My Account
My Slides
Search by Category
Pricing
Templates
View All Templates
Download Template Slides
✦ AI Search
Feedback
Login
Logout
Get Started
Browse all Slides
Browse all Slides
Create a FREE Account
Instant access to 1,000+ real slides from top companies like McKinsey, BCG, Goldman Sachs, Google and many more!
First Name
Last Name
Email
Password
I agree to all
Terms & Privacy Policy
Thank you! Your submission has been received!
Oops! Something went wrong while submitting the form.
Have an account?
Sign in
Saved Slides
Total No. of slides saved
0
↻ Refresh
✖ Clear all
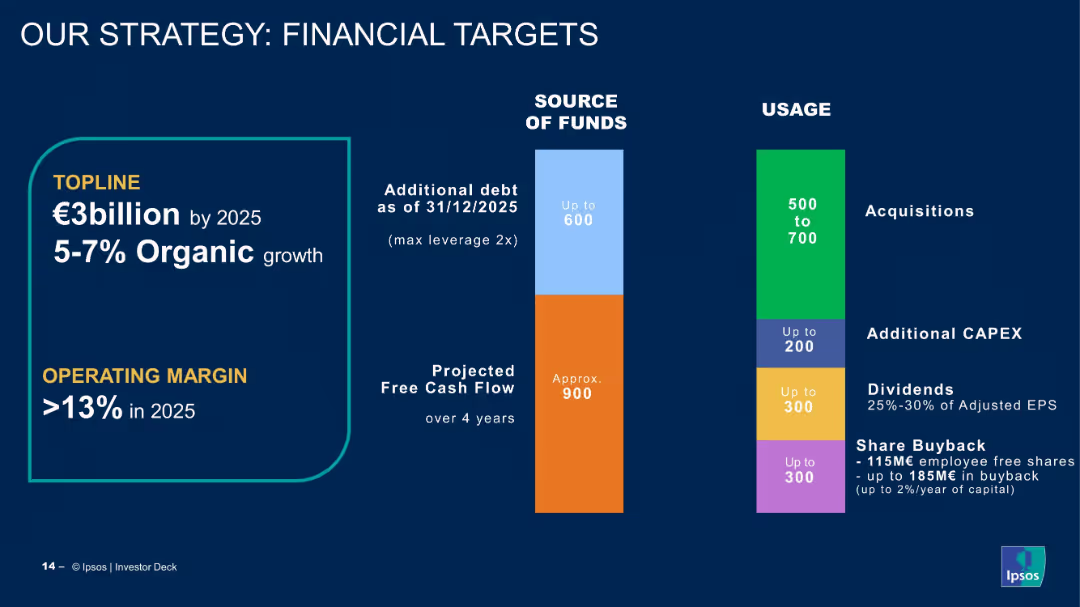
Column-style chart showing targets, sources, and usage of funds by 2025.
Strategic Planning
Financial Services
This slide outlines Ipsos’ strategic financial targets for 2025, including organic growth, acquisitions, capex, dividends, and share buybacks, supported by projected cash flow and allowable debt levels.
strategy, targets, 2025 goals, cash flow, capex, acquisitions, dividends, buyback, growth plan, Ipsos
false
Strategic Planning
Financial Services
Mixed Chart
IPSOS
Add to my slides
Remove from favorites
The slide features a pie chart with nine segments, each numbered and labeled with different business strategies such as "Develop tech-enabled advisors" and "Recalibrate pricing and business models". The background is dark with section headers like "RESEARCH BACKGROUND" in lighter text.
Strategic Planning
Technology & Software
This slide visually presents nine strategic actions aimed at enhancing business performance and adaptation in a tech-driven market, suitable for discussions on corporate strategy in finance and tech sectors.
strategy, technology, finance, innovation, pie chart, business model, digital transformation, market adaptation, tech advisors, pricing
false
Strategic Planning
Technology & Software
Vertical Flow
Deloitte
Add to my slides
Remove from favorites
This slide is divided into two main columns. The left side has two purple boxes with bullet points, each labeled as 'Infrastructure' and 'Resiliency'. The right side has two teal boxes, labeled 'Client Experiences' and 'Teammate Experiences'. There are four icon bullet points at the bottom.
Strategic Planning
Financial Services
The slide presents a technology strategy with a focus on modernizing infrastructure and enhancing client and teammate experiences. The content is strategically laid out to compare foundational improvements with benefits for users and employees.
Strategy, Technology, Infrastructure, Client Experience, Teammate Experience, Resiliency, Modernization
false
Strategic Planning
Financial Services
Table
Goldman Sachs
Add to my slides
Remove from favorites
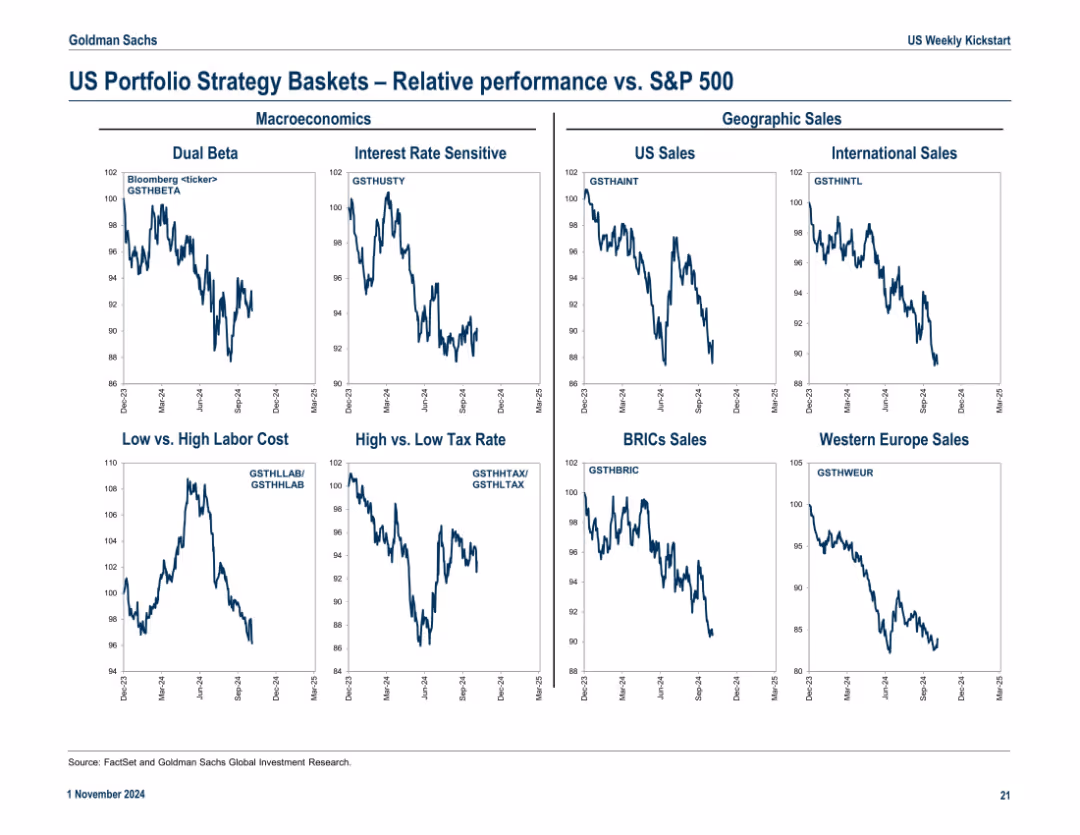
Nine-panel grid showing relative performance of macroeconomic and geographic strategy baskets vs. S&P 500
Market Analysis and Trends
Financial Services
Compares performance of strategy baskets (e.g., Dual Beta, BRICs Sales, Tax Themes) against the S&P 500, allowing investors to evaluate trends by macro or geographic exposure.
strategy themes, macroeconomics, BRICs, tax strategies, relative performance, portfolio positioning
false
Market Analysis and Trends
Financial Services
Multiple Chart
Goldman Sachs
Add to my slides
Remove from favorites
This slide uses a colorful, icon-driven design to represent various strategic areas such as profitability, portfolio transformation, and corporate responsibility. Each area is highlighted with distinct icons and color blocks, making the information approachable and easy to digest.
Strategic Planning
Agriculture & Food Production
Presents Tyson's multi-faceted strategic approach in a visually engaging manner. It outlines core areas of focus including profitability, product portfolio, and corporate responsibility, aiming to communicate the company's long-term objectives and commitments to stakeholders in a clear and memorable way.
Strategy, Tyson, Profitability, Sustainability, Corporate Responsibility
false
Strategic Planning
Agriculture & Food Production
Pillar
Barclays
Add to my slides
Remove from favorites
This slide has a simple layout with a clear division between text sections and a central infographic. The infographic is a circular diagram with four segments, each containing an icon and label, indicating a strategic approach.
Organizational Structure and Change
Professional Services
The slide describes an organization's strategy and foundational elements for creating value. It could be used to explain a company's core objectives and strategic guideposts, such as purpose, mission, and impact on various stakeholders.
Strategy, Value Creation, Impact, Growth, Sustainability, Inclusivity
false
Organizational Structure and Change
Professional Services
Diagram
McKinsey
Add to my slides
Remove from favorites
Slide uses a comparative layout with text blocks and a central transition arrow.
Strategic Planning
Financial Services
Discusses strategic shifts in UK digital investing and wealth management to enhance market position.
strategy, wealth management, digital investing, market share, UK
false
Strategic Planning
Financial Services
Linear Flow
Barclays
Add to my slides
Remove from favorites
Three pairs of bullet points, each with an icon, describing different aspects of the strategy supported by integrated global platforms, with text headers above.
Strategic Planning
Financial Services
This slide explains the wholesale payments strategy, supported by pillars like product variety, client connectivity, and analytics, useful for strategic planning discussions.
Strategy, Wholesale Payments, Global, Analytics, Connectivity, Innovation
false
Strategic Planning
Financial Services
Pillar
JP Morgan
Add to my slides
Remove from favorites
Contains stacked bar charts with detailed legends to explain subscriber behaviors related to costs, using a clean and effective layout.
Financial Performance
Media & Entertainment
Provides a detailed look at the financial aspects affecting consumer decisions in video streaming services, emphasizing the impact of cost on service cancellation. Important for financial analysis within the media sector.
streaming, costs, financial analysis, consumer decisions
false
Financial Performance
Media & Entertainment
Single Chart
Deloitte
Add to my slides
Remove from favorites
Combines textual content with a large, colorful bar graph comparing SVOD and free streaming usage. The visual balance between text and image aids comprehension.
Market Analysis and Trends
Media & Entertainment
Explores the role of free streaming services alongside paid options, highlighting their continued importance in the UK media landscape. Useful for strategic planning in media distribution.
streaming, free services, media strategy, UK
false
Market Analysis and Trends
Media & Entertainment
Mixed Chart
Deloitte
Add to my slides
Remove from favorites
A scatter plot showing changes in usage by platform, highlighting shifts in viewer behavior towards digital content and away from traditional TV.
Market Analysis and Trends
Media & Entertainment
The slide demonstrates the impact of streaming growth on traditional TV viewership, with digital content consumption becoming more frequent and impactful.
streaming, growth, traditional TV, digital content, behavior
false
Market Analysis and Trends
Media & Entertainment
Mixed Chart
Nielsen
Add to my slides
Remove from favorites
A bar chart comparing the relative streaming minutes versus Netflix for various platforms in Q4 2021. Platforms are listed on the x-axis with percentages representing their relative minutes viewed compared to Netflix, which is set at 100%.
Market Analysis and Trends
Media & Entertainment
This slide compares the relative streaming minutes of different platforms to Netflix in Q4 2021, indicating Netflix's dominance and the performance of other services like YouTube, Hulu, Amazon, Disney Plus, and others.
streaming minutes, platform comparison, Netflix, Q4 2021, Nielsen gauge
false
Market Analysis and Trends
Media & Entertainment
Single Chart
Nielsen
Add to my slides
Remove from favorites
Column charts depicting the percentage of users joining due to COVID-19 for SVOD and music, with text on the right discussing user behavior and retention.
Market Analysis and Trends
Technology & Software
Assesses the impact of COVID-19 on streaming entertainment services, detailing new user adoption rates and long-term customer retention. Key for streaming services to understand market penetration and forecast future trends.
Streaming services, COVID-19 impact, User adoption, Market trends, Customer retention
false
Market Analysis and Trends
Technology & Software
Mixed Chart
Bain
Add to my slides
Remove from favorites
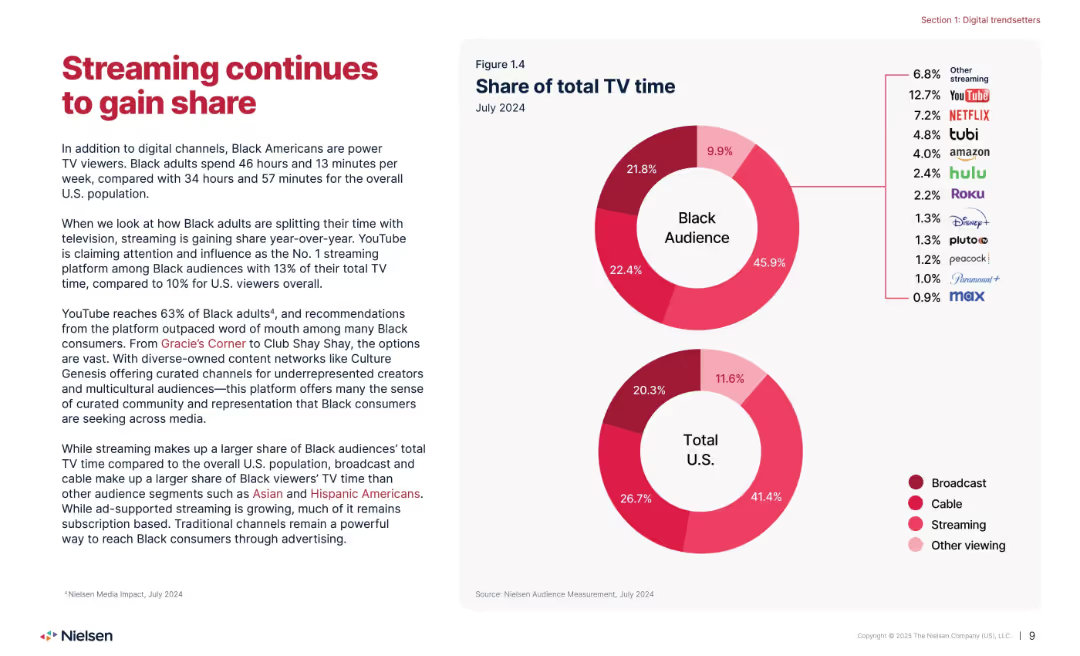
Left column: narrative; right column: donut charts of TV time share by platform.
Market Analysis and Trends
Media & Entertainment
Shows the increasing share of streaming in total TV time among Black audiences, with YouTube as the top streaming platform. Notes differences in platform preferences compared to the total U.S. audience, and highlights representation and cultural connection in content consumption.
streaming, TV, Black audience, YouTube, share, content
false
Market Analysis and Trends
Media & Entertainment
Mixed Chart
Nielsen
Add to my slides
Remove from favorites
A column chart showing streaming video share of time spent by age groups for February 2021 and 2022. The chart uses various shades of teal and green to differentiate age groups.
Market Analysis and Trends
Media & Entertainment
The slide shows an increase in average weekly minutes spent streaming video by all age groups, highlighting a year-over-year growth of 18%.
streaming, video, age groups, minutes, growth
false
Market Analysis and Trends
Media & Entertainment
Single Chart
Nielsen
Add to my slides
Remove from favorites
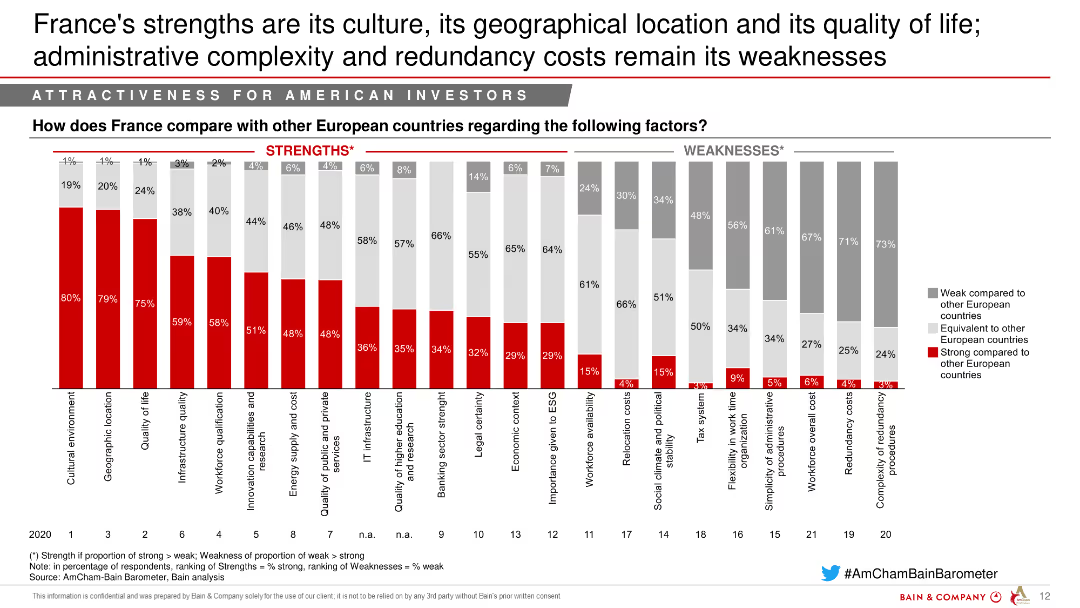
The slide includes a column chart comparing France's strengths and weaknesses against other European countries, highlighting areas like cultural environment and administrative complexity.
Market Analysis and Trends
Hospitality & Tourism
This slide assesses France's strengths and weaknesses as an investment destination, emphasizing its cultural and geographical advantages.
Strengths, Weaknesses, Cultural environment, Geographical location, Administrative complexity
false
Market Analysis and Trends
Hospitality & Tourism
Single Chart
Bain
Add to my slides
Remove from favorites
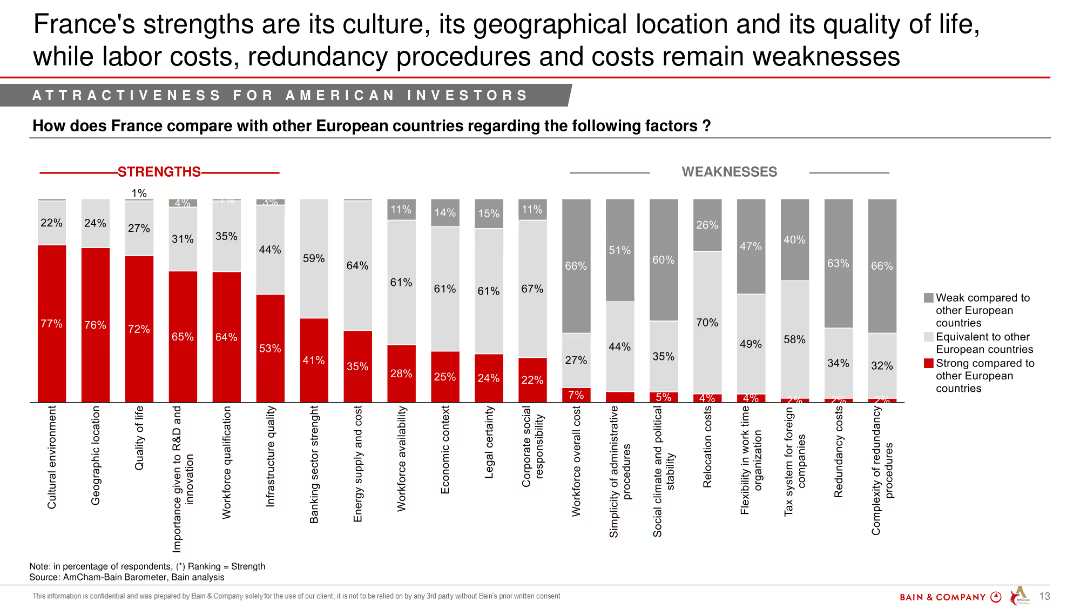
Column chart comparing strengths and weaknesses of France against other European countries across various factors like cultural environment and labor costs.
Market Analysis and Trends
Professional Services
The slide evaluates France's strengths and weaknesses in comparison to other European countries, focusing on cultural environment, geographic location, and quality of life.
strengths, weaknesses, France, comparison, Europe, cultural environment, labor costs
false
Market Analysis and Trends
Professional Services
Single Chart
Bain
Add to my slides
Remove from favorites
Column charts, text, and image of a woman in a wheelchair. Bars represent stress, burnout, mental health support, and optimism between part-time and full-time women workers.
Human Resources and Talent Management
Professional Services
Highlights the higher stress and burnout levels among part-time female workers compared to full-time. It also discusses lack of support and optimism issues.
stress, burnout, mental health, support, optimism, part-time, full-time, employment, women
false
Human Resources and Talent Management
Professional Services
Multiple Chart
Deloitte
Add to my slides
Remove from favorites
The slide contains a text section and a bar chart. The chart shows the percentage of respondents citing different factors contributing to stress, with shades of green differentiating millennials and Gen Z. The design is clean, utilizing white space effectively.
Risk Assessment and Management
Technology & Software
The slide presents the main stress factors for millennials and Gen Z, such as family welfare, financial future, and job prospects. It provides a detailed bar chart on stress drivers and discusses the pandemic's impact on financial concerns and job security, offering insights into workforce stress management and planning.
Stress Factors, Millennials, Gen Z, Pandemic Impact, Financial Concerns, Job Security, Bar Chart, Workforce Management
false
Risk Assessment and Management
Technology & Software
Mixed Chart
Deloitte
Add to my slides
Remove from favorites
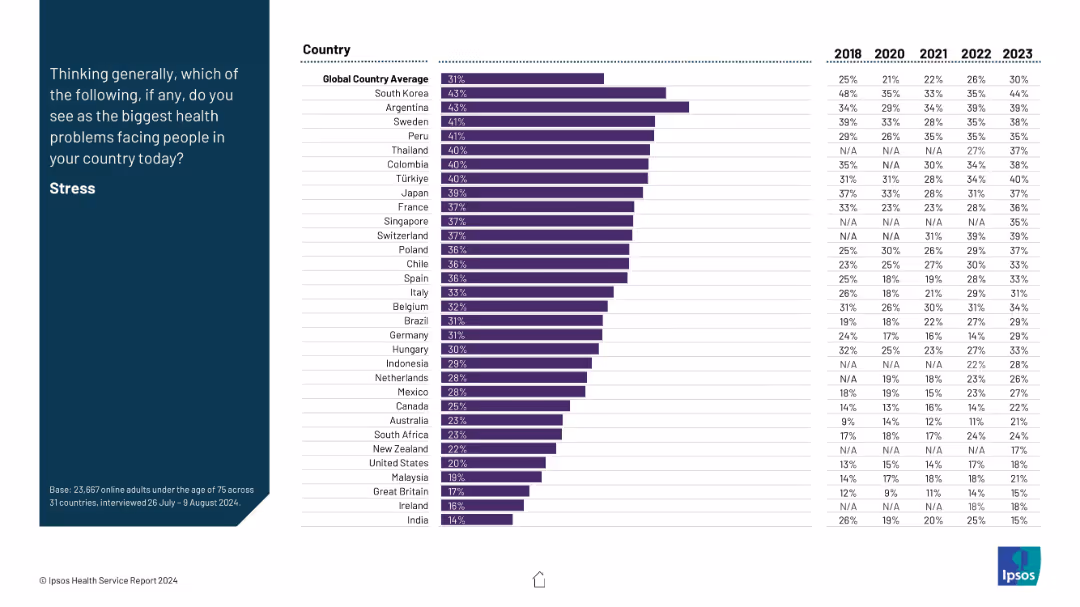
Layout consistent with previous: prompt on left, bar chart on right with time series from 2018–2023 for each country.
Market Analysis and Trends
Healthcare & Pharmaceuticals
This slide tracks stress perception as a major health issue across countries, with time series data. South Korea and Argentina show the highest concern. A global upward trend is visible, with stress becoming increasingly recognized as a health challenge.
stress, global health, trends, mental well-being, survey data
false
Market Analysis and Trends
Healthcare & Pharmaceuticals
Mixed Chart
IPSOS
Add to my slides
Remove from favorites
Contains text with a comparative bar chart showing stress levels among Gen Z and millennials over three years, along with top stress factors for both groups.
Market Analysis and Trends
Healthcare & Pharmaceuticals
The slide addresses the rising stress levels among Gen Z, especially women, compared to millennials. It includes a comparative bar chart of stress levels from 2020 to 2022 and identifies key factors contributing to stress, such as financial concerns and work-life balance.
Stress levels, Gen Z, millennials, comparison, stress factors
false
Market Analysis and Trends
Healthcare & Pharmaceuticals
Multiple Chart
Deloitte
Add to my slides
Remove from favorites
The slide features two horizontal bar charts comparing stress levels before and during COVID-19, and a pie chart showing stress shift percentages. Clean white background.
Risk Assessment and Management
Financial Services
This slide presents data on Canadian investors' stress levels regarding their investments, comparing pre-pandemic and current levels, and detailing changes in stress perception.
stress levels, investments, COVID-19, comparison, Canadian investors
false
Risk Assessment and Management
Financial Services
Multiple Chart
IPSOS
Add to my slides
Remove from favorites
A comparative bar chart showing stress levels among Millennials and Gen Z across various countries, with percentages and color-coded bars.
Market Analysis and Trends
Professional Services
The slide compares stress levels before and after the pandemic among Millennials and Gen Z across multiple countries, highlighting the impact of global economic changes.
Stress levels, Millennials, Gen Z, comparison, pandemic, global survey, mental health, economic impact
false
Market Analysis and Trends
Professional Services
Multiple Chart
Deloitte
Add to my slides
Remove from favorites
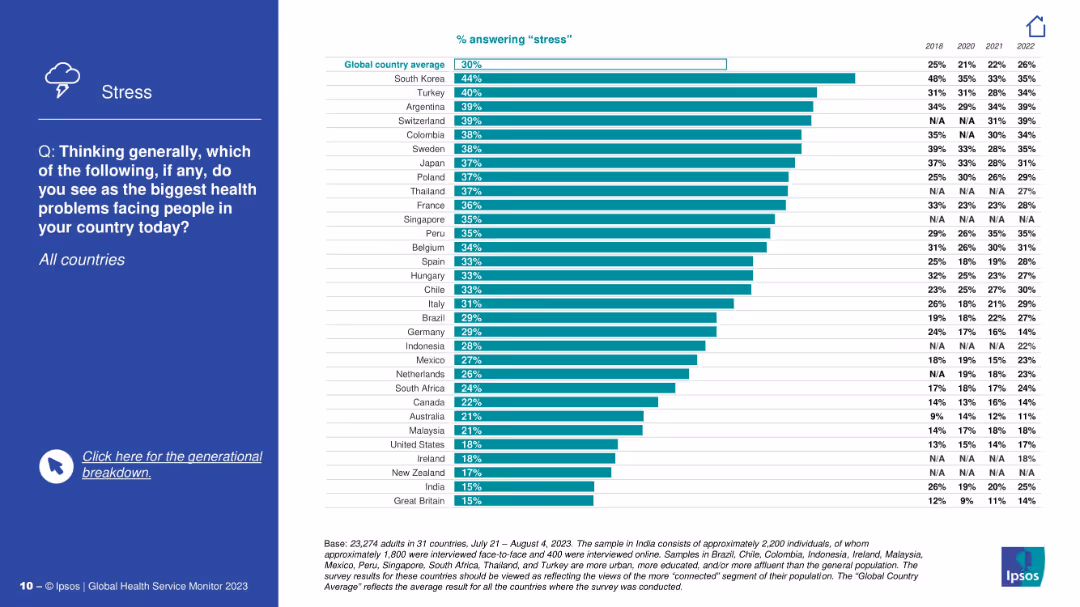
Stress-focused slide with blue sidebar; right side features country ranking by percentage citing stress as a top health issue, plus trend data.
Market Analysis and Trends
Healthcare & Pharmaceuticals
The slide ranks countries based on how many citizens consider stress a leading health problem. South Korea ranks highest. It includes data from past years, showing an increase in stress concern in most countries over time.
stress, mental well-being, Ipsos, health concerns, historical comparison, anxiety, pressure, perception, global health insights
false
Market Analysis and Trends
Healthcare & Pharmaceuticals
Mixed Chart
IPSOS
Add to my slides
Remove from favorites
The slide is split into two main sections. The left side has a text block and an illustration of a stressed individual, while the right side features a column chart depicting stress levels over three time points with gender differentiation. The chart uses green tones for distinction.
Market Analysis and Trends
Technology & Software
The slide addresses the high levels of stress experienced by millennials and Gen Z during the pandemic, with a focus on gender differences. A bar chart compares stress levels across 2020, 2020 Pulse, and 2021, highlighting that women reported higher stress. The content suggests persistent high stress levels and the implications for mental health and workforce management strategies.
Stress, Pandemic, Millennials, Gen Z, Mental Health, Gender, Bar Chart, Workforce Management, Health Trends
false
Market Analysis and Trends
Technology & Software
Mixed Chart
Deloitte
Add to my slides
Remove from favorites
This slide features a title at the top, a multi-bullet point section on the left outlining key assumptions, and a line graph depicting unemployment rate scenarios. On the right is a data table with net credit loss projections.
Risk Assessment and Management
Financial Services
Discussing the impact of various unemployment rates on credit card loss scenarios, the slide provides an analysis for planning under different economic conditions.
stress scenario, credit card, unemployment rate, loss projections, economic conditions, baseline, moderate recession
false
Risk Assessment and Management
Financial Services
Mixed Chart
JP Morgan
Add to my slides
Remove from favorites
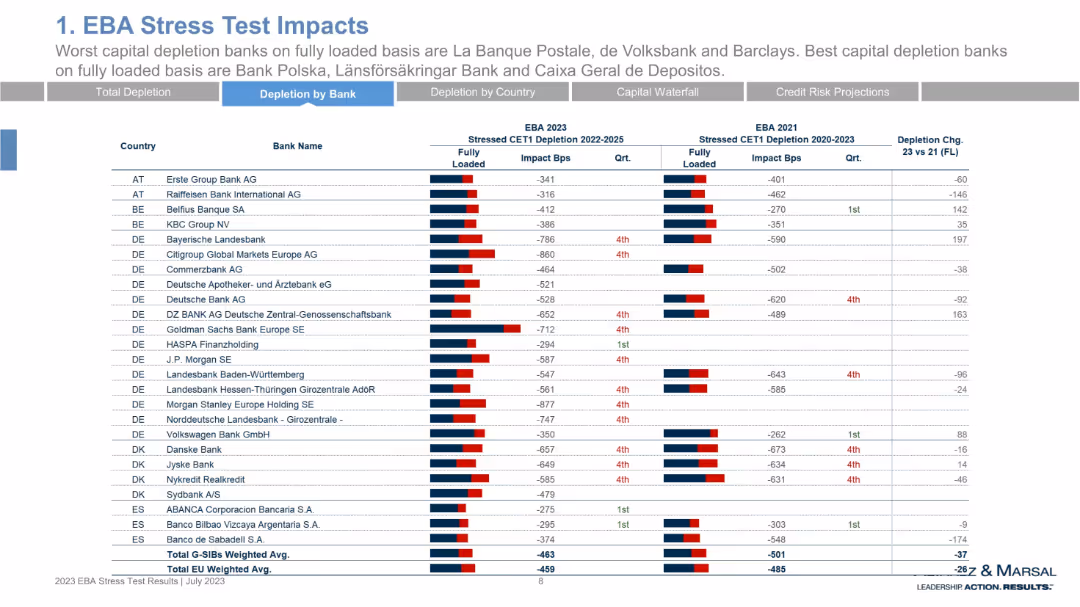
Data table listing banks by country with bar visualizations showing 2023 and 2021 CET1 depletion. Includes numeric impact values in basis points and bar color codes (red/blue).
Risk Assessment and Management
Financial Services
A ranked data table presents detailed CET1 depletion metrics by bank from 2021 to 2023 stress tests. Highlights most impacted banks (e.g., La Banque Postale, Volksbank) and best-performing banks (e.g., Bank Polska). Includes average depletion values and changes between years.
stress test, CET1 depletion, banks, 2023 vs 2021, capital resilience, ranking, EU
false
Risk Assessment and Management
Financial Services
Single Chart
Alvarez & Marsal
Add to my slides
Remove from favorites
The slide is divided into two segments with a central title. On the left, bullet points outline key assumptions. On the right, a line graph depicts the unemployment rate with two scenarios. There's a table below the graph summarizing potential losses.
Risk Assessment and Management
Financial Services
This slide performs a stress scenario analysis for the credit card division, with assumptions based on unemployment rates and potential credit losses. It provides projections and comparative scenarios to assist in strategic planning and risk preparedness.
Stress test, Credit card, Unemployment rate, Loss projections, Risk analysis, Scenario planning
false
Risk Assessment and Management
Financial Services
Single Chart
JP Morgan
Add to my slides
Remove from favorites
Uses bar chart with segmented opinions and historical comparison table.
Market Analysis and Trends
Government & Public Sector
Suggests 49% of respondents across 28 countries agree that rule-breaking strong leaders are needed for reform. Thailand and India show the highest support. The chart highlights a willingness to bypass traditional norms to enable change.
strong leader, reform, authoritarianism, political sentiment, rule-breaking
false
Market Analysis and Trends
Government & Public Sector
Mixed Chart
IPSOS
Add to my slides
Remove from favorites
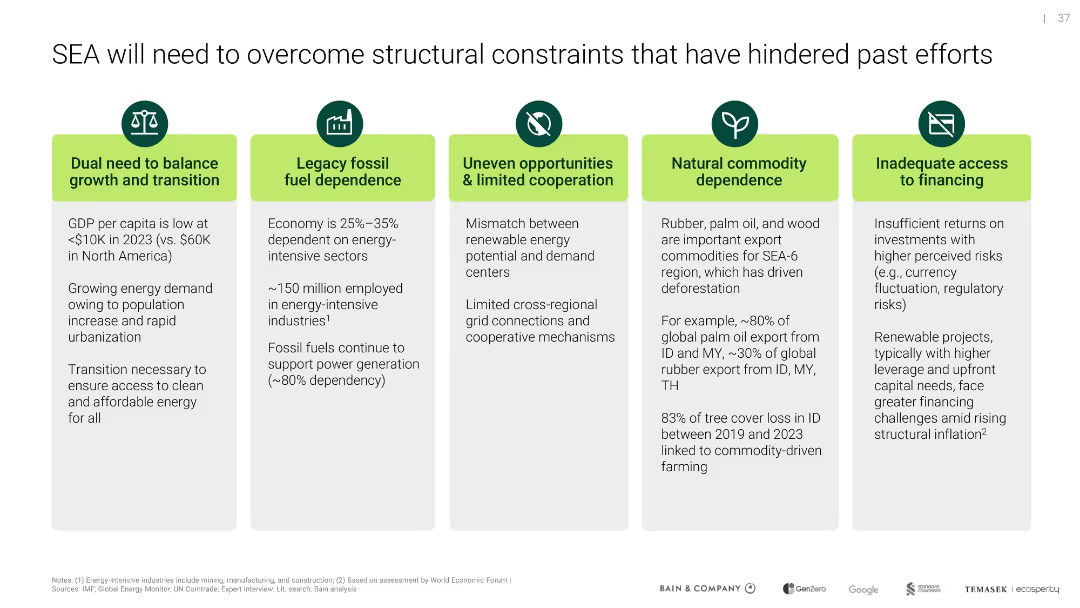
Five-column layout with icons atop text boxes; each represents a structural challenge hindering decarbonization
Operational Efficiency
Environmental Services & Sustainability
Outlines five structural barriers in SEA—low GDP per capita, fossil dependency, lack of cooperation, commodity reliance, and poor financing access—that must be addressed to enable effective climate action and transition.
structural barriers, fossil fuels, SEA, cooperation, financing
false
Operational Efficiency
Environmental Services & Sustainability
Pillar
Bain
Add to my slides
Remove from favorites
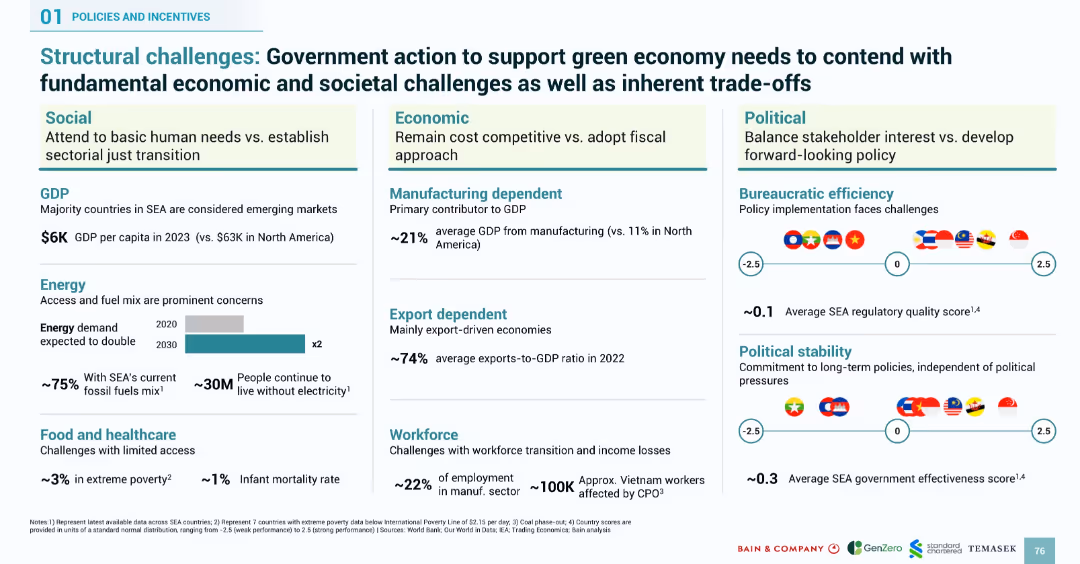
Grid-style layout with economic, social, and political factors influencing SEA’s green economy. Includes bar graphs, stats, and flag-based visuals.
Strategic Planning
Government & Public Sector
Details foundational economic and societal challenges Southeast Asia faces in transitioning to a green economy. Highlights low GDP, energy access, healthcare, workforce vulnerability, political instability, and manufacturing/export dependency. Uses data visualizations and flag indicators to illustrate governance effectiveness and regulatory quality.
structural challenges, SEA, green economy, governance, GDP, energy demand, workforce, healthcare, policy
false
Strategic Planning
Government & Public Sector
Mixed Chart
Bain
Add to my slides
Remove from favorites
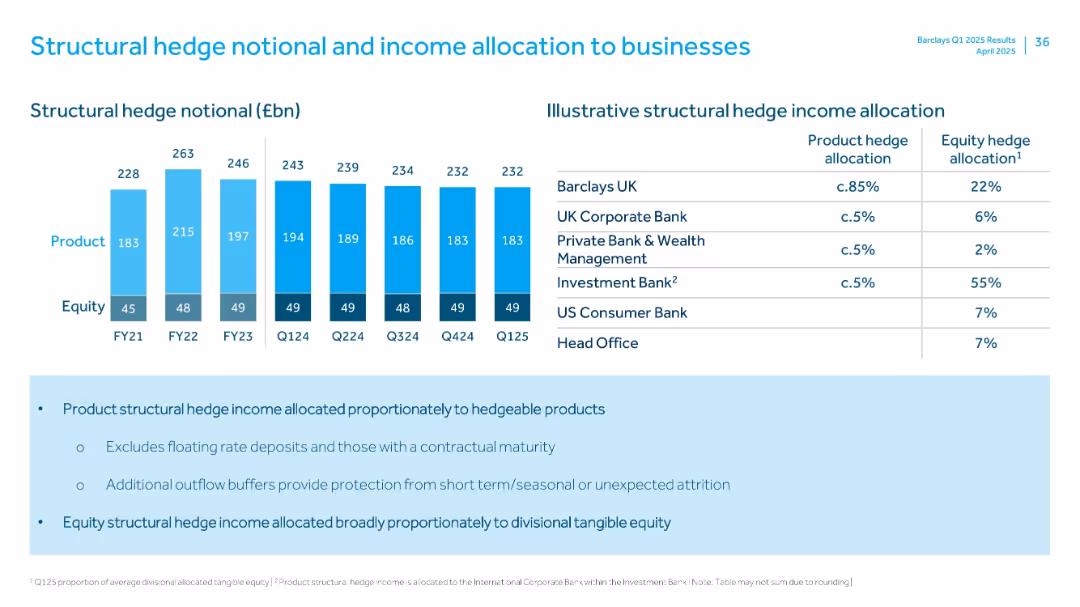
Bar chart (left) with hedge notional over time and a table (right) with income allocation across divisions
Risk Assessment and Management
Financial Services
Breaks down structural hedge notional into product and equity components and outlines income allocation to business units, emphasizing proportional distribution based on hedgeability and tangible equity.
structural hedge, income, allocation, equity, product
false
Risk Assessment and Management
Financial Services
Mixed Chart
Barclays
Add to my slides
Remove from favorites
Split chart: bar chart (left) on hedge notionals by type; table (right) with illustrative income allocation per business
Risk Assessment and Management
Financial Services
The slide explains how Barclays allocates income from structural hedges (product and equity) across divisions. It includes historical hedge notionals and emphasizes proportional allocation based on product hedgeability and equity capital. Provides clarity on risk and interest rate protection strategy.
structural hedge, income allocation, risk management, equity, product hedge
false
Risk Assessment and Management
Financial Services
Mixed Chart
Barclays
Add to my slides
Remove from favorites
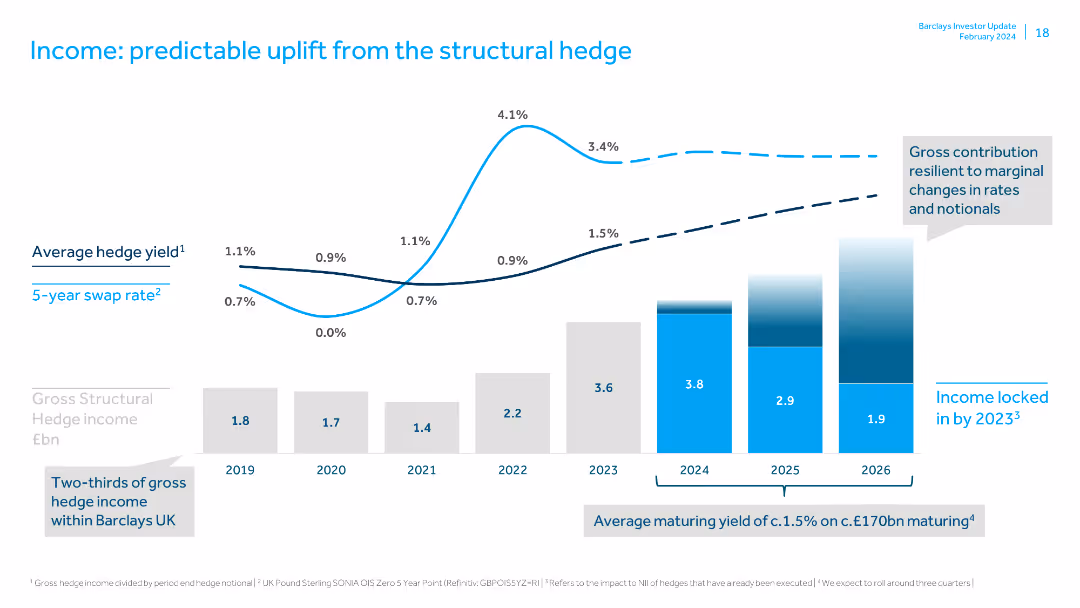
Displays a line chart for average hedge yield and column charts for gross structural hedge income. Text boxes highlight future projections.
Financial Performance
Financial Services
Details the predictable income uplift from structural hedges, showing past and projected hedge yields and income, emphasizing future income security.
structural hedge, income, hedge yield, financial performance, future projections, swap rate, gross income, financial security, hedging strategy
false
Financial Performance
Financial Services
Multiple Chart
Barclays
Add to my slides
Remove from favorites
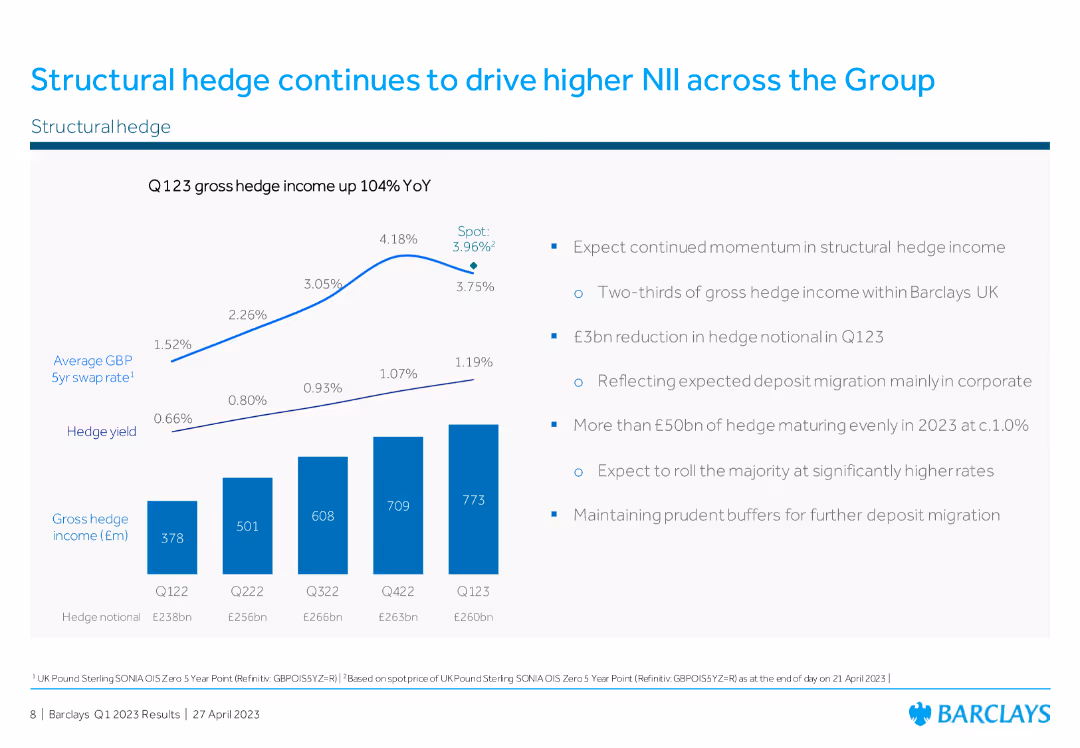
Column chart displaying Q1 2023 gross hedge income up 104% YoY, line graph showing average GBP 5-year swap rate and hedge yield, bullet points on the right with key takeaways.
Risk Assessment and Management
Financial Services
The slide details how structural hedges have significantly increased net interest income (NII), highlighting the trends in hedge income and the associated financial strategies.
structural hedge, NII, gross hedge income, GBP swap rate, financial strategies
false
Risk Assessment and Management
Financial Services
Multiple Chart
Barclays
Add to my slides
Remove from favorites
This slide comprises two content sections. The left section includes bullet points describing the strategy related to structured notes and unsecured funding. The right section features two pie charts showing the distribution of structured notes by tenor and entity, highlighting funding diversification.
Investment Analysis
Financial Services
Describes the company's strategic approach to funding through structured notes, showcasing how funding diversity is achieved across tenors and entities, pertinent for investors and financial analysts.
structured notes, unsecured funding, funding strategy, pie chart, investment analysis, diversification, tenor distribution, entity distribution, financial instruments, capital strategy
false
Investment Analysis
Financial Services
Multiple Chart
Goldman Sachs
Add to my slides
Remove from favorites
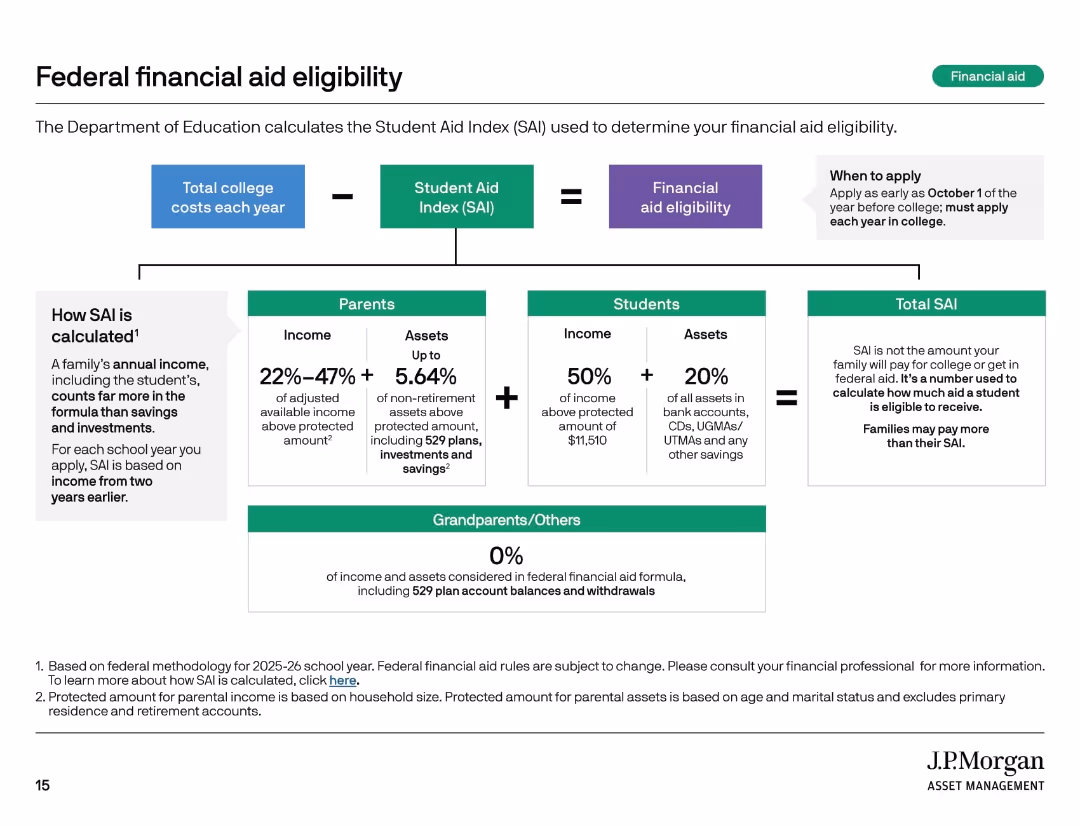
Flowchart style layout with boxes and arrows, sections for parents, students, and grandparents.
Regulatory and Compliance
Education & Training
This slide explains how the Student Aid Index (SAI) is calculated and used to determine federal financial aid eligibility. It details income and asset contribution formulas for parents and students, while noting that grandparent contributions are excluded. It includes application timing guidance.
student aid, SAI, financial aid, college costs, FAFSA
false
Regulatory and Compliance
Education & Training
Diagram
JP Morgan
Add to my slides
Remove from favorites
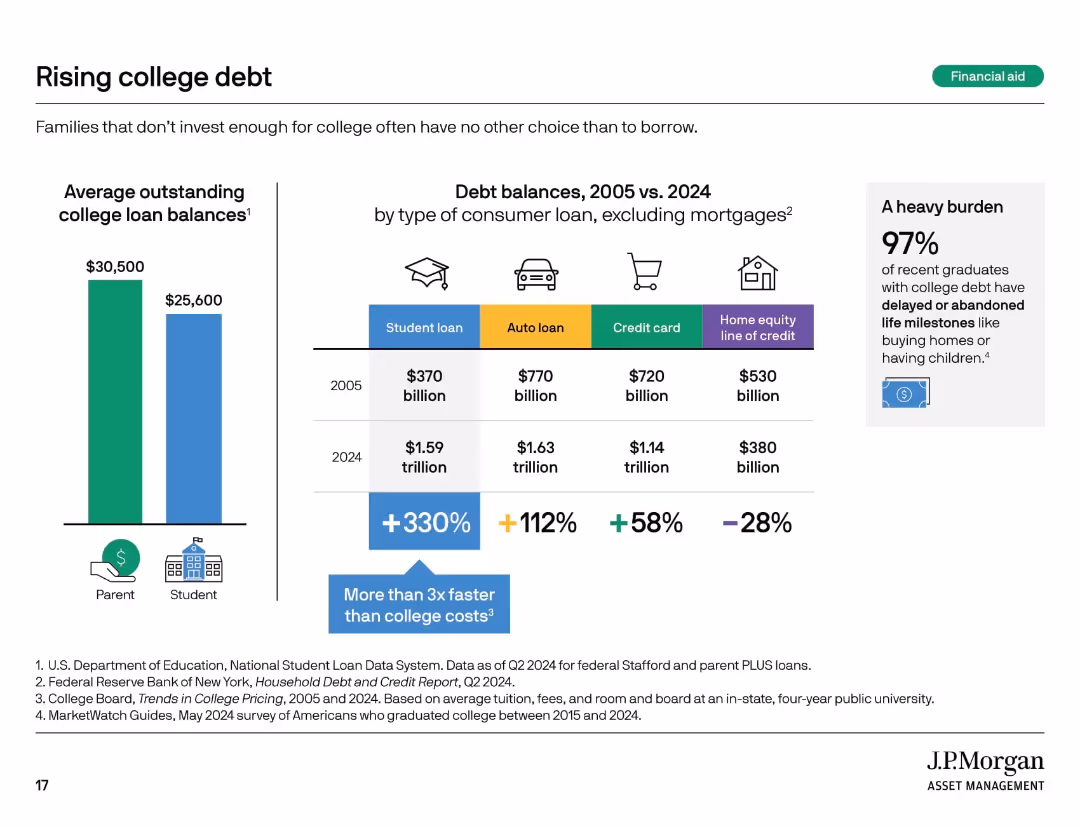
Bar chart and infographic showing loan growth and its impact, plus a statistic callout on graduate burden.
Financial Performance
Education & Training
This slide reveals how college debt has increased significantly over time, outpacing other loan types. It compares 2005 and 2024 balances for multiple loan categories and underscores the long-term burden on students, with 97% of graduates delaying or foregoing major life milestones due to debt.
student loans, debt burden, education finance, loan growth, graduates
false
Financial Performance
Education & Training
Mixed Chart
JP Morgan
Add to my slides
Remove from favorites
Bar charts compare the top countries for inbound and outbound student numbers in 2018, highlighting major destinations and sources of international students.
Market Analysis and Trends
Education & Training
Focuses on global student mobility in 2018, detailing the leading countries for inbound and outbound educational travel. It discusses trends and predicts future changes in international student flows by 2030.
student mobility, global, 2018, trends
false
Market Analysis and Trends
Education & Training
Multiple Chart
Roland Berger
Add to my slides
Remove from favorites
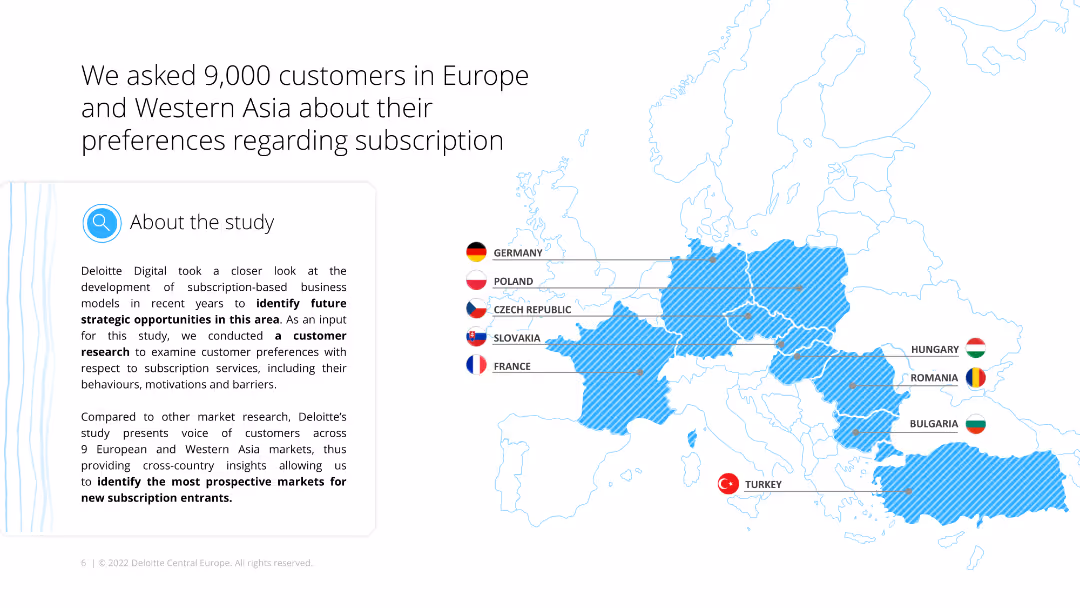
The slide has a map of Europe and Western Asia with country names and flags, indicating regions where the survey was conducted. A text box provides an overview of the study's purpose and methodology.
Customer and Market Segmentation
Consumer Goods
The slide provides an overview of a study conducted with 9,000 customers across Europe and Western Asia, focusing on their preferences regarding subscription services.
study overview, Europe, Western Asia, subscription, preferences
false
Customer and Market Segmentation
Consumer Goods
Graphic
Deloitte
Add to my slides
Remove from favorites
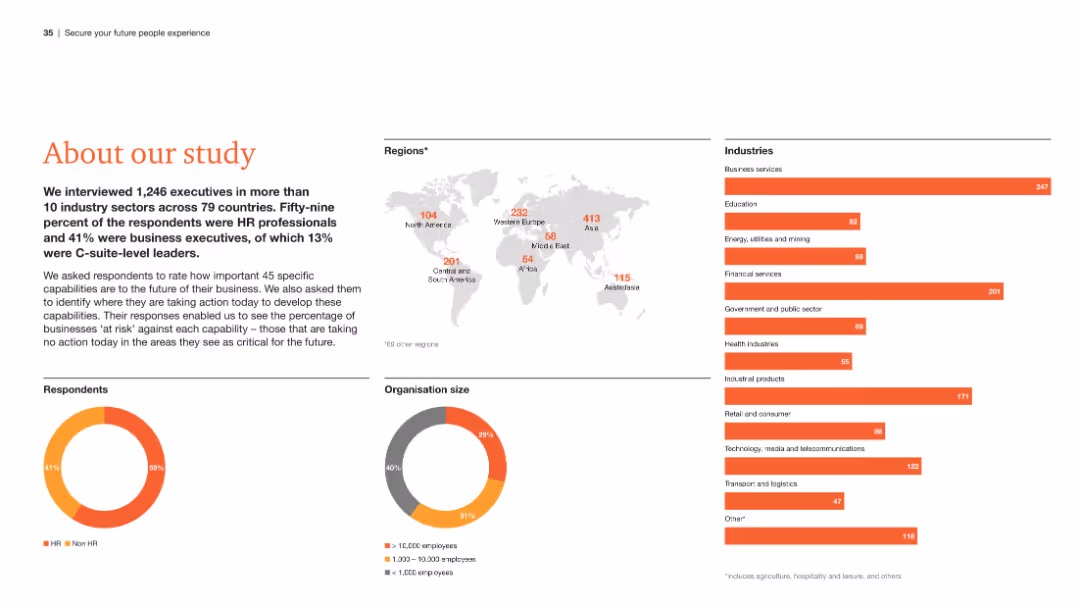
The slide presents an overview of the study, including a world map showing respondent distribution, pie charts of respondent roles and organization sizes, and a list of industries surveyed.
Strategic Planning
Professional Services
This slide provides a summary of the study's scope, detailing the demographics of respondents, the regions and industries covered, and the roles of the participants.
Study overview, respondent demographics, regions, industries, roles
false
Strategic Planning
Professional Services
Multiple Chart
PwC/Strategy&
Add to my slides
Remove from favorites
The slide features multiple column charts showing adjusted pre-tax income, cost/income ratio, return on regulatory capital, and client business volume over the years.
Financial Performance
Financial Services
This slide highlights the strong performance of the Swiss Universal Bank, showing financial metrics such as pre-tax income, cost/income ratio, and business volume growth.
SUB, financial performance, pre-tax income, cost/income ratio, business volume
false
Financial Performance
Financial Services
Multiple Chart
Credit Suisse
Add to my slides
Remove from favorites
Includes three line charts showing Sub-Saharan Africa y/y real GDP, y/y inflation, and repurchase rate path from 2005-2026F, with explanatory text.
Market Analysis and Trends
Financial Services
Provides an overview of Sub-Saharan Africa's economic outlook, covering GDP growth, inflation, and interest rate trends.
Sub-Saharan Africa, GDP, Inflation, Interest Rates, Economic Activity
false
Market Analysis and Trends
Financial Services
Multiple Chart
EY
Add to my slides
Remove from favorites
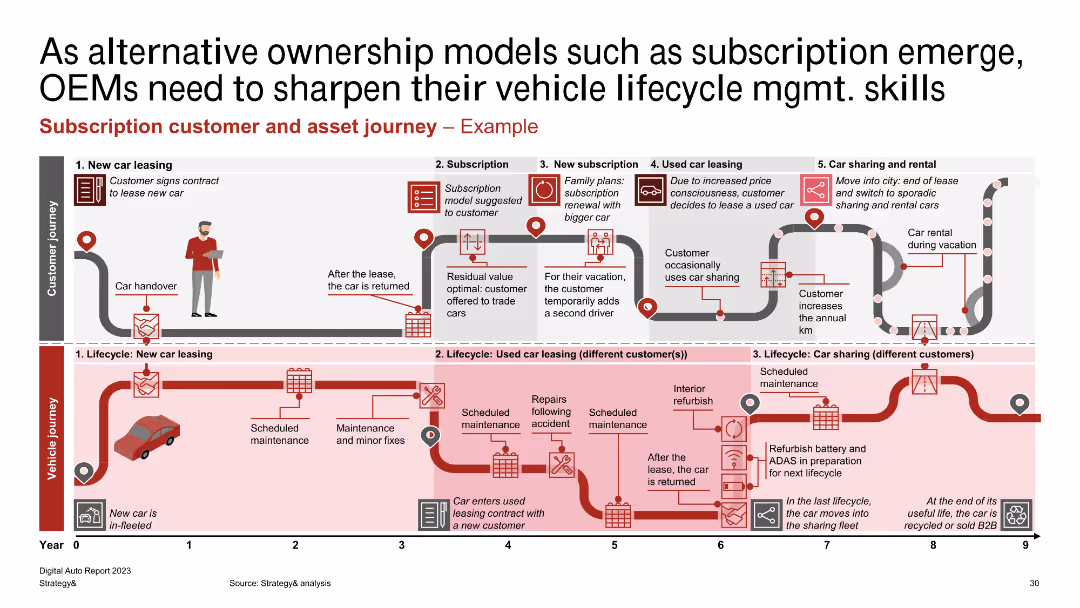
A detailed process flow diagram showing customer and vehicle journey stages for subscription-based ownership models.
Customer and Market Segmentation
Transportation & Logistics
Depicts the stages of customer and vehicle journeys in subscription models, from new car leasing to car sharing and rental, highlighting key activities and touchpoints.
subscription, customer journey, asset management, vehicle journey
false
Customer and Market Segmentation
Transportation & Logistics
Linear Flow
PwC/Strategy&
Add to my slides
Remove from favorites
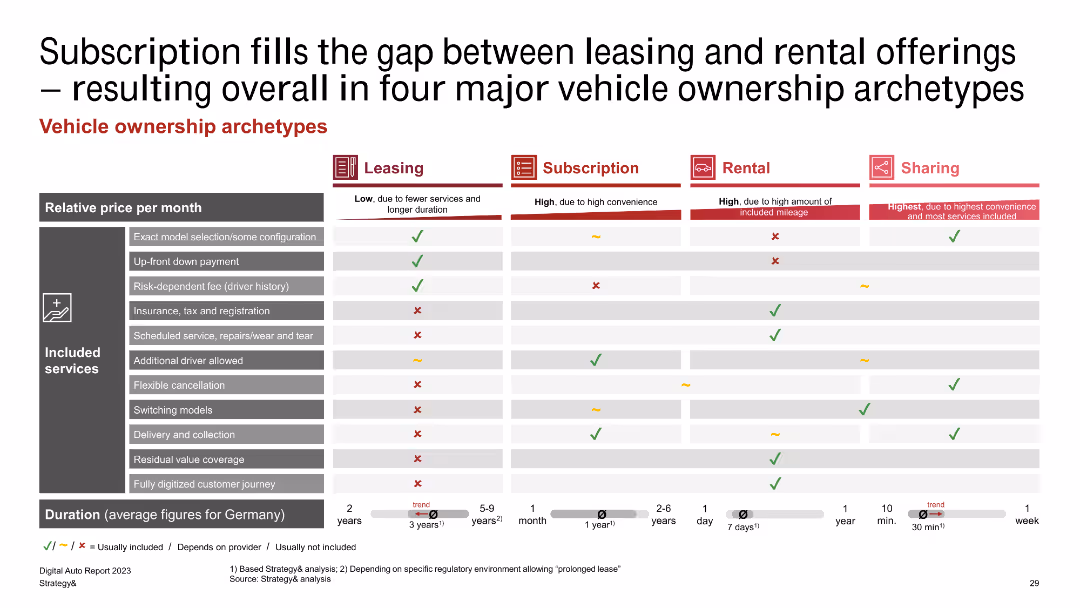
A comparative table outlining four major vehicle ownership archetypes: leasing, subscription, rental, and sharing, with included services and relative prices.
Market Analysis and Trends
Transportation & Logistics
Compares leasing, subscription, rental, and sharing vehicle ownership models, focusing on the services included, costs, and duration.
subscription, leasing, rental, sharing, vehicle ownership
false
Market Analysis and Trends
Transportation & Logistics
Table
PwC/Strategy&
Add to my slides
Remove from favorites
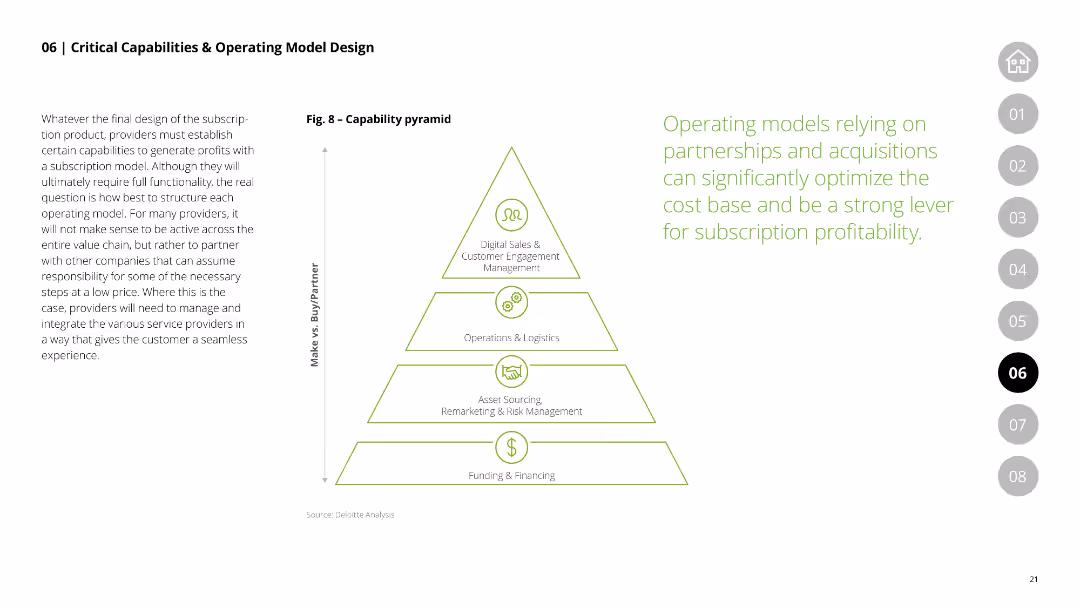
The slide features a pyramid diagram depicting critical capabilities for subscription model profitability, including digital sales, operations, asset sourcing, and financing, with an emphasis on partnerships and acquisitions.
Strategic Planning
Financial Services
Highlights the essential capabilities required for operating subscription models in the auto finance industry, stressing the importance of strategic partnerships and efficient operations.
subscription model, critical capabilities, operating model, strategic planning, partnerships, acquisitions
false
Strategic Planning
Financial Services
Framework
Deloitte
Add to my slides
Remove from favorites
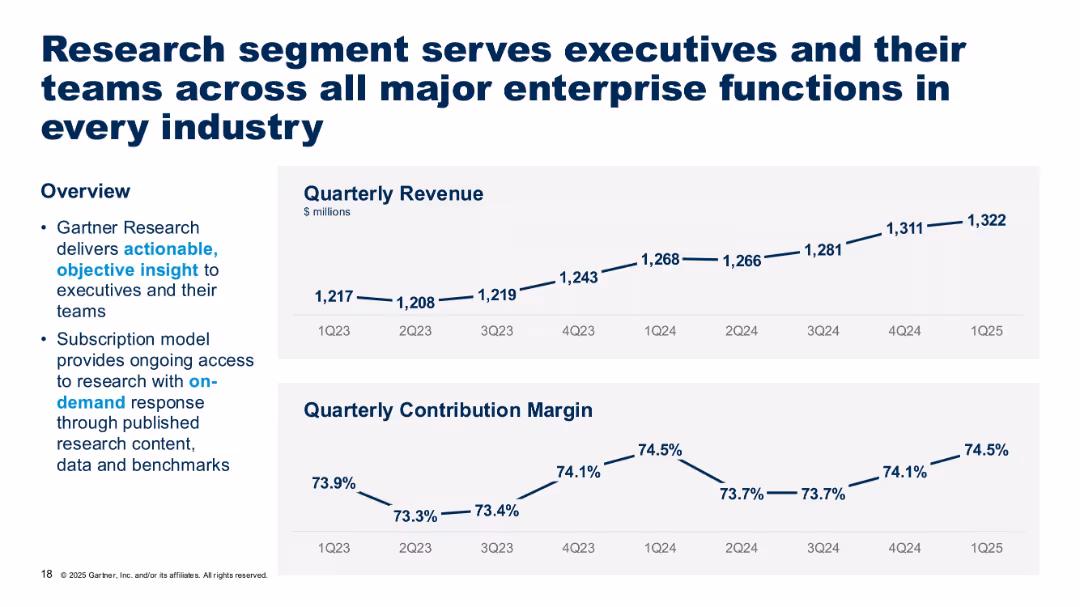
Two line graphs (quarterly revenue and contribution margin); bulleted overview on left; blue and white corporate design.
Performance Metrics and KPIs
Technology & Software
The slide highlights the steady growth in Gartner’s research segment revenue and its consistently high contribution margin. The overview emphasizes the value of actionable, on-demand insights through a subscription-based model.
subscription model, insights, contribution margin, executives, research
false
Performance Metrics and KPIs
Technology & Software
Multiple Chart
Gartner
Add to my slides
Remove from favorites
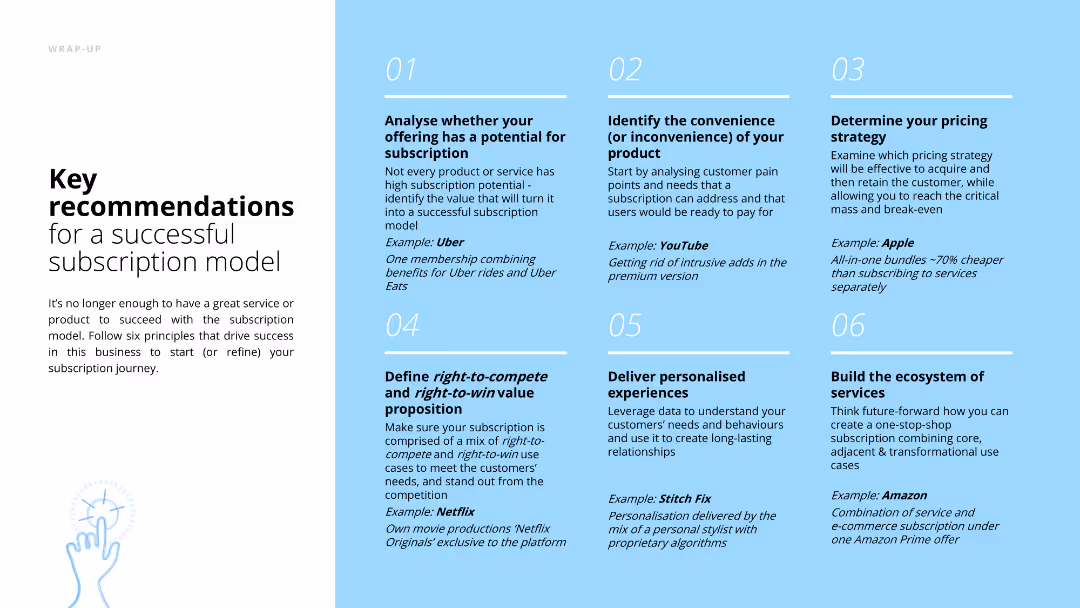
The slide lists six key recommendations for successful subscription models, each accompanied by a relevant example. The layout is clean with a blue background and white text.
Strategic Planning
Consumer Goods
The slide provides actionable insights for developing a successful subscription model, covering aspects such as analyzing potential, pricing strategy, and building an ecosystem of services.
subscription model, recommendations, strategic planning, pricing strategy, customer analysis, ecosystem, ecommerce, retail
false
Strategic Planning
Consumer Goods
Linear Flow
Deloitte
Add to my slides
Remove from favorites
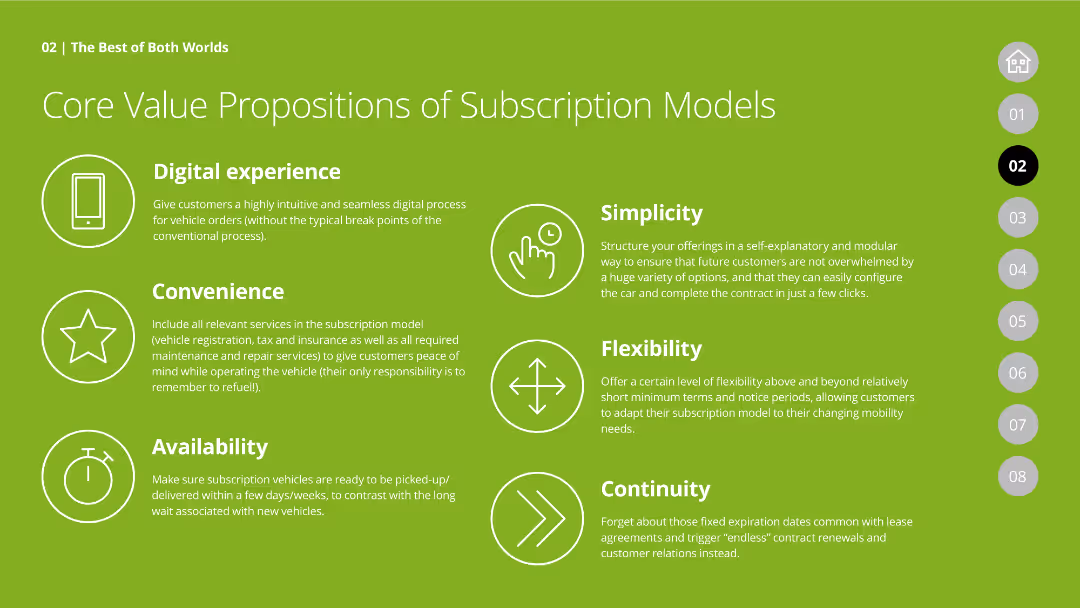
The slide lists core value propositions of subscription models with icons and descriptions for digital experience, convenience, simplicity, flexibility, availability, and continuity, presented on a green background.
Product and Service Analysis
Transportation & Logistics
Outlines the core benefits of subscription models for vehicles, emphasizing aspects like digital experience, convenience, and flexibility to appeal to consumers' changing preferences.
subscription models, core value propositions, digital experience, convenience, flexibility, vehicle subscription
false
Product and Service Analysis
Transportation & Logistics
Header Vertical
Deloitte
Add to my slides
Remove from favorites
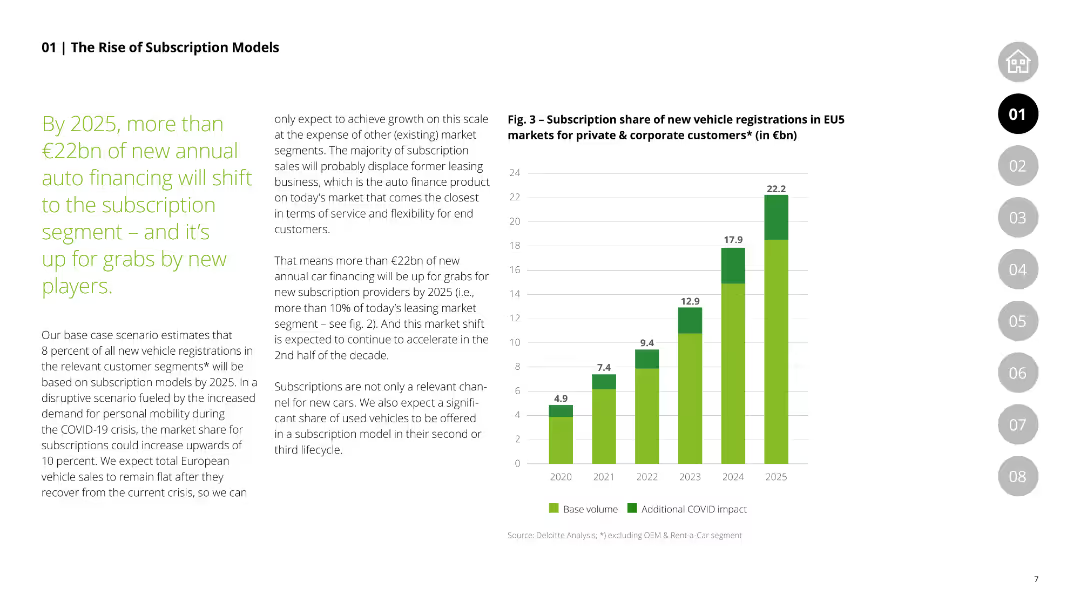
The slide shows a column chart projecting subscription share of new vehicle registrations in the EU5 markets for private and corporate customers from 2020 to 2025, highlighting the expected growth due to COVID-19 impact.
Market Analysis and Trends
Financial Services
Provides projections for the rise in subscription models in vehicle registrations in the EU5, emphasizing the impact of COVID-19 and the shift in market dynamics.
subscription models, vehicle registrations, EU5, market projection, COVID-19 impact
false
Market Analysis and Trends
Financial Services
Mixed Chart
Deloitte
Add to my slides
Remove from favorites
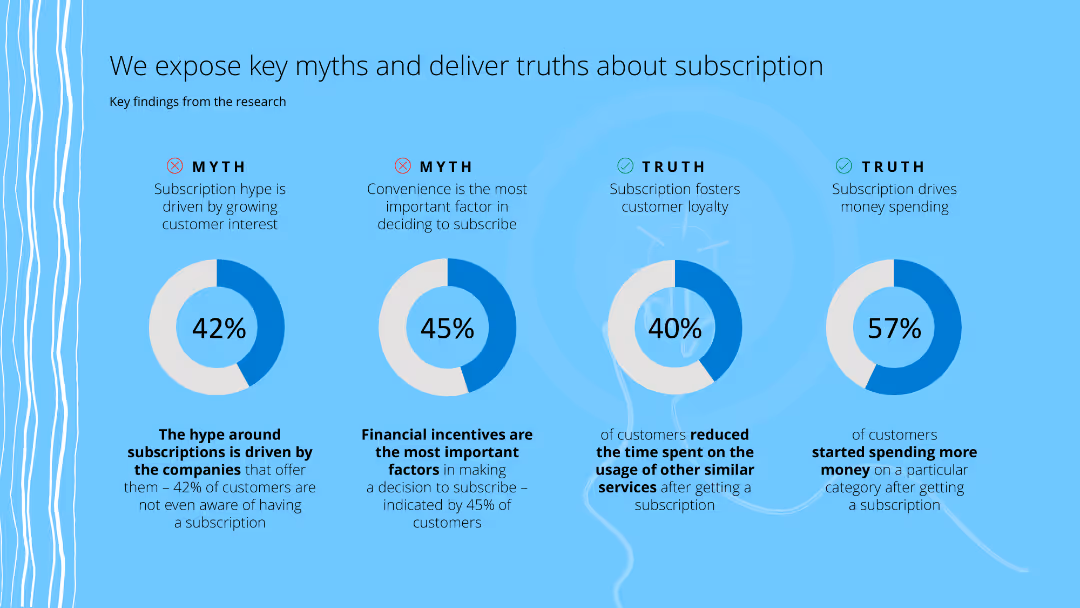
The slide has a light blue background with three myths and corresponding truths about subscriptions, each illustrated with a pie chart indicating percentage of customer agreement.
Customer and Market Segmentation
Consumer Goods
The slide presents key findings about customer perceptions on subscriptions, debunking common myths and presenting the actual truths based on survey data.
subscription, myths, truths, customer perception, survey
false
Customer and Market Segmentation
Consumer Goods
Multiple Chart
Deloitte
Add to my slides
Remove from favorites
Contains a mix of text, charts, and call-out boxes that break down the growth and projections of as-a-service models, highlighting key statistics.
Financial Performance
Technology & Software
Presents the importance of subscription-based models for top-line growth in the high-tech sector, referencing Apple's success and market projections.
subscription, revenue growth, as-a-service, high-tech, market projections, Apple
false
Financial Performance
Technology & Software
Linear Flow
Accenture
Add to my slides
Remove from favorites
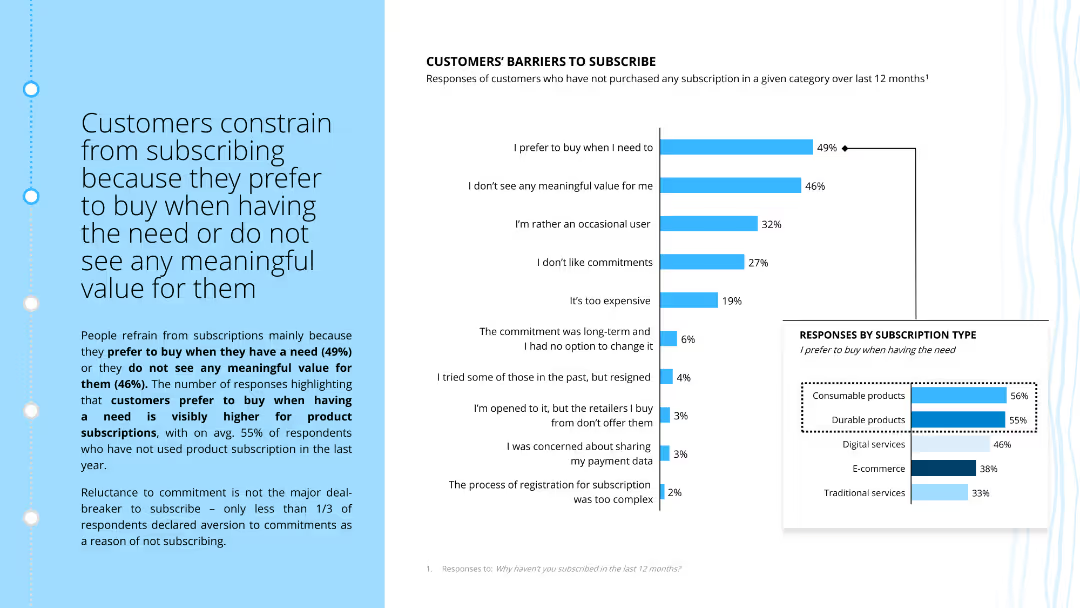
The slide features a column chart showing customer responses on barriers to subscribing, with percentages for each reason. Additionally, a horizontal bar chart displays responses by subscription type.
Market Analysis and Trends
Consumer Goods
The slide explains why customers refrain from subscribing, highlighting reasons such as preferring to buy when needed and not seeing meaningful value. It also shows data on preferences for different subscription types.
subscriptions, customer behavior, barriers, preferences, buying habits, product subscriptions, ecommerce, value perception, customer insights, retail
false
Market Analysis and Trends
Consumer Goods
Multiple Chart
Deloitte
Add to my slides
Remove from favorites
Displays a bar chart analyzing consumer concerns regarding vehicle subscription services, focusing on availability and cost issues.
Risk Assessment and Management
Transportation & Logistics
Discusses main consumer concerns about vehicle subscription services, including availability, cost, and the psychological impact of not owning a vehicle.
Subscription services, consumer concerns, availability, cost, ownership
false
Risk Assessment and Management
Transportation & Logistics
Single Chart
Deloitte
Add to my slides
Remove from favorites
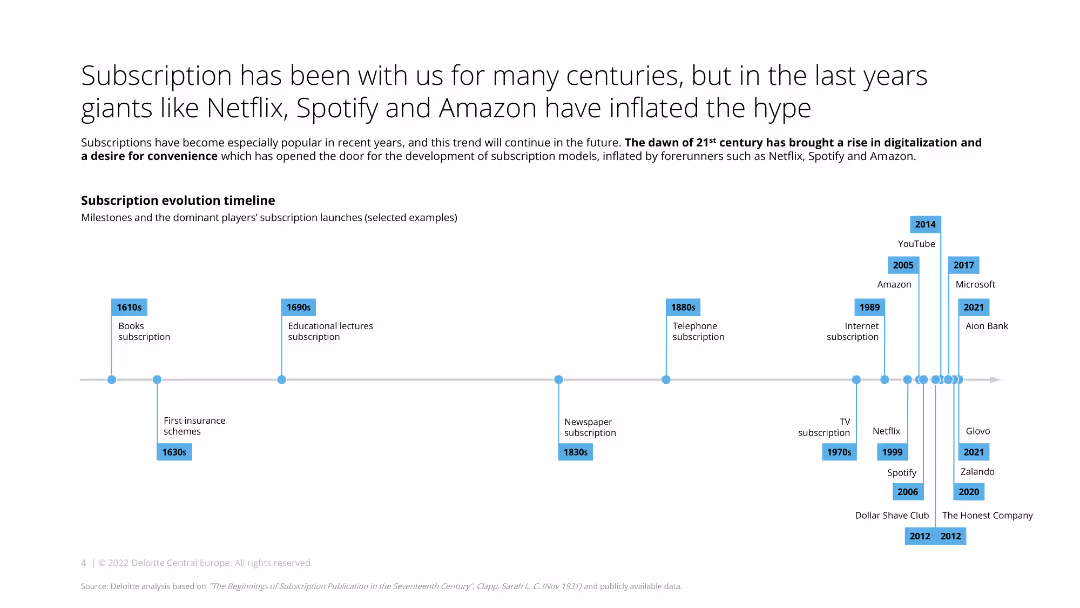
The slide features a timeline starting from the 1610s to the present, highlighting significant subscription model milestones in different industries, represented by labeled points on the timeline.
Market Analysis and Trends
Media & Entertainment
The slide shows the evolution of subscription models over the centuries, with key milestones in various industries, including books, lectures, newspapers, and digital services.
subscription, timeline, evolution, milestones, industry
false
Market Analysis and Trends
Media & Entertainment
Linear Flow
Deloitte
Add to my slides
Remove from favorites
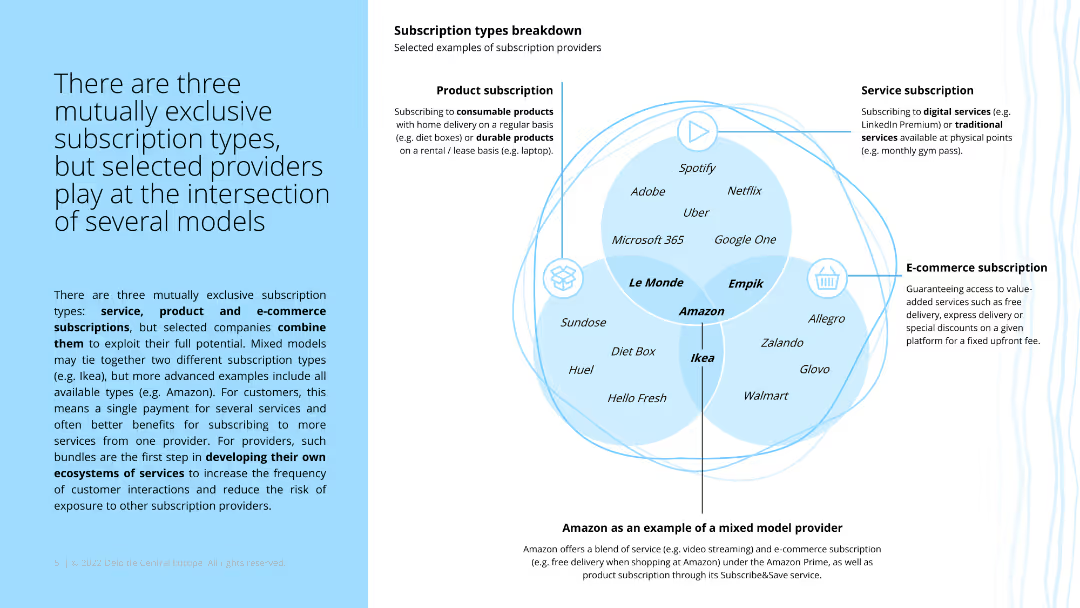
The slide includes a Venn diagram showing three mutually exclusive subscription types: service, product, and e-commerce, with examples of companies that operate at the intersection of these models.
Product and Service Analysis
Consumer Goods
The slide explains the different types of subscription models, illustrating how some companies combine multiple models to maximize their offerings.
subscription types, Venn diagram, service, product, e-commerce
false
Product and Service Analysis
Consumer Goods
Diagram
Deloitte
Add to my slides
Remove from favorites
Contains a complex, color-coded timeline illustrating various projects and studies from 2015 to 2019, with icons and logos of major oil companies.
Strategic Planning
Energy & Utilities
Provides a detailed look at the project timeline and key studies within the Subsea Integration Alliance, demonstrating the scope and scale of collaborative projects undertaken with major industry partners.
subsea, projects, timeline, integration, alliances
false
Strategic Planning
Energy & Utilities
Linear Flow
Barclays
Add to my slides
Remove from favorites
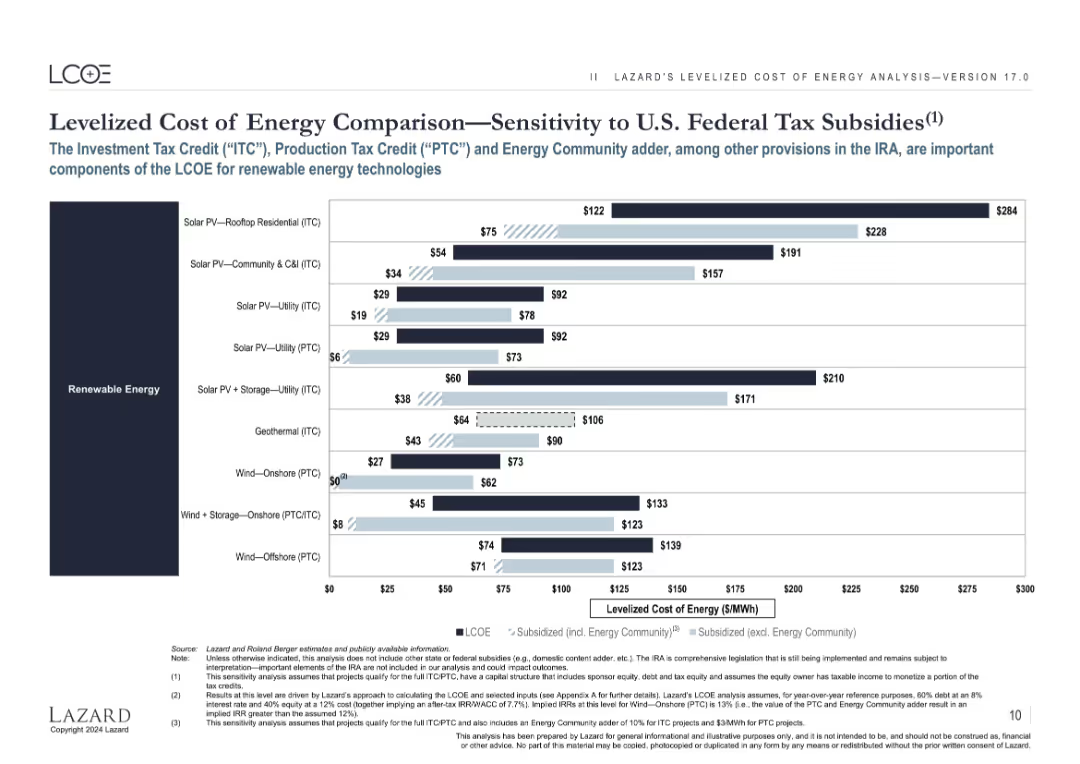
Same chart structure as 16633; includes lighter bars showing impact of ITC/PTC federal subsidies on renewable energy LCOE.
Regulatory and Compliance
Energy & Utilities
Demonstrates how U.S. tax subsidies (ITC/PTC) significantly reduce the LCOE of renewable technologies like solar and wind, improving their economic competitiveness.
subsidies, LCOE, tax credit, ITC, PTC, renewable, energy policy, incentives, U.S. IRA
false
Regulatory and Compliance
Energy & Utilities
Single Chart
Roland Berger
Add to my slides
Remove from favorites
The slide features a timeline of events and a map showing the Metro Manila Subway Project's phases. It includes photos and brief descriptions of key milestones.
Strategic Planning
Transportation & Logistics
Timeline of the Metro Manila Subway Project's development from initial inspections to meetings concerning construction phases.
subway, Philippines, timeline, construction, milestones
false
Strategic Planning
Transportation & Logistics
Vertical Flow
Deloitte
Add to my slides
Remove from favorites
A list format slide with a bold header, followed by four key points each backed by a description.
Corporate Finance and Valuation
Financial Services
Outlines the key success factors of an asset management company, ideal for investor relations or company meetings.
Success, Asset Management, Investment, Global Scale, Performance
false
Corporate Finance and Valuation
Financial Services
Table
Goldman Sachs
Add to my slides
Remove from favorites
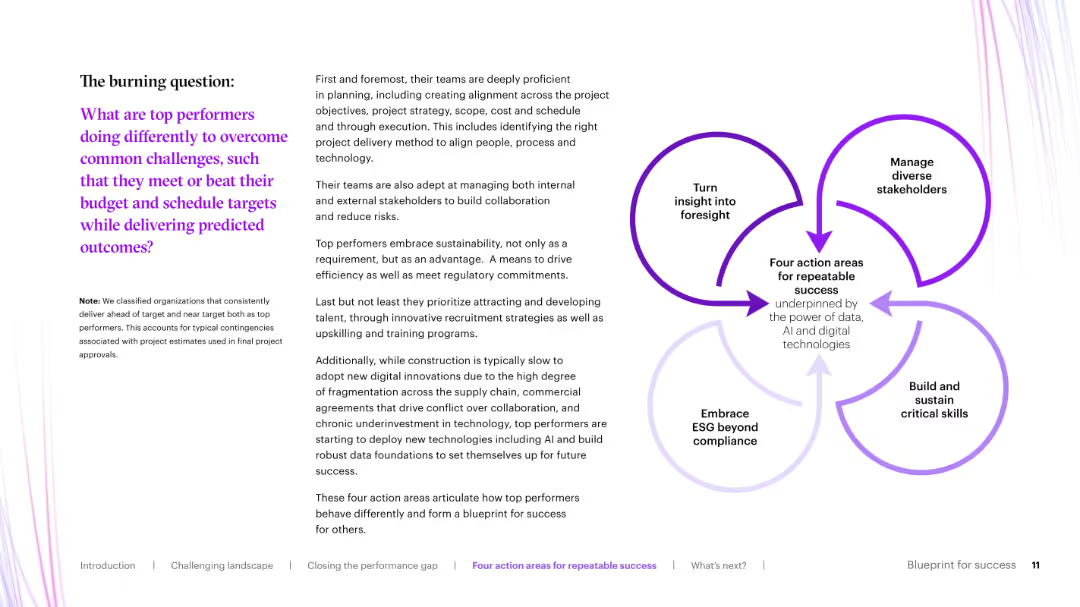
Text-heavy left layout with a circular infographic on the right showing "Four action areas for repeatable success."
Operational Efficiency
Real Estate & Construction
This slide introduces the key differentiators of top-performing organizations that succeed in delivering predictable capital project outcomes. It highlights four success pillars: foresight, stakeholder management, ESG, and skills development.
success factors, capital projects, ESG, foresight, stakeholder engagement
false
Operational Efficiency
Real Estate & Construction
Framework
Accenture
Add to my slides
Remove from favorites
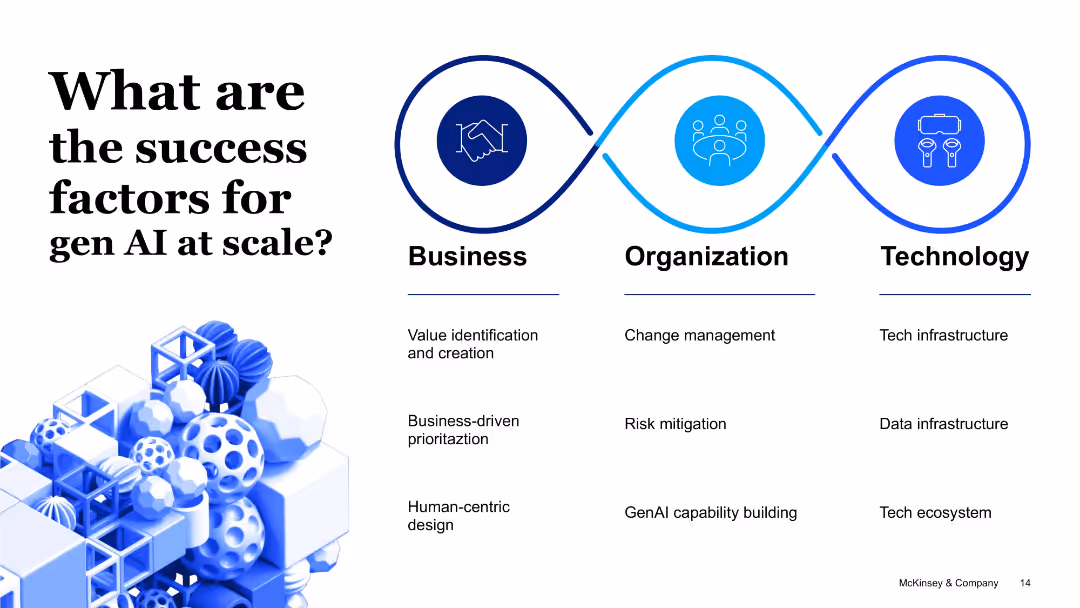
Three-column layout under Business, Organization, and Technology; uses iconography and wave design for section flow.
Strategic Planning
Artificial Intelligence
The slide identifies enablers of scalable Gen AI integration: business-driven value creation, risk mitigation and change management within organizations, and investment in robust tech/data infrastructure and ecosystems.
success factors, scalability, business, tech infrastructure, GenAI, change management
false
Strategic Planning
Artificial Intelligence
Pillar
McKinsey
Add to my slides
Remove from favorites
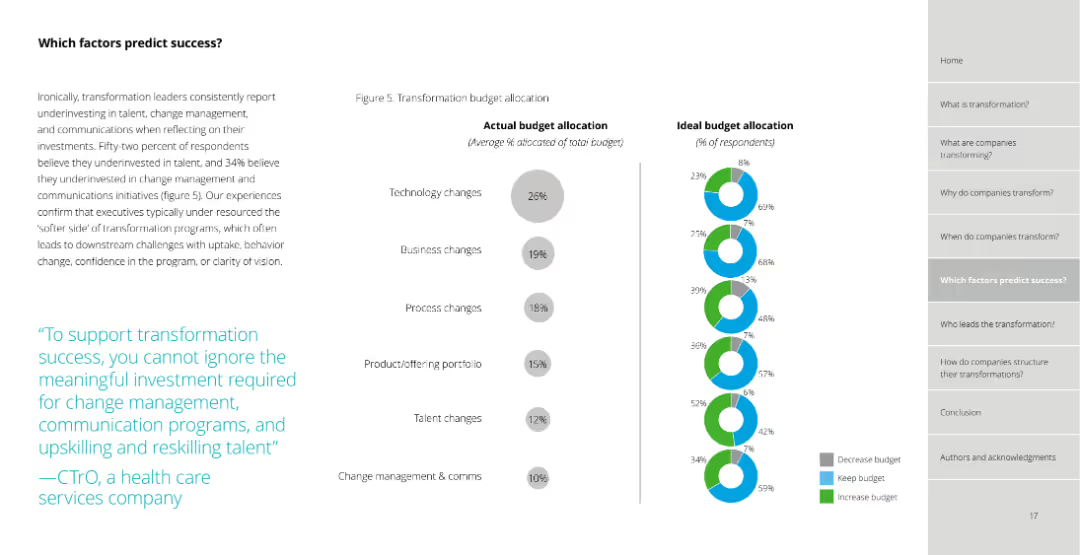
Side-by-side charts comparing actual vs. ideal transformation budget allocation across various categories.
Strategic Planning
Professional Services
Compares actual versus ideal budget allocation for transformation, highlighting areas where organizations under or over-invest.
success, financial, budget, actual, ideal, allocation, comparison
false
Strategic Planning
Professional Services
Multiple Chart
Deloitte
Add to my slides
Remove from favorites
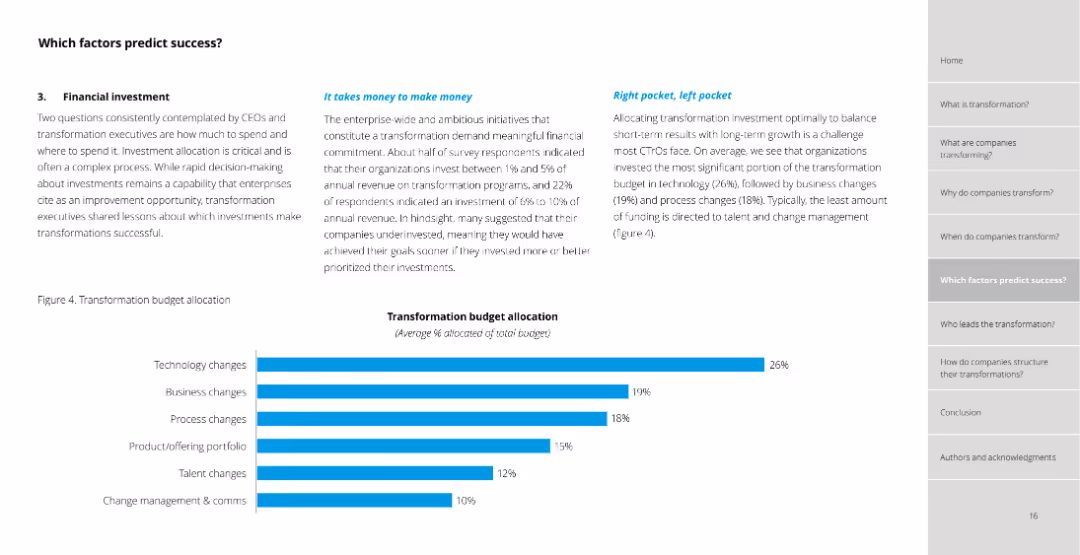
Bar chart (column chart) on transformation budget allocation across various categories like technology, business, process changes, etc.
Strategic Planning
Professional Services
Examines financial investment as a key factor in transformation success, with a focus on how budget is allocated across different areas.
success, financial, investment, budget, allocation, technology, business
false
Strategic Planning
Professional Services
Mixed Chart
Deloitte
Add to my slides
Remove from favorites
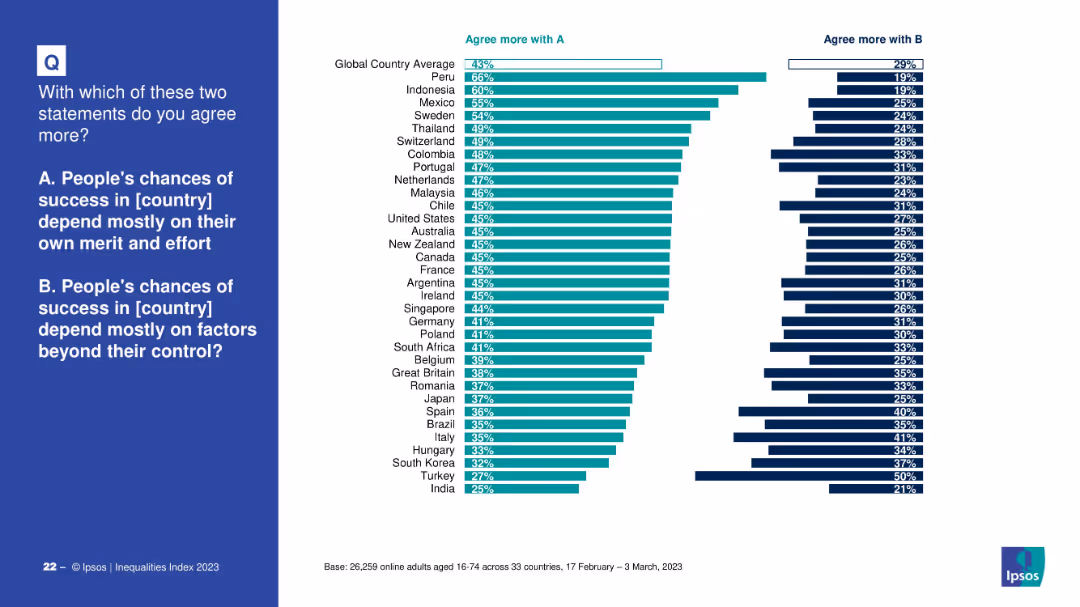
Bar chart comparing global and country-level agreement with: A) Success depends on merit and effort; B) Success depends on external factors. Dark teal vs. dark blue colors distinguish responses.
Market Analysis and Trends
Government & Public Sector
The slide captures attitudes across countries on whether success is determined by personal merit or external conditions. The global average leans slightly toward merit-based views, but with large variation between countries such as Peru (high merit belief) and India (low merit belief).
success, merit, external factors, perception, Ipsos, socioeconomics, global attitudes, inequality, control
false
Market Analysis and Trends
Government & Public Sector
Mixed Chart
IPSOS
Add to my slides
Remove from favorites
Features a vertical three-step list labeled from 1 to 3 with corresponding icons and short descriptions, all color-coded in shades of green and blue.
Strategic Planning
Professional Services
Describes the three crucial strategies for successful business integration, focusing on continuity, delivery of synergies, and transformation beyond the deal.
success, planning, business, integration, continuity, synergies, transformation
false
Strategic Planning
Professional Services
Vertical Flow
Deloitte
Add to my slides
Remove from favorites
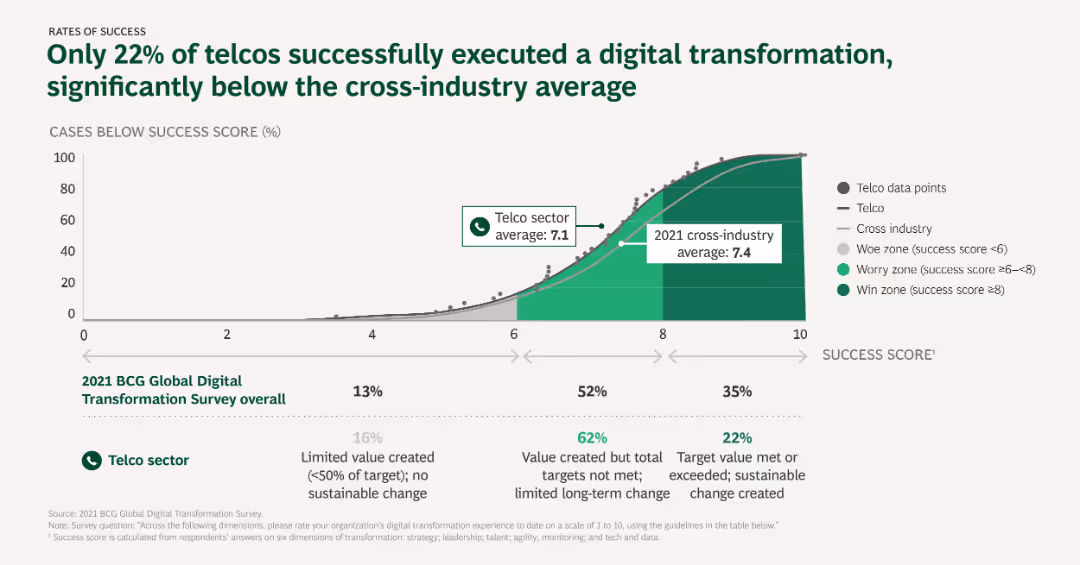
The slide presents a line graph comparing success scores of digital transformation across the telco sector and cross-industry, with annotations for worry, win, and average zones.
Performance Metrics and KPIs
Telecommunications
This slide illustrates the success rates of digital transformation initiatives in the telco sector compared to the cross-industry average, highlighting the low success rate among telcos.
Success rates, Digital transformation, Telcos, Cross-industry, Performance metrics
false
Performance Metrics and KPIs
Telecommunications
Mixed Chart
BCG
Add to my slides
Remove from favorites
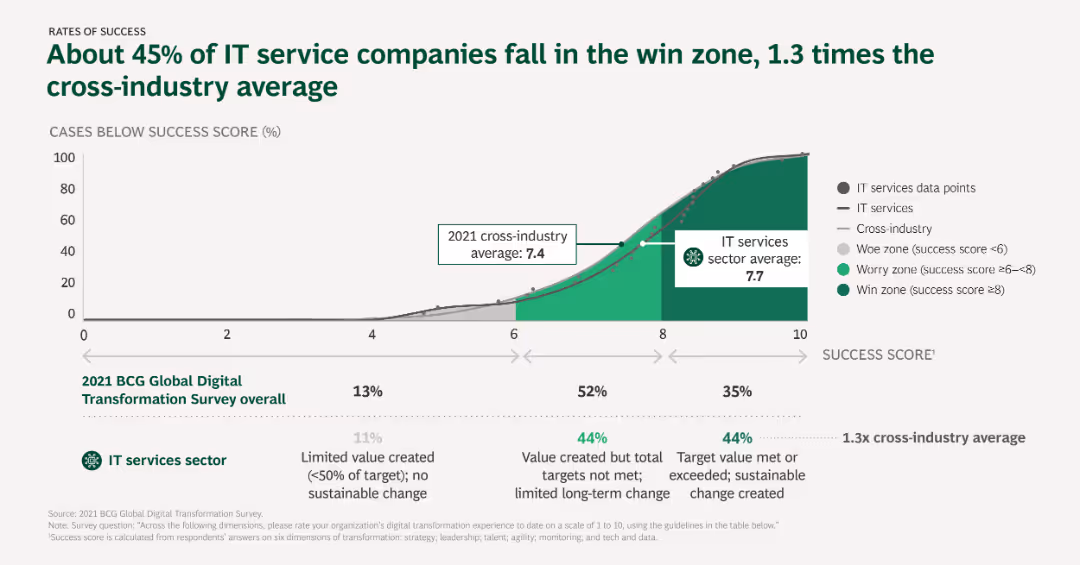
Column chart displaying success rates of IT service companies compared to cross-industry averages, with different zones indicating levels of success.
Performance Metrics and KPIs
Telecommunications
The slide examines the success rates of IT service companies in digital transformation, comparing them to cross-industry averages and categorizing success into different zones.
Success rates, IT services, Cross-industry comparison, Performance metrics, Digital transformation
false
Performance Metrics and KPIs
Telecommunications
Mixed Chart
BCG
Add to my slides
Remove from favorites
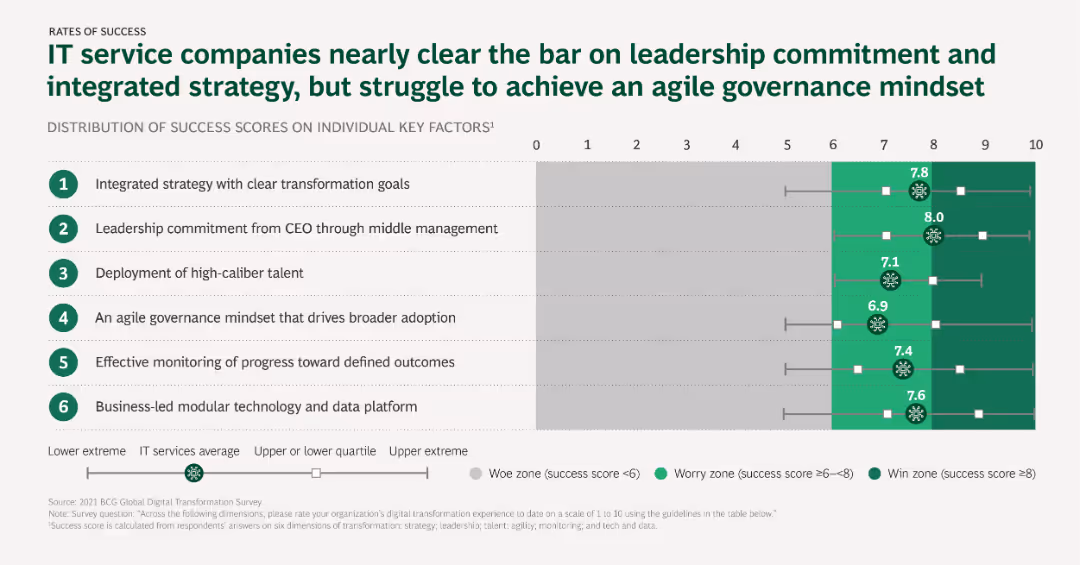
Scatter plot showing distribution of success scores on key factors for IT service companies, with different success zones and averages indicated.
Performance Metrics and KPIs
Telecommunications
This slide analyzes the success scores of IT service companies on individual key factors, highlighting areas like leadership commitment and agile governance mindset.
Success scores, Key factors, Leadership, Governance, IT services
false
Performance Metrics and KPIs
Telecommunications
Mixed Chart
BCG
Add to my slides
Remove from favorites
This final slide is simple, with four key points listed across the slide, each accompanied by an icon. The slide is designed to summarize the key messages of the presentation and provide clear takeaways.
Strategic Planning
Financial Services
Serves as a succinct wrap-up of the presentation's core messages, focusing on market positioning, capital preservation, customer commitment, and risk management strategies, aimed at reinforcing the final thoughts for the audience.
summary, conclusion, key points, market position, capital preservation, customer commitment, risk management, strategic summary, final thoughts, presentation wrap-up, core messages
false
Strategic Planning
Financial Services
Pillar
Goldman Sachs
Add to my slides
Remove from favorites
Consistent with slides 2962, 2963, and 2966, this slide shares the same style and cyclical arrows design. The gray color scheme is used throughout, and the slide number is 9.
Market Analysis and Trends
Financial Services
This slide reinforces the key themes of market structure evolution, likely serving as a concluding summary of the discussed catalysts and trends within the series.
summary, market structure, trends, evolution
false
Market Analysis and Trends
Financial Services
Linear Flow
Goldman Sachs
Add to my slides
Remove from favorites
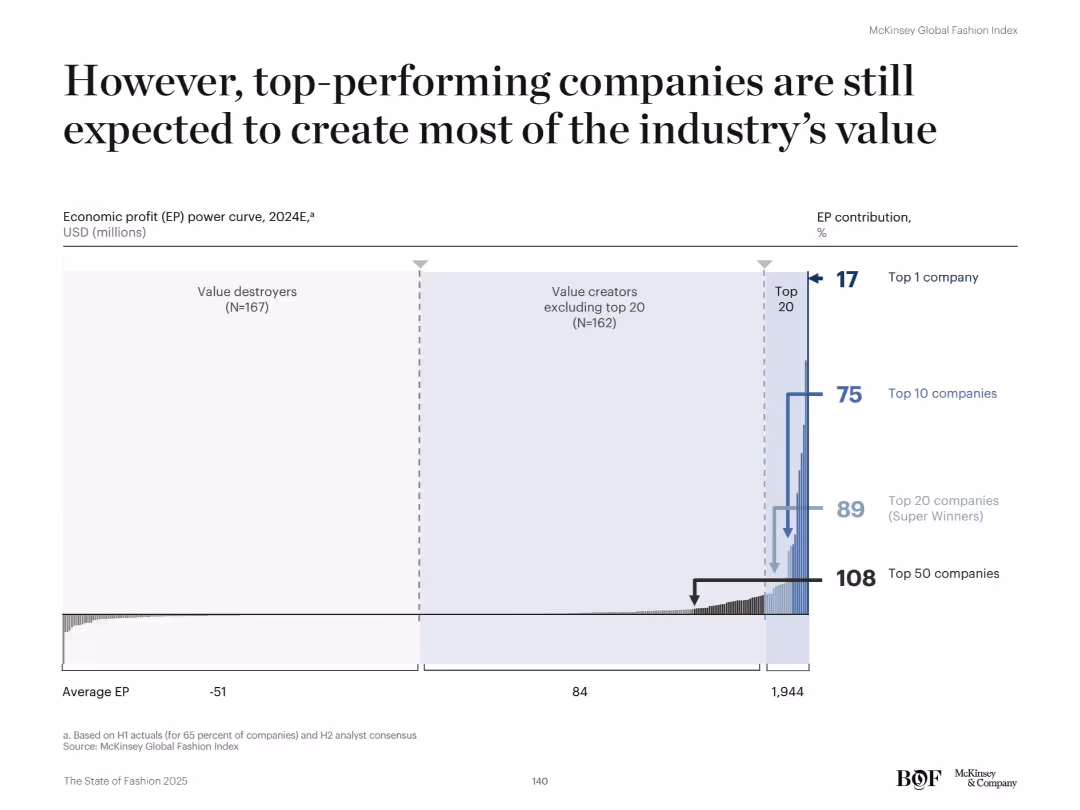
Wide bar chart resembling a power curve distribution with annotations. Horizontal layout. The chart groups companies by economic profit tiers and illustrates percentage contributions for top-performing brackets.
Financial Performance
Retail & E-commerce
Despite the narrowing EP gap, the top 20 companies (Super Winners) are still projected to deliver the majority of industry economic profit in 2024. The top 10 will account for 75% and the single top company for 17% of EP. The rest, including 167 value destroyers, generate below-average or negative EP.
super winners, economic profit, EP curve, top companies, fashion, value destroyers, retail performance
false
Financial Performance
Retail & E-commerce
Single Chart
McKinsey
Add to my slides
Remove from favorites
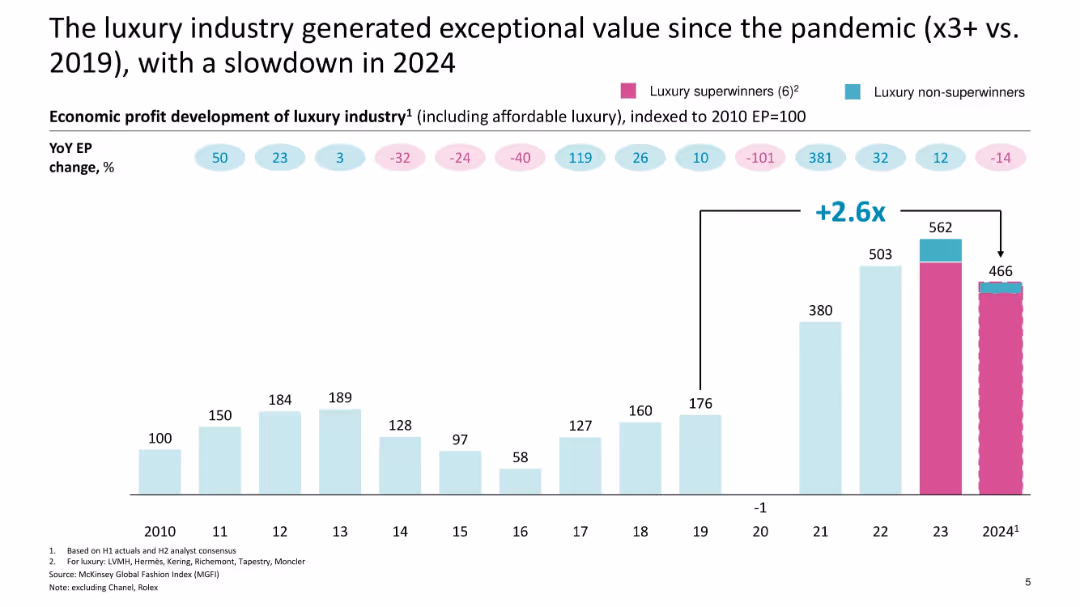
Vertical bar chart showing economic profit indexed to 2010; YoY EP change above
Financial Performance
Consumer Goods
The slide emphasizes a sharp post-pandemic surge in economic profit, driven largely by "superwinner" luxury brands, followed by a projected downturn in 2024.
superwinners, economic profit, luxury brands, post-pandemic, value creation, downturn, EP index
false
Financial Performance
Consumer Goods
Single Chart
McKinsey
Add to my slides
Remove from favorites
Two stacked line charts (BCVA and CST) tracking progress over 24 weeks for three treatment groups in supplement-free patients. Highlight box summarizes group differences.
Product and Service Analysis
Healthcare & Pharmaceuticals
Subgroup analysis reveals that supplement-free patients treated with DURAVYU 2.7mg had superior visual acuity gains (+10.3 letters) and CST reductions (-117.4 microns) compared to aflibercept and lower DURAVYU dosage. Suggests best results in supplement-free cohort.
supplement-free, subgroup, BCVA, CST, DURAVYU 2.7mg, clinical trial
false
Product and Service Analysis
Healthcare & Pharmaceuticals
Multiple Chart
Goldman Sachs
Add to my slides
Remove from favorites
Standard two-column format with text and triangle forecast graph on the left, image of female technician on the right. Purple theme.
Risk Assessment and Management
Industrial & Manufacturing
Analyzes supplier delivery expectations, noting that 85% of executives express confidence in delivery capabilities. Highlights Boeing’s delays and Airbus’s bottlenecks, with digital tools emerging to mitigate risks.
supplier delivery, Boeing, Airbus, aerospace risk, production bottlenecks, digital supply chain, forecast, logistics
false
Risk Assessment and Management
Industrial & Manufacturing
Mixed Chart
Accenture
Add to my slides
Remove from favorites
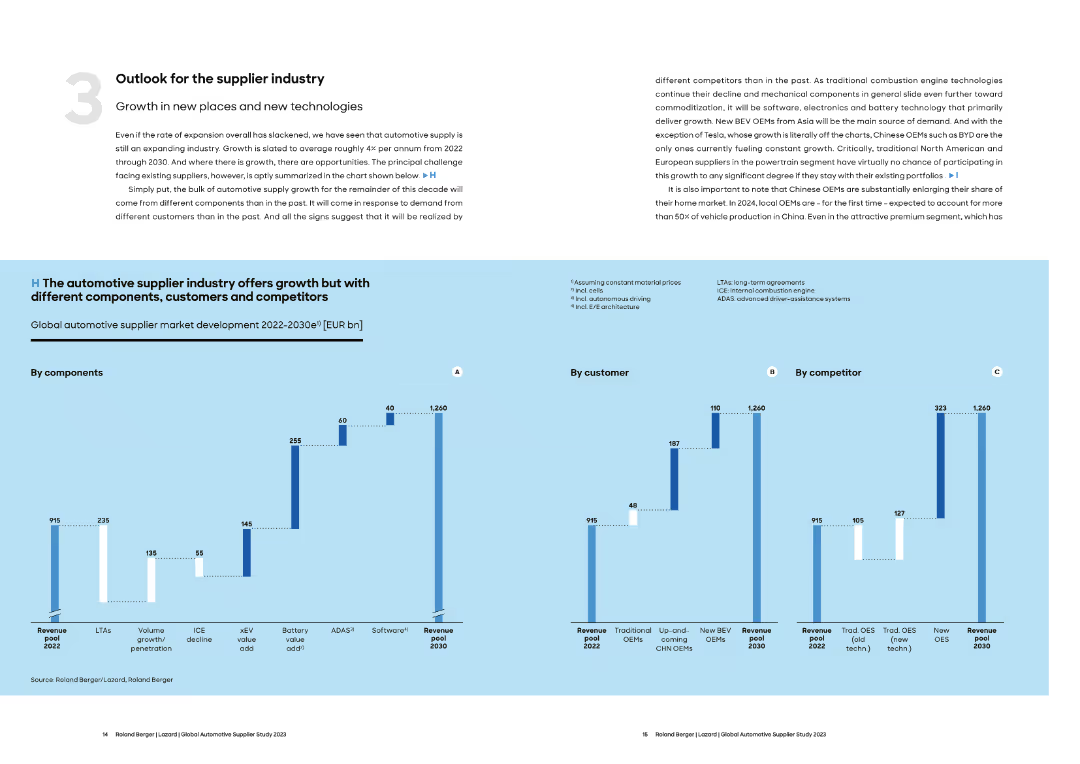
Features column charts depicting market development by components, customer segments, and competitors from 2022 to 2030. Text discusses the outlook for the automotive supplier industry with a focus on growth in new technologies.
Strategic Planning
Transportation & Logistics
Provides a strategic overview of the growth opportunities in the automotive supplier industry. Emphasizes the importance of new technologies, components, and customer segments in driving future market growth.
Supplier Industry, Automotive, Growth, Technology, Strategy
false
Strategic Planning
Transportation & Logistics
Multiple Chart
Roland Berger
Add to my slides
Remove from favorites
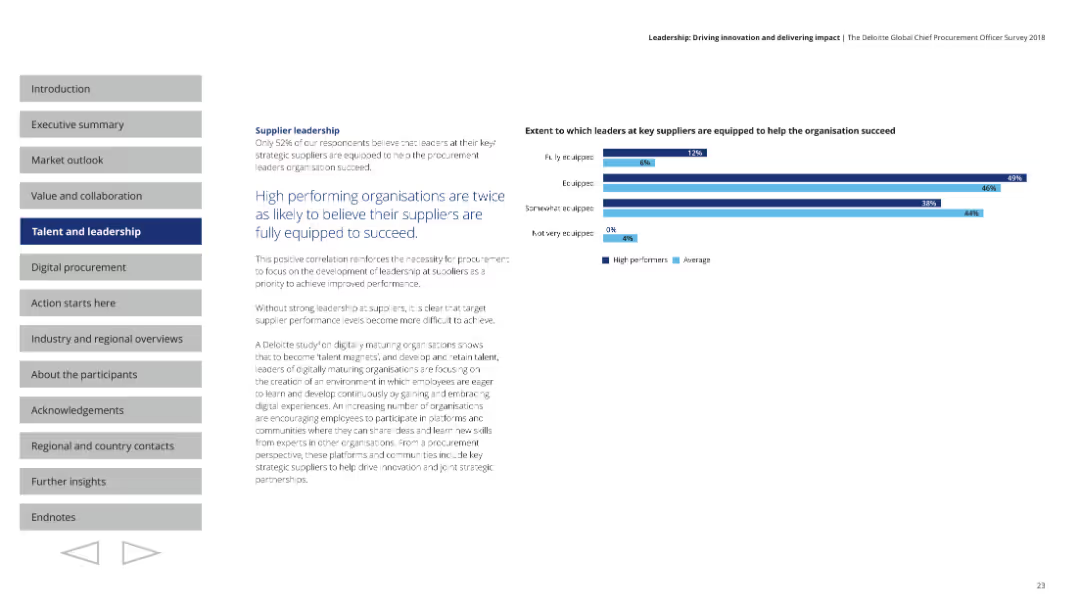
Horizontal bar charts comparing the extent to which leaders at key suppliers are equipped to help organizations succeed. Text on the left, and a chart with varying blue shades on the right, highlighting differences between high performers and average organizations.
Human Resources and Talent Management
Professional Services
Discusses the importance of supplier leadership, noting that high-performing organizations are more likely to believe their suppliers are fully equipped to succeed. Emphasizes the need for developing leadership skills at suppliers to improve overall procurement performance.
supplier leadership, procurement, performance, development, success
false
Human Resources and Talent Management
Professional Services
Mixed Chart
Deloitte
Add to my slides
Remove from favorites
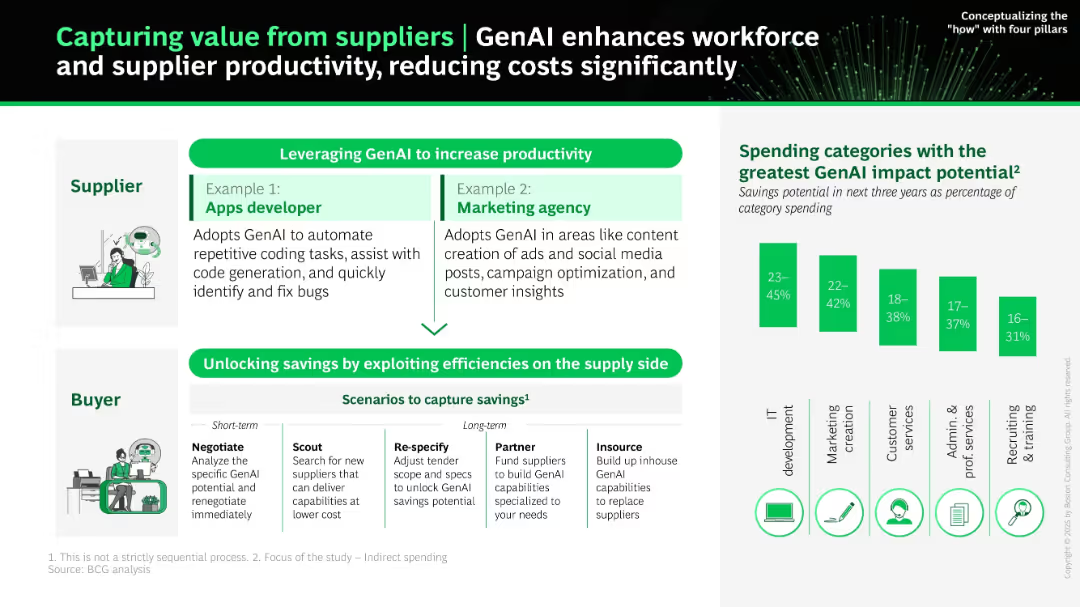
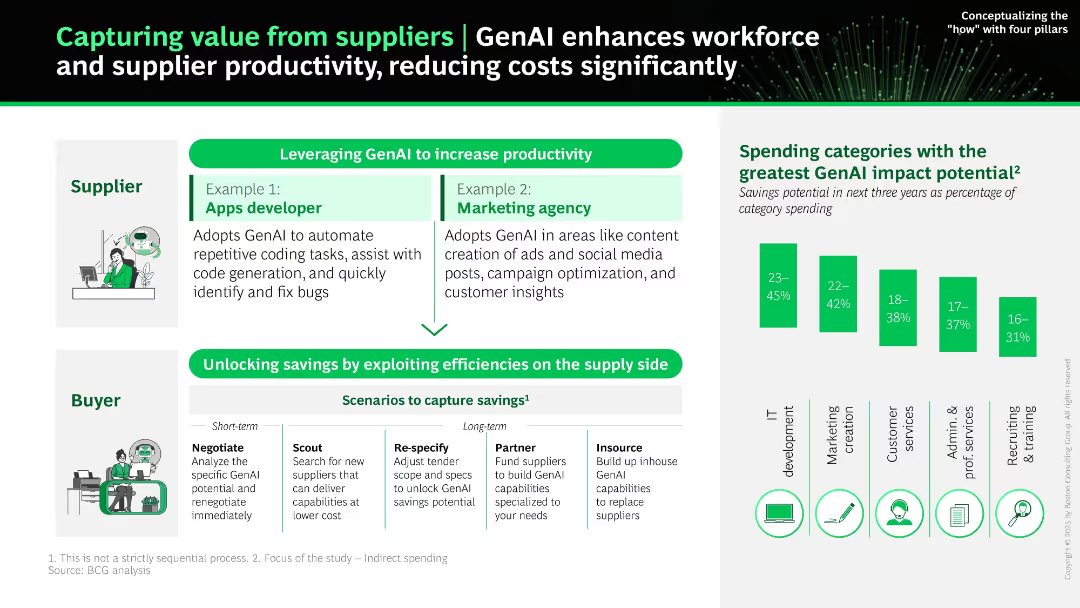
Divided into supplier and buyer sections, showing use case examples. Includes bar chart showing categories with highest GenAI impact. Green color highlights impact zones.
Strategic Planning
Technology & Software
Demonstrates how GenAI boosts productivity for suppliers (e.g., devs, marketers) and enables buyers to reduce costs via strategic steps (e.g., renegotiation, insourcing). The right-side bar chart shows where GenAI savings are highest, focusing on indirect spend.
supplier productivity, savings, GenAI, marketing, app development, indirect spend, buyer strategy
false
Strategic Planning
Technology & Software
Mixed Chart
BCG
Add to my slides
Remove from favorites
The slide has two line charts comparing suppliers' delivery times and manufacturing backlogs of work in the UK, US, Euro area, and Japan, with annotations.
Operational Efficiency
Transportation & Logistics
The slide analyzes the trends in supplier delivery times and manufacturing backlogs, noting improvements in supply availability and reduced bottlenecks.
suppliers, delivery, backlogs, UK, US, Euro area, Japan
false
Operational Efficiency
Transportation & Logistics
Multiple Chart
Accenture
Add to my slides
Remove from favorites
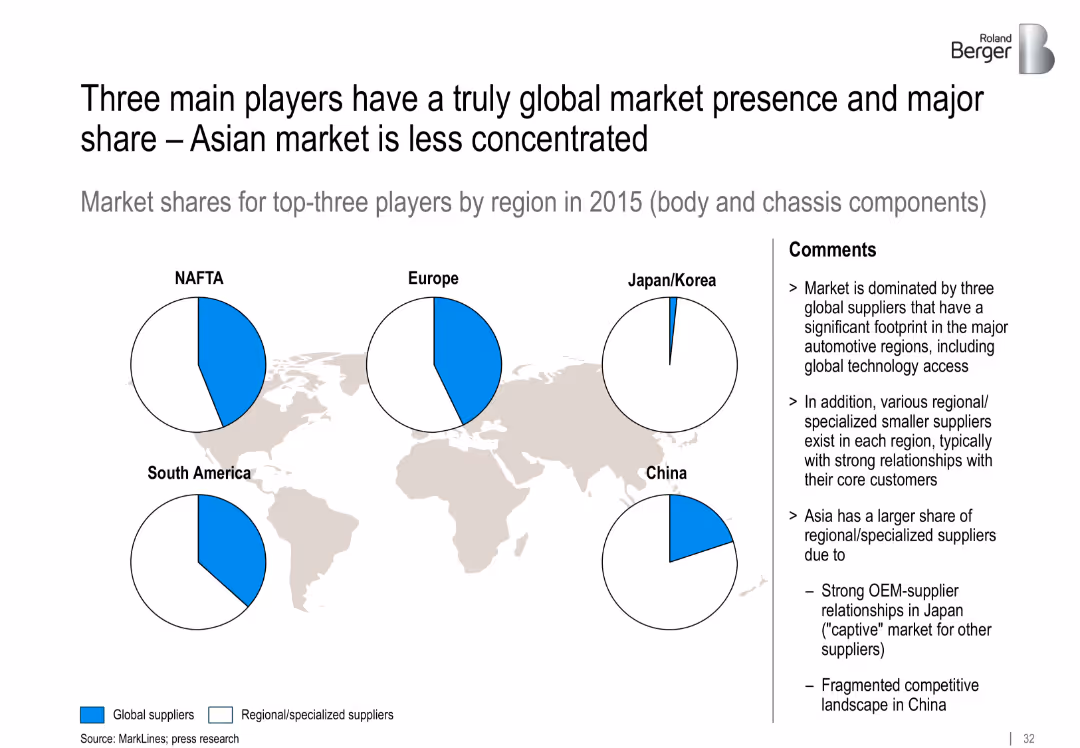
World map background with five pie charts over key regions showing global vs. regional supplier share in 2015. Comment section on the right.
Competitive Landscape
Industrial & Manufacturing
The slide reveals supplier concentration in major regions. Global suppliers dominate NAFTA and Europe, while Asia is fragmented with strong regional supplier presence due to OEM partnerships.
suppliers, global presence, regional market, fragmentation, OEM relationships, Asia
false
Competitive Landscape
Industrial & Manufacturing
Mixed Chart
Roland Berger
Add to my slides
Remove from favorites
Features diagrams and bar graphs displaying the number of Tier 1 suppliers across different industries and major companies.
Operational Efficiency
Industrial & Manufacturing
Details the extent of reliance on Tier 1 suppliers in large companies, highlighting the vast networks involved and the industries most dependent on these suppliers for operations.
Suppliers, Industries, Supply Chain, Tier 1, Companies
false
Operational Efficiency
Industrial & Manufacturing
Multiple Chart
McKinsey
Add to my slides
Remove from favorites
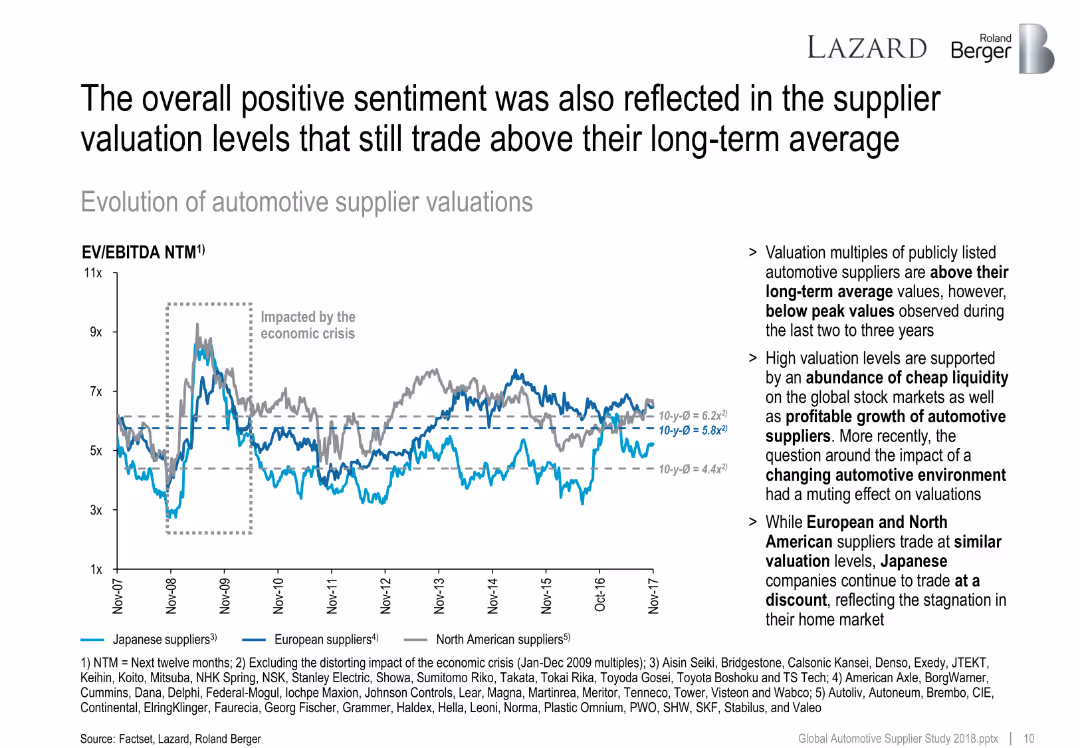
Line chart tracking EV/EBITDA for Japanese, European, and North American suppliers from 2007 to 2017. Dashed average lines and comment section included.
Investment Analysis
Industrial & Manufacturing
This slide explores supplier valuation trends over a decade. Japanese suppliers trade at a discount, while European and North American ones remain above long-term average due to high liquidity and profit growth.
supplier valuation, EV/EBITDA, investment, liquidity, Japan, North America, stock market
false
Investment Analysis
Industrial & Manufacturing
Mixed Chart
Roland Berger
Add to my slides
Remove from favorites
Top-down layout showing supplier and buyer roles; includes example boxes, bar graph on GenAI impact by category, and icons for each procurement category.
Operational Efficiency
Professional Services
The slide shows how GenAI boosts supplier and buyer productivity. It illustrates two supplier examples and outlines buyer-side strategies like scouting, negotiating, and insourcing. A bar graph reveals which spending categories have the highest GenAI savings potential.
supplier value, GenAI, cost savings, automation, procurement, category impact, negotiation, AI adoption
false
Operational Efficiency
Professional Services
Mixed Chart
BCG
Add to my slides
Remove from favorites
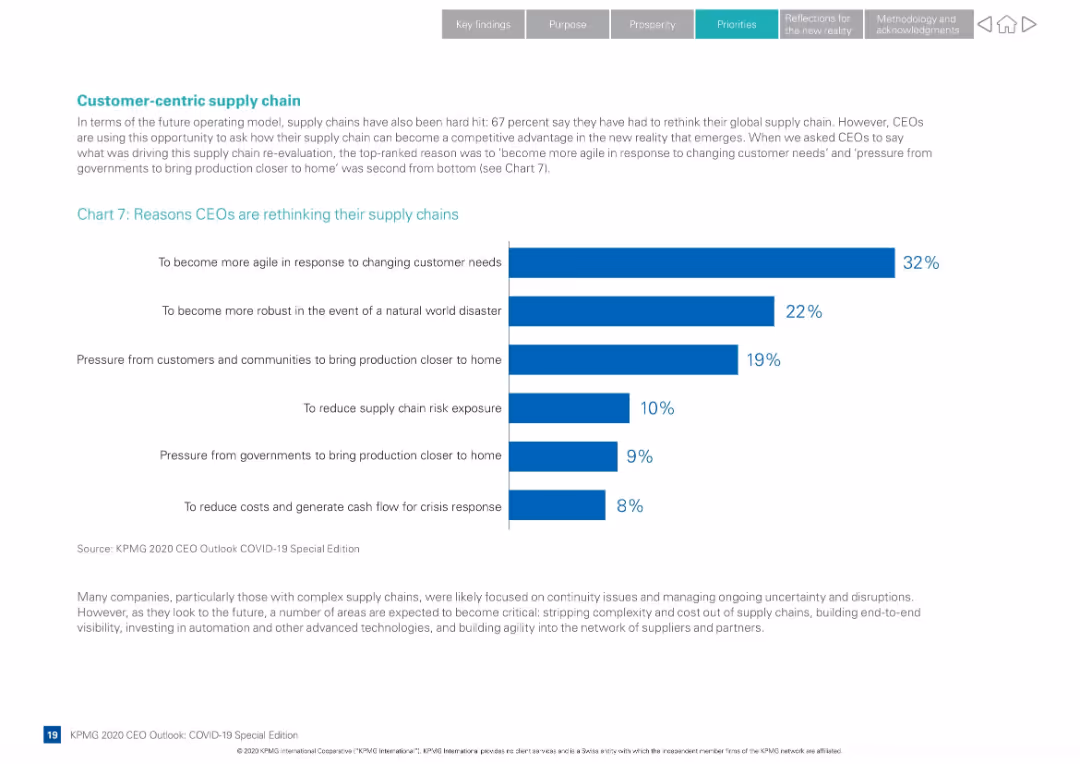
Clean, white-background layout with horizontal bar chart and supporting paragraph text
Operational Efficiency
Transportation & Logistics
Presents reasons CEOs are rethinking supply chains post-COVID. Emphasis on agility, robustness, and proximity to customers. Cites motivations like natural disasters, risk exposure, and government pressure.
supply chain, agility, COVID-19, CEO priorities, logistics, operational strategy, bar chart, customer needs
false
Operational Efficiency
Transportation & Logistics
Mixed Chart
KPMG
Add to my slides
Remove from favorites
Left side has percentage boxes, right side has a bar chart and text
Operational Efficiency
Transportation & Logistics
Use of generative AI in supply chain management, focusing on knowledge enhancement and predictive models
supply chain, AI, knowledge enhancement, predictive models
false
Operational Efficiency
Transportation & Logistics
Mixed Chart
Gartner
Add to my slides
Remove from favorites
The slide uses detailed diagrams to represent three supply chain models for cement and clinker. Each model is broken down into stages with icons and annotations.
Operational Efficiency
Industrial & Manufacturing
Illustrates the supply chain processes for domestic production, clinker import, and cement import in Australia. Highlights the different stages and logistics involved in each archetype.
Supply chain, cement, clinker, logistics, Australia
false
Operational Efficiency
Industrial & Manufacturing
Diagram
LEK
Add to my slides
Remove from favorites
Column charts display the top three supply chain impacts across different regions, with corresponding icons for each impact. Commentary is on the right.
Market Analysis and Trends
Transportation & Logistics
The slide presents survey results showing CEOs' concerns about supply chain disruptions due to geopolitical instability, climate change, and other challenges, highlighting regional differences.
Supply chain, CEO concerns, regional impacts, disruptions, survey
false
Market Analysis and Trends
Transportation & Logistics
Mixed Chart
Accenture
Add to my slides
Remove from favorites
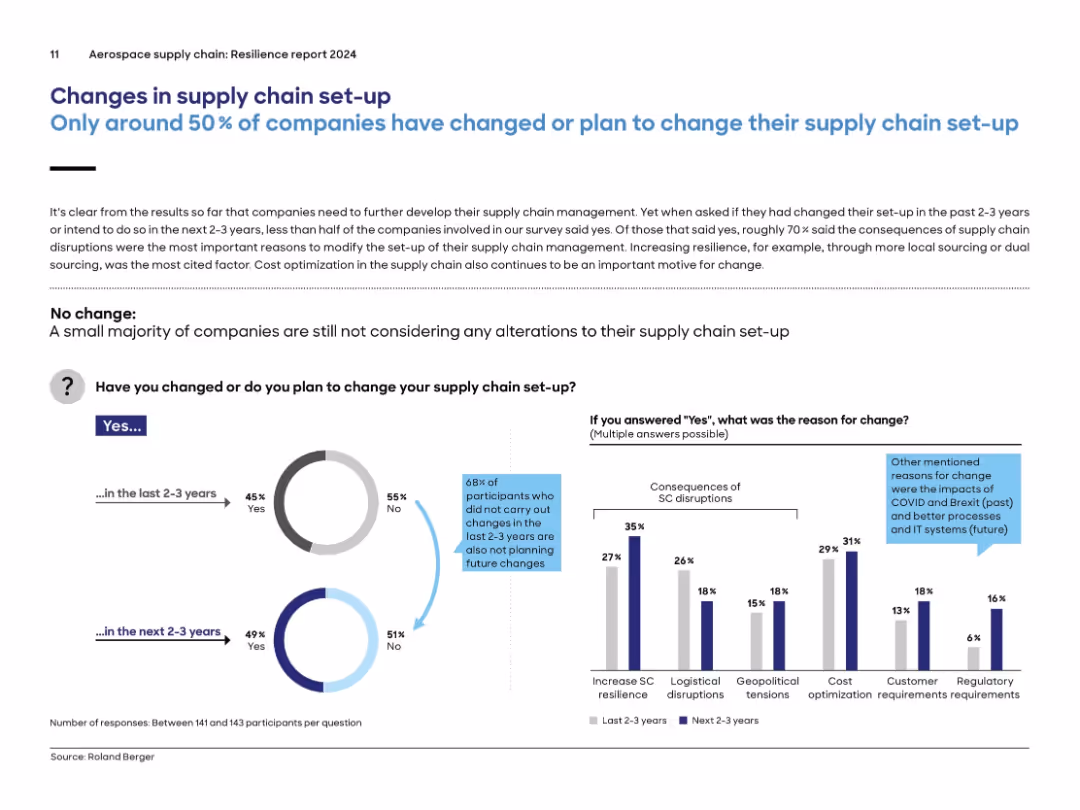
Split design with pie charts on the left showing past and planned changes, and a bar chart on the right detailing reasons for change.
Strategic Planning
Environmental Services & Sustainability
Less than half of companies have changed their supply chain set-up in the past 2–3 years or plan to do so. The main drivers for change were supply chain disruptions, increasing resilience, and cost optimization. The slide features visual data on the proportion of firms that changed, reasons cited, and future intentions, highlighting stagnation in proactive planning.
supply chain, change, resilience, planning, optimization, disruption, aerospace, pie chart
false
Strategic Planning
Environmental Services & Sustainability
Multiple Chart
Roland Berger
Add to my slides
Remove from favorites
The slide has a table with three columns comparing potential partnerships: Backwards integration, Long-term supply contracts & partnerships, and Green partnerships.
Strategic Planning
Industrial & Manufacturing
The slide outlines strategies for securing high-quality stock and mitigating commodity pressure through different types of partnerships.
supply chain, commodity pressure, partnerships, high-quality stock, strategies
false
Strategic Planning
Industrial & Manufacturing
Mixed Chart
McKinsey
Add to my slides
Remove from favorites
This slide presents two line charts: one showing the Global Supply Chain Pressure Index from December 2015 to June 2023, and another showing global commodity prices from January 2010 to June 2023.
Market Analysis and Trends
Financial Services
The slide examines the easing of supply chain pressures and the decline in commodity prices, discussing their implications for inflation and economic activity.
supply chain, commodity prices, inflation, economy
false
Market Analysis and Trends
Financial Services
Multiple Chart
EY
Add to my slides
Remove from favorites
Slide features a table each labeled with topics like 'Direct and indirect procurement'. Each icon has a concise descriptor on the left and an expanded rationale on the right. Green and white color scheme.
Operational Efficiency
Industrial & Manufacturing
Discusses strategies to manage supply chain and manufacturing costs effectively, offering specific actions like building sourcing capabilities and investing in digital manufacturing, aligned with industry best practices.
supply chain, cost management, procurement, manufacturing, logistics
false
Operational Efficiency
Industrial & Manufacturing
Table
BCG
Add to my slides
Remove from favorites
This slide features a diagram comparing cost differences in the wheat supply chains of Australia and Canada, with annotations highlighting key findings.
Operational Efficiency
Transportation & Logistics
The slide compares the cost structures of the wheat supply chains in Australia and Canada, emphasizing the higher domestic supply chain costs in Australia and identifying areas for potential improvement.
Supply chain costs, Australia, Canada, transportation, logistics, wheat supply chain, cost comparison, operational efficiency
false
Operational Efficiency
Transportation & Logistics
Single Chart
LEK
Add to my slides
Remove from favorites
The slide presents a diagram comparing the wheat supply chain costs between Australia and Ukraine, with detailed annotations on cost components and findings.
Operational Efficiency
Transportation & Logistics
The slide evaluates the cost differences in the wheat supply chains of Australia and Ukraine, noting that Australia's costs are higher despite Ukraine's longer transport distances and older infrastructure.
Supply chain costs, Australia, Ukraine, transportation, logistics, wheat supply chain, cost comparison, operational efficiency
false
Operational Efficiency
Transportation & Logistics
Single Chart
LEK
Add to my slides
Remove from favorites
Line chart with annotations and key geopolitical events labeled, showing deviations in global supply chain pressures from the long-term average.
Market Analysis and Trends
Transportation & Logistics
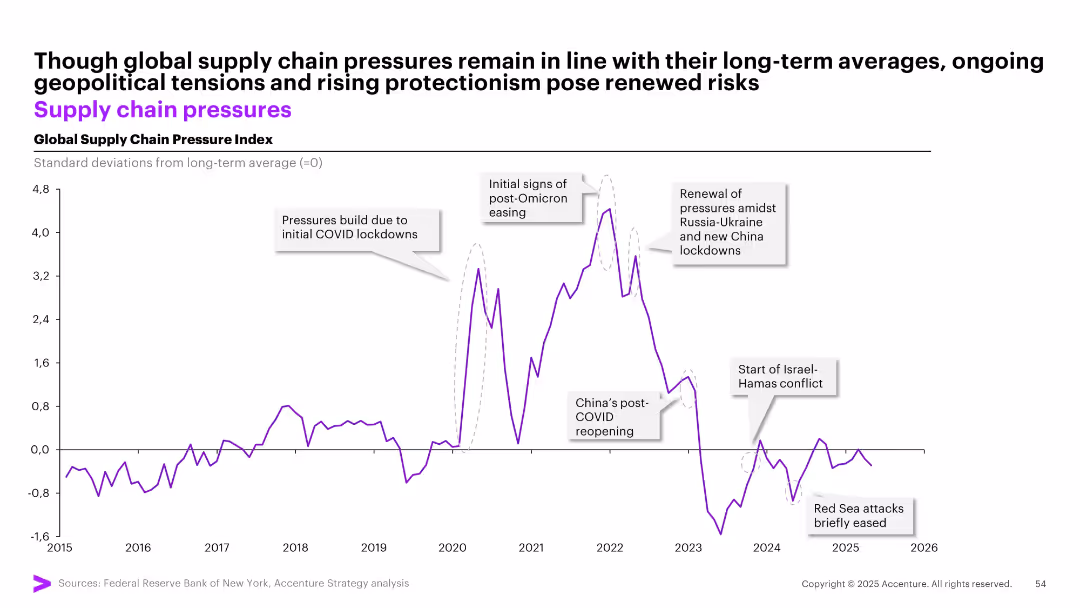
Tracks global supply chain pressure index from 2015 to 2026, highlighting disruptions from events such as COVID-19 lockdowns, Russia-Ukraine conflict, and Red Sea attacks. Despite fluctuations, pressures are nearing long-term average, but risks from protectionism persist.
supply chain, COVID-19, geopolitical risk, logistics, index, pressure, trend, Russia, China, Omicron, Hamas
false
Market Analysis and Trends
Transportation & Logistics
Single Chart
Accenture
Add to my slides
Remove from favorites
Horizontal 3-stage graphic from “Firefighting” to “SC Resilience”; percentage breakdown shown at the bottom; annotated illustrations explain each stage.
Strategic Planning
Environmental Services & Sustainability
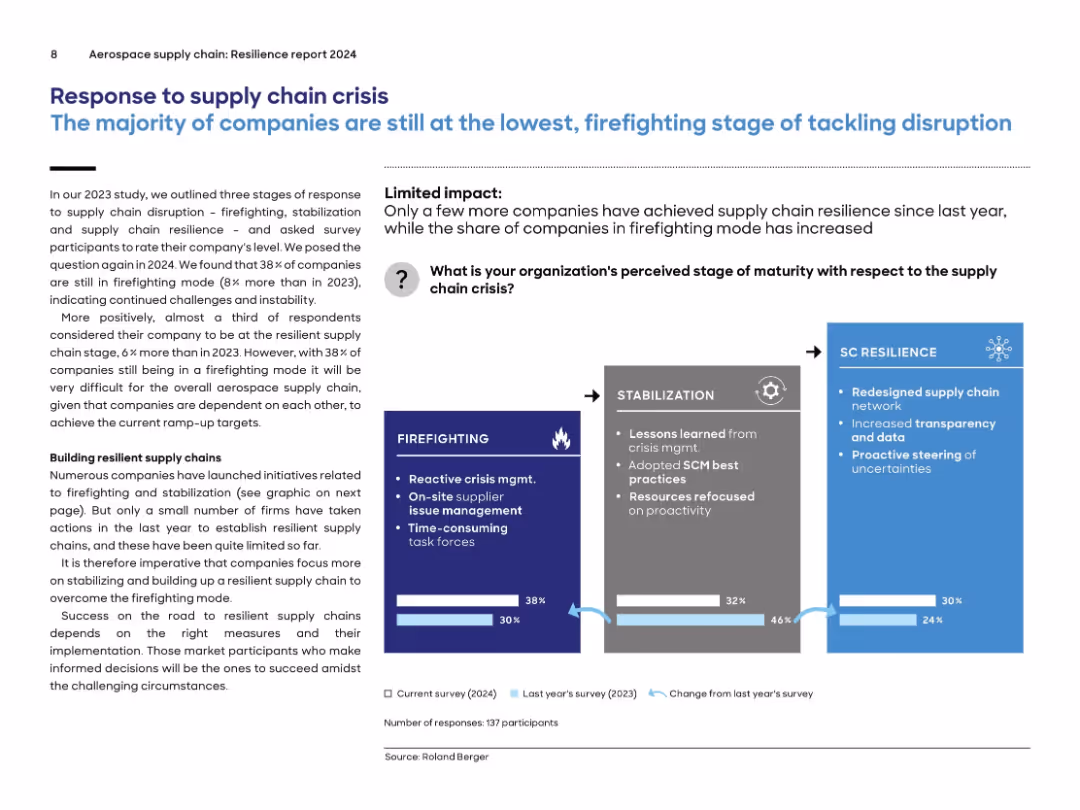
The slide categorizes company responses to supply chain disruption into three maturity stages: Firefighting (38%), Stabilization (32%), and Resilience (30%). Most companies remain in the initial, reactive stage. Although there is improvement over 2023, only a small number have developed proactive supply chain strategies. An arrow-based visual conveys progression across maturity stages.
supply chain, crisis response, maturity, firefighting, stabilization, resilience, aerospace, survey
false
Strategic Planning
Environmental Services & Sustainability
Mixed Chart
Roland Berger
Add to my slides
Remove from favorites
Text on left with explanation and bar chart on right showing severity levels; blue accents used; comparison between 2023 and 2024 survey results.
Risk Assessment and Management
Environmental Services & Sustainability
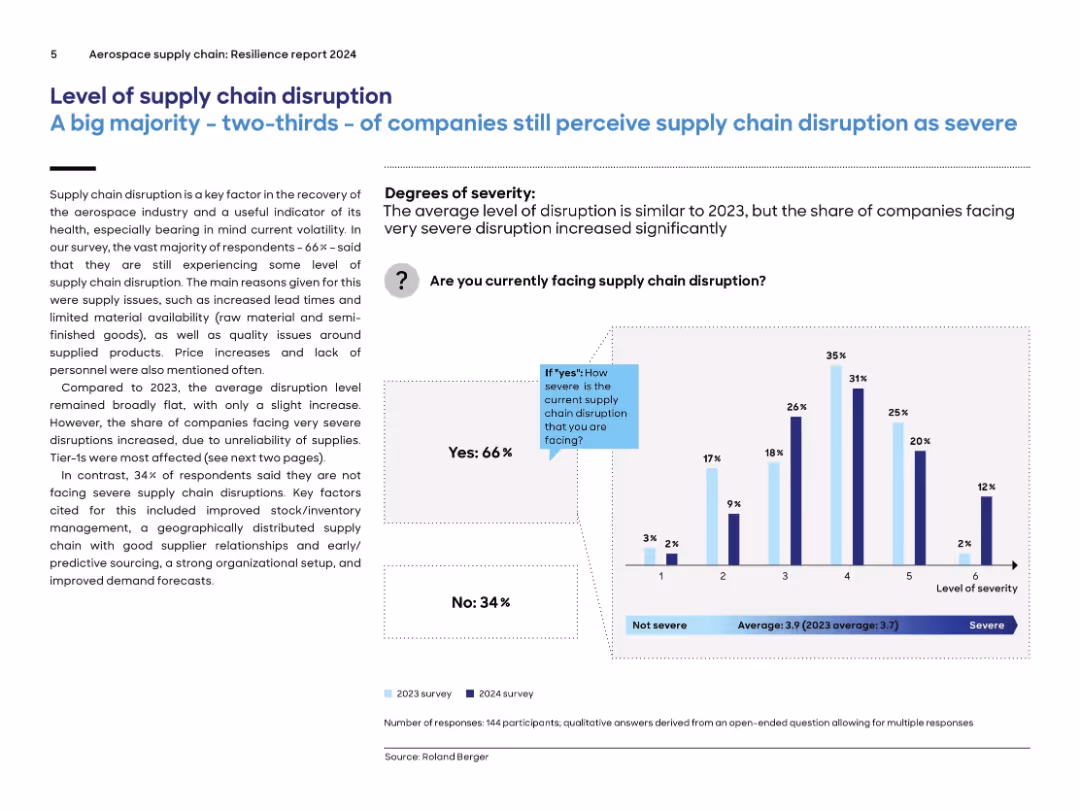
The slide highlights that 66% of aerospace companies still experience significant supply chain disruptions, with severity remaining similar to 2023. The primary issues include lead times, material availability, and labor shortages. Tier-1 companies are the most affected. A bar graph illustrates disruption severity levels, comparing survey responses from 2023 and 2024.
supply chain, disruption, aerospace, 2024, severity, tier-1, lead times, materials, labor, survey
false
Risk Assessment and Management
Environmental Services & Sustainability
Mixed Chart
Roland Berger
Add to my slides
Remove from favorites
The slide outlines the machinery and equipment value chain with detailed icons and text descriptions for each stage: raw material processing, manufacturing, and logistics. It includes several company logos representing various stakeholders.
Operational Efficiency
Industrial & Manufacturing
Explains the process and stages in the machinery and equipment value chain, emphasizing the efficiency and longevity of products. It mentions specific companies and their roles in the circular economy.
Supply Chain, Efficiency, Longevity, Machinery, Equipment
false
Operational Efficiency
Industrial & Manufacturing
Linear Flow
Accenture
Add to my slides
Remove from favorites
Features a marginal abatement cost curve graph with various transportation methods, and a detailed description of how digital platforms can optimize supply chain efficiency.
Market Analysis and Trends
Transportation & Logistics
Focuses on how supply chain optimization can significantly reduce emissions in the transportation sector, specifically through digital freight platforms that enhance efficiency and reduce empty backhauls, thus lowering both costs and emissions.
supply chain, emissions reduction, transportation, digital platforms
false
Market Analysis and Trends
Transportation & Logistics
Mixed Chart
Bain
Add to my slides
Remove from favorites
The slide includes a main title, several paragraphs of text, and a bar chart showing the principal reasons for implementing an SCF program. A pie chart illustrates the number of suppliers involved in the program. A three-color scheme of yellow, orange, and brown is used consistently throughout the slide.
Operational Efficiency
Financial Services
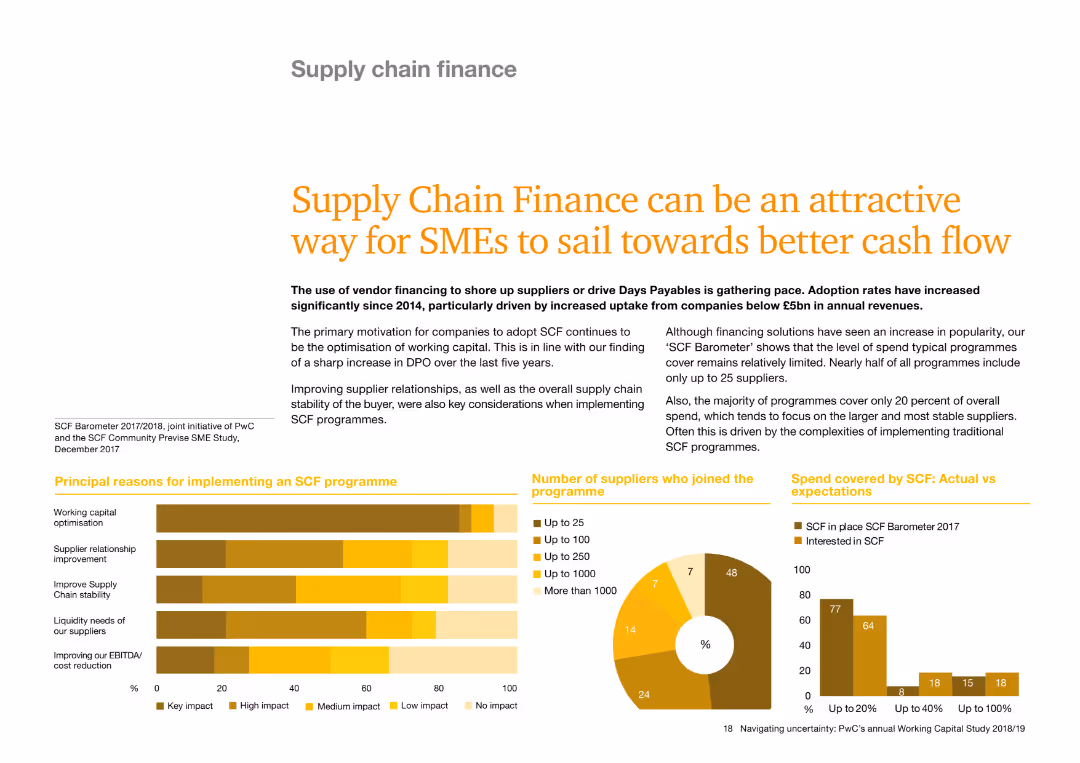
This slide discusses the benefits of supply chain finance (SCF) for SMEs, highlighting improved cash flow and supplier relationships. It also presents data on the number of suppliers participating in SCF programs and the impact on working capital. The bar and pie charts provide a clear visual representation of the data.
Supply chain finance, SMEs, cash flow, supplier relationships, SCF program, bar chart, pie chart
false
Operational Efficiency
Financial Services
Multiple Chart
PwC/Strategy&
Add to my slides
Remove from favorites
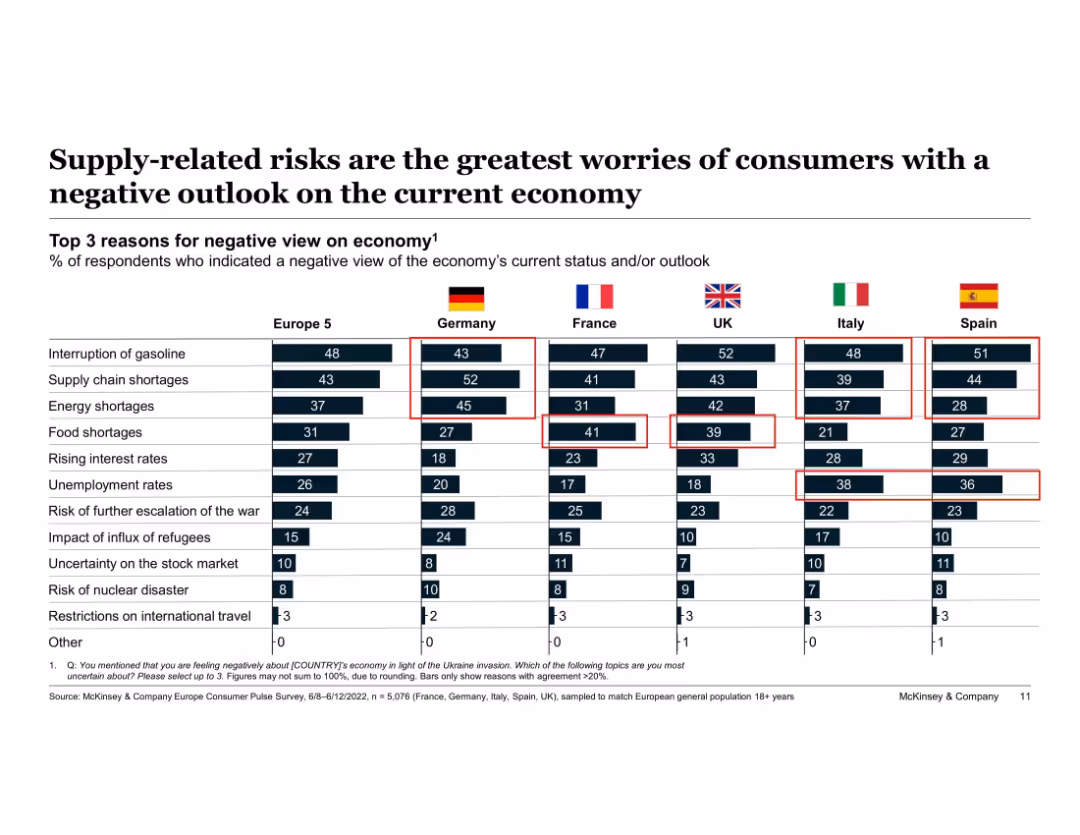
Matrix table of top reasons for economic pessimism across European countries. Red boxes highlight key concerns.
Risk Assessment and Management
Consumer Goods
The slide highlights key supply-side concerns driving negative economic outlooks among European consumers. Gasoline interruptions, supply chain issues, and food/energy shortages are prominent across countries, particularly in Germany, Spain, and the UK.
supply chain, food shortages, gasoline interruption, risk perception, economic pessimism, Europe, consumer anxiety
false
Risk Assessment and Management
Consumer Goods
Single Chart
McKinsey
Add to my slides
Remove from favorites
Previous
Next
You don't have any favorites yet.
Please wait loading your favorites slides...
Create a FREE account to continue browsing
Receive Instant Access to 1,000+ slides from companies like McKinsey, Google, and Goldman Sachs
First Name
Last Name
Email
Password
I agree to all
Terms & Privacy Policy
Thank you! Your submission has been received!
Oops! Something went wrong while submitting the form.
Have an account?
Sign in
Upgrade to PRO to Save slides
Advanced Search and Filters
Access to 15,000+ slides
Access to Category Pages
Save/Bookmark Slides
PowerPoint Template Library
Pick a Plan
MONTHLY
$12/month
Billed every month, Cancel anytime.
YEARLY
$9/year
Billed $108 annually, Cancel anytime.
Checkout for $12/month
Checkout for $108/yr
Secured by Stripe | AES-256 bit encryption


![To fix [Country], we need a strong leader willing to break the rules](https://cdn.prod.website-files.com/654e70fb59937215cac87b19/6899be2f75b0eec59aa53bda__f1yGTLQcvEobAXZiFDH0F8j5QImR-J20KLBLYJml0E.avif)