My Account
My Slides
Search by Category
Pricing
Templates
View All Templates
Download Template Slides
✦ AI Search
Feedback
Login
Logout
Get Started
Browse all Slides
Browse all Slides
Create a FREE Account
Instant access to 1,000+ real slides from top companies like McKinsey, BCG, Goldman Sachs, Google and many more!
First Name
Last Name
Email
Password
I agree to all
Terms & Privacy Policy
Thank you! Your submission has been received!
Oops! Something went wrong while submitting the form.
Have an account?
Sign in
Saved Slides
Total No. of slides saved
0
↻ Refresh
✖ Clear all
A list detailing NFT use cases across industries like Digital Art, Sports, Music, Real Estate, Gaming, and Finance. Each has icons and descriptions.
Industry Overview
Media & Entertainment
Outlines various NFT applications across multiple sectors, emphasizing the breadth of NFT adoption and its impact on different industries. Essential for industry overview presentations on NFTs.
NFTs, Use Cases, Digital Art, Sports, Music, Real Estate, Gaming, Finance
false
Industry Overview
Media & Entertainment
Table
McKinsey
Add to my slides
Remove from favorites
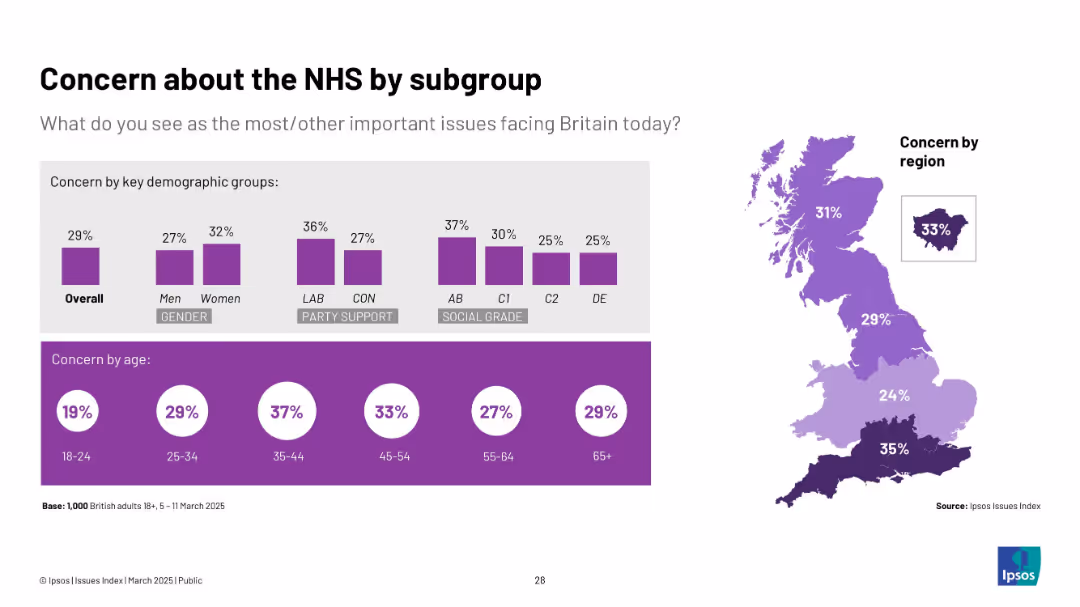
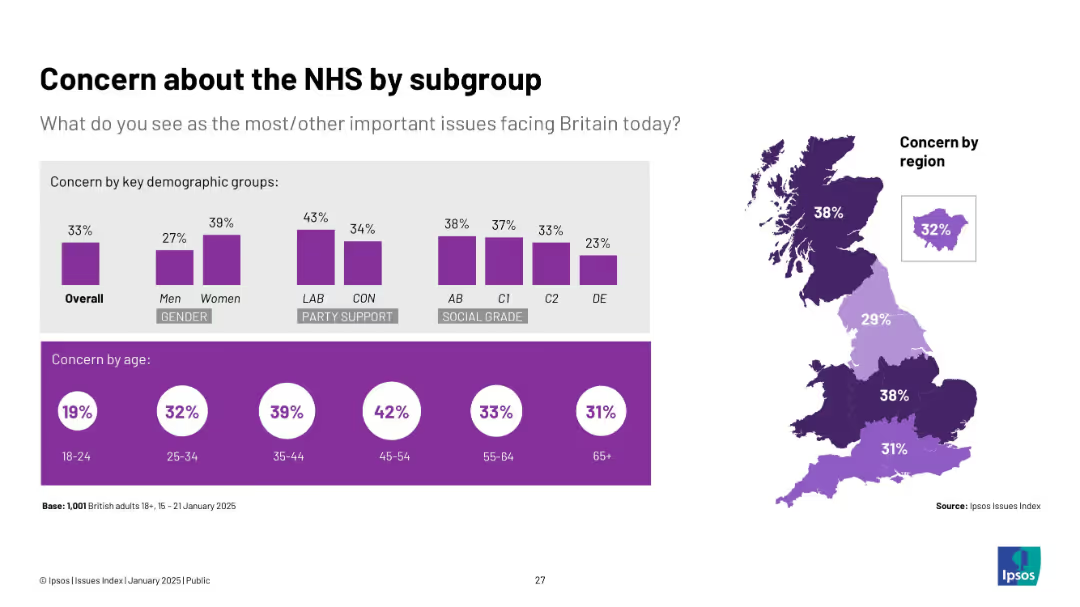
Purple-toned chart; similar demographic breakdown with map and bar visuals. Focuses on NHS concern levels by group.
Market Analysis and Trends
Healthcare & Pharmaceuticals
Explores NHS concern by age, gender, party, region, and social grade. Women, older adults, Labour supporters, and South England show higher concern. Least concern from young adults and DE social grade.
NHS, healthcare concern, regional views, Ipsos, demographics, UK healthcare
false
Market Analysis and Trends
Healthcare & Pharmaceuticals
Multiple Chart
IPSOS
Add to my slides
Remove from favorites
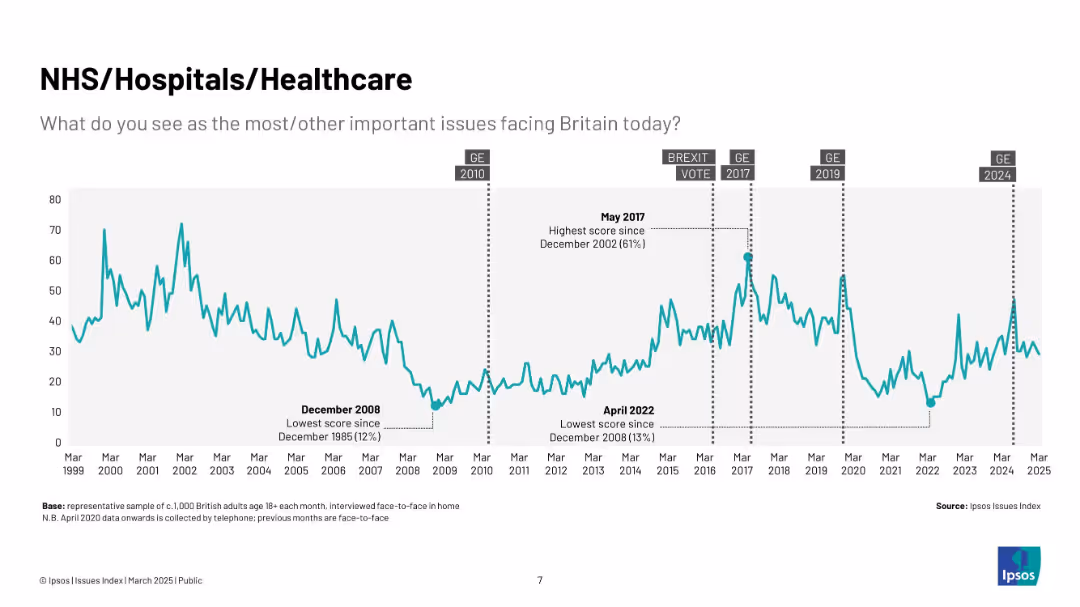
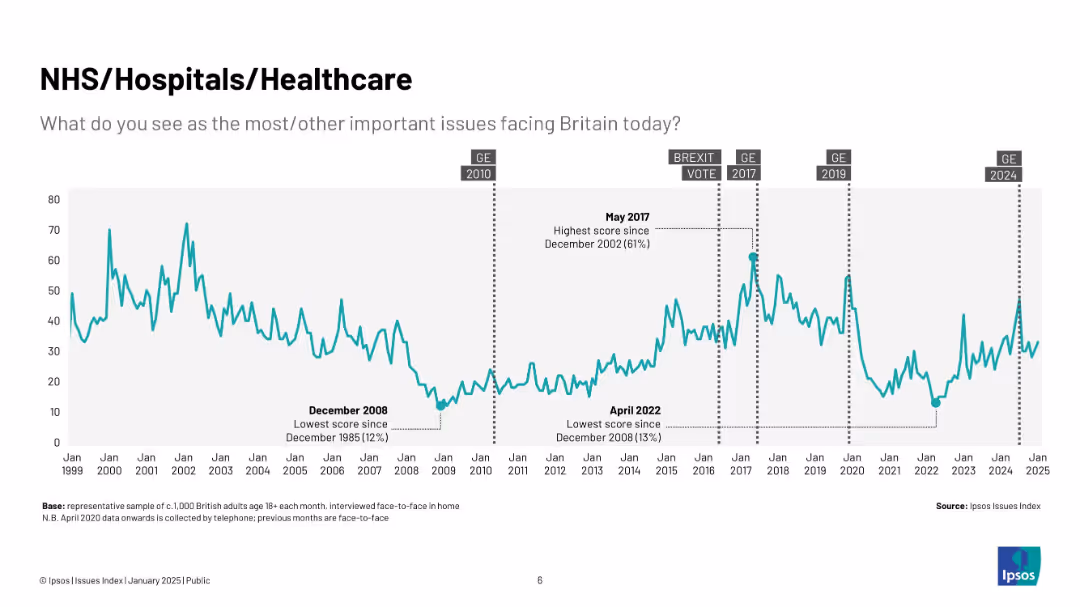
Teal line chart (1999–2025) showing public concern about NHS; includes peaks like 2017 and COVID era, with historic low in April 2022.
Market Analysis and Trends
Healthcare & Pharmaceuticals
Traces healthcare-related public concern trends, particularly focused on NHS performance and accessibility. Peaks are associated with systemic crises and political discourse.
NHS, healthcare, Ipsos, public concern, UK, pandemic, hospitals, medical
false
Market Analysis and Trends
Healthcare & Pharmaceuticals
Single Chart
IPSOS
Add to my slides
Remove from favorites
Timeline chart (1999–2025) of NHS concern levels; key points annotated; events like Brexit are noted
Market Analysis and Trends
Government & Public Sector
This slide shows fluctuations in public concern over healthcare from 1999 to 2025, highlighting peaks in 2017 and post-2020. Major political events are annotated for context.
NHS, healthcare, UK, concern, Ipsos, timeline, Brexit, trends, public health, chart
false
Market Analysis and Trends
Government & Public Sector
Single Chart
IPSOS
Add to my slides
Remove from favorites
Mixed visuals: bar charts by gender, party, social grade, age + regional heat map.
Market Analysis and Trends
Healthcare & Pharmaceuticals
The slide presents concern about the NHS across key demographic groups. Women, Labour supporters, and those aged 35–54 show the highest concern. Regional analysis reveals Northern and Central England express greater NHS worries.
NHS, healthcare, gender, age, regional concern, Ipsos
false
Market Analysis and Trends
Healthcare & Pharmaceuticals
Multiple Chart
IPSOS
Add to my slides
Remove from favorites
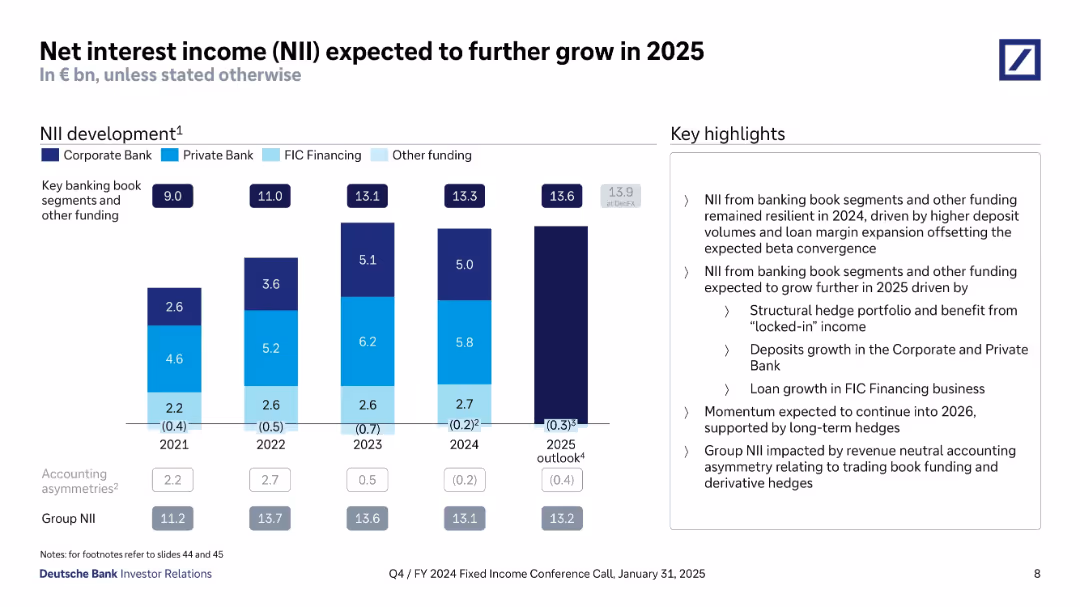
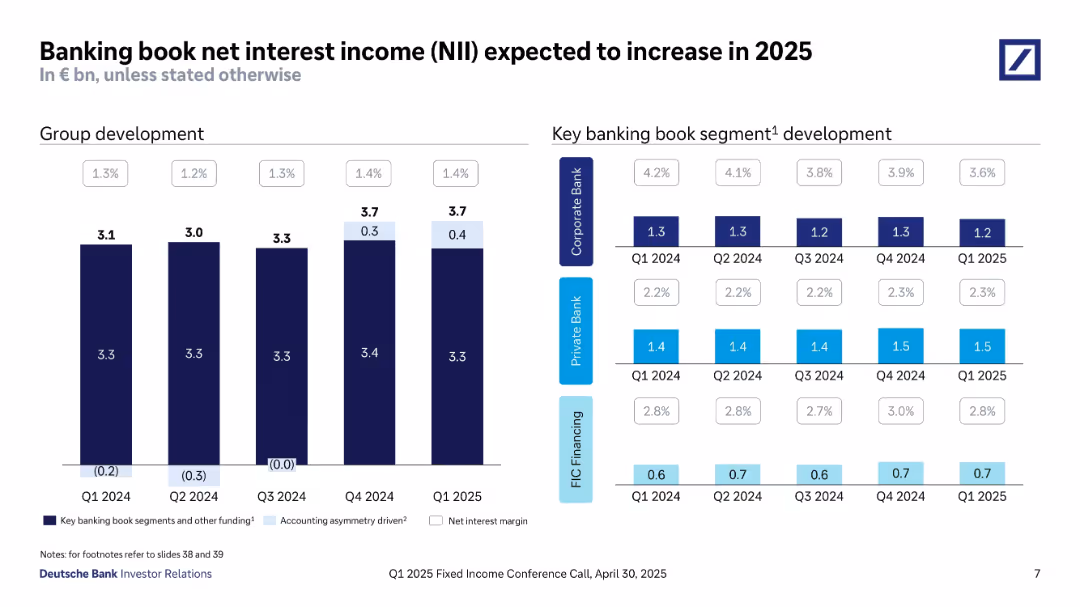
Left side shows multi-year bar chart of NII development by segment; right side lists highlights driving growth expectations.
Strategic Planning
Financial Services
The slide forecasts continued NII growth into 2025 due to drivers like structural hedge portfolios, deposit and loan growth, and long-term hedges. Historical and projected NII are visualized, while key growth factors are detailed in bullet form.
NII growth, 2025 outlook, deposits, hedges, loan growth, Deutsche Bank
false
Strategic Planning
Financial Services
Mixed Chart
Deutsche Bank
Add to my slides
Remove from favorites
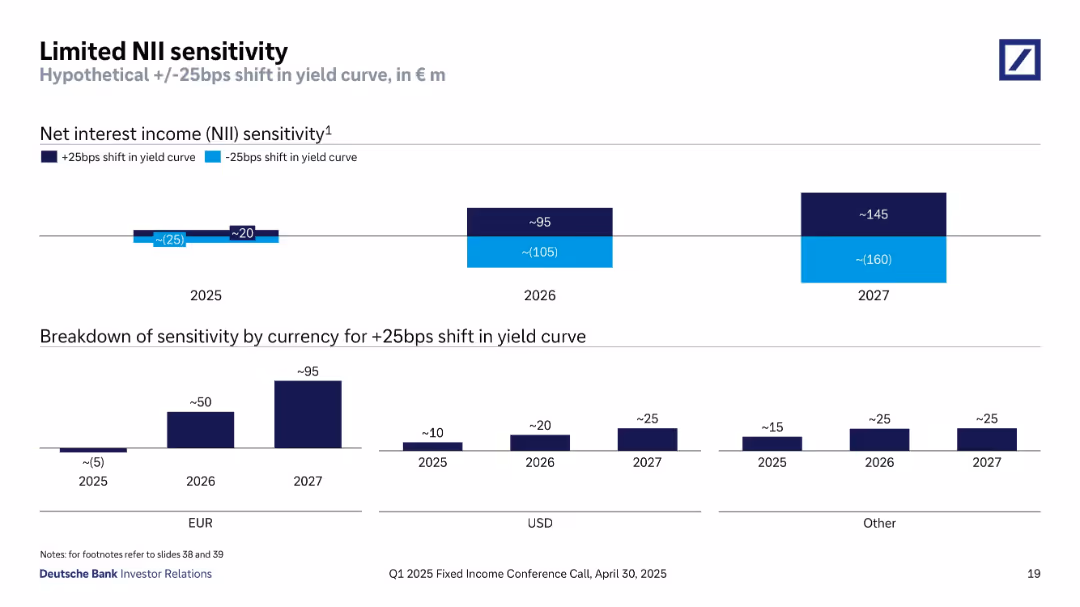
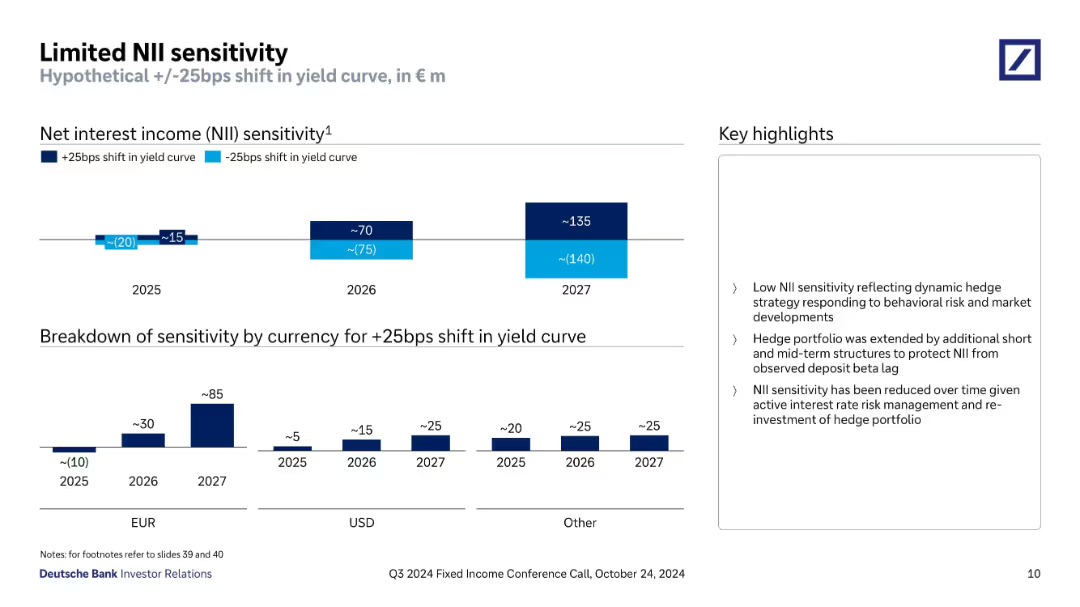
Two bar charts showing projected NII changes under +/-25bps yield curve shifts (total and by currency). Bars are segmented by year (2025–2027) and by EUR, USD, and other currencies. Consistent color coding for rate directions.
Risk Assessment and Management
Financial Services
This slide analyzes Deutsche Bank’s limited net interest income (NII) sensitivity to a 25bps shift in interest rates. NII impacts range from minor (€20–25m) in 2025 to larger swings (€145m gain / €160m loss) by 2027. Sensitivity is broken down by currency, with the EUR segment showing the most variation. It demonstrates well-managed interest rate risk and minimal NII volatility for near-term years.
NII sensitivity, interest rate risk, EUR, USD, yield curve shift, risk management, financial stability
false
Risk Assessment and Management
Financial Services
Multiple Chart
Deutsche Bank
Add to my slides
Remove from favorites
Horizontal bar and column charts show projected NII impact by year and currency with +/-25bps yield curve shifts.
Risk Assessment and Management
Financial Services
Analyzes how a 25bps change in yield curves would affect NII from 2025 to 2027. Also includes breakdown by currency (EUR, USD, Other). Highlights highest sensitivity in 2027 and provides insight into interest rate risk.
NII sensitivity, interest rates, yield curve, EUR, USD, risk management, projections
false
Risk Assessment and Management
Financial Services
Multiple Chart
Deutsche Bank
Add to my slides
Remove from favorites
Dual-chart layout: one showing NII sensitivity to ±25bps shift in yield curves, the other breaking down by currency. Text highlights strategic measures to reduce sensitivity.
Risk Assessment and Management
Financial Services
Illustrates the bank’s limited sensitivity to yield curve shifts due to dynamic hedge strategies. Outlines currency-level exposure and notes structural hedge re-investments that have reduced potential volatility in net interest income.
NII sensitivity, interest rates, yield curve, hedge strategy, EUR/USD exposure, 2025–2027, beta lag
false
Risk Assessment and Management
Financial Services
Multiple Chart
Deutsche Bank
Add to my slides
Remove from favorites
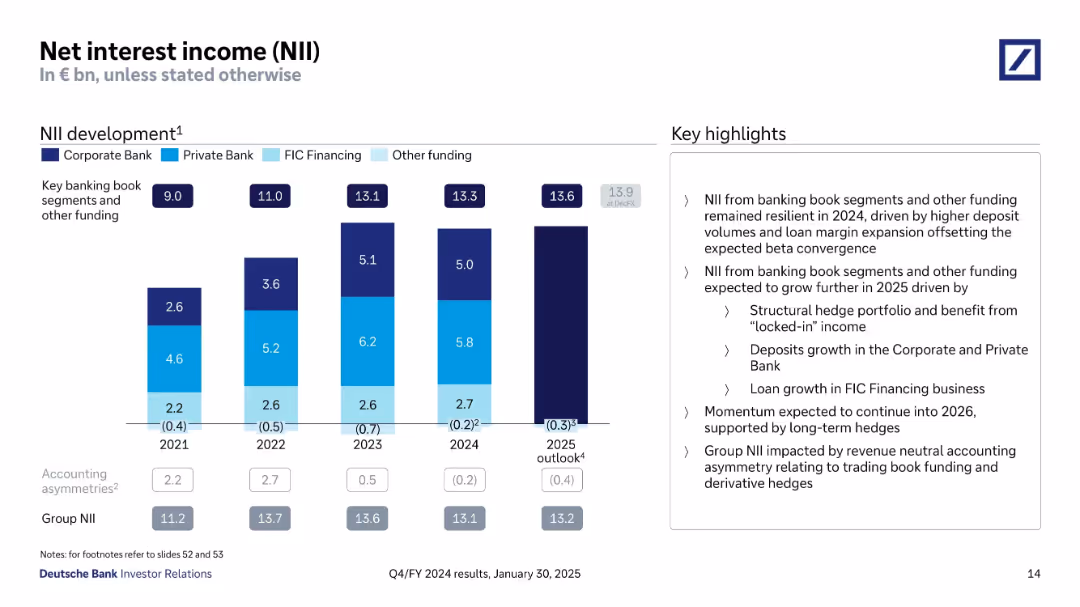
Bar chart showing annual NII trends from 2021 to 2025 outlook. Key segments are color-coded. Includes right-hand bullet highlights of drivers and projections.
Market Analysis and Trends
Financial Services
Tracks Deutsche Bank’s NII from 2021 to 2024, with 2025 outlook. Shows growth across business segments with emphasis on deposit volumes, loan growth, and income stabilization. Describes momentum drivers and structural hedge impacts.
NII trends, interest income, deposits, loans, hedging, segment revenue
false
Market Analysis and Trends
Financial Services
Mixed Chart
Deutsche Bank
Add to my slides
Remove from favorites
Features a column chart depicting net interest income and margins across different business sectors for FY23, providing insights into trends and projections for future financial guidance excluding certain business segments.
Financial Performance
Financial Services
Provides a detailed analysis of net interest income for FY23, highlighting performance across different business sectors, with a focus on year-over-year growth and the strategic implications for future financial planning.
NII, FY23, financial analysis, business sectors, financial planning
false
Financial Performance
Financial Services
Mixed Chart
Barclays
Add to my slides
Remove from favorites
This slide contains a series of column charts representing the Net Interest Income (NII) excluding markets with projections and impacts of various factors. A sidebar lists assumptions and sources of uncertainty related to the financial outlook. The color scheme differentiates current outlook from medium-term impacts.
Financial Performance
Financial Services
The slide provides a financial outlook on Net Interest Income (NII), excluding market influences, and accounts for the impact of the First Republic and other variables. The assumptions and uncertainties section aids in understanding the factors that may affect the bank's financial projections, offering a strategic view of the bank's future earning potential for investors and stakeholders.
NII, Financial Outlook, Projections, First Republic, Market Exclusion, Assumptions, Uncertainties, Financial Planning, Banking
false
Financial Performance
Financial Services
Mixed Chart
JP Morgan
Add to my slides
Remove from favorites
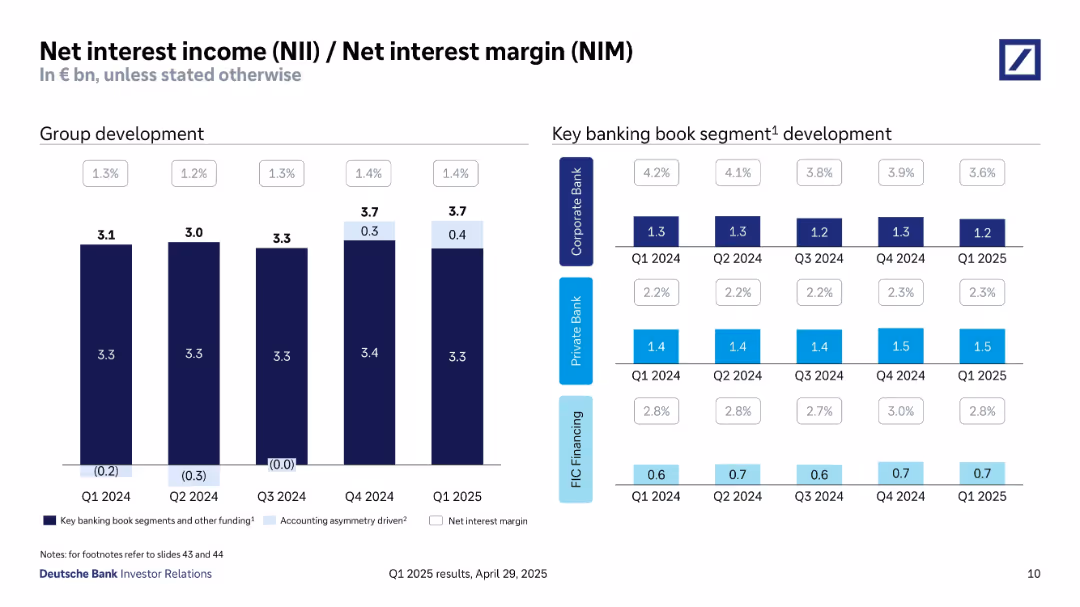
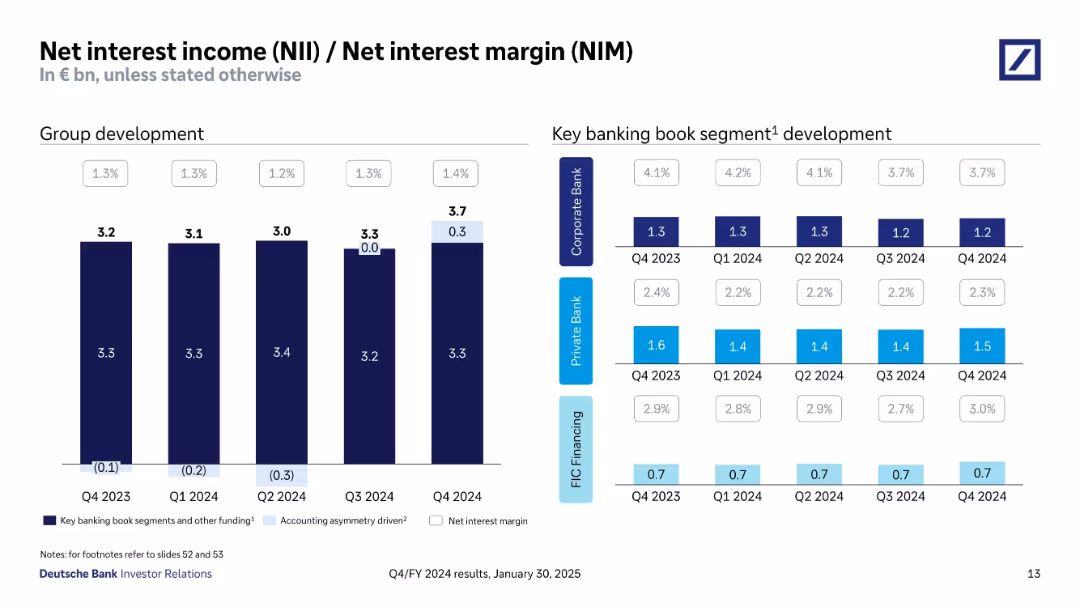
Left: vertical bar charts for group NII development; Right: grid chart for key segment performance over time.
Financial Performance
Financial Services
The slide forecasts increased NII in 2025, rising to €3.7bn. It breaks down performance by business segments including Corporate Bank, Private Bank, and FIC Financing. Highlights stable margins and strong contributions from Private Bank and FIC.
NII, Interest Income, Private Bank, Corporate Bank, FIC Financing, Forecast, Segment Analysis, 2025
false
Financial Performance
Financial Services
Multiple Chart
Deutsche Bank
Add to my slides
Remove from favorites
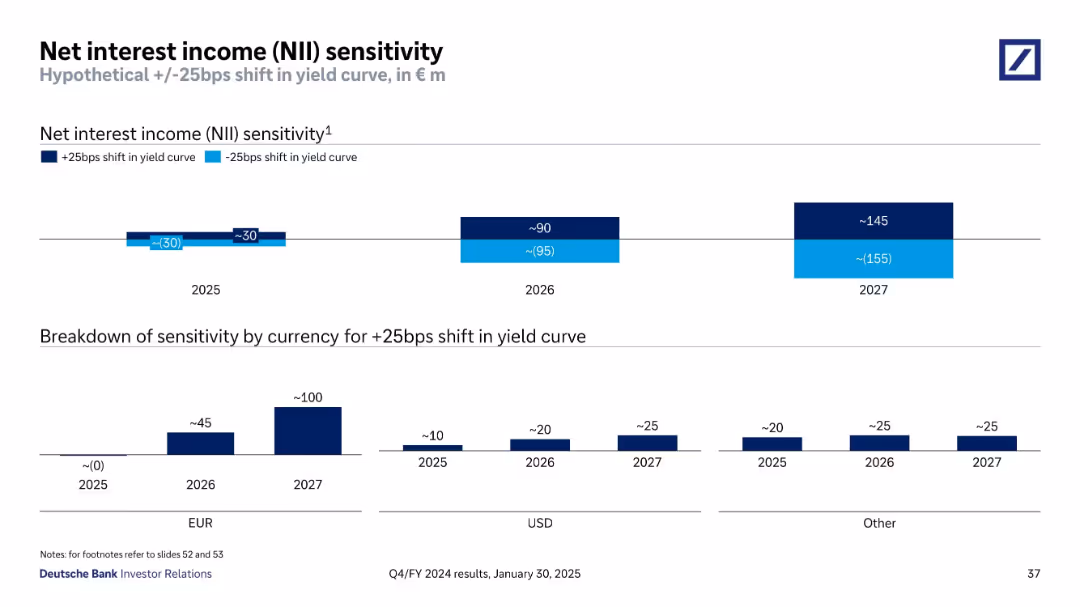
Bar chart projections showing sensitivity to +/-25bps shift in yield curve over 2025–2027
Risk Assessment and Management
Financial Services
Displays Deutsche Bank’s estimated NII sensitivity to yield curve shifts through 2027. The breakdown indicates impact by year and by currency, showing increasing NII benefit in future years under a rising rate scenario.
NII, Interest Rates, Yield Curve, Sensitivity, EUR, USD, Forecast
false
Risk Assessment and Management
Financial Services
Multiple Chart
Deutsche Bank
Add to my slides
Remove from favorites
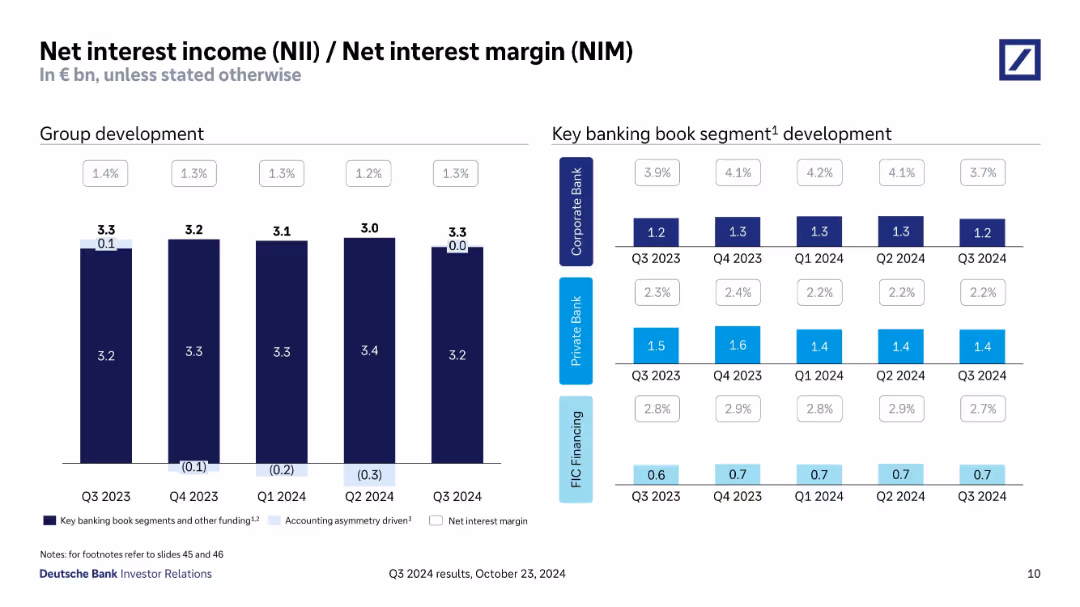
This slide features a column chart showing group net interest income (£bn) and net interest margin percentages from Q319 to Q323. On the right, it lists the contributions to group NII and NIM by different business units.
Financial Performance
Financial Services
The slide highlights Barclays' group net interest income of £3.2bn and a net interest margin of 3.98% for Q323, along with contributions from different business units such as Barclays UK, CC&P, and CIB.
NII, NIM, Q323, net interest, income
false
Financial Performance
Financial Services
Mixed Chart
Barclays
Add to my slides
Remove from favorites
Bar charts comparing NII across quarters and margin metrics for business segments; grouped by banking units
Financial Performance
Financial Services
Shows Deutsche Bank's NII and NIM trends across four quarters, with detailed breakdowns across banking segments like Corporate Bank, Private Bank, and FIC Financing, reflecting stable NIM despite varied NII.
NII, NIM, banking segments, Q1 2025, revenue streams, Deutsche Bank
false
Financial Performance
Financial Services
Multiple Chart
Deutsche Bank
Add to my slides
Remove from favorites
Left: stacked bar chart of NII and margin; Right: segmented bar chart by business units.
Performance Metrics and KPIs
Financial Services
Shows quarterly evolution of net interest income and margin across key banking segments. NIM remained stable overall despite minor fluctuations across segments. The charts reflect income drivers and margin trends within divisions.
NII, NIM, interest income, banking segments, margin trends
false
Performance Metrics and KPIs
Financial Services
Multiple Chart
Deutsche Bank
Add to my slides
Remove from favorites
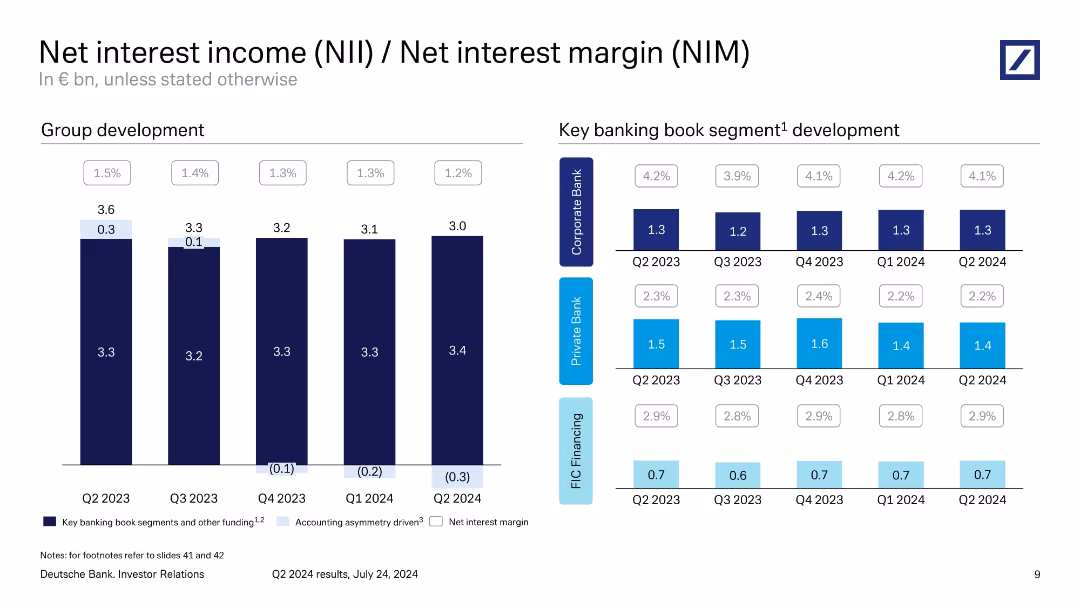
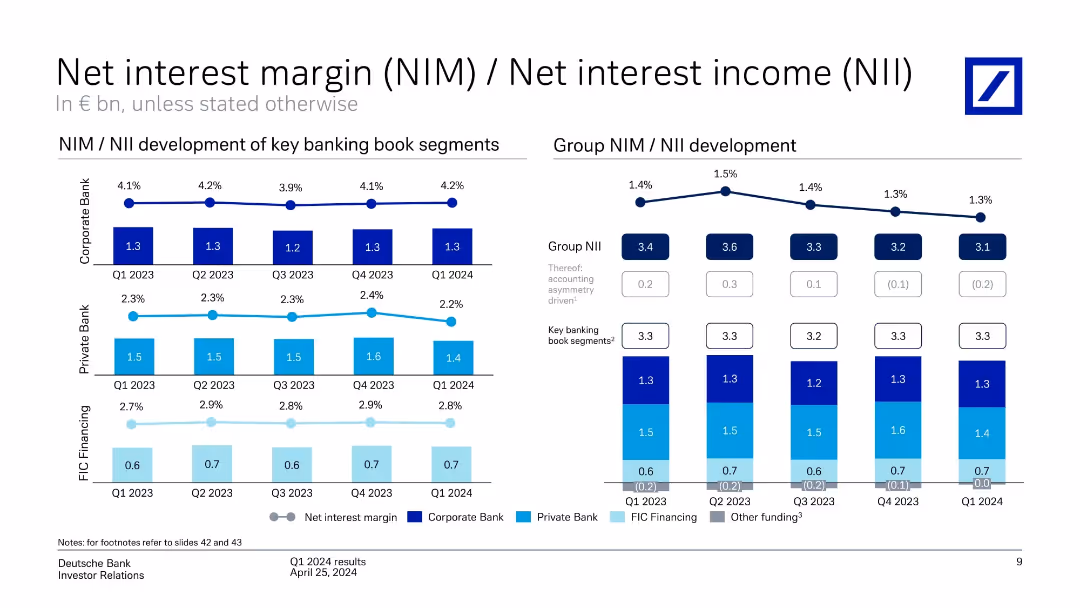
Left bar chart for group NII, right grid for NII by bank segment with margin overlays.
Financial Performance
Financial Services
Tracks quarterly development in net interest income and margin across the group and major banking segments. Shows gradual decline in NIM from Q2 2023 to Q2 2024 and provides insight into accounting asymmetry effects and segment-specific interest income contributions.
NII, NIM, interest margin, banking segments, Q2 2024, Deutsche Bank
false
Financial Performance
Financial Services
Multiple Chart
Deutsche Bank
Add to my slides
Remove from favorites
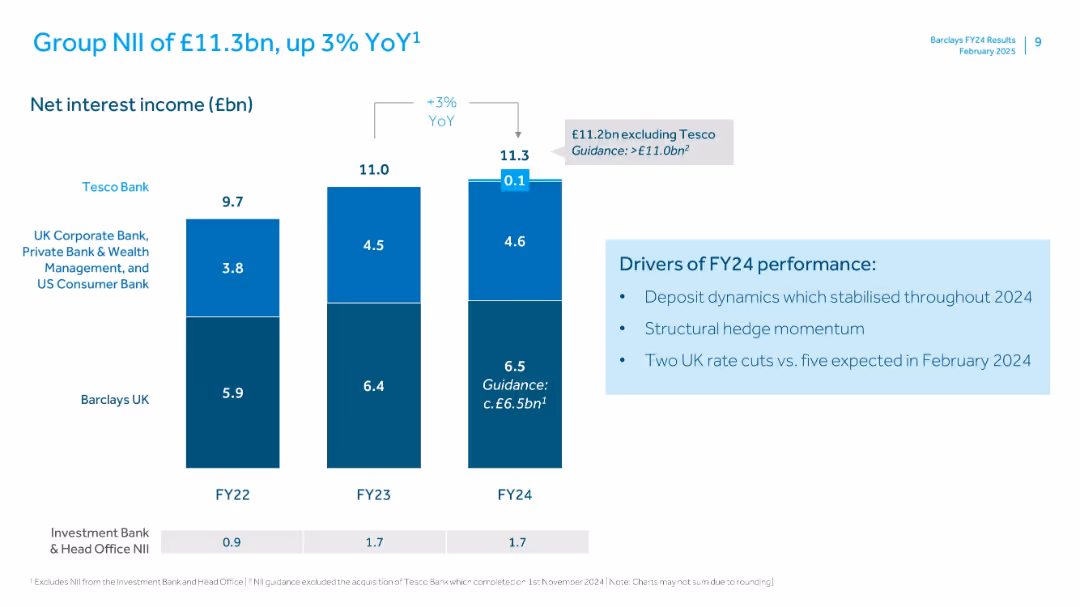
Vertical stacked bars for net interest income (NII) across segments. Right-hand text box with performance drivers.
Financial Performance
Financial Services
Reports a 3% YoY rise in Barclays’ net interest income (NII), reaching £11.3bn in FY24. The slide outlines segment-level contributions and factors like deposit dynamics, hedge momentum, and interest rate cuts.
NII, Net Interest, FY24, Barclays, Tesco Bank, Deposit, Hedge, Rates, Income
false
Financial Performance
Financial Services
Mixed Chart
Barclays
Add to my slides
Remove from favorites
Column charts and tables showing NII contributions and impacts over time. Uses green, blue, and grey colors for data segmentation.
Financial Performance
Financial Services
This slide details the expected NII contributions from Non-Core and swaps, providing medium-term outlook and potential impacts on net interest margin (NIM).
NII, Non-Core, swaps, contributions, NIM
false
Financial Performance
Financial Services
Mixed Chart
Barclays
Add to my slides
Remove from favorites
Slide with complex column charts depicting Group NII development over several years, alongside key highlights on the right.
Financial Performance
Financial Services
Discusses predictions and strategies for stable net interest income in banking, highlighting impacts from hedge portfolios and deposit volumes.
NII, banking, hedge, deposit, revenue, forecasting, financial stability
false
Financial Performance
Financial Services
Mixed Chart
Deutsche Bank
Add to my slides
Remove from favorites
A stylistic column chart with projected quarterly growth, using contrasting colors and a clear timeline, also includes bullet points on rate outlook and loan growth.
Financial Performance
Financial Services
Forecasts the net interest income growth for a financial institution, detailing contributing factors and expectations for the upcoming quarters.
NII, financial forecast, interest income, growth, quarterly, finance, loan growth, projections
false
Financial Performance
Financial Services
Single Chart
JP Morgan
Add to my slides
Remove from favorites
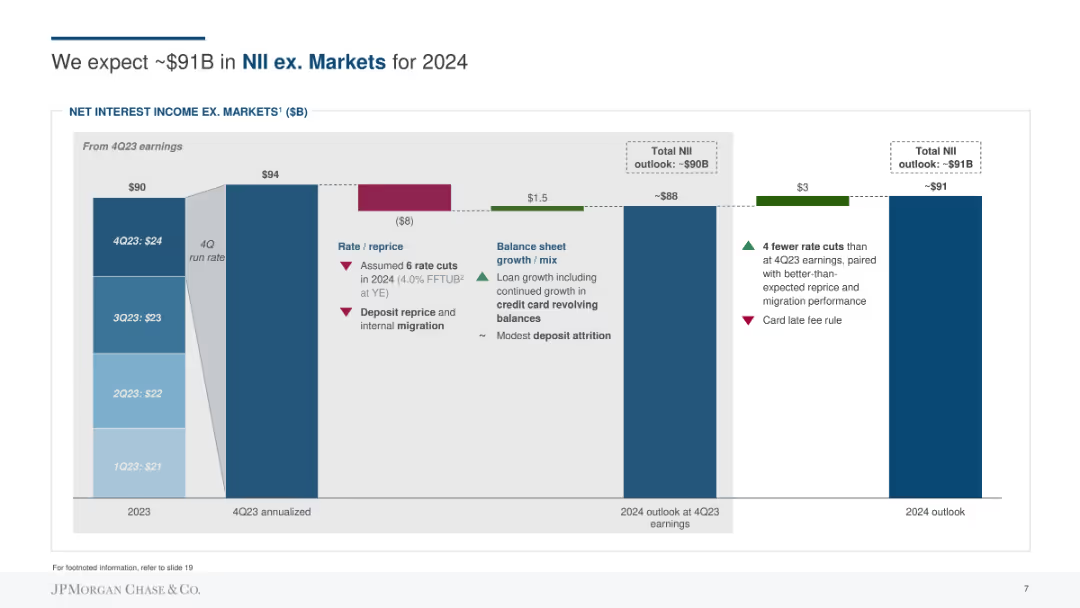
Column chart showing net interest income (NII) outlook, with factors affecting rate, repricing, balance sheet growth, and deposit migration.
Financial Performance
Financial Services
Forecasts the net interest income excluding markets for 2024, detailing rate and repricing assumptions, balance sheet growth, and migration impacts.
NII, forecasting, net interest income, rate, repricing, balance sheet growth, deposits
false
Financial Performance
Financial Services
Single Chart
JP Morgan
Add to my slides
Remove from favorites
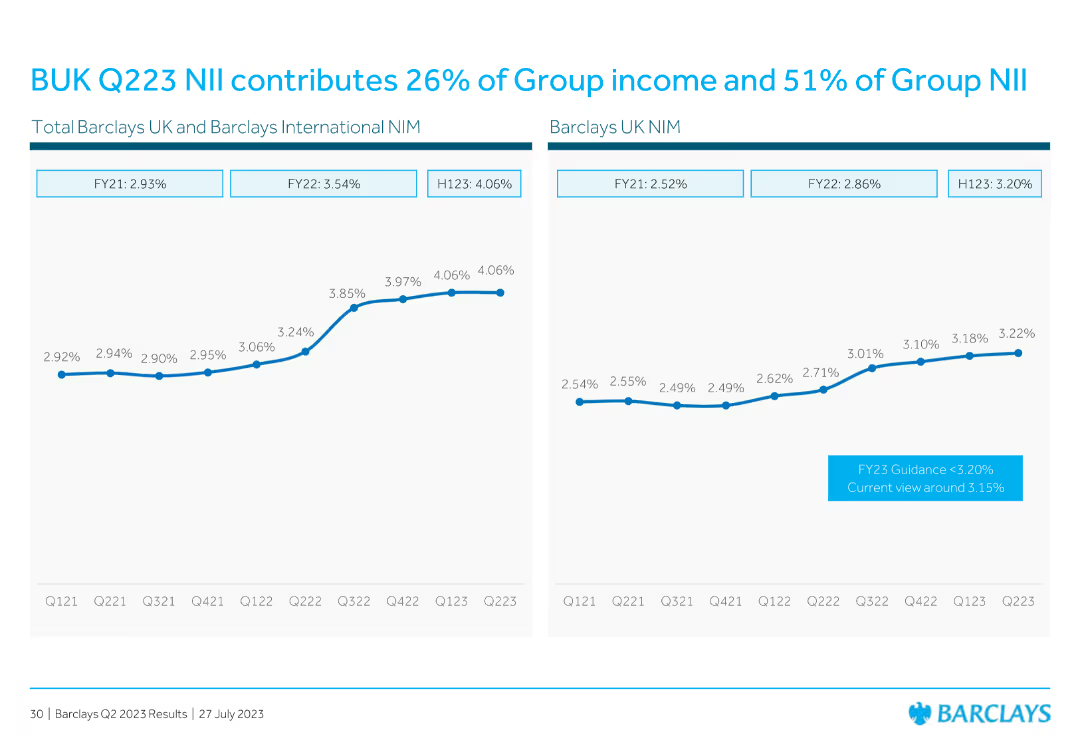
Features line charts comparing net interest margin (NIM) across different periods for Barclays UK and Barclays International.
Financial Performance
Financial Services
Describes the contribution of BUK Q223 net interest income (NII) to the group's overall income and NII, with historical comparisons.
NII, income, group, contribution, NIM
false
Financial Performance
Financial Services
Multiple Chart
Barclays
Add to my slides
Remove from favorites
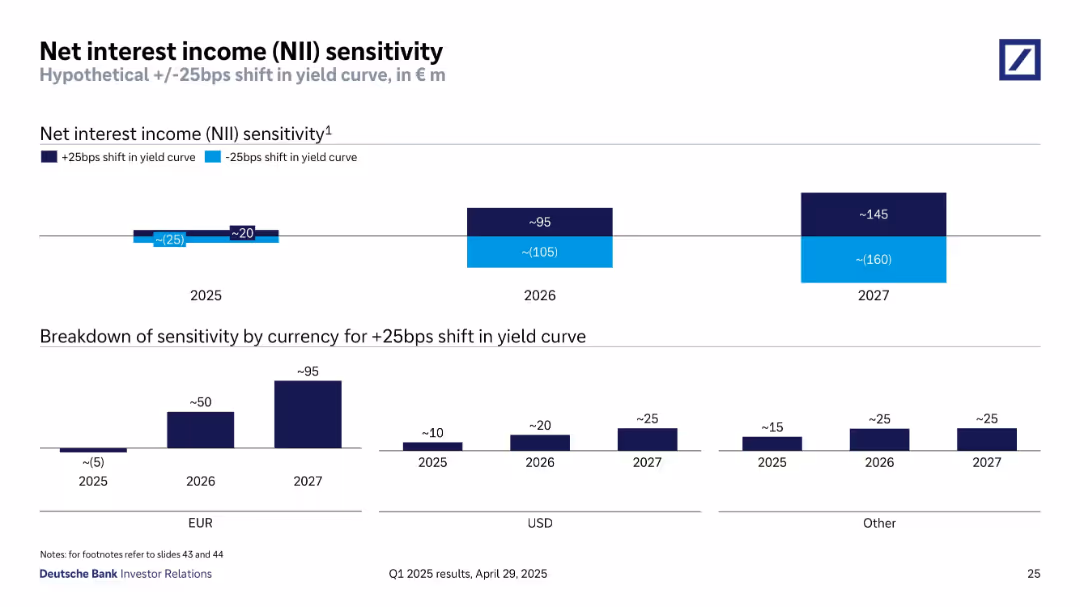
Bar chart displays net interest income (NII) sensitivity to +/-25bps yield curve shifts, broken down by year and currency. The layout uses a clean, dark-light blue contrast to show direction of sensitivity.
Risk Assessment and Management
Financial Services
This slide analyzes the bank’s net interest income sensitivity under hypothetical interest rate shifts of +/-25bps across years 2025–2027. It shows limited exposure in 2025 and gradually increasing sensitivity in later years. Sensitivity is broken down further by EUR, USD, and other currencies, illustrating manageable rate risk.
NII, interest rate sensitivity, yield curve, risk, 2025–2027, EUR, USD, Deutsche Bank, interest income
false
Risk Assessment and Management
Financial Services
Multiple Chart
Deutsche Bank
Add to my slides
Remove from favorites
Contains column charts detailing financial data.
Financial Performance
Financial Services
Analyzes net interest income over several years.
NII, interest, income, financial
false
Financial Performance
Financial Services
Mixed Chart
Deutsche Bank
Add to my slides
Remove from favorites
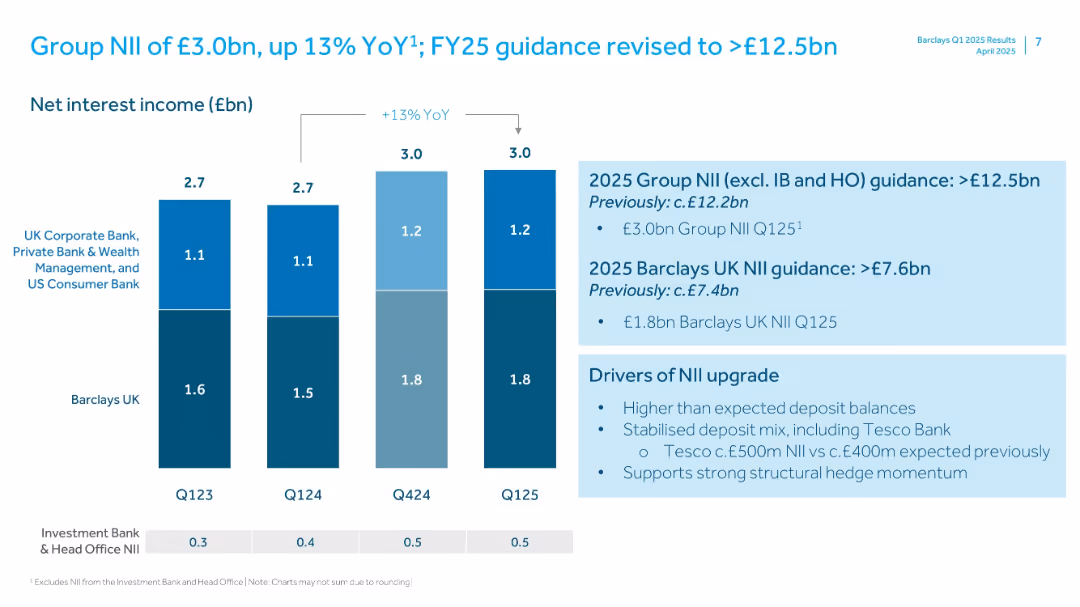
Stacked bar chart showing Net Interest Income by segment with projections.
Strategic Planning
Financial Services
Barclays outlines net interest income (NII) trends across business segments and upgrades FY25 guidance. The slide includes key drivers for the upward revision, including Tesco Bank’s contribution.
NII, net interest income, Barclays, UK bank, financial guidance, deposits, income projections, growth drivers
false
Strategic Planning
Financial Services
Mixed Chart
Barclays
Add to my slides
Remove from favorites
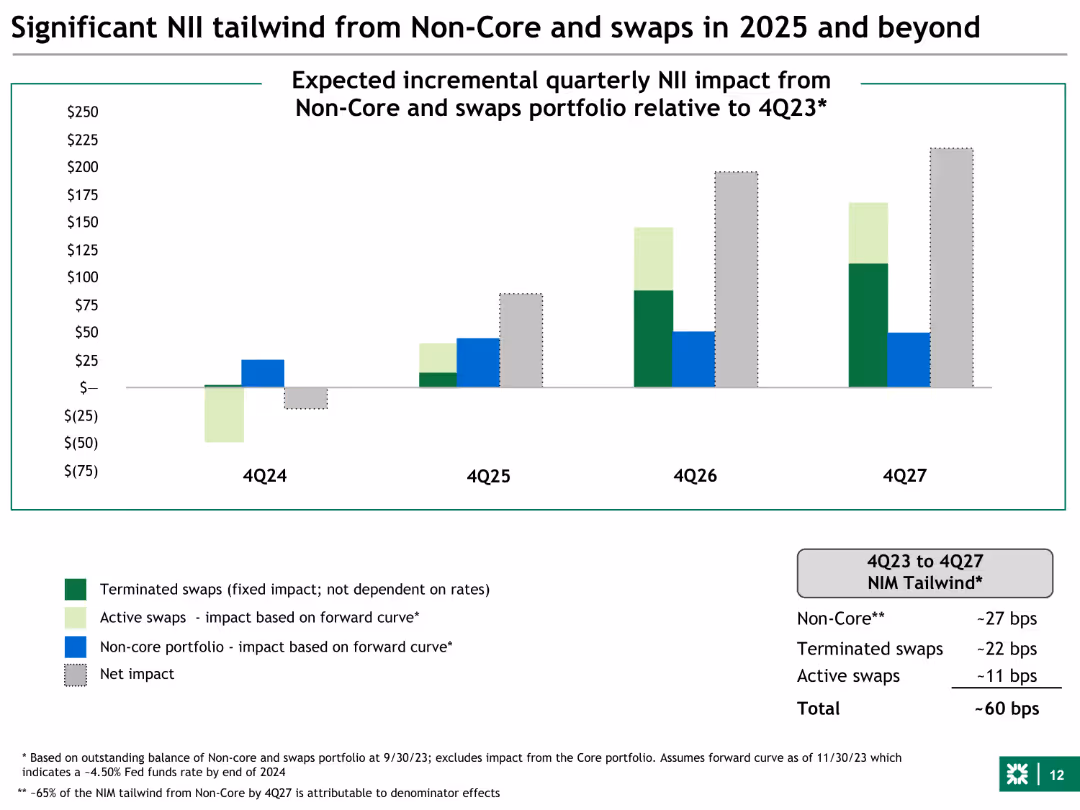
The slide features a column chart with four sets of bars representing expected quarterly NII impacts from non-core and swaps portfolios relative to 4Q23, spanning from 4Q24 to 4Q27. The bars are color-coded for terminated swaps, active swaps, non-core portfolio, and net impact.
Financial Performance
Financial Services
This slide shows the projected quarterly NII (Net Interest Income) impact from non-core and swaps portfolios for the years 2025 to 2027. It is used to illustrate the financial benefits of maintaining these portfolios, highlighting the substantial positive effects on the overall financial performance.
NII, non-core, swaps, financial performance, projections, 2025, 2026, 2027, portfolio, impact
false
Financial Performance
Financial Services
Mixed Chart
Goldman Sachs
Add to my slides
Remove from favorites
Features sensitivity analysis with column charts depicting hypothetical shifts in yield curve impacts on NII.
Risk Assessment and Management
Financial Services
Analyzes financial sensitivity to interest rate fluctuations, highlighting potential impacts on net interest income.
NII, sensitivity, interest rates, finance, risk management, forecasting
false
Risk Assessment and Management
Financial Services
Multiple Chart
Deutsche Bank
Add to my slides
Remove from favorites
This slide features multiple column charts displaying NII sensitivity to hypothetical +/- 25bps shifts in yield curve for years 2024, 2025, and 2026. Each chart is presented with two columns for potential increases or decreases in Euros, alongside breakdowns by currency (EUR and USD) showing the estimated impacts per year.
Risk Assessment and Management
Financial Services
The slide analyzes the sensitivity of net interest income to shifts in the yield curve, broken down by year and currency. It provides financial projections and potential impacts, helping in risk assessment and financial planning. Used to guide strategic financial decisions and risk management in banking.
NII, yield curve, risk management, financial planning, currency impact, EUR, USD, 2024-2026, projections
false
Risk Assessment and Management
Financial Services
Multiple Chart
Deutsche Bank
Add to my slides
Remove from favorites
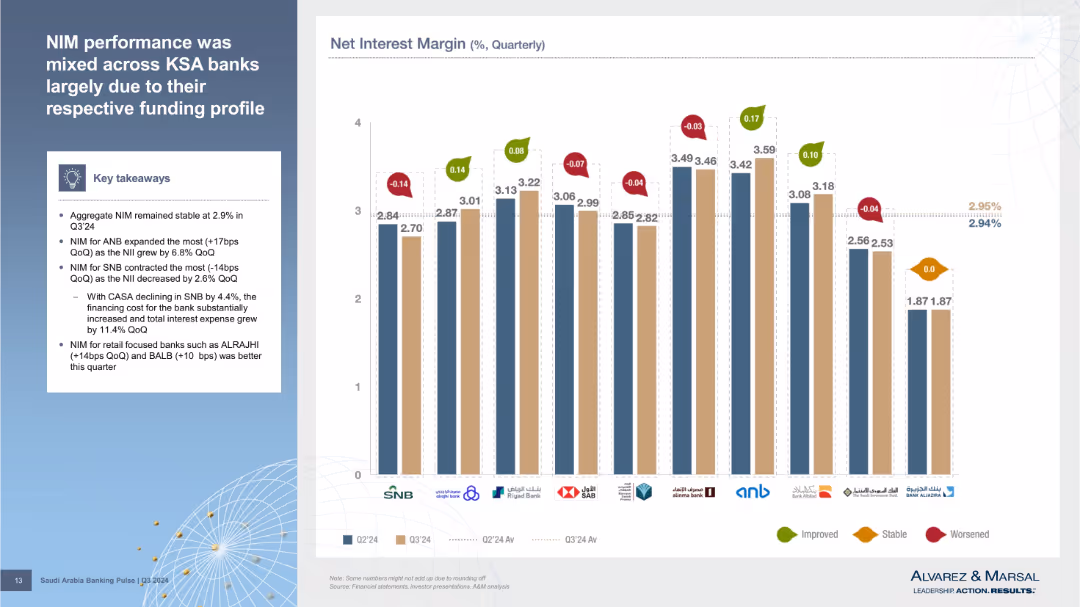
Left has textual insights; right features bar graph comparing Net Interest Margin by bank, with change indicators (colored arrows).
Performance Metrics and KPIs
Financial Services
Examines variation in NIM among individual banks for Q3’24, attributing changes to funding profiles and CASA movement. Highlights SNB and ANB as outliers in performance.
NIM, CASA, net interest margin, bank performance, funding cost, Q3’24, KSA banks, margin analysis
false
Performance Metrics and KPIs
Financial Services
Mixed Chart
Alvarez & Marsal
Add to my slides
Remove from favorites
Dual-panel layout: bar chart of group NII/NIM on the left and segmented banking performance table on the right. Uses consistent blue tones for segment differentiation.
Performance Metrics and KPIs
Financial Services
Displays the quarterly development of net interest income and margin for FY 2024. Breaks down performance by corporate, private, and FIC financing segments. Indicates margin stability and segment-specific performance over time.
NIM, NII, banking income, segment margin, FY2024, interest earnings
false
Performance Metrics and KPIs
Financial Services
Multiple Chart
Deutsche Bank
Add to my slides
Remove from favorites
Multiple mini-bar charts tracking NIM and NII over five quarters for Corporate, Private Bank, and Group levels. Color-coded segments with annotations.
Financial Performance
Financial Services
Tracks trends in net interest margin and income across key divisions. Group NII remains stable while margin slightly declines. Illustrates income components and effects of funding costs across banking units.
NIM, NII, interest income, banking segments, margin trends
false
Financial Performance
Financial Services
Multiple Chart
Deutsche Bank
Add to my slides
Remove from favorites
This slide features multiple line charts tracking the net interest margin development for Corporate and Private Banks. It includes column charts showing group NIM development. There's a side panel with key highlights in bullet points.
Financial Performance
Financial Services
The slide illustrates the development of net interest margins within a financial institution, comparing corporate and private banking sectors over several quarters.
NIM, banking, financial analysis, interest rates, quarterly performance
false
Financial Performance
Financial Services
Multiple Chart
Deutsche Bank
Add to my slides
Remove from favorites
Contains line and column charts showing the Net Interest Margin (NIM) development for Corporate and Private Banks. Includes data points over multiple quarters.
Financial Performance
Financial Services
Details trends in Net Interest Margin for Deutsche Bank's Corporate and Private Banking sectors, analyzing shifts in financial management strategies and market conditions.
NIM, banking, interest rates, financial analysis, trends
false
Financial Performance
Financial Services
Multiple Chart
Deutsche Bank
Add to my slides
Remove from favorites
Slide displays two line charts for Divisional NIM development and a column chart for Group NIM development. Key highlights in text.
Financial Performance
Financial Services
This slide presents the quarterly development of net interest margins for different banking divisions, detailing factors influencing these metrics, such as asset growth and policy changes.
NIM, banking, quarterly, asset growth, metrics, interest, development, corporate, private
false
Financial Performance
Financial Services
Multiple Chart
Deutsche Bank
Add to my slides
Remove from favorites
Detailed line graphs show NIM trends across divisions, complemented by column chart that represent average interest earning assets. The design is clean, with blue and gray colors providing distinct visual segments.
Financial Performance
Financial Services
Analyzes NIM performance in Deutsche Bank's corporate and private banking sectors, showing past and current trends, and how they compare to the overall group NIM. Useful for financial analysis and strategic decision-making.
NIM, interest margins, financial analysis, banking sectors
false
Financial Performance
Financial Services
Multiple Chart
Deutsche Bank
Add to my slides
Remove from favorites
This slide uses line charts to show the Net Interest Margin (NIM) development for different banking sectors over time, presented in a clean and organized manner.
Financial Performance
Financial Services
Discusses the impact of interest rates on Net Interest Margin in different banking sectors, providing insights into financial trends and earnings. This slide is valuable for financial presentations focusing on interest rate impacts and profitability.
NIM, interest rates, banking, finance, profitability
false
Financial Performance
Financial Services
Multiple Chart
Deutsche Bank
Add to my slides
Remove from favorites
Contains line graphs and column charts detailing the net interest margin (NIM) for different bank divisions and the group overall, alongside key financial highlights.
Performance Metrics and KPIs
Financial Services
Analyzes the net interest margin trends within the bank, highlighting changes due to market conditions and bank strategies, crucial for assessing profitability.
NIM, trends, profitability, bank strategy
false
Performance Metrics and KPIs
Financial Services
Multiple Chart
Deutsche Bank
Add to my slides
Remove from favorites
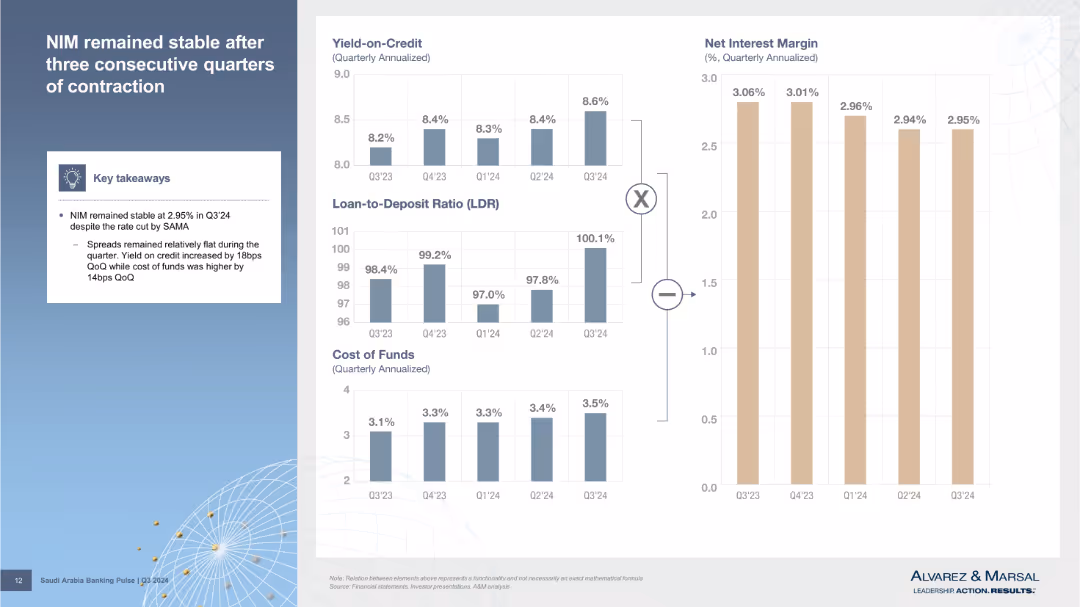
Left column features key takeaways; right contains small stacked bar charts for yield on credit, LDR, CoF, and NIM trends. Clean, modular layout.
Performance Metrics and KPIs
Financial Services
Discusses Net Interest Margin (NIM) stability in Q3’24. Shows relationships between yield on credit, loan-to-deposit ratio, and cost of funds using visual breakdowns.
NIM, yield, cost of funds, LDR, interest margin, Q3’24, SAMA, bank metrics, credit spreads
false
Performance Metrics and KPIs
Financial Services
Multiple Chart
Alvarez & Marsal
Add to my slides
Remove from favorites
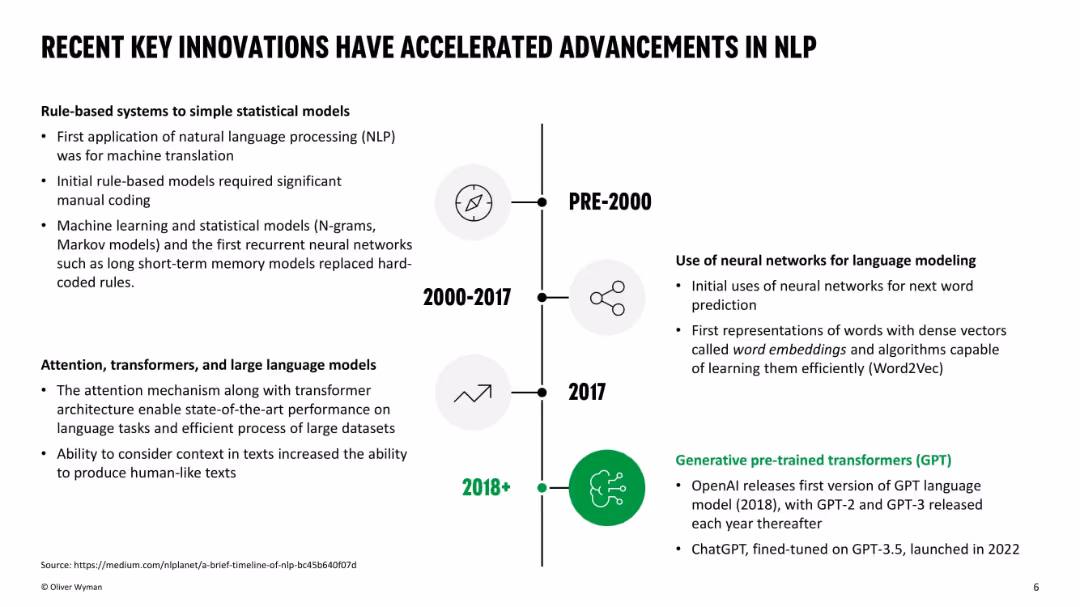
Vertical timeline with milestones and brief summaries from pre-2000 to post-2018, including GPT advancements. Icons and sectioned visual design with bold headings.
Technology and Digital Transformation
Artificial Intelligence
A historical overview of natural language processing (NLP) innovation, progressing from rule-based models to modern large language models like GPT. Highlights key technological transitions: statistical models, neural networks, and transformers, ending with generative pre-trained models starting in 2018.
NLP, GPT, timeline, AI, language models, transformers, embeddings, Word2Vec, innovation
false
Technology and Digital Transformation
Artificial Intelligence
Header Vertical
Oliver Wyman
Add to my slides
Remove from favorites
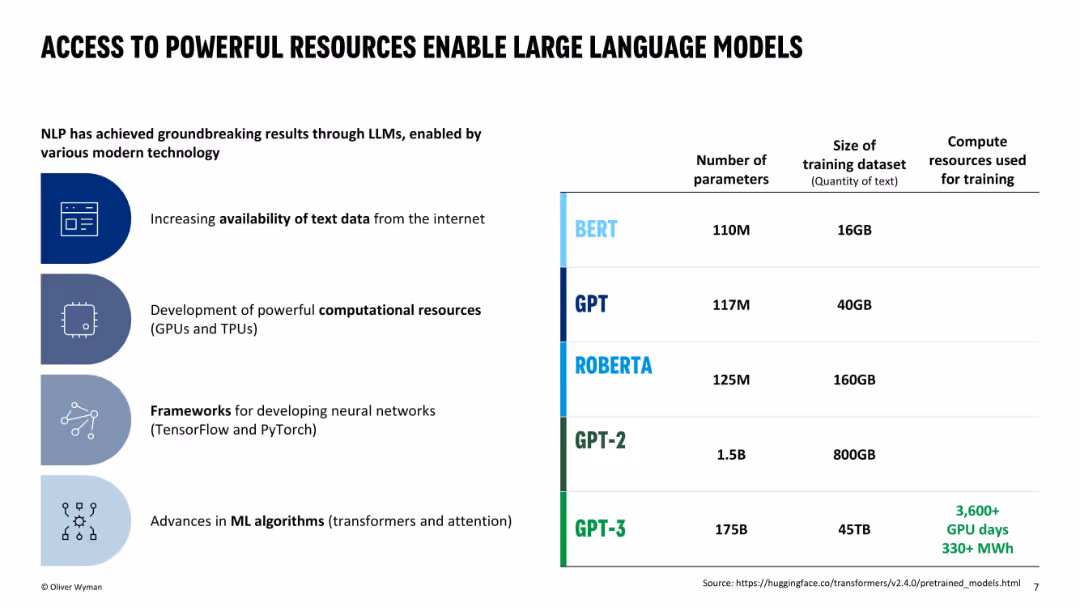
Split design: infographic list on the left and comparison table on the right detailing NLP models (BERT, GPT-3, etc.) by size, training data, and compute power.
Technology and Digital Transformation
Artificial Intelligence
This slide details the technological enablers behind modern NLP success, including data availability, compute power, and frameworks. It compares different language models like BERT, RoBERTa, GPT-2, and GPT-3 in terms of parameters, datasets, and compute needs, emphasizing GPT-3's scale and power.
NLP, GPT-3, compute power, data availability, language models, parameters, training size, transformers
false
Technology and Digital Transformation
Artificial Intelligence
Table
Oliver Wyman
Add to my slides
Remove from favorites
Two-column layout with textual content on the left and a table comparing FY20 and FY21 guidance on the right. Shades of gray and blue are used for text and table elements respectively.
Financial Performance
Financial Services
Details fiscal updates, affirms segment profit guidance, and indicates an increase in NPAT guidance. It's a deep dive into financial adjustments, explaining changes in projections with a focus on integration and transition costs.
NPAT, Segment Profit, Guidance, ETR, ROIC
false
Financial Performance
Financial Services
Mixed Chart
Goldman Sachs
Add to my slides
Remove from favorites
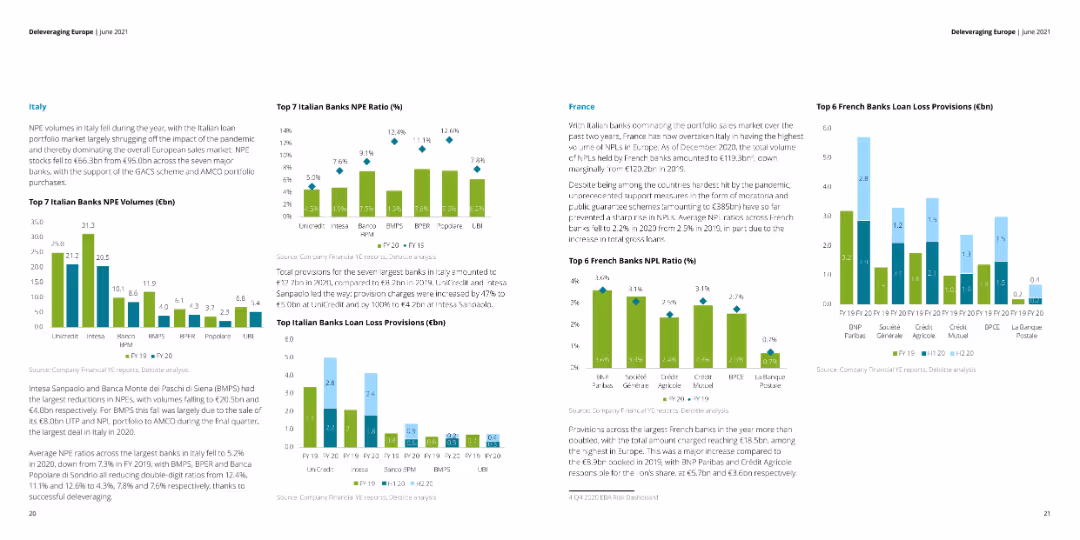
The slide features multiple column charts showing NPE volumes, NPE ratios, and loan loss provisions for top banks in Italy and France. Text sections provide detailed explanations of the charts.
Financial Performance
Financial Services
This slide analyzes the NPE volumes, NPE ratios, and loan loss provisions for the top banks in Italy and France. It discusses the impact of the pandemic and government support schemes on the financial metrics.
NPE volumes, NPE ratios, loan loss, Italy, France
false
Financial Performance
Financial Services
Multiple Chart
Deloitte
Add to my slides
Remove from favorites
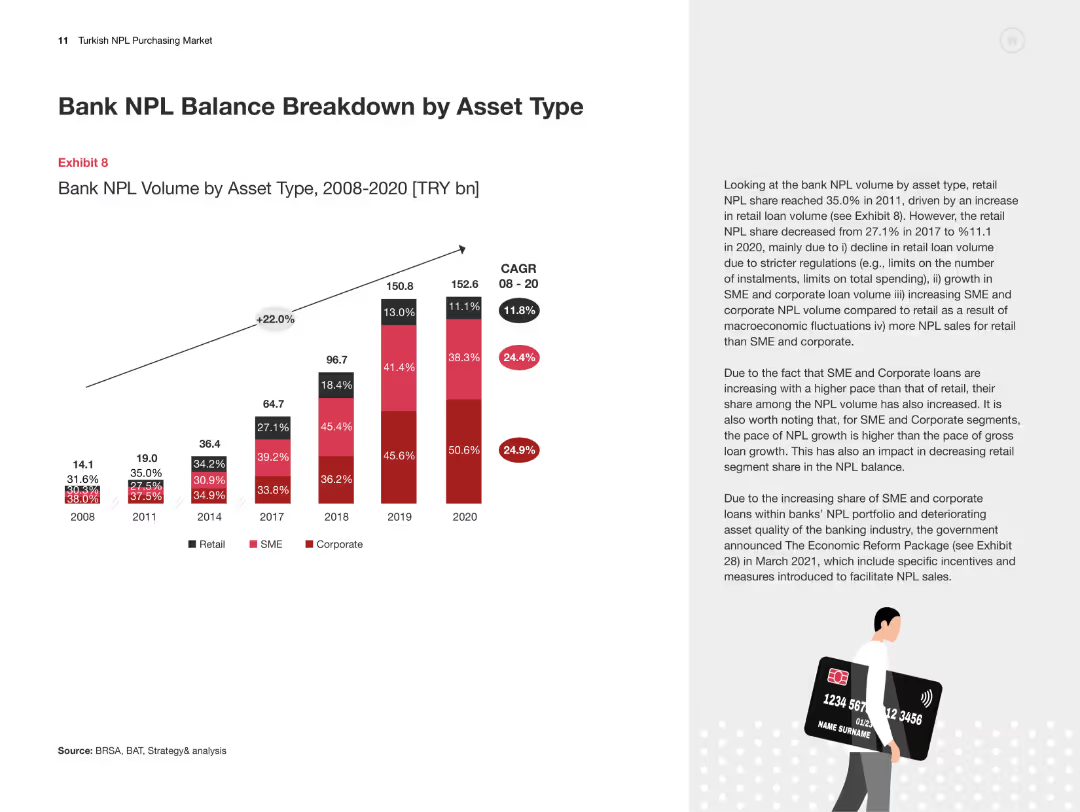
The slide includes a column chart showing the NPL volume by asset type from 2008 to 2020, with detailed text explaining the trends and contributing factors.
Risk Assessment and Management
Financial Services
This slide examines the breakdown of non-performing loan balances by asset type in Turkish banks, highlighting the significant trends and influencing factors over time.
NPL Balance, Asset Type, Turkey, Non-Performing Loans, Risk Factors
false
Risk Assessment and Management
Financial Services
Mixed Chart
PwC/Strategy&
Add to my slides
Remove from favorites
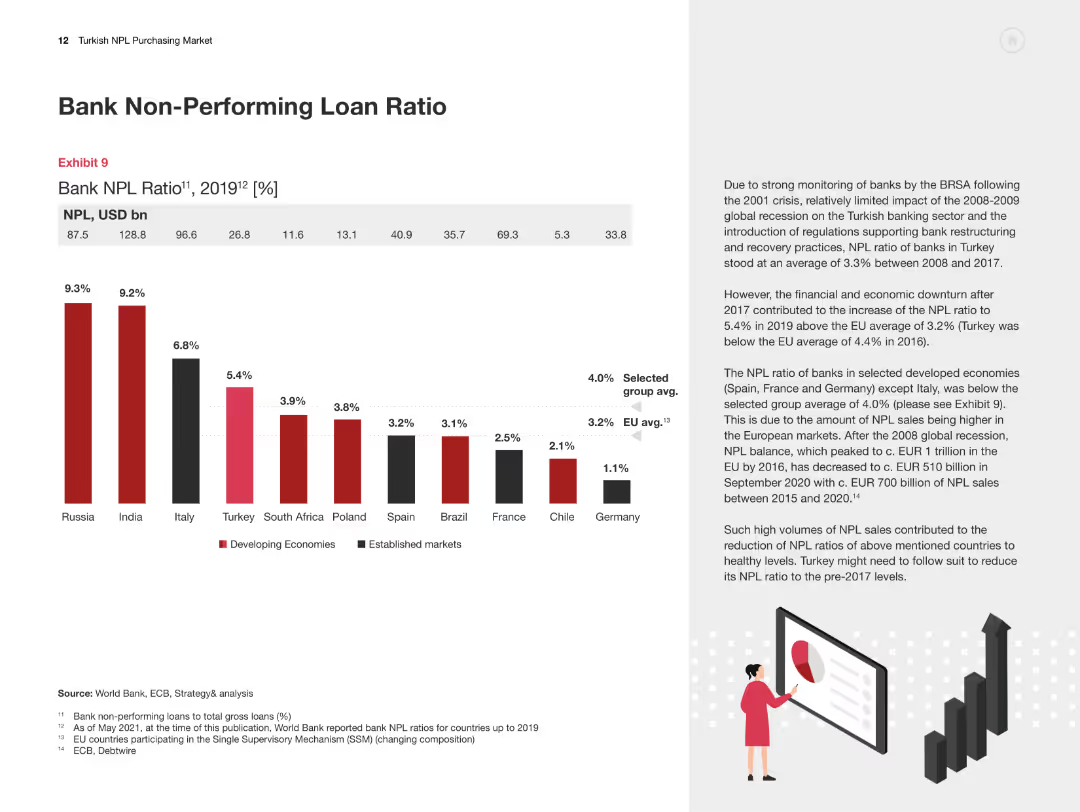
The slide features a column chart comparing the bank NPL ratios across various countries for 2019, with explanatory text on the significance and implications of these ratios.
Risk Assessment and Management
Financial Services
This slide presents a comparative analysis of bank non-performing loan ratios across different countries, emphasizing the significance and implications for the Turkish market.
NPL Ratio, Comparative Analysis, Turkey, International Comparison, Risk Assessment
false
Risk Assessment and Management
Financial Services
Mixed Chart
PwC/Strategy&
Add to my slides
Remove from favorites
This slide displays comparative column charts of NPL ratios and cost of risk, alongside a map visualization to geographically contextualize the data.
Risk Assessment and Management
Financial Services
It assesses the bank's non-performing loan (NPL) ratio and risk costs across regions, demonstrating a cautious risk profile. Ideal for comparing financial stability across markets.
NPL Ratio, Risk Profile, Geographical Analysis, Financial Stability, Cost of Risk, Comparative Data
false
Risk Assessment and Management
Financial Services
Multiple Chart
Morgan Stanley
Add to my slides
Remove from favorites
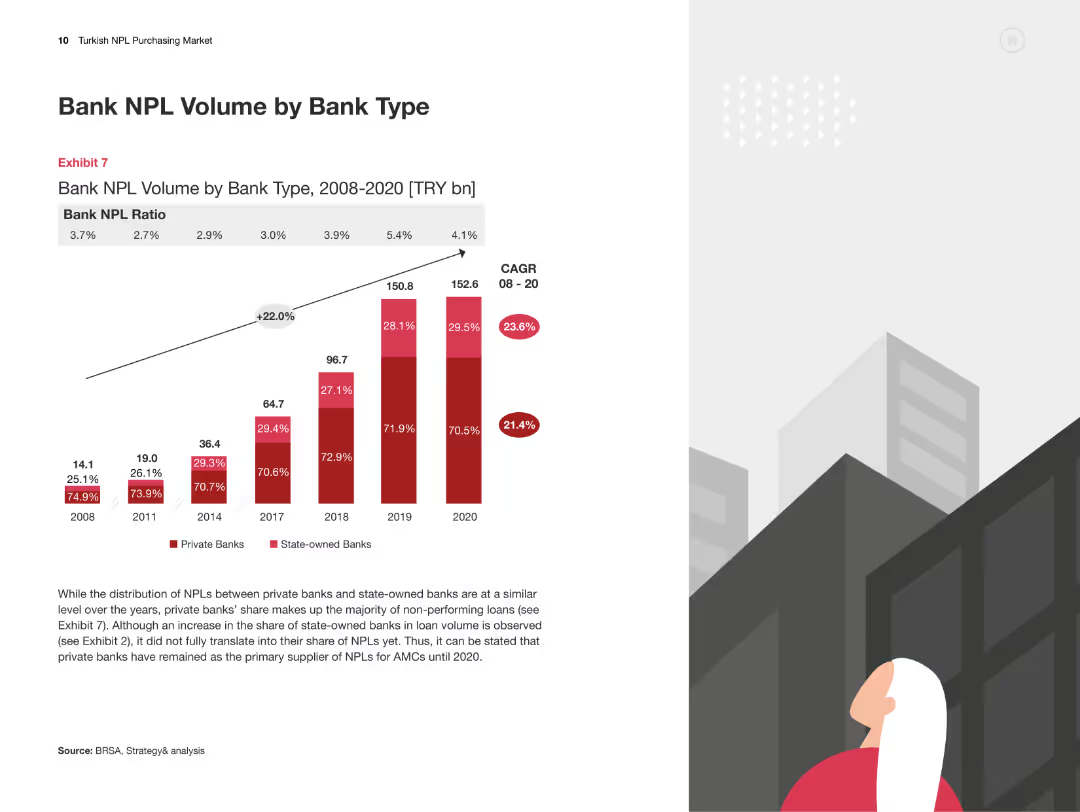
The slide features a column chart detailing the NPL volume by bank type from 2008 to 2020, with explanatory text on the trends and differences between private and state banks.
Risk Assessment and Management
Financial Services
This slide provides an analysis of the non-performing loan volumes in Turkish banks, comparing the trends between private and state-owned banks over a period of time.
NPL Volume, Bank Type, Turkey, Private Banks, State-owned Banks
false
Risk Assessment and Management
Financial Services
Mixed Chart
PwC/Strategy&
Add to my slides
Remove from favorites
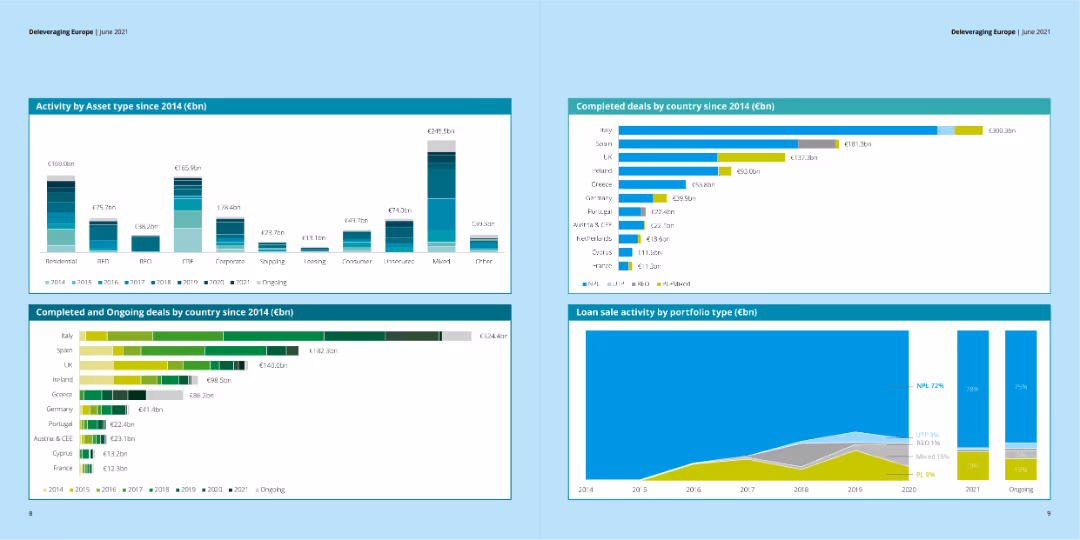
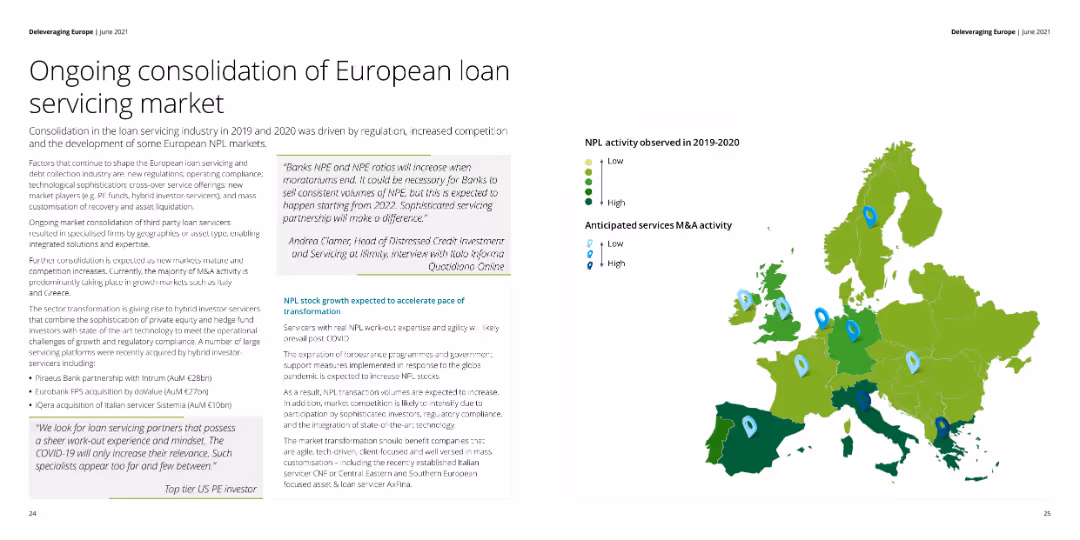
The slide includes a map showing NPL activity across Europe with varying intensities. Text blocks provide insights into market consolidation, regulatory impacts, and quotes from industry experts.
Market Analysis and Trends
Financial Services
This slide discusses the consolidation of the European loan servicing market, driven by regulatory changes and market conditions. It includes a map showing NPL activity levels and anticipates M&A activity.
NPL activity, market consolidation, Europe, M&A
false
Market Analysis and Trends
Financial Services
Graphic
Deloitte
Add to my slides
Remove from favorites
Column chart forecasting net NPL inflow volume from 2010-2023, with different macroeconomic scenarios.
Market Analysis and Trends
Financial Services
The slide predicts net NPL inflow volumes in Turkey from 2010-2023, examining various growth scenarios and their impacts.
NPL inflow, growth forecast, economic analysis, financial trends, Turkey
false
Market Analysis and Trends
Financial Services
Mixed Chart
PwC/Strategy&
Add to my slides
Remove from favorites
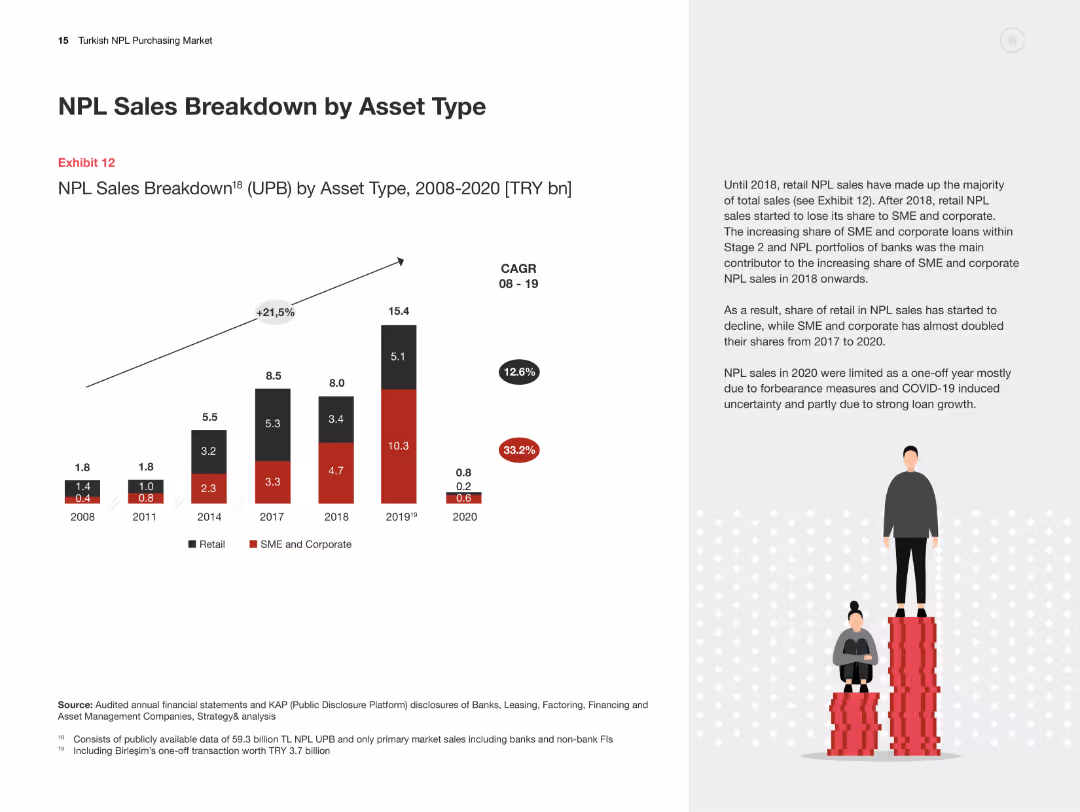
Column chart illustrating NPL sales breakdown by asset type from 2008-2020. Text discusses the shift in asset types.
Market Analysis and Trends
Financial Services
The slide categorizes NPL sales by asset type, showing trends from 2008-2020 and explaining shifts in retail and corporate loans.
NPL sales, asset types, retail loans, corporate loans, financial analysis, Turkey
false
Market Analysis and Trends
Financial Services
Mixed Chart
PwC/Strategy&
Add to my slides
Remove from favorites
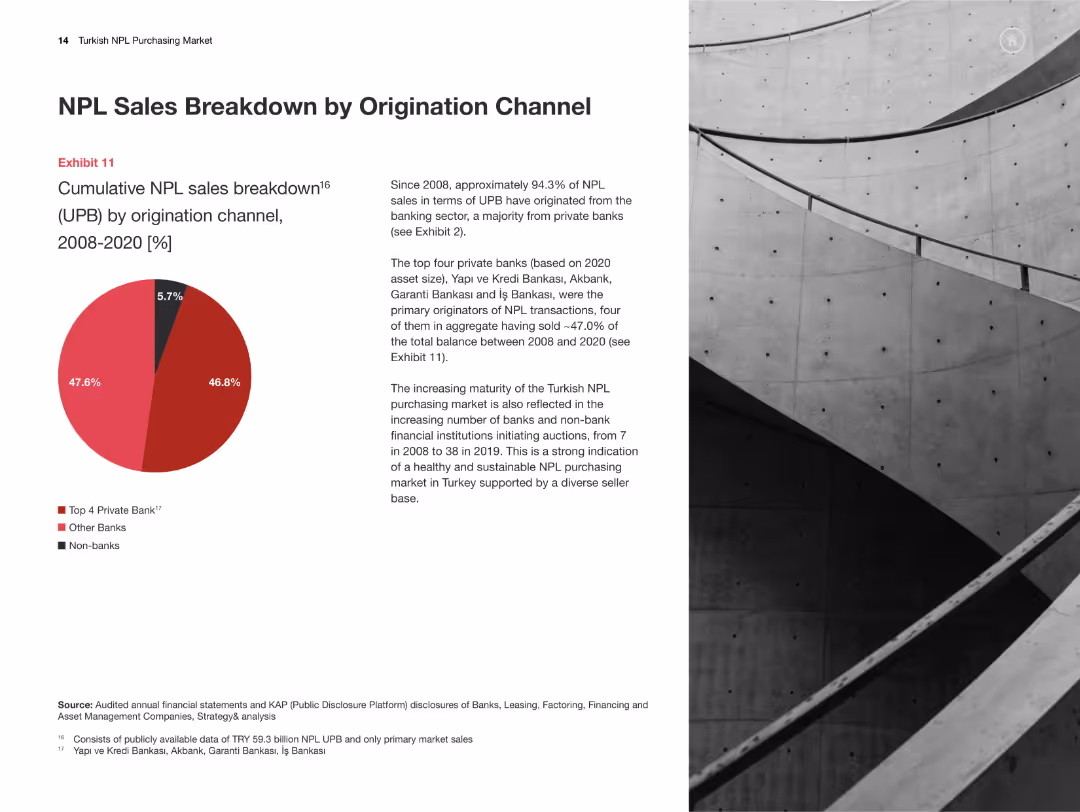
Pie chart showing the breakdown of NPL sales by origination channel (2008-2020). Text details channel contributions.
Market Analysis and Trends
Financial Services
This slide analyzes the breakdown of NPL sales by origination channel, indicating the major contributors and trends over the period.
NPL sales, origination channels, financial breakdown, market trends, Turkey
false
Market Analysis and Trends
Financial Services
Mixed Chart
PwC/Strategy&
Add to my slides
Remove from favorites
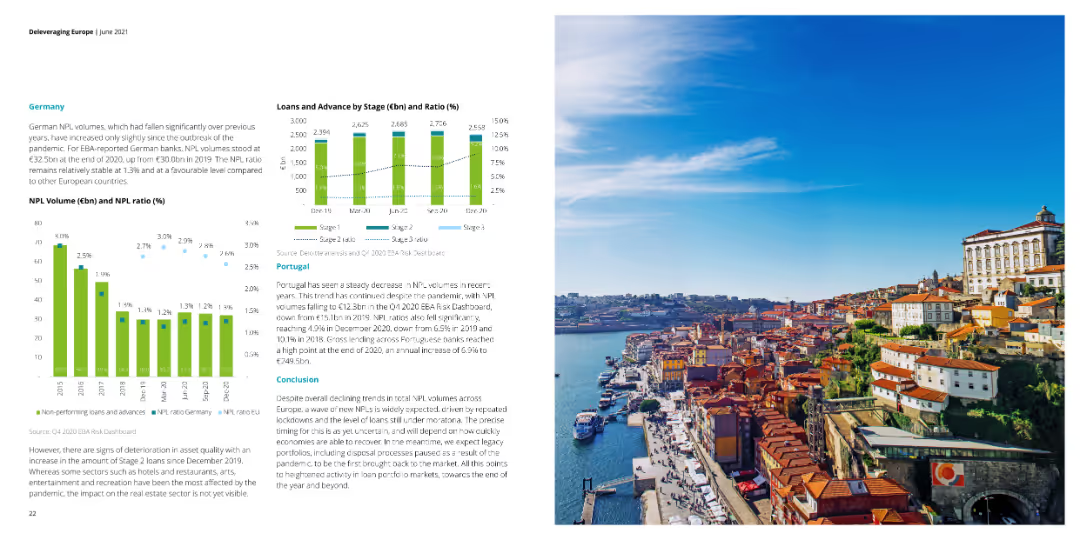
The slide displays column charts depicting NPL volumes and NPL ratios for German banks and loans by stage for Portugal. An image of a waterfront cityscape complements the data.
Financial Performance
Financial Services
This slide focuses on the NPL volumes and ratios for German banks and the distribution of loans by stage in Portugal. It highlights the effects of the pandemic on these metrics.
NPL volumes, NPL ratios, Germany, Portugal, loans
false
Financial Performance
Financial Services
Multiple Chart
Deloitte
Add to my slides
Remove from favorites
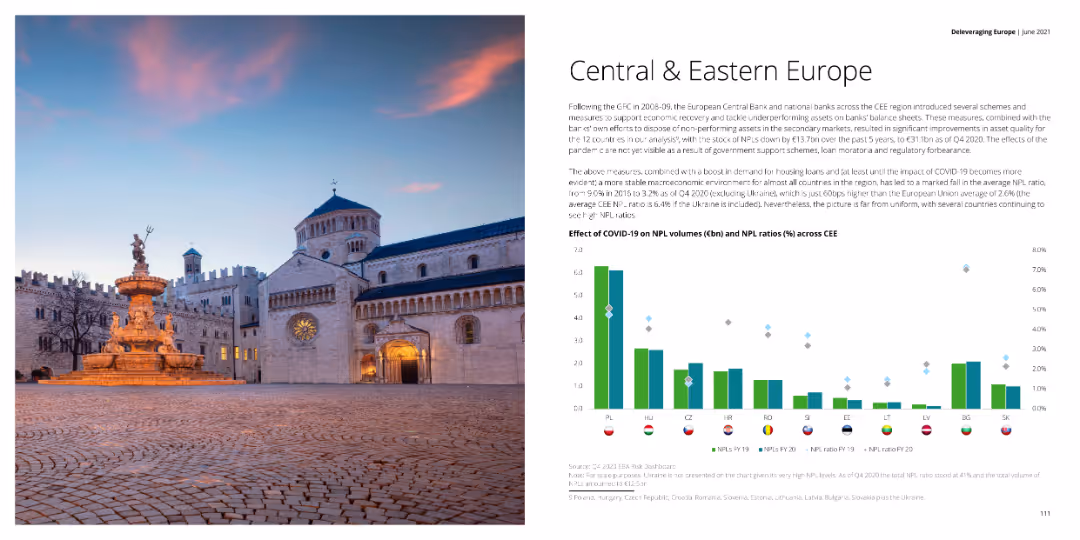
The slide includes a column chart showing the effect of COVID-19 on NPL volumes and ratios across CEE countries, with a text block summarizing the impacts and measures taken by banks. The left side contains an image of a cathedral.
Market Analysis and Trends
Financial Services
The slide analyzes the impact of COVID-19 on NPL volumes and ratios across Central and Eastern Europe, highlighting measures taken by banks and government schemes to support the financial sector.
NPL, COVID-19, financial impact, CEE, measures
false
Market Analysis and Trends
Financial Services
Mixed Chart
Deloitte
Add to my slides
Remove from favorites
The slide features a bar chart showing coverage ratios of NPLs across CEE countries, along with a text block summarizing the current status and outlook. The left side contains a graph of loan moratoria across CEE.
Risk Assessment and Management
Financial Services
The slide provides a detailed view of NPL coverage ratios across CEE countries, discussing the implications and future outlook, and includes an overview of loan moratoria in the region.
NPL, coverage ratios, loan moratoria, CEE, outlook
false
Risk Assessment and Management
Financial Services
Multiple Chart
Deloitte
Add to my slides
Remove from favorites
This slide features a column chart showing NPL sales volume from 2010 to 2023 with historical and projected values. It uses different colors to represent various growth scenarios.
Market Analysis and Trends
Financial Services
This slide projects the expected growth in NPL sales volumes in Turkey from 2010 to 2023, highlighting historical growth rates and various future scenarios based on economic conditions.
NPL, growth, Turkey, projections, economic scenarios
false
Market Analysis and Trends
Financial Services
Mixed Chart
PwC/Strategy&
Add to my slides
Remove from favorites
Column charts on EBA loans under moratoria by country, with detailed textual analysis of trends.
Regulatory and Compliance
Financial Services
Discusses the impact of the pandemic on NPL volumes and loan provisions, focusing on regulatory changes and market responses.
NPL, pandemic, moratoria, regulatory, compliance
false
Regulatory and Compliance
Financial Services
Multiple Chart
Deloitte
Add to my slides
Remove from favorites
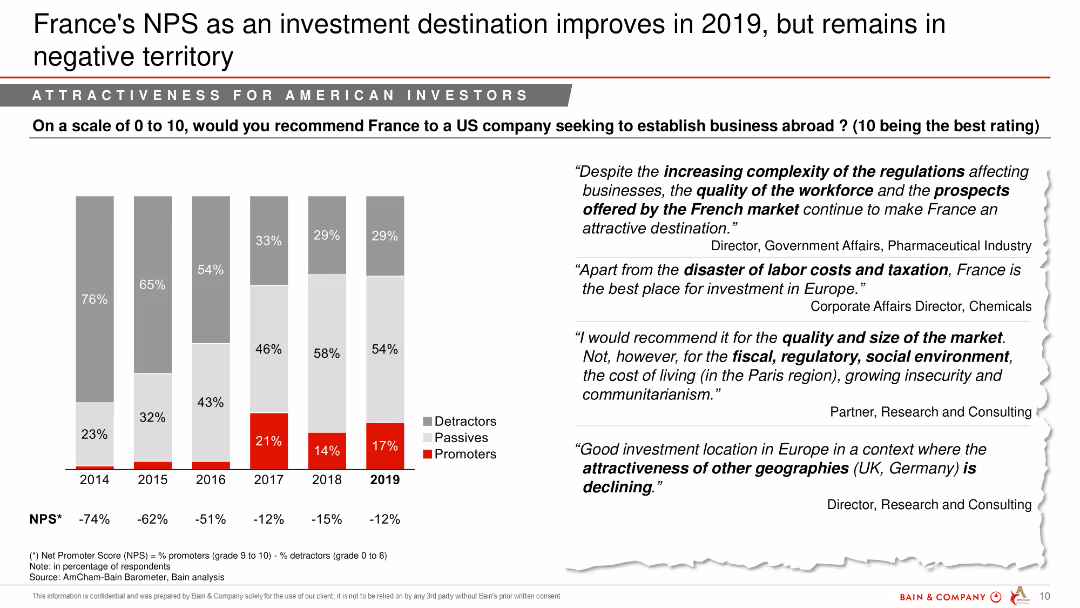
Displays a column chart of Net Promoter Score (NPS) for France from 2013-2018, highlighting detractors, passives, and promoters, with key business insights.
Corporate Finance and Valuation
Financial Services
Evaluates France's Net Promoter Score (NPS) as an investment destination, detailing the perspectives of various business stakeholders on its market potential.
NPS, France, investment destination, business perspectives, market analysis
false
Corporate Finance and Valuation
Financial Services
Mixed Chart
Bain
Add to my slides
Remove from favorites
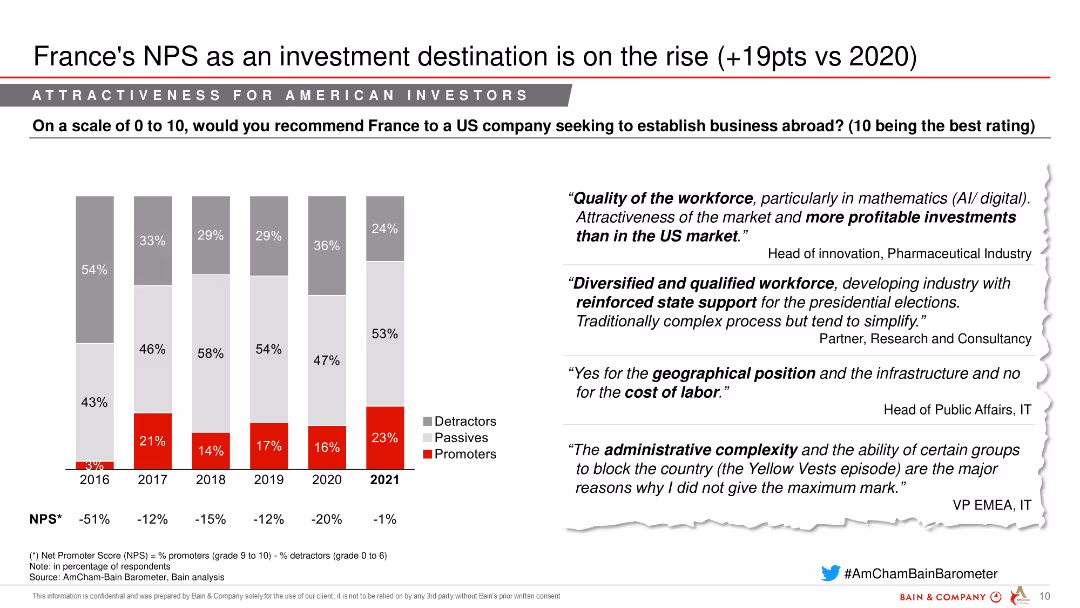
The slide features a column chart displaying the Net Promoter Score (NPS) of France as an investment destination from 2016 to 2021, segmented into detractors, passives, and promoters. Quotes from industry experts are on the right.
Investment Analysis
Healthcare & Pharmaceuticals
This slide indicates an increase in France's attractiveness as an investment destination, with a notable rise in its NPS score in 2021.
NPS, Investment destination, Pharmaceuticals, Market attractiveness, Investment trends
false
Investment Analysis
Healthcare & Pharmaceuticals
Mixed Chart
Bain
Add to my slides
Remove from favorites
Split layout; left side has a circular graphic showing NPS score, right side contains text on a blue background explaining reasons for high performance.
Performance Metrics and KPIs
Healthcare & Pharmaceuticals
Highlights a high Net Promoter Score (NPS) of 75 for 2024, classified as "World class". The slide attributes the score to product reliability, customer alignment, data focus, and challenge handling.
NPS, customer satisfaction, 2024, performance, healthcare, product quality, data focus, client alignment
false
Performance Metrics and KPIs
Healthcare & Pharmaceuticals
Mixed Chart
JP Morgan
Add to my slides
Remove from favorites
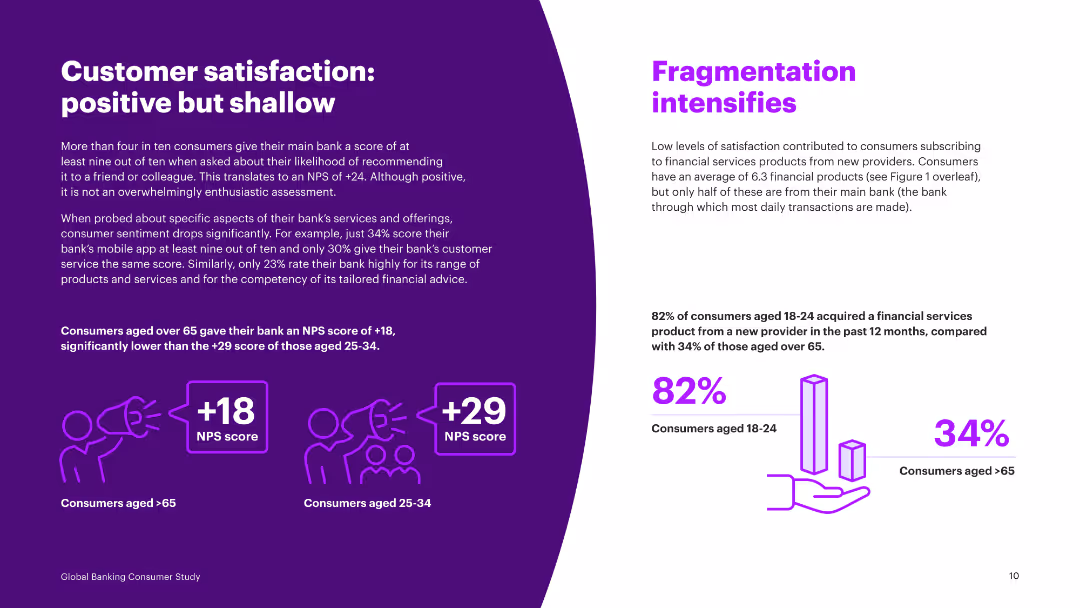
Comparative analysis using NPS scores for different age groups, with textual insights on customer satisfaction levels and service aspects.
Performance Metrics and KPIs
Financial Services
Provides a detailed look at customer satisfaction scores (NPS) by age group and the disparity in satisfaction with different banking services and features.
NPS, customer satisfaction, age groups, banking services, features, comparative, scores, insights, survey
false
Performance Metrics and KPIs
Financial Services
Mixed Chart
Accenture
Add to my slides
Remove from favorites
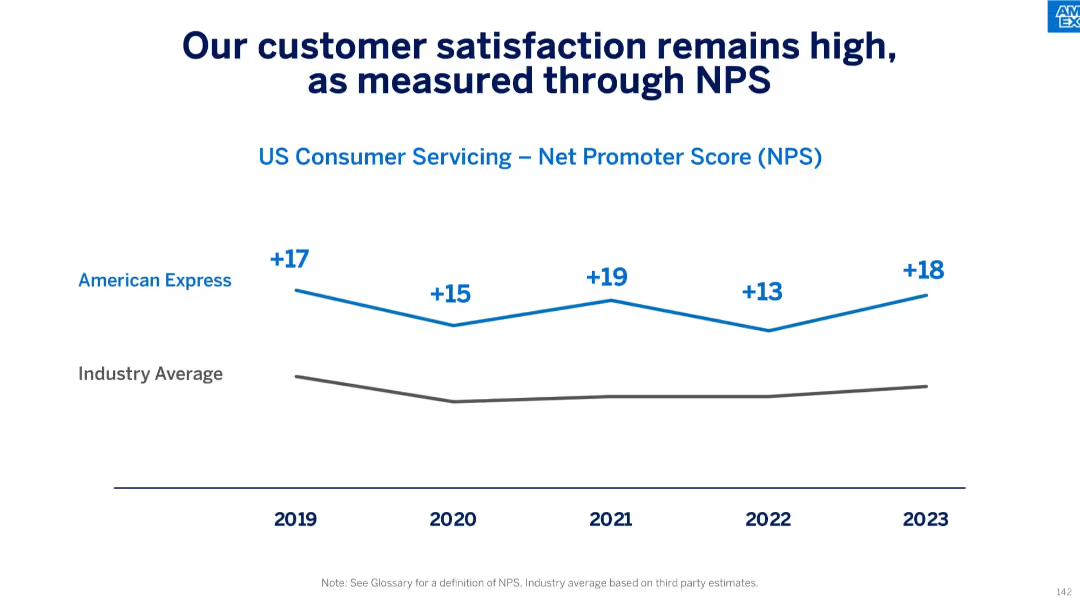
Line graph comparing Net Promoter Score (NPS) of American Express vs industry average from 2019–2023.
Performance Metrics and KPIs
Financial Services
This slide communicates strong customer satisfaction in U.S. consumer servicing, as reflected in American Express’ consistently high NPS, which remained above industry averages from 2019 through 2023, peaking at +19 in 2021 and rebounding to +18 in 2023.
NPS, customer satisfaction, consumer servicing, benchmark, Net Promoter Score, industry average, loyalty, performance
false
Performance Metrics and KPIs
Financial Services
Single Chart
McKinsey
Add to my slides
Remove from favorites
Column chart showing the Net Promoter Score (NPS) from 2014 to 2019, categorized into Detractors, Passives, and Promoters, with comments from respondents.
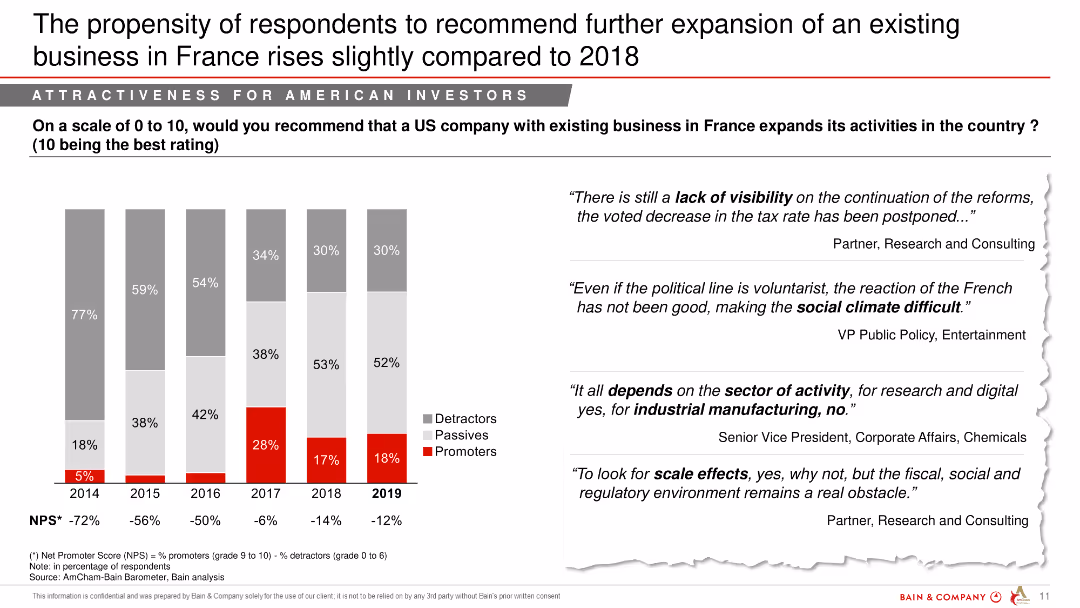
Market Analysis and Trends
Professional Services
The slide presents the NPS of American investors recommending further business expansion in France, highlighting a slight rise in recommendations from 2018.
NPS, expansion, business, France, investors, trend
false
Market Analysis and Trends
Professional Services
Mixed Chart
Bain
Add to my slides
Remove from favorites
Consists of column charts over five years showing the Net Promoter Score for France as a destination for foreign workers, accompanied by qualitative feedback from various professionals.
Market Analysis and Trends
Professional Services
Evaluates France's appeal as a work destination through yearly Net Promoter Scores, providing insights into the perceptions of foreign employees about working and living in France.
NPS, foreign employees, France, work environment, expatriate
false
Market Analysis and Trends
Professional Services
Mixed Chart
Bain
Add to my slides
Remove from favorites
This slide features two sections. The left section contains a scatter plot with a trend line showing a positive correlation. The right section contains a column chart showing NPS values.
Market Analysis and Trends
Professional Services
Analyzes the correlation between the number of high value elements a company delivers and its Net Promoter Score (NPS). Intended for strategic business insights and decision making.
NPS, high value elements, correlation, companies, business analysis
false
Market Analysis and Trends
Professional Services
Multiple Chart
Bain
Add to my slides
Remove from favorites
A column chart showing France's Net Promoter Score as an investment destination over several years, with text quotes from experts.
Market Analysis and Trends
Financial Services
This slide evaluates France's Net Promoter Score for investment attractiveness, highlighting opinions and trends over recent years.
NPS, investment destination, France, financial services, market analysis, yearly comparison, opinions
false
Market Analysis and Trends
Financial Services
Mixed Chart
Bain
Add to my slides
Remove from favorites
Features stacked bar graphs displaying Net Promoter Score by country over three years. The color scheme aids distinction between years, with an explanatory side text.
Customer and Market Segmentation
Retail & E-commerce
Details the decline in consumer satisfaction with online shopping despite increased usage of e-commerce platforms in Southeast Asia.
NPS, satisfaction, e-commerce, SEA
false
Customer and Market Segmentation
Retail & E-commerce
Multiple Chart
Bain
Add to my slides
Remove from favorites
Column chart showing the Net Promoter Score (NPS) for recommending France as a country to settle from 2014 to 2019, with quotes from respondents.
Market Analysis and Trends
Professional Services
The slide presents the decline in NPS for recommending France as a place to settle, despite the positive feedback on quality of life.
NPS, settle, France, quality of life, decline, recommendation
false
Market Analysis and Trends
Professional Services
Mixed Chart
Bain
Add to my slides
Remove from favorites
The slide contains a column chart comparing current NTM P/E ratios for different S&P 500 sectors against their 10-year high, low, and average. Text explanations are included.
Investment Analysis
Financial Services
This slide offers a sector-specific analysis of NTM P/E ratios for the S&P 500, providing valuable information for sector-based investment decisions.
NTM P/E, S&P 500, sectors, valuation, analysis
false
Investment Analysis
Financial Services
Mixed Chart
Morgan Stanley
Add to my slides
Remove from favorites
The slide includes a column chart showing current NTM P/E ratios for various regions and styles compared to their 10-year high, low, and average. Text explanations are provided.
Investment Analysis
Financial Services
This slide compares the current NTM P/E ratios across different regions and styles with their historical values, offering insights for investment analysis.
NTM P/E, valuation, regions, investment, analysis
false
Investment Analysis
Financial Services
Mixed Chart
Morgan Stanley
Add to my slides
Remove from favorites
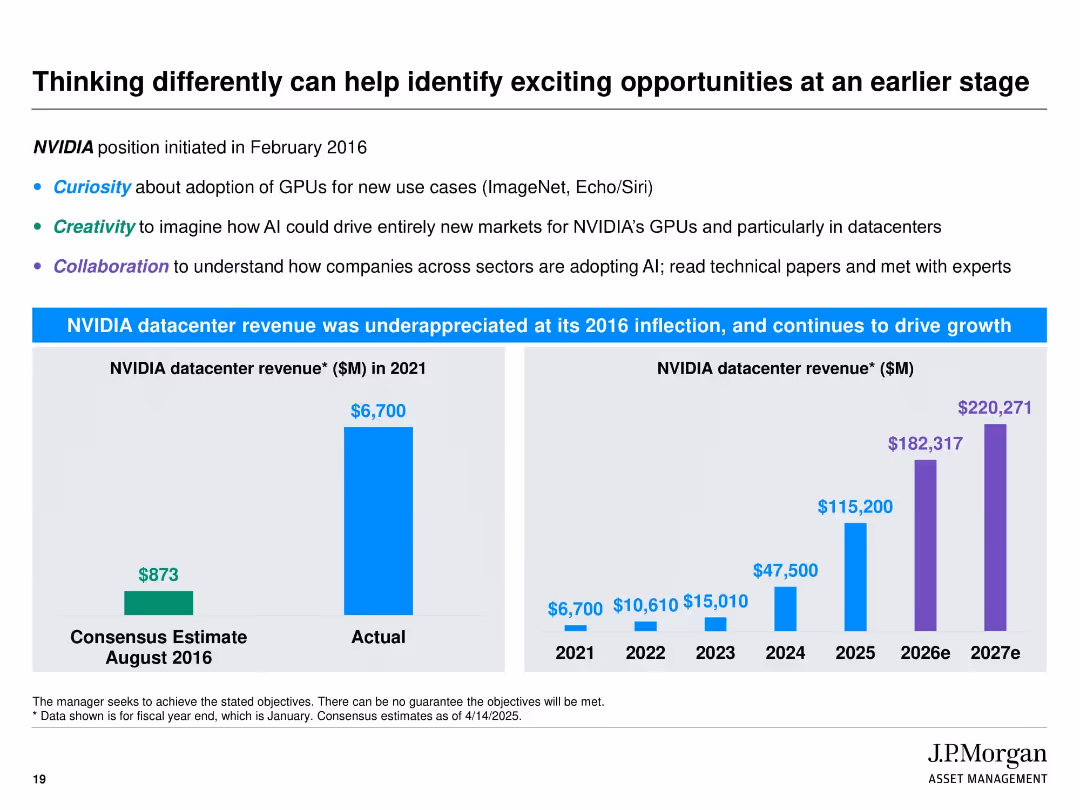
Split into two horizontal sections. Top section has bullet text with keywords in blue, green, and purple. Bottom section features two bar charts comparing consensus vs. actual and projected NVIDIA datacenter revenues. Uses bright blue and purple for visual impact.
Market Analysis and Trends
Technology & Software
This slide highlights the strategic foresight in identifying NVIDIA’s datacenter opportunity since 2016. It emphasizes attributes like curiosity, creativity, and collaboration. A dramatic gap between consensus and actual revenue is shown, followed by projections demonstrating continued strong growth, reinforcing J.P. Morgan’s proactive investment strategy.
NVIDIA, GPUs, AI, datacenter, creativity, revenue forecast, investment foresight, J.P. Morgan, early-stage opportunity
false
Market Analysis and Trends
Technology & Software
Multiple Chart
JP Morgan
Add to my slides
Remove from favorites
This slide provides a timeline of NVIDIA's market capitalization, paired with text descriptions on a white and purple background. Icons are used to depict various sectors like autonomous vehicles, smart city solutions, and intelligent stores.
Market Analysis and Trends
Technology & Software
Highlighting NVIDIA's evolution, the slide outlines the company's growth from a graphics chip company to a comprehensive industry solution provider. It showcases various end-to-end hardware, software, and service solutions that NVIDIA has developed.
NVIDIA, market cap, E2E industry solutions, autonomous vehicles, smart city, intelligent stores, smart hospitals, graphic chips, tech evolution, industry activator
true
Market Analysis and Trends
Technology & Software
Boxed
Accenture
Add to my slides
Remove from favorites
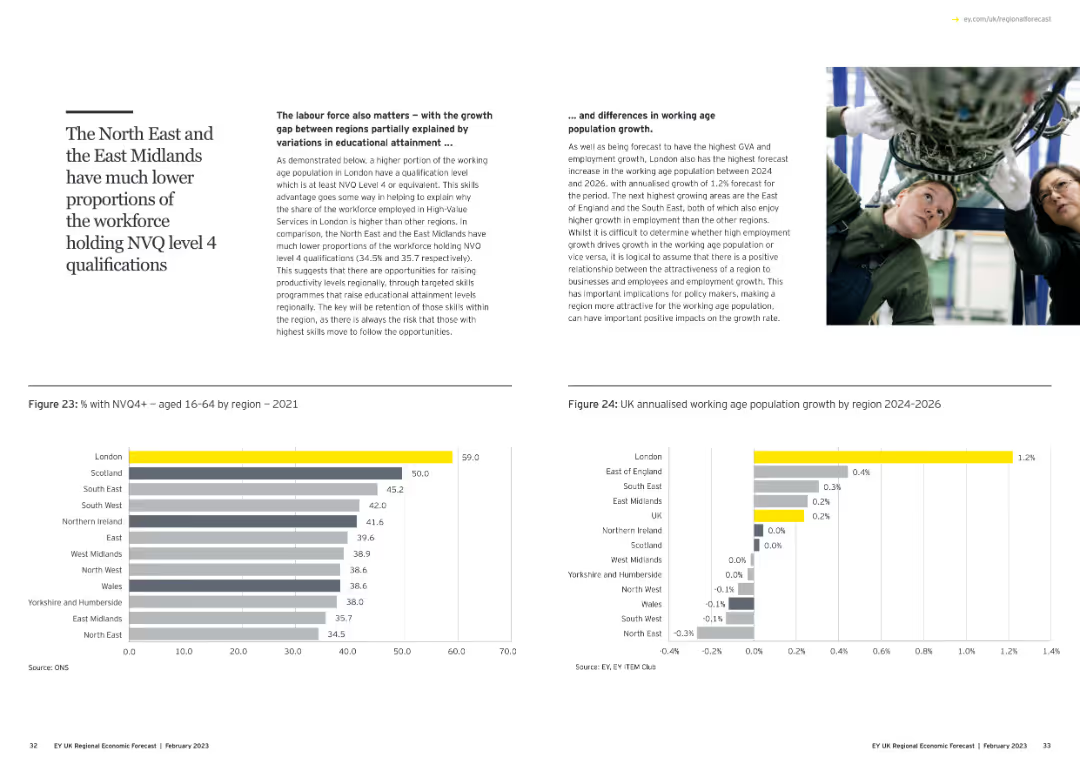
This slide includes a text box on the left with explanations about NVQ level 4 qualifications. Below, there is a column chart showing the percentage of workforce with NVQ4+ by region, and a bar chart forecasting working-age population growth.
Human Resources and Talent Management
Education & Training
The slide discusses regional disparities in educational attainment, specifically NVQ level 4 qualifications, and its impact on workforce proportions and future population growth across various regions.
NVQ level 4, workforce, education, regional disparities, population growth
false
Human Resources and Talent Management
Education & Training
Multiple Chart
EY
Add to my slides
Remove from favorites
The slide presents three bar charts, showing the share of NY employees, payroll, and small businesses across six key industries, each represented with its respective color and percentage.
Market Analysis and Trends
Financial Services
This slide provides an overview of six major industries in New York State, showing their share in terms of employees, payroll, and small business ownership, illustrating the sectors' sizes and economic weight.
NY State, industries, employees, payroll, small businesses, economic overview, column chart
false
Market Analysis and Trends
Financial Services
Multiple Chart
BCG
Add to my slides
Remove from favorites
This slide utilizes a complex array of column charts detailing the 2019 GDP contributions and unemployment claims across various sectors in NY, segmented by industry and visualized with distinct colors.
Market Analysis and Trends
Financial Services
Offers a comprehensive snapshot of the New York economy, detailing each industry's contribution to the state's GDP and its unemployment figures in early 2020, reflecting the pandemic's impact.
NY economy, 2019 GDP, unemployment claims, industry analysis, pandemic, bar charts
false
Market Analysis and Trends
Financial Services
Single Chart
BCG
Add to my slides
Remove from favorites
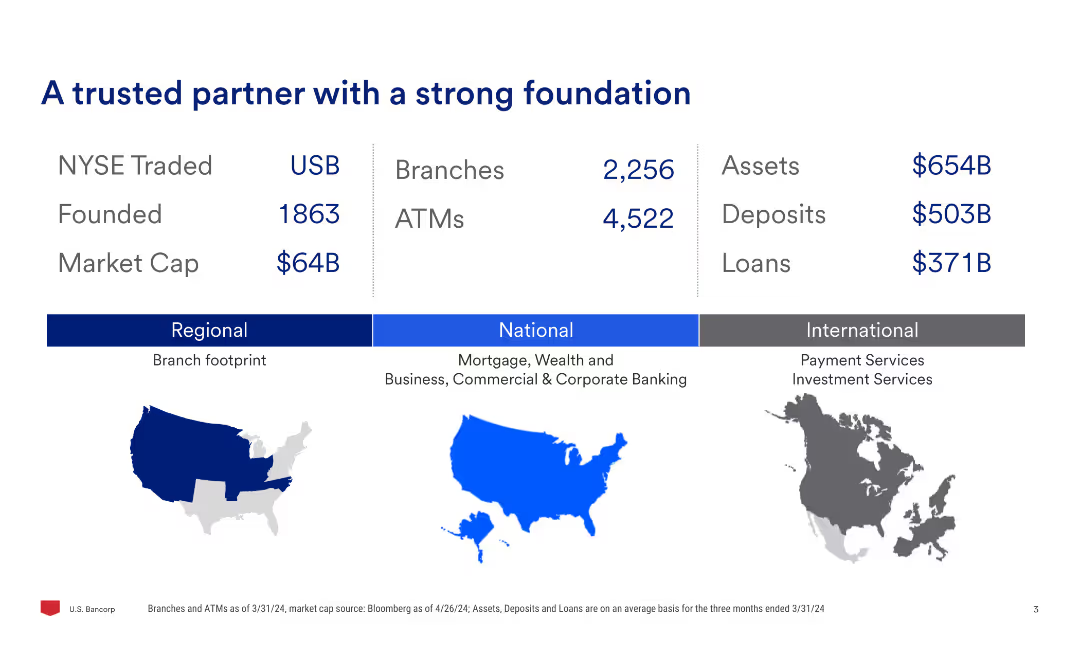
This slide features a minimal design with a three-column layout. The left column contains financial metrics, the center column shows branches and ATMs, and the right column shows assets, deposits, and loans. There are also regional, national, and international maps.
Financial Performance
Financial Services
Provides an overview of the company's key financial metrics, including NYSE trading symbol, founding year, market cap, branches, ATMs, assets, deposits, and loans. It also outlines the company's regional, national, and international presence.
NYSE, trading, branches, assets, deposits, loans, financial metrics, market cap, regional, national
false
Financial Performance
Financial Services
Graphic
Barclays
Add to my slides
Remove from favorites
Features a bar chart displaying budget and expenditure metrics.
Financial Performance
Government & Public Sector
Provides an overview of Namibia's budget, focusing on operational expenditure, revenue vs. expenditure, and tax vs. non-tax revenue, highlighting fiscal metrics.
Namibia, budget, finance, government, expenditure
false
Financial Performance
Government & Public Sector
Single Chart
PwC/Strategy&
Add to my slides
Remove from favorites
Slide shows a map of Namibia with key economic statistics presented in a segmented arrow design, highlighting data like unemployment rate, GDP growth, and inflation.
Industry Overview
Government & Public Sector
Provides a concise overview of Namibia’s current economic status, detailing key statistics like unemployment, GDP growth, and inflation rates.
Namibia, economic statistics, unemployment, GDP growth, inflation, economic overview
false
Industry Overview
Government & Public Sector
Graphic
PwC/Strategy&
Add to my slides
Remove from favorites
Timeline showing the projected development of nanotechnologies from passive nanostructures in the 2000s to molecular nanosystems by 2050.
Technology and Digital Transformation
Technology & Software
The slide presents the evolution of nanotechnology, from early applications of passive nanostructures to advanced molecular nanosystems by 2050. It highlights the transformative potential of nanotechnology across various industries and applications, emphasizing its role in future innovations.
Nanotechnology, Material Science, Evolution
false
Technology and Digital Transformation
Technology & Software
Linear Flow
Roland Berger
Add to my slides
Remove from favorites
Features a quote from Namibia's Minister of Finance, an image of a person at a desk, and three highlighted goals represented by vertical bars of varying colors (yellow, grey, red), each with a brief label. The design is clean, utilizing ample whitespace and balanced text placement.
Strategic Planning
Government & Public Sector
Outlines the strategic goals of Namibia's national budget for 2024/25, focusing on stimulating domestic demand, investing in infrastructure, and fiscal prudence. Aims to communicate governmental fiscal priorities and public sector planning.
National Budget, Fiscal Planning, Namibia, Public Sector, Economic Strategy
false
Strategic Planning
Government & Public Sector
Pillar
PwC/Strategy&
Add to my slides
Remove from favorites
Contains a mixed chart with columns and a line graph illustrating Namibia's national debt from 2017/18 to 2024/25. Columns represent domestic and foreign debt in two shades of red, while the line graph shows total debt as a percentage of GDP. Includes minimal textual annotations.
Financial Performance
Government & Public Sector
Provides an overview of Namibia's national debt trends, highlighting increases in domestic and foreign debt over time. Useful for understanding fiscal health and governmental financial strategies.
National Debt, Fiscal Health, Namibia, Government Finance, Debt Trends
false
Financial Performance
Government & Public Sector
Single Chart
PwC/Strategy&
Add to my slides
Remove from favorites
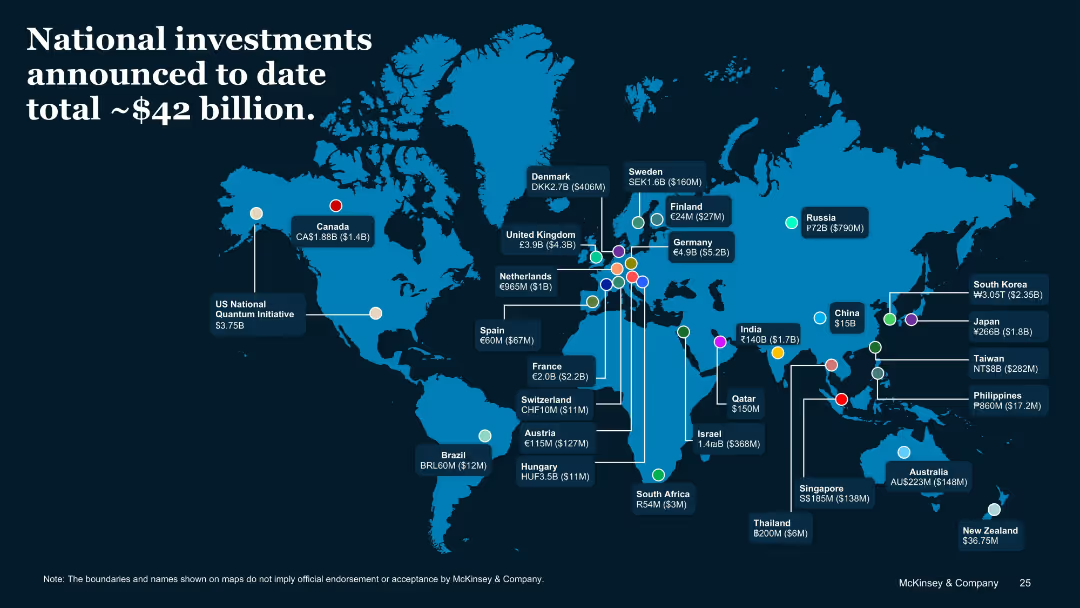
World map with labeled investment amounts per country
Financial Performance
Government & Public Sector
A geographic visualization of national QT funding initiatives. Major contributors include the US, China, Germany, and the UK. The slide conveys total announced public investments and emphasizes global distribution and policy support.
National Funding, QT, Investment Map, Global Strategy, Government Support
false
Financial Performance
Government & Public Sector
Uncategorized
McKinsey
Add to my slides
Remove from favorites
Contains a single, bold line graph with different scenario projections, showing natural gas demand trends over time.
Strategic Planning
Energy & Utilities
Projects growth in natural gas demand across various scenarios, with implications for strategic energy planning, particularly concerning decarbonization efforts.
Natural Gas, Demand Growth, Scenario Analysis, Strategic Energy Planning, Decarbonization
false
Strategic Planning
Energy & Utilities
Single Chart
McKinsey
Add to my slides
Remove from favorites
The slide features a bar chart showing global natural gas demand (bcm) from 2022 to 2050, with segments for Petrochemicals, Power with CCUS, Residential, Power, Industrial, and Commercial. The chart indicates a decline in demand, particularly in residential and conventional power segments.
Strategic Planning
Energy & Utilities
This slide projects the stabilization and eventual decline in global natural gas demand by 2050, emphasizing the significant drop in residential and conventional power applications. It also highlights the role of CCUS in the transition to greener energy solutions.
Natural Gas, Demand, Decline, 2050, Residential, Power, CCUS
false
Strategic Planning
Energy & Utilities
Mixed Chart
EY
Add to my slides
Remove from favorites
A bubble chart showing the timeline and capacity of natural gas processing combined with CCUS projects.
Market Analysis and Trends
Energy & Utilities
Highlights the historical and future significance of natural gas processing in CCS applications.
Natural gas, CCS, timeline, capacity, projects
false
Market Analysis and Trends
Energy & Utilities
Single Chart
Kearney
Add to my slides
Remove from favorites
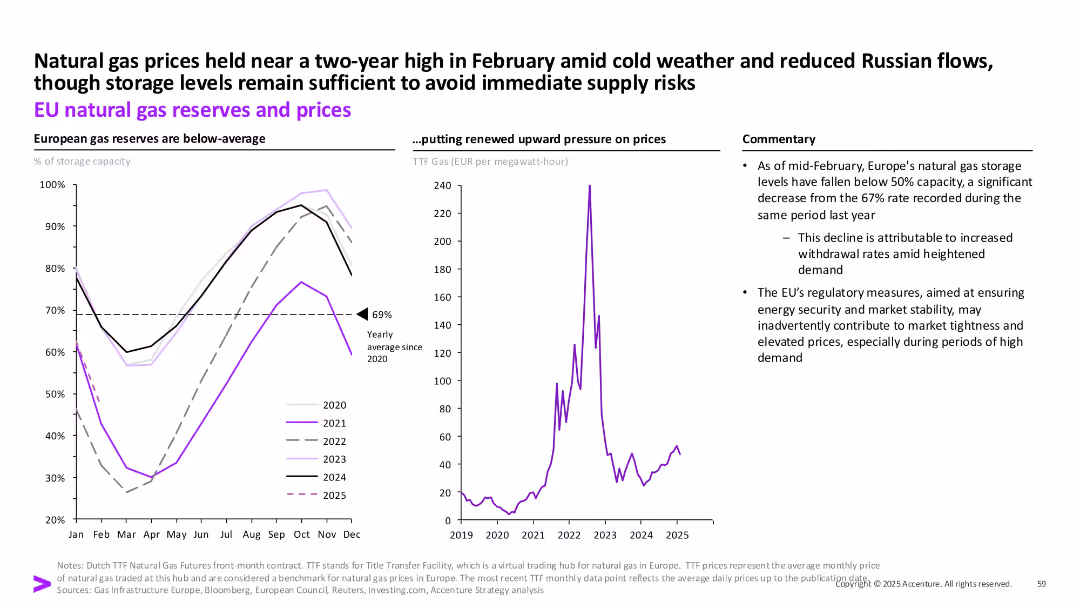
Dual chart layout: reserves by year (left), gas prices (right), plus commentary box on the side.
Risk Assessment and Management
Energy & Utilities
The slide provides an overview of declining EU gas reserves as of early 2025 and how this correlates with higher prices, especially amid colder weather and reduced Russian flows. Regulatory impact is also addressed.
Natural gas, EU, storage, TTF prices, energy security, regulation, Russia, demand
false
Risk Assessment and Management
Energy & Utilities
Multiple Chart
Accenture
Add to my slides
Remove from favorites
Contains a text description of natural H2 production sources, a map highlighting Mali, and key features of the Bourakebougou field.
Market Analysis and Trends
Energy & Utilities
Discusses various natural sources of hydrogen production discovered in different geological settings, with a focus on the Bourakebougou field in Mali.
Natural hydrogen, production sources, geology, Mali, Bourakebougou field
false
Market Analysis and Trends
Energy & Utilities
Graphic
Kearney
Add to my slides
Remove from favorites
Diagram with a map of Central America and icons representing various benefits of nearshoring, such as growth in value chains and productivity.
Market Analysis and Trends
Transportation & Logistics
This slide explores the benefits of nearshoring for Central America, including promoting value chains, boosting productivity through R&D, and revitalizing the economy by developing local supply chains.
Nearshoring, Central America, benefits, productivity, economy
false
Market Analysis and Trends
Transportation & Logistics
Diagram
Deloitte
Add to my slides
Remove from favorites
The slide has a title at the top, text in the middle, and a pie chart at the bottom showing the sense of belonging to the neighborhood.
Risk Assessment and Management
Government & Public Sector
Indicates that 77% of respondents feel they belong strongly to their neighborhood. The data is represented in a pie chart, showing varying degrees of belonging.
Neighborhood, Belonging, Survey, Community, Data
false
Risk Assessment and Management
Government & Public Sector
Mixed Chart
IPSOS
Add to my slides
Remove from favorites
The slide has a title at the top, text in the middle, and a column chart at the bottom showing reliance on neighborhood help.
Risk Assessment and Management
Government & Public Sector
Highlights that 83% of respondents believe they can rely on someone in their neighborhood for help. The data compares responses from May and December 2020.
Neighborhood, Help, Survey, Community, Data
false
Risk Assessment and Management
Government & Public Sector
Single Chart
IPSOS
Add to my slides
Remove from favorites
The slide has a title at the top, text in the middle, and a column chart at the bottom showing trust levels in neighborhoods.
Risk Assessment and Management
Government & Public Sector
Presents data on neighborhood trust levels, with 81% of respondents agreeing they trust people in their neighborhood. The data compares trust levels from May and December 2020.
Neighborhood, Trust, Survey, Community, Data
false
Risk Assessment and Management
Government & Public Sector
Single Chart
IPSOS
Add to my slides
Remove from favorites
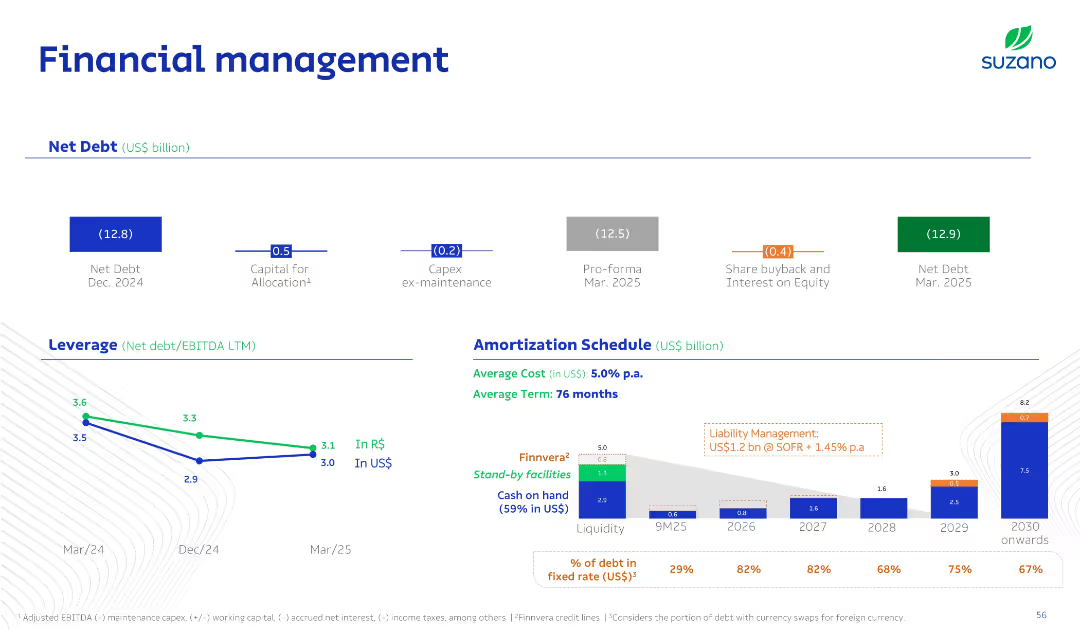
Clean multi-zone slide: top for net debt summary, bottom for leverage ratio trend and amortization bar chart; color-coded debt types and facilities.
Corporate Finance and Valuation
Consumer Goods
This slide presents Suzano's debt structure, including net debt positions, leverage ratios in R$/US$, and a debt amortization schedule through 2030. It details cost of debt, liquidity, and upcoming obligations.
Net Debt, Leverage, Amortization, Liquidity, Finance
false
Corporate Finance and Valuation
Consumer Goods
Multiple Chart
Goldman Sachs
Add to my slides
Remove from favorites
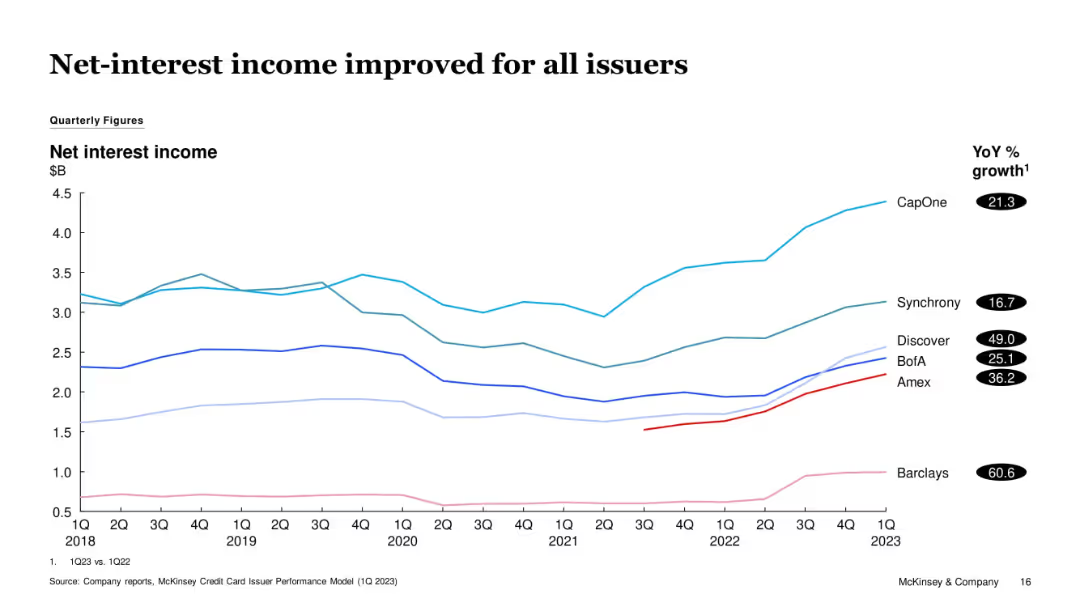
Multi-line graph tracking issuer-specific net-interest income from 1Q18 to 1Q23. YoY % growth listed next to issuer names.
Financial Performance
Financial Services
All tracked issuers saw improvements in net-interest income YoY, with Barclays and Discover showing the highest gains. The chart visualizes long-term recovery and growth momentum from earlier dips in 2020-2021.
Net Interest Income, Barclays, Discover, CapOne, Income Growth, Credit
false
Financial Performance
Financial Services
Single Chart
McKinsey
Add to my slides
Remove from favorites
The slide features a series of column charts comparing net interest income by segment across different quarters, accompanied by table detailing loan distribution and metrics. Various shades of blue and gray are used.
Financial Performance
Financial Services
This slide provides a detailed financial analysis, breaking down net interest income by business segment and loan types, and comparing quarter-on-quarter and year-on-year changes. It's intended for presenting to stakeholders interested in the financial health and lending performance of the company.
Net Interest, Loans, Financial Analysis, QoQ, YoY
false
Financial Performance
Financial Services
Mixed Chart
Goldman Sachs
Add to my slides
Remove from favorites
Comprising column charts, a table, and metrics presented in a well-organized manner, this slide compares net interest income and loans across different sectors.
Operational Efficiency
Financial Services
Examines the net interest income by segment, detailing loan categories and providing metrics on the allocation and growth of loans. It serves to analyze financial health and operational efficiency within the company's loan management strategy.
Net Interest, Loans, Financial Health, Operational Efficiency, Metrics
false
Operational Efficiency
Financial Services
Multiple Chart
Goldman Sachs
Add to my slides
Remove from favorites
Features table and column charts on net interest income by segment and detailed tables on loan types and amounts.
Financial Performance
Financial Services
Focuses on net interest income across different business segments and provides a detailed breakdown of loans. It is suitable for financial review meetings to discuss income trends and loan allocations in various sectors.
Net Interest, Loans, Segments, Income Trends, Corporate, Wealth Management, Real Estate, Consumer, Credit, Asset Management, Investment Banking
false
Financial Performance
Financial Services
Multiple Chart
Goldman Sachs
Add to my slides
Remove from favorites
The slide features three key areas: 'Net Profit Contribution' shown as a column chart, 'Income by region' displayed as a donut chart, and 'Regulatory capital' in a stacked column chart. It has a clear title at the top.
Financial Performance
Financial Services
This slide presents Macquarie Capital's financial overview, with a focus on net profit, income distribution by region, and regulatory capital allocation. It's intended for financial review and investment strategy discussions.
Net Profit, Income, Regulatory, Capital, Financial Overview, Investment Strategy
false
Financial Performance
Financial Services
Multiple Chart
Morgan Stanley
Add to my slides
Remove from favorites
The slide displays a column chart depicting net profit contribution over five years, paired with a pie chart outlining net operating income by category. The visuals are paired with clear descriptive texts.
Market Analysis and Trends
Financial Services
It outlines the company's profit growth over time and breaks down income by category. The pie chart shows the distribution of operating income, providing insights into the financial structure of the company’s commodities and global markets segment.
Net Profit, Operating Income, Commodities, Financial Analysis, Growth
false
Market Analysis and Trends
Financial Services
Multiple Chart
Goldman Sachs
Add to my slides
Remove from favorites
The slide compares Net Promoter Scores (NPS) across food delivery platforms, featuring graphical data visualization on the right and explanatory text on the left. The clear, professional design aids in understanding the content.
Performance Metrics and KPIs
Retail & E-commerce
Evaluates customer loyalty in the food delivery sector through Net Promoter Scores, providing a metric for comparing consumer satisfaction across platforms. The data indicates a significant opportunity for improvement and competition.
Net Promoter Score, customer loyalty, food delivery, consumer satisfaction, Southeast Asia, market competition, business metrics
false
Performance Metrics and KPIs
Retail & E-commerce
Multiple Chart
Bain
Add to my slides
Remove from favorites
This slide contains column chart depicting 'Net Revenues by Segment' for different quarters, alongside a table comparing financial metrics like net earnings and EPS for Q1 2023 against previous periods.
Financial Performance
Financial Services
A comprehensive financial review of Q1 2023, showing performance metrics across various business segments and overall company profitability. It serves to present trends and results to stakeholders for strategic and investment decisions.
Net Revenue, Financial Metrics, Earnings, EPS, ROE, Segment Analysis, Profitability, Quarter Comparison, Banking, Asset Management
false
Financial Performance
Financial Services
Mixed Chart
Goldman Sachs
Add to my slides
Remove from favorites
Previous
Next
You don't have any favorites yet.
Please wait loading your favorites slides...
Create a FREE account to continue browsing
Receive Instant Access to 1,000+ slides from companies like McKinsey, Google, and Goldman Sachs
First Name
Last Name
Email
Password
I agree to all
Terms & Privacy Policy
Thank you! Your submission has been received!
Oops! Something went wrong while submitting the form.
Have an account?
Sign in
Upgrade to PRO to Save slides
Advanced Search and Filters
Access to 15,000+ slides
Access to Category Pages
Save/Bookmark Slides
PowerPoint Template Library
Pick a Plan
MONTHLY
$12/month
Billed every month, Cancel anytime.
YEARLY
$9/year
Billed $108 annually, Cancel anytime.
Checkout for $12/month
Checkout for $108/yr
Secured by Stripe | AES-256 bit encryption


![Exhibit 19 Net NPL Inflow Total Volume Expected Growth [TRY bn, 2010-23]](https://cdn.prod.website-files.com/654e70fb59937215cac87b19/6877e20855d85025a974ff4f_ofN2ANWw3JoDVnhaHR8_7Dyz6-HsTTy8qicHH5chkcM.avif)

![Exhibit 22 NPL Sales Total Volume Expected Growth [TRY bn, 2010-23]](https://cdn.prod.website-files.com/654e70fb59937215cac87b19/6877e212f9a180cbc7298040_L52_Oa3wTN6SGsqWKzp8NZrmC8r3tL5qZ_X5VbS8Ai0.avif)