My Account
My Slides
Search by Category
Pricing
Templates
View All Templates
Download Template Slides
✦ AI Search
Feedback
Login
Logout
Get Started
Browse all Slides
Browse all Slides
Create a FREE Account
Instant access to 1,000+ real slides from top companies like McKinsey, BCG, Goldman Sachs, Google and many more!
First Name
Last Name
Email
Password
I agree to all
Terms & Privacy Policy
Thank you! Your submission has been received!
Oops! Something went wrong while submitting the form.
Have an account?
Sign in
Saved Slides
Total No. of slides saved
0
↻ Refresh
✖ Clear all
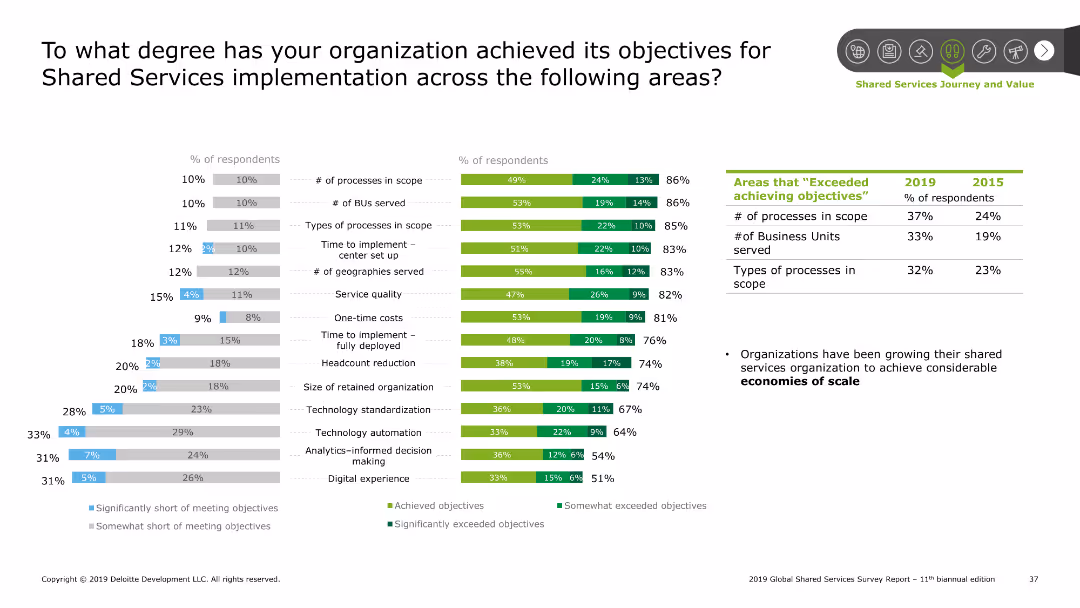
The slide features column charts showing the extent to which organizations have met their objectives in various aspects of shared services implementation.
Performance Metrics and KPIs
Professional Services
This slide measures the achievement of objectives in shared services implementation across different metrics such as processes, BUs served, and cost management.
Objectives, shared services, implementation, performance, metrics
false
Performance Metrics and KPIs
Professional Services
Multiple Chart
Deloitte
Add to my slides
Remove from favorites
Column chart with shades of gray showing the percentage of occupations that could be fully automated or partially automated, listing specific job roles as examples at various automation levels.
Operational Efficiency
Industrial & Manufacturing
Shows the automation potential across different occupations, illustrating how many roles could see a significant portion of their tasks automated and identifying specific occupations like travel agents and web developers.
Occupations, Automation, Job Roles, Potential, Tasks
false
Operational Efficiency
Industrial & Manufacturing
Single Chart
McKinsey
Add to my slides
Remove from favorites
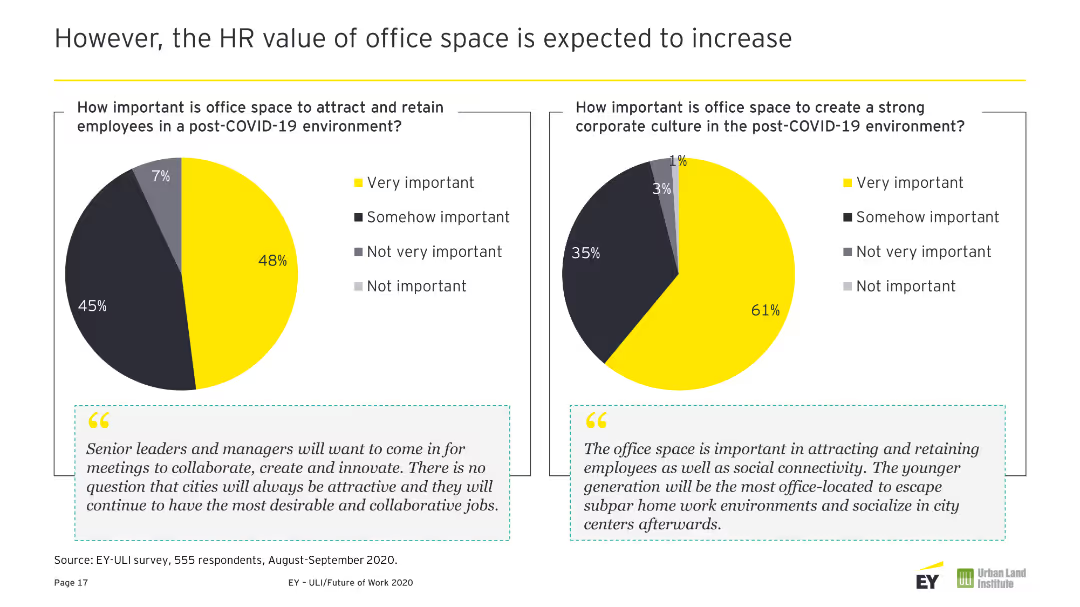
The slide illustrates company approaches to office attendance with three different sized circles, each representing a percentage of companies. The color coding matches the legend, making it clear and easy to understand. The minimalist design focuses on the data, free from any distracting visual elements.
Human Resources and Talent Management
Professional Services
This slide provides an overview of strategies employed by companies to encourage office collaboration. It depicts the percentage of companies allowing employee flexibility, those structuring specific in-office days, and others, helping to guide discussion on balancing autonomy with collaborative needs.
Office Collaboration, Employee Autonomy, Work Strategy, Company Culture, Flexibility
false
Human Resources and Talent Management
Professional Services
Single Chart
EY
Add to my slides
Remove from favorites
Column chart predicting changes in office space usage over the next three-to-five years. Contains three text quotes on the left side in gray boxes. Dominated by yellow and gray colors.
Market Analysis and Trends
Real Estate & Construction
Forecasts a decrease in office space demand due to new work patterns, with detailed reasons including cost management and adaptation to less space.
Office Space, Decrease, Work Patterns, Forecast, Demand, Cost Management, Adaptation, Trends, Space Usage
false
Market Analysis and Trends
Real Estate & Construction
Multiple Chart
EY
Add to my slides
Remove from favorites
Pie chart showing percentage of internet-using buyers, with bar graphs for younger and older offline investors.
Investment Analysis
Financial Services
Explores the investment behavior of offline vs. online investors, highlighting the preference for agents and ease of understanding.
Offline Investors, Agents, Simplicity, Financial Information, Online Options, Investment Behavior
false
Investment Analysis
Financial Services
Mixed Chart
BCG
Add to my slides
Remove from favorites
The slide is divided into three sections, each with a header, a descriptive text block, and an accompanying image. It features images of offshore platforms and vessels, emphasizing Seatruim’s capabilities.
Operational Efficiency
Energy & Utilities
Showcases Seatruim’s achievements and capabilities in offshore platform design and construction, emphasizing their market leadership and commitment to quality and innovation. Suitable for discussions on company accomplishments and industry standing.
Offshore Platforms, FPSOs, Leadership, Achievements
false
Operational Efficiency
Energy & Utilities
Header Vertical
Morgan Stanley
Add to my slides
Remove from favorites
The slide features a combination of images and bulleted lists. Four images represent key pillars, and a detailed list of industry trends and opportunities follows each image.
Market Analysis and Trends
Energy & Utilities
Discusses the growth drivers in the renewable energy sector, emphasizing Seatruim’s strategic areas of development. Useful for presenting the market outlook and potential growth areas in offshore energy and decarbonization initiatives.
Offshore Wind, Decarbonization, New Energies, Growth
false
Market Analysis and Trends
Energy & Utilities
Header Vertical
Morgan Stanley
Add to my slides
Remove from favorites
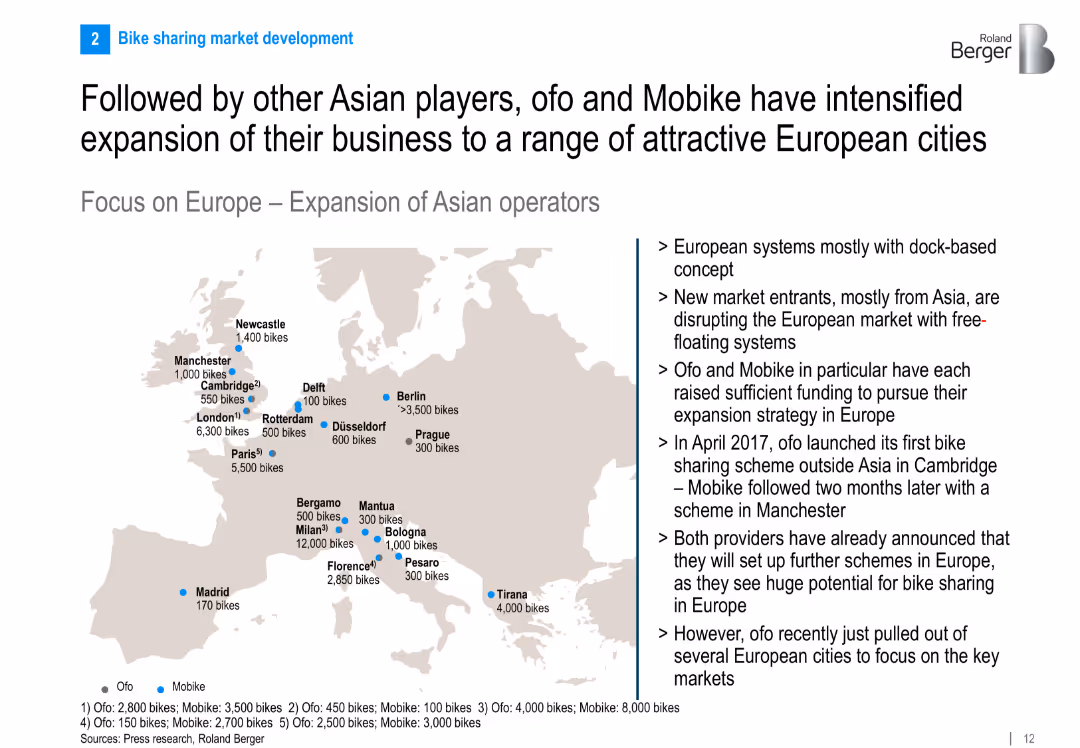
Map of Europe showing cities where Ofo and Mobike operate, with accompanying text on strategy and timeline of market entry.
Sales and Business Development
Transportation & Logistics
The slide outlines the expansion of major Asian bike sharing players into Europe. It maps out cities with Ofo and Mobike operations and discusses how these companies disrupted existing systems with dockless models and rapid scaling.
Ofo, Mobike, bike sharing, expansion, Europe, dockless, market entry, urban transport
false
Sales and Business Development
Transportation & Logistics
Graphic
Roland Berger
Add to my slides
Remove from favorites
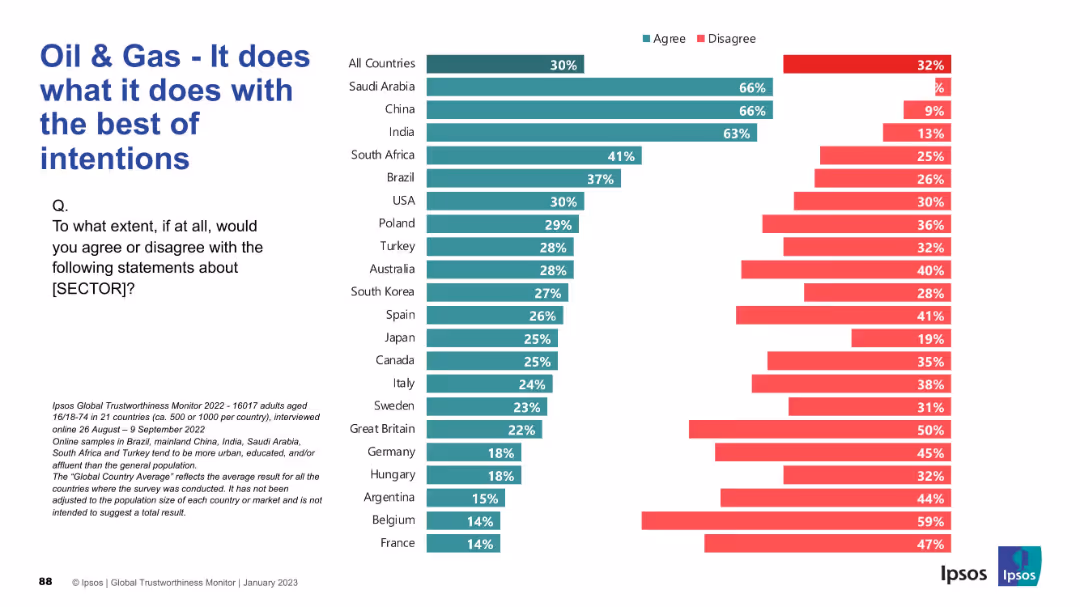
Bar chart comparing agreement and disagreement across countries with the statement. Left-aligned title and question, horizontal bars with green (agree) and red (disagree).
Market Analysis and Trends
Energy & Utilities
This slide presents public opinion across 21 countries on whether the oil & gas sector operates with the best of intentions. Agreement is highest in Saudi Arabia, China, and India, with European countries showing more disagreement.
Oil & Gas, Trust, Global Survey, Intentions, Public Perception, Ipsos, Country Comparison, Sector Sentiment, Energy, Opinions
false
Market Analysis and Trends
Energy & Utilities
Mixed Chart
IPSOS
Add to my slides
Remove from favorites
Features two line graphs and a bar chart illustrating the historical and predicted oil demand, key drivers for peak demand, and global EV sales share.
Risk Assessment and Management
Energy & Utilities
Details the potential peak in oil demand due to electric vehicle uptake, highlighting key factors like historical growth rates and changes in road transport, aiding in risk assessment for the oil industry.
Oil Demand Peak, EV Adoption, Historical Data, Transport Sector, Growth Rates, Risk Management
false
Risk Assessment and Management
Energy & Utilities
Multiple Chart
McKinsey
Add to my slides
Remove from favorites
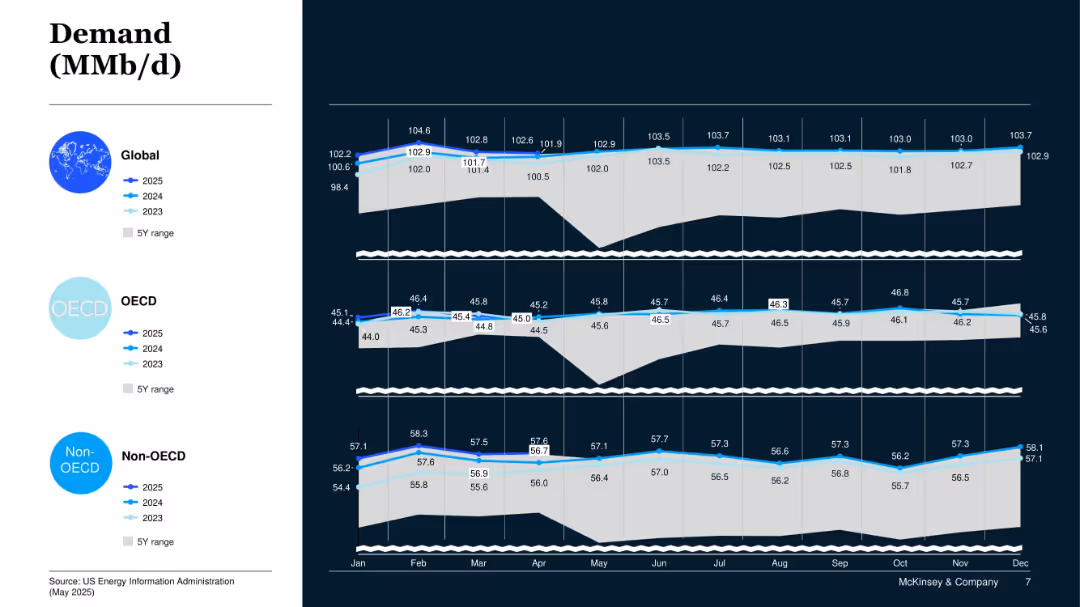
Layered line area chart across three panels: Global, OECD, Non-OECD; shows 2023–2025 demand outlook and 5Y range.
Market Analysis and Trends
Energy & Utilities
This slide compares global oil demand trends across OECD and non-OECD regions. It indicates steady global demand growth led by non-OECD consumption.
Oil Demand, OECD, Non-OECD, Global Energy, Consumption Forecast, 2025 Outlook
false
Market Analysis and Trends
Energy & Utilities
Mixed Chart
McKinsey
Add to my slides
Remove from favorites
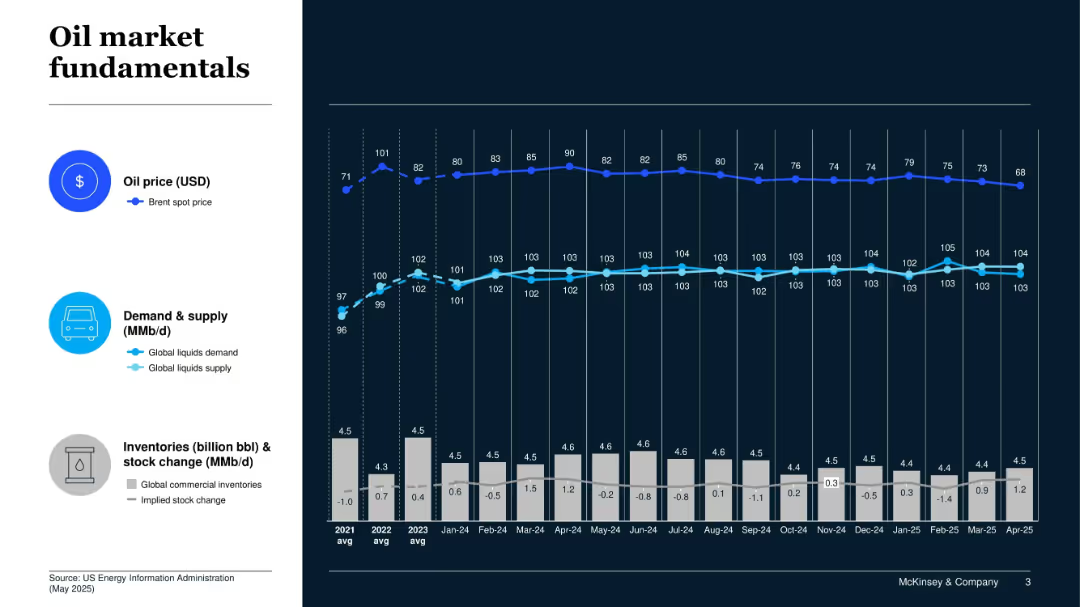
Multi-line and bar combo chart on a dark background; shows Brent price, demand/supply, and inventories over time.
Market Analysis and Trends
Energy & Utilities
This slide presents the key fundamentals of the oil market from 2021 to 2025, including price trends, supply-demand balance, and inventory levels. It reveals falling prices despite stable demand and supply.
Oil Price, Supply-Demand, Inventories, Brent Spot Price, Global Liquids, Energy Market, Stock Change
false
Market Analysis and Trends
Energy & Utilities
Mixed Chart
McKinsey
Add to my slides
Remove from favorites
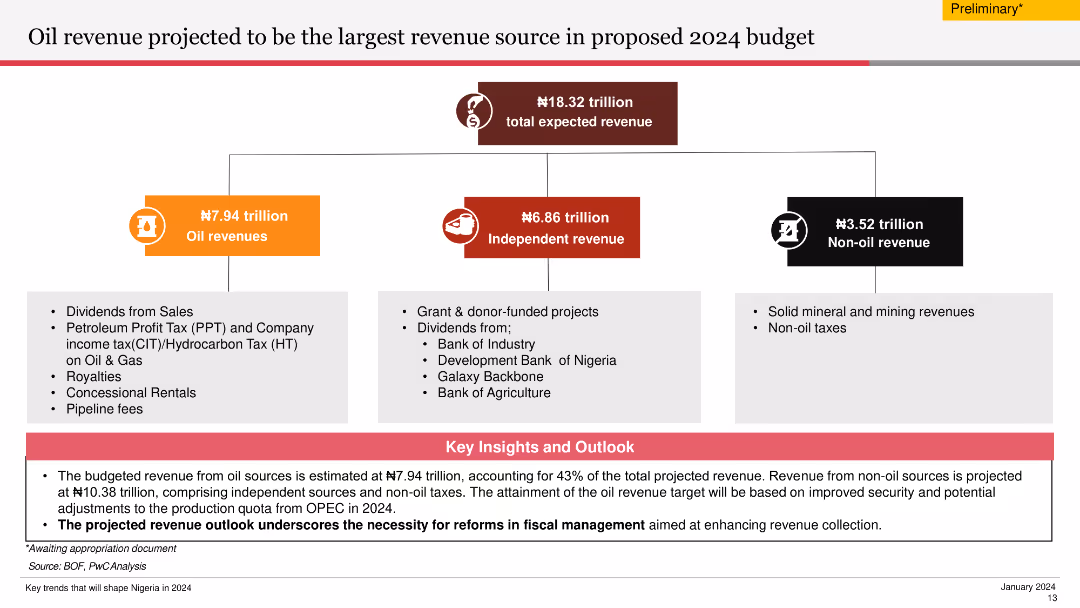
The slide uses a flowchart to illustrate projected oil revenues and other revenue sources for the 2024 budget. It is moderately complex, with a focus on clear and structured information.
Market Analysis and Trends
Energy & Utilities
The slide outlines the projected oil revenue for the 2024 budget, showing the distribution of revenue sources and emphasizing the need for fiscal management reforms.
Oil Revenue, Projection, Budget, Fiscal, Sources
false
Market Analysis and Trends
Energy & Utilities
Diagram
PwC/Strategy&
Add to my slides
Remove from favorites
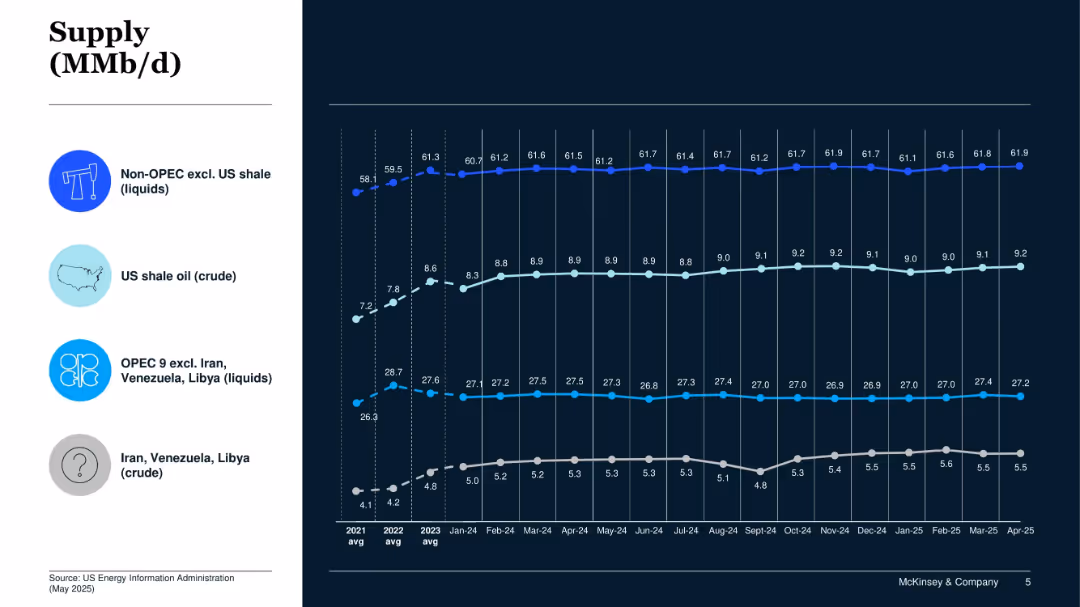
Line chart tracking four major oil supply sources over time on dark background, including Non-OPEC, OPEC, US shale, and others.
Operational Efficiency
Energy & Utilities
This slide visualizes global oil supply dynamics from major sources over time. It highlights steady increases in non-OPEC and US shale outputs, with some fluctuation in OPEC nations.
Oil Supply, Non-OPEC, OPEC, Shale Oil, Energy Production, Crude Oil
false
Operational Efficiency
Energy & Utilities
Mixed Chart
McKinsey
Add to my slides
Remove from favorites
Contains a mix of text and a column chart titled 'Copernicus economic impact (2018)'. The layout is balanced with clear separation between textual information and visual data representation.
Market Analysis and Trends
Energy & Utilities
Discusses the economic impact of the oil and gas industry with a focus on the Copernicus program's contribution, highlighting sectors such as exploration and monitoring with benefits like cost savings and risk reduction.
Oil and Gas, Economic Impact, Exploration
false
Market Analysis and Trends
Energy & Utilities
Mixed Chart
PwC/Strategy&
Add to my slides
Remove from favorites
Includes a line graph showing 'Growth in world oil supply and demand', and extensive text explaining the current status and challenges of the oil and gas sector post-market collapse.
Industry Overview
Energy & Utilities
Analyzes the recovery trends in the oil and gas industry, noting new projects and changes in market dynamics, alongside challenges like decline in new discoveries and geopolitical issues.
Oil and Gas, Recovery, Challenges, Market Trends
false
Industry Overview
Energy & Utilities
Mixed Chart
PwC/Strategy&
Add to my slides
Remove from favorites
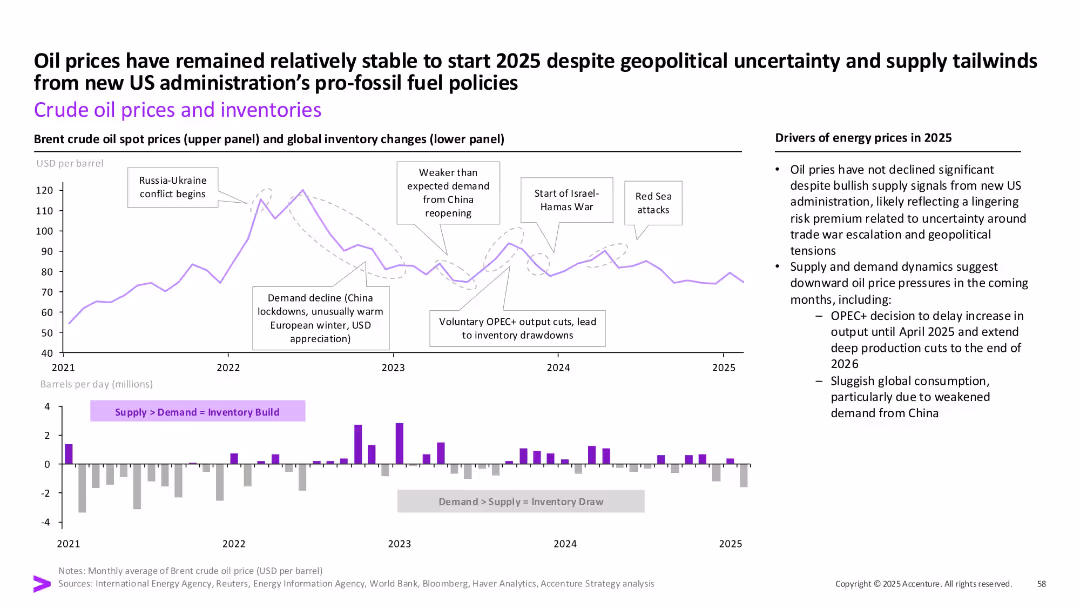
Two-panel chart: oil price trends and inventory changes. Includes timeline of events and commentary on the right.
Market Analysis and Trends
Energy & Utilities
This slide illustrates crude oil price stability entering 2025 despite geopolitical instability and policy changes. It also charts inventory dynamics influenced by OPEC+ decisions and demand shifts, especially from China.
Oil prices, inventory, OPEC, geopolitics, Red Sea, demand, energy policy, consumption
false
Market Analysis and Trends
Energy & Utilities
Multiple Chart
Accenture
Add to my slides
Remove from favorites
The slide includes a column chart and text blocks. It details oil and gas net lending exposures by geography, division, rating, and segment.
Risk Assessment and Management
Financial Services
This slide analyzes the oil and gas exposure, showing a reduction in exposure and the distribution across different segments, used for managing and assessing financial risks in the energy sector.
Oil, Gas, Exposure, Risk, Lending
false
Risk Assessment and Management
Financial Services
Mixed Chart
UBS
Add to my slides
Remove from favorites
The slide contains a column chart illustrating the global crude oil demand (mmbpd) from 2022 to 2050, with segments for Aviation, Petrochemicals, Transport, Residential, Power, and Industrial. The chart shows a notable decline in demand post-2030, particularly in the transport sector.
Strategic Planning
Energy & Utilities
This slide discusses the transition from traditional oil and gas to greener alternatives. It projects a significant reduction in global crude oil demand by 2050, driven mainly by declines in the transport sector, and highlights the shift towards cleaner energy sources.
Oil, Gas, Green, Transition, Demand, 2050, Crude, Decline
false
Strategic Planning
Energy & Utilities
Mixed Chart
EY
Add to my slides
Remove from favorites
The slide includes a bar chart illustrating the evolution of the oil and gas portfolio (illustrative) from 2022 to 2050. Segments include Synthetic Fuels, Hydrogen and Ammonia, Biofuels and Biogas, Renewable Power, Natural with CCUS offsets, and Crude Oil with CCUS offsets.
Strategic Planning
Energy & Utilities
This slide presents an illustrative forecast of the future energy portfolio of major oil and gas companies, showing a shift towards renewable and decarbonized energy sources by 2050. It emphasizes the diversification of energy sources to meet energy transition goals.
Oil, Gas, Portfolio, Evolution, Renewable, 2050, Decarbonization
false
Strategic Planning
Energy & Utilities
Mixed Chart
EY
Add to my slides
Remove from favorites
Slide is a table layout detailing figures, with clear demarcation and legible text.
Risk Assessment and Management
Energy & Utilities
Analyzes BBVA's exposure to the Oil & Gas sector, with a breakdown by region and subsegment.
Oil, Gas, exposure, BBVA, risk
false
Risk Assessment and Management
Energy & Utilities
Table
Morgan Stanley
Add to my slides
Remove from favorites
Two column charts showing Brent and WTI price estimates from banks and brokers. Each chart has consultant and bank/broker ranges with data points from 2020 to 2024.
Market Analysis and Trends
Energy & Utilities
This slide forecasts higher oil prices for Brent and WTI, with consultant ranges suggesting long-term sustainable prices. Provides average price per barrel estimates.
Oil, price, forecast, Brent, WTI, bank, broker, consultant, estimate, range
false
Market Analysis and Trends
Energy & Utilities
Multiple Chart
EY
Add to my slides
Remove from favorites
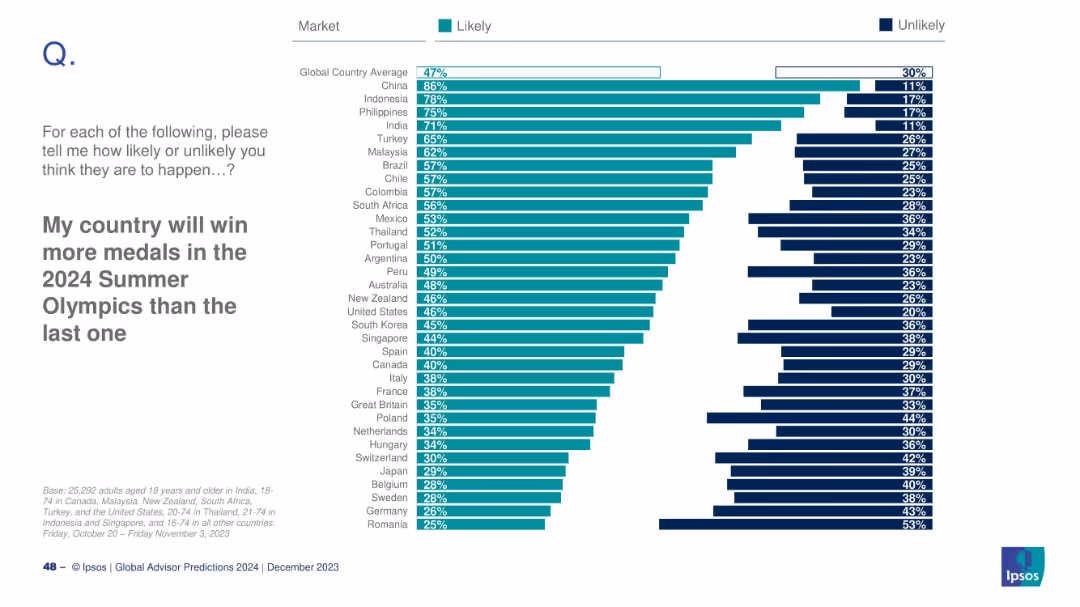
Horizontal bar chart of Likely/Unlikely responses per country; includes global average.
Strategic Planning
Media & Entertainment
The slide captures national confidence in Olympic performance for 2024. China (86%) leads expectations, while Romania (25%) ranks lowest. The global average is 47%. This reflects sports optimism and national pride ahead of the Summer Olympics.
Olympics, sports prediction, national pride, medal tally, 2024 games, public opinion, Ipsos, country comparison, athletic performance, sentiment
false
Strategic Planning
Media & Entertainment
Mixed Chart
IPSOS
Add to my slides
Remove from favorites
Slide with a mix of icons, text, and percentages. It displays digital log-ins, a branch network, and personnel details, all contributing to an omnichannel banking experience.
Operational Efficiency
Financial Services
Describes the digital and physical banking services provided by Chase, emphasizing the scope and reach of their offerings to serve clients through various channels.
Omnichannel, Digital, Physical Network, Chase, Banking, Client Service, Multi-channel, Relationship Management
false
Operational Efficiency
Financial Services
Framework
JP Morgan
Add to my slides
Remove from favorites
The slide includes two columns of text with accompanying images, trend assessments with bar charts for impact and time of adoption.
Technology and Digital Transformation
Retail & E-commerce
Describes omnichannel shopping and instant shopping, emphasizing seamless customer experiences across different channels.
Omnichannel, Instant Shopping, Customer Experience, Retail, Shopping Experience, Real-time Data, Omnichannel Strategies
false
Technology and Digital Transformation
Retail & E-commerce
Mixed Chart
Deloitte
Add to my slides
Remove from favorites
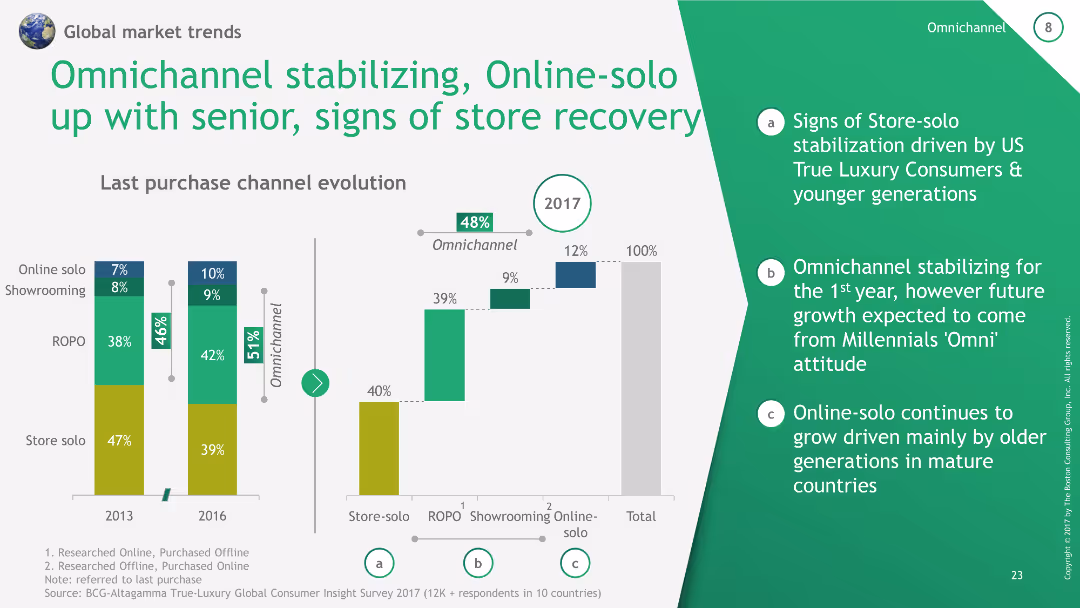
The slide contains a column chart showing last purchase channel evolution from 2013 to 2017, with annotations explaining the trends.
Market Analysis and Trends
Retail & E-commerce
The slide discusses the stabilization of omnichannel and the growth of online-solo purchases among seniors, highlighting store recovery signs.
Omnichannel, Online-solo, Store recovery, Trends, Retail
false
Market Analysis and Trends
Retail & E-commerce
Multiple Chart
BCG
Add to my slides
Remove from favorites
The slide presents bar graphs comparing current and future use of digital services. It has a title, a subtitle, and a source citation at the bottom.
Market Analysis and Trends
Retail & E-commerce
The slide shows the usage of digital services during COVID-19, with an expectation that consumers will continue using these services post-pandemic.
Omnichannel, Retail, COVID-19, Digital Services, Consumer Behavior, Future Trends, Bar Graphs, Usage Statistics
false
Market Analysis and Trends
Retail & E-commerce
Mixed Chart
Accenture
Add to my slides
Remove from favorites
Divided into two main sections with text, the slide features an image of a woman looking at merchandise in the lower left corner. The right side of the slide emphasizes 'no-regret' moves businesses can make.
Strategic Planning
Retail & E-commerce
Provides a strategic framework for creating an integrated channel strategy that addresses customer needs and drives lifetime loyalty. It's intended for businesses seeking to blend online and offline retail experiences seamlessly. The slide suggests starting with understanding consumers and driving towards lifetime loyalty to build a strong omnichannel retail presence, offering steps to remove barriers to conversion, and considering future physical retail space requirements.
Omnichannel, Retail, Strategy, Consumers, Loyalty
false
Strategic Planning
Retail & E-commerce
Boxed
Bain
Add to my slides
Remove from favorites
A bubble chart showing the growth and CARG (2020-2025) of different IT services, categorized by 'Run,' 'Build,' and 'Design.' Each bubble represents a service category with varying sizes indicating their market impact.
Technology and Digital Transformation
Technology & Software
This slide illustrates the transition from on-premise to cloud services, highlighting the growth rates and market sizes of different IT service categories, aiding in strategic planning for digital transformation.
On-Prem to Cloud, IT Services, Growth, Digital Transformation, Market Impact
false
Technology and Digital Transformation
Technology & Software
Single Chart
Gartner
Add to my slides
Remove from favorites
The slide includes bar charts comparing on-farm storage costs and capacity in Australia, Canada, and Ukraine, along with contextual notes.
Operational Efficiency
Agriculture & Food Production
The slide highlights Australia's limited on-farm storage capacity compared to Canada and Ukraine, discussing the cost advantages and market impacts of this limitation.
On-farm storage, Australia, Canada, Ukraine, storage costs, storage capacity, agriculture, food production, operational efficiency
false
Operational Efficiency
Agriculture & Food Production
Multiple Chart
LEK
Add to my slides
Remove from favorites
Displays a split bar chart contrasting online and offline penetration in grocery vs. non-grocery e-commerce, accompanied by explanatory text.
Market Analysis and Trends
Retail & E-commerce
This slide identifies online grocery as a relatively untapped segment within e-commerce, presenting it as an area ripe for growth and innovation. It might be used to argue for investment in online grocery platforms or to inform strategic moves within the retail sector.
Online Grocery, E-commerce, Opportunity
false
Market Analysis and Trends
Retail & E-commerce
Mixed Chart
Bain
Add to my slides
Remove from favorites
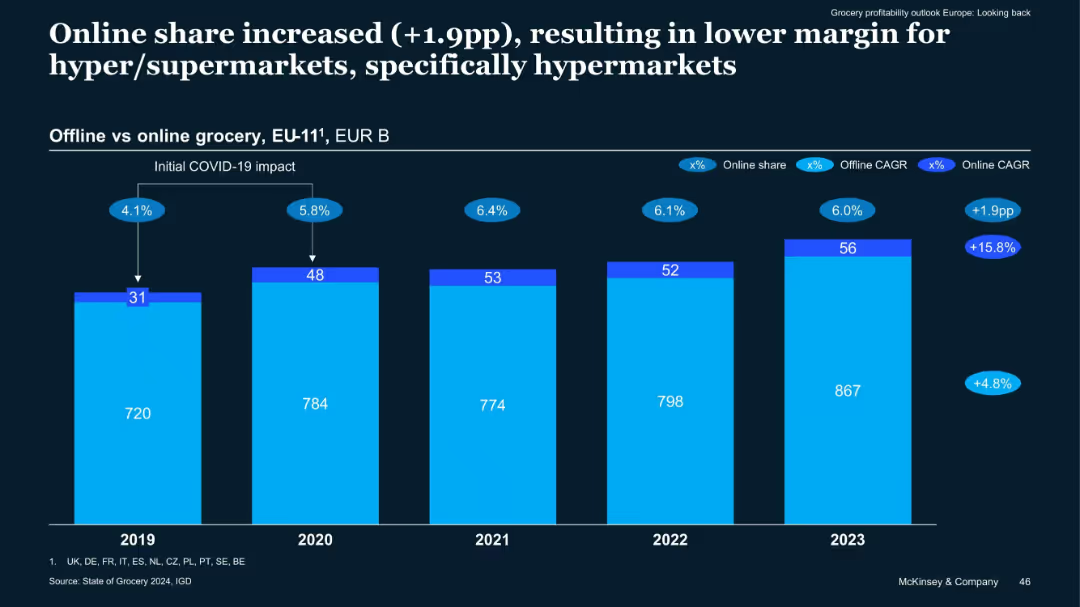
Stacked bar chart of online vs offline grocery sales (EUR B) from 2019–2023
Market Analysis and Trends
Retail & E-commerce
Online grocery sales grew by 1.9 percentage points from 2019 to 2023 in EU-11, with a high CAGR, affecting hypermarket margins. The trend reflects post-COVID consumer behavior favoring convenience, despite operational challenges for large-format retailers.
Online Grocery, Offline Sales, EU-11, E-commerce Growth, Hypermarkets
false
Market Analysis and Trends
Retail & E-commerce
Single Chart
McKinsey
Add to my slides
Remove from favorites
Features a funnel diagram and pie charts to show the influence of online interactions on luxury purchases from 2018 to 2025.
Technology and Digital Transformation
Retail & E-commerce
Explores how digital platforms influence the luxury goods purchasing process, predicting that by 2025, online interactions will affect almost every luxury purchase and enable half of them through technologies like VR and IoT.
Online Influence, Luxury Purchases, Digital Transformation
false
Technology and Digital Transformation
Retail & E-commerce
Multiple Chart
Bain
Add to my slides
Remove from favorites
The slide features a box plot and a column chart displaying the distribution of average daily time spent on online intermediaries. Two tables provide detailed statistics about the average time and proportion of online time spent.
Market Analysis and Trends
Telecommunications
This slide presents data on the average daily time spent on Online Intermediaries (OIs), showing detailed statistics, including the mean, median, and percentile distributions, based on panelist data from Ipsos Iris Clickstream Data.
Online Intermediaries, Daily Time, Statistics, Box Plot, Column Chart
false
Market Analysis and Trends
Telecommunications
Mixed Chart
IPSOS
Add to my slides
Remove from favorites
Shows a column chart for online media GMV with a detailed breakdown of sub-sectors like video, gaming, and music.
Market Analysis and Trends
Media & Entertainment
The slide presents a comprehensive look at the online media industry, indicating strong growth amidst changing consumption patterns due to the pandemic. It can inform media companies' strategic planning, especially in areas like video streaming and gaming.
Online Media, GMV, Growth, Trends
false
Market Analysis and Trends
Media & Entertainment
Mixed Chart
Bain
Add to my slides
Remove from favorites
Contains multiple column charts comparing the market share of different retail channels for luxury goods from 2014 to 2025, with an emphasis on the growth of online sales.
Technology and Digital Transformation
Retail & E-commerce
Analyzes the trend towards online shopping for luxury goods, projecting significant growth and integration with physical retail channels by 2025. Discusses how technology will enhance shopping experiences.
Online Shopping, Luxury Goods, Market Trends, Growth
false
Technology and Digital Transformation
Retail & E-commerce
Mixed Chart
Bain
Add to my slides
Remove from favorites
The slide is a vibrant mix of textual content and complementary visuals, including bar graphs and stylized illustrations. It's divided into segments showing statistics and user activities.
Customer and Market Segmentation
Technology & Software
It details the value derived by Australian households from conducting essential tasks and engaging in enrichment activities online, highlighting the nbn™ network's impact on their lives.
Online Tasks, Entertainment, Socializing, nbn, Value, Connectivity, Remote Work, Market Segmentation
false
Customer and Market Segmentation
Technology & Software
Mixed Chart
Accenture
Add to my slides
Remove from favorites
Comprises of column charts with future projections for online travel subcategories, and bullet points explaining the data.
Market Analysis and Trends
Hospitality & Tourism
Provides a detailed outlook on the online travel industry, including expectations for recovery and growth post-pandemic. This slide is pertinent for travel industry professionals and investors for planning and strategizing around the anticipated market changes.
Online Travel, Forecast, Pandemic
false
Market Analysis and Trends
Hospitality & Tourism
Mixed Chart
Bain
Add to my slides
Remove from favorites
Depicts multiple bar charts showing the increase in online adoption across various retail categories, with a particular focus on groceries.
Market Analysis and Trends
Retail & E-commerce
Details the significant increase in online retail adoption in Southeast Asia, with an emphasis on the rapid rise of online grocery shopping.
Online adoption, retail categories, Southeast Asia, groceries, bar chart
false
Market Analysis and Trends
Retail & E-commerce
Multiple Chart
Bain
Add to my slides
Remove from favorites
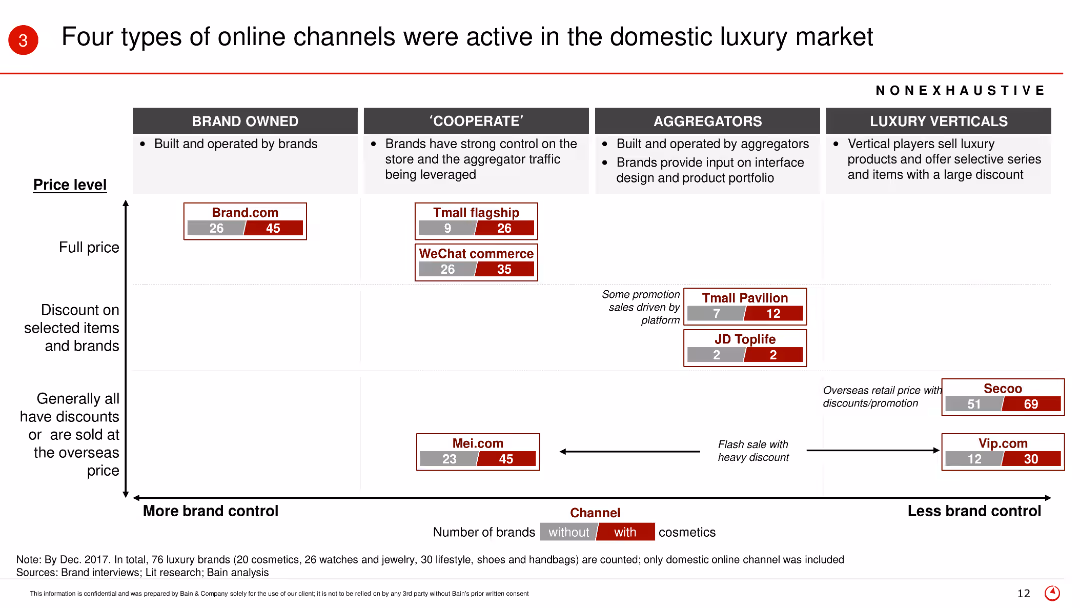
The slide presents a matrix chart categorizing online channels into brand owned, cooperate, aggregators, and luxury verticals, with various metrics such as price level and number of brands with/without cosmetics.
Market Analysis and Trends
Retail & E-commerce
This slide categorizes the different types of online channels in the luxury market, explaining their price levels and brand control, highlighting the role of cosmetics in each category.
Online channels, luxury market, brand control, cosmetics, price level, domestic market
false
Market Analysis and Trends
Retail & E-commerce
Table
Bain
Add to my slides
Remove from favorites
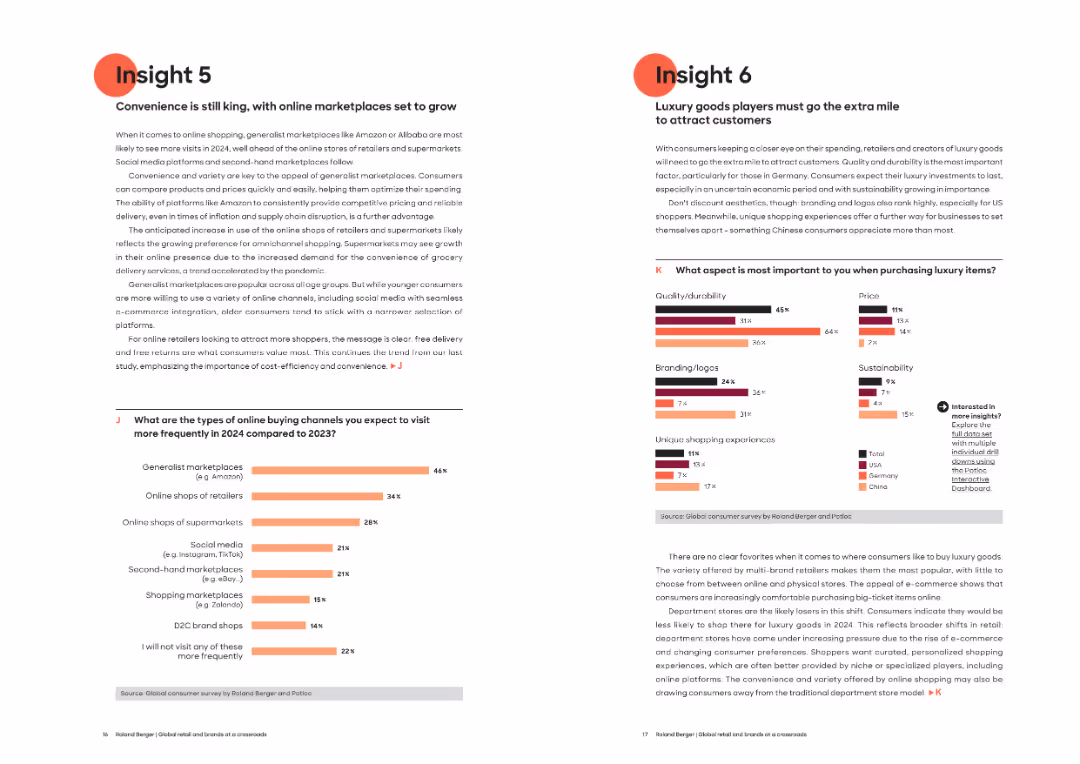
Two-column split slide, each side with a chart and a few paragraphs. Consistent use of red highlights and structured formatting for clarity.
Market Analysis and Trends
Retail & E-commerce
Insight 5 discusses the growing dominance of generalist marketplaces like Amazon for online shopping due to convenience and cost. Insight 6 focuses on luxury goods purchasing drivers, noting quality, sustainability, and unique experiences as critical factors.
Online marketplaces, luxury goods, consumer behavior, shopping trends, generalist platforms, branding, sustainability, price sensitivity
false
Market Analysis and Trends
Retail & E-commerce
Multiple Chart
Roland Berger
Add to my slides
Remove from favorites
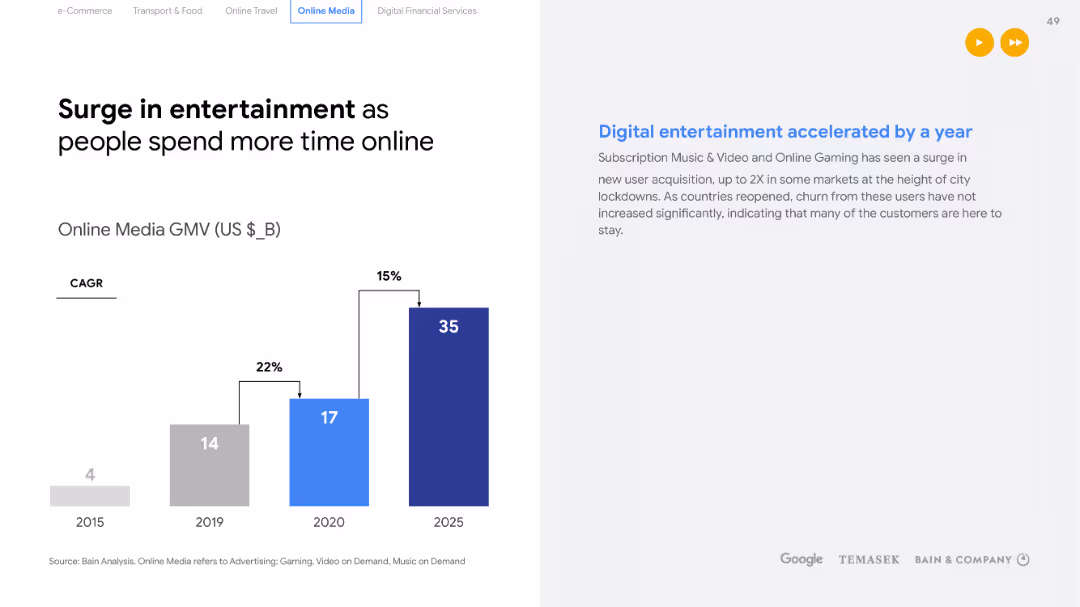
Bar chart displaying the GMV for Online Media from 2015 to a 2025 forecast, with a breakdown of different online media types. Text on the right outlines the acceleration of digital entertainment during the pandemic.
Market Analysis and Trends
Technology & Software
Forecasts growth in the online media sector and highlights the acceleration of digital entertainment adoption due to the pandemic. Useful for media companies and investors looking at digital trends and customer retention post-pandemic.
Online media, Digital entertainment, Growth forecast, Pandemic impact, Customer retention
false
Market Analysis and Trends
Technology & Software
Single Chart
Bain
Add to my slides
Remove from favorites
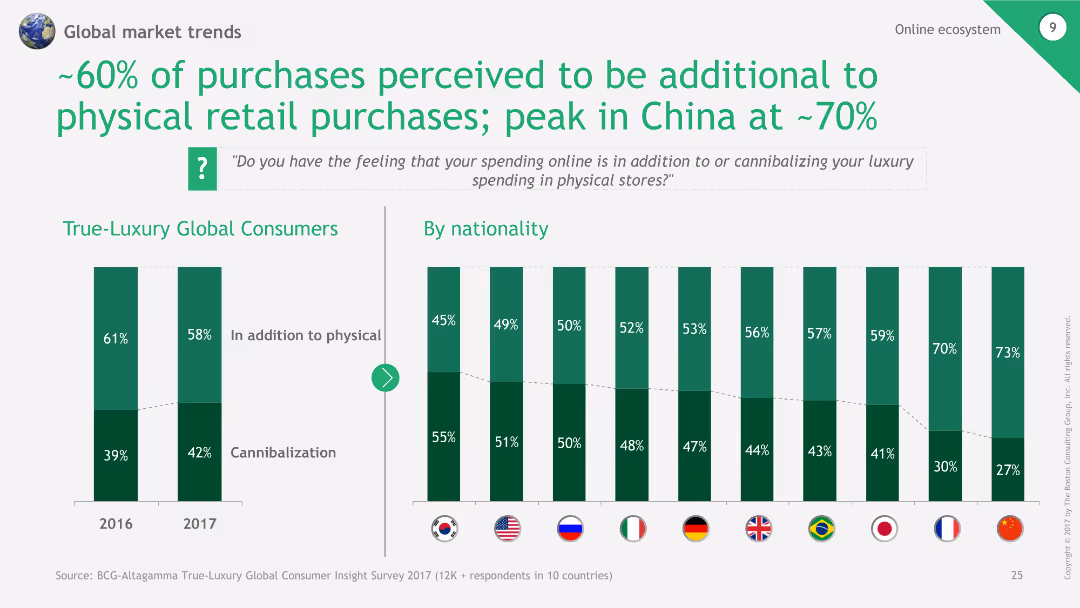
The slide features a column chart showing perceptions of online spending in addition to physical purchases, segmented by nationality.
Market Analysis and Trends
Retail & E-commerce
The slide examines the perception that a significant portion of online purchases adds to physical retail, with a peak in China.
Online purchases, Physical retail, China, Perception, Nationality
false
Market Analysis and Trends
Retail & E-commerce
Multiple Chart
BCG
Add to my slides
Remove from favorites
Utilizes a bar graph to display the growth in the number of categories purchased online by consumers in Southeast Asia, comparing 2019 and 2020 data.
Customer and Market Segmentation
Retail & E-commerce
Demonstrates the broadening of online purchases among Southeast Asian consumers, who are expanding the variety of categories they buy from.
Online purchases, consumer expansion, Southeast Asia, category growth, graph
false
Customer and Market Segmentation
Retail & E-commerce
Single Chart
Bain
Add to my slides
Remove from favorites
Combines informative text with simple iconography to contrast the growth of online retail markets in Southeast Asia and India.
Competitive Landscape
Retail & E-commerce
Analyzes the recent developments in the online retail market in Southeast Asia, demonstrating how it has outpaced India's growth.
Online retail, market analysis, Southeast Asia, India, comparative growth
false
Competitive Landscape
Retail & E-commerce
Single Chart
Bain
Add to my slides
Remove from favorites
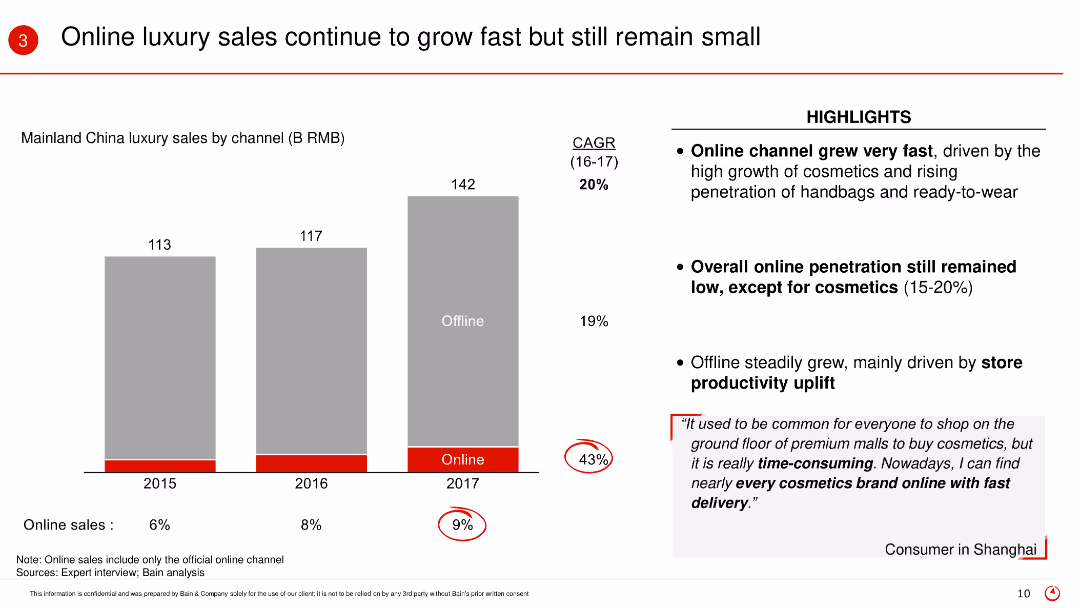
The slide contains a column chart showing Mainland China luxury sales by channel from 2015 to 2017, highlighting online and offline sales. Key points are highlighted in red circles, and there is a text box with consumer feedback.
Market Analysis and Trends
Retail & E-commerce
The slide discusses the growth of online luxury sales in Mainland China, emphasizing the faster growth of online channels compared to offline, and includes consumer insights about shopping preferences.
Online sales, luxury market, China, growth, consumer behavior, sales channels, CAGR
false
Market Analysis and Trends
Retail & E-commerce
Mixed Chart
Bain
Add to my slides
Remove from favorites
Features a large bar graph with color-coding to denote the digital consumer population growth across Southeast Asian countries, contrasting 2019 and 2020 data.
Market Analysis and Trends
Retail & E-commerce
Discusses the migration of offline shoppers to online platforms in Southeast Asia with Indonesia seeing the highest increase in digital consumers.
Online shopping, Southeast Asia, digital consumers, Indonesia, graph
false
Market Analysis and Trends
Retail & E-commerce
Single Chart
Bain
Add to my slides
Remove from favorites
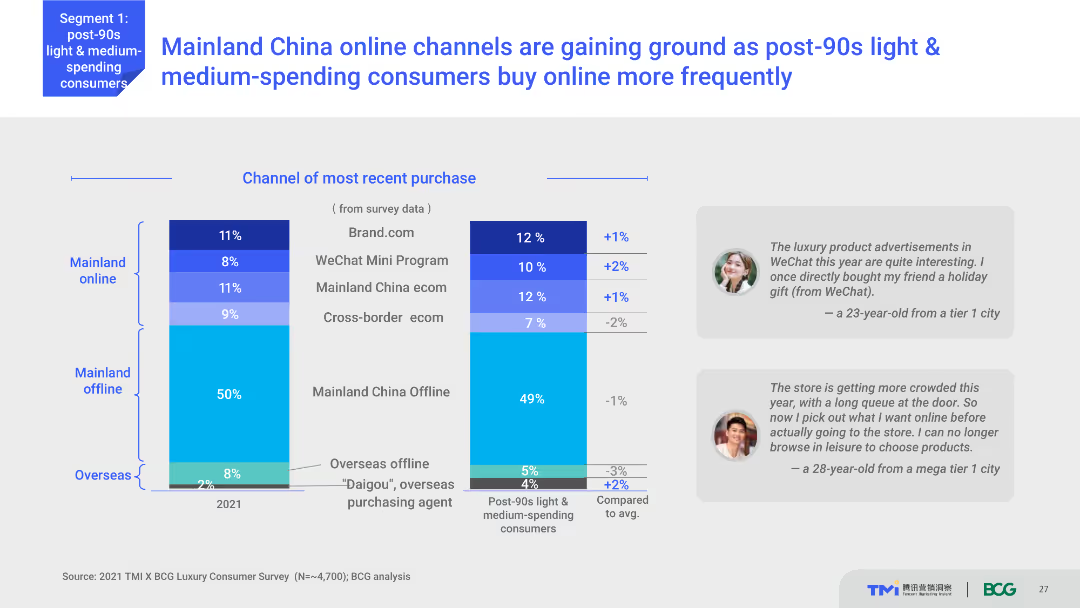
Column chart showing the most recent purchase channels for Mainland China and Overseas. The chart compares percentages between online and offline purchases in 2021. Text boxes with user quotes are placed beside the chart.
Market Analysis and Trends
Retail & E-commerce
Shows the shift in purchase behavior of post-90s light and medium-spending consumers in Mainland China towards online channels. Indicates the percentages of purchases through different online and offline channels.
Online shopping, consumer behavior, China, retail trends, WeChat Mini Program
false
Market Analysis and Trends
Retail & E-commerce
Multiple Chart
BCG
Add to my slides
Remove from favorites
Features percentage data with bar charts and icons to emphasize the increase in online shopping for essentials, particularly groceries, in Southeast Asia.
Market Analysis and Trends
Retail & E-commerce
Highlights the mainstream adoption of online shopping for essential goods, such as groceries, in Southeast Asia, underscoring the impact of digital adoption on consumer habits.
Online shopping, essentials, groceries, mainstream, Southeast Asia
false
Market Analysis and Trends
Retail & E-commerce
Single Chart
Bain
Add to my slides
Remove from favorites
Contains multiple bar graphs comparing platform usage over two years across different Southeast Asian countries, with a clear legend and annotations.
Customer and Market Segmentation
Retail & E-commerce
Shows the increase in the average number of online platforms used per person in Southeast Asia from 2021 to 2022.
Online shopping, user data, SEA
false
Customer and Market Segmentation
Retail & E-commerce
Boxed
Bain
Add to my slides
Remove from favorites
This slide features a pie chart and a series of color-coded bars, showcasing the distribution and average online spending of different types of online spenders along with the categories they spend on.
Customer and Market Segmentation
Retail & E-commerce
It profiles online spenders by their spending habits, categorizing them as low, medium, or high. It also identifies the proportion of their total spendings online and the types of categories they are likely to purchase from.
Online spending, consumer behavior, e-commerce
false
Customer and Market Segmentation
Retail & E-commerce
Single Chart
BCG
Add to my slides
Remove from favorites
A slide with a dual focus on textual explanation and bar charts, predicting the future online spending in Southeast Asia and comparing it with past forecasts.
Financial Performance
Retail & E-commerce
Forecasts a dramatic increase in online spending within Southeast Asia by 2025, with detailed expectations of consumer spending growth.
Online spending, forecast, Southeast Asia, consumer behavior, bar chart
false
Financial Performance
Retail & E-commerce
Multiple Chart
Bain
Add to my slides
Remove from favorites
Featuring horizontal bars, this slide contrasts the user base numbers in 2017 with the estimated figures for 2020E across multiple sectors, highlighting the expected growth.
Market Analysis and Trends
Retail & E-commerce
The slide indicates the projected increase in the online spender base across various sectors, with estimated growth rates suggesting a 2-3x increase, thus providing insights into consumer behavior trends.
Online spending, user base growth, sector comparison
false
Market Analysis and Trends
Retail & E-commerce
Single Chart
BCG
Add to my slides
Remove from favorites
Features several bar graphs, a large numeric callout, and additional textual explanations. The slide is data-intensive with a focus on specific metrics.
Market Analysis and Trends
Technology & Software
Analyzes factors contributing to the increase in the number of online transactions in the SEA ecommerce market, such as internet penetration and consumer sentiment, and the impact on the ecommerce market size.
Online transactions, growth drivers, SEA, ecommerce market, bar graphs
false
Market Analysis and Trends
Technology & Software
Multiple Chart
Bain
Add to my slides
Remove from favorites
Bar chart on the left, depicting online travel GMV (Gross Merchandise Value) across three segments with forecast for 2025. Right side text describing the online travel trends, recovery signs, and the growth of online penetration.
Market Analysis and Trends
Technology & Software
Details the financial impact of COVID-19 on the online travel industry and projects future growth. Useful for investors and businesses within the online travel sector for strategic planning and understanding the pace of market recovery.
Online travel, COVID-19 impact, Market recovery, Growth projection, GMV
false
Market Analysis and Trends
Technology & Software
Mixed Chart
Bain
Add to my slides
Remove from favorites
This slide comprises column chart comparing efficiency ratios, a detailed table of financial results, and a list of highlights. It has a moderate level of visual complexity with a structured layout.
Operational Efficiency
Financial Services
Discusses the company’s expenses in various categories and highlights efficiency ratios. This type of slide is valuable in operational reviews, financial planning, or stakeholder meetings for insight into cost management and identifying areas for efficiency improvements.
Operating Expenses, Compensation, Efficiency Ratio, Tax Rate
false
Operational Efficiency
Financial Services
Mixed Chart
Goldman Sachs
Add to my slides
Remove from favorites
The slide features three column charts showing adjusted revenues, operating expenses, and pre-tax loss progression over several quarters. Text details the strategies and outcomes related to operating expense reductions and portfolio valuation risks.
Financial Performance
Financial Services
Explains the improvement in adjusted pre-tax loss through the reduction of operating expenses and portfolio valuation risks. The column charts show the financial progression across quarters, supported by text that details the specific strategies implemented and their impact on financial performance.
Operating Expenses, Portfolio, Risk, Financial Performance, Reduction
false
Financial Performance
Financial Services
Multiple Chart
Credit Suisse
Add to my slides
Remove from favorites
A column chart representing income statements for various operating groups, paired with a text block describing key drivers. The layout is clean with contrasting colors for easy differentiation.
Financial Performance
Financial Services
Evaluates financial performance by operating group, highlighting contributions and key factors driving results. It is used to understand divisional performance within the overall corporate structure.
Operating Groups, Financial Performance, Net Profit Contribution, Key Drivers, Analysis
false
Financial Performance
Financial Services
Mixed Chart
Goldman Sachs
Add to my slides
Remove from favorites
Slide includes a table with different metrics like 'Revenue' and 'Expense' plotted over three years, supplemented with trend arrows and brief annotations.
Operational Efficiency
Financial Services
JP Morgan's improvement in operating leverage over time is conveyed, highlighting investment, expense, and headcount trends. It's designed for financial analysis and illustrating efficiency improvements to investors or analysts.
Operating Leverage, Revenue, Expense, Efficiency, Investment
false
Operational Efficiency
Financial Services
Table
JP Morgan
Add to my slides
Remove from favorites
Includes a table comparing medium-term trends across different financial sectors, with icons indicating trend directions and notes on the side.
Market Analysis and Trends
Financial Services
Used to compare medium-term revenue trends and market forecasts for strategic planning or investment guidance.
Operating Outlook, Organic Revenue, Margin Trend, ROIC, Financial Sectors, Forecasting
false
Market Analysis and Trends
Financial Services
Table
Goldman Sachs
Add to my slides
Remove from favorites
This slide presents a three-pillar plan with icons and text in a horizontal layout. Each pillar has a different icon—chart, gear, and mobile phone—representing operating performance, capital allocation, and digitalisation respectively. The slide is visually simple, with a grey and blue color palette and uses the Santander logo at the top. The slide footer includes a confidentiality notice and a slide number.
Strategic Planning
Financial Services
The slide outlines Santander's strategic approach for growth, focusing on operational efficiency, optimal capital distribution, and accelerating digital transformation. This would be relevant in strategic planning meetings or stakeholder briefings to discuss future directions and priorities.
Operating Performance, Capital Allocation, Digitalisation, Santander, Strategic Growth, Profitability, Banking Strategy, Financial Services
false
Strategic Planning
Financial Services
Pillar
Morgan Stanley
Add to my slides
Remove from favorites
Column chart showing changes in operating expenses from 9M21 to 9M22 with text explanations of cost factors.
Financial Performance
Financial Services
Highlights the operating expenses over a period, detailing components like FX, litigation, and variable compensation.
Operating expenses, FX, litigation, variable compensation, 9M22, cost strategy, financial performance, UBS
false
Financial Performance
Financial Services
Mixed Chart
UBS
Add to my slides
Remove from favorites
Column charts depicting operating expenses over three years, alongside metrics on digital transformation and branch closures.
Operational Efficiency
Financial Services
Details the reduction in operating expenses and highlights initiatives in digital transformation and efficiency improvements.
Operating expenses, digital transformation, efficiency, branch closures, expenses reduction
false
Operational Efficiency
Financial Services
Multiple Chart
Credit Suisse
Add to my slides
Remove from favorites
Diagram listing the top 10 levers for operational efficiency, including product portfolio, R&D, procurement, production, logistics, sales & marketing, and service & after-sales.
Strategic Planning
Financial Services
The slide presents the top 10 operational efficiency levers for 2019, focusing on key areas such as cost improvement in the product portfolio, material cost reduction, and production efficiency. It highlights the strategic initiatives that companies are prioritizing to enhance their competitiveness and operational performance.
Operational Efficiency, Cost Improvement, 2019
false
Strategic Planning
Financial Services
Table
Roland Berger
Add to my slides
Remove from favorites
This slide includes multiple triangular diagrams illustrating the impact of technology, process, data, and talent on operational maturity. The visuals are effectively used to compare the influence of each factor.
Strategic Planning
Professional Services
Highlights how different operational levers affect the maturity and efficiency of business operations. Essential for strategic decision-making and resource allocation in organizational development.
Operational Efficiency, Maturity Levels, Strategy
false
Strategic Planning
Professional Services
Mixed Chart
Accenture
Add to my slides
Remove from favorites
Displays a multi-layered diagram categorizing operational maturity into four levels: Stable, Efficient, Predictive, and Future-ready. Each level is described with respect to technology, process, data, and talent.
Operational Efficiency
Professional Services
Describes different levels of operational maturity in organizations and their implications on business efficiency and future readiness. Useful for consultants and managers aiming to enhance operational strategies.
Operational Maturity, Business Strategy, Efficiency
false
Operational Efficiency
Professional Services
Table
Accenture
Add to my slides
Remove from favorites
Minimal text with four distinct blocks each containing a strategic focus area, supported by icons.
Strategic Planning
Financial Services
Focuses on the company’s operational strategy elements, from client-centric structure to accountability. Useful for presenting organizational strategy updates.
Operational Strategy, Client-Centric, Growth, Accountability, Financial Planning, Business
false
Strategic Planning
Financial Services
Table
Goldman Sachs
Add to my slides
Remove from favorites
Contains bullet points summarizing operational highlights and growth strategies, accompanied by a column chart of revenue growth with recurring and non-recurring figures.
Strategic Planning
Technology & Software
Likely serves as an executive summary, detailing key strategies and financial growth for a company.
Operational, Growth, Strategy, Revenue, Recurring, Non-recurring, Highlights, Financial
false
Strategic Planning
Technology & Software
Mixed Chart
Goldman Sachs
Add to my slides
Remove from favorites
An intricate network diagram on a dark background illustrates client and personnel connections, with color-coded dots and sector labels demonstrating operational strategies.
Operational Efficiency
Financial Services
The slide operationalizes the organization's approach, showing connectivity and key areas like collaboration and infrastructure between clients and staff.
Operational, Strategy, Clients, Personnel, Investment, Banking, Asset, Management
false
Operational Efficiency
Financial Services
Uncategorized
Goldman Sachs
Add to my slides
Remove from favorites
Bar and column charts, text breakdown, three-column layout.
Operational Efficiency
Financial Services
Operational cost breakdown and efficiency for 2021 and 2022, with outlook for 2023.
Operational, efficiency, cost, investments, overhead, revenue, structure, banking
false
Operational Efficiency
Financial Services
Single Chart
JP Morgan
Add to my slides
Remove from favorites
The slide features a mix of text and bar charts with segmented pie charts displaying data on respondents' functions and industries.
Operational Efficiency
Industrial & Manufacturing
The slide presents an overview of the Operations Efficiency Radar study, focusing on manufacturing and service providers, targeting functional heads.
Operations Efficiency, CFO, Manufacturing, Survey, Trends
false
Operational Efficiency
Industrial & Manufacturing
Multiple Chart
Roland Berger
Add to my slides
Remove from favorites
The slide includes icons and key facts related to the Operations Efficiency Radar, summarizing survey scope, participation, and data points.
Operational Efficiency
Industrial & Manufacturing
Provides an overview of the Operations Efficiency Radar, summarizing key metrics, industries covered, and the scope of the surveys conducted.
Operations Efficiency, Survey, Data Points, Trends
false
Operational Efficiency
Industrial & Manufacturing
Pillar
Roland Berger
Add to my slides
Remove from favorites
Contains lists and categorizations of risks such as Product, Supply base, Manufacturing, etc., alongside icons illustrating different types of impact.
Risk Assessment and Management
Professional Services
Offers a detailed breakdown of various operations risks along with their potential impacts on revenue, cash, cost, and customer satisfaction.
Operations risk, Categories, Impact analysis, Revenue, Cash, Cost, Customer
false
Risk Assessment and Management
Professional Services
Header Horizontal
Bain
Add to my slides
Remove from favorites
Features column charts showing the shifts in focus on flexibility, resilience, and business continuity versus cost reduction, customer service, and speed for the next years.
Strategic Planning
Professional Services
Discusses how operational strategies have shifted towards increasing resilience and flexibility, particularly after 2020, with quantitative future projections.
Operations strategy, Flexibility, Resilience, Business continuity, Cost reduction, Customer service, Speed
false
Strategic Planning
Professional Services
Multiple Chart
Bain
Add to my slides
Remove from favorites
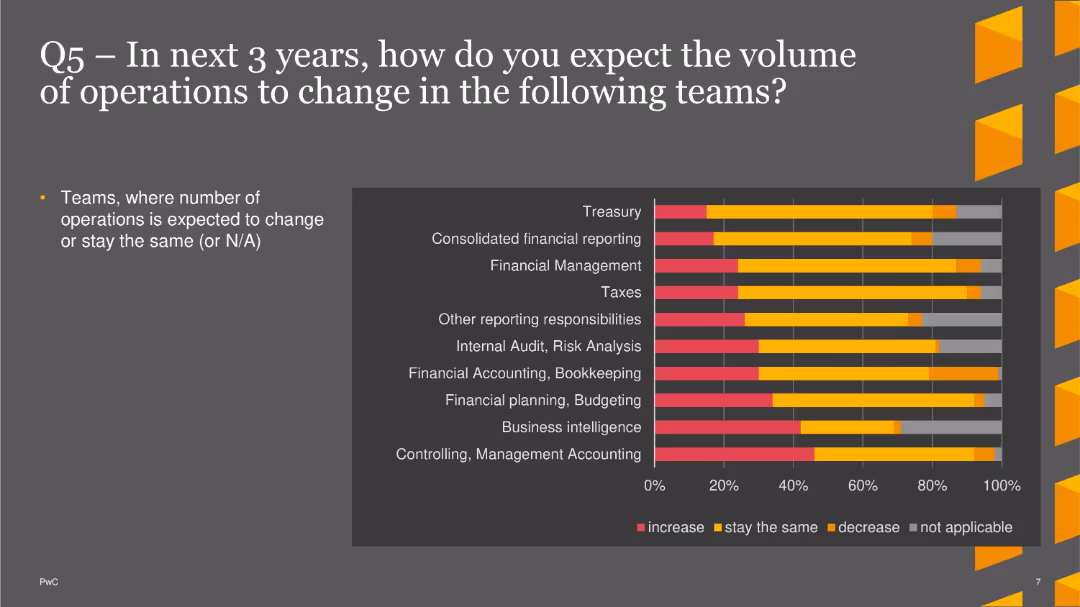
The slide includes a bar chart depicting expected changes in operations volume across various teams over the next three years.
Market Analysis and Trends
Financial Services
This slide highlights teams where operations volume is expected to change or stay the same, focusing on treasury, financial reporting, and management.
Operations, Future, Teams, Bar Chart, PwC, Survey, 2022
false
Market Analysis and Trends
Financial Services
Single Chart
PwC/Strategy&
Add to my slides
Remove from favorites
A flowchart depicting a typical enterprise procurement process with steps from proposal to payment receipt. Accompanied by bullet points explaining the reasons for starting with procurement and its suitability for blockchain applications.
Operational Efficiency
Technology & Software
Describes EY's Network Procurement module within OpsChain 4.0, highlighting its deployment on the Baseline Protocol and the rationale for focusing on procurement processes first.
OpsChain, Network Procurement, Baseline Protocol, blockchain, enterprise procurement, EY, process flow, efficiency
false
Operational Efficiency
Technology & Software
Graphic
EY
Add to my slides
Remove from favorites
This comparative slide is divided into two sections contrasting what has been done with what is left to do regarding the company's optimisation efforts. It's a visually simple design with checkmarks for completed tasks and bullet points for planned tasks.
Operational Efficiency
Financial Services
This slide assesses the company's operational optimisation progress against future goals, serving as a status update and action plan for continuous improvement.
Optimisation, Progress, Future Goals, Action Plan, Improvement
false
Operational Efficiency
Financial Services
Table
Morgan Stanley
Add to my slides
Remove from favorites
Features four small column charts comparing capacity differences between Option 3C and the Base case across various scenarios (Central, Step Change, Fast Change, Slow Change).
Financial Performance
Energy & Utilities
Compares capacity differences between Option 3C and the Base case, providing insights into potential changes in energy production capacities across different scenarios.
Option 3C, capacity, comparison, Base case, energy, scenarios, Central, Step Change, Fast Change, Slow Change
false
Financial Performance
Energy & Utilities
Multiple Chart
EY
Add to my slides
Remove from favorites
The slide contains four bar charts illustrating cumulative gross market benefits across different scenarios (Central, Step Change, Fast Change, Slow Change).
Financial Performance
Energy & Utilities
Forecasts cumulative gross market benefits under different scenarios, presenting data on CAPEX, FOM, fuel, VOM, and other factors discounted to June 2020 dollars.
Option 3C, market benefits, forecast, scenarios, CAPEX, FOM, fuel, VOM, discounted
false
Financial Performance
Energy & Utilities
Multiple Chart
EY
Add to my slides
Remove from favorites
A column chart displays the order intake from 2018 to 2021, with a blue gradient. The slide includes red text boxes with bullet points on strategic outlook and future projections.
Sales and Business Development
Industrial & Manufacturing
It displays a positive trend in order intake, with strategic notes on market positioning and future expectations. This is likely used in sales meetings or investor briefings to demonstrate sales momentum and business growth.
Order Intake, Sales Trend, Strategic Outlook, Aerospace, Defense
false
Sales and Business Development
Industrial & Manufacturing
Mixed Chart
Goldman Sachs
Add to my slides
Remove from favorites
Displays column charts comparing net new households and wealth management referrals over several years. The graphs are accompanied by textual explanations and key growth drivers.
Strategic Planning
Financial Services
Discusses the organic growth and enterprise connectivity strategies, highlighting new household acquisition and referral trends within the business, underpinned by a variety of strategic growth drivers.
Organic Growth, Enterprise Connectivity, Net New Households, Wealth Management, Referrals, Growth Drivers, BAC, Market Connectivity
false
Strategic Planning
Financial Services
Multiple Chart
Morgan Stanley
Add to my slides
Remove from favorites
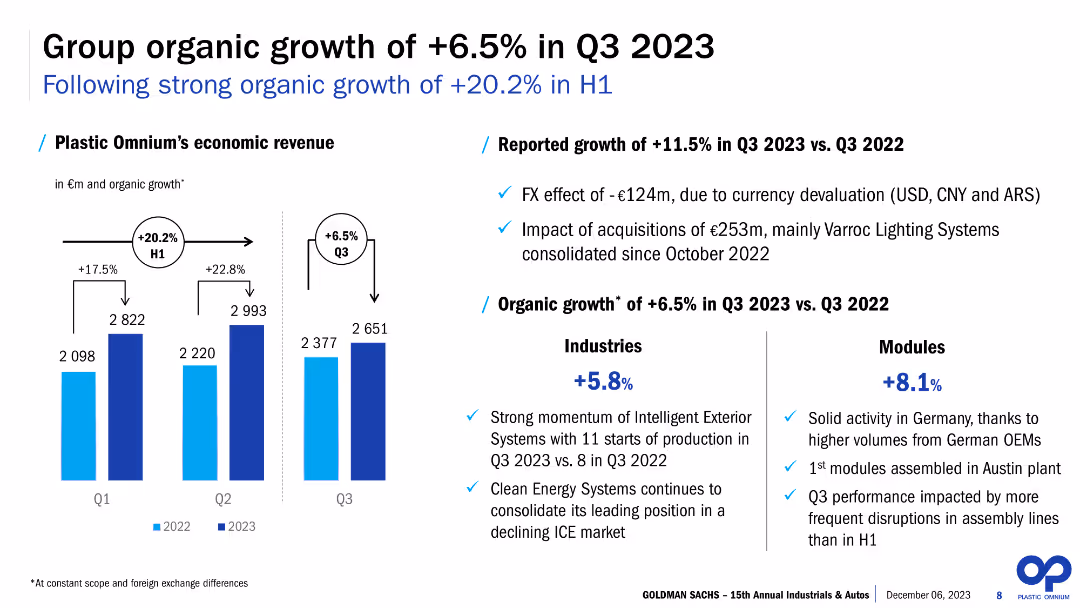
This slide presents column charts comparing economic revenue over three quarters for two consecutive years, with textual annotations and bullet points highlighting key financial figures and percentages. The design includes two shades of blue to distinguish the years and is accompanied by symbols representing different industry sectors and a module. Visual elements are arranged for easy comparison of data points.
Financial Performance
Industrial & Manufacturing
The slide discusses the company's economic revenue and organic growth rate in Q3 2023, with a comparison to the previous year. It shows reported growth, effects of currency devaluation, and the impact of acquisitions. Additionally, it provides a breakdown of growth by industry and modules. This slide is suitable for financial reviews, highlighting performance and growth in specific sectors and overall company health.
Organic Growth, Q3 2023, Revenue, Acquisitions, Industry, Modules, Percentages, Comparative, Financial
false
Financial Performance
Industrial & Manufacturing
Mixed Chart
Goldman Sachs
Add to my slides
Remove from favorites
Features a complex stacked column chart showing revenue growth over several years, including acquisitions.
Financial Performance
Financial Services
The slide likely aims to illustrate financial growth and strategic acquisitions for stakeholders or analysts.
Organic Growth, Revenue, Acquisitions, Financial, Analysis, CAGR, Trend, Performance
false
Financial Performance
Financial Services
Single Chart
Goldman Sachs
Add to my slides
Remove from favorites
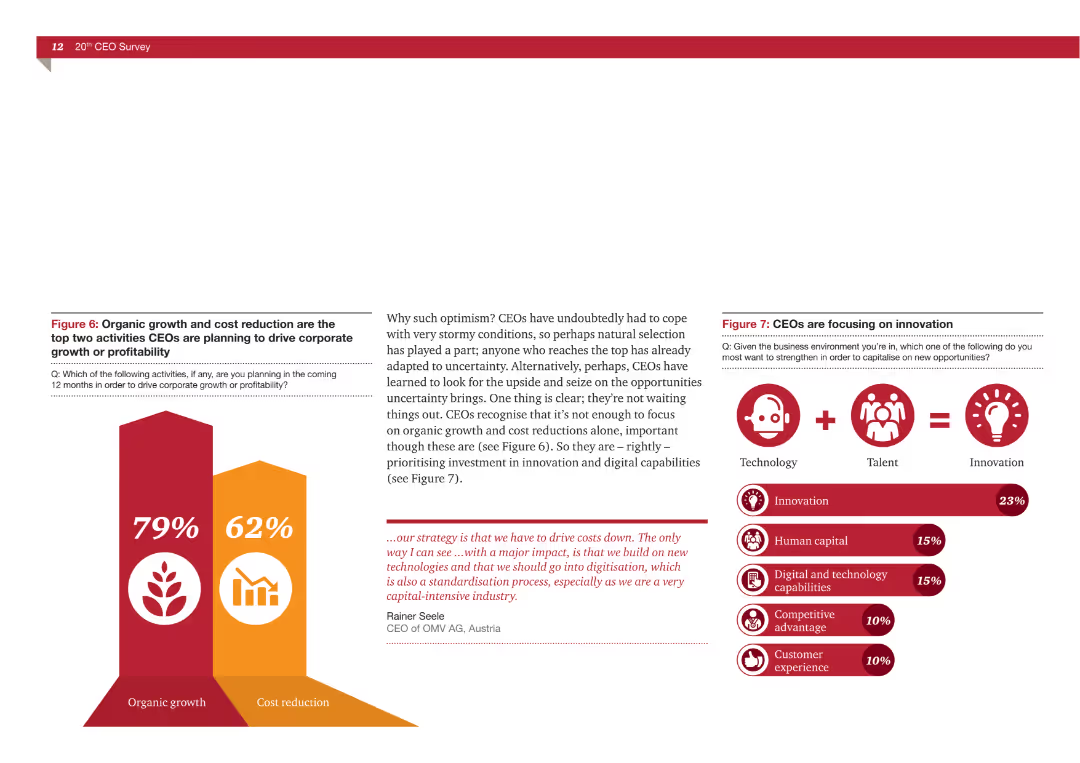
The slide features a column chart comparing organic growth (79%) and cost reduction (62%). It also has icons and small textual descriptions explaining the focus on innovation.
Strategic Planning
Professional Services
This slide compares the top two activities CEOs are planning to drive corporate growth or profitability: organic growth and cost reduction. It highlights that 79% of CEOs focus on organic growth while 62% prioritize cost reduction. The slide emphasizes the need for innovation.
Organic growth, cost reduction, CEOs, corporate growth, profitability, innovation, strategic planning
false
Strategic Planning
Professional Services
Multiple Chart
PwC/Strategy&
Add to my slides
Remove from favorites
The slide includes two column charts showing economic revenue growth in Q1, Q2, and Q3 of 2022 and 2023. There are bullet points on the right side detailing the reported growth, impact of acquisitions, and growth in industries and modules.
Financial Performance
Financial Services
The slide reports Plastic Omnium’s economic revenue growth in Q3 2023, highlighting a 6.5% increase. It details the impact of currency devaluation, acquisitions, and sector-specific growth in industries and modules. The focus is on financial performance and growth metrics.
Organic growth, revenue, Q3 2023, financial performance, acquisitions, industry growth, module growth, economic revenue, currency impact, growth metrics
false
Financial Performance
Financial Services
Mixed Chart
Goldman Sachs
Add to my slides
Remove from favorites
The slide contains a header, a background image, and two sections: a text block on the left and a bar chart on the right. The bar chart shows survey responses on people's attitudes toward genetically modified and engineered foods, with different colors representing levels of agreement and disagreement.
Product and Service Analysis
Agriculture & Food Production
Discusses the debate between organic and genetically modified foods. The bar chart illustrates survey data on people's efforts to avoid genetically modified foods, showing varying levels of agreement and disagreement with the statement about avoiding such foods.
Organic, modified foods, engineered foods, survey, attitudes
false
Product and Service Analysis
Agriculture & Food Production
Mixed Chart
IPSOS
Add to my slides
Remove from favorites
Bar graph and respondent quotes about steps being taken to enhance organizational agility, focusing on training and technology.
Strategic Planning
Professional Services
Outlines the specific actions companies are taking to become more agile, ranking culture and training among the top measures being implemented.
Organizational Agility, Training, Culture, Steps, Bar Graph, Quotes
false
Strategic Planning
Professional Services
Mixed Chart
Kearney
Add to my slides
Remove from favorites
This slide contrasts organizational models using a dark theme, with vertical bars and pie chart elements. It visually differentiates current vs. future expectations through color-coding and is supplemented with callouts for additional context.
Organizational Structure and Change
Professional Services
Discusses anticipated changes in organizational structure, shifting away from hierarchical models, which is essential for understanding evolving corporate cultures and internal dynamics across various industries.
Organizational Change, Corporate Culture, Hierarchy, Flat Structure, Industry Dynamics, Future Trends
false
Organizational Structure and Change
Professional Services
Multiple Chart
Kearney
Add to my slides
Remove from favorites
Features four rounded rectangles, each with a heading and a short text blurb beneath it. The slide is divided into quadrants representing different aspects of work structure and delivery.
Organizational Structure and Change
Professional Services
Encourages thinking about work delivery, organization, employee experience, and enabling work. Useful for initiating discussions on organizational changes needed for the future of work.
Organizational Change, Work, Structure, Planning
true
Organizational Structure and Change
Professional Services
Pillar
Deloitte
Add to my slides
Remove from favorites
Displays a circular diagram detailing the nine dimensions of organizational health, supplemented by statistics and performance impacts in side pie charts.
Human Resources and Talent Management
Professional Services
This slide advocates for regular assessments of organizational health across nine critical dimensions to better integrate SDG strategies into the core business processes, highlighting how such practices can lead to enhanced performance and competitive advantage.
Organizational Health, SDG Strategy, Performance Improvement, Competitive Advantage
false
Human Resources and Talent Management
Professional Services
Multiple Chart
McKinsey
Add to my slides
Remove from favorites
A simple slide with a central graphic of four interconnected diamonds, each labeled with a business division, and a textual statement below emphasizing client-centricity.
Strategic Planning
Financial Services
Demonstrates the unified approach of the firm, highlighting the integration of different business divisions to ensure client-centric service and strategic talent deployment.
Organizational Structure, Client-Centricity, Integration, Talent Deployment
false
Strategic Planning
Financial Services
Framework
Goldman Sachs
Add to my slides
Remove from favorites
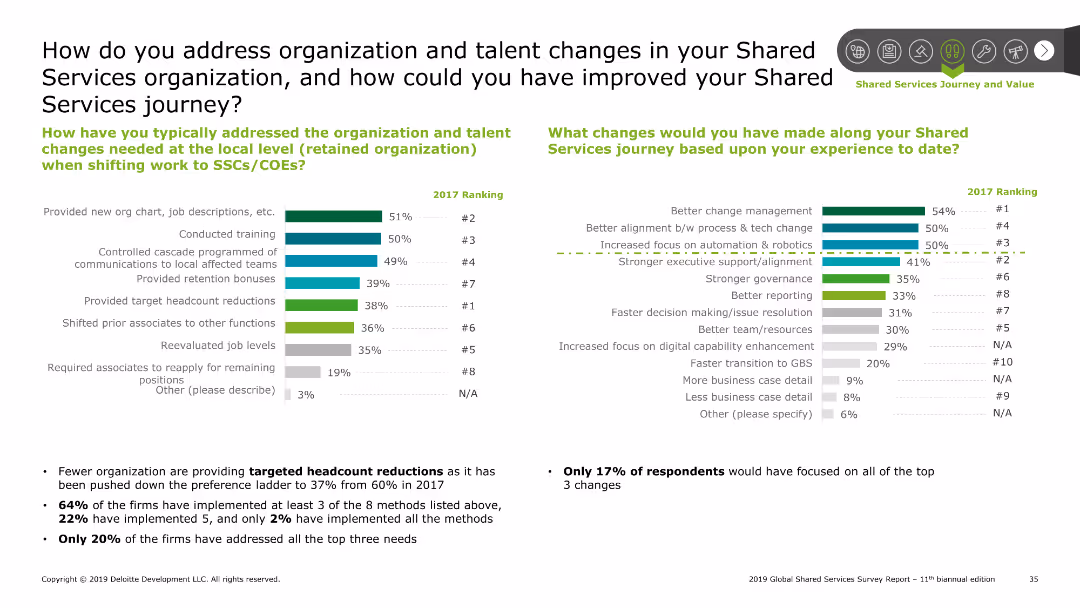
The slide contains a bar chart showing methods for addressing organizational changes and a column chart with improvements for the shared services journey.
Organizational Structure and Change
Professional Services
This slide discusses methods for addressing organizational and talent changes in shared services, and identifies potential improvements based on past experiences.
Organizational change, talent management, shared services, improvements
false
Organizational Structure and Change
Professional Services
Multiple Chart
Deloitte
Add to my slides
Remove from favorites
Divides concepts of purpose, strategy, and culture visually, accompanied by a supermarket case study responding to COVID-19. It uses clear lines and text separation for organizational topics.
Operational Efficiency
Retail & E-commerce
Emphasizes the alignment of purpose, strategy, and culture in driving organizational success, showcased through a supermarket case study during the COVID-19 crisis.
Organizational culture, Strategic alignment, COVID-19, Supermarket
false
Operational Efficiency
Retail & E-commerce
Header Vertical
BCG
Add to my slides
Remove from favorites
Block diagrams outline steps to create a resilient and agile organization, using a dual-tone color scheme for clarity.
Operational Efficiency
Professional Services
Details a five-step process to enhance organizational design for resilience and agility, preparing for the new reality with rapid assessment and implementation strategies.
Organizational design, Resilience, Agility, Productivity, Cost efficiency
false
Operational Efficiency
Professional Services
Linear Flow
BCG
Add to my slides
Remove from favorites
Organizational chart of the SUB divisional management committee and ExB of Credit Suisse with individual roles.
Organizational Structure and Change
Financial Services
Displays the management structure of Credit Suisse’s SUB division, detailing the roles and responsibilities of each executive member.
Organizational structure, management committee, SUB, Credit Suisse, executives
false
Organizational Structure and Change
Financial Services
Diagram
Credit Suisse
Add to my slides
Remove from favorites
Contains column charts representing origination costs and headcount, and green checkmarks for achieved milestones. The information is well-organized and clearly labeled.
Operational Efficiency
Financial Services
Outlines strategies and results for reducing origination costs in home lending. This slide can help in illustrating cost management success in the financial industry.
Origination Costs, Efficiency, Servicing Expenses, Home Lending
false
Operational Efficiency
Financial Services
Multiple Chart
JP Morgan
Add to my slides
Remove from favorites
Features dual-axis column charts showing origination volume in dark and light blue, with growth annotation. The right side has column charts depicting Home Lending ROE with a trend line indicating an increase.
Financial Performance
Financial Services
Displays growth in consumer originations and scaling of correspondent lending with a significant increase in ROE, highlighting the division’s strong financial performance over two years.
Origination Volume, Consumer, Correspondent, Return on Equity, Growth, Financial Performance
false
Financial Performance
Financial Services
Multiple Chart
JP Morgan
Add to my slides
Remove from favorites
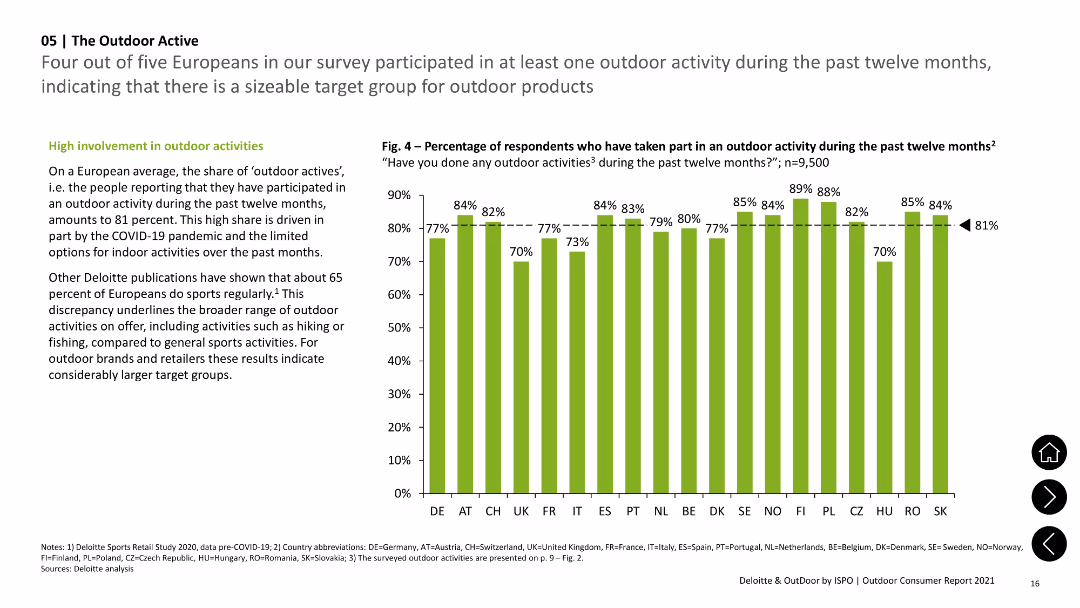
Features a column chart showing percentages of outdoor activity participation across various European countries with text summarizing high involvement in these.
Market Analysis and Trends
Consumer Goods
Shows the percentage of Europeans participating in outdoor activities, emphasizing high involvement rates and variation among countries.
Outdoor, Activities, Europe, Participation, Survey
false
Market Analysis and Trends
Consumer Goods
Mixed Chart
Deloitte
Add to my slides
Remove from favorites
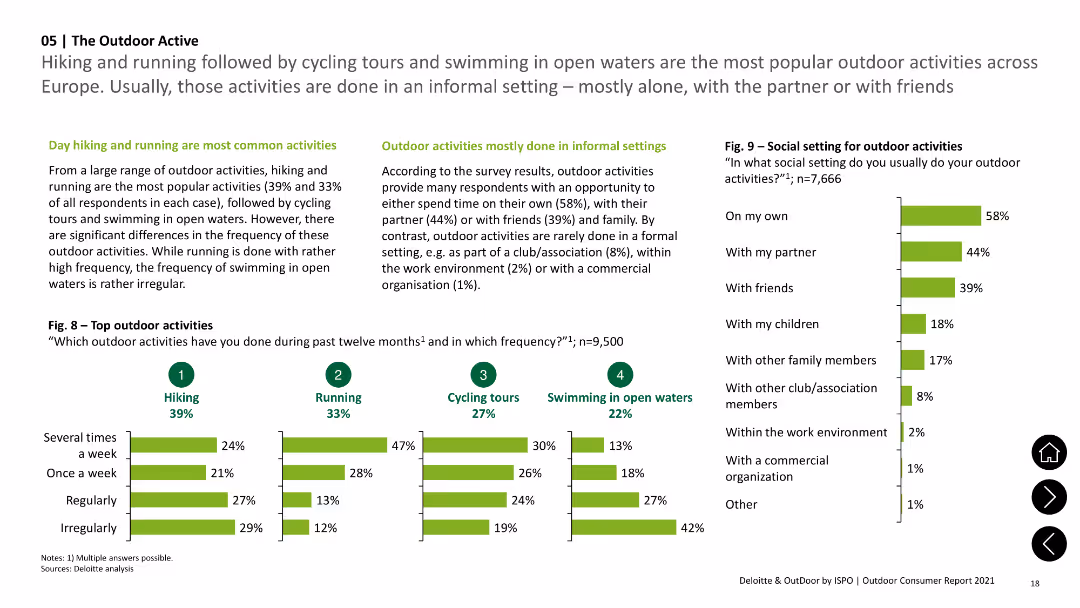
Column charts showing frequency of top outdoor activities like hiking, running, cycling, and swimming, with text describing informal settings of these activities.
Market Analysis and Trends
Consumer Goods
Highlights popular outdoor activities, including hiking and running, and their frequency. Notes that most activities are done informally.
Outdoor, Activities, Hiking, Running, Frequency
false
Market Analysis and Trends
Consumer Goods
Multiple Chart
Deloitte
Add to my slides
Remove from favorites
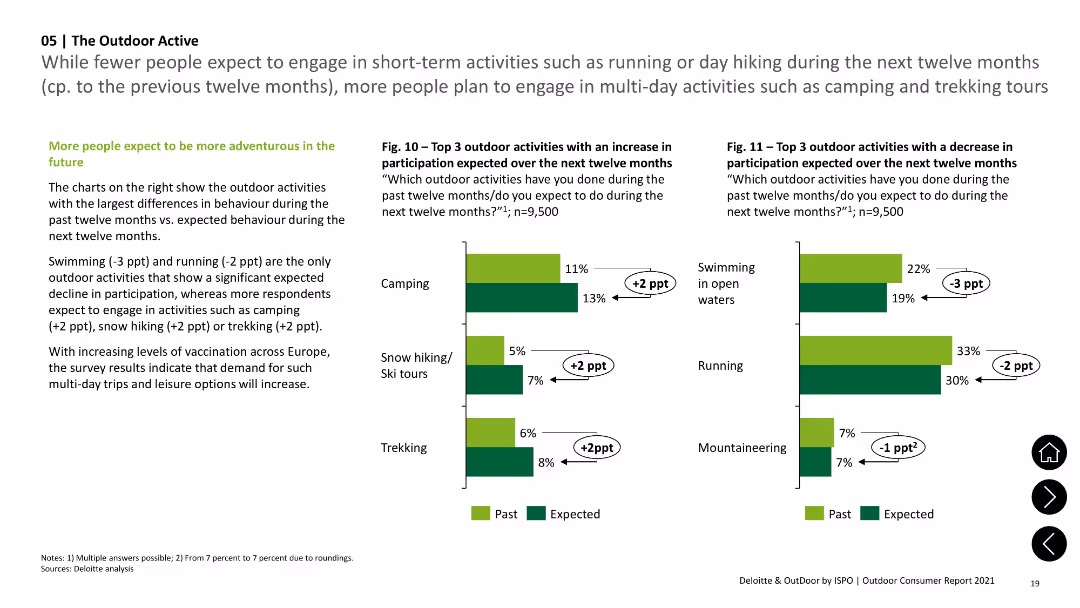
Column charts indicating past vs. expected future participation in various outdoor activities, with notes on changes in adventure expectations.
Market Analysis and Trends
Consumer Goods
Compares past participation rates in outdoor activities with future expectations, noting increases in camping and trekking.
Outdoor, Future, Camping, Trekking, Participation
false
Market Analysis and Trends
Consumer Goods
Multiple Chart
Deloitte
Add to my slides
Remove from favorites
Previous
Next
You don't have any favorites yet.
Please wait loading your favorites slides...
Create a FREE account to continue browsing
Receive Instant Access to 1,000+ slides from companies like McKinsey, Google, and Goldman Sachs
First Name
Last Name
Email
Password
I agree to all
Terms & Privacy Policy
Thank you! Your submission has been received!
Oops! Something went wrong while submitting the form.
Have an account?
Sign in
Upgrade to PRO to Save slides
Advanced Search and Filters
Access to 15,000+ slides
Access to Category Pages
Save/Bookmark Slides
PowerPoint Template Library
Pick a Plan
MONTHLY
$12/month
Billed every month, Cancel anytime.
YEARLY
$9/year
Billed $108 annually, Cancel anytime.
Checkout for $12/month
Checkout for $108/yr
Secured by Stripe | AES-256 bit encryption