My Account
My Slides
Search by Category
Templates
Leave Feedback
Login
Logout
Get Started
Browse all Slides
Browse all Slides
Create a FREE Account
Instant access to 1,000+ real slides from top companies like McKinsey, BCG, Goldman Sachs, Google and many more!
First Name
Last Name
Email
Password
I agree to all
Terms & Privacy Policy
Thank you! Your submission has been received!
Oops! Something went wrong while submitting the form.
Have an account?
Sign in
📢 Ready to start building slides? Check out our new template library
VIEW TEMPLATES
Welcome,
Welcome
PRO
Show Featured Only
Checkbox 8
Companies
Mckinsey
Bain
BCG
EY
Deloitte
Accenture
PwC/Strategy&
JP Morgan
Goldman Sachs
Morgan Stanley
Citigroup
Deutsche Bank
Barclays
LEK
KPMG
Kearney
Oliver Wyman
Booz Allen Hamilton
Gartner
IPSOS
Nielsen
Slide type
Text Only
Linear Flow
Vertical Flow
Single Chart
Header Horizontal
Mixed Chart
Header Vertical
Pillar
Multiple Chart
Graphic
Agenda
Title
Table
Framework
Industry
Technology & Software
Artificial Intelligence
Financial Services
Retail & E-commerce
Consumer Goods
Industrial & Manufacturing
Transportation & Logistics
Telecommunications
Real Estate & Construction
Hospitality & Tourism
Professional Services
Education & Training
Media & Entertainment
Agriculture & Food Production
Healthcare & Pharmaceuticals
Environmental Services & Sustainability
Government & Public Sector
Use Case
Mergers and Acquisitions
Performance Metrics and KPIs
Client Case Studies
Competitive Landscape
Corporate Finance and Valuation
Product and Service Analysis
Customer and Market Segmentation
Organizational Structure and Change
Industry Overview
Regulatory and Compliance
Risk Assessment and Management
Investment Analysis
Organizational Structure and Change
Human Resources and Talent Management
Financial Performance
Market Analysis and Trends
Sales and Business Development
Human Resources and Talent Management
Clear all
Thank you! Your submission has been received!
Oops! Something went wrong while submitting the form.
Tag
View slide
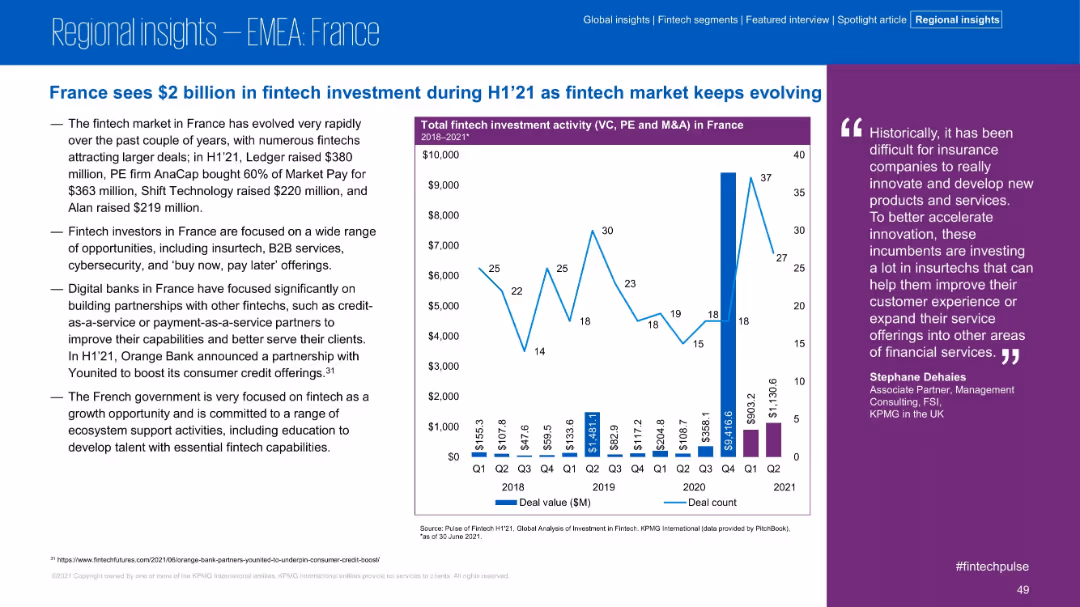
Text-heavy left panel and right-aligned investment trend chart; quote in purple column; professional and clear design.
Market Analysis and Trends
Financial Services
Fintech investment in France reached $2B in H1 2021, with multiple large deals and focus on insurtech, B2B services, and digital banks. The government’s support and emphasis on ecosystem development are also highlighted.
France, Fintech, H1 2021, Digital Banking, Insurtech, Investment, B2B, Government Support
false
Market Analysis and Trends
Financial Services financial-services
Mixed Chart
KPMG
View slide
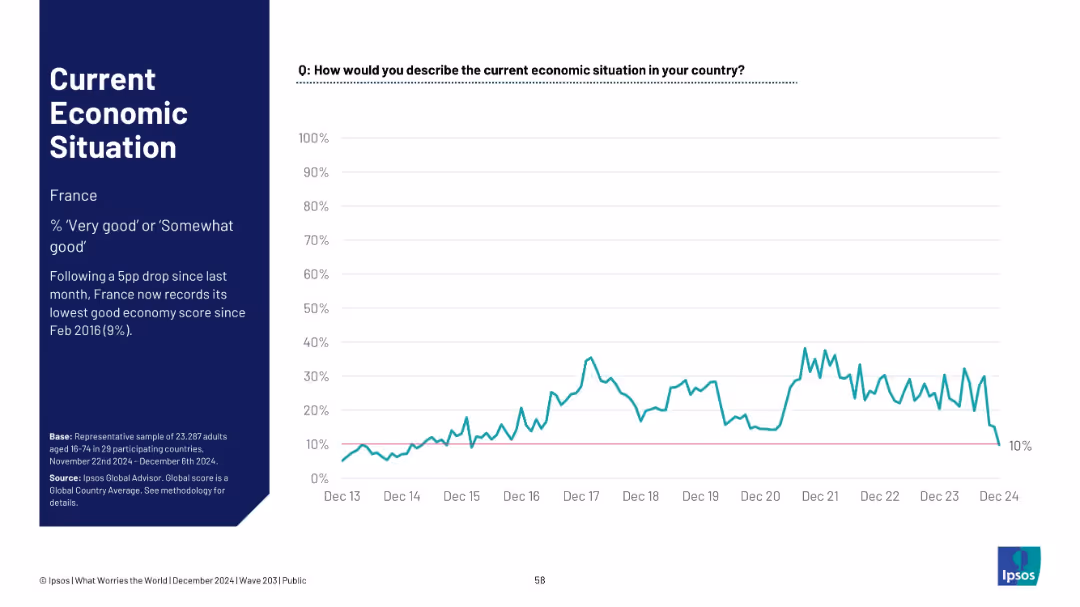
Timeline line chart focused on France; shows a sharp recent decline; minimalistic layout.
Market Analysis and Trends
Financial Services
France’s perception of its economic situation dropped to 10%, marking its lowest rating since February 2016, following a 5-point monthly decline.
France, economic decline, Ipsos data, historical low, 2024 drop, macroeconomic perception, time series, survey sentiment
false
Market Analysis and Trends
Financial Services financial-services
Mixed Chart
IPSOS
View slide
Slide with multiple column charts detailing various French economic measures including corporate taxation, PACTE law, and unemployment insurance reform. Colors range from red to gray to indicate different levels of public perception from negative to positive.
Market Analysis and Trends
Government & Public Sector
Analyzes public perception of ongoing economic measures in France and their impact on the country's attractiveness, aimed at policymakers and economic analysts.
France, economic measures, public perception, corporate taxation, unemployment insurance, PACTE law, reform impact
false
Market Analysis and Trends
Government & Public Sector government-and-public-sector
Multiple Chart
Bain
View slide
Split layout with left panel showing title and summary; right side features a time-series line graph (Nov 2013–Nov 2024) for France's economic view
Market Analysis and Trends
Government & Public Sector
This slide displays French public sentiment on the economy (% viewing it as 'very good' or 'somewhat good') over time, showing a current low of 14%—the lowest since April 2021.
France, economic sentiment, Ipsos, public opinion, trend, recession, survey, economy rating, chart, global study
false
Market Analysis and Trends
Government & Public Sector government-and-public-sector
Single Chart
IPSOS
View slide
The slide contains multiple column charts, showing percentages of detractors, passives, and promoters from 2016 to 2023 about settling in France, with quotes from various business leaders providing context.
Market Analysis and Trends
Hospitality & Tourism
Analyzes the perception trends over years regarding France's attractiveness to foreign employees, noting a recent decline in positive ratings. It highlights testimonials on France's living conditions and labor costs.
France, foreign employees, NPS, perception, attractiveness
false
Market Analysis and Trends
Hospitality & Tourism hospitality-and-tourism
Mixed Chart
Bain
View slide
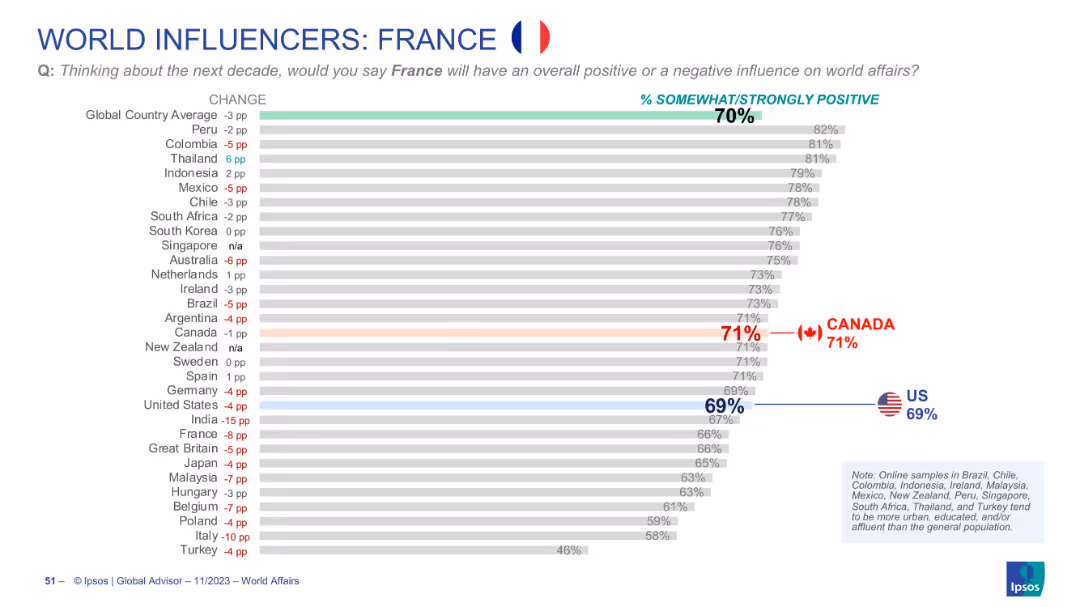
Similar horizontal chart showing views on France's global role
Market Analysis and Trends
Government & Public Sector
Tracks global views of France’s future influence. The global average is 70%. Canada scores France at 71%, while the U.S. gives it 69%. Includes year-over-year changes per country.
France, global perception, Canada, US, public opinion, diplomacy, Ipsos, bar chart, world influence, soft power
false
Market Analysis and Trends
Government & Public Sector government-and-public-sector
Single Chart
IPSOS
View slide
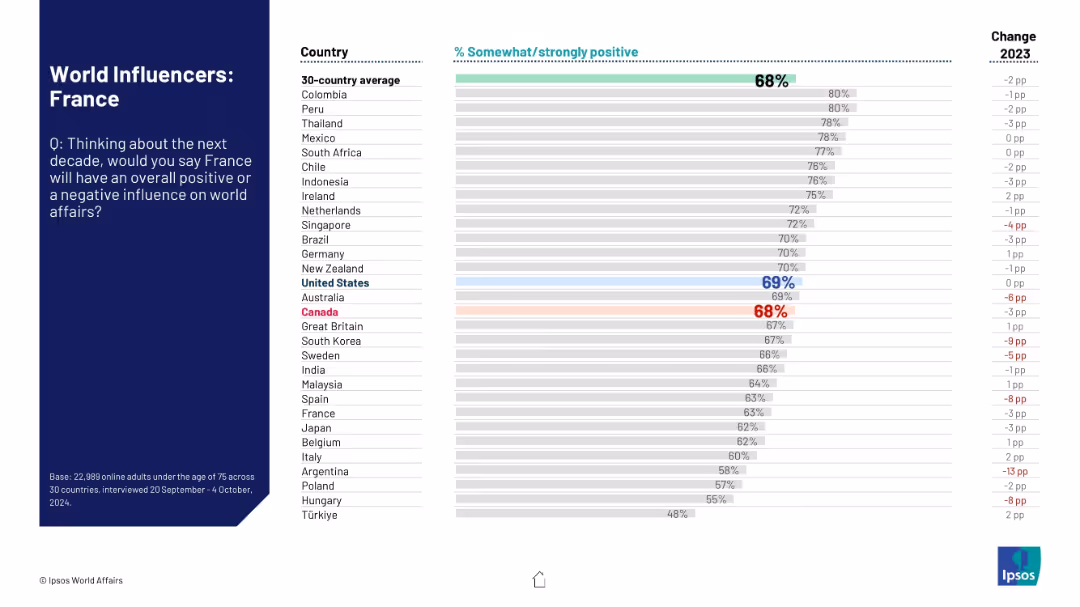
Country ranking showing public opinion on France’s future influence on world affairs; includes change from previous year.
Strategic Planning
Government & Public Sector
This slide assesses global attitudes toward France’s projected global role over the next decade. It includes a 30-country comparison of positive sentiment and yearly change data, positioning France among peers.
France, international opinion, geopolitical role, global affairs, public perception, soft power, Ipsos data
false
Strategic Planning
Government & Public Sector government-and-public-sector
Mixed Chart
IPSOS
View slide
The slide is a complex visual representation, using a Cartesian coordinate system chart with multiple criteria plotted along X (Importance of criterion) and Y (Position of France). Various factors are highlighted in red, indicating areas of improvement.
Market Analysis and Trends
Professional Services
This slide evaluates France's attractiveness to American investors focusing on factors like workforce cost, administrative complexity, and social climate. It suggests key improvement areas to enhance France's business environment.
France, investment, administrative complexity, social climate, attractiveness
false
Market Analysis and Trends
Professional Services professional-services
Single Chart
Bain
View slide
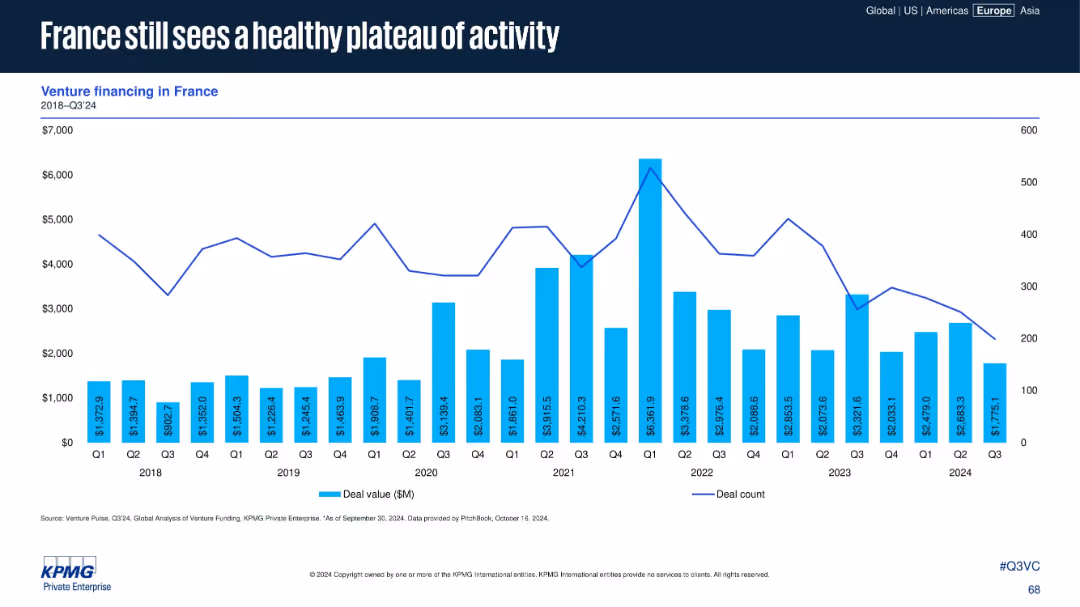
French venture financing data (deal value and count) from 2018–Q3 2024 in a standard dual-axis chart.
Market Analysis and Trends
Financial Services
France maintains a stable level of VC activity in Q3 2024, consistent with previous quarters. Despite no dramatic highs, the data reflects a healthy and sustained venture funding environment in the country.
France, venture capital, deal value, Q3 2024, stable investment, plateau, deal count, historical trend
false
Market Analysis and Trends
Financial Services financial-services
Single Chart
KPMG
View slide
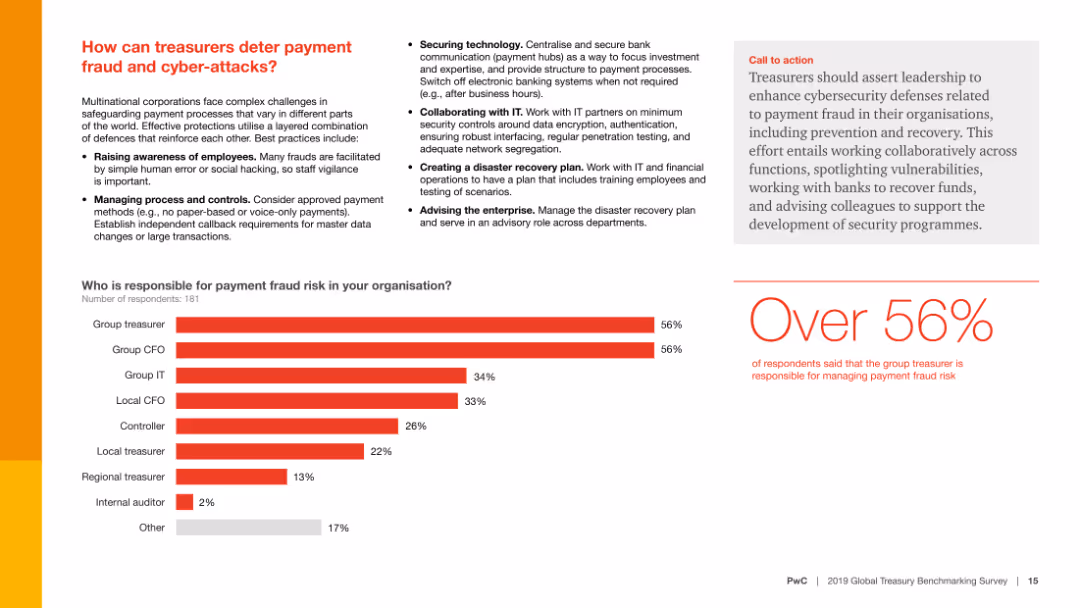
Contains text, a column chart, and a call-to-action section. The column chart shows who is responsible for managing payment fraud risk.
Risk Assessment and Management
Financial Services
This slide presents strategies for preventing payment fraud and cyber-attacks and identifies who within an organization is responsible for managing these risks.
Fraud prevention, cyber-attacks, risk management, survey, responsibility
false
Risk Assessment and Management
Financial Services financial-services
Mixed Chart
PwC/Strategy&
View slide
The slide features a stacked bar chart comparing domestic supply chain costs and freight costs by transport mode, with a cost estimate for the industry.
Financial Performance
Transportation & Logistics
It analyzes the distribution of supply chain costs in the cement industry, highlighting the significant contribution of freight and transportation modes.
Freight, supply chain, cement, costs, road, shipping, rail, transport, industry, analysis
false
Financial Performance
Transportation & Logistics transportation-and-logistics
Single Chart
LEK
View slide
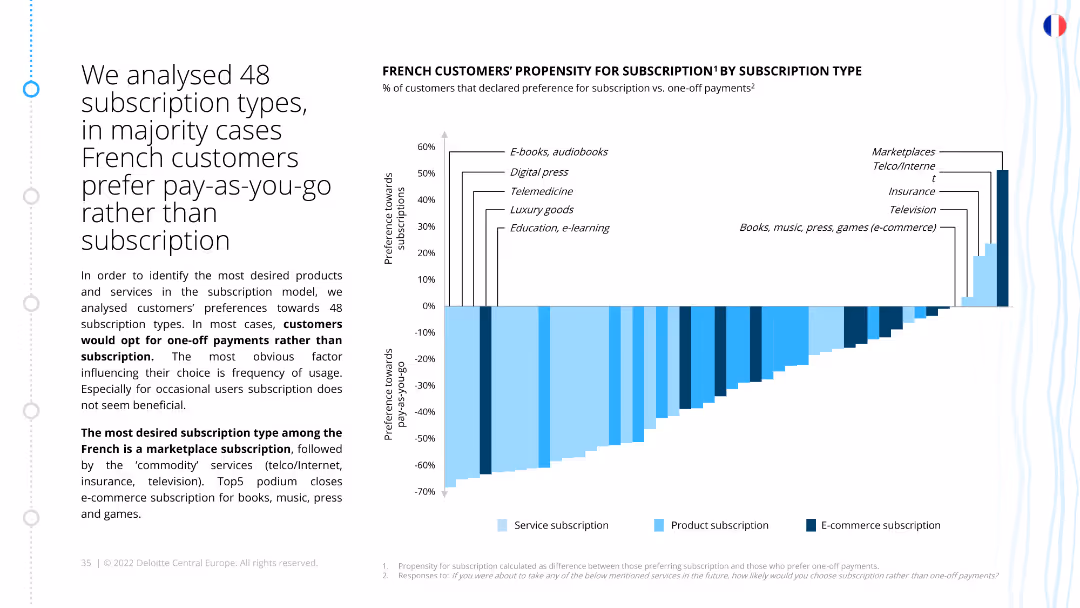
The slide includes a bar chart showing French customers' preferences for subscriptions versus one-off payments across various categories. It highlights significant differences in preferences.
Market Analysis and Trends
Consumer Goods
This slide analyzes French customers' preferences for subscription types, revealing a tendency towards one-off payments. It identifies the most desired subscription types and factors influencing these preferences.
French customers, subscription preferences, one-off payments, market analysis, ecommerce, retail
false
Market Analysis and Trends
Consumer Goods consumer-goods
Mixed Chart
Deloitte
View slide
Features multiple small bar charts in red and green, visually comparing sentiments like burnout and job pride among French workers against other countries.
Organizational Structure and Change
Professional Services
Explores job satisfaction and employee sentiment among French workers compared to other countries, focusing on aspects like burnout and pride, valuable for HR and organizational planning.
French workers, job satisfaction, burnout, bar chart
false
Organizational Structure and Change
Professional Services professional-services
Multiple Chart
BCG
View slide
Features a detailed chart analyzing the correlation between various job satisfaction elements and employee retention in France.
Organizational Structure and Change
Professional Services
Detailed analysis of how different factors of job satisfaction impact employee retention among French deskless workers, critical for HR management and policy-making.
French workers, job satisfaction, emotional needs, chart
false
Organizational Structure and Change
Professional Services professional-services
Multiple Chart
BCG
View slide
Column charts display opinions on French-American relations and EU-US trade concerns with additional professional quotes.
Regulatory and Compliance
Government & Public Sector
Reviews concerns about French-American relations and potential impacts of a trade war with the US on the European Union, with industry expert insights.
French-American relations, EU, trade war, international relations, investment impact, Macron
false
Regulatory and Compliance
Government & Public Sector government-and-public-sector
Multiple Chart
Bain
View slide
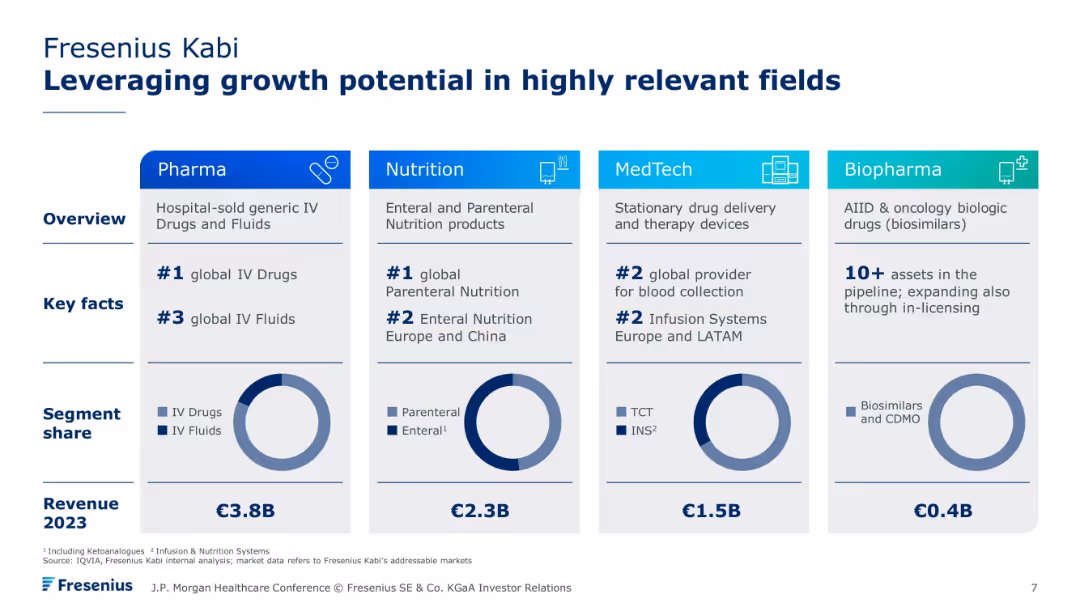
Four-column layout with product segment focus: Pharma, Nutrition, MedTech, and Biopharma. Includes key facts, market positions, and 2023 revenue per segment. Blue-themed design with pie charts.
Strategic Planning
Healthcare & Pharmaceuticals
Fresenius Kabi’s diversified portfolio across pharmaceuticals, nutrition, MedTech, and biosimilars is detailed, showing global leadership in key areas like IV drugs and parenteral nutrition. Each vertical is quantified with 2023 revenue and market ranking.
Fresenius Kabi, pharma segments, IV drugs, nutrition, MedTech, biosimilars, growth strategy
false
Strategic Planning
Healthcare & Pharmaceuticals healthcare-and-pharmaceuticals
Single Chart
JP Morgan
View slide
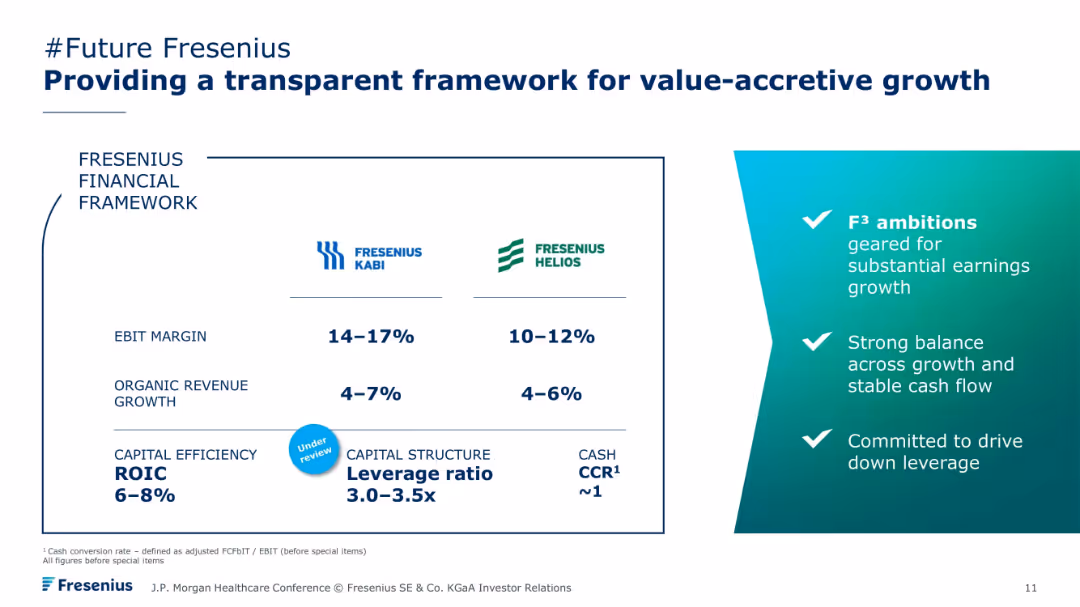
Two-column layout showing Fresenius Kabi and Helios metrics: EBIT margin, revenue growth, ROIC, and leverage ratio. Right column lists strategic goals. Teal and blue color palette with iconography.
Corporate Finance and Valuation
Healthcare & Pharmaceuticals
Presents Fresenius’ financial framework and targets for both Kabi and Helios divisions. It includes key performance metrics and outlines strategic ambitions: strong earnings growth, balance between growth and cash flow, and reduction of financial leverage.
Fresenius, EBIT margin, value-accretive growth, Helios, financial targets, capital structure
false
Corporate Finance and Valuation
Healthcare & Pharmaceuticals healthcare-and-pharmaceuticals
Framework
JP Morgan
View slide
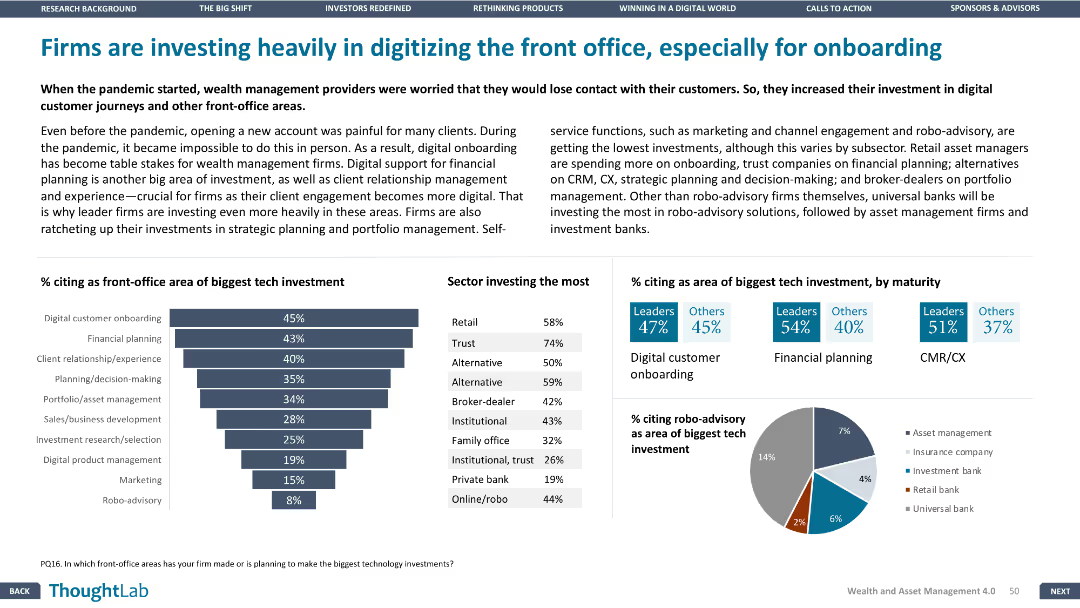
This slide includes a column chart and bar chart, along with a detailed table. The layout is dense, focusing on front-office tech investments and sectors investing the most.
Technology and Digital Transformation
Financial Services
The slide highlights the investment by firms in digitizing front-office operations, especially for digital onboarding, with data on the biggest tech investments and sectors leading these investments.
Front office, digital onboarding, tech investments, financial planning, CX
false
Technology and Digital Transformation
Financial Services financial-services
Multiple Chart
Deloitte
View slide
Circular diagram categorizing various frontier technologies (e.g., AI, blockchain) and a bar chart projecting the global market size of these technologies from 2018 to 2025.
Technology and Digital Transformation
Technology & Software
This slide categorizes emerging frontier technologies and projects their market sizes up to 2025. It highlights the expected growth in technologies like AI, IoT, and blockchain, emphasizing their potential impact on future economic landscapes.
Frontier Technologies, Market Size, AI, IoT, Blockchain
false
Technology and Digital Transformation
Technology & Software technology-and-software
Mixed Chart
Roland Berger
View slide
The slide features a table comparing various fuel cell technologies. The table includes parameters like temperature, stack size, electrical performance, applications, advantages, and challenges.
Technology and Digital Transformation
Energy & Utilities
The slide compares different types of fuel cells, highlighting the potential of Polymer Electrolyte Membrane (PEM) technology in terms of efficiency, application range, and improvement potential.
Fuel cells, PEM, efficiency, comparison, advantages, challenges, technology, applications, temperature, performance
false
Technology and Digital Transformation
Energy & Utilities energy-and-utilities
Table
Kearney
View slide
The slide is organized into sections detailing fuel cell R&D funding, key improvement levers, areas improved, and benefits/challenges. Includes a bar chart on R&D funding breakdown.
Risk Assessment and Management
Energy & Utilities
Discusses the challenges in fuel cell technology related to cost and durability, and outlines key improvement areas with corresponding benefits and challenges.
Fuel cells, cost reduction, durability, performance, challenges, R&D funding, improvement levers, benefits
false
Risk Assessment and Management
Energy & Utilities energy-and-utilities
Mixed Chart
Kearney
View slide
The slide contains a column chart showing technical targets and system cost reduction projections for fuel cell power systems over several years. Additional data on efficiency and power density.
Market Analysis and Trends
Energy & Utilities
Focuses on the advancements in fuel cell research aimed at improving efficiency, durability, and cost-effectiveness. Displays trends and projections in technical performance and cost reduction.
Fuel cells, research, efficiency, durability, cost reduction, projections, targets, power systems, data
false
Market Analysis and Trends
Energy & Utilities energy-and-utilities
Mixed Chart
Kearney
View slide
The slide contains multiple column charts showing share and size of wallet, net revenues, and financial performance improvements over the years.
Financial Performance
Financial Services
This slide presents the performance results of Credit Suisse's full-service model in Switzerland, highlighting improvements in share and wallet size and net revenues.
Full service model, financial performance, share of wallet, net revenues, Switzerland
false
Financial Performance
Financial Services financial-services
Multiple Chart
Credit Suisse
View slide
The slide features a bar chart showing the market value of the global full-service restaurant market by the top countries in 2022. Flags represent each country, with Italy highlighted in yellow.
Market Analysis and Trends
Hospitality & Tourism
This slide shows the market value distribution of full-service restaurants among the top 10 countries, emphasizing Italy's significant contribution as the leading European country in this sector.
Full service restaurants, market value, top countries, Italy, 2022
false
Market Analysis and Trends
Hospitality & Tourism hospitality-and-tourism
Mixed Chart
Deloitte
View slide
The slide features a column chart showcasing growth, two pie charts, and a pictogram of a bank. It has a moderate amount of text and visual elements like icons and a three-color scheme.
Strategic Planning
Financial Services
This slide highlights the benefits of a full-service offering within a branch ecosystem, comparing advisor hiring and client acquisition with growth metrics. The slide is used to illustrate strategic growth and the impact of integrated services on client acquisition and advisor performance.
Full-service, Client acquisition, Advisor hiring, Growth, Branch ecosystem
false
Strategic Planning
Financial Services financial-services
Multiple Chart
JP Morgan
View slide
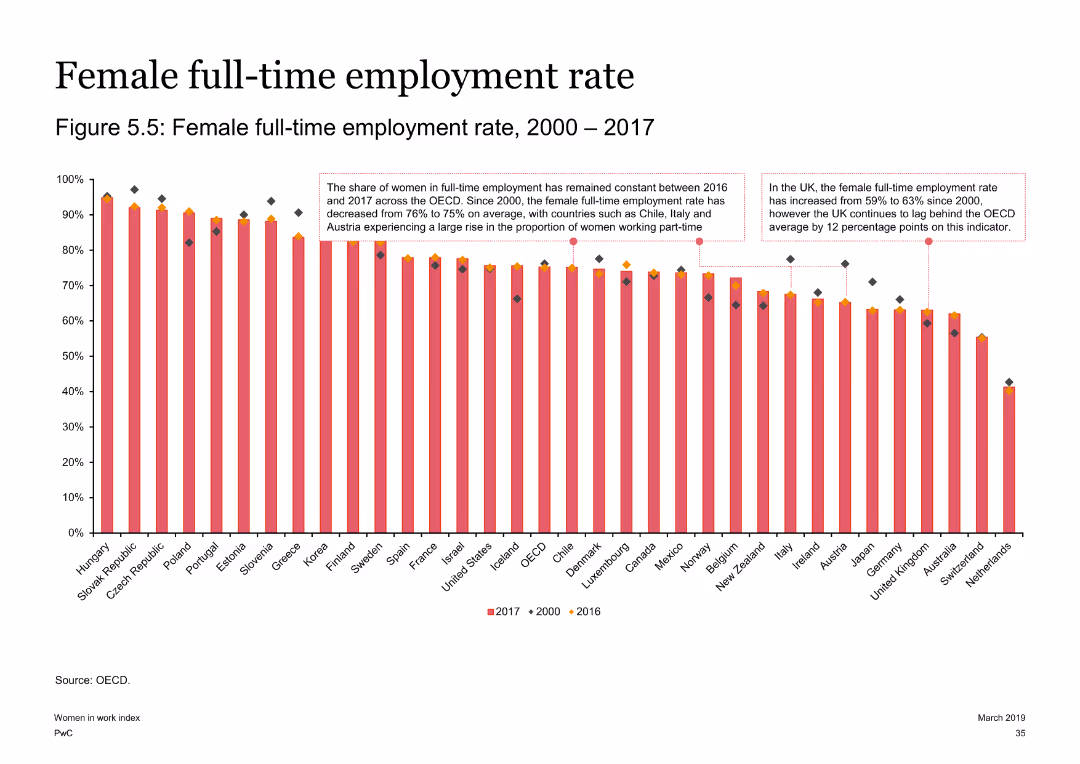
The slide contains a column chart depicting female full-time employment rates from 2000 to 2017 across multiple countries. Key observations for the OECD, UK, and Austria are highlighted with text boxes.
Risk Assessment and Management
Government & Public Sector
This slide presents the full-time employment rates for women over a 17-year period, noting the constancy in some regions and significant changes in others, such as the UK and Austria.
Full-time employment, female, OECD, UK, Austria, employment trends
false
Risk Assessment and Management
Government & Public Sector government-and-public-sector
Single Chart
PwC/Strategy&
View slide
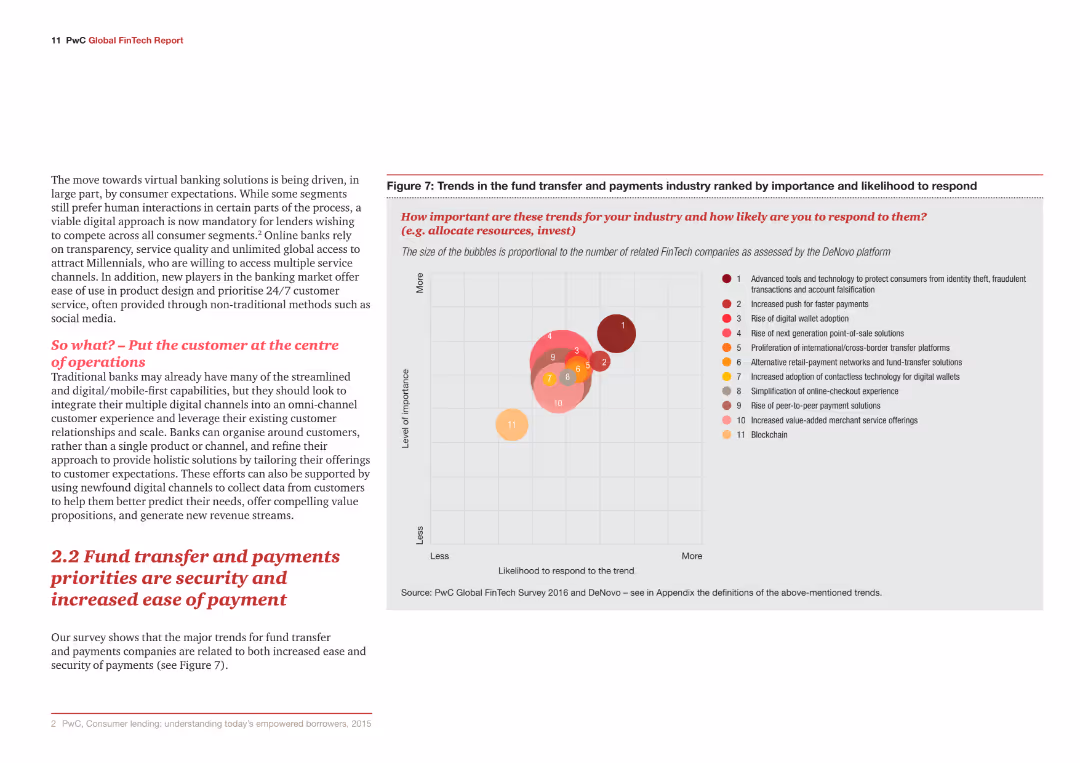
The slide contains a bubble chart and a text section. The bubble chart ranks trends by importance and likelihood to respond.
Market Analysis and Trends
Financial Services
The slide discusses the major trends for fund transfer and payments companies, focusing on security and ease of payment.
Fund transfer, payments, security, ease of payment, trends
false
Market Analysis and Trends
Financial Services financial-services
Mixed Chart
PwC/Strategy&
View slide
The slide includes two stacked column charts showing the evolution of the funding mix over time and a checklist on the right side. The visual elements are balanced and provide a clear comparison of data between two periods.
Financial Performance
Financial Services
Showcasing the company's funding strategy, this slide compares the composition of the funding sources from a past period to the current one, underlining the diversification and liquidity strategy. Ideal for presentations aimed at investors or financial analysts to discuss funding stability and strategy.
Funding Mix, Financial Strategy, Liquidity, Diversification, Capital Management
false
Financial Performance
Financial Services financial-services
Mixed Chart
Goldman Sachs
View slide
A column chart comparison of funding mixes from different years with forecast projections and explanatory text.
Operational Efficiency
Financial Services
This slide projects the benefits of optimizing unsecured funding, suitable for presentations on financial strategy or banking operations efficiency.
Funding Mix, Optimization, Deposits, Financial Strategy, Banking Operations, Projections
false
Operational Efficiency
Financial Services financial-services
Single Chart
Goldman Sachs
View slide
Shows a line graph with a future state projection and a list of key strategic points, indicating stages of funding optimization.
Operational Efficiency
Financial Services
Discusses strategies for funding optimization for better returns, presented to stakeholders for financial and operational strategy reviews.
Funding Optimization, Strategy, Returns, Financial Planning, Operational Efficiency
false
Operational Efficiency
Financial Services financial-services
Mixed Chart
Goldman Sachs
Previous
Loading...
Hold On!
We are searching in our database
If nothing, comes up, please try different filters!
Column Chart
Heatmap
Chevron
Org Chart
Infographic
Callouts
Timeline
List
Graphic
Picture
Process Flow
Diagram
Paragraph
Map
Table
Framework
Subtitle
Takeaway Box
Icon
Other Chart
Radar Chart
Waterfall Chart
Mekko Chart
Pie Chart
Scatter Plot
Line Chart
Bar chart
Bullet points
Create a FREE account to continue browsing
Receive Instant Access to 1,000+ slides from companies like McKinsey, Google, and Goldman Sachs
First Name
Last Name
Email
Password
I agree to all
Terms & Privacy Policy
Thank you! Your submission has been received!
Oops! Something went wrong while submitting the form.
Have an account?
Sign in
Upgrade to PRO to Save slides
Advanced Search and Filters
Access to 15,000+ slides
Access to Category Pages
Save/Bookmark Slides
PowerPoint Template Library
Pick a Plan
MONTHLY
$12/month
Billed every month, Cancel anytime.
YEARLY
$9/year
Billed $108 annually, Cancel anytime.
Checkout for $12/month
Checkout for $108/yr
Secured by Stripe | AES-256 bit encryption