My Account
My Slides
Search by Category
Templates
View All Templates
Download Template Slides
Leave Feedback
Login
Logout
Get Started
Browse all Slides
Browse all Slides
Create a FREE Account
Instant access to 1,000+ real slides from top companies like McKinsey, BCG, Goldman Sachs, Google and many more!
First Name
Last Name
Email
Password
I agree to all
Terms & Privacy Policy
Thank you! Your submission has been received!
Oops! Something went wrong while submitting the form.
Have an account?
Sign in
Spark Your Next Big Idea with New Presentation Templates
VIEW ALL Templates
Welcome,
Welcome
PRO
Show Featured Only
Checkbox 8
Companies
Mckinsey
Bain
BCG
EY
Deloitte
Accenture
PwC/Strategy&
JP Morgan
Goldman Sachs
Morgan Stanley
Citigroup
Deutsche Bank
Barclays
LEK
KPMG
Kearney
Oliver Wyman
Booz Allen Hamilton
Gartner
IPSOS
Nielsen
Slide type
Text Only
Linear Flow
Vertical Flow
Single Chart
Header Horizontal
Mixed Chart
Header Vertical
Pillar
Multiple Chart
Graphic
Agenda
Title
Table
Framework
Industry
Technology & Software
Artificial Intelligence
Financial Services
Retail & E-commerce
Consumer Goods
Industrial & Manufacturing
Transportation & Logistics
Telecommunications
Real Estate & Construction
Hospitality & Tourism
Professional Services
Education & Training
Media & Entertainment
Agriculture & Food Production
Healthcare & Pharmaceuticals
Environmental Services & Sustainability
Government & Public Sector
Use Case
Mergers and Acquisitions
Performance Metrics and KPIs
Client Case Studies
Competitive Landscape
Corporate Finance and Valuation
Product and Service Analysis
Customer and Market Segmentation
Organizational Structure and Change
Industry Overview
Regulatory and Compliance
Risk Assessment and Management
Investment Analysis
Organizational Structure and Change
Human Resources and Talent Management
Financial Performance
Market Analysis and Trends
Sales and Business Development
Human Resources and Talent Management
Clear all
Thank you! Your submission has been received!
Oops! Something went wrong while submitting the form.
Tag
View slide
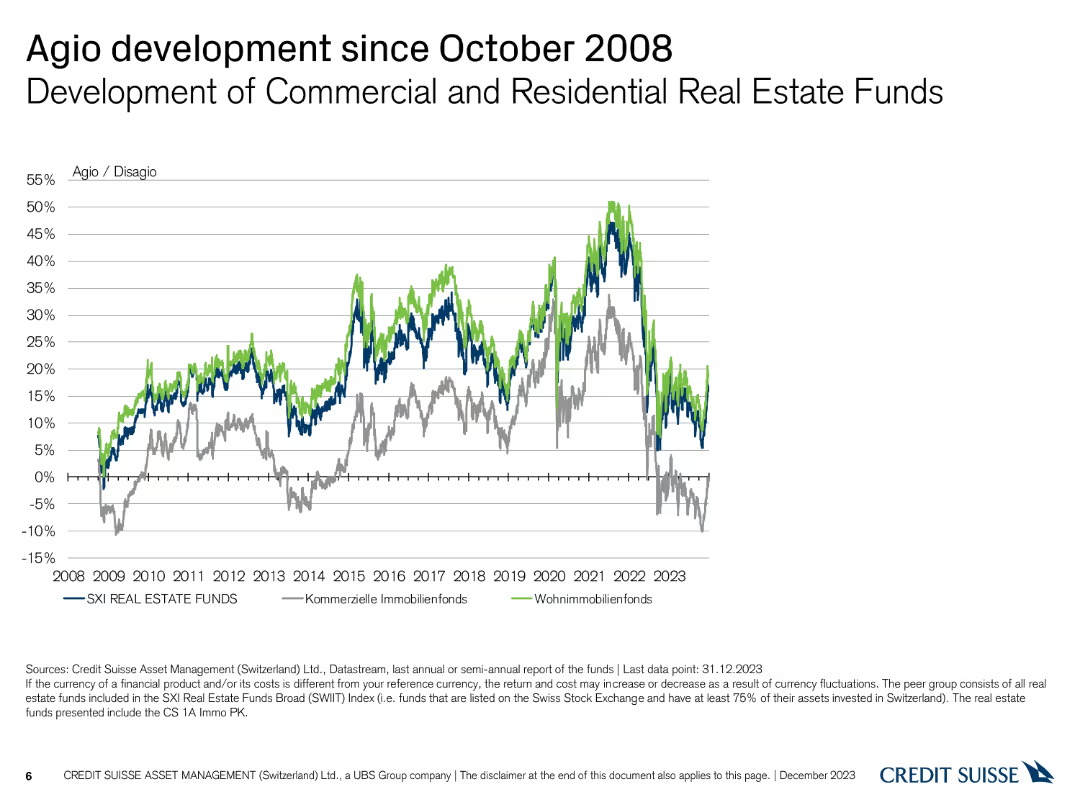
A line chart showing the development of Agio/Disagio percentages for commercial and residential real estate funds, with multiple colored lines.
Market Analysis and Trends
Financial Services
This slide presents the Agio/Disagio development for Swiss commercial and residential real estate funds from 2008 to 2023, highlighting significant market shifts.
Agio, Disagio, Commercial, Residential, Trends
false
Market Analysis and Trends
Financial Services financial-services
Single Chart
Credit Suisse
View slide
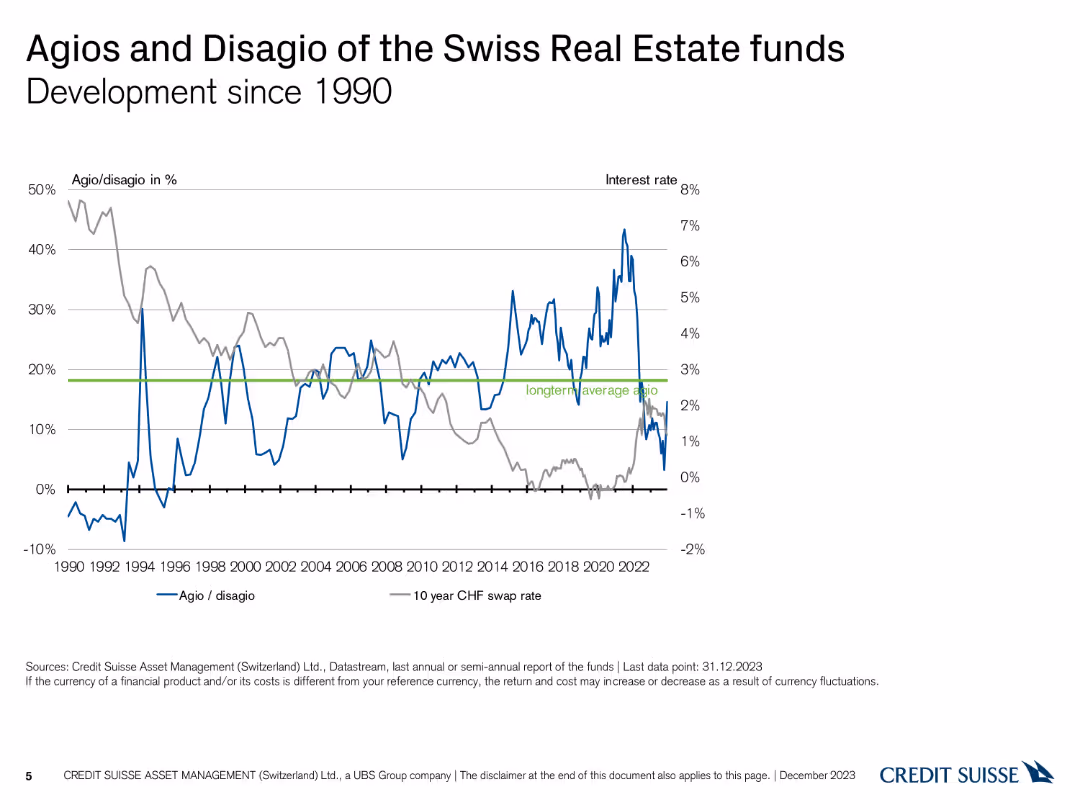
A line chart comparing Agio/Disagio percentages and interest rates over time, with separate lines for each metric and key dates highlighted.
Financial Performance
Financial Services
This slide tracks the historical development of Agio/Disagio percentages and interest rates for Swiss real estate funds since 1990, showing key trends and fluctuations.
Agio, Disagio, Historical Data, Interest Rates, Trends
false
Financial Performance
Financial Services financial-services
Single Chart
Credit Suisse
View slide
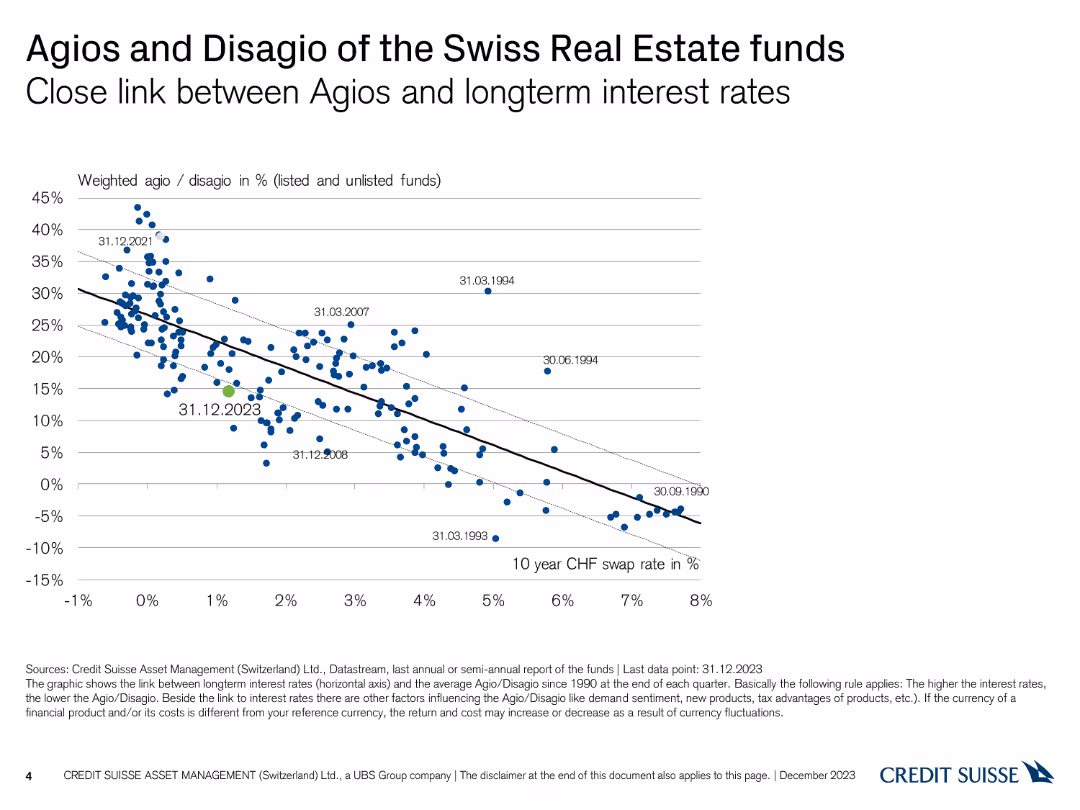
A scatter plot showing the relationship between Agio/Disagio percentages and long-term interest rates, with a trend line illustrating the correlation.
Financial Performance
Financial Services
This slide demonstrates the correlation between the Agio/Disagio percentages of Swiss real estate funds and long-term interest rates, based on data since 1990.
Agio, Disagio, Interest Rates, Correlation, Funds
false
Financial Performance
Financial Services financial-services
Single Chart
Credit Suisse
View slide
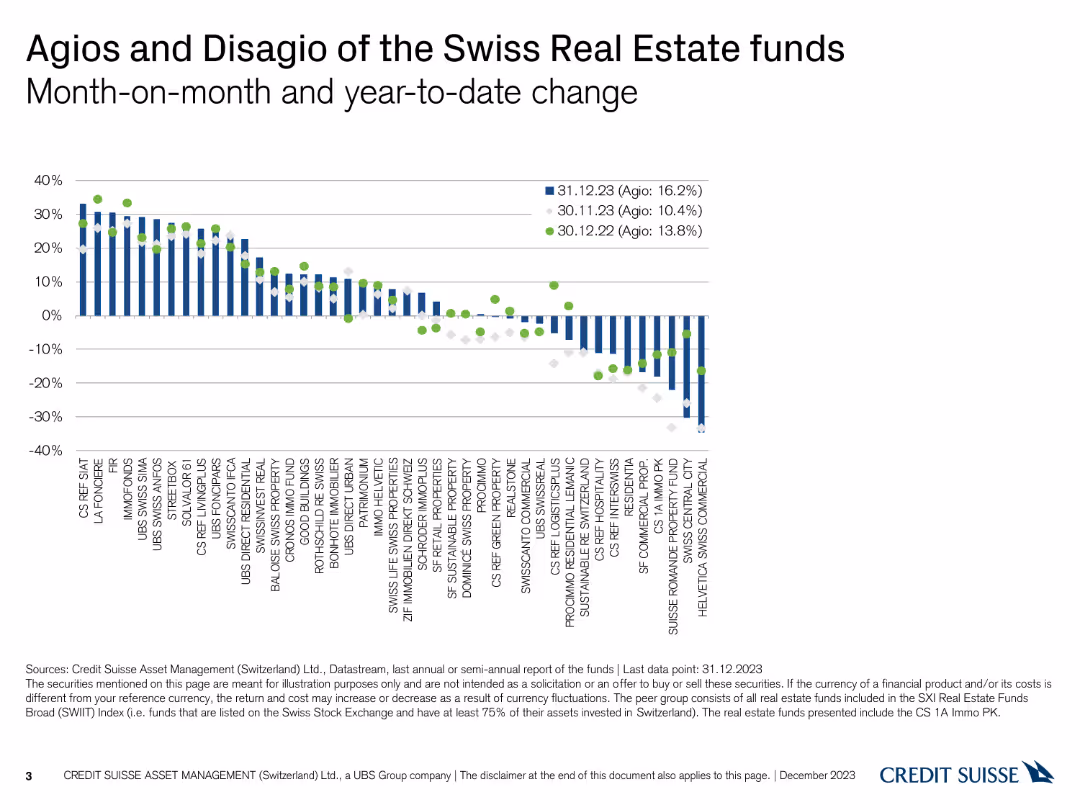
A column chart depicting month-on-month and year-to-date changes in Agio and Disagio percentages for Swiss real estate funds with three data points.
Financial Performance
Financial Services
This slide shows the month-on-month and year-to-date changes in the Agio and Disagio of various Swiss real estate funds, comparing data from three different dates.
Agio, Disagio, Month-on-Month, Year-to-Date, Funds
false
Financial Performance
Financial Services financial-services
Single Chart
Credit Suisse
View slide
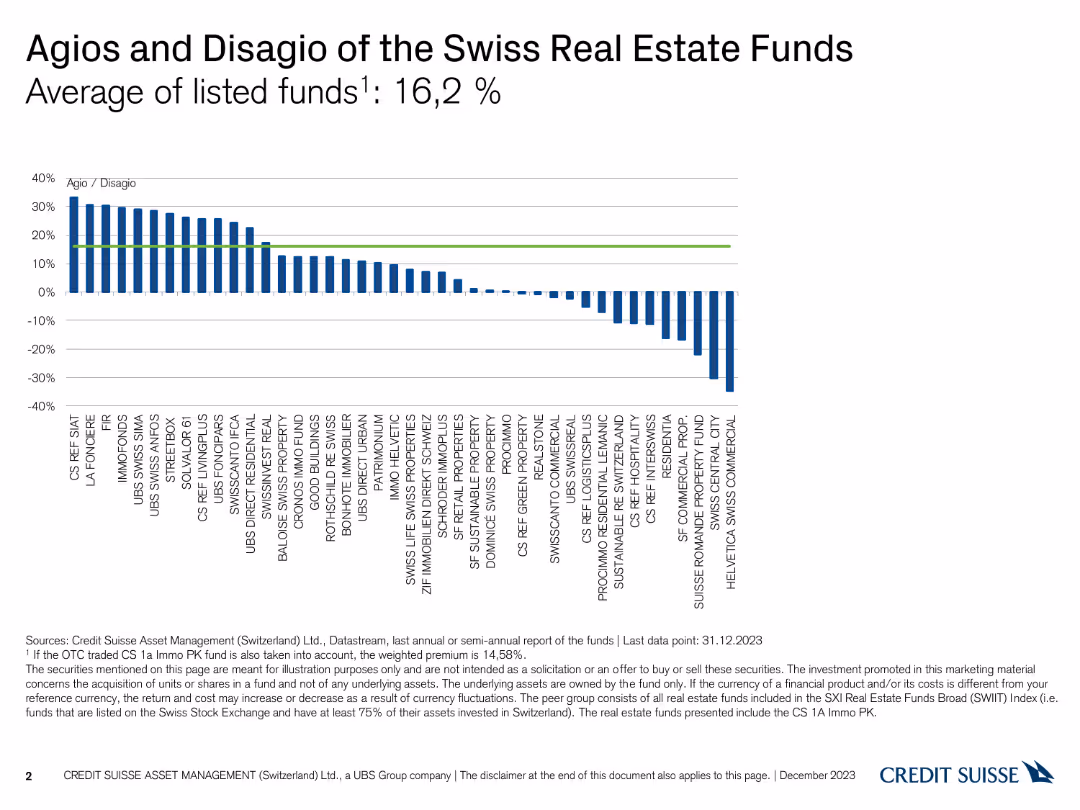
A column chart showing the Agio and Disagio percentages of various Swiss real estate funds, with bars extending above and below a zero line.
Financial Performance
Financial Services
This slide illustrates the Agio (premium) and Disagio (discount) of different Swiss real estate funds as of December 31, 2023, highlighting an average of 16.2%.
Agio, Disagio, Real Estate Funds, Premium, Discount
false
Financial Performance
Financial Services financial-services
Single Chart
Credit Suisse
View slide
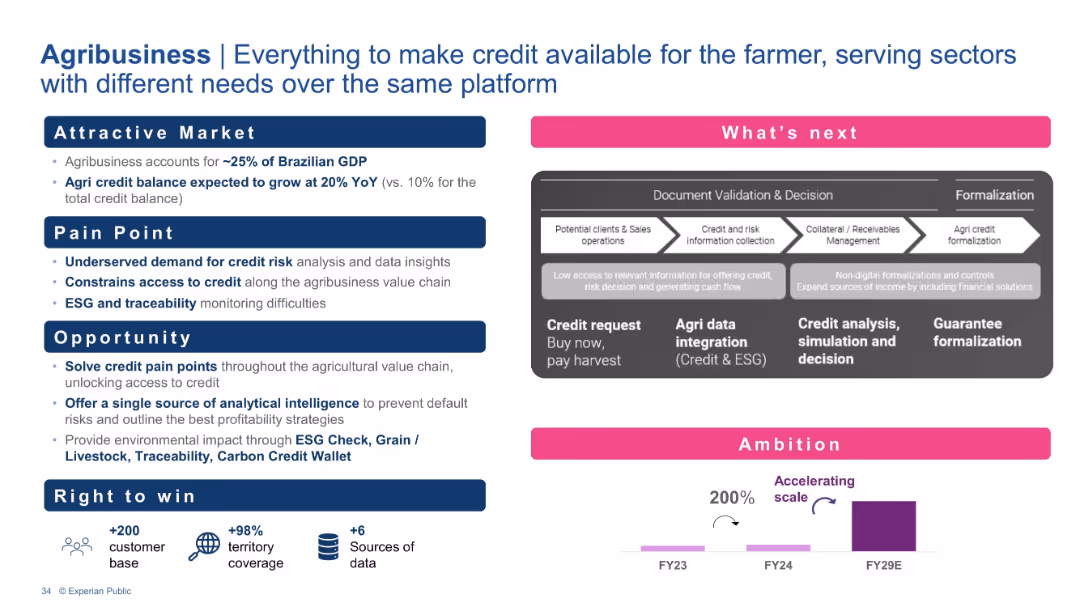
Structured in classic pain-point/opportunity format with flowchart showing the agri-credit process. Metrics and ambition chart below.
Product and Service Analysis
Agriculture & Food Production
This slide focuses on Experian's agribusiness strategy. It highlights the underserved market in credit access and ESG data, and introduces a platform to support end-to-end agri-credit processing. Growth is driven by credit analytics, ESG intelligence, and data validation services.
Agribusiness, Credit access, ESG, Traceability, Platform integration, Rural finance, Agri credit
false
Product and Service Analysis
Agriculture & Food Production agriculture-and-food-production
Mixed Chart
Barclays
View slide
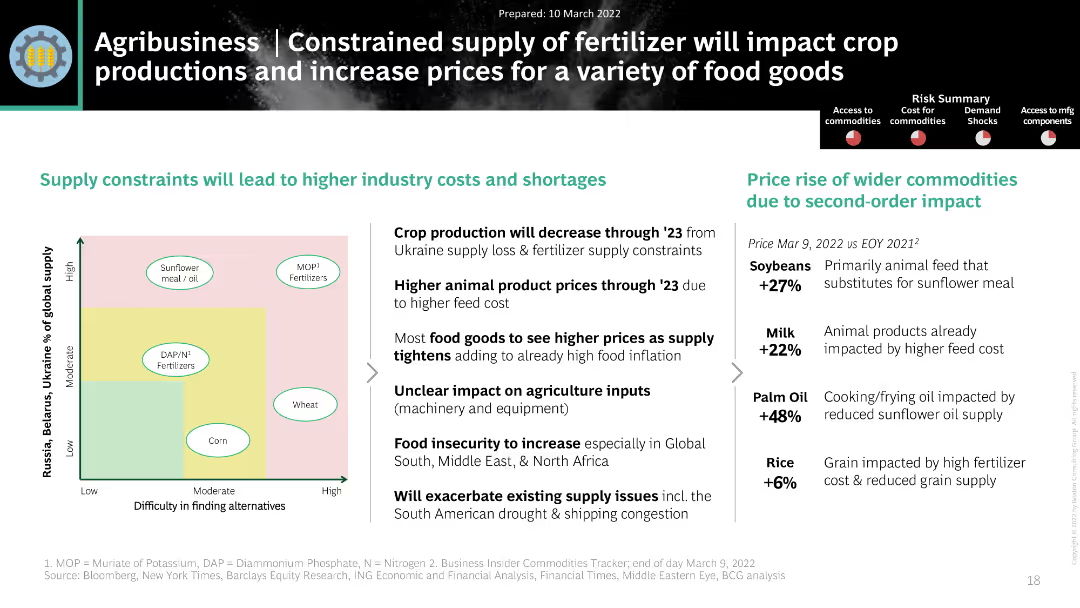
The slide includes a matrix chart and a column chart showing commodity price rises. The layout is moderately dense.
Market Analysis and Trends
Agriculture & Food Production
It discusses the constrained supply of fertilizers from Ukraine and its impact on crop production and prices of food goods.
Agribusiness, Fertilizers, Crop Production, Prices, Ukraine
false
Market Analysis and Trends
Agriculture & Food Production agriculture-and-food-production
Header Horizontal
BCG
View slide
Bullet points and icons, with a blue and white color scheme, focused on agriculture.
Risk Assessment and Management
Agriculture & Food Production
Analyzes the impact of bioengineering on agricultural practices and food production.
Agriculture, Bioengineering, Food Production, Impact Analysis
false
Risk Assessment and Management
Agriculture & Food Production agriculture-and-food-production
Header Horizontal
McKinsey
View slide
The title slide for a presentation with a vivid background image of a wheat field, the logos of EY and Parthenon, and the names of two managing directors.
Industry Overview
Agriculture & Food Production
This introductory slide sets the theme for a presentation on investing in the agricultural crop industry, likely to be part of a broader discussion on investment opportunities and strategies within the agriculture sector. The visual backdrop of crops establishes the industry context.
Agriculture, Crop Industry, Investment, EY-Parthenon, Managing Directors, Overview
false
Industry Overview
Agriculture & Food Production agriculture-and-food-production
Title
EY
View slide
Pie chart and bullet points summarizing agriculture's economic value and emissions profile. Text provides an overview of the sector's role and impact.
Industry Overview
Agriculture & Food Production
Describes the economic significance of the Australian agriculture sector, detailing its contributions to GDP and employment, as well as its emissions profile.
Agriculture, Economic Contribution, Emissions Profile, GDP, Employment, National Impact, Sector Overview
false
Industry Overview
Agriculture & Food Production agriculture-and-food-production
Multiple Chart
EY
View slide
The slide presents a title at the top with two line charts below, depicting the total population and number of undernourished people worldwide.
Industry Overview
Agriculture & Food Production
This slide discusses the role of the agriculture sector in the global economy and the shift towards sustainability, highlighting population growth and food scarcity issues.
Agriculture, Economy, Sustainability, Population, Food Scarcity
false
Industry Overview
Agriculture & Food Production agriculture-and-food-production
Mixed Chart
PwC/Strategy&
View slide
The slide includes column chart and diagrams showing the economic impact of Copernicus on agriculture.
Market Analysis and Trends
Agriculture & Food Production
Focuses on precision farming and the economic benefits derived from using Copernicus data in agriculture, aiming to enhance profitability and productivity.
Agriculture, Precision Farming, Copernicus, Profitability, Productivity
false
Market Analysis and Trends
Agriculture & Food Production agriculture-and-food-production
Mixed Chart
PwC/Strategy&
View slide
Features a column chart detailing 'Copernicus economic impact (2018)' for air quality monitoring, alongside key products and a detailed text description of applications.
Regulatory and Compliance
Environmental Services & Sustainability
Discusses the applications and benefits of using Copernicus data for air quality monitoring, emphasizing the improvement in data quality and accessibility, and its impact on policy making and environmental compliance.
Air Quality, Monitoring, Copernicus
false
Regulatory and Compliance
Environmental Services & Sustainability environmental-services-and-sustainability
Mixed Chart
PwC/Strategy&
View slide
Contains detailed text along with a world map illustrating 'DALYs' attributable to ambient air pollution per 100,000 population in 2016, and a bar chart showing data on EU energy-related CO2 emissions over time.
Regulatory and Compliance
Environmental Services & Sustainability
Provides an overview of the impacts of air quality on public health, focusing on DALY metrics to illustrate the global burden of disease linked to air pollution. Discusses the role of monitoring and policy in improving air quality standards.
Air Quality, Public Health, Pollution, DALYs
false
Regulatory and Compliance
Environmental Services & Sustainability environmental-services-and-sustainability
Graphic
PwC/Strategy&
View slide
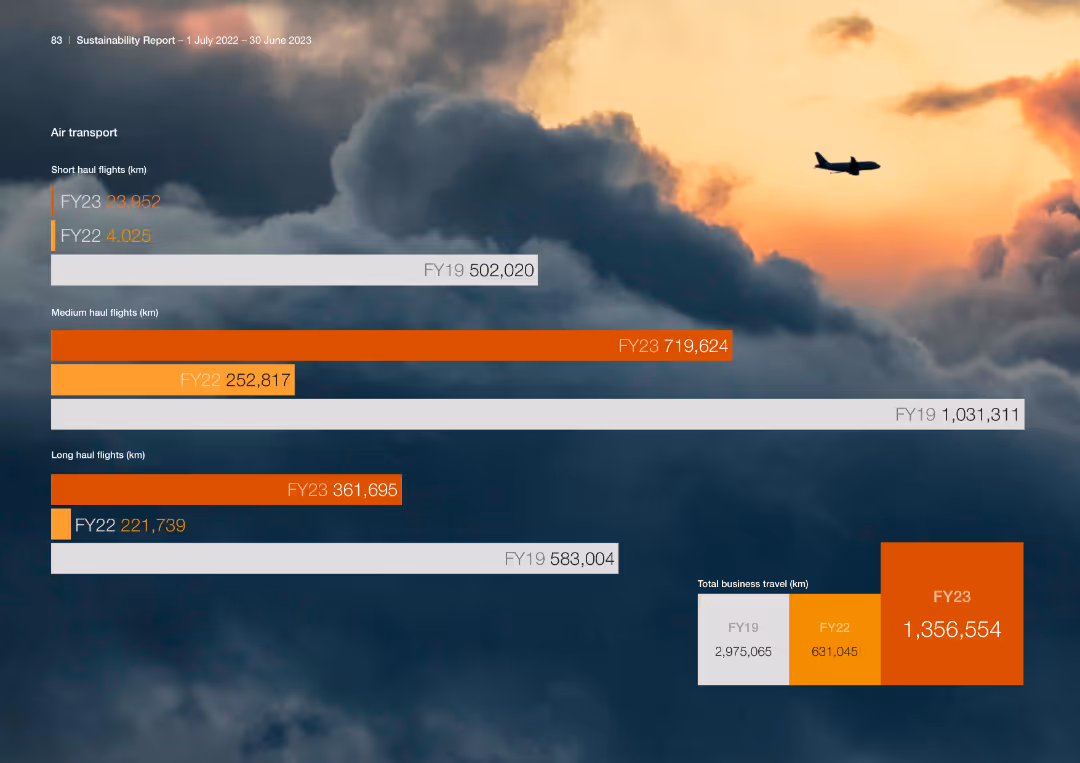
The slide features multiple horizontal bar charts comparing air transport metrics over different fiscal years. The design is visually engaging with a clear hierarchy and color-coded data.
Operational Efficiency
Transportation & Logistics
The slide compares the number of short, medium, and long-haul flights over fiscal years, showing trends and changes in business travel for the company.
Air Transport, Flights, Comparison, Fiscal Years
false
Operational Efficiency
Transportation & Logistics transportation-and-logistics
Single Chart
PwC/Strategy&
View slide
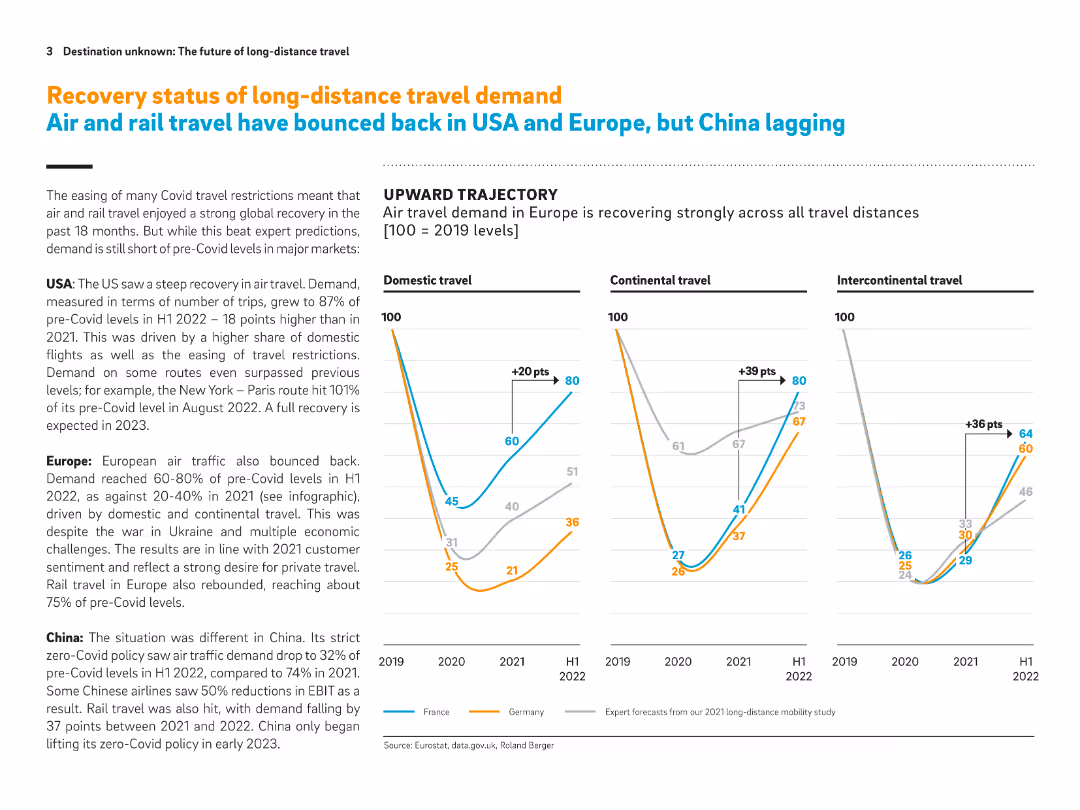
Full-slide layout with three line graphs comparing air travel demand in different regions. Text blocks on the left summarize trends by region (USA, Europe, China).
Market Analysis and Trends
Transportation & Logistics
This slide shows recovery trajectories of air travel from 2019 to 2022, indicating stronger recovery in the US and Europe compared to China. It includes domestic, continental, and intercontinental trends. Europe leads recovery, while China lags behind due to strict Covid policies.
Air travel, recovery trends, post-Covid travel, USA, Europe, China, travel demand, mobility, domestic travel
false
Market Analysis and Trends
Transportation & Logistics transportation-and-logistics
Multiple Chart
Roland Berger
View slide
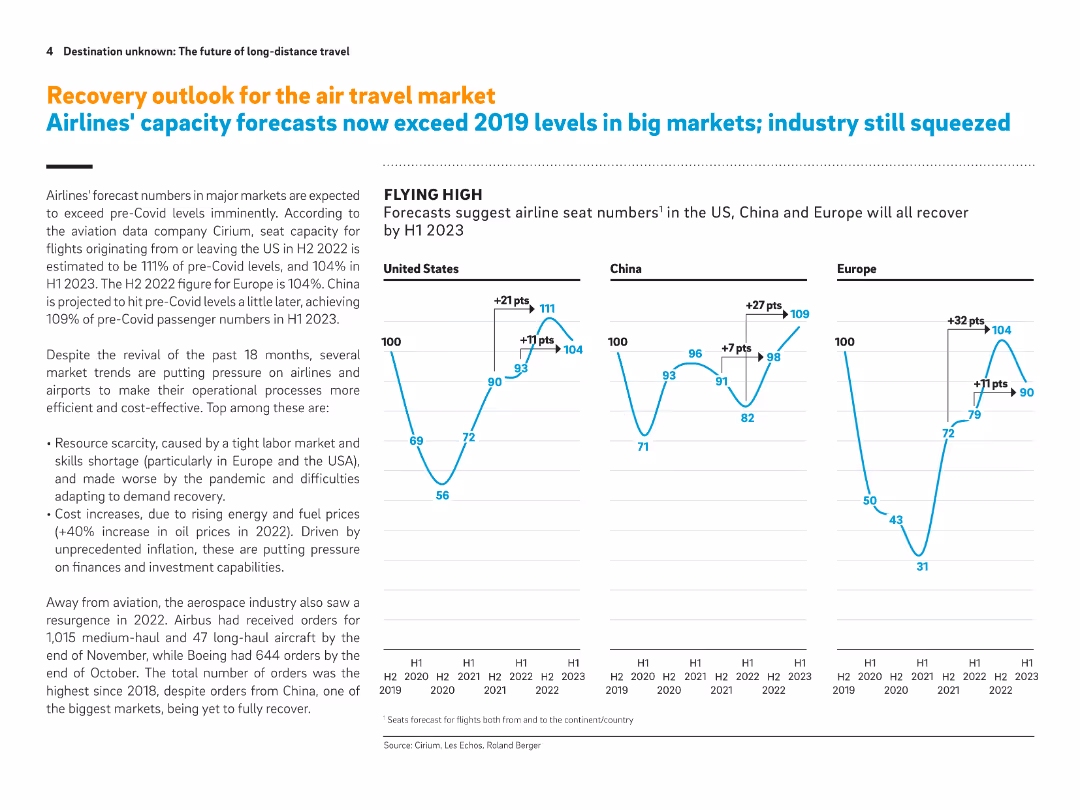
Full-slide with three line graphs on seat capacity forecasts and accompanying explanation of airline and aerospace trends. Emphasizes post-Covid recovery in the US, China, and Europe.
Strategic Planning
Transportation & Logistics
Forecasts suggest airline seat capacities will exceed 2019 levels by H1 2023. The slide also highlights industry pressures such as resource scarcity, labor shortages, and rising fuel costs. Aerospace orders have rebounded, especially in the US and Europe.
Airline capacity, post-Covid recovery, seat forecast, labor shortages, fuel prices, aerospace orders, air travel market
false
Strategic Planning
Transportation & Logistics transportation-and-logistics
Multiple Chart
Roland Berger
View slide
The slide features two charts: a bar chart on the left showing the average age of commercial aircraft in the U.S. from 1993 to 2022, and a column chart on the right depicting the U.S. airline passenger miles flown annually from 1970 to 2022. The charts use vertical bars to represent data points and include a clear legend.
Market Analysis and Trends
Transportation & Logistics
This slide analyzes trends in the global airline industry, focusing on the aging fleet of commercial aircraft in the U.S. and the increase in passenger miles flown. It provides insights into the operational dynamics and growth of the airline sector.
Airline industry, aircraft age, passenger miles, aviation trends, fleet management, industry analysis, air travel
false
Market Analysis and Trends
Transportation & Logistics transportation-and-logistics
Multiple Chart
JP Morgan
View slide
Pie chart and bar graphs comparing the purchasing triggers for offline and online airline buyers.
Market Analysis and Trends
Transportation & Logistics
Evaluates reasons why buyers choose offline vs. online purchasing for airlines, with emphasis on trust and transaction value.
Airlines, Trust, Onsite Payment, Online Buying, Offline Purchasing, Transaction Value
false
Market Analysis and Trends
Transportation & Logistics transportation-and-logistics
Mixed Chart
BCG
View slide
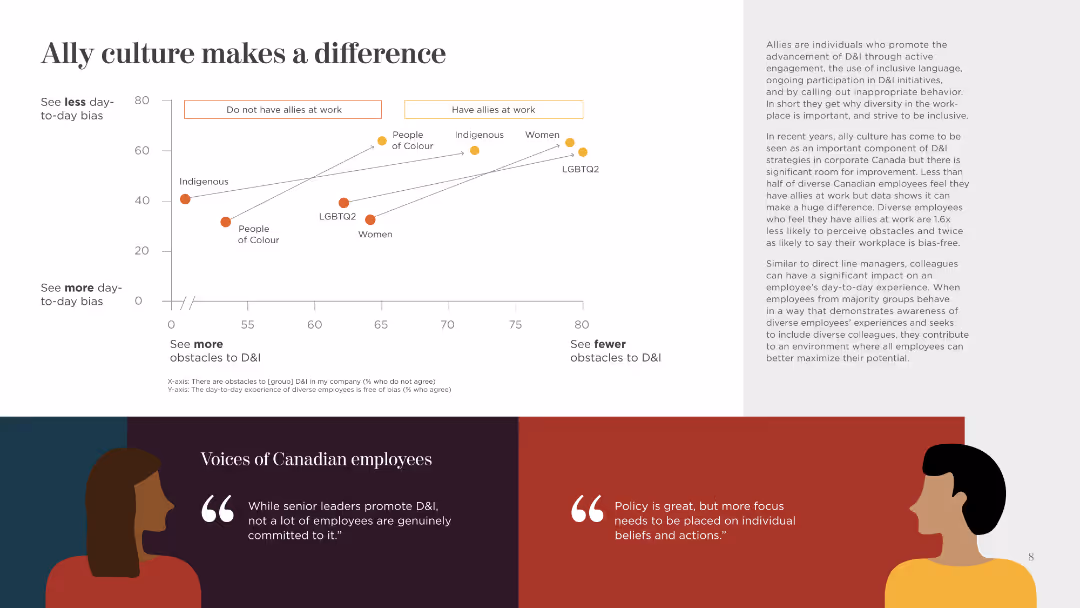
This slide presents a scatter plot comparing the presence of allies at work and the perception of day-to-day bias. It includes quotes and uses simple icons and color-coded data points.
Human Resources and Talent Management
Government & Public Sector
The slide highlights the impact of having allies in the workplace on reducing bias and fostering a more inclusive environment, supported by data and employee quotes.
Allies, Workplace, Bias, Inclusion, Impact, Data, Employee Quotes, Environment, Culture
false
Human Resources and Talent Management
Government & Public Sector government-and-public-sector
Mixed Chart
BCG
View slide
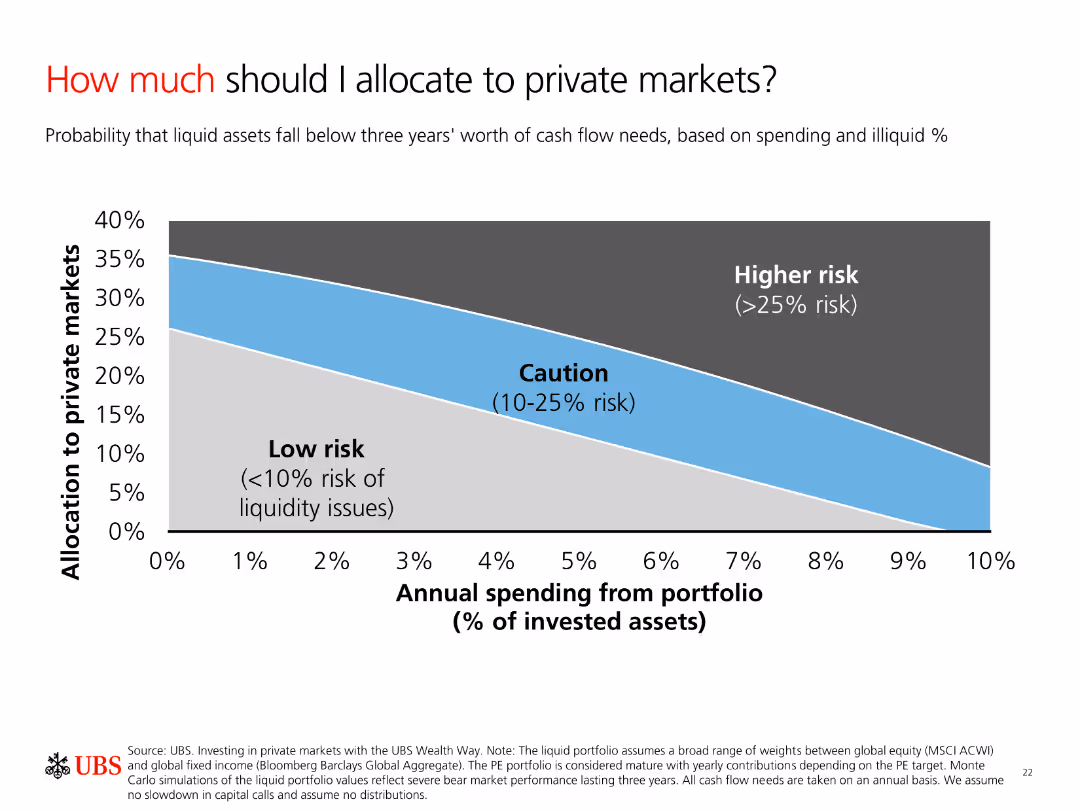
A column chart showing allocation to private markets based on risk levels. The chart categorizes risks into Low risk, Caution, and Higher risk with a smooth gradient background.
Investment Analysis
Financial Services
The slide explains the allocation of investments to private markets based on annual spending and risk levels. It helps investors understand potential liquidity risks.
Allocation, Risk, Private Markets, Spending, Liquidity
false
Investment Analysis
Financial Services financial-services
Single Chart
UBS
View slide
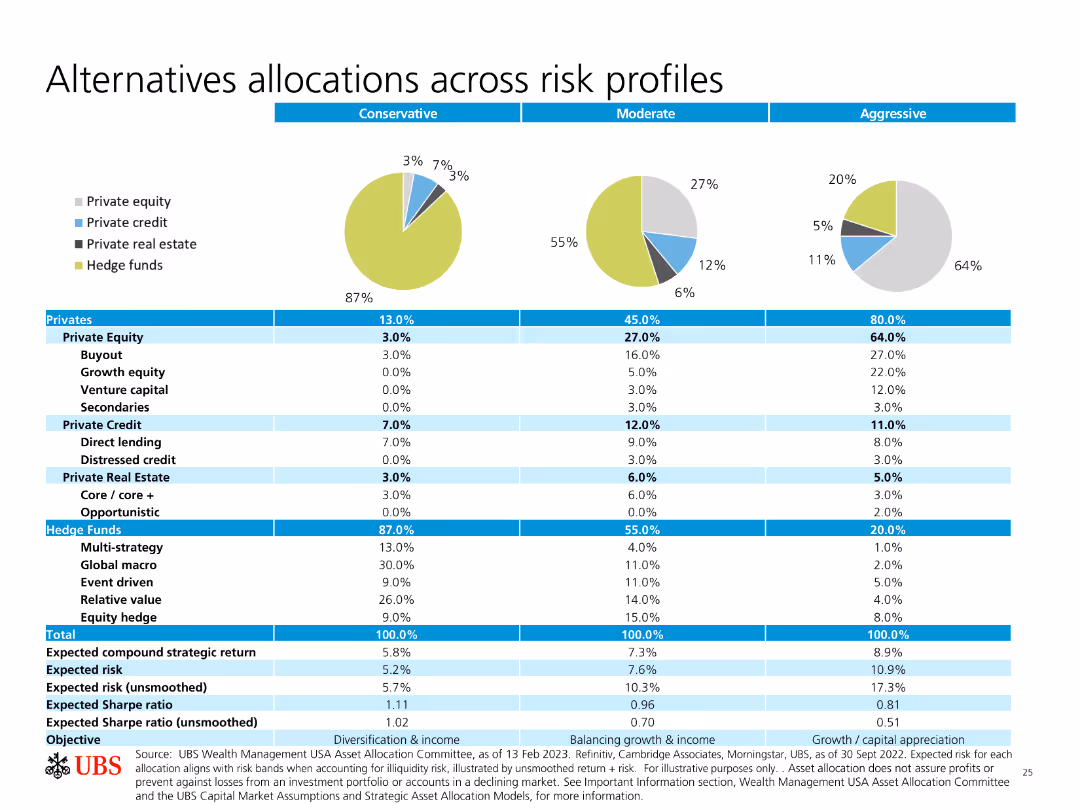
Pie charts and a table showing allocations across different risk profiles (Conservative, Moderate, Aggressive) for various investment types.
Investment Analysis
Financial Services
The slide details how different types of investments (equity, credit, real estate, hedge funds) are allocated based on risk profiles, providing expected returns and risks.
Allocations, Risk Profiles, Private Equity, Hedge Funds, Expected Returns
false
Investment Analysis
Financial Services financial-services
Multiple Chart
UBS
View slide
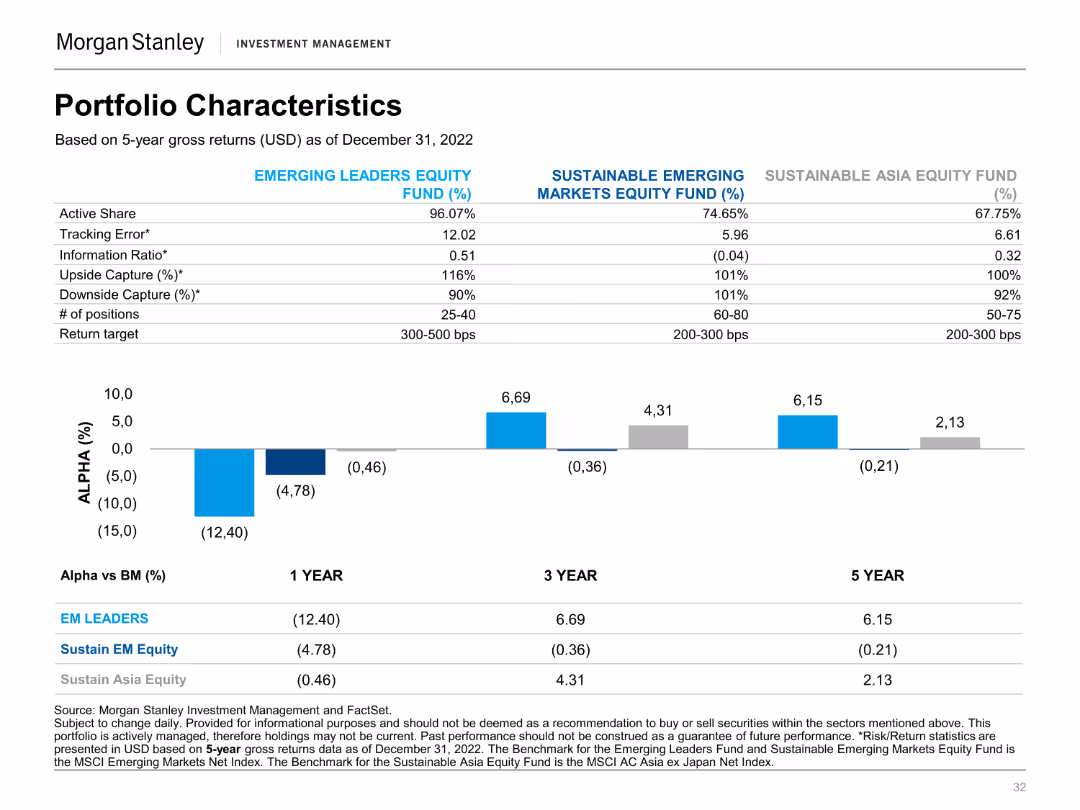
A column chart showing alpha percentages for various funds over 1, 3, and 5-year periods. It includes a table with fund characteristics and target returns.
Financial Performance
Financial Services
This slide provides a comparison of the portfolio characteristics and performance metrics of different equity funds, showing alpha values.
Alpha, Equity Funds, Performance Metrics, Portfolio, Returns, Financial, Comparison, Characteristics, Investment, Analysis
false
Financial Performance
Financial Services financial-services
Mixed Chart
Morgan Stanley
View slide
The slide contains a column chart showing market concentration levels across different access modes using an alternative approach, which considers outlet homepages within the last 5 steps and excludes subsequent visits. Annotations provided.
Market Analysis and Trends
Media & Entertainment
This slide examines market concentration levels (HHI) by access mode using an alternative approach that includes outlet homepages within the last 5 steps before reaching news articles and excludes subsequent visits, offering insights into media concentration.
Alternative Approach, Market Concentration, HHI, Column Chart, Access Mode
false
Market Analysis and Trends
Media & Entertainment media-and-entertainment
Single Chart
IPSOS
View slide
Contains tables and bullet points detailing alternative investments, their average AUS, and effective fees, alongside column chart summarizing historical principal investments rollforward.
Investment Analysis
Financial Services
Analyzes the alternative investment portfolio's performance, with a focus on average assets under supervision and fee structures. It's aimed at investors seeking detailed information on the sector's financial dynamics and investment potential.
Alternative Investments, AUS, Effective Fees, Corporate Equity, Hedge Funds, Principal Investments, Investment Portfolio, Fee Structure
false
Investment Analysis
Financial Services financial-services
Mixed Chart
Goldman Sachs
View slide
Featuring a title, tables with detailed financial data, and a column chart on historical principal investments, the slide has a moderate level of visual complexity appropriate for conveying detailed information.
Investment Analysis
Financial Services
Targets alternative investment performance within asset management, detailing average AUS and effective fees. It's used for assessing investment strategies, updating investors, or guiding financial planning. Includes management fees and fundraising achievements.
Alternative Investments, AUS, Effective Fees, Fundraising
false
Investment Analysis
Financial Services financial-services
Mixed Chart
Goldman Sachs
View slide
Contains a series of column chart detailing alternative investment asset under supervision and fees, with an emphasis on blue tones. There are also numerical lists presenting additional data on on-balance sheet investments.
Investment Analysis
Financial Services
Highlights the firm's alternative investment strategies, including assets under supervision and associated fees, designed for financial consultants or potential investors looking at alternative investment opportunities and their performance.
Alternative Investments, AUS, Fees, Strategy
false
Investment Analysis
Financial Services financial-services
Mixed Chart
Goldman Sachs
View slide
Mix of tables, column charts, and a summary section, along with textual annotations and headings for each section.
Investment Analysis
Financial Services
Slide analyzes alternative investment assets, fees, and balance sheet allocations. Appropriate for discussions on investment strategy or financial planning.
Alternative Investments, Fees, Asset Allocation
false
Investment Analysis
Financial Services financial-services
Multiple Chart
Goldman Sachs
View slide
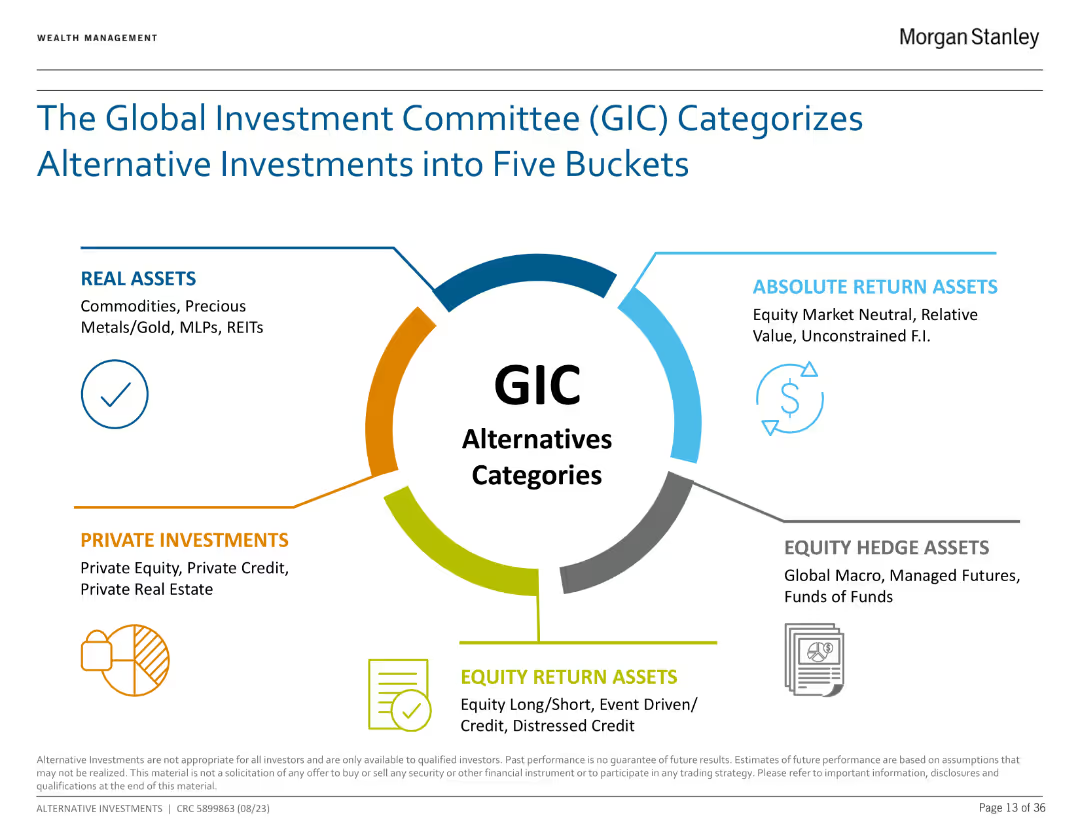
The slide features a circular diagram with five sections representing different categories of alternative investments, each with brief descriptions.
Investment Analysis
Financial Services
The slide explains the five categories of alternative investments as defined by the Global Investment Committee (GIC): Real Assets, Absolute Return Assets, Equity Hedge Assets, Private Investments, and Equity Return Assets.
Alternative Investments, GIC, Real Assets, Equity, Investment Analysis
false
Investment Analysis
Financial Services financial-services
Framework
Morgan Stanley
View slide
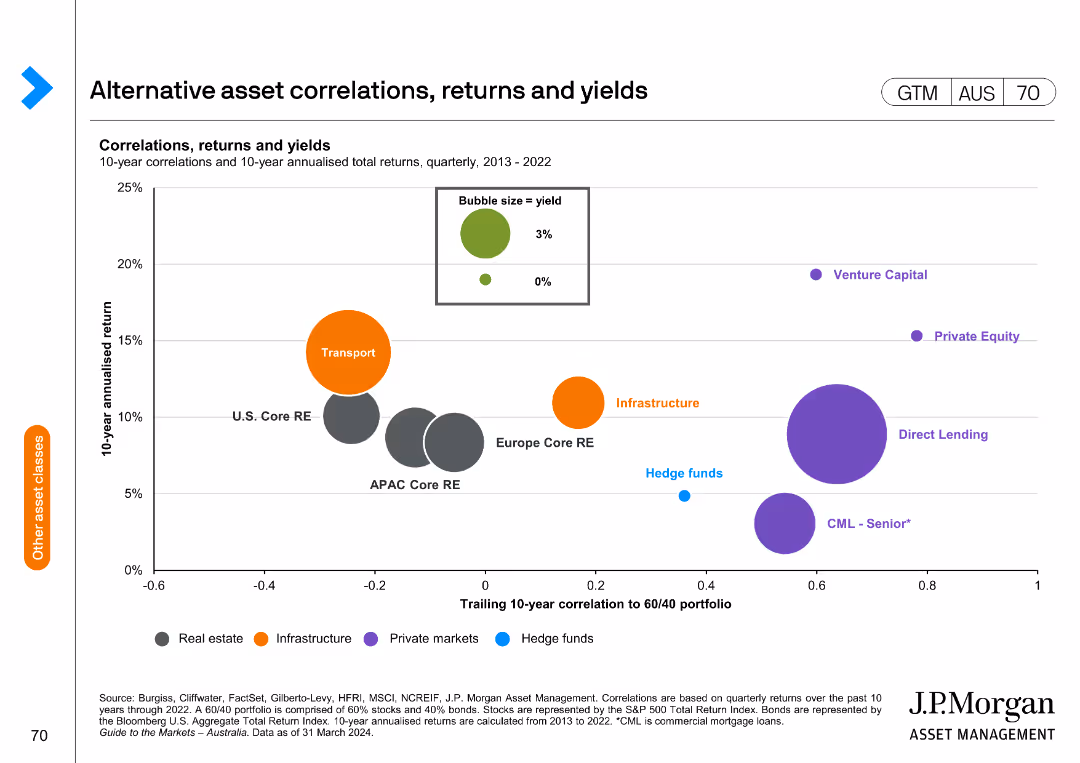
The slide features a bubble chart showing correlations, returns, and yields of alternative assets from 2013 to 2022. The x-axis represents the trailing 10-year correlation to a 60/40 portfolio, and the y-axis shows the 10-year annualized return.
Investment Analysis
Financial Services
This slide provides insights into the performance of various alternative assets, highlighting their correlations, returns, and yields for investment analysis and portfolio management.
Alternative assets, correlations, returns, yields, investment analysis, portfolio management, bubble chart
false
Investment Analysis
Financial Services financial-services
Single Chart
JP Morgan
Previous
Loading...
Hold On!
We are searching in our database
If nothing, comes up, please try different filters!
Column Chart
Heatmap
Chevron
Org Chart
Infographic
Callouts
Timeline
List
Graphic
Picture
Process Flow
Diagram
Paragraph
Map
Table
Framework
Subtitle
Takeaway Box
Icon
Other Chart
Radar Chart
Waterfall Chart
Mekko Chart
Pie Chart
Scatter Plot
Line Chart
Bar chart
Bullet points
Create a FREE account to continue browsing
Receive Instant Access to 1,000+ slides from companies like McKinsey, Google, and Goldman Sachs
First Name
Last Name
Email
Password
I agree to all
Terms & Privacy Policy
Thank you! Your submission has been received!
Oops! Something went wrong while submitting the form.
Have an account?
Sign in
Upgrade to PRO to Save slides
Advanced Search and Filters
Access to 15,000+ slides
Access to Category Pages
Save/Bookmark Slides
PowerPoint Template Library
Pick a Plan
MONTHLY
$12/month
Billed every month, Cancel anytime.
YEARLY
$9/year
Billed $108 annually, Cancel anytime.
Checkout for $12/month
Checkout for $108/yr
Secured by Stripe | AES-256 bit encryption