My Account
My Slides
Search by Category
Templates
View All Templates
Download Template Slides
✦ AI Search
Feedback
Login
Logout
Get Started
Browse all Slides
Browse all Slides
Create a FREE Account
Instant access to 1,000+ real slides from top companies like McKinsey, BCG, Goldman Sachs, Google and many more!
First Name
Last Name
Email
Password
I agree to all
Terms & Privacy Policy
Thank you! Your submission has been received!
Oops! Something went wrong while submitting the form.
Have an account?
Sign in
Go Back
View source
View source
Details
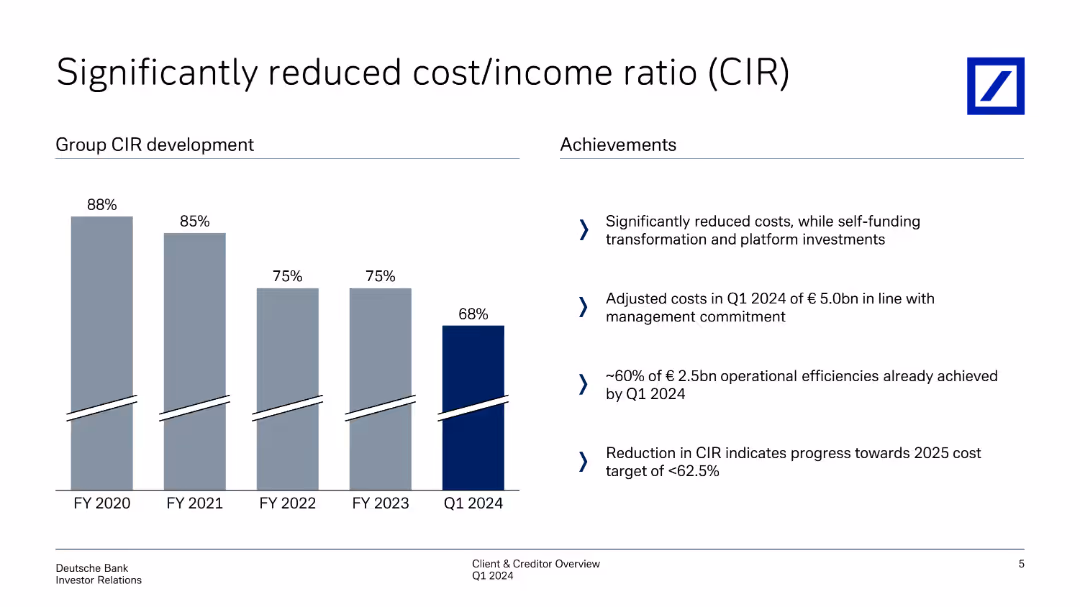
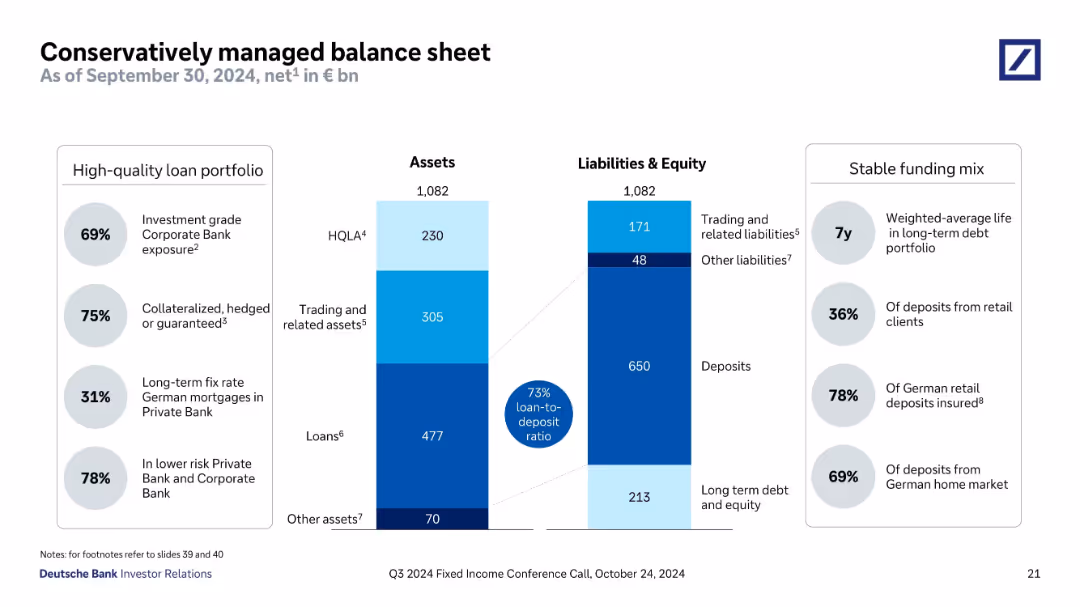
Client & Creditor Overview May, 2024
Slide type
Mixed Chart
Description
This slide shows column charts depicting the development of cost/income ratio (CIR) over fiscal years, with achievements listed on the right side.
Use Case
Operational Efficiency
Industry
Financial Services
Tags
Bullet points
Column Chart
View Similar Templates
Please submit your feedback
here
.
Note
: All slides are from public sources.
Add to my slides
Add to my slides
Add to my slides
Saved
Saving to my slides
Continue browsing similar slides with a FREE account
Receive Instant Access to 8,000+ slides
First Name
Last Name
Email
Password
I agree to all
Terms & Privacy Policy
Thank you! Your submission has been received!
Oops! Something went wrong while submitting the form.
Have an account?
Sign in
Spark Your Next Big Idea with New Presentation Templates
Go to Templates
Related
Mixed Chart
Slides
Previous
Load More