My Account
My Slides
Search by Category
Templates
View All Templates
Download Template Slides
Leave Feedback
Login
Logout
Get Started
Browse all Slides
Browse all Slides
Create a FREE Account
Instant access to 1,000+ real slides from top companies like McKinsey, BCG, Goldman Sachs, Google and many more!
First Name
Last Name
Email
Password
I agree to all
Terms & Privacy Policy
Thank you! Your submission has been received!
Oops! Something went wrong while submitting the form.
Have an account?
Sign in
Instant access to the internet's best slides
Get access to 40+ advanced filters and more
Advanced Search and Filters
Access to
10,000+ slides
Access to Category Pages
Save/Bookmark Slides
PowerPoint Template Library (New)
Choose your plan
MONTHLY
$12/month
Billed every month, cancel anytime.
YEARLY
$9/month
Billed $108 annually, cancel anytime.
Checkout for $12/month
Checkout for $108/yr
Secured by Stripe | AES-256 bit encryption
Spark Your Next Big Idea with New Presentation Templates
VIEW ALL Templates
Welcome,
Welcome
Upgrade to SlideStart
Pro
Instant access to 15,000+ slides
Show Featured Only
Checkbox 8
Companies
Mckinsey
Bain
BCG
EY
Deloitte
Accenture
PwC/Strategy&
JP Morgan
Goldman Sachs
Morgan Stanley
Citigroup
Deutsche Bank
Barclays
LEK
Kearney
Oliver Wyman
Booz Allen Hamilton
Gartner
IPSOS
Nielsen
Slide type
Header Horizontal
Framework
Vertical Flow
Single Chart
Single Chart
Text Only
Mixed Chart
Header Vertical
Graphic
Pillar
Multiple Chart
Agenda
Title
Table
Linear Flow
Upgrade to SlideStart
Pro
Instant access to 40+ advanced filters
Industry
Upgrade to SlideStart
Pro
Instant access to 40+ advanced filters
Technology
Healthcare
Financial Services
Consumer Goods
Energy & Utilities
Manufacturing
Retail
E-commerce
Logistics
Telecommunications
Real Estate
Professional Services
Education
Media
Entertainment
Hospitatlity
Tourism
Agriculture
Food Production
Government & Public Sector
Environmental
Sustainability
Use Case
Upgrade to SlideStart
Pro
Instant access to 40+ advanced filters
Sales and Business Development
Mergers and Acquisitions
Corporate Finance and Valuation
Performance Metrics and KPIs
Client Case Studies
Competitive Landscape
Product and Service Analysis
Customer and Market Segmentation
Organizational Structure
Human Resources and Talent Management
Industry Overview
Regulatory and Compliance
Risk Assessment and Management
Agriculture & Food Production
Hospitality and Tourism
Government
Environmental
Sustainability
Clear all
Thank you! Your submission has been received!
Oops! Something went wrong while submitting the form.
Show Featured Only
Checkbox 8
Companies
Mckinsey
Bain
BCG
EY
Deloitte
Accenture
PwC/Strategy&
JP Morgan
Goldman Sachs
Morgan Stanley
Citigroup
Deutsche Bank
Barclays
LEK
Kearney
Oliver Wyman
Booz Allen Hamilton
Gartner
IPSOS
Nielsen
Slide type
Text Only
Linear Flow
Vertical Flow
Single Chart
Header Horizontal
Mixed Chart
Header Vertical
Pillar
Multiple Chart
Graphic
Agenda
Title
Table
Framework
Industry
Technology
Healthcare
Financial Services
Consumer Goods
Energy & Utilities
Manufacturing
Retail
E-commerce
Logistics
Telecommunications
Real Estate
Professional Services
Education
Media
Entertainment
Hospitatlity
Tourism
Agriculture
Food Production
Government & Public Sector
Environmental
Sustainability
Use Case
Sales and Business Development
Mergers and Acquisitions
Corporate Finance and Valuation
Performance Metrics and KPIs
Client Case Studies
Competitive Landscape
Product and Service Analysis
Customer and Market Segmentation
Organizational Structure
Human Resources and Talent Management
Industry Overview
Regulatory and Compliance
Risk Assessment and Management
Agriculture & Food Production
Hospitality and Tourism
Government
Environmental
Sustainability
Clear all
Thank you! Your submission has been received!
Oops! Something went wrong while submitting the form.
Tag
View slide
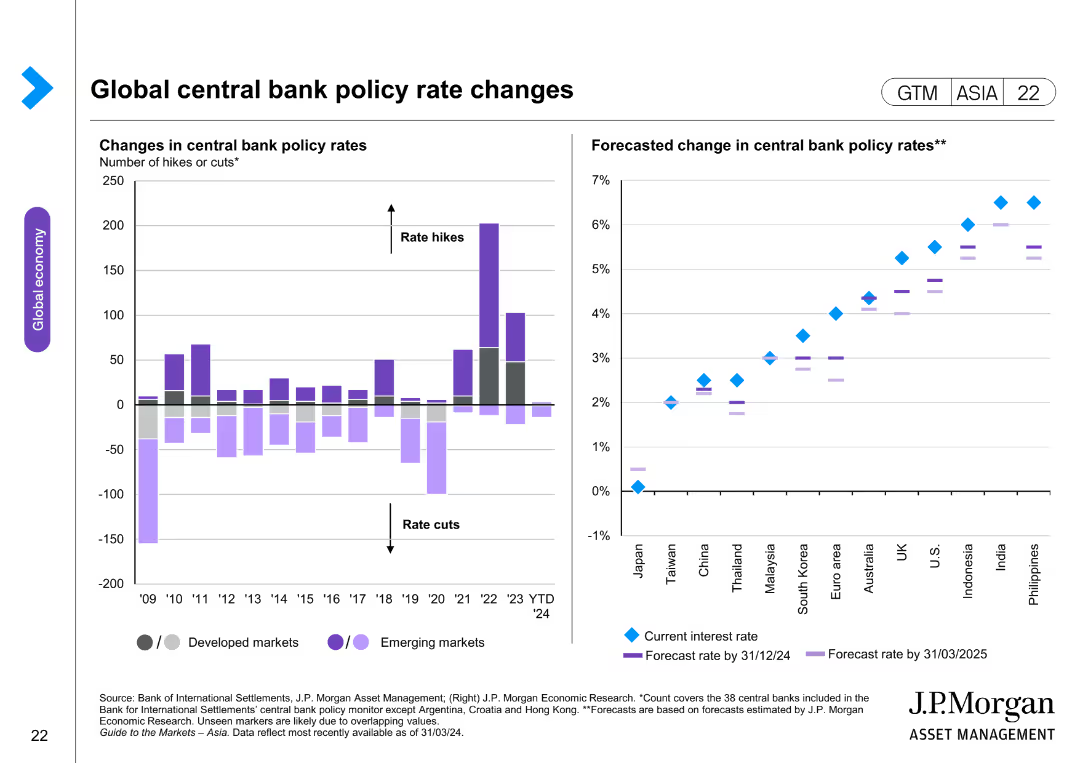
The slide contains two column charts. The left chart shows changes in central bank policy rates for developed and emerging markets. The right chart forecasts changes in central bank policy rates, with separate markers for current and forecasted rates.
Market Analysis and Trends
Financial Services
The slide analyzes changes and forecasts in global central bank policy rates, providing insights into monetary policy trends. It is useful for understanding economic strategies and planning.
central bank, policy rates, economic strategy, financial analysis, developed markets, emerging markets, monetary policy
false
Global central bank policy rate changesGuide to the Markets Asia | 2Q 2024
Multiple Chart
JP Morgan
View slide
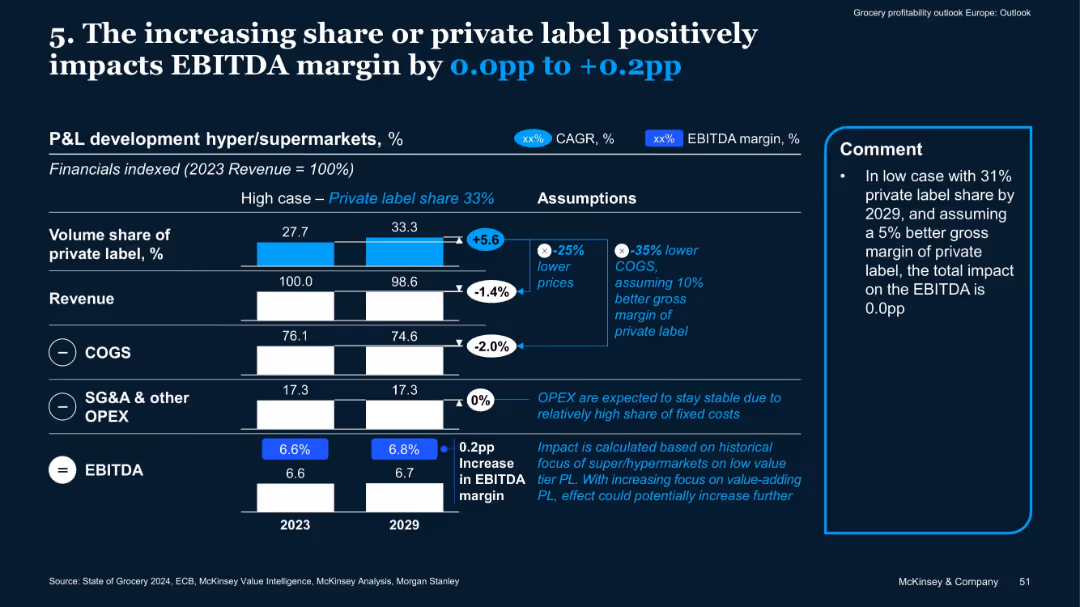
Vertical bar comparisons 2023 vs. 2029, assumptions box, side comment box
Financial Performance
Retail & E-commerce
The slide highlights how growing private label share (from 27.7% to 33.3%) can improve EBITDA margins by 0.0 to +0.2pp due to lower COGS and value-focused strategies. Stable OPEX assumptions also support margin gains.
private label, EBITDA, revenue, margins, OPEX, COGS, supermarkets
false
5. The increasing share or private label positively impacts EBITDA margin by 0.0pp to +0.2ppGrocery profitability outlook –Europe
Mixed Chart
McKinsey
View slide
Displays a bold title with a line graph beneath it showing the growth of e-commerce over a decade, annotated with key points.
Market Analysis and Trends
Retail & E-commerce
This slide demonstrates the rapid acceleration of e-commerce adoption as a share of retail sales, suggesting a transformative shift in shopping habits.
e-commerce growth, retail trends, market analysis, digital transformation, sales data, pandemic impact
false
eCommerce has seen 10 years of growth in a matter of monthsHow is COVID-19 changing the retail consumer?
Single Chart
Accenture
View slide
The slide features two donut charts showing the composition of a servicing portfolio and a limited servicing portfolio. They are color-coded and labeled with different sectors like Fannie Mae, Freddie Mac, and others. There is a list of notes below explaining key points related to the data shown.
Financial Performance
Financial Services
It illustrates the composition and performance of a company's servicing portfolio, highlighting its diversification and year-over-year revenue increase. It is valuable for investors or management reviewing financial health and diversification in revenue sources, particularly in financial servicing sectors.
Servicing Portfolio, Revenue, TTM, Financial Health, Diversification, Fannie Mae, Freddie Mac
false
Servicing Portfolio Generated $218.5 million over TTM, up 15.8% YoYFixed Income Investor Presentation for Goldman Sachs Annual Leveraged Finance & Credit Conference
Single Chart
Goldman Sachs
View slide
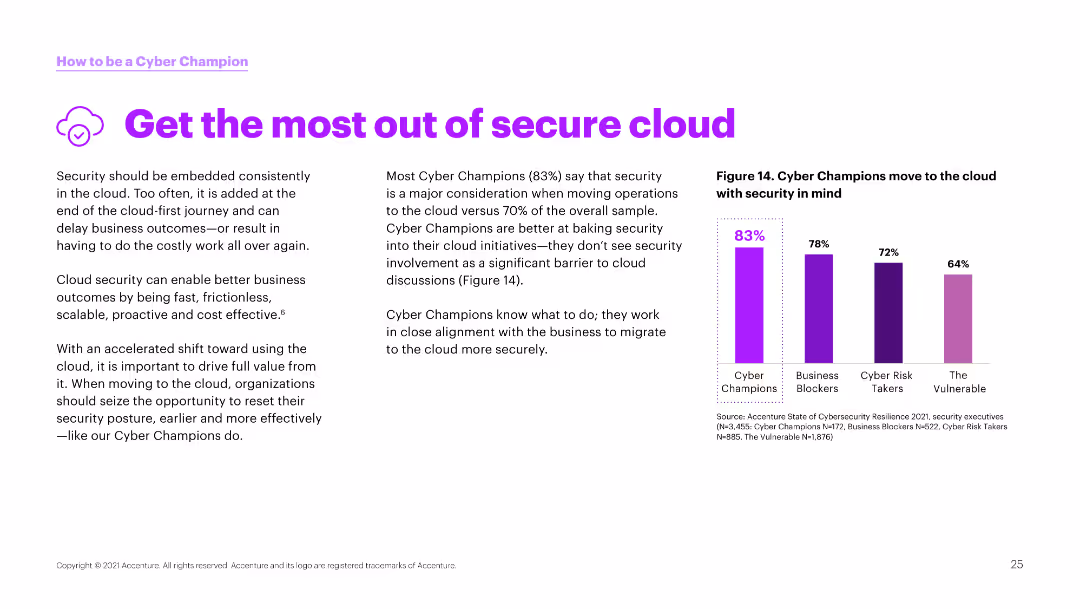
The slide has a white background with a column chart on the right side. The left side contains text discussing the importance of integrating security in cloud operations.
Technology and Digital Transformation
Technology & Software
This slide emphasizes the significance of embedding security in cloud operations for better business outcomes and the high percentage of cyber champions prioritizing cloud security.
Cloud security, business outcomes, cybersecurity, cloud operations, champions, integration, security, digital transformation, alignment
false
Get the most out of secure cloudHow aligning security and the business creates cyber resilience
Mixed Chart
Accenture
View slide
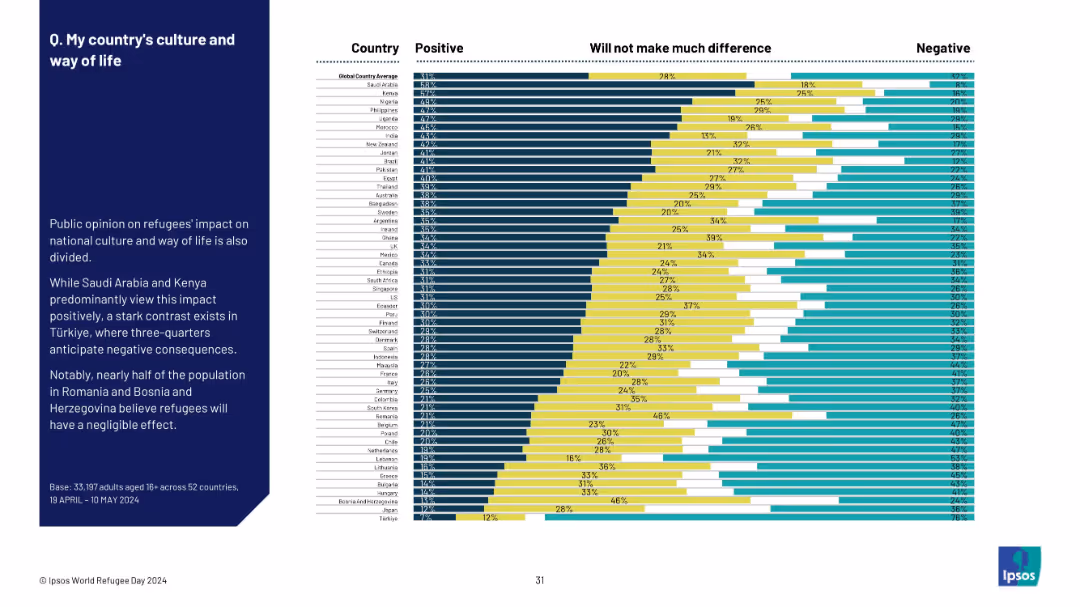
Similar visual style: bar chart by country with summary on the left; divided by impact perception.
Market Analysis and Trends
Government & Public Sector
This slide shows how public opinion on refugees' impact on national culture varies by country. While Saudi Arabia and Kenya are optimistic, countries like Türkiye are more negative. Bosnia sees the impact as mostly neutral.
refugees, culture, national identity, public opinion, Ipsos, global perception, sentiment, national values, integration
false
Q. My country's culture and way of lifeWORLD REFUGEE DAY
Mixed Chart
IPSOS
View slide
Features a stacked area chart tracking the frequency of COVID-19 variants over time with multiple color-coded layers representing different variants.
Market Analysis and Trends
Healthcare & Pharmaceuticals
This slide presents the dominance of the Delta variant among COVID-19 cases over time, useful for epidemiological tracking and vaccine strategy adjustments.
COVID-19, Delta variant, epidemiology, vaccine strategy, variant tracking
false
Despite progress on vaccination across the world, caution required as transmissible Delta variant becomes dominantHow COVID-19 Changed the Consumer
Single Chart
BCG
View slide
This slide features a tripartite layout with three content blocks, each with an icon, title, and bullet points describing strategies for increasing recurring revenues. The layout is balanced with equal spacing and a minimalist design.
Strategic Planning
Financial Services
The slide details strategies to increase recurring revenues, focusing on property management business, global corporate services, and investing in predictable businesses. It's aimed at stakeholders interested in understanding and evaluating the company's growth strategies and potential for scaling.
Recurring Revenues, Strategy, Property Management, Global Services, Investment
false
How We Expect to Further Increase Recurring RevenuesFixed Income Investor Presentation for Goldman Sachs Annual Leveraged Finance & Credit Conference
Pillar
Goldman Sachs
View slide
This slide displays a title, two column charts comparing filings, finalisations, and pending applications, and a line graph showing clearance rates for FCoA and FCC, indicating a backlog in both courts.
Regulatory and Compliance
Government & Public Sector
The slide compares filings and finalisations in FCoA and FCC, revealing a pending caseload exceeding filed and finalised cases, and examines clearance rates, suggesting a lag in keeping pace with filings.
FCoA, FCC, case filings, finalisations, clearance rates, legal backlog, pending applications
false
The family law backlog in the courtsReview of efficiency of the operation of the federal courts
Multiple Chart
PwC/Strategy&
View slide
Descriptive graphs showing six OEM archetypes with details on BEV starting points, market shares, and primary markets. Each archetype is color-coded and has comparative bars.
Competitive Landscape
Transportation & Logistics
Details various OEM archetypes and their initial market positions in the electric vehicle sector, focusing on differences in strategy and market share from 2022 to 2030.
OEM, archetypes, BEV, market position, strategy
false
Six different OEM archetypes with different BEV starting pointsThe Combustion Engine Business Model in the Age of Electromobility
Multiple Chart
BCG
View slide
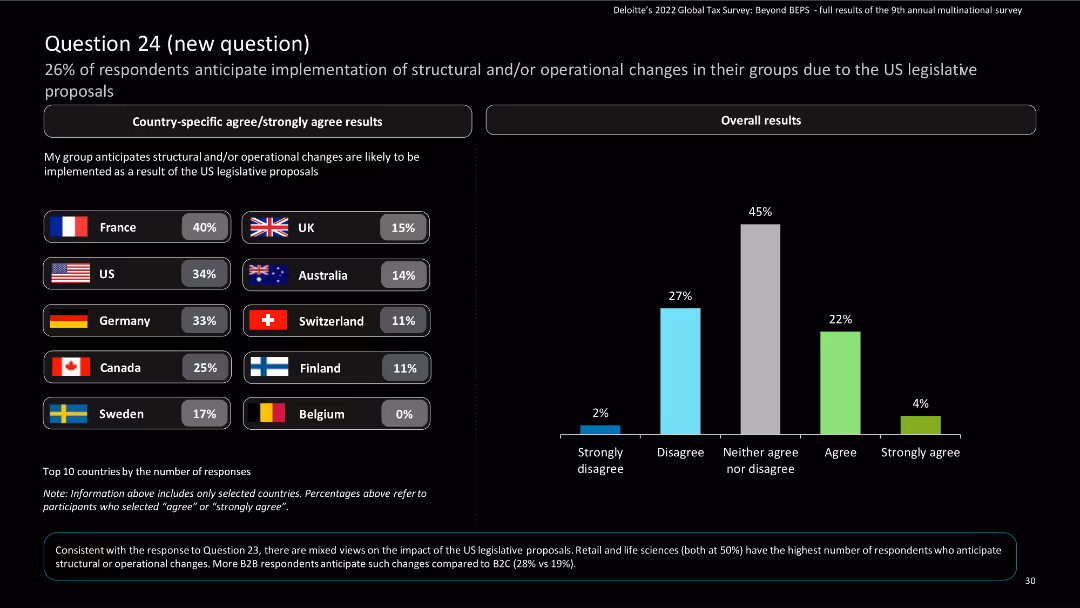
The slide features bar charts and column charts to represent anticipated structural and operational changes due to US legislative proposals.
Market Analysis and Trends
Financial Services
It shows the percentage of respondents expecting structural or operational changes in their groups due to US legislative proposals, with country-specific data.
survey, column chart, structural changes, countries
false
Question 24 (new question) 26% of respondents anticipate implementation of structural and/or operational changes in their groups due to the US legislati ve proposalsDeloitte’s 2022 Global Tax Survey: Beyond BEPS
Mixed Chart
Deloitte
View slide
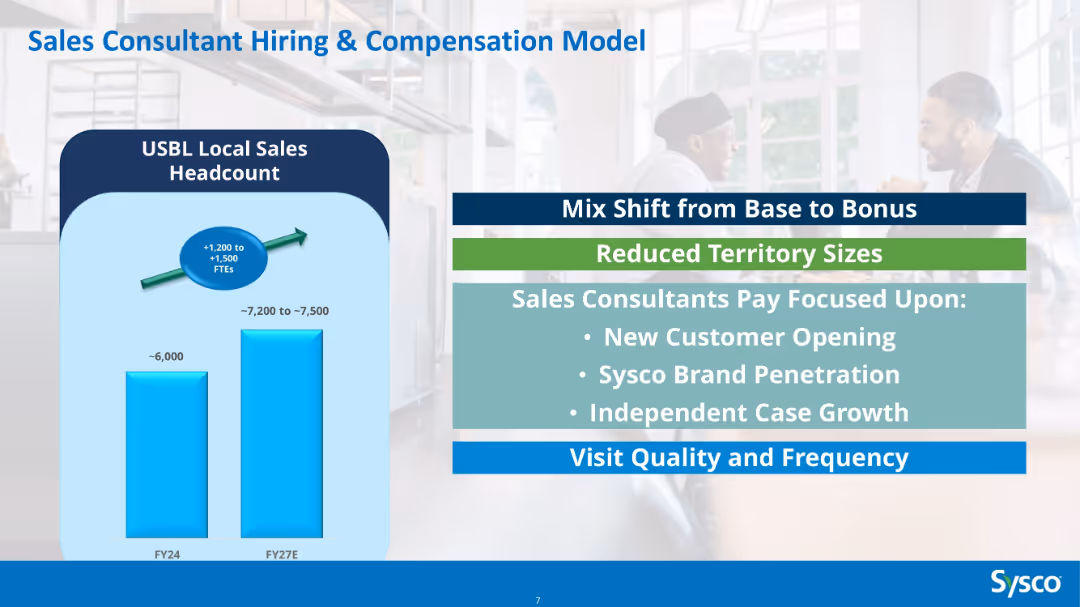
Bar chart comparing FY24 vs FY27E headcount, overlayed with text blocks listing compensation strategy shifts.
Human Resources and Talent Management
Consumer Goods
Describes a hiring plan to increase Sysco’s local sales headcount by ~1,200–1,500 FTEs by FY27. Includes pay structure shifts from base to bonus, smaller territories, and focus areas like new customer acquisition and brand penetration.
sales team, hiring, compensation, Sysco, strategy, headcount, bonuses, HR, FTE growth
false
Sales Consultant Hiring & Compensation ModelBarclays 17th Annual Consumer Staples Conference 2024
Mixed Chart
Barclays
View slide
This slide shows a column chart and a line graph on SACU revenue over time. It illustrates actual revenues and their percentage of total revenue, highlighted with a dotted line.
Regulatory and Compliance
Government & Public Sector
Focuses on the Southern African Customs Union (SACU) revenue streams, analyzing past performance and future projections.
SACU, revenue analysis, projections, fiscal planning, customs
false
SACU RevenueBudget on a plate 2019/2020
Single Chart
PwC/Strategy&
View slide
The slide summarizes strategic focus areas through four segments with icons and brief descriptions: delivering products, software development capabilities, data power, and customer protection. It employs a clear layout with each segment distinctly color-coded for emphasis.
Strategic Planning
Financial Services
Summarizes the bank's strengths in delivering products, enhancing software development, leveraging data, and protecting customers with a focus on technology.
Strategic Planning, Product Differentiation, Financial Services, Technology, Data Utilization, Cybersecurity, Customer Protection
false
We are well positioned to differentiate ourselves with technologyGlobal Technology
Pillar
JP Morgan
View slide
A map of China highlighting luxury consumer percentages by province, and pie charts on the right
Market Analysis and Trends
Retail & E-commerce
Analyzes geographical distribution of luxury consumers in China and categorizes city tiers
Luxury, Consumers, China, City Tiers, Geography
false
50% of luxury consumers live beyond top 15 citiesChina Luxury Digital Playbook
Multiple Chart
BCG
View slide
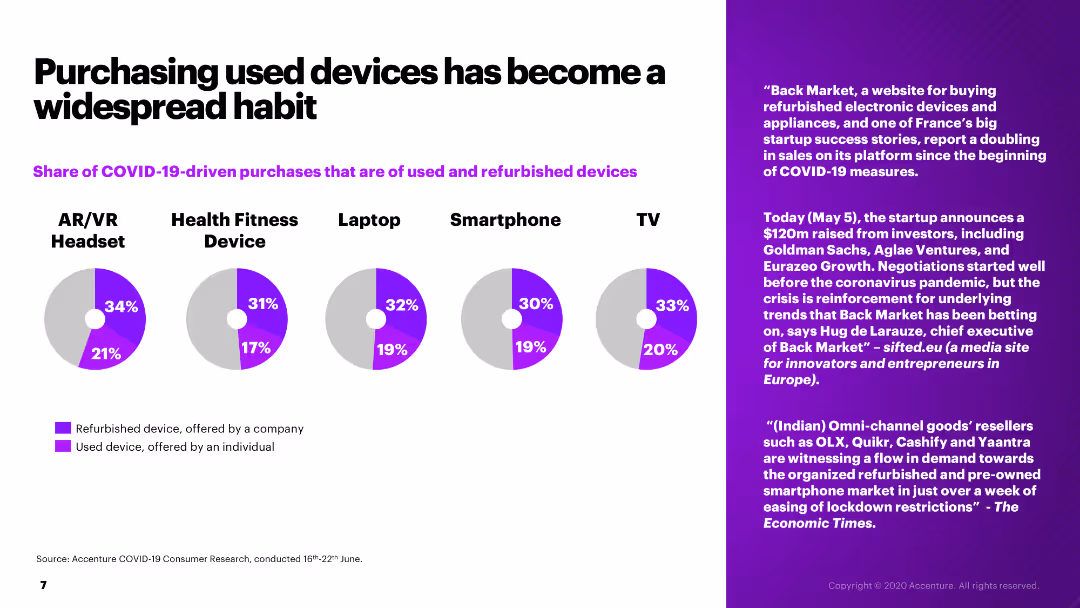
The slide features pie charts showing the share of COVID-19-driven purchases that are used and refurbished devices across various product categories.
Market Analysis and Trends
Retail & E-commerce
The slide examines the trend of purchasing used and refurbished devices due to COVID-19, with statistics on various electronic categories and consumer habits.
used devices, refurbished devices, COVID-19, consumer trends, electronics
false
Purchasing used devices has become a widespread habitHow will COVID-19 change the consumer?
Multiple Chart
Accenture
View slide
Features icons next to text headings, each representing different sections of the report. The design is straightforward, utilizing white space effectively to enhance readability.
Organizational Structure and Change
Environmental Services & Sustainability
Outlines the main sections of the presentation which include investment opportunities, impediments to change, and recommendations for accelerating the green economy.
Agenda, sections, green economy, investment opportunities, recommendations
false
Contents 2022: Moving from promises to action A year of new challengesSoutheast Asia’s Green Economy 2022 Report
Agenda
Bain
View slide
The slide contains column charts showing the progression of Equifax's Vitality Index over several years, emphasizing new product introductions and their impact on the index.
Performance Metrics and KPIs
Financial Services
This slide presents the performance of Equifax in terms of its Vitality Index, highlighting the success of new product introductions and their impact on company performance and strategic direction.
Vitality Index, performance, product introductions, Equifax
false
14% Vitality Index a record and well above 10% LT Framework… 30+ NPIs in Quarter, 65 YTDBarclays Credit Bureau Day
Mixed Chart
Barclays
View slide
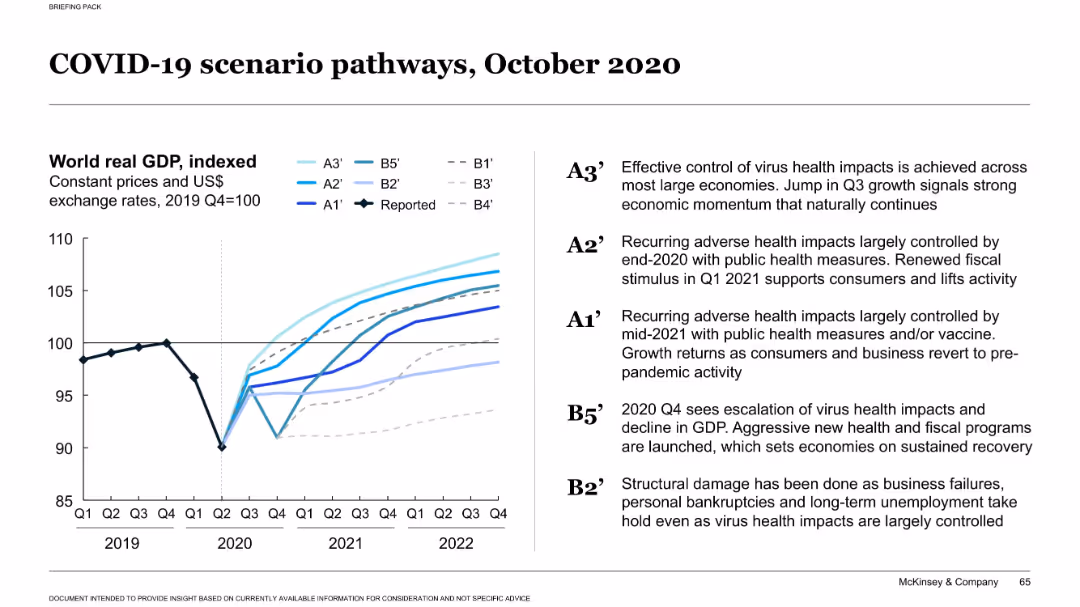
Left-aligned GDP line chart with 9 scenario curves and annotated legends; text explanations on right
Market Analysis and Trends
Financial Services
The slide outlines different COVID-19 economic recovery scenarios through 2022, highlighting various health and fiscal responses. Each pathway (A3’ to B2’) reflects different timelines and outcomes for world GDP recovery based on virus control and economic stimulus levels.
GDP, scenario planning, COVID-19, economic forecast, recovery models
false
COVID-19 scenario pathways, October 2020COVID-19: Briefing materials
Mixed Chart
McKinsey
View slide
Features a column chart showing responses about the future role of crypto assets, divided into several ratings.
Market Analysis and Trends
Financial Services
The slide discusses Canadians' opinions on the future role of crypto assets, showing a split view but with a significant portion believing in their importance. It also highlights the correlation between demographics and their views on crypto.
Crypto assets, future, financial ecosystem
false
Crypto Assets FutureRole in the Financial EcosystemCRYPTO ASSET SURVEY
Mixed Chart
IPSOS
View slide
Features combined column charts on demand, supply, and forecast of refined nickel with annotations on a dark background. Focuses on the discrepancy between supply and expected demand from 2021 to 2031.
Market Analysis and Trends
Energy & Utilities
Discusses the projected supply and demand for refined nickel, indicating a potential long-term shortage influenced by electric vehicle production, despite efforts to balance market pressures with alternative technologies.
nickel, supply demand, electric vehicles, shortage
false
With current demand trends, a long-term shortage of nickel is expected, driven by EV growthBattery materials demand and supply perspective
Single Chart
McKinsey
View slide
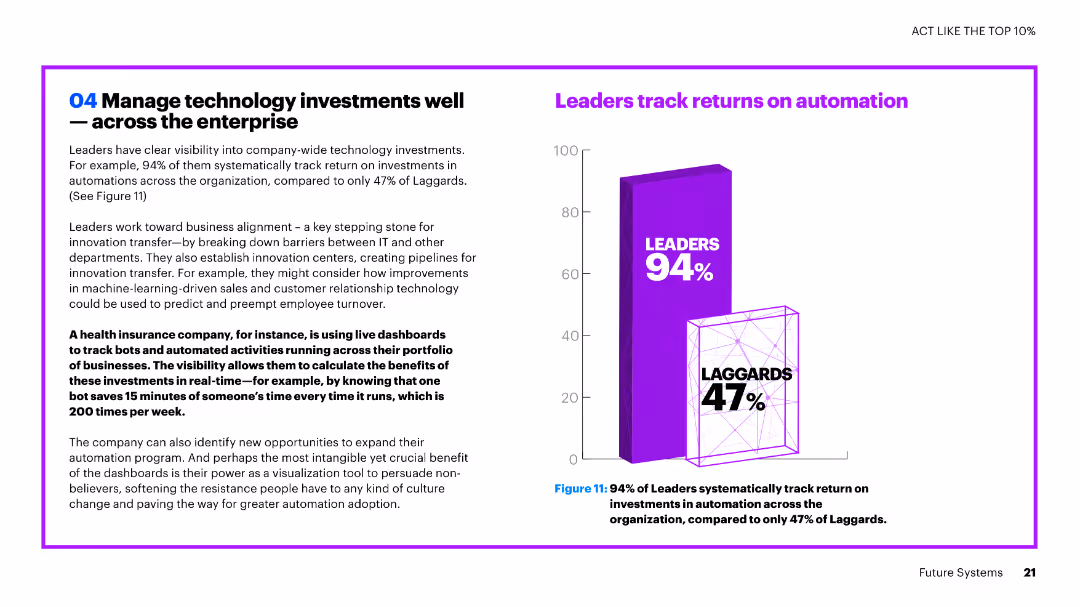
The slide contains text and a vertical column chart. The chart compares the percentage of leaders and laggards in tracking returns on automation investments.
Investment Analysis
Financial Services
The slide emphasizes the importance of tracking technology investments, highlighting that a high percentage of leaders track returns on automation investments compared to laggards.
technology investments, automation, leaders, laggards, tracking, returns, financial services, comparison
false
04 Manage technology investments well — across the enterpriseFULL VALUE. FULL STOP How to scale innovation and achieve full value with Future Systems
Mixed Chart
Accenture
View slide
The slide includes a column chart detailing the methods of payment used to purchase crypto assets in 2023 and 2022. Methods include cash savings, credit cards, and loans.
Financial Performance
Financial Services
This slide provides insights into the various methods used to finance crypto asset purchases, comparing 2023 with 2022. It helps in understanding the financial behaviors of crypto investors.
Crypto, Payment, Financing, Methods, Comparison
false
Crypto Assets Method of Payment Cash savings continue to be the most common way to finance the purchase of crypto assets, with 46% of owners reporting to have used cash savings (consistent with 2022).CRYPTO ASSET SURVEY 2023
Mixed Chart
IPSOS
View slide
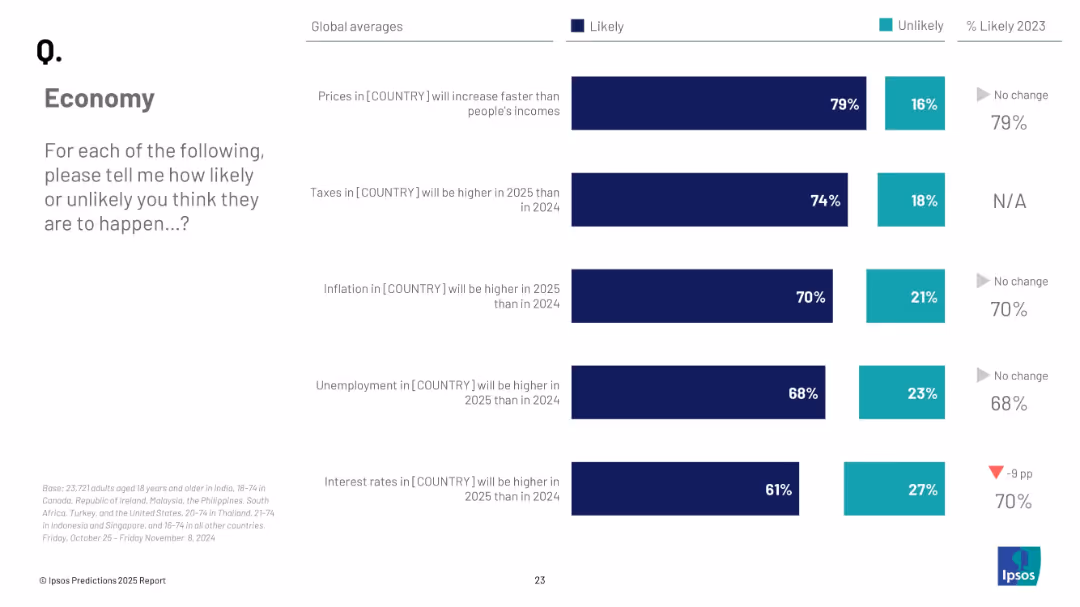
Stacked bar chart showing global averages of how likely people believe five economic events will occur in 2025, including prices, taxes, inflation, etc.
Strategic Planning
Financial Services
A global snapshot of predicted economic conditions for 2025, including anticipated changes in prices, taxes, inflation, unemployment, and interest rates. Most expectations trend toward worsening conditions.
economy, global trends, inflation, taxes, unemployment, strategic forecast, Ipsos, 2025
false
EconomyPREDICTIONS 2025 REPORT
Mixed Chart
IPSOS
View slide
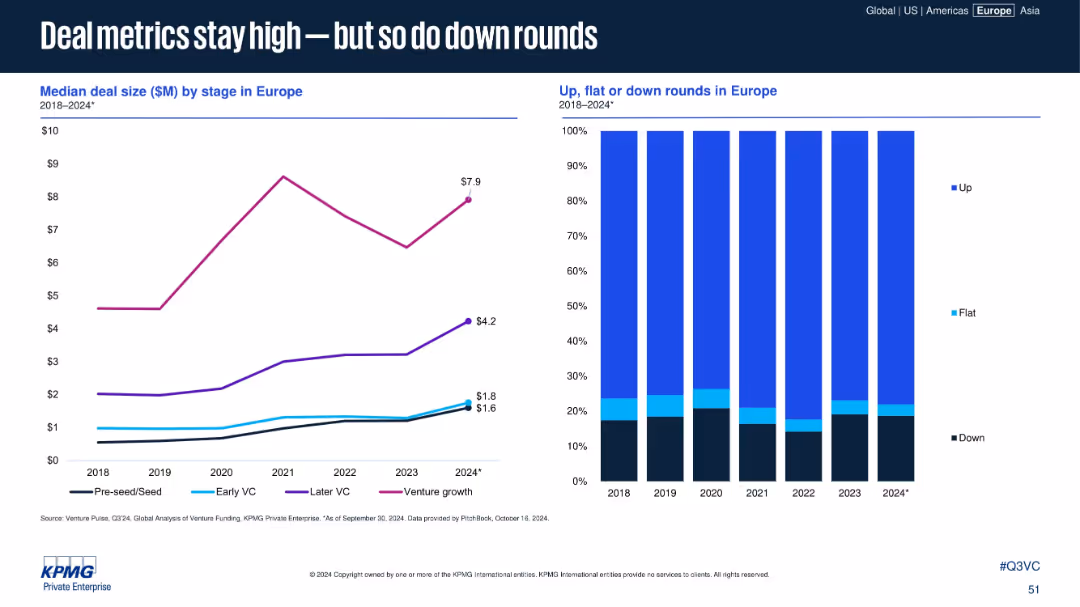
Left panel: line chart of median deal size by stage. Right panel: stacked bar chart of round types (up/flat/down)
Performance Metrics and KPIs
Financial Services
This slide compares deal size trends across VC stages and the distribution of deal rounds (up, flat, down) from 2018 to 2024. Despite high valuations, down rounds remain significant, reflecting investor caution.
VC stage, median deal size, down rounds, early-stage funding, Europe
false
Deal metrics stay high — but so do down roundsVenture Pulse Q3 2024
Multiple Chart
KPMG
View slide
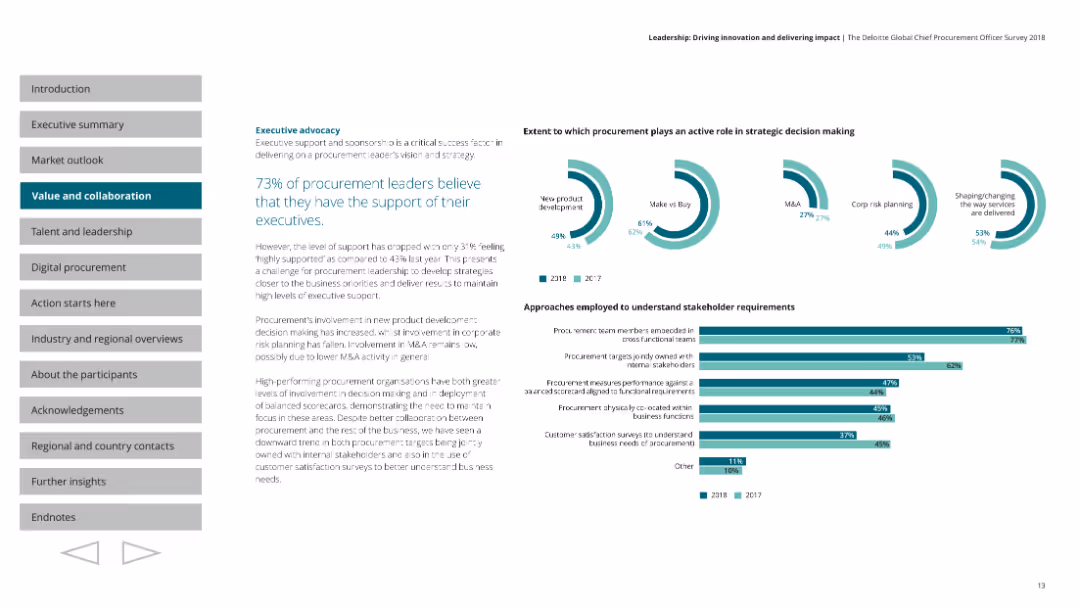
A pie chart showing the extent to which procurement leaders believe they have executive support. Multiple pie charts depicting the role of procurement in strategic decision-making. Horizontal bar charts show approaches to understanding stakeholder requirements. Text is on the left with pie charts and bar charts on the right.
Strategic Planning
Professional Services
Highlights that 73% of procurement leaders believe they have executive support, though this is a decrease from the previous year. Discusses the role of procurement in strategic decision-making and approaches to understanding stakeholder requirements.
procurement, leadership, advocacy, stakeholders, strategy
false
Extent to which procurement plays an active role in strategic decision makingLeadership: Driving innovation and delivering impact The Deloitte Global Chief Procurement Officer Survey 2018
Multiple Chart
Deloitte
View slide
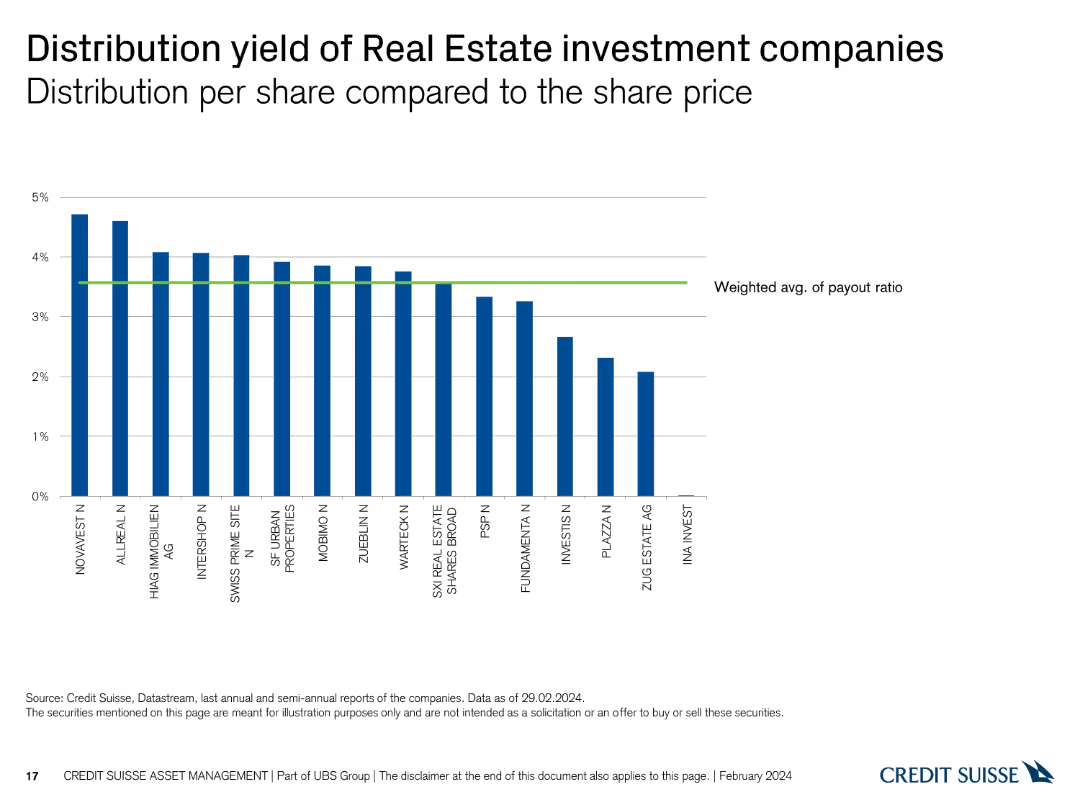
The slide includes a column chart showing the distribution yield per share compared to the share price for various Real Estate investment companies.
Financial Performance
Real Estate & Construction
It evaluates the distribution yield of different Real Estate companies, assisting in investment analysis based on yield performance.
distribution yield, Real Estate, investment, companies, share price
false
Distribution yield of Real Estate investment companies Distribution per share compared to the share priceSwiss Real Estate Funds At a glance
Single Chart
Credit Suisse
View slide
Column charts comparing the share of deals involving strategic vs. financial investors in the T&L sector.
Investment Analysis
Transportation & Logistics
Analyzes the role of strategic and financial investors in shaping the transportation and logistics market.
Investors, Strategic, Financial, Transportation, Logistics, Deals, Market, Analysis
false
Strategic investors slowly expanding share of dealsTransport & Logistics Barometer
Mixed Chart
PwC/Strategy&
View slide
This slide is a split layout with a title section, a left-hand bullet list, and a right-hand bar chart with a 0-10 scale. The color scheme includes blue, yellow, and green. There is a balance of textual information and visual data, with a clear presentation of the Net Promoter Score.
Market Analysis and Trends
Retail & E-commerce
The slide communicates merchants' satisfaction with digital platforms and their likelihood to recommend these platforms to peers, backed by a bar chart visualizing Net Promoter Score (NPS). It highlights the top reasons for merchant satisfaction, such as simplicity, ease of transaction, and customer base, serving as a persuasive data point for platform reliability.
digital platforms, merchants, satisfaction, NPS, ease of transaction, customer base, simplicity
false
Digital merchants are highly satisfied with the digital platforms they usee-Conomy SEA 2021 Roaring 20s: The SEA Digital Decade
Mixed Chart
Bain
View slide
Uses bar chart with segmented opinions and historical comparison table.
Market Analysis and Trends
Government & Public Sector
Suggests 49% of respondents across 28 countries agree that rule-breaking strong leaders are needed for reform. Thailand and India show the highest support. The chart highlights a willingness to bypass traditional norms to enable change.
strong leader, reform, authoritarianism, political sentiment, rule-breaking
false
To fix [Country], we need a strong leader willing to break the rulesPOPULISM IN 2024
Mixed Chart
IPSOS
View slide
A slide with a mixture of bullet points and charts, focusing on the inefficiencies of remote work. It includes sub-sections with icons and a bar graph comparing productivity decay in different site complexities.
Operational Efficiency
Professional Services
Examines the challenges of work-from-home setups, focusing on structural, people, process, and technology inefficiencies. Offers insights for HR departments and managers overseeing remote teams.
Remote work, Efficiency, Team cohesion, Productivity, Organizational structure
false
Employee work from home deep dive (1/2) Key challenge of remote teams (if left unmitigated) is reduced efficiency and cohesionCOVID-19: Briefing Note
Mixed Chart
McKinsey
View slide
Includes a bar chart showing consumer preferences for smartphone features, focusing on battery life and camera quality.
Product and Service Analysis
Telecommunications
Highlights consumer preferences for certain smartphone features like battery life and camera, while noting lower interest in eco-friendly specifications.
smartphone features, consumer preferences, battery life, camera quality, sustainability
false
Consumers (continue to) demand great battery life and a camera from their future smartphone. Sustainability credentials such as carbon footprint, use of recycled materials, are the leastimportant.Digital Consumer Trends 2023
Mixed Chart
Deloitte
View slide
Pie charts showing the employment status and satisfaction levels of highly skilled workers in local companies.
Human Resources and Talent Management
Professional Services
Surveys the employment trends among highly skilled workers in local companies, noting high satisfaction and mobility.
Employment trends, skilled workers, job satisfaction, local companies
false
Local businesses are also the majority employer todayRe-focus your talent lens: Abundance awaits
Multiple Chart
Accenture
View slide
The slide features a large image of a network globe with text on the right and a trend assessment.
Technology and Digital Transformation
Technology & Software
Covers the significance of data and AI in creating personalized consumer experiences and improving supply chain automation.
Data, AI, Personalization, Consumer Experience, Supply Chain, Automation, Blockchain
false
Data Era & AI Consumer ProfilingTrendRadar: The Future Consumer
Multiple Chart
Deloitte
View slide
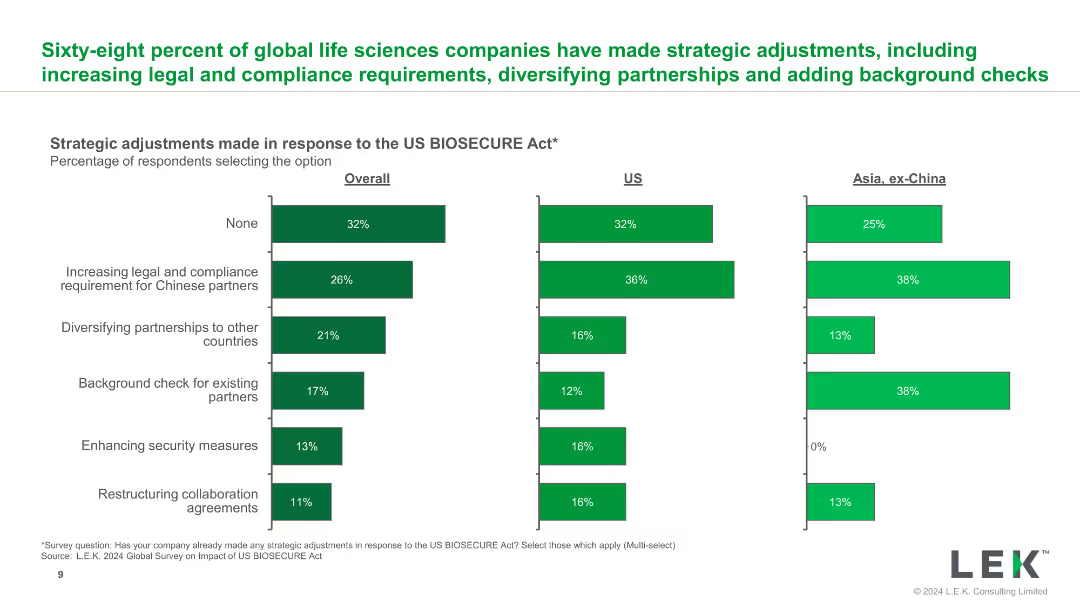
The slide has a bar chart representing strategic adjustments made by companies in response to the BIOSECURE Act, with categories such as legal compliance, partnerships, and security measures.
Strategic Planning
Healthcare & Pharmaceuticals
It outlines the various strategic adjustments that companies have implemented in response to the BIOSECURE Act, highlighting key areas of change.
strategic adjustments, BIOSECURE Act, compliance, partnerships, security
false
Sixty-eight percent of global life sciences companies have made strategic adjustments, including increasing legal and compliance requirements, diversifying partnerships and adding background checksImpact of the US BIOSECURE Act on Biopharmas, Contract Services and Investors
Multiple Chart
LEK
View slide
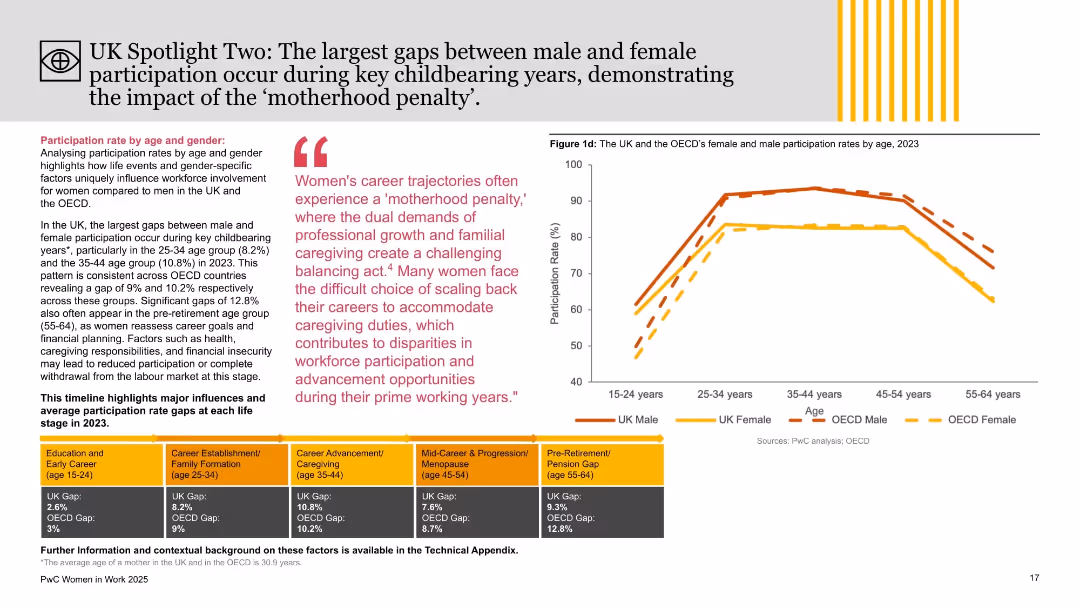
Right side features age-segmented participation chart; left side includes thematic analysis with colored blocks and quote on ‘motherhood penalty.’
Market Analysis and Trends
Government & Public Sector
This slide explores age-related gender participation gaps in the UK and OECD, emphasizing childbearing years (25–44) as periods with the widest disparities. It links challenges like caregiving and career progression with reduced female workforce involvement, using the “motherhood penalty” concept.
motherhood penalty, gender gap, age analysis, workforce participation, UK, OECD, PwC, employment trends, caregiving, labor market
false
UK Spotlight Two: Participation Gap by AgePwC Women in Work 2025
Mixed Chart
PwC/Strategy&
View slide
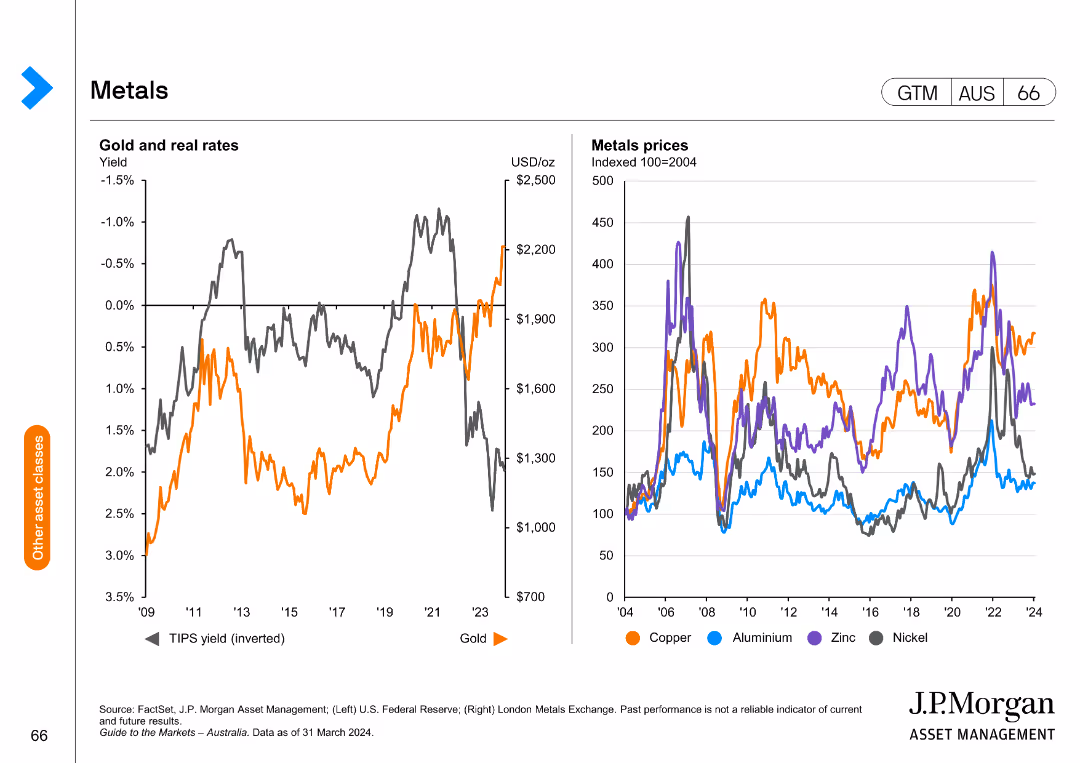
The slide features two line charts side by side. The left chart displays gold and real rates with the inverted TIPS yield and gold price trends. The right chart shows metal prices for copper, aluminum, zinc, and nickel.
Market Analysis and Trends
Financial Services
This slide analyzes trends in metal prices and real rates, providing insights into gold and other metals' performance, useful for market analysis and investment decision-making.
Metals, gold, real rates, TIPS yield, market analysis, investment, trends, copper, aluminum, zinc, nickel
false
Gold and real rates YieldUSD/Guide to the Markets Australia | 2Q 2024
Multiple Chart
JP Morgan
View slide
This slide contains multiple column charts showing the growth of digital financial services, payments, remittance flows, lending, investment, and insurance sectors from 2019 to 2030 with compound annual growth rates (CAGR). There are annotations for specific CAGRs and projected values in billions for future years.
Market Analysis and Trends
Financial Services
The slide presents a forecast of growth in various financial sub-sectors due to the shift from offline to online post-pandemic, highlighting the increasing trend in digital transactions and services with specific focus on CAGRs and future projections.
digital, financial services, CAGR, growth, forecast, pandemic, trends, online, payments, investment
false
DFS: All sub-sectors are growing as a result of enduring offline-to-online behaviour shifts post-pandemice-Conomy SEA 2022 Through the waves, towards a sea of opportunity
Multiple Chart
Bain
View slide
Similar to the previous slide, this one uses a comparative chart layout to show credit ratings from major agencies for holding companies.
Competitive Landscape
Financial Services
It highlights credit ratings for UBS and competitors' holding companies, detailing their ratings and outlooks as of September 2023.
credit ratings, peer comparison, holding company, Moody's, S&P, Fitch, UBS, financial, September 2023
false
Credit ratings peer comparison Long-term senior unsecured debt – holding company, as of 11.9.23Second quarter 2023 Fixed Income investor presentation
Table
UBS
View slide
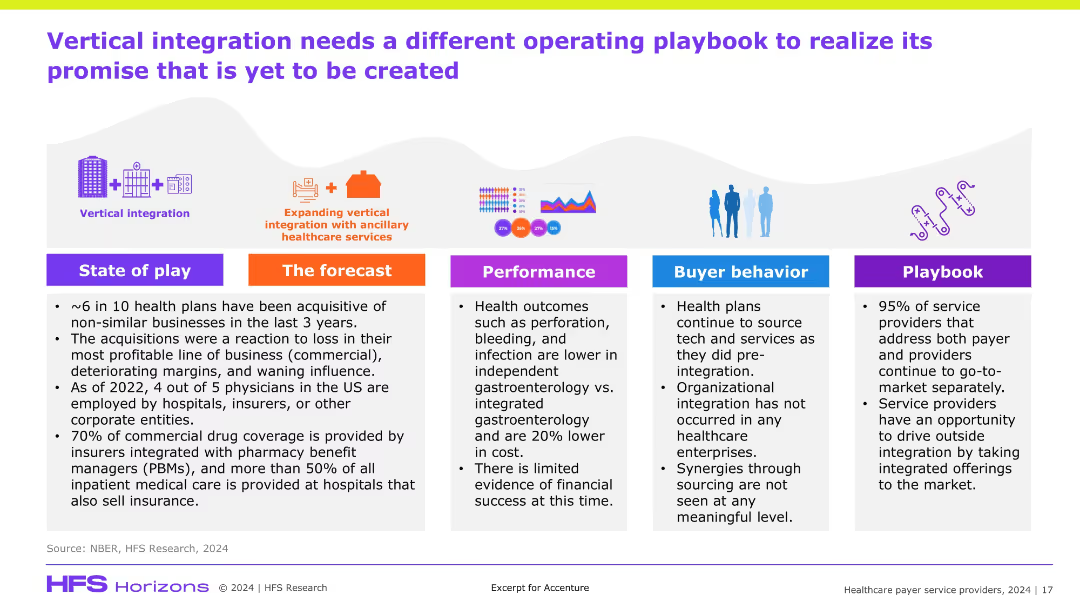
Horizontal layout with five color-coded columns (State of play, Forecast, Performance, Buyer behavior, Playbook), icons and infographics on top, light background, bold color headers.
Strategic Planning
Healthcare & Pharmaceuticals
The slide critiques the ineffectiveness of current vertical integration strategies in healthcare, stating that financial performance hasn't improved and buyer behavior hasn't changed. It highlights the need for a new operating model and playbook, as most service providers still market separately to payers and providers.
vertical integration, healthcare strategy, service providers, playbook, acquisitions
false
Vertical integration needs a different operating playbook to realize its promise that is yet to be createdHealthcare Payer Service Providers, 2024
Pillar
Accenture
View slide
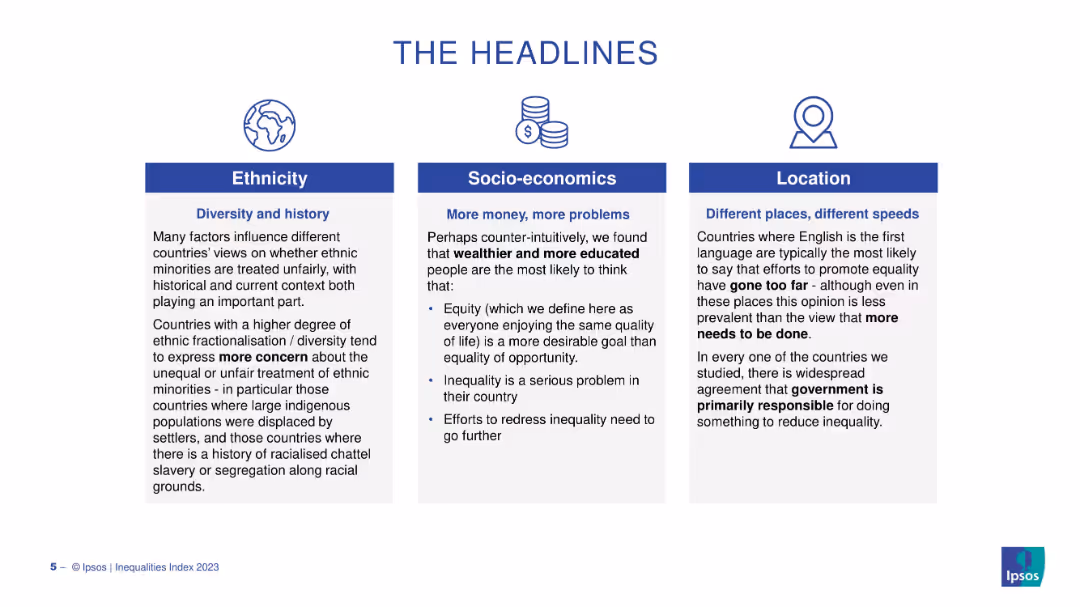
Three vertical panels under headings Ethnicity, Socio-economics, and Location. Text-heavy layout with icons and blue headers.
Strategic Planning
Government & Public Sector
This slide discusses how perceptions of inequality vary depending on ethnicity, wealth/education, and geography, showing how context affects views on fairness and responsibility in promoting equality.
inequality, ethnicity, geography, socioeconomics, fairness, global views
false
THE HEADLINESIPSOS EQUALITIES INDEX 2023
Pillar
IPSOS
View slide
Slide compares decarbonization technologies across three readiness levels: proven, market ready, and emerging, with clear categorization.
Technology and Digital Transformation
Environmental Services & Sustainability
Discusses various technologies for decarbonization and their stages of readiness for investment in Southeast Asia.
decarbonization, technology readiness, investment, SEA
false
Diverse range of decarbonization levers exist with varying degrees of tech maturity; this report considers 30 key levers for potential impact and invest-ability in SEASoutheast Asia’s Green Economy 2022 Report
Header Horizontal
Bain
View slide
The slide contains a line chart on the left showing the global PMI for manufacturing and services from 2007 to 2023. On the right, there is a heatmap displaying the global PMI for manufacturing by country (U.S., Japan, Australia, Eurozone, China, etc.) from April 2023 to March 2024.
Market Analysis and Trends
Industrial & Manufacturing
The slide provides a detailed view of global manufacturing performance through PMI indices, offering insights into the health of the manufacturing sector across different countries.
PMI, Manufacturing, Global, Services, Heatmap
false
Global PMI for manufacturing and services IndexGuide to the Markets Australia | 2Q 2024
Mixed Chart
JP Morgan
View slide
A column chart showing year-over-year percentage change in headline CPI from 2022 to 2025F for global and various regions including the US, Euro area, UK, Japan, China, India, LatAm, ASEAN, MENA, and SSA.
Market Analysis and Trends
Financial Services
The slide forecasts continued disinflation across most economies in 2024, assuming soft demand growth and steady supply conditions.
disinflation, CPI, economic forecast, 2024, demand growth, supply conditions
false
Disinflationary momentum should continue across most economies in 2024 assuming soft demand growth and rebounding to steady supply conditionsGlobal economic outlook: finding balance in 2024
Single Chart
EY
View slide
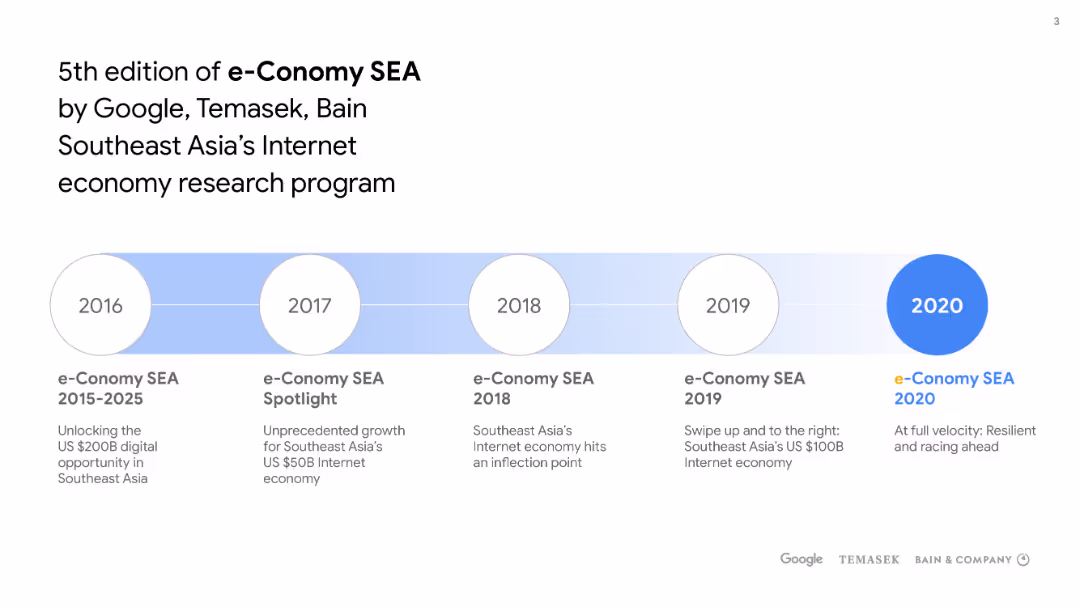
This slide has a horizontal timeline with circular nodes for the years 2016 to 2020, highlighting the progression of the e-Conomy SEA editions. The 2020 node is emphasized with a larger, filled circle. The title and subtitle are at the top, and there's a sponsors' logo section at the bottom.
Market Analysis and Trends
Technology & Software
The slide outlines the annual milestones of the e-Conomy SEA research program from 2015 to 2020, indicating growth and evolution in Southeast Asia's internet economy, supported by Google, Temasek, and Bain & Company.
e-Conomy, SEA, Google, Temasek, Bain & Company, Internet economy, Southeast Asia, research program, timeline
false
5th edition of e-Conomy SEA by Google, Temasek, Bain Southeast Asia’s Internet economy research programe-Conomy SEA 2020 At full velocity: Resilient and racing ahead
Pillar
Bain
View slide
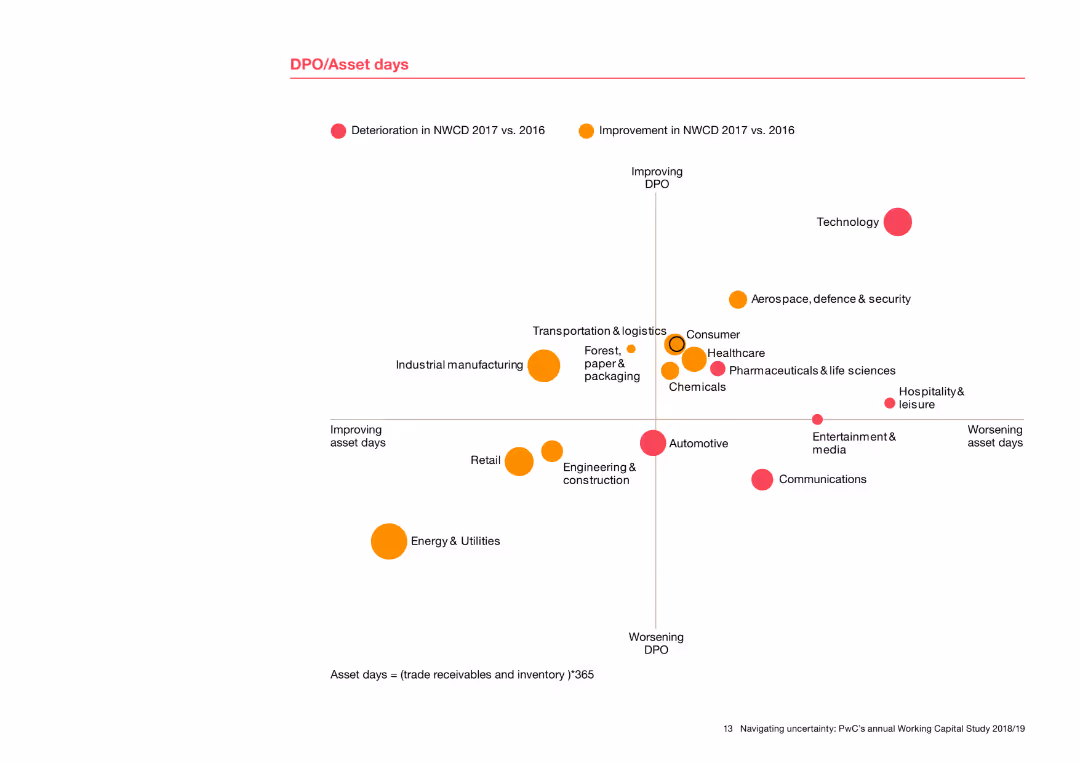
The slide includes a scatter plot showing DPO (Days Payable Outstanding) against asset days for various industries. Dots are color-coded to indicate improvement or deterioration from 2016 to 2017. Industries are labeled around the dots, providing a clear comparison of performance.
Risk Assessment and Management
Financial Services
This slide presents a detailed analysis of DPO and asset days across industries, showing trends in payables and asset management. The scatter plot visualizes how different sectors have improved or worsened in these metrics, offering insights into risk management and operational efficiency.
DPO, asset days, scatter plot, industry comparison, performance trends, risk management
false
DPO/Asset daysNavigating uncertainty: PwC’s annual global Working Capital Study
Single Chart
PwC/Strategy&
View slide
Column charts with detailed annotations showing different capital ratios and leverage ratios for 3Q22. The slide has a clean design with focus on key financial metrics.
Financial Performance
Financial Services
This slide presents various capital and leverage ratios, including CET1 capital ratio guidance and TLAC buffer requirements for 3Q22.
capital, leverage, CET1, TLAC, buffer
false
Capital and leverage ratios Total loss-absorbing capacity (TLAC)Third quarter 2022 Financial results
Multiple Chart
UBS
View slide
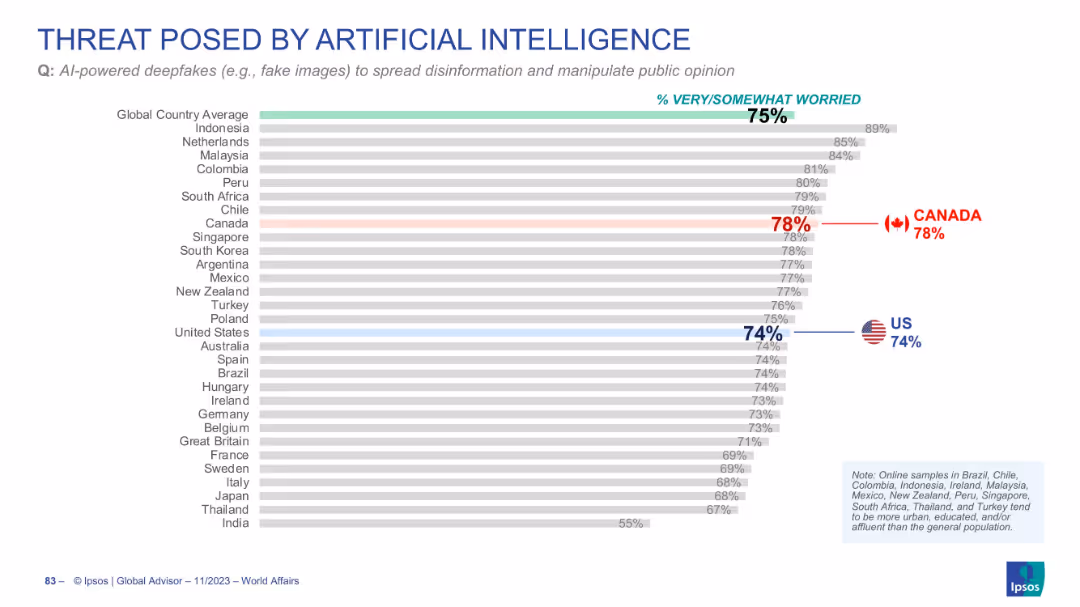
Horizontal bar chart displaying concern over AI-powered deepfakes
Risk Assessment and Management
Artificial Intelligence
Public concern about deepfakes as a tool for disinformation is high globally (75%). Canada (78%) and the US (74%) also show significant concern on this issue.
AI deepfakes, disinformation, public opinion, global perception, misinformation
false
THREAT POSED BY ARTIFICIAL INTELLIGENCEWORLD AFFAIRS 2023
Single Chart
IPSOS
View slide
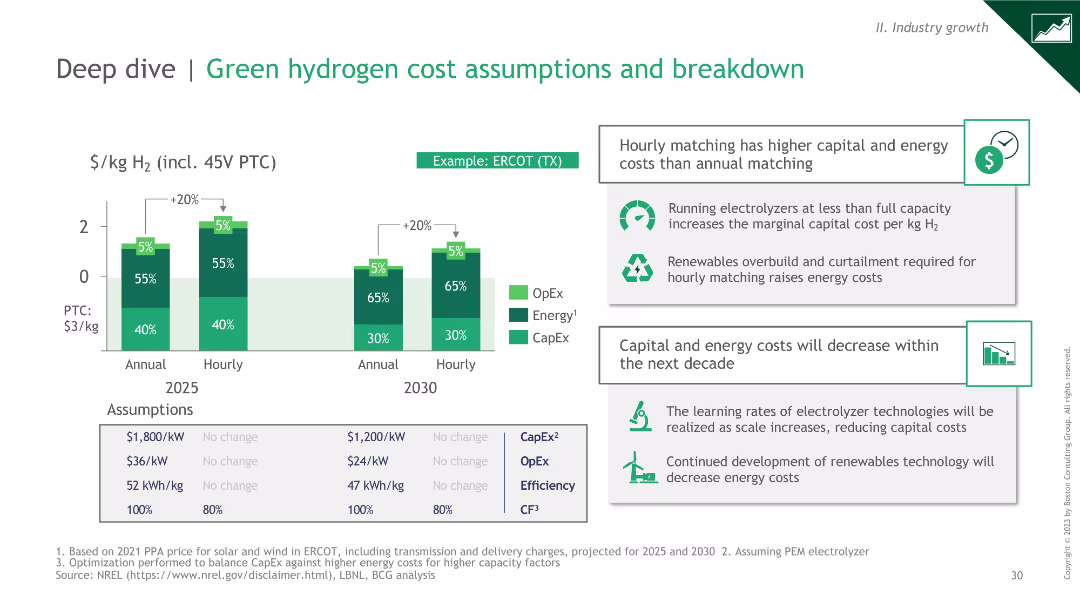
Column charts comparing OpEx, Energy, and CapEx for annual vs hourly matching in 2025 and 2030. Includes text boxes with insights on cost assumptions and learning rates.
Technology and Digital Transformation
Energy & Utilities
Column charts comparing OpEx, Energy, and CapEx for annual vs hourly matching in 2025 and 2030. Includes text boxes with insights on cost assumptions and learning rates.
This slide analyzes green hydrogen cost assumptions, focusing on the differences in costs between annual and hourly matching. It highlights key insights and future cost reductions.
false
Deep dive | Green hydrogen cost assumptions and breakdownGreen Hydrogen: An assessment of near-term power matching requirements
Mixed Chart
BCG
View slide
Consistent with slides 2962, 2963, and 2966, this slide shares the same style and cyclical arrows design. The gray color scheme is used throughout, and the slide number is 9.
Market Analysis and Trends
Financial Services
This slide reinforces the key themes of market structure evolution, likely serving as a concluding summary of the discussed catalysts and trends within the series.
summary, market structure, trends, evolution
false
Market Structure Evolution: Catalysts and Secular TrendsGoldman Sachs Investor Day
Linear Flow
Goldman Sachs
View slide
The slide features a dark background, a quote in a yellow text box, and a question followed by a bar chart showing performance ratings of healthcare system aspects.
Customer and Market Segmentation
Healthcare & Pharmaceuticals
This slide presents Canadian consumers' ratings of the healthcare system's performance in optimizing experiences regardless of personal circumstances.
Healthcare experience, performance, consumer ratings, equitable treatment, Canada
false
‘The experience is important to me.’ Consumers: CanadaHealth care consumer views on value
Mixed Chart
EY
View slide
Diagrams showing traditional, direct, and domestic supply chain archetypes for grain movement, with detailed steps from farm to port and export.
Operational Efficiency
Transportation & Logistics
The slide outlines three main supply chain models for grain movement in Australia, illustrating the processes involved from harvesting to export.
supply chain, grain movement, Australia, traditional, direct, domestic
false
Three supply chain archetypes exist to describe the majority of grain movement in AustraliaInternational Comparison of Australia’s Freight and Supply Chain Performance
Diagram
LEK
View slide
Bar chart showing percentages of various HRIS types, including outsourced, off-the-shelf, and in-house solutions. The largest bar represents HRIS custom developed by outsourced specialists at 46%.
Human Resources and Talent Management
Professional Services
This slide displays a bar chart categorizing HR information systems by type within organizations, highlighting the prevalence of outsourced solutions.
HRIS, outsourcing, in-house, off-the-shelf, bar chart
false
Type of HR Information System (HRIS) used in respondents’ organisationsHR Pulse Survey Presentation of results
Single Chart
PwC/Strategy&
View slide
The slide includes a column chart displaying support for various government policies to improve internet trust.
Regulatory and Compliance
Government & Public Sector
The slide presents public opinion on different government policies aimed at enhancing internet trust.
government policies, internet trust, public opinion, regulation, cybersecurity, data protection
false
A majority, agree that most proposed government policies will improve internet trust.MARKET DATA FROM SECONDARY SOURCES
Single Chart
IPSOS
View slide
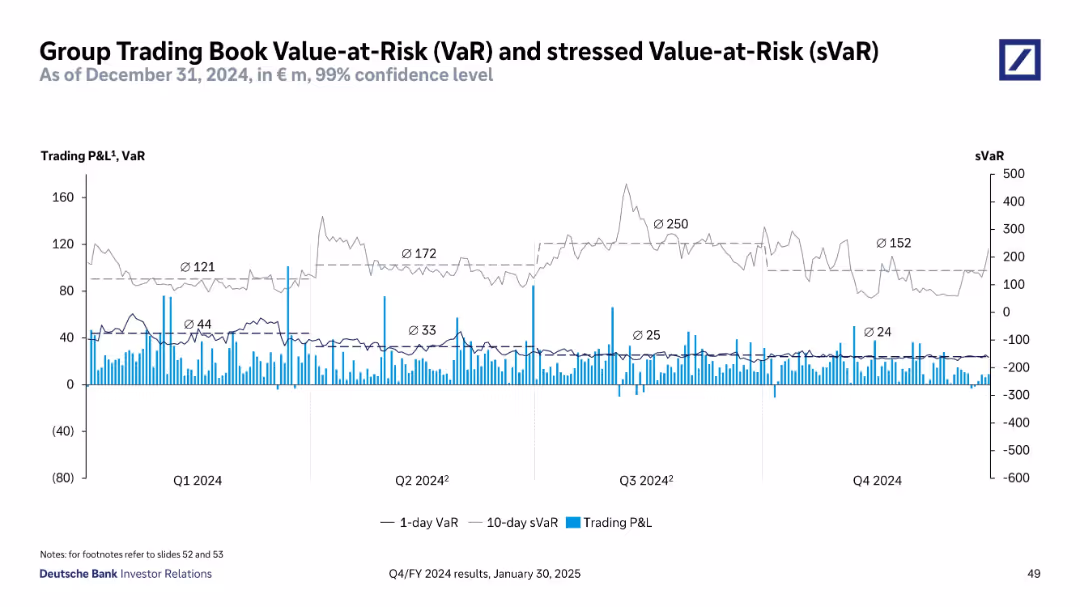
Line and bar chart with dual y-axes; light gray and dark gray lines for 1-day VaR and 10-day sVaR; blue bars for Trading P&L; four quarterly periods labeled
Risk Assessment and Management
Financial Services
This slide shows Deutsche Bank’s VaR and sVaR trends for 2024, illustrating daily risk metrics and profit/loss volatility. Quarterly averages highlight changes in risk exposure and stress scenarios.
VaR, sVaR, Trading P&L, risk metrics, 2024, volatility, confidence level, Deutsche Bank, quarterly trends, market risk
false
Group Trading Book Value-at-Risk (VaR) and stressed Value-at-Risk (sVaR)Q4/FY 2024 results
Single Chart
Deutsche Bank
View slide
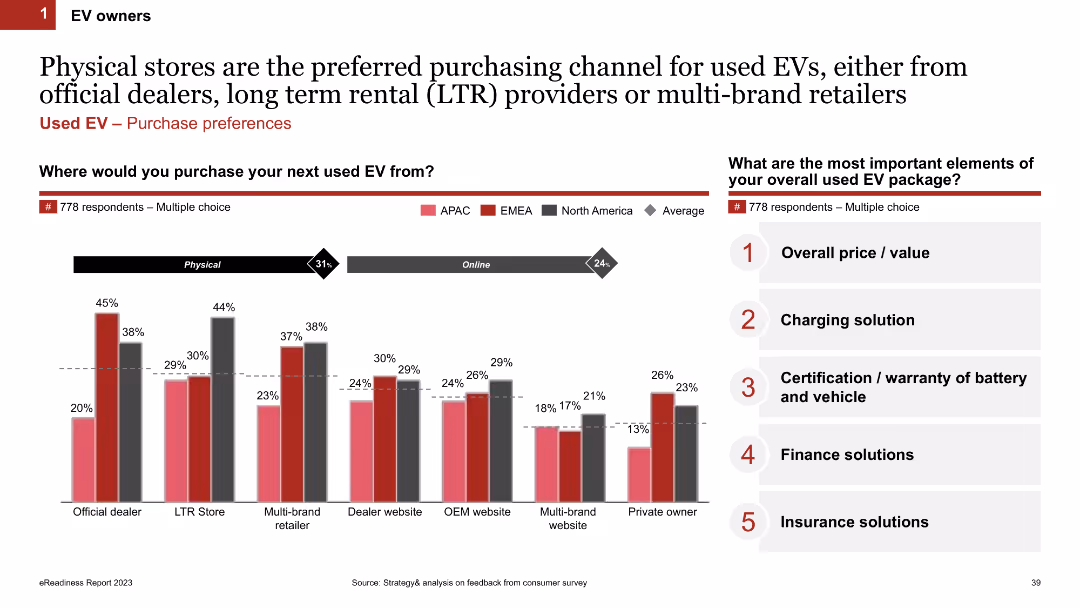
The slide features column charts showing where customers prefer to purchase used EVs (official dealers, LTR stores, multi-brand retailers) and the most important elements of the used EV package (price, charging solution, warranty).
Market Analysis and Trends
Transportation & Logistics
This slide examines the preferred purchasing channels for used EVs and the key elements that customers consider important in a used EV package. It includes regional preferences and highlights factors like price and warranty.
used EVs, purchasing channels, physical stores, preferred elements, price, warranty
false
Physical stores are the preferred purchasing channel for used EVs, either from official dealers, long term rental (LTR) providers or multi-brand retailers4th edition eReadiness 2023
Mixed Chart
PwC/Strategy&
View slide
Contains text descriptions and bullet points with a sidebar example of an Indian alcohol beverage manufacturer, a QR code, and percentage growth figures.
Market Analysis and Trends
Professional Services
Describes strategies for leveraging customer insights to develop and prioritize demand spaces, illustrated by a case study with positive growth outcomes.
Customer Insights, Demographics, Market Segmentation, Demand Spaces, Growth Strategy
false
Leverage deep customer insights—demographics, needs, context—to develop and prioritize meaningful demand spacesBCG Executive Perspectives: The Future of Sales and Marketing is Here
Text Only
BCG
View slide
Three sections with images and accompanying text, each highlighting different aspects of real estate services. Green, blue, and red color highlights for revenue numbers.
Financial Performance
Real Estate & Construction
The slide compares strategies in commercial real estate services, including term lending, community development banking, and real estate banking, focusing on performance and strategic approaches.
Real Estate, Strategy, Lending, Banking, Performance
false
Commercial Real Estate (CRE) –positioned for through-the-cycle performanceInverstors Day 2023
Header Vertical
JP Morgan
View slide
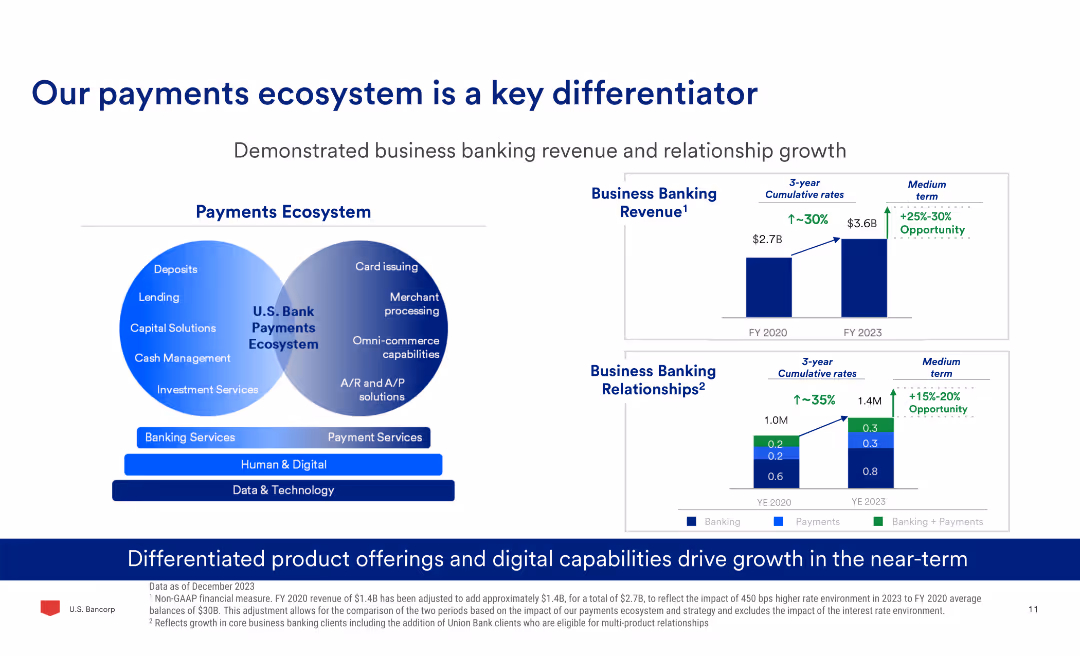
The slide has a Venn diagram comparing banking and payment services, two column charts showing business banking revenue and relationships growth, and text explaining product offerings.
Market Analysis and Trends
Financial Services
The slide demonstrates the growth in business banking revenue and relationships, highlighting the differentiated product offerings and digital capabilities driving this growth.
Payments, Banking, Revenue, Growth, Digital, Ecosystem
false
Our payments ecosystem is a key differentiatorBarclays Americas Select Franchise Conference 2024
Multiple Chart
Barclays
View slide
This slide contrasts types of MSMEs with a focus on their business mindset and digital practices through a bar graph and text annotations.
Market Analysis and Trends
Financial Services
Analyzing MSME types in tier 2 and tier 3 cities, the slide presents a predominant 'wait-and-see' approach to digital adoption. It may be used to examine digital strategy and its adoption in these markets, reflecting the conservative mindset of most MSMEs towards new practices.
MSMEs, Tier 2 and 3 Cities, Digital Adoption, Business Mindset, Market Analysis
false
Overall, more than 80% of MSMEs in tier 2 and tier 3 cities adopt a waitand-see mentality when it comes to digital practices.Unlocking the next wave of digital growth: beyond metropolitan Indonesia
Mixed Chart
Kearney
View slide
This slide has a two-column comparative layout with icons and bullet points. The left side is turquoise, the right blue, both featuring text and symbols representing different compensation stages.
Human Resources and Talent Management
Technology & Software
Compares early and late-stage compensation principles, appealing to varying levels of risk and immediacy of benefits, relevant to HR professionals.
compensation, structure, early-stage, late-stage, equity, benchmarks, performance, seniority, trends
false
Various compensation structures can be leveraged depending on company stageASEAN Growth and Scale Talent Playbook
Linear Flow
Kearney
View slide
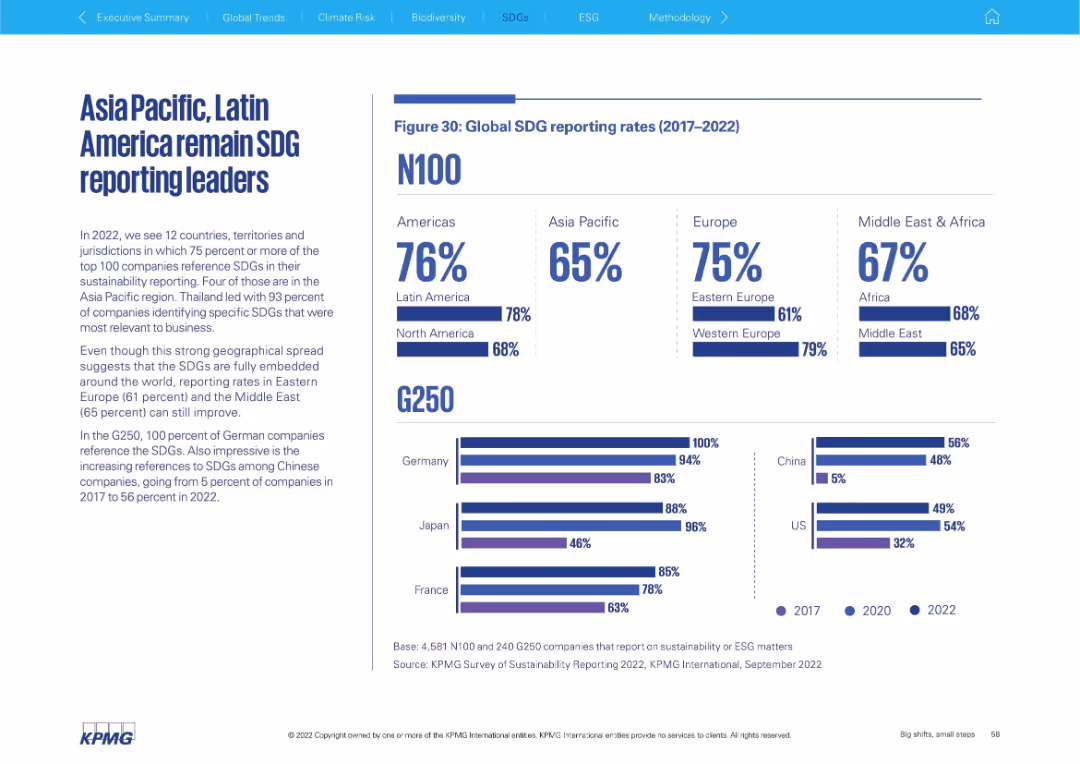
Two-column layout with text on the left and a data-rich infographic on the right, including bar graphs and percentage stats comparing global SDG reporting by region and country.
Strategic Planning
Professional Services
This slide presents SDG reporting rates globally (2017–2022), highlighting regional leaders and laggards. It compares N100 and G250 companies by region and includes national-level insights, notably Germany’s 100% G250 reporting rate and China’s rapid growth.
SDG, sustainability, G250, N100, regional comparison, ESG, Latin America, Asia Pacific, Europe, corporate reporting
false
Asia Pacific, Latin America remain SDG reporting leadersBig shifts, small steps Survey of Sustainability Reporting 2022
Multiple Chart
KPMG
View slide
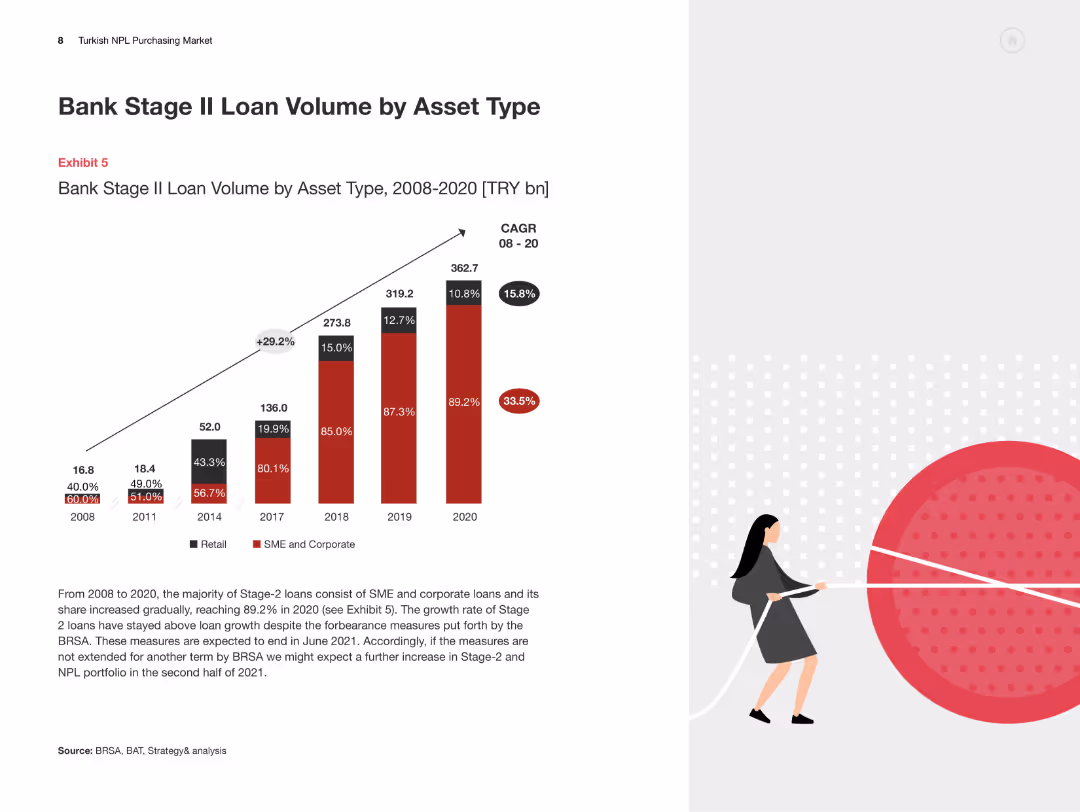
The slide features a column chart illustrating the bank Stage II loan volume by asset type from 2008 to 2020, with explanatory text on the growth and trends observed.
Market Analysis and Trends
Financial Services
This slide examines the growth of Stage II loans by asset type in the Turkish banking sector, detailing the significant trends and factors influencing the market.
Stage II Loans, Asset Type, Turkey, Loan Volume, Market Trends
false
Bank Stage II Loan Volume by Asset TypeTurkish NPL Purchasing Market Overview and the way forward
Mixed Chart
PwC/Strategy&
View slide
The slide features two sections: "Automated Buying" on the left with an icon of a smart fridge and text, and "Interactive Shelves" on the right with a photo of a woman interacting with a screen. Both sections have trend assessment bars indicating "Prepare" and "Watch" with impact on industry and time of mainstream adoption.
Technology and Digital Transformation
Technology & Software
Describes the concepts of automated buying and interactive shelves in the context of AI and data era, highlighting how these technologies can improve shopping experiences and customer retention. The slide also includes trend assessments and industry impact projections.
AI, Data, Retail, Technology, Innovation
false
Data Era & AI Automated BuyingTrendRadar: The Future Consumer
Multiple Chart
Deloitte
View slide
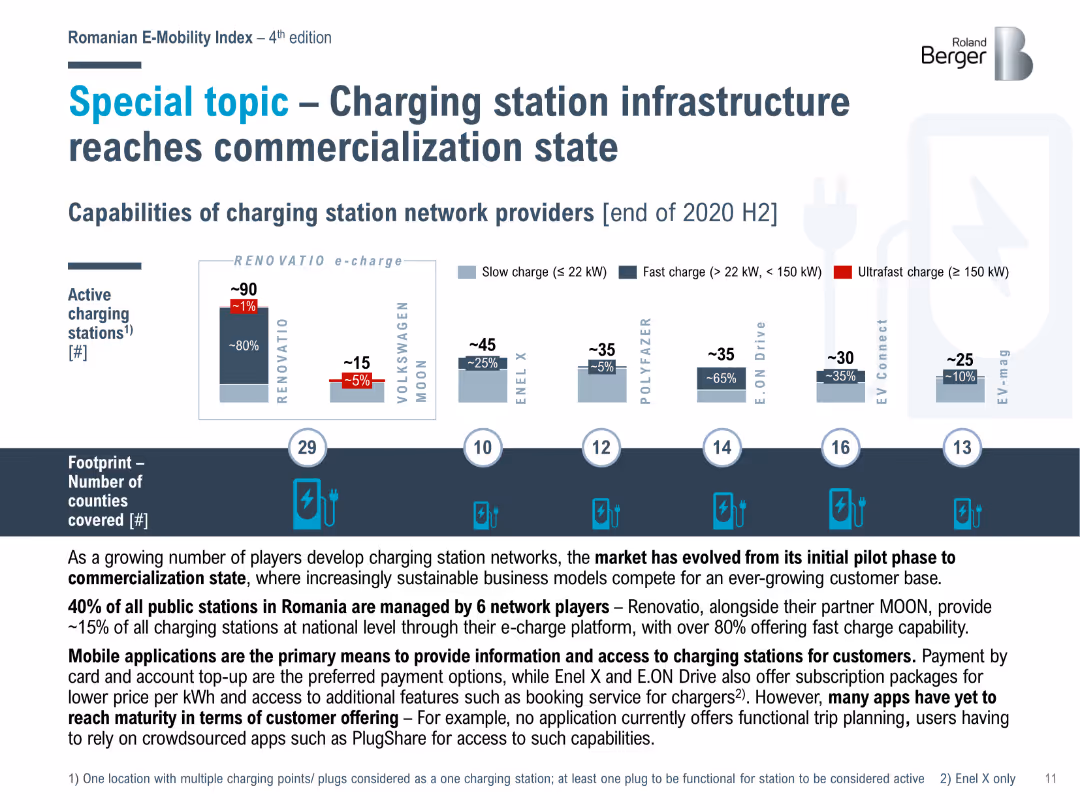
Bar chart showing the capabilities of charging station network providers in Romania at the end of 2020 H2, including the number of slow, fast, and ultrafast charging stations.
Market Analysis and Trends
Energy & Utilities
Analyzes the commercialization of charging station infrastructure in Romania, with details on the capabilities of different network providers and the spread across counties.
charging infrastructure, commercialization, Romania, network providers
false
Special topic – Charging station infrastructure reaches commercialization stateRomanian E Mobility Index REI 4 (Fourth Edition)
Mixed Chart
Roland Berger
View slide
The slide presents a sequence of column charts and textual analysis. It visually communicates the historical capital allocation and expectations for future returns with a clear graphical representation using shades of blue and gray.
Investment Analysis
Financial Services
The slide from JPMorgan Chase focuses on capital optimization and projected return on equity (ROE). It is designed for financial presentations that detail capital allocation strategies and the expected outcomes in terms of growth and returns, highlighting both the cost of capital and the benefits of disciplined capital deployment.
Capital Optimization, Growth, Returns, ROE, Cost of Capital, Investment, Disciplined Deployment, Client Wallet, Market Completeness
false
We continuously optimize our capital footprint to deliver growth and strong returnsCorporate & Investment Bank 2022
Multiple Chart
JP Morgan
View slide
Contains segmented column charts showing direct and indirect contributions of tourism to the GDP and employment in Europe.
Strategic Planning
Hospitality & Tourism
Examines the direct and indirect economic impacts of tourism in Europe, including contributions to GDP and employment figures.
Tourism, GDP, Employment, Economic impact, Europe
false
Overall tourism contributed directly to ~4% of GDP and 12M jobs in 2019, up to ~6% and 22M if considering indirect impactHigh-end Tourism - a strong driver for Europe
Mixed Chart
Bain
View slide
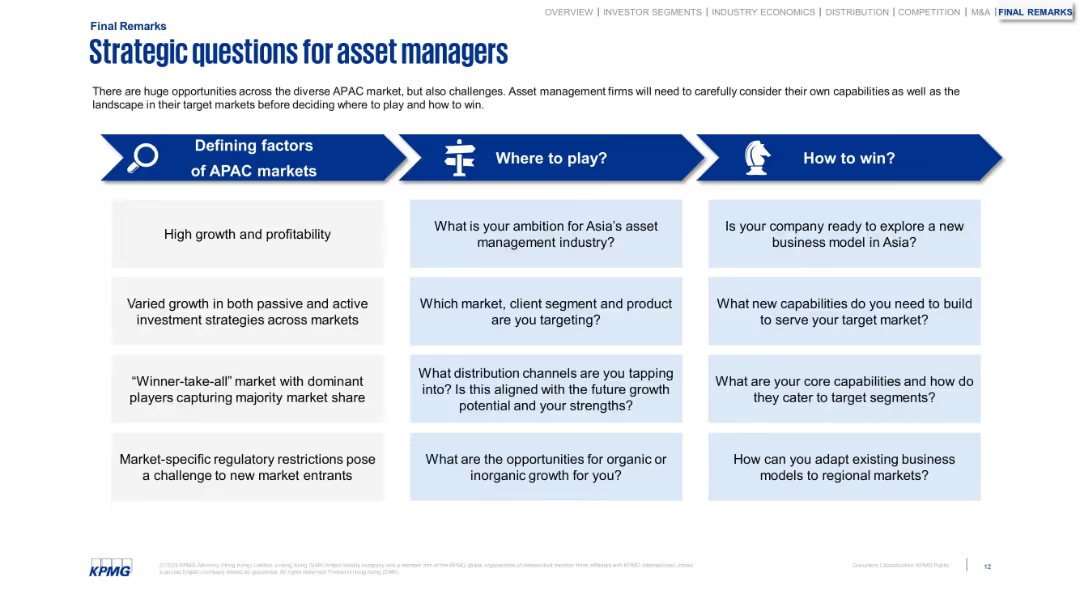
Three-column horizontal layout with categorized questions under: Defining factors, Where to play?, and How to win? Blue and white color scheme with icons for each category.
Strategic Planning
Financial Services
This slide presents strategic considerations for asset managers exploring the APAC market. It breaks down market dynamics and internal capability questions to help firms define entry and success strategies, considering regulation, client targeting, and competitive edge.
strategy, APAC, asset management, market entry, business model, capabilities, targeting, growth, regulation
false
Strategic questions for asset managersGrowing in a Turbulent World
Table
KPMG
View slide
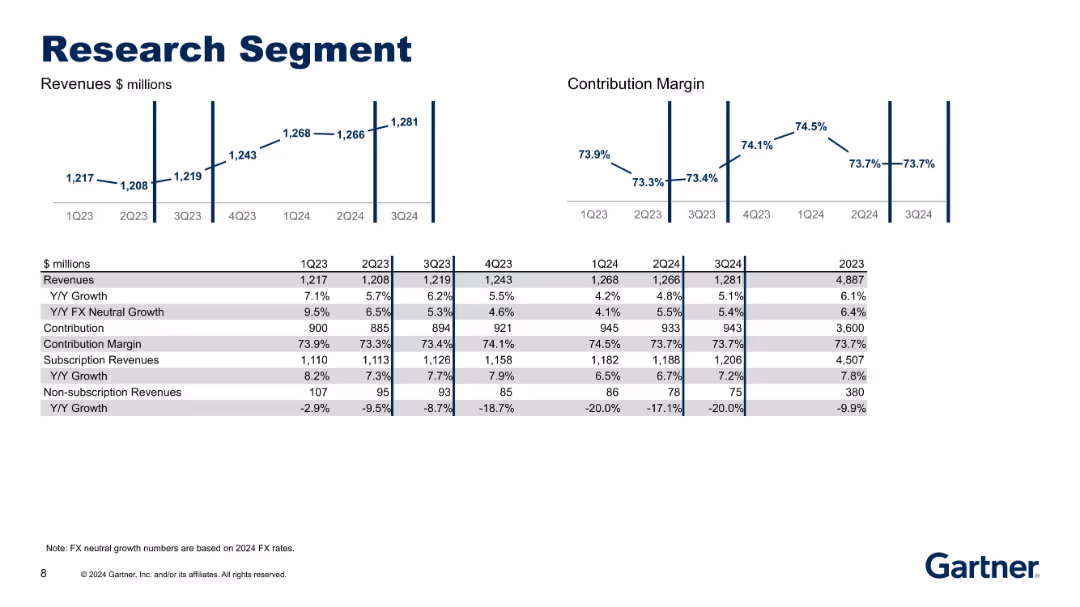
Duplicate of slide 18622 but updated to Q3 2024. Same format with revenue and margin charts and a table below showing updated financial data.
Product and Service Analysis
Technology & Software
Updated financial performance and KPIs for the Research segment. Reflects most recent data to aid in performance tracking and strategic decisions related to subscription and non-subscription services.
research, FX neutral, margin, subscription, financial update
false
Research SegmentThird Quarter 2024 Results
Multiple Chart
Gartner
View slide
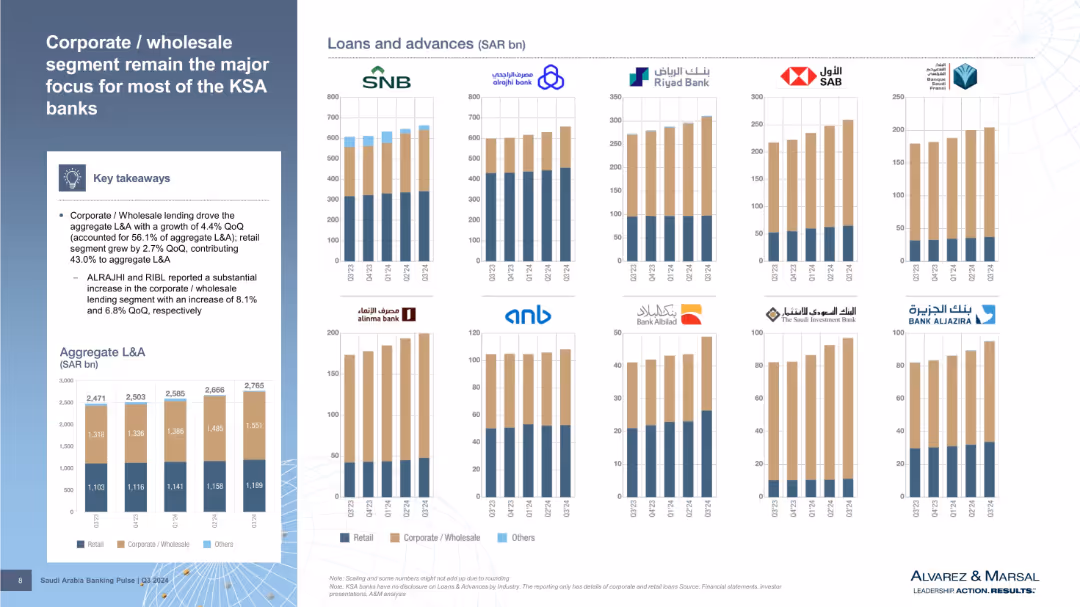
Left side contains text box; right side presents stacked bar charts of L&A by bank and segment (retail, wholesale, others) over time.
Customer and Market Segmentation
Financial Services
Focuses on the dominance of corporate/wholesale lending in total L&A composition. Charts depict loan segmentation trends across banks, revealing key contributors to loan growth.
loans & advances, corporate lending, retail loans, KSA banks, segment analysis, Q3’24, bar charts, financial trends
false
Corporate / wholesale segment remain the major focus for most of the KSA banksSaudi Arabia Banking Pulse
Multiple Chart
Alvarez & Marsal
View slide
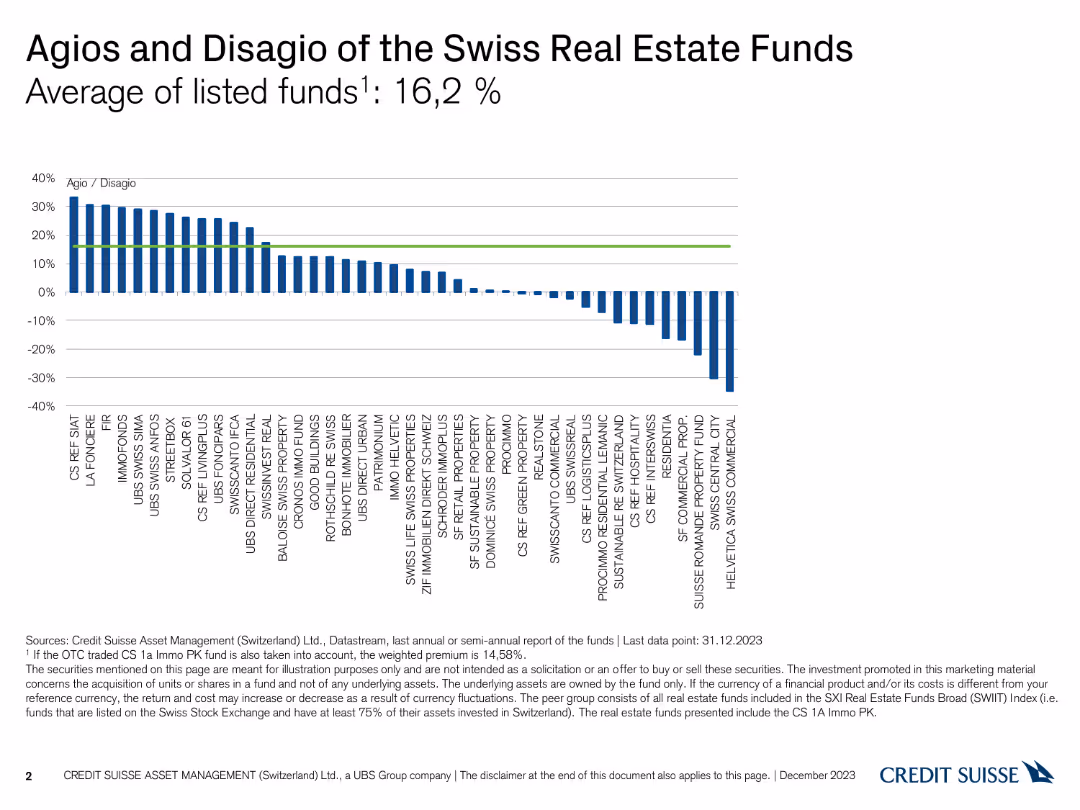
A column chart showing the Agio and Disagio percentages of various Swiss real estate funds, with bars extending above and below a zero line.
Financial Performance
Financial Services
This slide illustrates the Agio (premium) and Disagio (discount) of different Swiss real estate funds as of December 31, 2023, highlighting an average of 16.2%.
Agio, Disagio, Real Estate Funds, Premium, Discount
false
Agios and Disagio of the Swiss Real Estate Funds Average of listed funds 1 : 16,2Swiss Real Estate Funds At a glance December 2023
Single Chart
Credit Suisse
View slide
A world map highlights key locations with markers. An inset magnifies the Singapore region, showing more detail with labeled yard locations.
Strategic Planning
Energy & Utilities
The slide demonstrates Seatruim's global presence, highlighting its worldwide yards and the strategic position of Singapore in the company's operations. It could be used to emphasize the company's expansive global operations and strategic locations.
Global, Operations, Reach, Yards, Singapore
false
GLOBAL SCALE & REACHMorgan Stanley Asia Pacific Summit
Graphic
Morgan Stanley
View slide
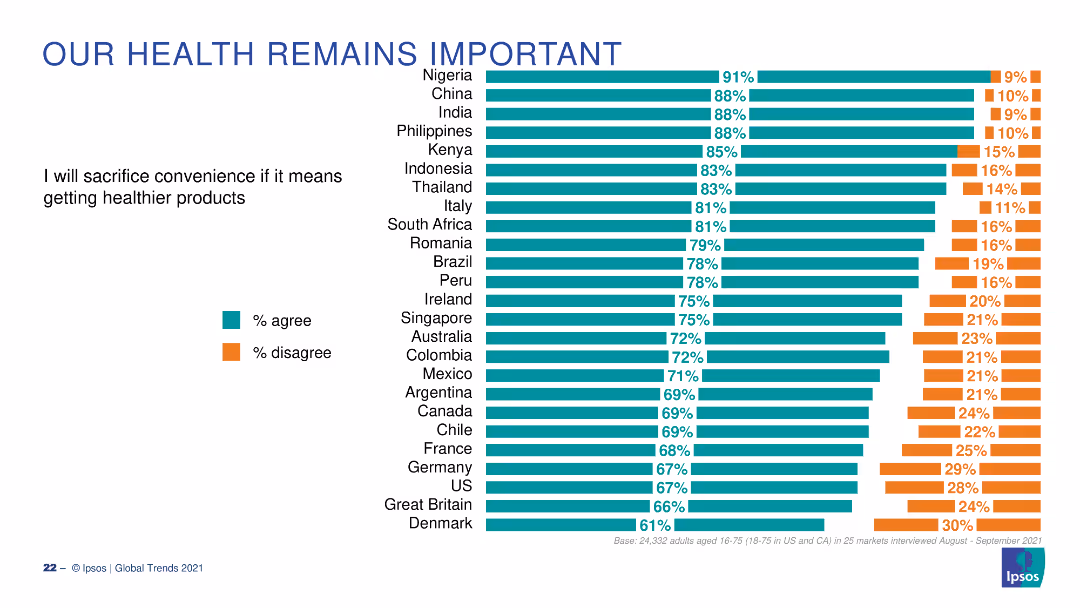
This slide features vertical bar charts showing respondents' willingness to sacrifice convenience for healthier products across different countries. The charts are color-coded, with accompanying text summarizing the findings.
Market Analysis and Trends
Healthcare & Pharmaceuticals
The slide indicates a strong willingness among respondents to prioritize health over convenience, with high agreement percentages across various countries. This can be used to discuss consumer health trends, market opportunities for healthier products, and cross-cultural differences in health priorities.
health priorities, consumer behavior, convenience, healthier products, global trends
false
OUR HEALTH REMAINS IMPORTANTGLOBAL TRENDS 2021 Aftershocks and continuity
Multiple Chart
IPSOS
View slide
Column charts showing RWA, LRD, CET1 capital ratio, and total loss absorbing capacity
Risk Assessment and Management
Financial Services
Highlights actions taken to reinforce balance sheet strength and maintain capital ratios
balance, sheet, capital, reinforcement
false
Reinforcing our balance sheet for all seasons through active managementFirst quarter 2024 Financial results
Multiple Chart
UBS
View slide
This slide continues with the theme of empowerment and skills, presenting bar charts that compare responses about job impact and training concerns between different generations, specifically Gen Z and Baby Boomers.
Market Analysis and Trends
Education & Training
This slide provides insight into generational differences concerning job security and the impact of technology. It highlights concerns among younger workers about their roles being replaced by technology and their worries about not receiving adequate training.
generational differences, technology impact, training concerns, job security
false
Younger workers are more concerned that technology will replace their rolesGlobal Workforce Hopes and Fears Survey 2022
Multiple Chart
PwC/Strategy&
View slide
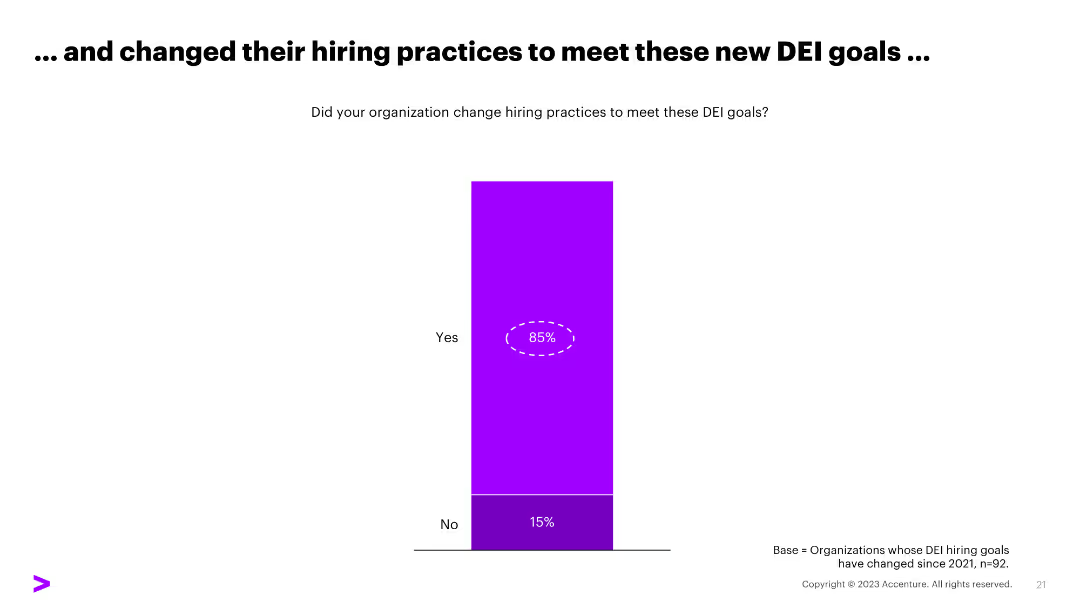
A column chart displaying the results of a survey where 85% of organizations changed their hiring practices to meet DEI goals, with "Yes" and "No" responses.
Human Resources and Talent Management
Professional Services
The slide shows a survey result indicating that 85% of organizations changed their hiring practices to meet DEI goals, useful for HR strategy discussions.
DEI, hiring practices, survey, HR strategy, organizations
false
… and changed their hiring practices to meet these new DEI goals …Tech Talent Hiring Trends Survey
Single Chart
Accenture
View slide
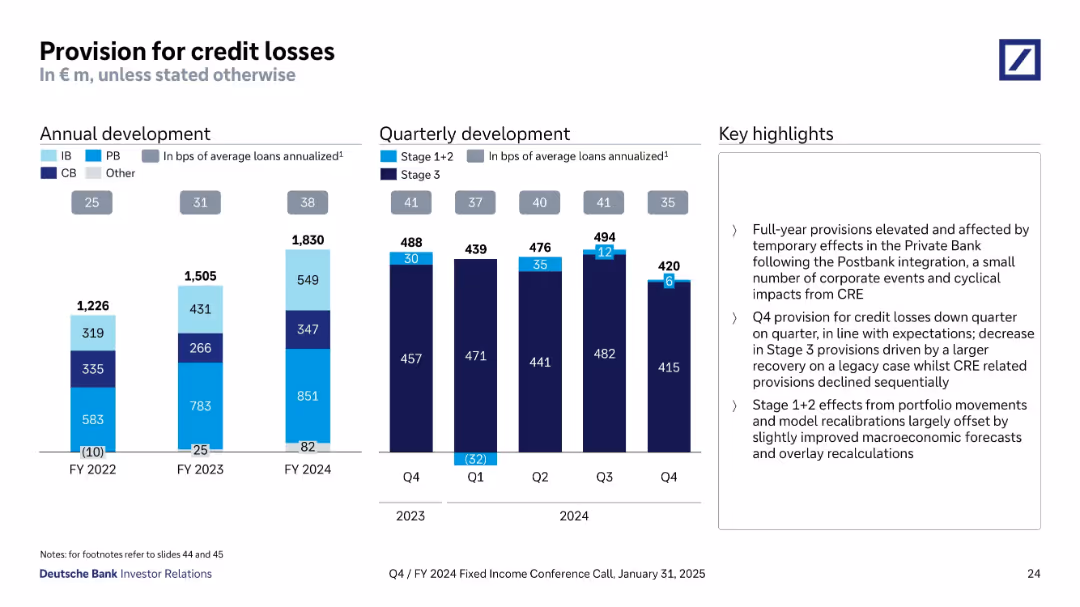
Combination of bar graphs: annual development on the left and quarterly breakdown on the right. Uses color-coded segments by business type and provisioning stage. Right-side textbox outlines quarterly changes.
Risk Assessment and Management
Financial Services
This slide tracks Deutsche Bank's credit loss provisions from FY2022 to FY2024, highlighting increases due to Postbank integration and cyclical factors. It also compares quarterly movements, showing a decline in Q4 2024 driven by recovery in legacy cases and lower CRE provisions. Staging (1+2 vs 3) is used to differentiate risk exposure levels.
credit loss provisions, CRE, Postbank, provisioning stages, Q4 2024, recovery, Deutsche Bank, credit risk
false
Provision for credit lossesQ4/FY 2024 Fixed Income Investor Conference Call
Multiple Chart
Deutsche Bank
View slide
This slide presents two column charts, one for average commercial and industrial loans and the other for average commercial real estate loans, with supporting text below. The design is straightforward and data-centric.
Financial Performance
Financial Services
Highlighting the quality and growth of loan portfolios, the slide presents data on commercial and industrial loans and commercial real estate loans, indicating a conservative approach to credit and a leadership position in the middle market lending space.
Loan portfolio, credit quality, market lending, commercial real estate
false
High-quality loan portfoliosInverstors Day 2023
Multiple Chart
JP Morgan
View slide
A bar chart shows the percentage of urban consumers intending to travel internationally, compared over two years. There is a clear visual distinction between the years.
Market Analysis and Trends
Hospitality & Tourism
Investigates the intent of consumers from various SEA countries to travel internationally, showing a significant rise and projecting future trends.
international travel, SEA, Singapore, Malaysia, consumer intent, urban consumers, travel trends
false
Online travel: Intent to travel internationally is back, with Singaporeans and Malaysians most likely to take flighte-Conomy SEA 2022 Through the waves, towards a sea of opportunity
Mixed Chart
Bain
View slide
The slide is divided into textual content and infographic elements with percentage figures and pictograms related to agility and talent. Green and grey color highlights are used for emphasis.
Organizational Structure and Change
Professional Services
Discusses the Adaptable Organization (AO) as a shift in management philosophy to increase agility through empowered networks of teams. It points out the current state of digital disruption, organizational agility, leadership, and the need for new talent within professional services.
Adaptable Organization, management, agility, talent, disruption, teams
false
How work is organised…Future of Work - How work is organized?
Linear Flow
Deloitte
View slide
Comprising a stacked column chart, this slide visually represents like-for-like DPU history with layers indicating operating DPU, fees in units, and capital top-up. Each column represents a year from 2018 to 2022, with a color-coding scheme and annotations for additional details. There's a legend explaining the components of the bars and a footnote defining like-for-like DPU.
Financial Performance
Financial Services
Provides a historical perspective on the Distribution Per Unit (DPU), indicating the company's financial performance and operational efficiency over a five-year period.
DPU Trends, Financial Performance, Operational Efficiency, Yearly Comparison, Capital Management, Fee Structure
false
5-year like-for-like and operating DPU trendMorgan Stanley Conference Investor presentation
Single Chart
Morgan Stanley
View slide
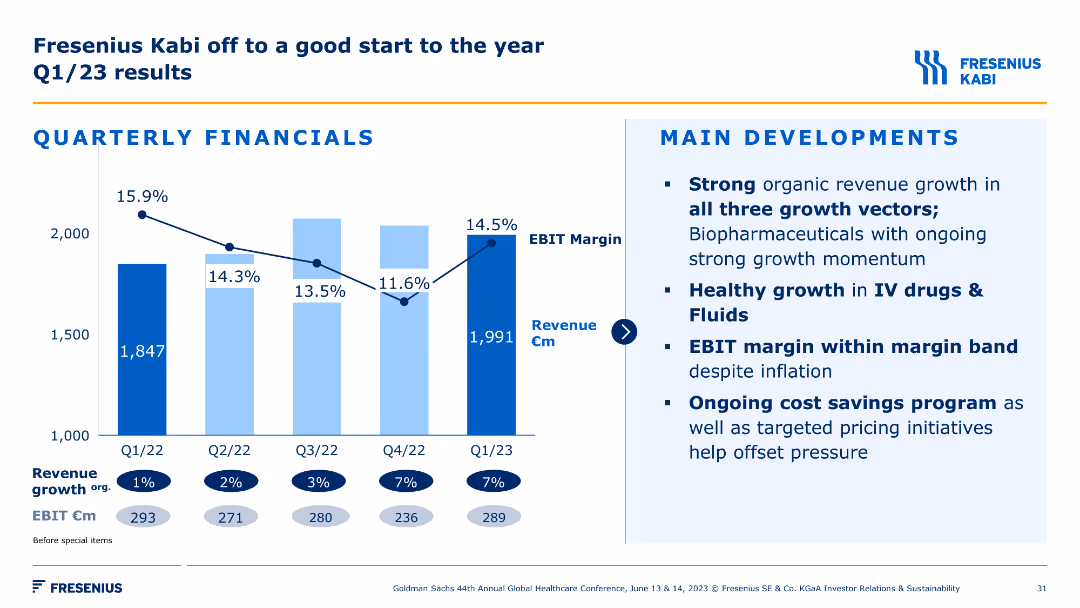
A column chart displaying quarterly financial results with revenue and EBIT margins. Accompanied by a bullet list summarizing main developments and growth vectors.
Financial Performance
Healthcare & Pharmaceuticals
This slide presents Q1/23 financial results for Fresenius Kabi, highlighting strong organic growth, healthy IV drugs and fluids growth, and ongoing cost savings programs.
financials, Q1 results, growth, revenue, EBIT
false
Fresenius Kabi off to a good start to the year Q1/23 resultsGoldman Sachs 44th Annual Global Healthcare Conference
Mixed Chart
Goldman Sachs
View slide
The slide is a simple text-based title slide with black text on a white background and a gold stripe on the left. It provides contact information for a lead economist.
Industry Overview
Financial Services
This closing slide offers contact details for further discussion on inflation, serving as an open invitation for dialogue regarding the transitory or persistent nature of current inflation trends. It concludes a financial presentation, allowing for audience follow-up with the expert for deeper insights.
Inflation, Contact, Economics, Discussion, Expert, Finance, Research
false
Inflation: transitory or persistent?Inflation: transitory or persistent?
Title
JP Morgan
View slide
Line chart showing trends in the desire for a simpler life over several years in various countries.
Market Analysis and Trends
Government & Public Sector
The slide tracks the importance of simplicity over time, highlighting trends in different countries.
simplicity, trend analysis, longitudinal study, lifestyle, global trends
false
Simplicity remains importantA NEW WORLD DISORDER?
Mixed Chart
IPSOS
View slide
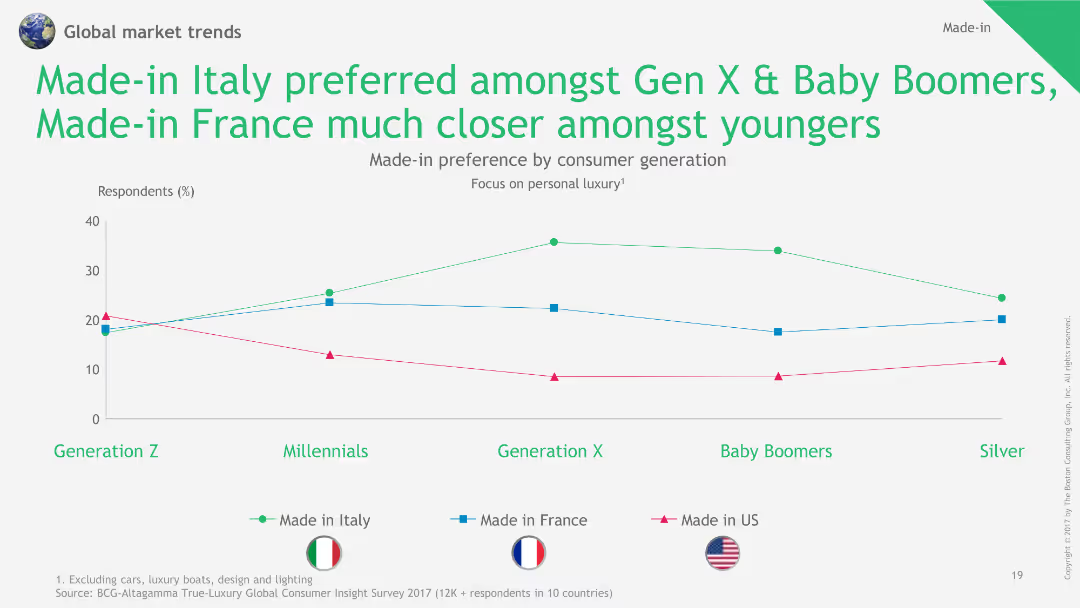
This slide features a line chart comparing preferences for Made-in Italy, Made-in France, and Made-in US products among different generations.
Market Analysis and Trends
Consumer Goods
The slide highlights generational preferences for luxury products, with Gen X and Baby Boomers favoring Italian-made items, and younger generations showing a closer preference for French-made.
Made-in Italy, Made-in France, generational preference, line chart, luxury products
false
Made-in Italy preferred amongst Gen X & Baby Boomers, Made-in France much closer amongst youngers2018 True-Luxury Global Consumer Insight
Single Chart
BCG
View slide
Two charts: a column chart comparing long-term profitable vs a bar chart showing low-growth companies across industries; a heatmap comparing industry strengths.
Industry Overview
Professional Services
Analyzes long-term profitable growth in various industries, demonstrating different resilience and performance metrics.
Profitable growth, industry comparison, resilience, performance metrics, heatmap
false
An industry perspectiveReinventing for resilience
Multiple Chart
Accenture
View slide
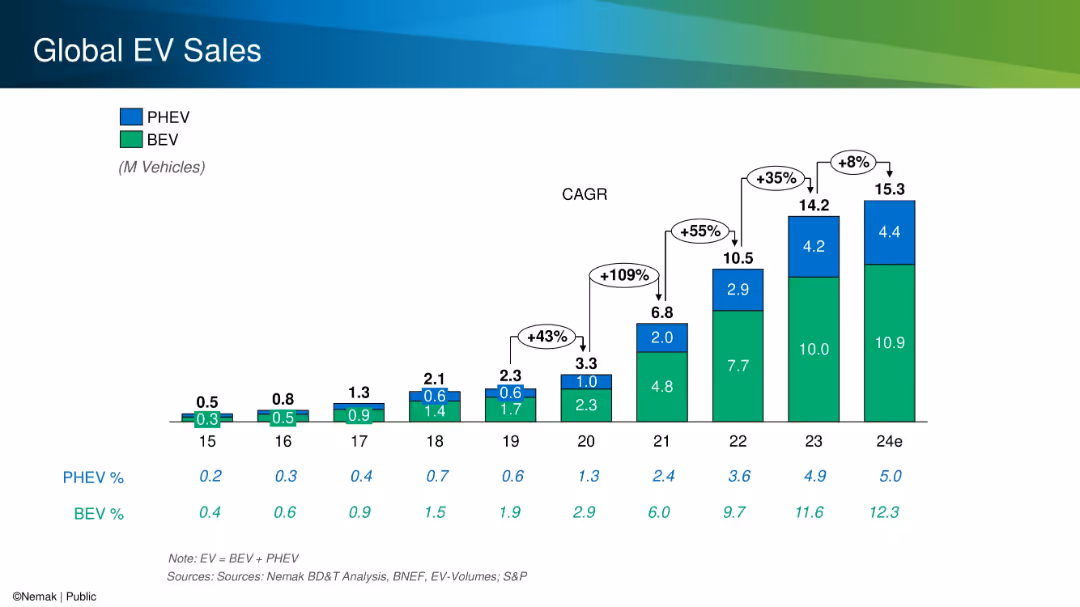
Stacked bar chart with color-coded segments for PHEV and BEV, annotated with CAGR growth percentages.
Performance Metrics and KPIs
Industrial & Manufacturing
The slide provides a historical and projected overview of global electric vehicle (EV) sales split between BEVs and PHEVs. It highlights significant year-over-year growth, especially from 2020 to 2023, and shows total volumes and market share increases.
EV sales, BEV, PHEV, CAGR, growth, market share
false
Global EV Sales2024 Barclays ESG Conference
Single Chart
Barclays
View slide
Circular diagram illustrating the data value chain from data collection to monetization, with a column chart projecting total data traffic from 2020 to 2026.
Technology and Digital Transformation
Technology & Software
The slide emphasizes the market opportunities created by digitalization along the data value chain. It outlines the process from data collection to value creation and monetization, projecting a substantial increase in data traffic and highlighting the economic potential of data-driven business models.
Digitalization, Data Value Chain, Monetization, Data Traffic
false
Digitalization enables new market opportunities Significant future growth is expected along the data value chain, particularly in data monetizationMegatrend 5 - Technology & Innovation
Mixed Chart
Roland Berger
View slide
The slide displays a column chart comparing adjusted ROE from 2019 to the outlook in 2021, with annotations for various business drivers. A dark blue and green color scheme is used to differentiate between historical data and outlook projections.
Financial Performance
Financial Services
This slide focuses on JPMorgan Chase's return on equity (ROE) outlook, showing an adjusted ROE comparison and the impact of different business factors. It is useful for financial analysts and investors to assess the company's financial performance and capital allocation strategies while considering market growth and potential risks.
ROE, Capital, Growth, Market Share, Investment, Expense, Valuation, Tax, Credit Costs, Outlook
false
We maintain 16% ROE outlook with approximately 25% more capitalCorporate & Investment Bank 2022
Single Chart
JP Morgan
View slide
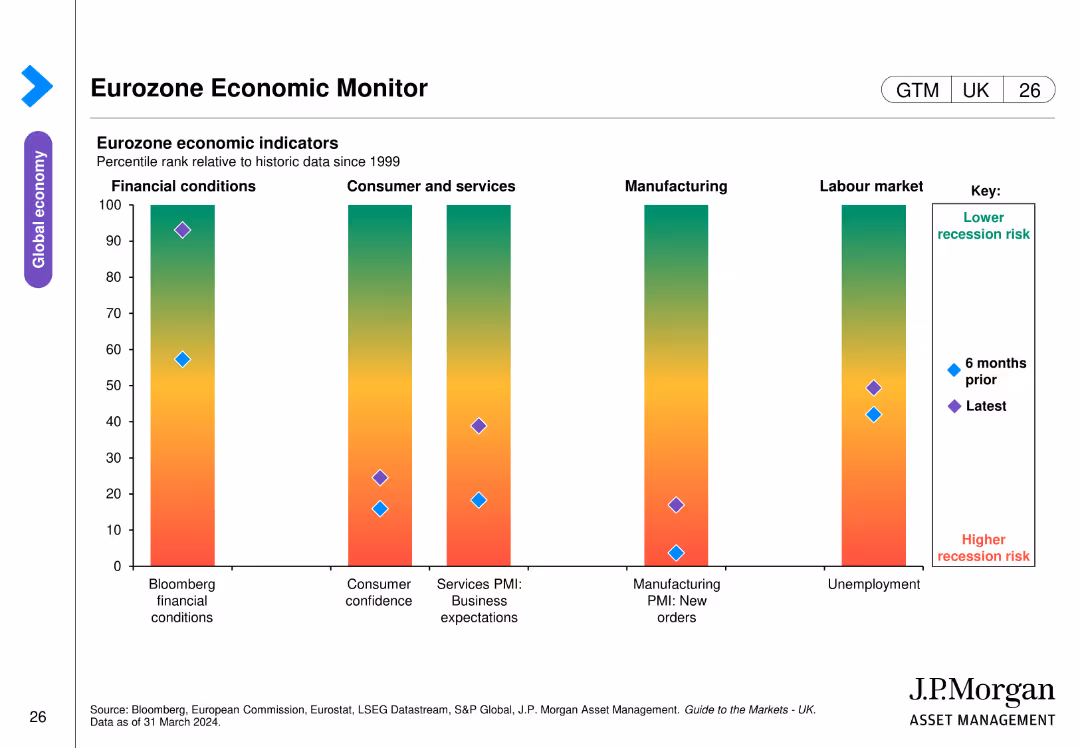
The slide includes a bar chart displaying eurozone economic indicators. The bars show percentile ranks relative to historic data across different economic conditions, consumer confidence, business expectations, manufacturing orders, and unemployment.
Market Analysis and Trends
Financial Services
This slide monitors eurozone economic health by presenting various economic indicators over time, aiding in the assessment of recession risks and economic stability.
eurozone, economic indicators, recession risk, consumer confidence, manufacturing orders
false
Eurozone Economic MonitorGuide to the Markets UK | Q2 2024
Single Chart
JP Morgan
1
...
Next
Load More
Hold On!
We are searching in our database
If nothing, comes up, please try different filters!
Create a FREE account to continue browsing
Receive Instant Access to 1,000+ slides from companies like McKinsey, Google, and Goldman Sachs
First Name
Last Name
Email
Password
I agree to all
Terms & Privacy Policy
Thank you! Your submission has been received!
Oops! Something went wrong while submitting the form.
Have an account?
Sign in
Column Chart
Heatmap
Chevron
Org Chart
Infographic
Callouts
Timeline
List
Graphic
Picture
Process Flow
Diagram
Paragraph
Map
Table
Framework
Subtitle
Takeaway Box
Icon
Other Chart
Radar Chart
Waterfall Chart
Mekko Chart
Pie Chart
Scatter Plot
Line Chart
Bar chart
Bullet points


![To fix [Country], we need a strong leader willing to break the rules](https://cdn.prod.website-files.com/654e70fb59937215cac87b19/6899be2f75b0eec59aa53bda__f1yGTLQcvEobAXZiFDH0F8j5QImR-J20KLBLYJml0E.avif)