My Account
My Slides
Search by Category
Templates
View All Templates
Download Template Slides
Leave Feedback
Login
Logout
Get Started
Browse all Slides
Browse all Slides
Create a FREE Account
Instant access to 1,000+ real slides from top companies like McKinsey, BCG, Goldman Sachs, Google and many more!
First Name
Last Name
Email
Password
I agree to all
Terms & Privacy Policy
Thank you! Your submission has been received!
Oops! Something went wrong while submitting the form.
Have an account?
Sign in
Instant access to the internet's best slides
Get access to 40+ advanced filters and more
Advanced Search and Filters
Access to
10,000+ slides
Access to Category Pages
Save/Bookmark Slides
PowerPoint Template Library (New)
Choose your plan
MONTHLY
$12/month
Billed every month, cancel anytime.
YEARLY
$9/month
Billed $108 annually, cancel anytime.
Checkout for $12/month
Checkout for $108/yr
Secured by Stripe | AES-256 bit encryption
Spark Your Next Big Idea with New Presentation Templates
VIEW ALL Templates
Welcome,
Welcome
Upgrade to SlideStart
Pro
Instant access to 15,000+ slides
Show Featured Only
Checkbox 8
Companies
Mckinsey
Bain
BCG
EY
Deloitte
Accenture
PwC/Strategy&
JP Morgan
Goldman Sachs
Morgan Stanley
Citigroup
Deutsche Bank
Barclays
LEK
Kearney
Oliver Wyman
Booz Allen Hamilton
Gartner
IPSOS
Nielsen
Slide type
Header Horizontal
Framework
Vertical Flow
Single Chart
Single Chart
Text Only
Mixed Chart
Header Vertical
Graphic
Pillar
Multiple Chart
Agenda
Title
Table
Linear Flow
Upgrade to SlideStart
Pro
Instant access to 40+ advanced filters
Industry
Upgrade to SlideStart
Pro
Instant access to 40+ advanced filters
Technology
Healthcare
Financial Services
Consumer Goods
Energy & Utilities
Manufacturing
Retail
E-commerce
Logistics
Telecommunications
Real Estate
Professional Services
Education
Media
Entertainment
Hospitatlity
Tourism
Agriculture
Food Production
Government & Public Sector
Environmental
Sustainability
Use Case
Upgrade to SlideStart
Pro
Instant access to 40+ advanced filters
Sales and Business Development
Mergers and Acquisitions
Corporate Finance and Valuation
Performance Metrics and KPIs
Client Case Studies
Competitive Landscape
Product and Service Analysis
Customer and Market Segmentation
Organizational Structure
Human Resources and Talent Management
Industry Overview
Regulatory and Compliance
Risk Assessment and Management
Agriculture & Food Production
Hospitality and Tourism
Government
Environmental
Sustainability
Clear all
Thank you! Your submission has been received!
Oops! Something went wrong while submitting the form.
Show Featured Only
Checkbox 8
Companies
Mckinsey
Bain
BCG
EY
Deloitte
Accenture
PwC/Strategy&
JP Morgan
Goldman Sachs
Morgan Stanley
Citigroup
Deutsche Bank
Barclays
LEK
Kearney
Oliver Wyman
Booz Allen Hamilton
Gartner
IPSOS
Nielsen
Slide type
Text Only
Linear Flow
Vertical Flow
Single Chart
Header Horizontal
Mixed Chart
Header Vertical
Pillar
Multiple Chart
Graphic
Agenda
Title
Table
Framework
Industry
Technology
Healthcare
Financial Services
Consumer Goods
Energy & Utilities
Manufacturing
Retail
E-commerce
Logistics
Telecommunications
Real Estate
Professional Services
Education
Media
Entertainment
Hospitatlity
Tourism
Agriculture
Food Production
Government & Public Sector
Environmental
Sustainability
Use Case
Sales and Business Development
Mergers and Acquisitions
Corporate Finance and Valuation
Performance Metrics and KPIs
Client Case Studies
Competitive Landscape
Product and Service Analysis
Customer and Market Segmentation
Organizational Structure
Human Resources and Talent Management
Industry Overview
Regulatory and Compliance
Risk Assessment and Management
Agriculture & Food Production
Hospitality and Tourism
Government
Environmental
Sustainability
Clear all
Thank you! Your submission has been received!
Oops! Something went wrong while submitting the form.
Tag
View slide
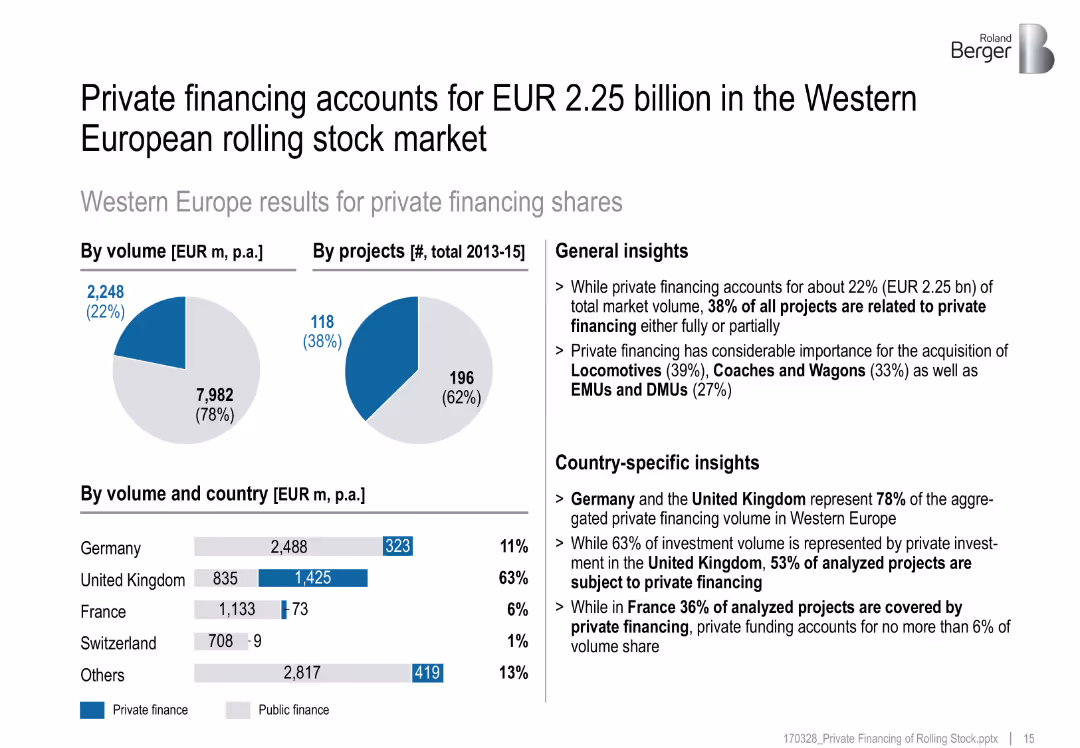
Pie charts, bar chart, and annotated insights by country
Investment Analysis
Transportation & Logistics
Highlights Western Europe’s private rail financing landscape, with country-specific breakdowns showing the UK and Germany as leading contributors.
private investment, Western Europe, rolling stock, country insights, rail market
false
Private financing accounts for EUR 2.25 billion in the Western European rolling stock marketPrivate financing of rolling stock
Multiple Chart
Roland Berger
View slide
Bar chart showing the estimated time for financial recovery among households post-COVID-19. Categories range from one year to more than five years.
Risk Assessment and Management
Financial Services
The slide details the estimated time for Canadian households to recover financially from COVID-19, with responses indicating a range from one year to more than five years. It also notes a small percentage of respondents who feel their finances were not significantly impacted.
COVID-19, Financial Recovery, Canadian, Households, Pandemic
false
How Long It Will Take Households to RecoverINVESTING AND THE COVID-19 PANDEMIC
Mixed Chart
IPSOS
View slide
Displays a shift in the newspaper classified revenue from predominantly newspapers in 2003 to a majority online in 2019, illustrated with a before-and-after pie chart comparison. The slide provides detailed annotations about key players in the online classified market.
Competitive Landscape
Media & Entertainment
Examines the transition of classified ad revenues from traditional newspapers to online platforms, identifying key players that dominate the new market landscape. This slide is valuable for strategic planning in media and advertising, providing insights into market dynamics and potential areas for investment or innovation.
market shift, classified ads, online platforms, media strategy, competitive analysis
false
Online, ‘pure play’ sites have captured the majority of classified revenuesWestern Europe News Media Landscape Trends
Multiple Chart
Accenture
View slide
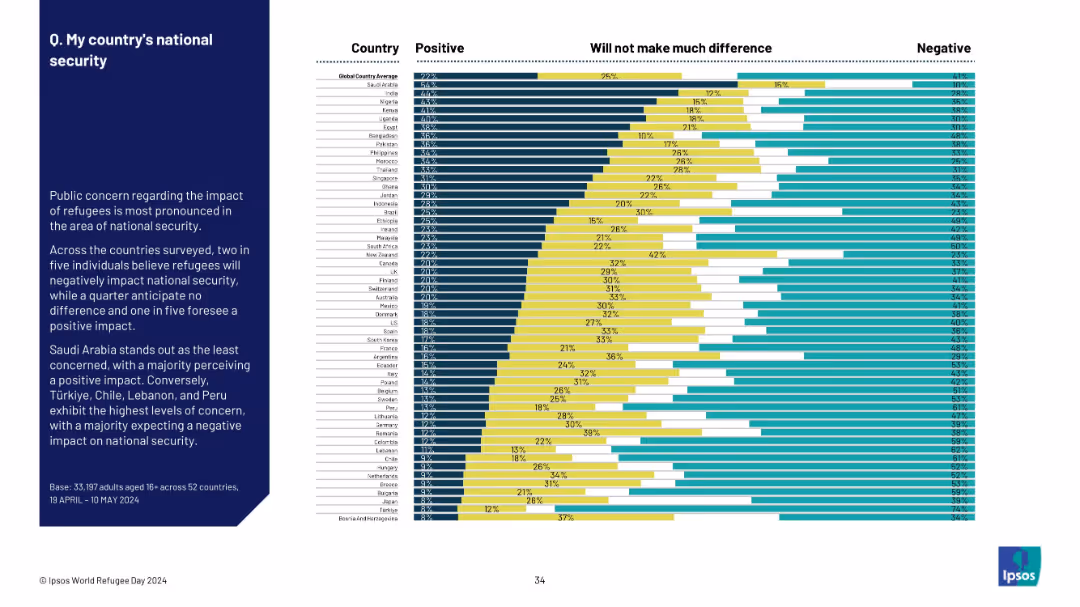
Horizontally segmented bar chart with opinion distributions; summary text on the left.
Risk Assessment and Management
Government & Public Sector
The slide explores how refugees are perceived in terms of national security. Two in five globally view the impact as negative. Saudi Arabia sees it positively, while Türkiye, Lebanon, and Chile express strong concerns.
refugees, national security, safety, perception, public sentiment, Ipsos survey, global opinion, threat, policy
false
Q. My country's national securityWORLD REFUGEE DAY
Mixed Chart
IPSOS
View slide
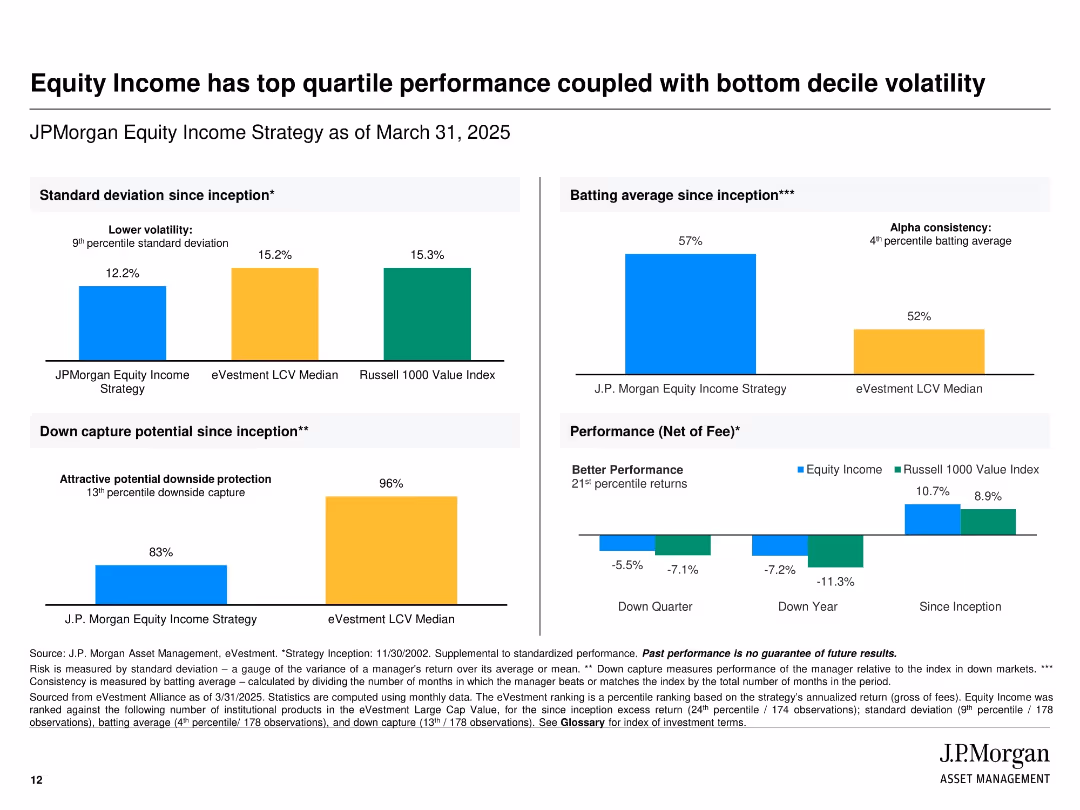
Grid-based design with grouped bar charts showing volatility, down capture, performance, and batting average compared to benchmarks.
Financial Performance
Financial Services
Demonstrates how JPMorgan’s Equity Income Strategy offers lower volatility and strong downside protection. Shows outperformance versus benchmarks across different timeframes, emphasizing consistent alpha generation and strong performance even during downturns.
equity income, performance, volatility, downside protection, benchmark comparison, standard deviation
false
Equity Income has top quartile performance coupled with bottom decile volatilityJPMorgan Equity Income Strategy
Multiple Chart
JP Morgan
View slide
Circular charts showing percentages related to risk management confidence, with explanatory text.
Risk Assessment and Management
Financial Services
Discusses the gaps in risk management processes among APAC family offices, detailing specific confidence issues.
risk management, APAC, family offices, process gaps, confidence
false
Many APAC family offices display a lack of confidence about their risk management processesEY Family Office Study
Multiple Chart
EY
View slide
The slide contains two sections: the top part with column charts showing adoption percentages for different technologies and the bottom part with another set of column charts illustrating use cases.
Technology and Digital Transformation
Technology & Software
This slide details the adoption rates of various emerging technologies and relevant use cases, showing the gap between current use and future willingness to adopt.
adoption curve, emerging technologies, use cases, technology adoption, future trends
false
Advancing the adoption curveIs the future of your tech stack built on the foundation of your people?
Multiple Chart
EY
View slide
The slide features three main components: bar graphs showing industry involvement, a line chart illustrating trend popularity over time, and lists highlighting target demographics and tags.
Market Analysis and Trends
Media & Entertainment
This slide analyzes the impact of cultural heritage on various demographics and industries, illustrating growth in digital engagement with art and traditional crafts.
Seniors, Gen X, Millennials, Art & Design, Craft, Traditions, Preservation, Museum
false
Functional Nextatlas Insight Cultural heritage renaissance reflects society’s quest for authenticity amid a rapidly digitalizing worldDigital Revolution Awards
Multiple Chart
Bain
View slide
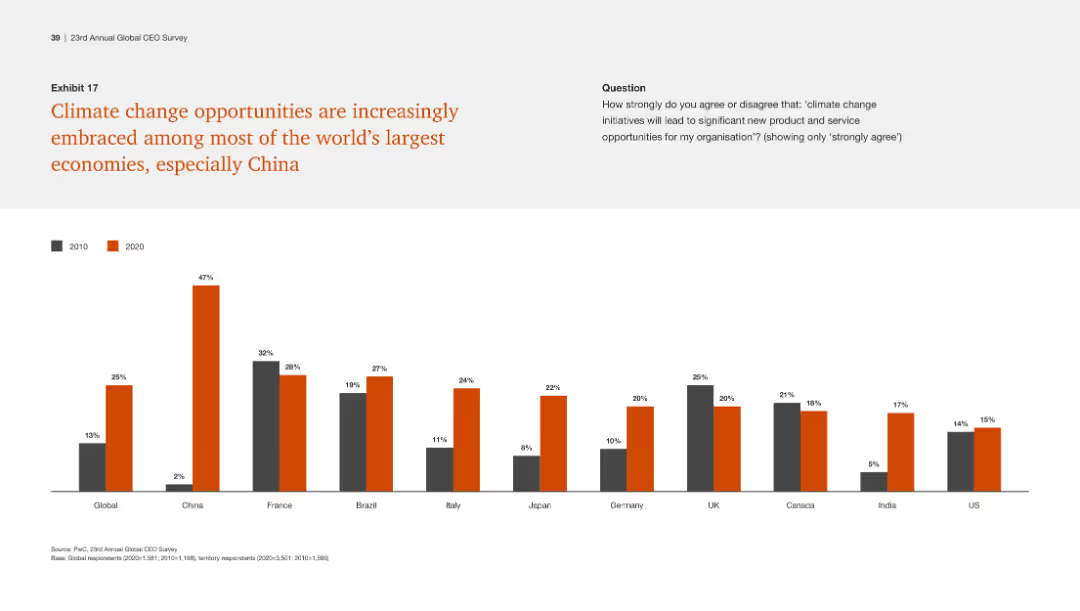
Column chart comparing agreement with climate change opportunities among major economies between 2010 and 2020, including bars for China, France, Brazil, and others.
Market Analysis and Trends
Environmental Services & Sustainability
The slide shows how agreement on climate change opportunities has increased in major economies, highlighting significant growth in China, France, and Brazil.
Climate change, economies, opportunities, growth, 2020
false
Exhibit 17 Climate change opportunities are increasingly embraced among most of the world’s largest economies, especially China23rd Annual Global CEO Survey Navigating the rising tide of uncertainty
Single Chart
PwC/Strategy&
View slide
Grid layout with circular percentage indicators by year (2015–2023) across 4 threat types. Each includes a trend in percentage points.
Risk Assessment and Management
Government & Public Sector
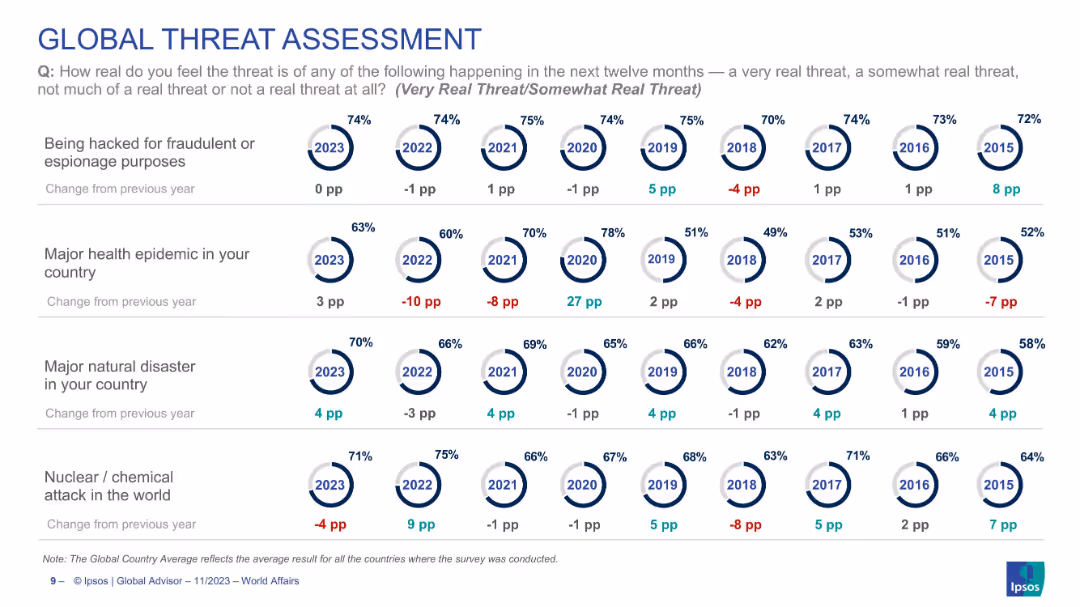
Shows global perceptions of major threats (cyber hacking, epidemics, natural disasters, nuclear/chemical attack) over time. Each row tracks how serious the public sees these risks, indicating trend shifts (e.g., epidemic threat up 3 points in 2023). Provides historical trend context across 9 years.
threat perception, global risks, natural disaster, cyberattack, epidemic, nuclear threat, trend analysis, Ipsos, global survey
false
GLOBAL THREAT ASSESSMENTWORLD AFFAIRS 2023
Single Chart
IPSOS
View slide
Slide includes column charts of revenue and balance sheet metrics across periods, and a line graph illustrating profitability trends.
Financial Performance
Financial Services
Provides a financial overview showcasing growth in revenue and assets, aimed at stakeholders interested in corporate financial health and performance metrics.
financial, performance, revenue, growth, assets
false
Financial performance 1H23 financial performanceHSBC Mexico Barclays Global Financial Services Conference 2023
Multiple Chart
Barclays
View slide
White background with a bar chart showing the marginal abatement cost curve. Clear labeling and color coding for different cost ranges.
Financial Performance
Environmental Services & Sustainability
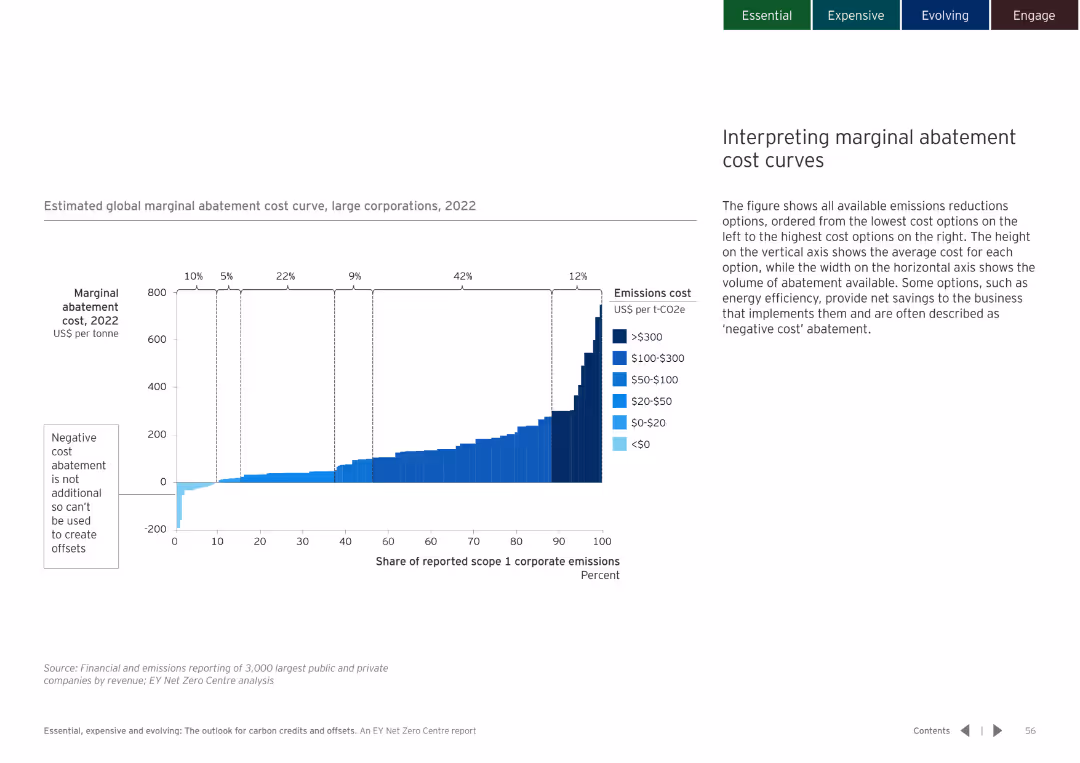
Explains the interpretation of marginal abatement cost curves and the implications for emissions reduction strategies.
abatement cost curves, emissions reduction, cost interpretation
false
Estimated global marginal abatement cost curve, large corporations, 2022Essential, expensive and evolving: The outlook for carbon credits and offsets
Mixed Chart
EY
View slide
Line graph showing indexed business climate trends across regions, with emphasis on recent delta changes
Market Analysis and Trends
Industrial & Manufacturing
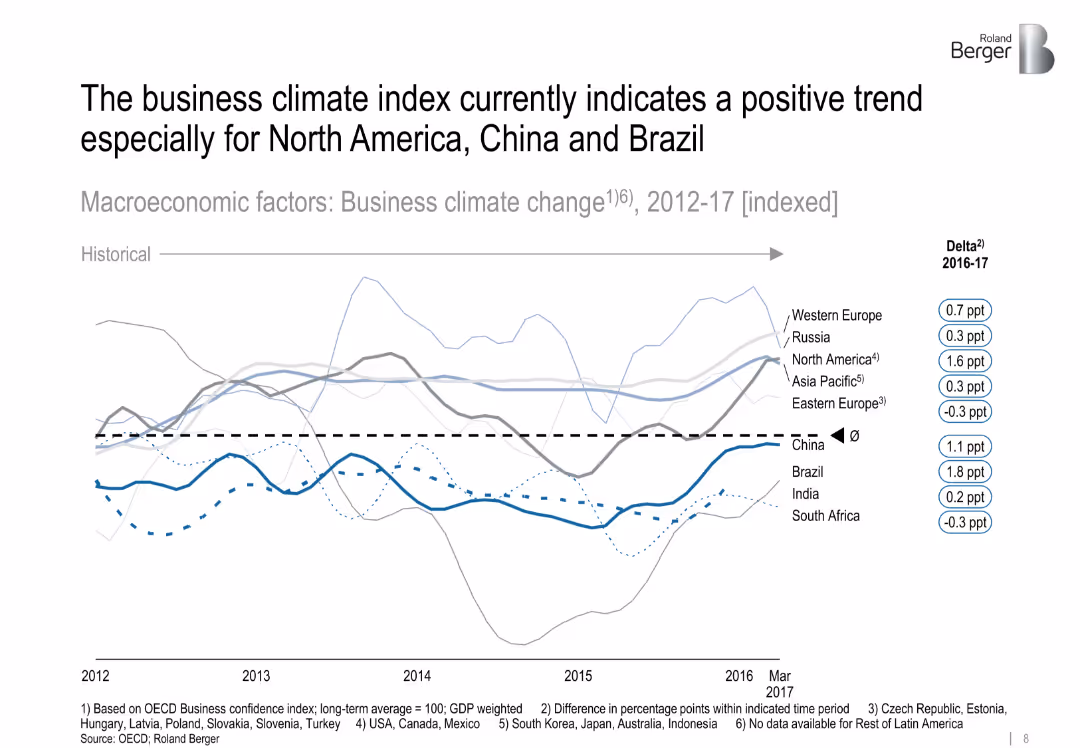
The slide evaluates regional business climate shifts from 2012 to 2017, highlighting recent improvements in North America, China, and Brazil. It uses OECD data to chart confidence and trend direction.
business climate, macroeconomics, confidence, North America, China, Brazil, OECD
false
The business climate index currently indicates a positive trend especially for North America, China and BrazilTruck and trailer components – Success factors for suppliers in specialized markets
Single Chart
Roland Berger
View slide
Features logos of Athena, Chase.com, and ServiceNow with bullet points outlining improvements and efficiencies gained in each case. It highlights specific achievements such as cost reductions, enhanced customer support, and platform optimizations.
Technology and Digital Transformation
Technology & Software
Showcases technology-driven operational enhancements and cost efficiency improvements through three distinct case studies.
Case Study, Digital Strategy, Capacity, Performance, Cost Savings, Technology Platforms, Financial Services, Cloud-Native, Automation
false
Three examples that demonstrate the value we have realizedGlobal Technology
Pillar
JP Morgan
View slide
Includes a heatmap chart depicting the interconnectedness of various risks including financial, operational, disruptive technology, and compliance risks, among others, based on industry data.
Risk Assessment and Management
Financial Services
Details how different risk types impact each other across sectors, providing a comprehensive view of potential vulnerabilities in the financial industry. Useful for strategic planning and risk assessment workshops.
risk assessment, heatmap, financial industry, strategic planning
false
How key risks are interconnectedHyper-disruption demands constant reinvention
Table
Accenture
View slide
Dual bar charts comparing # of universities with QT programs and degrees (2022 vs 2023).
Human Resources and Talent Management
Education & Training
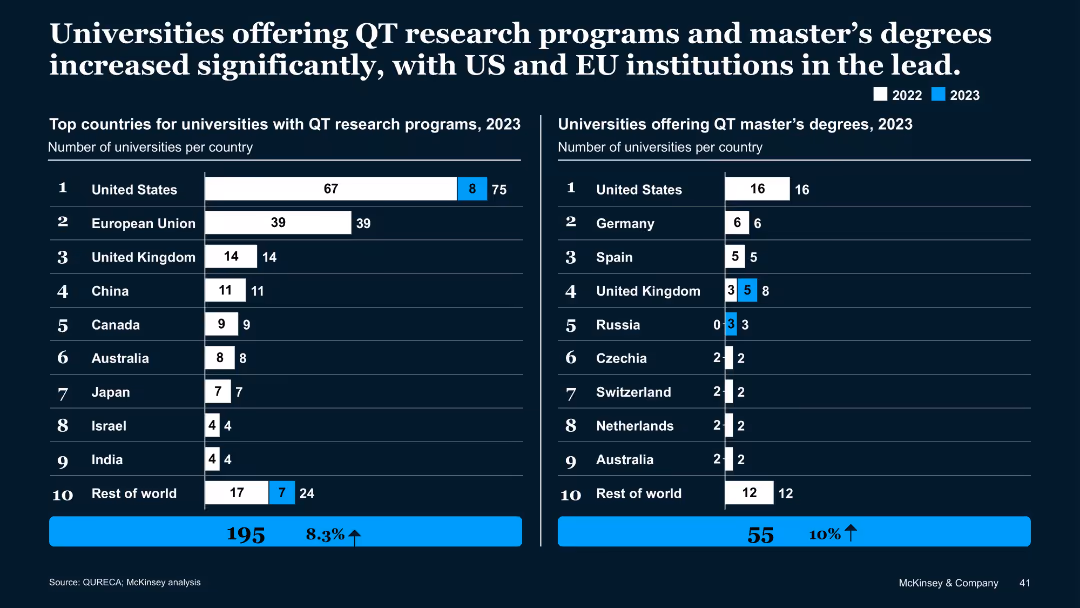
Shows expansion in academic QT programs. U.S. leads with 75 research universities and 16 master’s programs. EU follows. QT education has grown 8.3% for research and 10% for master’s programs in one year, indicating academic scaling.
quantum education, universities, master’s degrees, talent, training, US, EU, 2023
false
Universities offering QT research programs and master’s degrees increased significantly, with US and EU institutions in the lead.Quantum Technology Monitor
Multiple Chart
McKinsey
View slide
Utilizes a scatter plot chart with textual and numeric data to discuss global phenomena impacts, incorporating color-coded risk levels for clarity.
Risk Assessment and Management
Financial Services
Discusses various global risks perceived by executives and their expected impacts on businesses, with a focus on economic factors.
risk assessment, executives, global phenomena, impact
false
Heading into 2023, executives view inflation and economic uncertainties as biggest risks, while digital & technology as opportunitiesThe CEO Outlook Caution, Optimism, and Navigating the Road Ahead
Mixed Chart
BCG
View slide
The slide presents a donut chart and a gauge chart showing the extent of managerial engagement in developing team engagement plans. Both charts use vibrant colors to differentiate levels of agreement and disagreement.
Human Resources and Talent Management
Professional Services
Focuses on how actively managers engage in team development, crucial for HR training sessions or leadership workshops to enhance managerial effectiveness.
managerial engagement, HR, development
false
Active role of Managers in building engagement plans with their team membersHR Pulse Survey Presentation of results
Multiple Chart
PwC/Strategy&
View slide
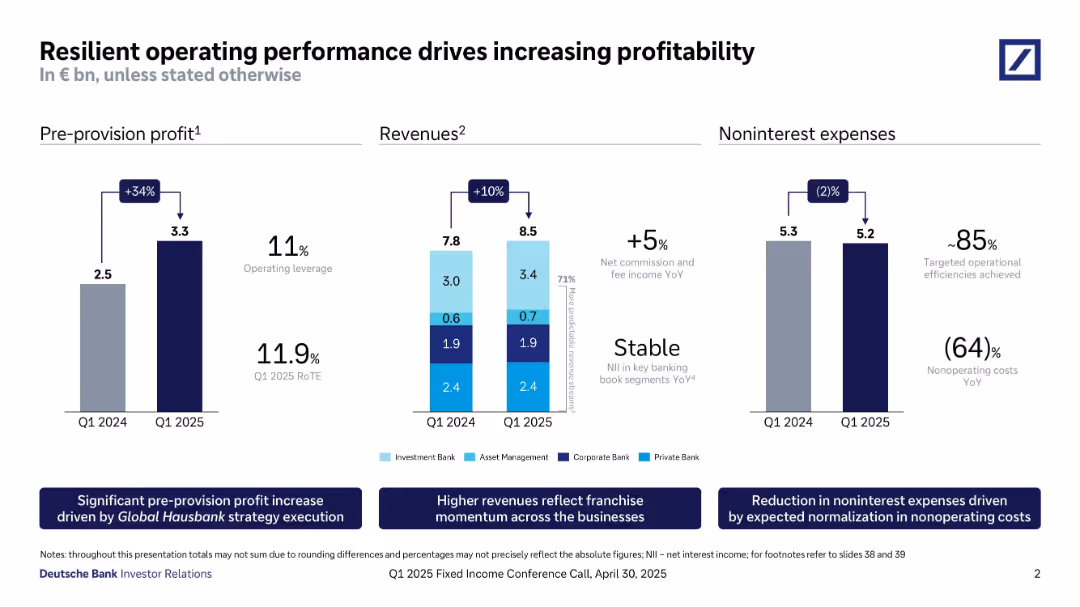
Three-column layout with bar charts showing pre-provision profit, revenues, and noninterest expenses.
Financial Performance
Financial Services
The slide demonstrates Deutsche Bank’s Q1 2025 operating performance improvements: pre-provision profit grew 34%, revenue increased 10%, and noninterest expenses decreased 2%. Highlights include RoTE, stable NII, and cost reductions.
Profitability, Operating Leverage, RoTE, Revenues, Expenses, Efficiency, Strategy Execution, Q1 2025
false
Resilient operating performance drives increasing profitabilityQ1 2025 Fixed Income Investor Conference Call
Multiple Chart
Deutsche Bank
View slide
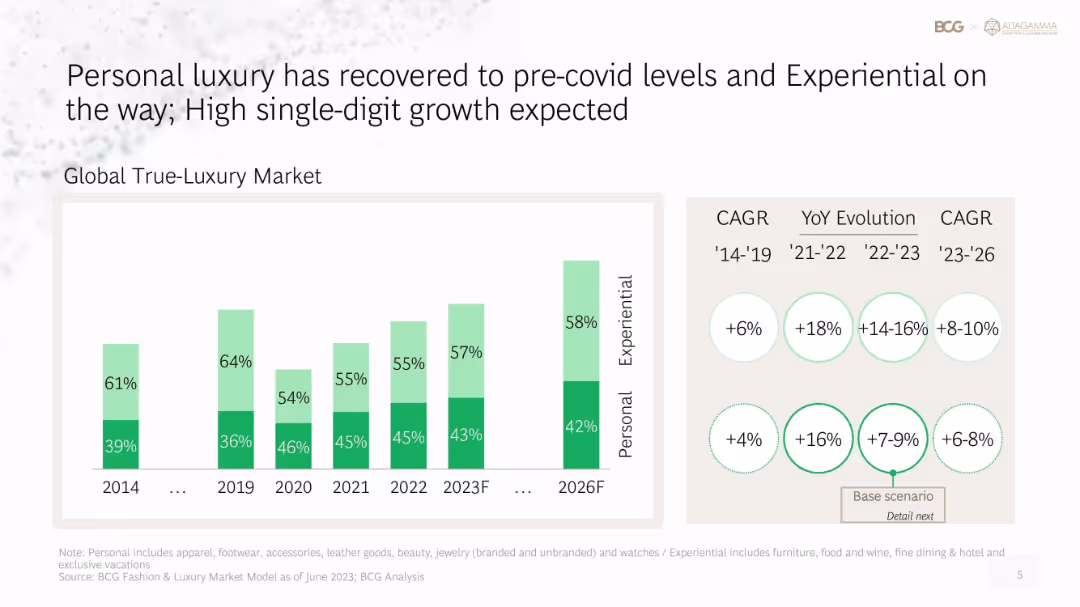
Bar graph of global true-luxury market split (personal vs. experiential), CAGR evolution shown in bubbles
Market Analysis and Trends
Consumer Goods
This slide showcases the rebound of the personal luxury market and the rise of experiential luxury. Growth metrics from 2014 to 2026 are visualized through a bar graph and CAGR bubbles, highlighting recovery from Covid and expected strong performance ahead.
luxury market, experiential, personal goods, CAGR, recovery, growth forecast, BCG, consumer behavior
false
Personal luxury has recovered to pre-covid levels and Experiential on the way; High single-digit growth expectedTrue-Luxury Global Consumer Insights
Single Chart
BCG
View slide
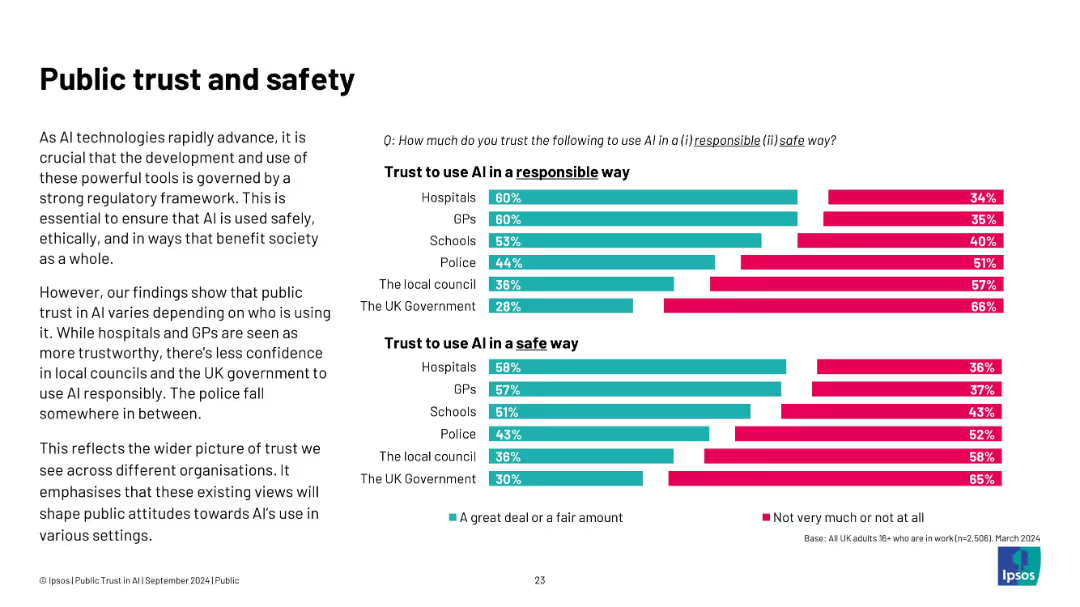
Two sets of horizontal bar charts on the right, comparing “Trust to use AI responsibly” and “Trust to use AI safely” across public institutions. Left-aligned explanatory text.
Risk Assessment and Management
Artificial Intelligence
This slide explores varying public trust levels in institutions using AI. Hospitals and GPs are trusted the most, while the UK Government and local councils rank lowest. Trust levels are split between “a great deal/fair amount” and “not very much/not at all,” indicating skepticism about responsible and safe AI use. This illustrates the role of institutional reputation in AI governance.
trust, AI safety, responsible use, healthcare, government, public perception, ethics, regulation, UK institutions
false
Public trust and safetyPUBLIC TRUST IN AI: IMPLICATIONS FOR POLICY AND REGULATION
Mixed Chart
IPSOS
View slide
This slide features a horizontal bar chart comparing agreement and disagreement levels on government action against climate change across global markets.
Market Analysis and Trends
Government & Public Sector
Highlights public opinion on government action regarding climate change, showing a high level of agreement that inaction is failing citizens.
climate change, government, public opinion, global, action
false
There is strong agreement that governments will be failing citizens if they don’t act now on climate changeEARTH DAY 2021 GLOBAL ADVISOR https://www.ipsos.com/en/earth-day-2021-globally-people-wonder-whats-plan-tackle-climate-change Public opinion and action on climate change
Multiple Chart
IPSOS
View slide
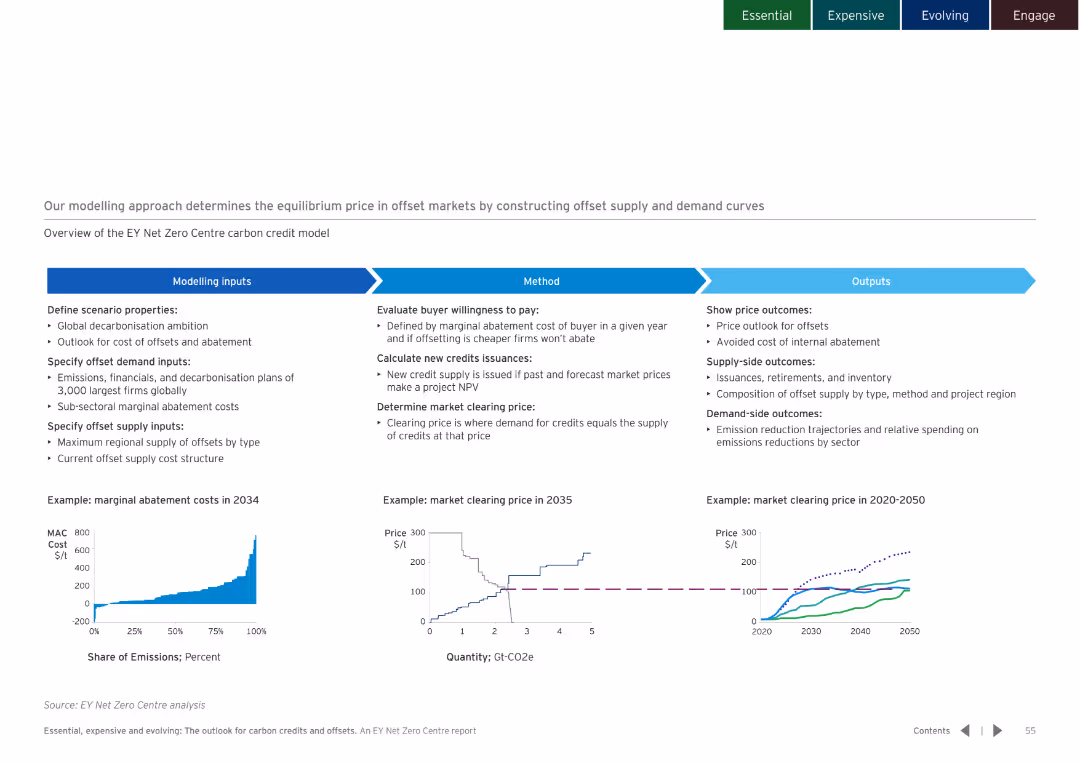
White background with a flowchart explaining the modelling approach, including inputs, methods, and outputs. Charts illustrate key concepts.
Strategic Planning
Environmental Services & Sustainability
Details the modelling approach used to determine the equilibrium price in offset markets, covering inputs, methods, and expected outputs.
equilibrium price, offset markets, modelling approach
false
Our modelling approach determines the equilibrium price in offset markets by constructing offset supply and demand curvesEssential, expensive and evolving: The outlook for carbon credits and offsets
Multiple Chart
EY
View slide
Featuring a mixture of column charts and stacked bar graphs, this slide presents AWM client assets, NAV, and net returns for various alternative investment options over several years. The data is segmented by asset type and performance against benchmarks.
Investment Analysis
Financial Services
This slide reviews the growth and scaling of alternative investments, presenting data on net asset value and returns compared to benchmarks. Useful for investor meetings or strategic reviews focusing on diversification and alternative investment strategies.
alternatives, investment, growth, benchmarks, net asset value
false
Key investment #3: Building AlternativesAsset & Wealth Management 2022
Multiple Chart
JP Morgan
View slide
A line chart illustrates the year-on-year CPI inflation rate and its sequential short-term momentum from 2018 to 2023. A highlighted section indicates recent trends. The slide includes a textbox with implications for corporates and commentary on inflation momentum and Federal Reserve policies.
Market Analysis and Trends
Financial Services
The slide examines the persistent inflation momentum in the US despite base effects lowering headline inflation rates. It suggests that further monetary policy tightening may be needed and advises companies to plan for sustained inflation levels in their strategic planning.
CPI inflation, inflation trends, year-on-year, Federal Reserve, monetary policy, inflation momentum, corporate planning, economic analysis, inflation rate, sequential momentum
false
Sequential inflation momentum is still not subsiding, even as base effects continue to bring down the headline inflation rateMarch Macro Brief Financial fissures emerge
Mixed Chart
Accenture
View slide
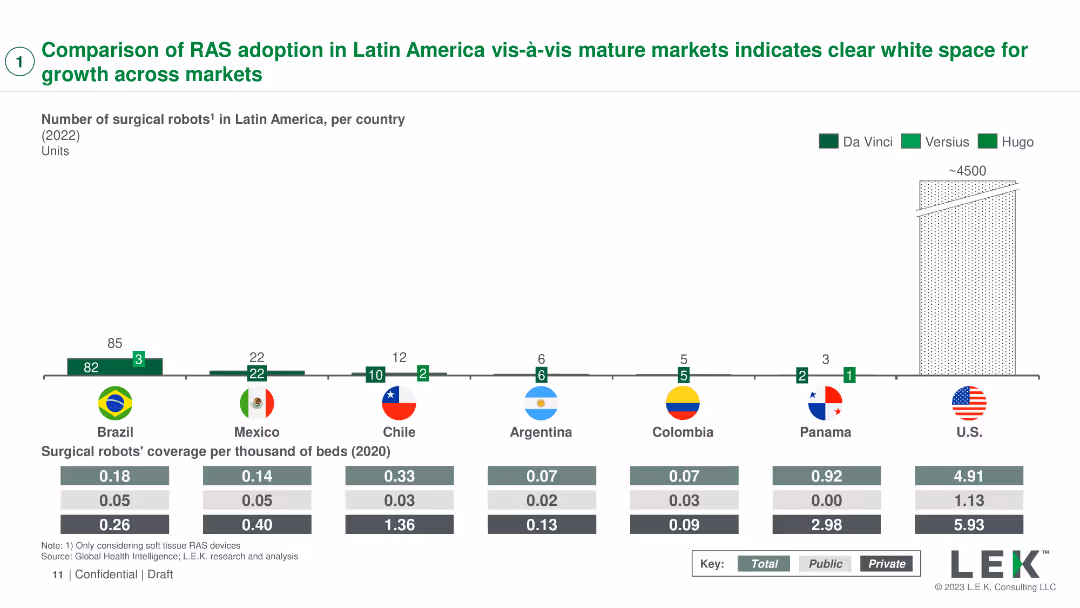
A column chart showing the number of surgical robots in various countries with coverage per thousand beds
Market Analysis and Trends
Healthcare & Pharmaceuticals
Compares the adoption of robotic-assisted surgery (RAS) systems in Latin America with mature markets, identifying growth opportunities
RAS adoption, market comparison, Latin America, growth, healthcare
false
Comparison of RAS adoption in Latin America vis-à-vis mature markets indicates clear white space for growth across marketsWhat is and how to navigate the RAS opportunity in LatAm?
Mixed Chart
LEK
View slide
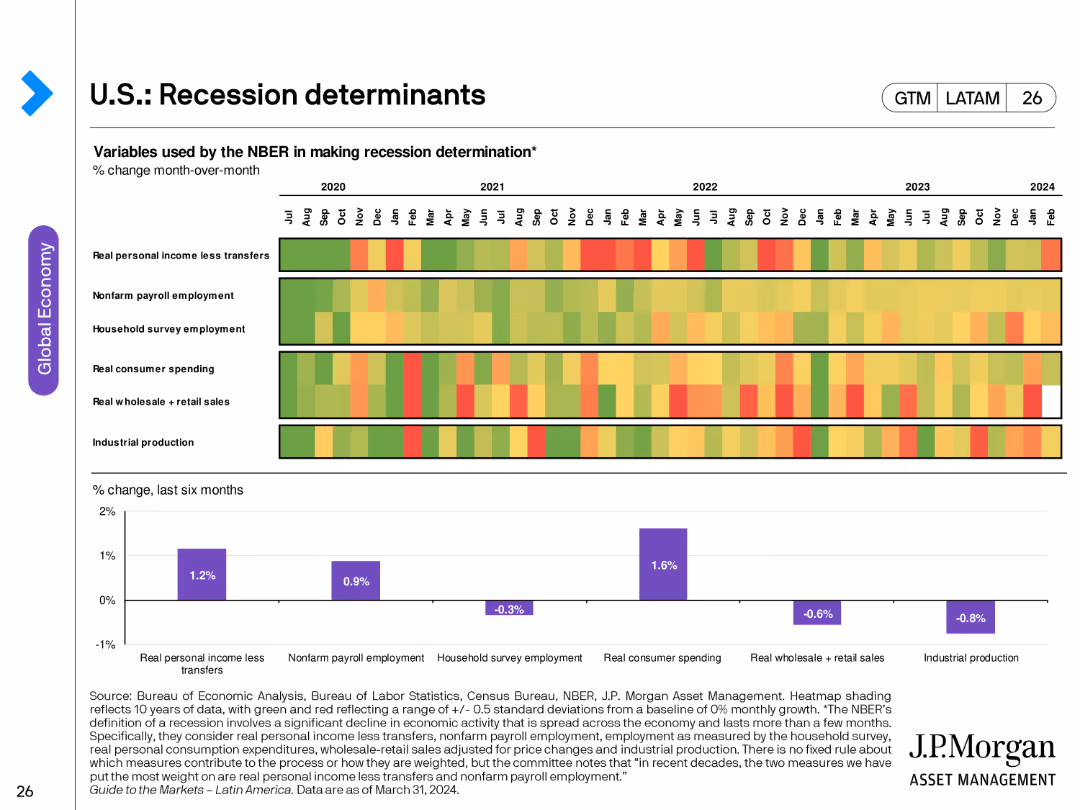
The slide includes a heatmap of various economic indicators used by NBER to determine recessions, along with a bar chart showing percent change over the last six months for specific metrics like real personal income and industrial production.
Risk Assessment and Management
Financial Services
This slide identifies key economic indicators used to determine recessions, presenting a detailed month-over-month change analysis. Useful for risk management and economic forecasting.
recession, NBER, economic indicators, risk management, personal income, industrial production
false
U.S.: Recession determinantsGuide to the Markets Latin America | 2Q 2024
Mixed Chart
JP Morgan
View slide
The slide features a pie chart and a bar graph depicting the likelihood of employees seeking new employment within the next 12 months, segmented by age group. The design is straightforward with a clear visual hierarchy that directs attention to the key data points.
Human Resources and Talent Management
Professional Services
This slide presents data from a global workforce survey, highlighting the ongoing trend of the Great Resignation and its impact on employee retention across different age groups. It's particularly relevant for human resources discussions on strategies to improve employee retention and engagement.
Great Resignation, Employee Retention, Workforce, Age Groups, Survey Data, Pie Chart
false
1. Backdrop - our workforce challenges today (continued)Boardroom Agenda
Multiple Chart
PwC/Strategy&
View slide
A graphically intensive slide illustrating growth opportunities and textual information on a dark background.
Investment Analysis
Financial Services
This slide outlines the estimated growth opportunities across different financial sectors, highlighting the engineering support for these initiatives.
Growth, Opportunities, Franchise, Investing, Banking, Revenue, Engineering
false
Investing in our Franchise Opportunities for growthGoldman Sachs Presentation to Credit Suisse Financial Services Conference
Vertical Flow
Goldman Sachs
View slide
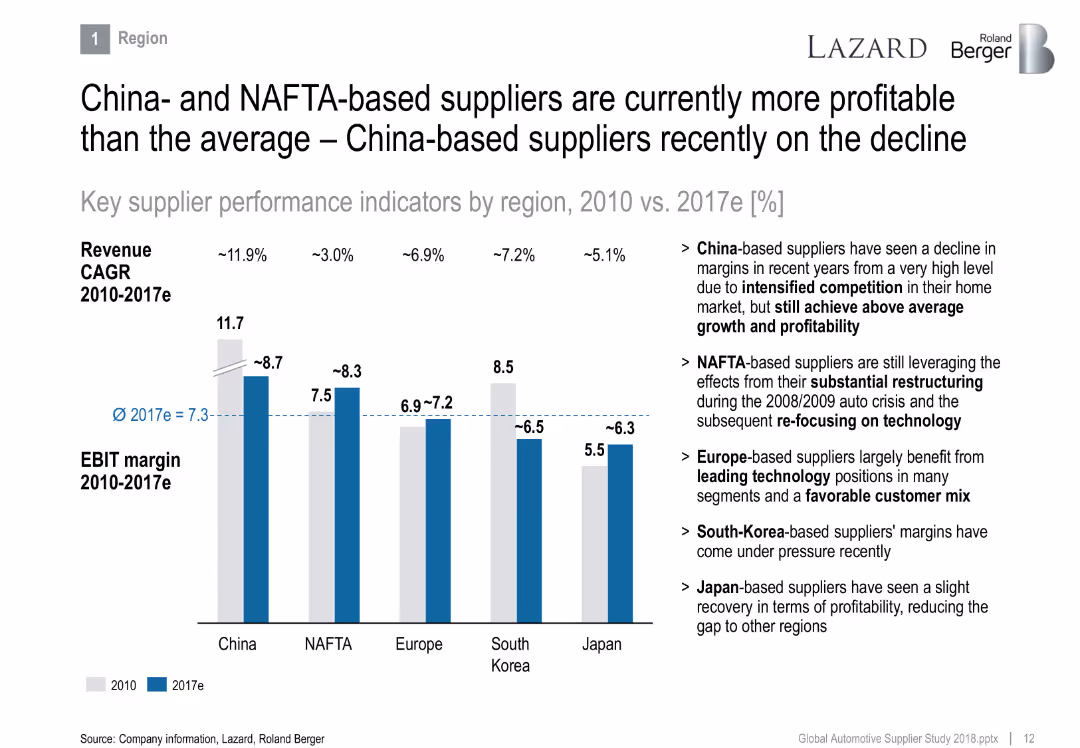
Bar chart comparing EBIT margins and revenue CAGR by region (China, NAFTA, Europe, South Korea, Japan), with explanatory text on the right.
Financial Performance
Industrial & Manufacturing
Compares supplier profitability across global regions from 2010 to 2017e. China and NAFTA regions show higher margins despite challenges, with commentary on competitive dynamics, restructuring effects, and customer mix advantages.
EBIT margin, suppliers, NAFTA, China, profitability, regions, restructuring, competition
false
China- and NAFTA-based suppliers are currently more profitable than the average – China-based suppliers recently on the declineThe overall positive sentiment was also reflected in the supplier valuation levels that still trade above their long-term average
Mixed Chart
Roland Berger
View slide
The slide shows a line chart with time on the horizontal axis and percentage on the vertical axis, displaying a rising trend.
Financial Performance
Financial Services
Details the growing proportion of marketing budgets in company finances over time, attributing the increase to digital marketing investments. Suitable for financial analysis and planning, particularly in assessing the impact of marketing on overall budgets.
financial, marketing, budgets, trends, digital, analysis, growth, investment
false
Marketing budgets as a percent of overall company budgets rise to all time CMO Survey highThe CMO Survey Marketing in a Post Covid Era
Mixed Chart
Deloitte
View slide
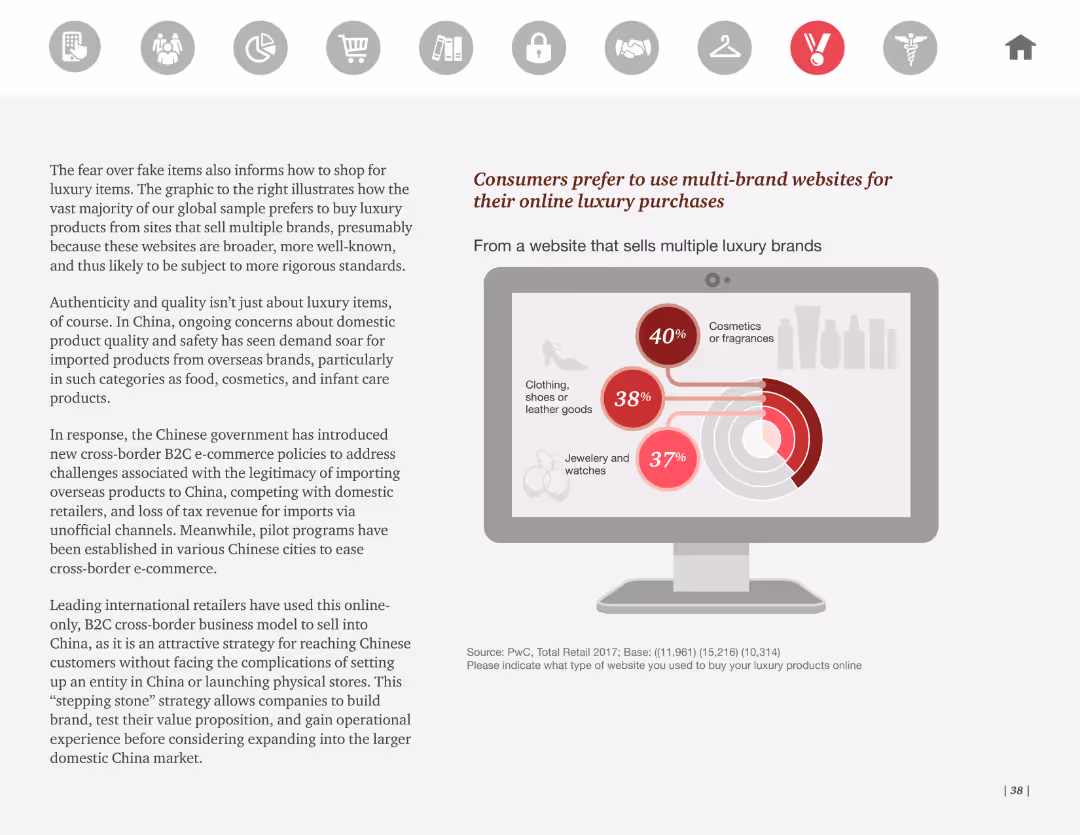
This slide includes a pie chart illustrating consumer preferences for buying luxury items from multi-brand websites. It features a prominent graphic of a laptop screen showing the product categories.
Market Analysis and Trends
Retail & E-commerce
The slide reveals that consumers prefer multi-brand websites for luxury purchases due to broader product ranges and perceived reliability. It discusses the Chinese market's growing demand for imported luxury goods and related B2C e-commerce policies.
Luxury goods, multi-brand websites, online shopping, consumer preferences, e-commerce
false
Consumers prefer to use multi-brand websites for their online luxury purchases10 retailer investments for an uncertain future
Mixed Chart
PwC/Strategy&
View slide
Dense layout with column chart and icons detailing corporate sustainability efforts and partnerships across the SEA region.
Strategic Planning
Government & Public Sector
Outlines the roles of businesses in SEA in advancing sustainability, including commitments, partnerships, and innovations.
SEA, sustainability, business leadership, corporate initiatives
false
Businesses in the region are leading the chargeSoutheast Asia’s Green Economy 2021 Report: Opportunities on the Road to Net Zero
Mixed Chart
Bain
View slide
The slide includes a title and a column chart listing the top attributes deemed essential for corporate affairs functions. It features text explaining the importance of trust, good judgment, and resilience, using a professional layout with white and yellow colors.
Organizational Structure and Change
Professional Services
This slide details the critical attributes identified by corporate affairs directors as essential for their functions, including trust, good judgment, and resilience. It explains the significance of these attributes in managing corporate affairs effectively.
corporate affairs, critical attributes, trust, good judgment, resilience, organizational success, leadership
false
1.4 What are the critical attributes of a Corporate Affairs Function?Tested, Trusted, Transformed An exploration of the Corporate Affairs Function and its Leaders
Mixed Chart
Deloitte
View slide
Detailed diagrams and calculations explaining the methodology to estimate economic impact of COVID-19 by combining sectoral data with expected duration of crisis measures.
Strategic Planning
Financial Services
Explores the methodology to estimate economic impacts of COVID-19, combining industry-specific data with projected lengths of lockdowns and restrictions.
COVID-19, economic impact, sectoral analysis, lockdown duration, crisis measures, economic methodology
false
Methodology | To determine economic impact, must derive depth (from economic starting point) and factor-in length of crisisCOVID-19 BCG Perspectives Publication #5 with a focus on Revamping Organizations for the New Reality
Multiple Chart
BCG
View slide
A pie chart shows 2020 revenue by customer, detailing the percentage of revenue from various automotive manufacturers. It is accompanied by text explaining customer diversity. Color-coding is used to distinguish different customers.
Customer and Market Segmentation
Industrial & Manufacturing
The slide presents the diversified customer base of TI Fluid Systems in 2020, emphasizing the strategic advantage of not relying excessively on any single customer, which helps in maintaining revenue consistency.
automotive, customer diversity, revenue, 2020, pie chart
false
Highly Diversified Customer BaseTI Fluid Systems Investor Presentation
Mixed Chart
Deutsche Bank
View slide
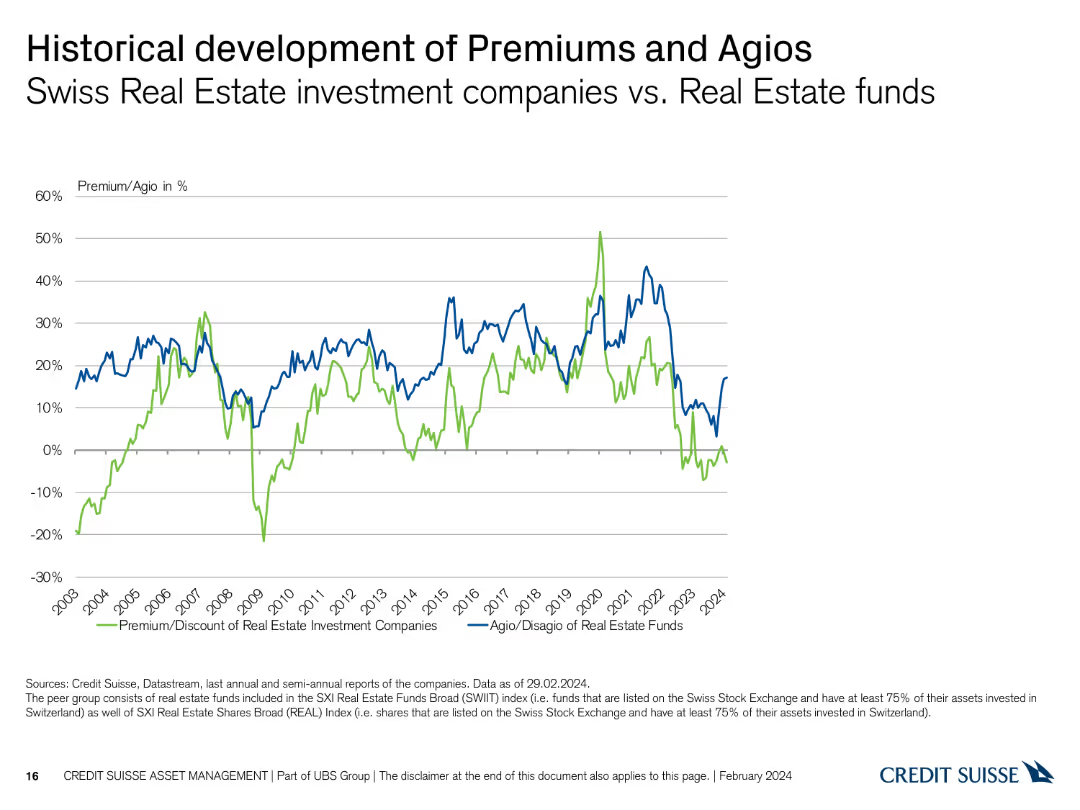
This slide features a line chart depicting the historical development of premiums and agios for Swiss Real Estate investment companies versus Real Estate funds.
Market Analysis and Trends
Real Estate & Construction
It compares historical premium and agio rates, providing insights into market trends and performance over time in the Real Estate sector.
historical trends, premiums, agios, Real Estate, investment companies, funds
false
Historical development of Premiums and Agios Swiss Real Estate investment companies vs. Real Estate fundsSwiss Real Estate Funds At a glance
Single Chart
Credit Suisse
View slide
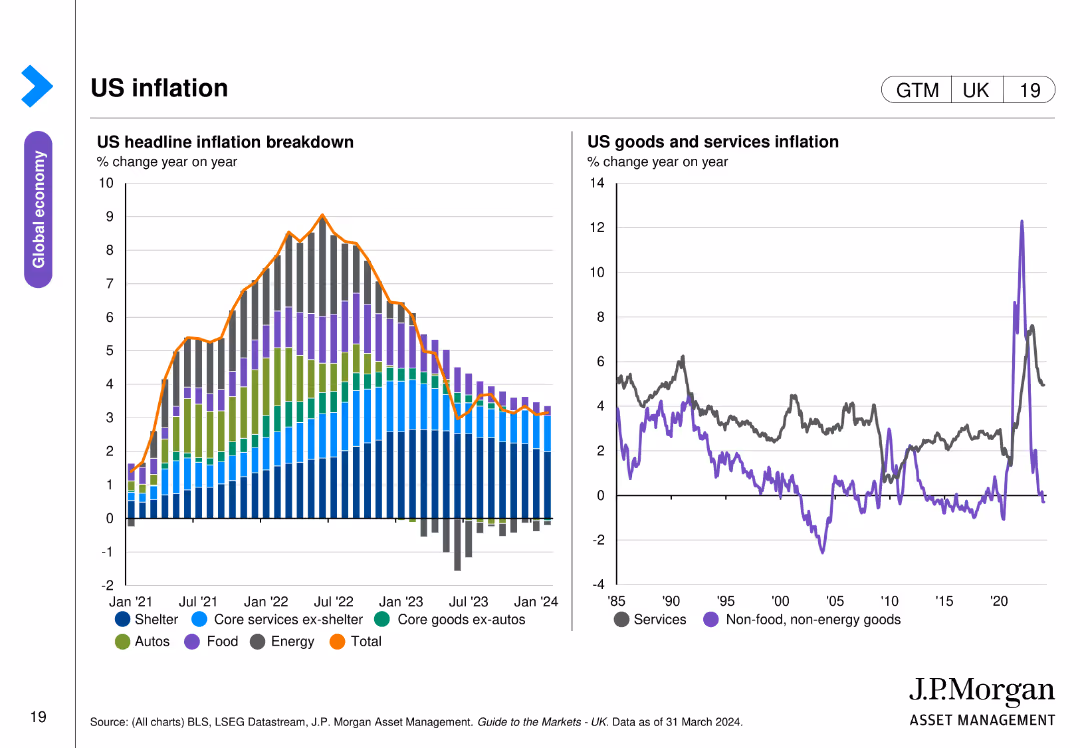
The slide features two line charts: one detailing the breakdown of US headline inflation from January 2021 to March 2024, and the other showing US goods and services inflation year on year since 1985.
Market Analysis and Trends
Financial Services
This slide provides an in-depth look at US inflation, breaking down headline inflation by components and comparing goods and services inflation trends over nearly four decades, highlighting key inflation drivers and trends.
US inflation, headline inflation, goods, services, trends
false
US headline inflation breakdownGuide to the Markets UK | Q2 2024
Multiple Chart
JP Morgan
View slide
Gartner Hype Cycle diagram for the digital workplace in 2020, showing different stages from innovation trigger to plateau of productivity.
Technology and Digital Transformation
Technology & Software
The slide presents the Gartner Hype Cycle for the digital workplace, illustrating the impact of the pandemic on accelerating digitalization. It highlights the various stages of workplace technologies and the future expectations for innovations that could enhance productivity and collaboration.
Digital Workplace, Pandemic, Hype Cycle
false
Workplaces have experienced a push to digitalization due to the pandemic Other innovations are yet to impact our working lifeMegatrend 5 - Technology & Innovation
Mixed Chart
Roland Berger
View slide
This slide shows column charts comparing the preferred sales channels for car purchases (in-person, by phone, online) before and during COVID-19 in the US, Europe, and Asia.
Market Analysis and Trends
Transportation & Logistics
Analyzes trends in consumer preferences for car purchase channels, highlighting the shift towards digital platforms during the pandemic.
sales channels, digital transformation, car purchases, column chart, regional trends
false
Across markets, at least a third of consumers prefers digital sales channels – trend stable across marketsCOVID-19 Auto & Mobility Consumer Insights
Multiple Chart
McKinsey
View slide
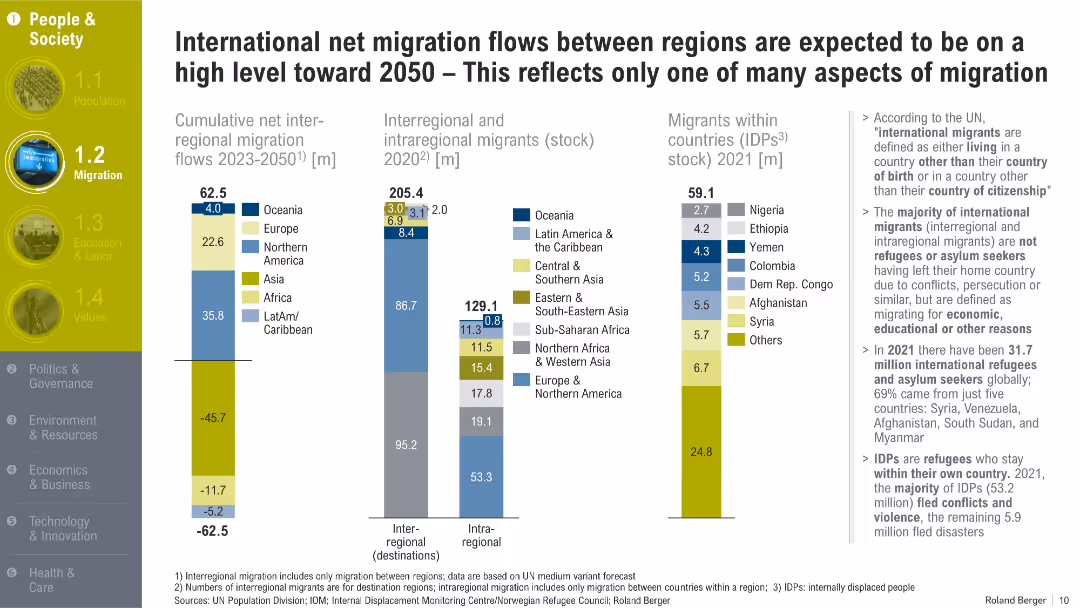
Multi-column bar charts with migration metrics, segmented by regions, accompanied by annotations and definitions on the right. Yellow-highlighted section headers and icons on the left.
Market Analysis and Trends
Government & Public Sector
The slide outlines migration trends through 2050, emphasizing regional flows, migrant stocks, and internally displaced persons. It distinguishes between types of migration and explains the driving forces like economic opportunity and conflict.
migration, international migrants, IDPs, regional flows, demographic shifts, refugees, asylum seekers, displacement, migration forecasts
false
International net migration flows between regions are expected to be on a high level toward 2050 – This reflects only one of many aspects of migrationTrend Compendium 2050 Six megatrends that will shape the world
Multiple Chart
Roland Berger
View slide
The slide is segmented into two main sections with column charts and a checklist. The upper section discusses the year-to-date issuance strategy, while the lower section compares debt and preferred stock issuances against maturities in a multi-bar chart.
Investment Analysis
Financial Services
This slide provides a strategic review of the year-to-date issuance performance, detailing benchmark and non-benchmark issuances, and planned maturities. Suitable for financial strategy meetings to assess and plan for capital market activities and investor relations.
Issuance Strategy, Capital Markets, Debt Management, Stock Issuance, Maturities
false
Issuance Strategy and PlanFixed Income Investor Presentation
Mixed Chart
Goldman Sachs
View slide
The slide contains a line chart showing DEX to CEX spot trade volume (%) and a column chart showing DEX volume in billions. It has a clear blue and white color scheme with icons representing key points on the right side, which include self-custody of funds, lower barrier for issuers, regulations, and investor access.
Market Analysis and Trends
Financial Services
The slide discusses the growing market share of DEXs compared to CEXs, highlighting benefits like self-custody of funds, lower entry barriers for issuers, less stringent regulations, and increased investor access, supported by trade volume data.
DEX, CEX, market share, self-custody, regulations, investor access, trade volume
false
DEXs are gaining more market share compared to CEXs due to a.o. self-custody, easier entry for issuers, fewer regulatory obligations, and additional investor accessTowards the unified secondary market: The evolution of distribution channels and evaluation of Asset Tokenization Benefits
Mixed Chart
EY
View slide
Features a bar chart detailing major and very major barriers to productivity, with market competition and legacy technology at the top.
Market Analysis and Trends
Professional Services
This slide identifies significant external and internal challenges to productivity enhancements in companies.
barriers, productivity, technology, market competition, challenges
false
Market competition and legacy technology are the most likely to be considered major or very major barriers to increasing productivity according to respondents.Private company outlook: Productivity
Single Chart
Deloitte
View slide
Utilizes bar charts to display projected vaccine production capacities by various manufacturers, highlighting planned figures for end-2020 and end-2021.
Regulatory and Compliance
Healthcare & Pharmaceuticals
Evaluates the global vaccine production capabilities and strategies, with emphasis on scaling up to meet anticipated demand.
vaccine, manufacturing, scale-up, capacity
false
Manufacturing set-up & scale-up | Developers rapidly augmenting capacity; several governments putting mechanisms for early accessVaccines & Therapeutics Outlook Part I: Timelines and Success Factors
Mixed Chart
BCG
View slide
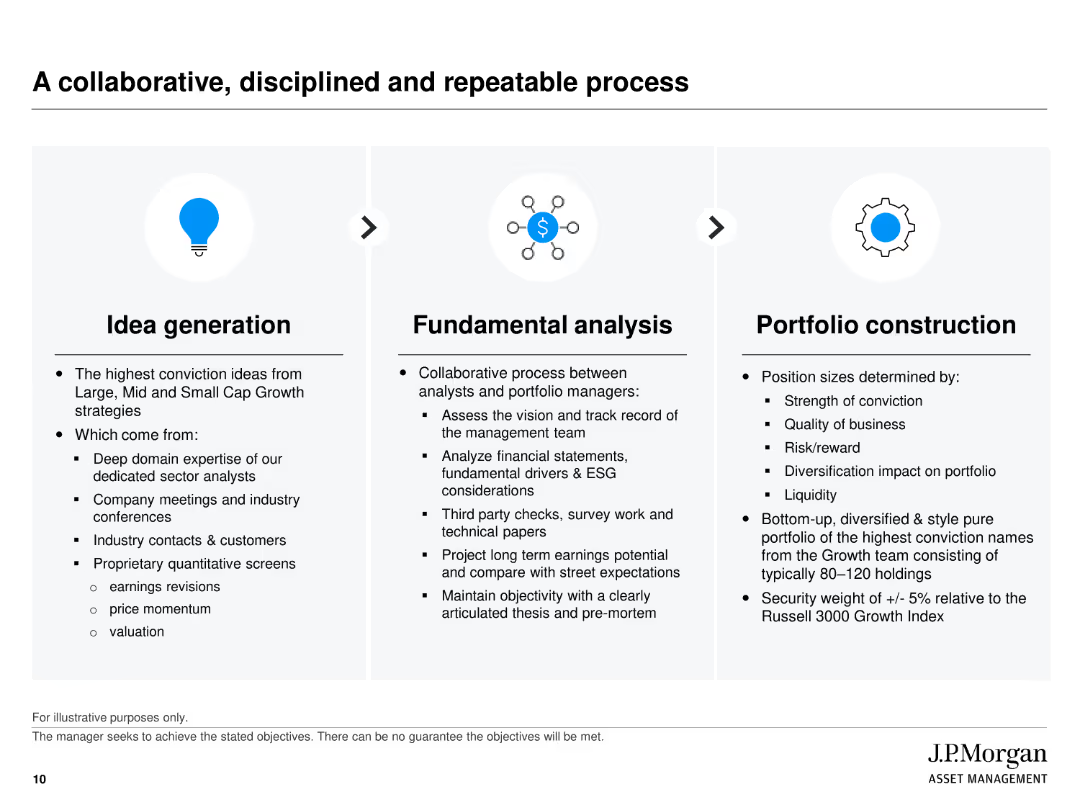
Three-column layout: Idea Generation, Fundamental Analysis, and Portfolio Construction, each described with icons and text explaining the processes.
Operational Efficiency
Financial Services
Describes the structured process used by J.P. Morgan for managing growth portfolios, from generating investment ideas to fundamental analysis and constructing the portfolio.
process, collaboration, portfolio construction, idea generation, fundamental analysis
false
A collaborative, disciplined and repeatable processJ.P. Morgan Growth Advantage Strategy
Pillar
JP Morgan
View slide
Circular diagram illustrating the vicious cycle of discrimination and bias aggravated by AI, with sections on world, data, design, and use.
Technology and Digital Transformation
Technology & Software
The slide addresses the issue of discriminatory bias in AI systems, emphasizing the need for efforts to prevent such biases from being embedded. It outlines the cycle of bias, from real-world patterns of inequality to biased AI design and deployment practices, highlighting the challenges and potential solutions for creating fairer AI systems.
AI Bias, Discrimination, Inequality, Fair AI
false
AI's future journey is rooted in the computation of human perceptions Efforts are needed to counteract embedding discriminatory bias into systemsMegatrend 5 - Technology & Innovation
Linear Flow
Roland Berger
View slide
Three large interconnected circles with statistics and an ASEAN logo in the center against a bold red background.
Market Analysis and Trends
Financial Services
This slide projects ASEAN's economic growth, demographic details, and future outlook, with a focus on the young working population and literacy rates. It's suitable for illustrating ASEAN's potential as a growing economic power and discussing investment opportunities.
ASEAN, economic growth, demographics, young population, literacy, investment opportunities, outlook, economic power
false
ASEAN, with significant demographic bonus, is on track to become the 4th largest economy by 2030ASEAN Growth and Scale Talent Playbook
Boxed
Kearney
View slide
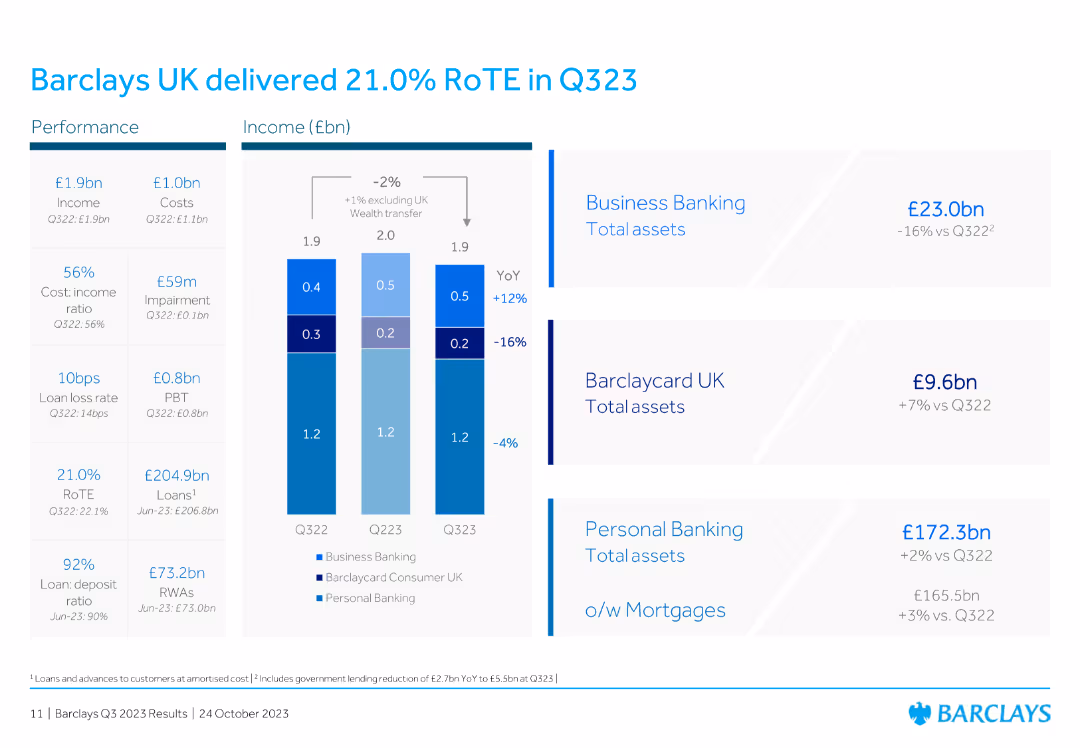
The slide features a column chart showing income (£bn) and financial performance metrics for Barclays UK from Q322 to Q323. It includes performance indicators for business banking, Barclaycard UK, and personal banking.
Financial Performance
Financial Services
The slide highlights Barclays UK's financial performance for Q323, reporting a RoTE of 21.0%. It includes metrics for income, costs, impairment, and performance indicators for business banking, Barclaycard UK, and personal banking.
RoTE, Q323, Barclays UK, performance, metrics
false
Barclays UK delivered 21.0% RoTE in Q323Barclays PLC Q3 2023 Fixed Income Investor Presentation
Mixed Chart
Barclays
View slide
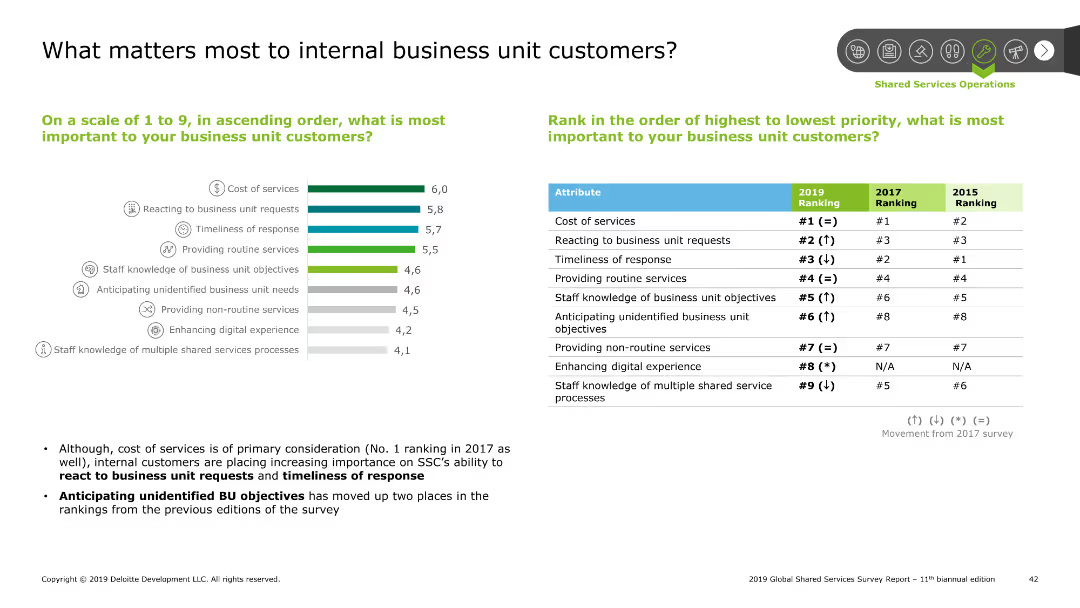
The slide features a combination of a column chart and a table. The column chart ranks importance factors for business unit customers, and the table shows rankings by year.
Customer and Market Segmentation
Professional Services
This slide identifies and ranks the factors most important to internal business unit customers, including cost of services and responsiveness, based on survey results.
Business unit customers, importance factors, ranking, survey
false
What matters most to internal business unit customers?2019 Global Shared Services Survey Report 11th biannual edition
Mixed Chart
Deloitte
View slide
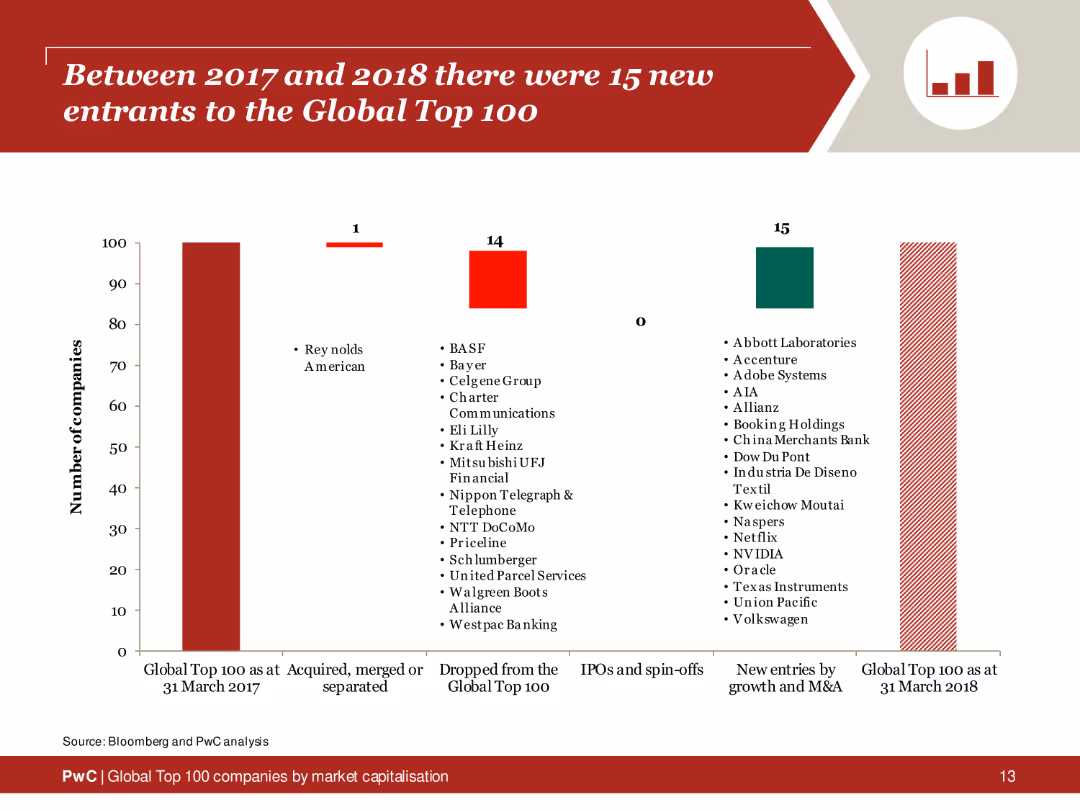
The slide includes a column chart showing the number of companies entering and exiting the Global Top 100 between 2017 and 2018, with textual analysis on the right side.
Market Analysis and Trends
Financial Services
Summary of new entries and exits in the Global Top 100 companies from 2017 to 2018, identifying companies and reasons for changes.
new entrants, global top 100, 2017, 2018, analysis
false
Between 2017 and 2018 there were 15 new entrants to the Global Top 100Global Top 100 companies by market capitalisation
Single Chart
PwC/Strategy&
View slide
Features diagrams of heat pump valve unit and car, with callouts describing parts and benefits.
Technology and Digital Transformation
Transportation & Logistics
Highlights the role of a specific heat pump technology in BEV cabin comfort, focusing on supplier monopoly and efficiency gains.
BEV, heat pump, valve unit, efficiency, supply chain
false
EV Technology: BEV Cabin Comfort Heat PumpTI Fluid Systems Investor Presentation
Diagram
Deutsche Bank
View slide
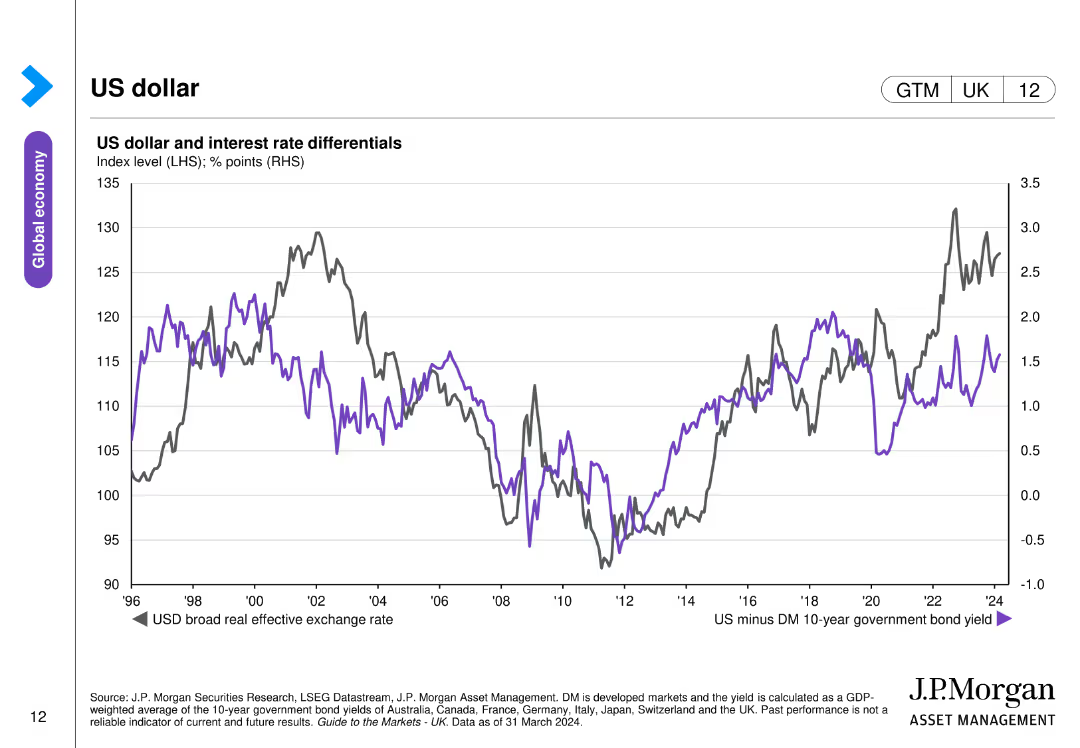
The slide contains a line chart depicting the US dollar's broad real effective exchange rate and interest rate differentials between the US and developed markets.
Investment Analysis
Financial Services
The slide analyzes the performance of the US dollar and its relationship with interest rate differentials, relevant for currency and investment strategies.
US dollar, exchange rate, interest rates, currency performance, investment
false
US dollar and interest rate differentialsGuide to the Markets UK | Q2 2024
Single Chart
JP Morgan
View slide
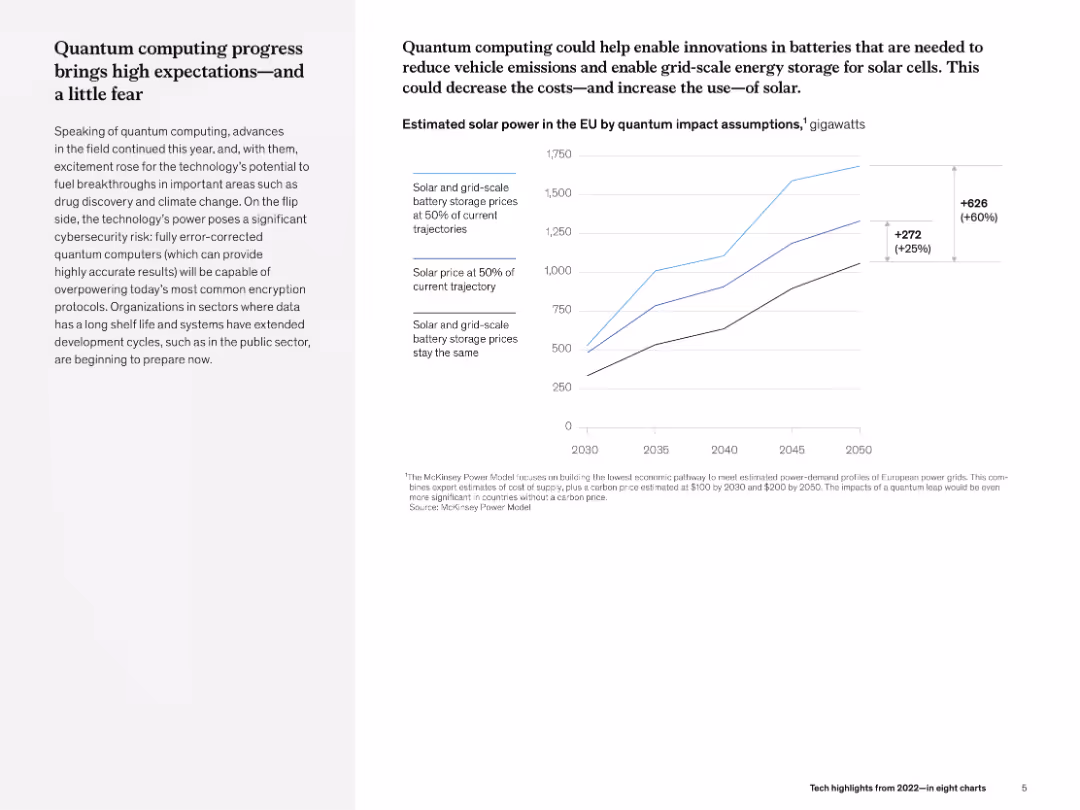
Left text column with narrative and right line chart showing future solar energy impact under quantum assumptions.
Technology and Digital Transformation
Environmental Services & Sustainability
The slide details the potential of quantum computing in energy optimization, especially in solar energy and storage. The chart projects power capacity under different assumptions, showing a 60% increase with quantum breakthroughs.
quantum computing, solar power, energy storage, sustainability, projections, McKinsey
false
Quantum computing progress brings high expectations—and a little fearTech highlights from 2022—in eight charts
Mixed Chart
McKinsey
View slide
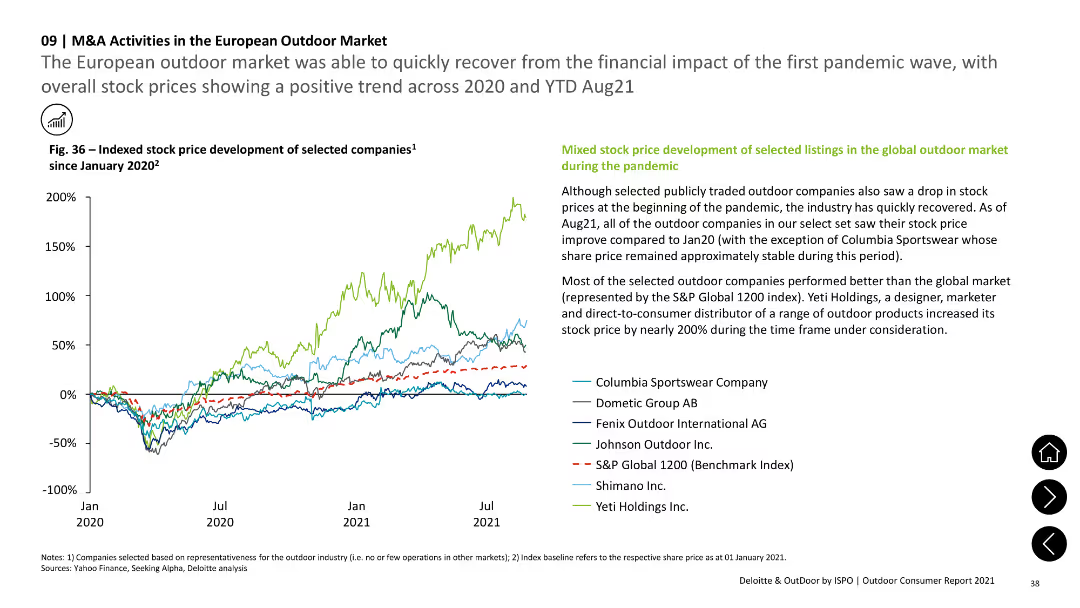
The slide includes a line chart showing indexed stock price development of selected companies from January 2020 to August 2021. Text sections provide explanations and context.
Market Analysis and Trends
Financial Services
The slide highlights the recovery of the European outdoor market from the pandemic, with a line chart showing positive trends in stock prices for selected companies, reflecting investor confidence and market recovery.
stock price, financial trends, market recovery, European market, pandemic impact
false
The European outdoor market was able to quickly recover from the financial impact of the first pandemic wave, with overall stock prices showing a positive trend across 2020 and YTD Aug21Outdoor Consumer Report 2021 Deloitte & OutDoor by ISPO
Mixed Chart
Deloitte
View slide
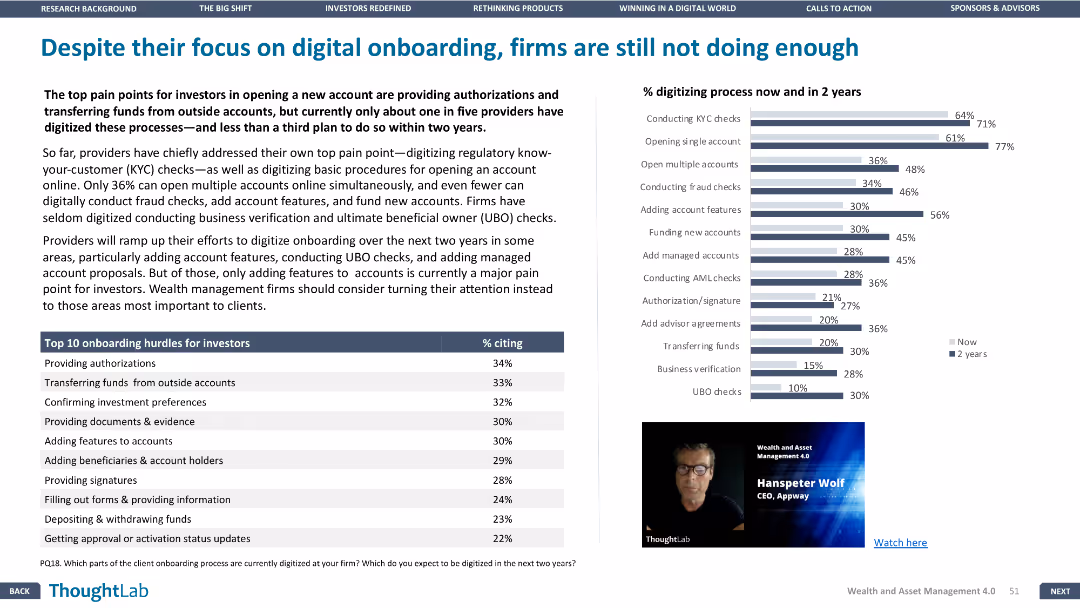
This slide features a column chart and a table. The layout is dense, with detailed data on the digitization of onboarding processes and the top onboarding hurdles for investors.
Technology and Digital Transformation
Financial Services
The slide points out that firms, despite investing in digital onboarding, are falling short in certain areas, with a focus on the percentage of firms digitizing various processes now and in two years.
Digital onboarding, digitization, investor hurdles, KYC, AML
false
Despite their focus on digital onboarding, firms are still not doing enoughWealth and asset management 4.0
Mixed Chart
Deloitte
View slide
Slide contains multiple structured lists categorizing various services like Diligence, Performance Improvement, Exit Support. Clear headings and subheadings organize the services within each category.
Investment Analysis
Professional Services
This slide presents Alvarez & Marsal's diverse service offerings across the investment lifecycle, categorized into stages such as Diligence, Performance Improvement, and Exit Support, detailing specific services under each category.
Investment, Lifecycle, Diligence, Performance, Exit
false
A&M Service Offering Across The Investment LifecycleIntroduction to A&M Services in Asia
Table
Alvarez & Marsal
View slide
Two pie charts showing the percentage of people using VPNs to access crypto trading platforms, divided into 'Outside of Canada' and 'Inside of Canada' for 2023 and 2022.
Regulatory and Compliance
Financial Services
This slide analyzes the use of VPNs by individuals accessing crypto trading platforms inside and outside Canada, comparing 2023 data to 2022.
VPN, crypto, trading, Canada, 2023, 2022, comparison
false
VPN Used to Access Crypto Trading Platforms Consistent with 2022, the vast majority of those who obtained assets through a centralized crypto trading platform reported theydid not use a VPN to access these platforms,CRYPTO ASSET SURVEY 2023
Multiple Chart
IPSOS
View slide
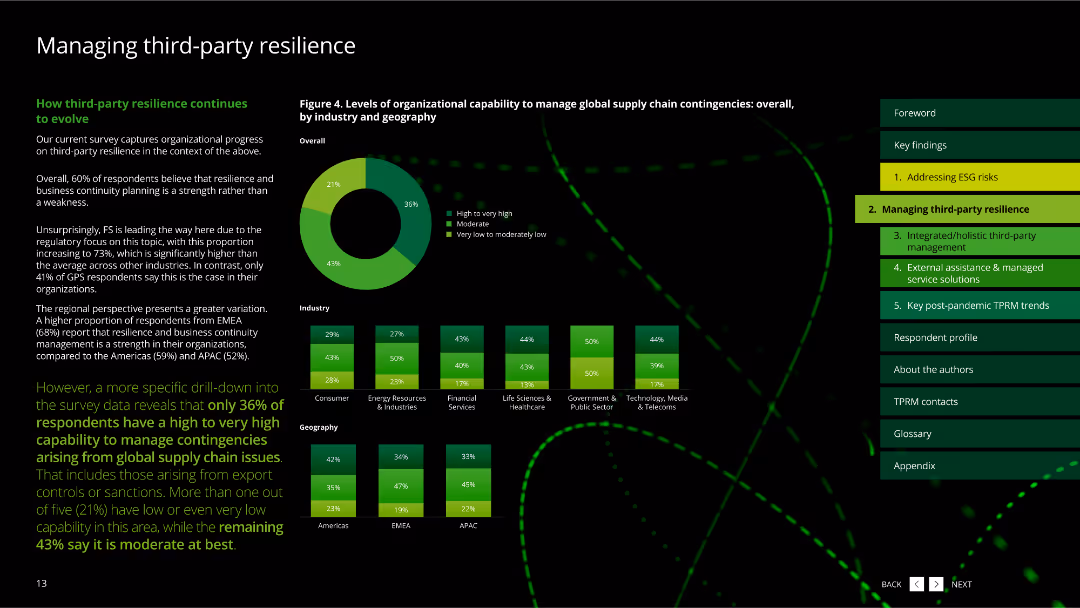
The slide features column charts about mechanisms for enhancing third-party resilience assurance.
Risk Assessment and Management
Technology & Software
This slide describes mechanisms that can enhance third-party resilience assurance, based on survey data.
third-party, resilience, assurance, mechanisms, survey
false
How third-party resilience continues to evolveGlobal third-party risk management survey 2022
Multiple Chart
Deloitte
View slide
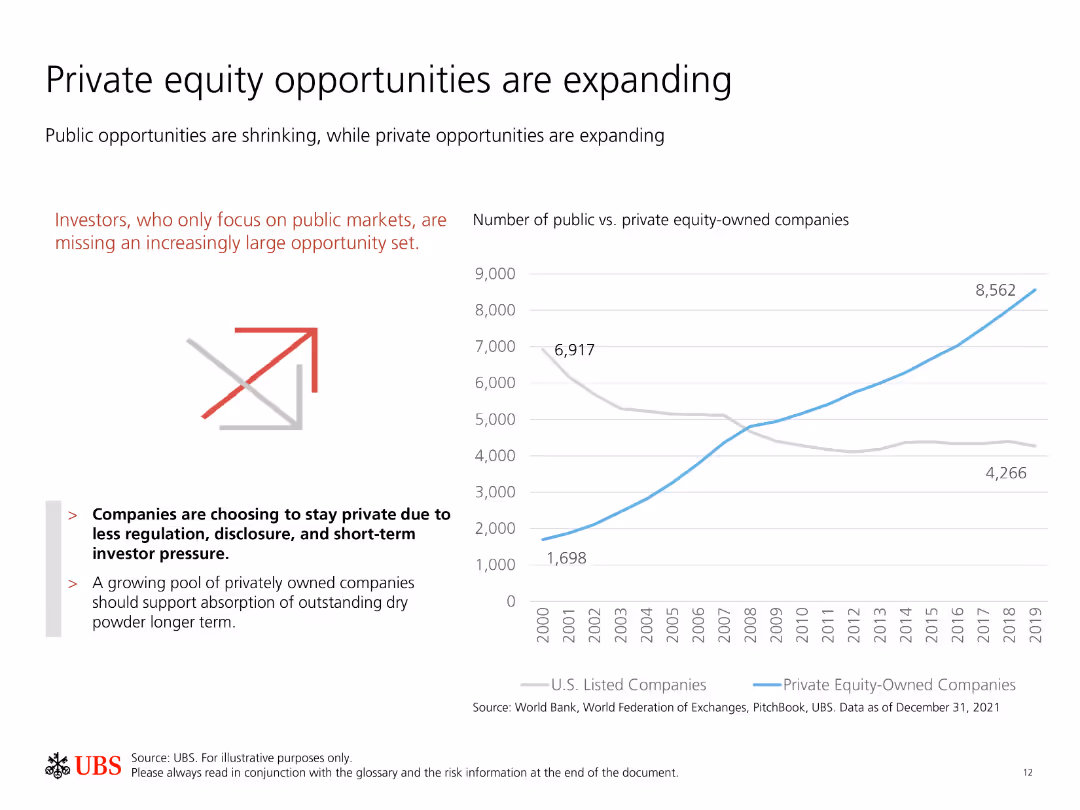
Contains a line chart comparing the number of public vs. private equity-owned companies over time, with explanatory text on the left.
Investment Analysis
Financial Services
Shows the increasing opportunities in private equity compared to public markets, highlighting a trend of companies staying private longer for various advantages.
Private equity, public markets, investment opportunities, growth, trends
false
Private equity opportunities are expandingPrivate markets asset allocation guide
Mixed Chart
UBS
View slide
This slide features a dark background with a blue and yellow pie chart on the right and a vertical bar graph on the left. Both visual elements are clear and distinct, with text annotations providing context to the data presented.
Customer and Market Segmentation
Retail & E-commerce
The slide presents data on consumer purchasing driven by ethical concerns, projected for 2026, which is crucial for discussions on ethical practices and consumer trends within various industries.
Ethical Purchasing, Consumer Trends, 2026 Forecast, Industry Analysis, Ethical Practices
false
64% of respondents believe more purchases will be driven by ethical concerns in 2026 vs. todayConsumers at 250
Multiple Chart
Kearney
View slide
Structured layout with three sections, bulleted lists of digital innovations, and images of diverse working settings.
Technology and Digital Transformation
Professional Services
Data on digital innovation adoption for workplace flexibility, wellbeing, and collaboration, emphasizing hybrid technologies and health certifications.
Hybrid Work, Wellbeing, Digital Innovation, Collaboration
false
Technology priorities are targeted to flexibility, wellbeing and collaboration.Future Workplace Index 2.0
Header Horizontal
EY
View slide
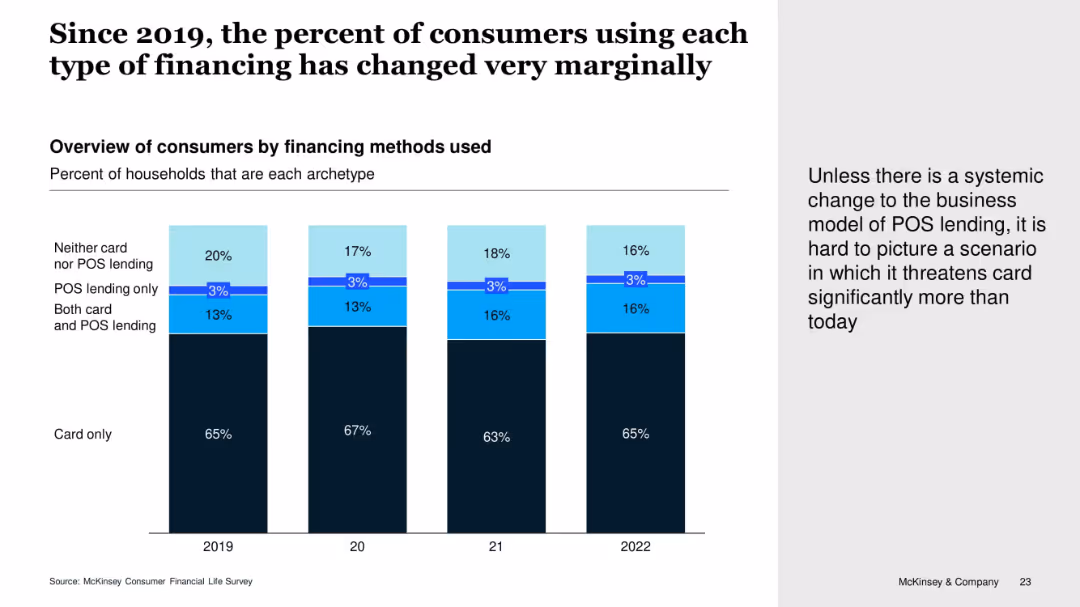
Vertical stacked bar chart showing consumer financing preferences by year (2019–2022), segmented by card use and POS lending combinations. Includes callout text on the right.
Customer and Market Segmentation
Financial Services
The slide shows little change over time in the types of consumer financing used. The majority continue to rely solely on cards, while POS lending adoption remains minimal. The narrative suggests POS lending isn't significantly threatening card use without a structural change.
POS Lending, Credit Cards, Consumer Behavior, Lending Trends, McKinsey Survey
false
Since 2019, the percent of consumers using each type of financing has changed very marginallyUS Credit Card Issuer Performance, 1Q 2023
Mixed Chart
McKinsey
View slide
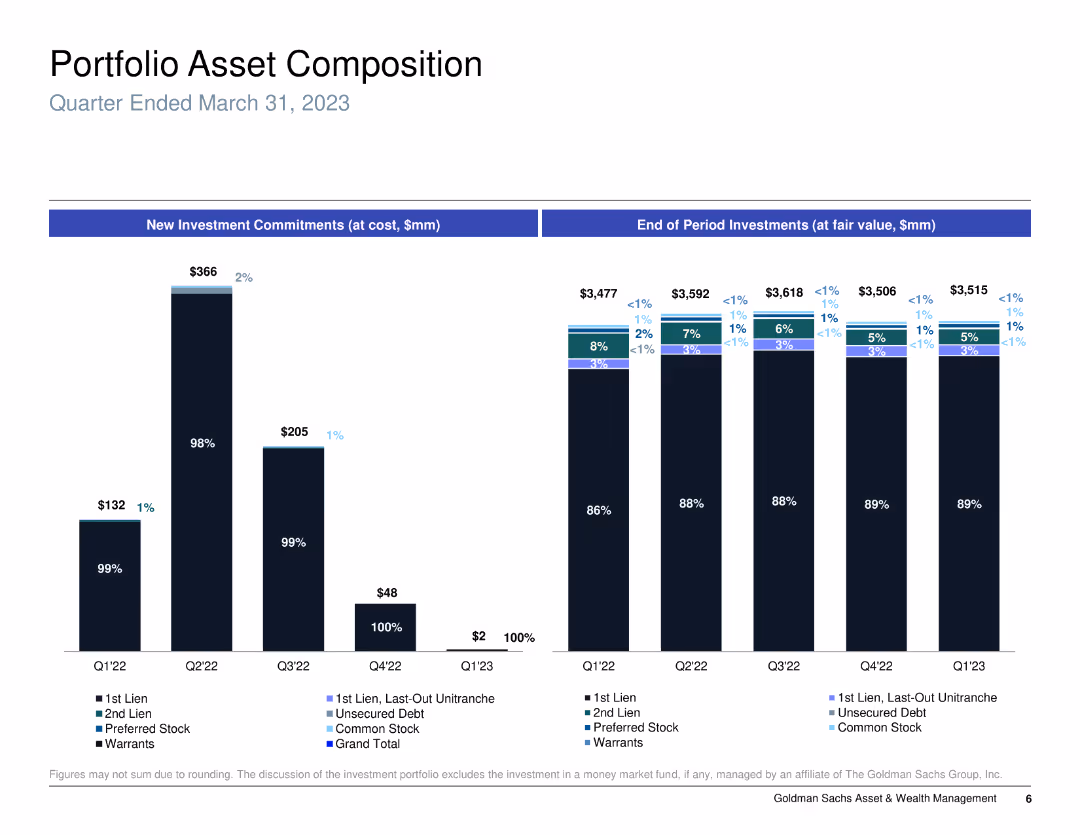
Column chart showing new investment commitments and end of period investments, categorized by type of asset.
Investment Analysis
Financial Services
Analyzes the portfolio asset composition for a specific period, detailing types of investments and their changes over time.
portfolio, assets, investment, commitments
false
Portfolio Asset Composition Quarter Ended March 31, 2023Goldman Sachs BDC, Inc. Investor Presentation
Multiple Chart
Goldman Sachs
View slide
Column chart slide with three campaigns showing increases in impressions and corresponding revenue. Each column has a different color representing before and after Nielsen SS.
Financial Performance
Media & Entertainment
Illustrates the impact of increased impressions on revenue, showing significant growth across three campaigns with Nielsen Streaming Signals.
impressions, revenue, campaigns, Nielsen, growth, streaming signals
false
Increasing impressions mean big upsideSpring 2022 National Client Meeting
Single Chart
Nielsen
View slide
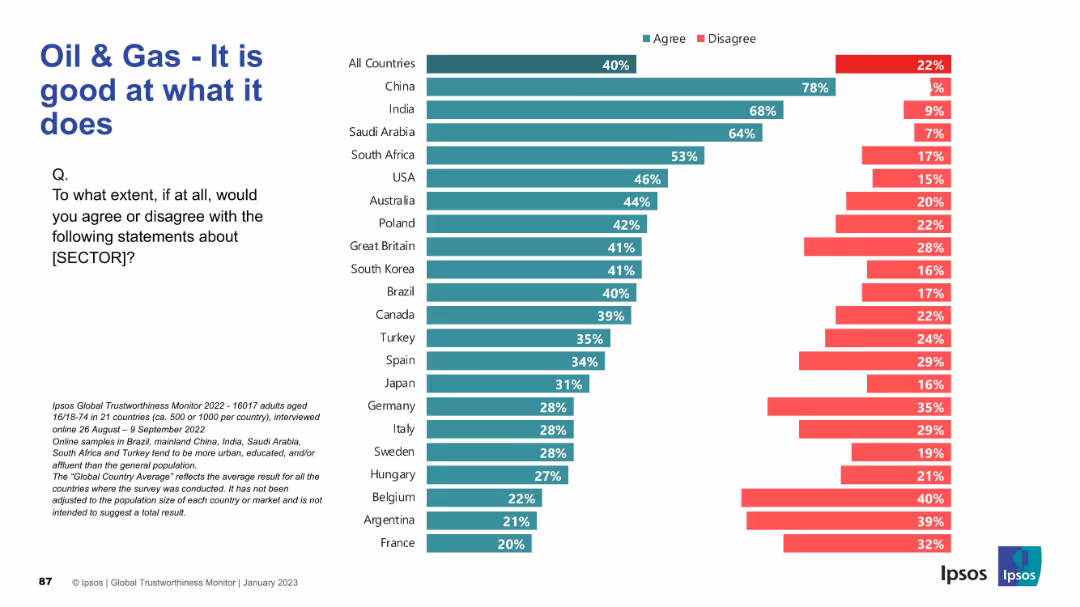
Horizontal bar chart for multiple countries with title and question on left. Sector changed to "Oil & Gas"; maintains same color-coded structure.
Market Analysis and Trends
Energy & Utilities
This slide evaluates how competent people think the oil and gas sector is at its core functions. China, India, and Saudi Arabia again show highest agreement, while European countries like France and Belgium are the most skeptical. This differs slightly from pharmaceutical sentiment.
oil & gas, performance, sector perception, Ipsos, energy industry, global opinion, agreement levels, international comparison, competence
false
Oil & Gas – It is good at what it doesIPSOS GLOBAL TRUSTWORTHINESS MONITOR January 2023
Mixed Chart
IPSOS
View slide
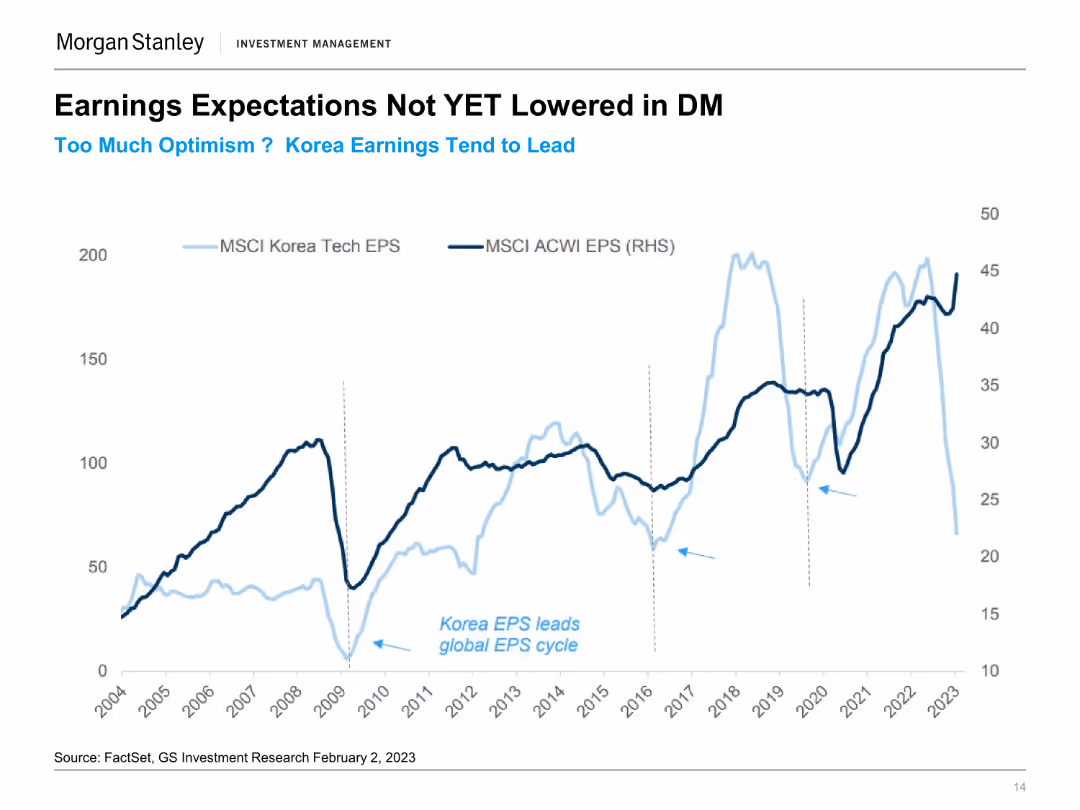
The slide features a line chart comparing MSCI Korea Tech EPS and MSCI ACWI EPS from 2004 to 2023. Two lines represent the earnings per share for each index over time.
Financial Performance
Financial Services
This slide discusses the earnings expectations in developed markets, highlighting Korea's earnings trends compared to global averages and noting optimism in projections.
Earnings Expectations, Korea EPS, MSCI, Developed Markets, Financial Performance, Market Trends, Tech Sector, EPS Comparison
false
Earnings Expectations Not YET Lowered in DMMorgan Stanley Investment Management Emerging Markets / Asia
Single Chart
Morgan Stanley
View slide
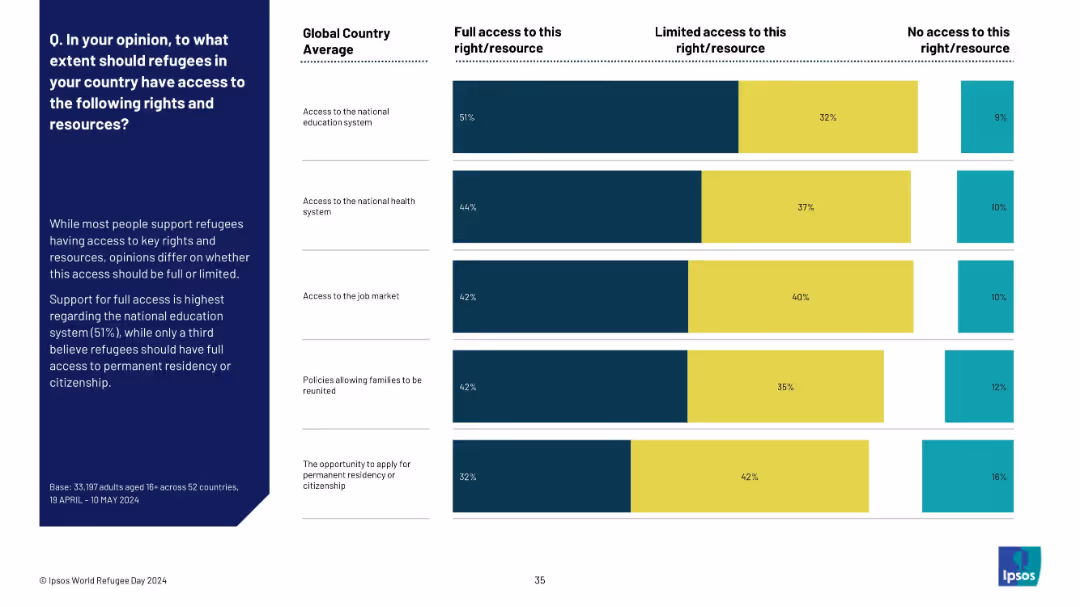
Simplified horizontal stacked bar chart summarizing access rights (education, health, jobs, etc.).
Regulatory and Compliance
Government & Public Sector
This slide shows the global average opinion on whether refugees should have full, limited, or no access to national systems like education, healthcare, jobs, and citizenship. Most support some level of access, with full access varying.
refugees, access rights, healthcare, education, job market, citizenship, public opinion, human rights, survey
false
Q. In your opinion, to what extent should refugees...WORLD REFUGEE DAY
Mixed Chart
IPSOS
View slide
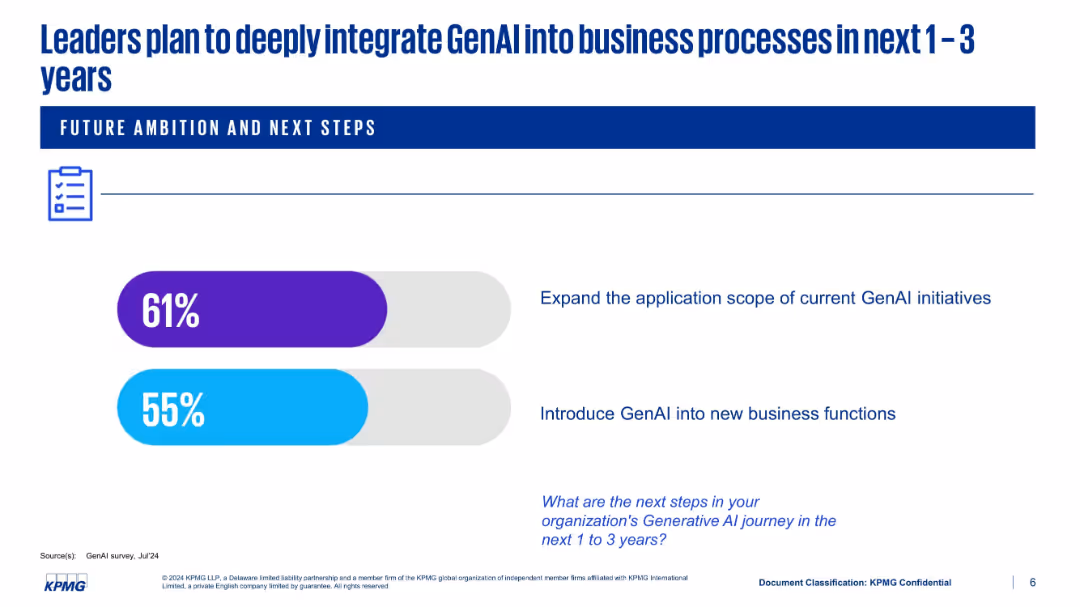
Simple layout with two horizontal progress bars showing future plans: expand scope and introduce into new functions
Strategic Planning
Artificial Intelligence
This slide outlines executive ambitions to scale GenAI integration over the next 1–3 years. 61% of leaders plan to expand current initiatives, while 55% aim to introduce GenAI to new business areas. The layout is minimalistic, focusing attention on the percentages and intended actions.
GenAI roadmap, expansion, business functions, KPMG, adoption, strategy
false
Leaders plan to deeply integrate GenAI into business processes in next 1–3 yearsGenAI Survey –2024 Key insights
Single Chart
KPMG
View slide
Assumptions in funding models for connectivity
Strategic Planning
Telecommunications
Detailed column charts with cost breakdowns and potential savings across various funding models, highlighting the assumptions made for each scenario. The design uses blue and green shades to represent different costs and savings, making it easy to differentiate.
Analyzes the impact of different funding assumptions on the potential success of school connectivity initiatives in Java, Bali, and Sumatra, emphasizing the role of governmental and community contributions.
false
P&L o total area in Java, Bali & Sumatra | Funding models can lead to school connectivity if assumptions turn out positiveIndonesia case study
Mixed Chart
BCG
View slide
Column chart showing Australian wheat production by state over years. Text on the side explains factors affecting production, such as weather and drought conditions.
Market Analysis and Trends
Agriculture & Food Production
The slide analyzes the volatility of wheat production in Australia, highlighting the impact of weather conditions and drought on annual production volumes.
wheat production, volatility, Australia, weather conditions, drought
false
Wheat is a highly volatile crop with large variations in annual production volumes, primarily driven by Australia’s weather conditionsInternational Comparison of Australia’s Freight and Supply Chain Performance
Mixed Chart
LEK
View slide
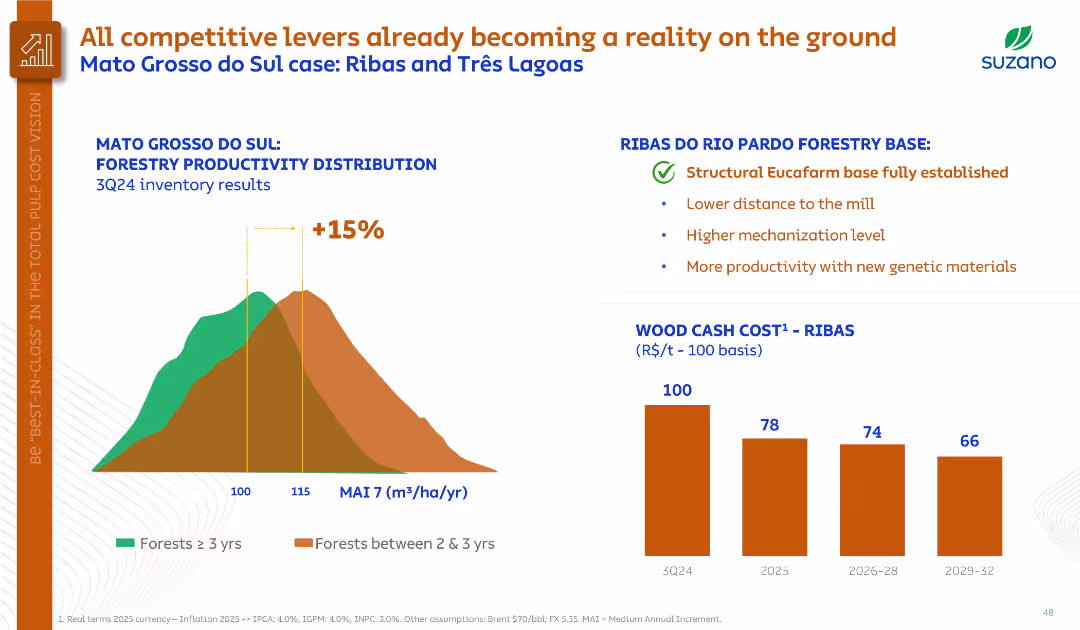
Histogram on forestry productivity, bullet points summarizing Ribas region benefits, and bar chart on wood cost.
Operational Efficiency
Agriculture & Food Production
Demonstrates forestry productivity improvements in Mato Grosso do Sul, highlighting the Ribas base’s structural advantages. Projects significant cost reduction in wood by 2029 through higher yields and mechanization.
forestry productivity, Ribas, genetic materials, cost reduction, MAI
false
All competitive levers already becoming a reality on the groundGoldman Sachs Brazil Commodities Days
Multiple Chart
Goldman Sachs
View slide
This slide shows a combination of line and column charts tracking growth and returns over the years, specifically highlighting the receivables CAGR and RoTE. It uses a blue color theme that is consistent with the corporate branding, and the charts are well-organized to depict trends clearly.
Financial Performance
Financial Services
Reviews Barclays' historical financial performance, emphasizing growth in receivables and RoTE over time. It highlights the impact of external factors like COVID-19 and shows the company's resilience and capacity for recovery.
financial growth, RoTE, receivables, historical data, COVID-19
false
Long track record of growth and returnsFY 2023 Results Announcement
Single Chart
Barclays
View slide
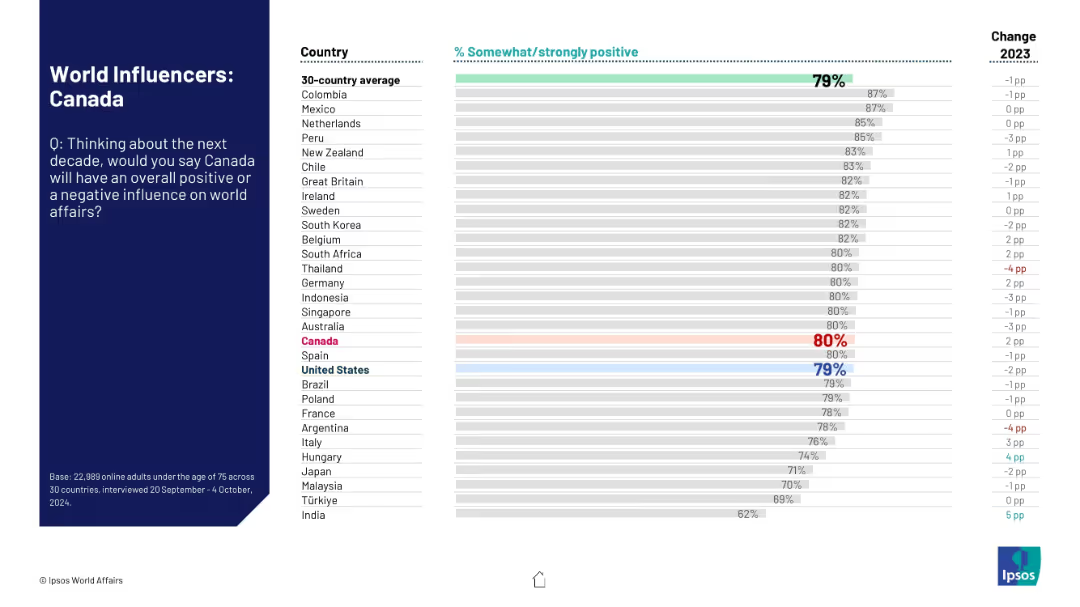
Standard Ipsos layout with ranked horizontal bars; shows 30-country perception of Canada's influence on world affairs over the next decade.
Strategic Planning
Government & Public Sector
This slide ranks global perceptions of Canada’s potential positive influence in world affairs over the next decade. Canada ranks high, with comparison to the 30-country average and change from previous year shown.
global influence, Canada, public opinion, world affairs, strategic perception, international relations, Ipsos ranking, soft power
false
World Influencers: CanadaWORLD AFFAIRS
Mixed Chart
IPSOS
View slide
The slide displays a table and a bar chart showing adjusted net revenues, operating expenses, and pre-tax income/loss for Credit Suisse divisions for 2Q23, with percentage changes quarter-on-quarter.
Financial Performance
Financial Services
The slide provides an overview of Credit Suisse's adjusted financial results for the second quarter of 2023, highlighting revenue, expenses, and pre-tax income/loss for different divisions, indicating financial health and performance.
adjusted results, Credit Suisse, 2Q23, net revenues, operating expenses
false
Credit Suisse adjusted 2Q23 results (CHF, US GAAP)Second quarter 2023 Fixed Income investor presentation
Mixed Chart
UBS
View slide
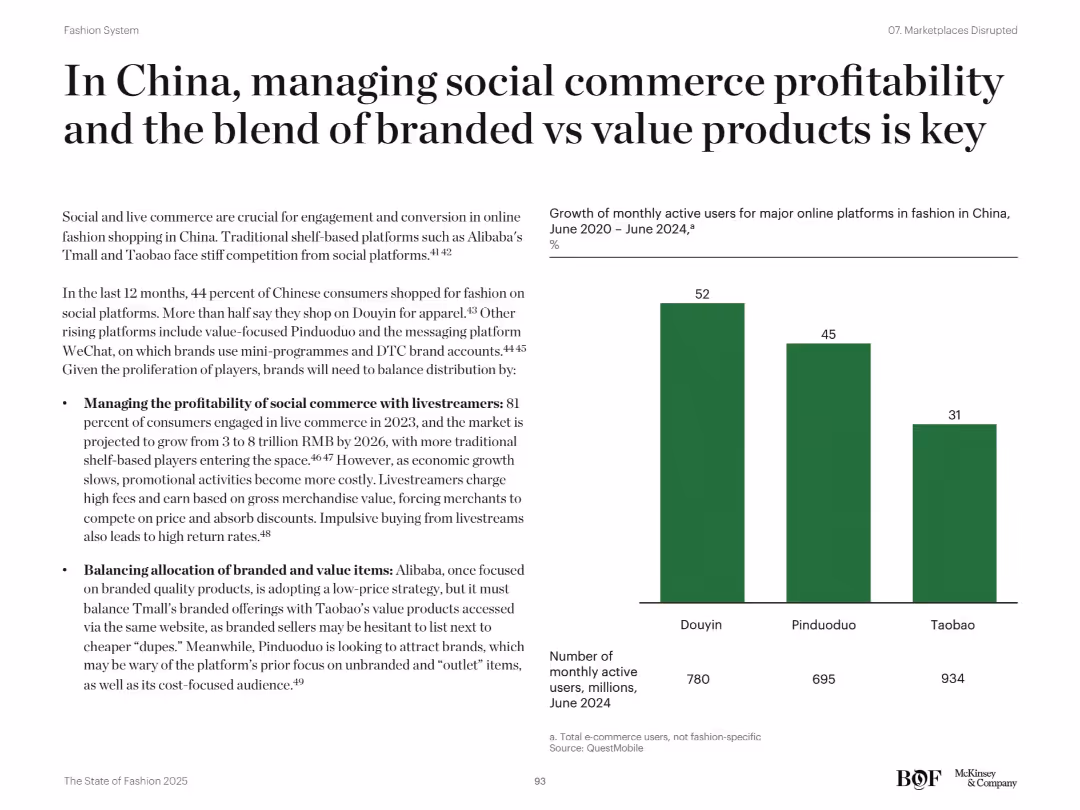
Balanced layout with left-aligned bullets and a bar chart showing MAU growth on the right; clean visual design
Market Analysis and Trends
Retail & E-commerce
The slide emphasizes the importance of social commerce and livestreaming in China’s fashion market. It discusses challenges around profitability and distribution between branded and value products. The bar chart presents monthly active user growth across Douyin, Pinduoduo, and Taobao. Strategic considerations include fee pressure from livestreamers and the shift in platform branding strategies.
China, social commerce, Douyin, livestreaming, Pinduoduo, Taobao, branded vs value, MAU
false
In China, managing social commerce profitability and the blend of branded vs value products is keyThe State of Fashion 2025
Mixed Chart
McKinsey
View slide
The slide features a dartboard chart and bar graphs representing the various actions CEOs are taking to reconfigure supply chains and source local alternatives.
Operational Efficiency
Transportation & Logistics
The slide highlights the strategies CEOs are employing to reconfigure supply chains and find local alternatives to mitigate disruptions.
supply chains, local alternatives, disruptions, reconfiguration, CEO strategies
false
CEOs are reconfiguring their supply chains and sourcing local alternatives to combat the impact of disruptionsHow will you reframe your future?
Mixed Chart
EY
View slide
The slide contains a dual-section layout with text-based principles on the left and key liquidity metrics on the right in rectangular callouts. The design is straightforward and focused on clarity of information.
Risk Assessment and Management
Financial Services
Discussing principles of liquidity management, the slide highlights the firm's strategies to maintain a robust liquidity position. Appropriate for briefings on financial risk management, illustrating conservative liquidity principles and current liquidity metrics.
Liquidity Management, Financial Risk, Principles, Metrics, Conservative Approach
false
Conservative Liquidity Risk ManagementFixed Income Investor Presentation
Header Horizontal
Goldman Sachs
View slide
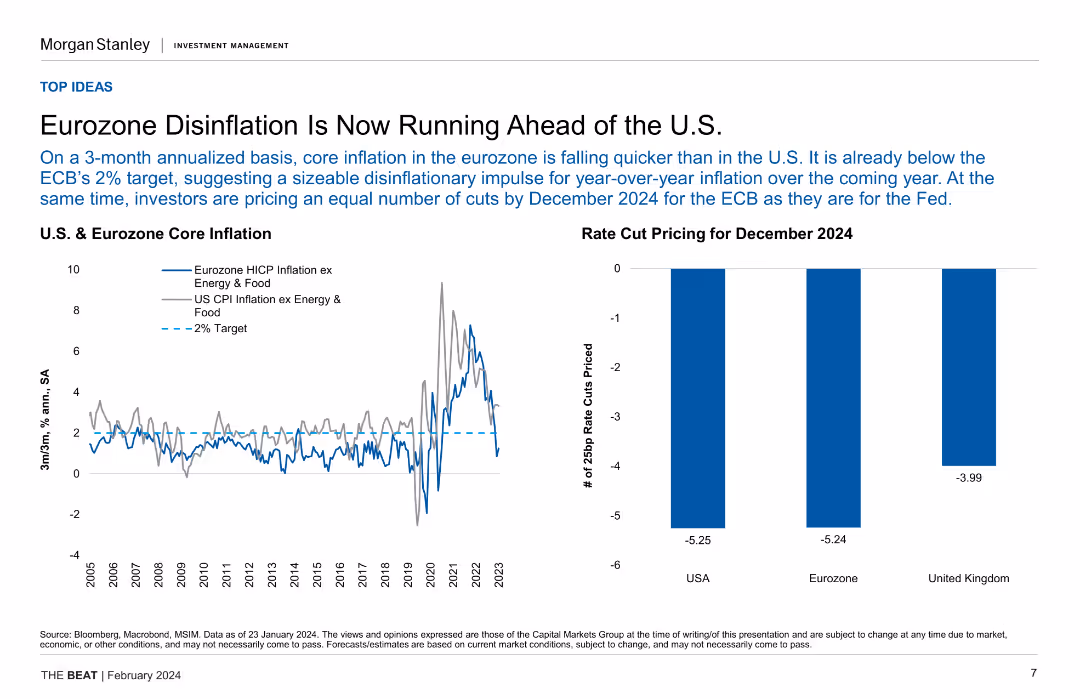
Line chart comparing U.S. and Eurozone core inflation rates, along with a column chart showing rate cut pricing for December 2024.
Market Analysis and Trends
Financial Services
The slide highlights the disinflation trend in the Eurozone compared to the U.S., projecting future rate cuts by the ECB and the Fed.
Eurozone, disinflation, core inflation, rate cut, economic trend
false
Eurozone Disinflation Is Now Running Ahead of the U.S.The BEAT February 2024
Multiple Chart
Morgan Stanley
View slide
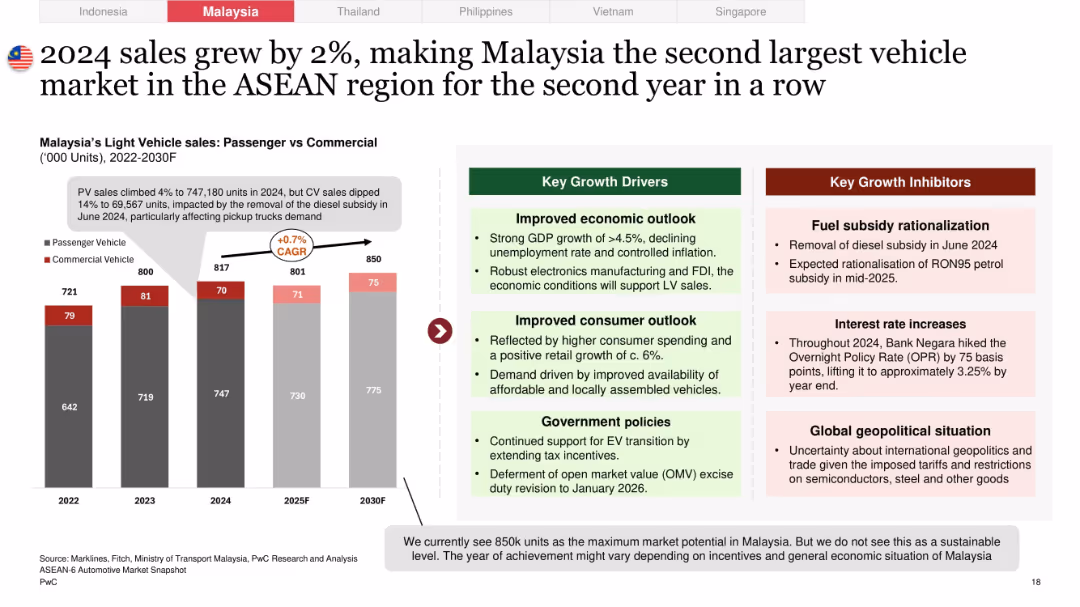
Dual-panel layout with a bar chart (2022–2030F) on the left comparing PV and CV sales, and side-by-side boxes for growth drivers/inhibitors on the right
Market Analysis and Trends
Industrial & Manufacturing
Highlights Malaysia's modest 2% growth in light vehicle sales in 2024, emphasizing strong passenger vehicle (PV) performance but a decline in commercial vehicle (CV) sales. Includes economic, policy, and consumer outlook drivers, as well as risks like fuel subsidy cuts and interest rate hikes.
Malaysia, light vehicle sales, CAGR, commercial vehicle, growth drivers, economic outlook, fuel subsidy, PV vs CV, automotive market, ASEAN
false
2024 sales grew by 2%, making Malaysia the second largest vehicle market in the ASEAN region for the second year in a rowOverview of the ASEAN-6 Automotive Market
Mixed Chart
PwC/Strategy&
View slide
The slide includes multiple charts showing bond flows, annual flows by currency, and flows by sovereign/corporate/mixed. The layout is data-heavy with several visual elements.
Market Analysis and Trends
Financial Services
The slide analyzes bond flows for 2023, highlighting investor hesitance to allocate to emerging market debt but noting a potential turning point. It includes detailed data on annual flows by currency and other metrics.
bond flows, market analysis, 2023, emerging markets, investment
false
Technical: 2023 Flows YTDEmerging Markets Debt Monitor
Multiple Chart
Morgan Stanley
View slide
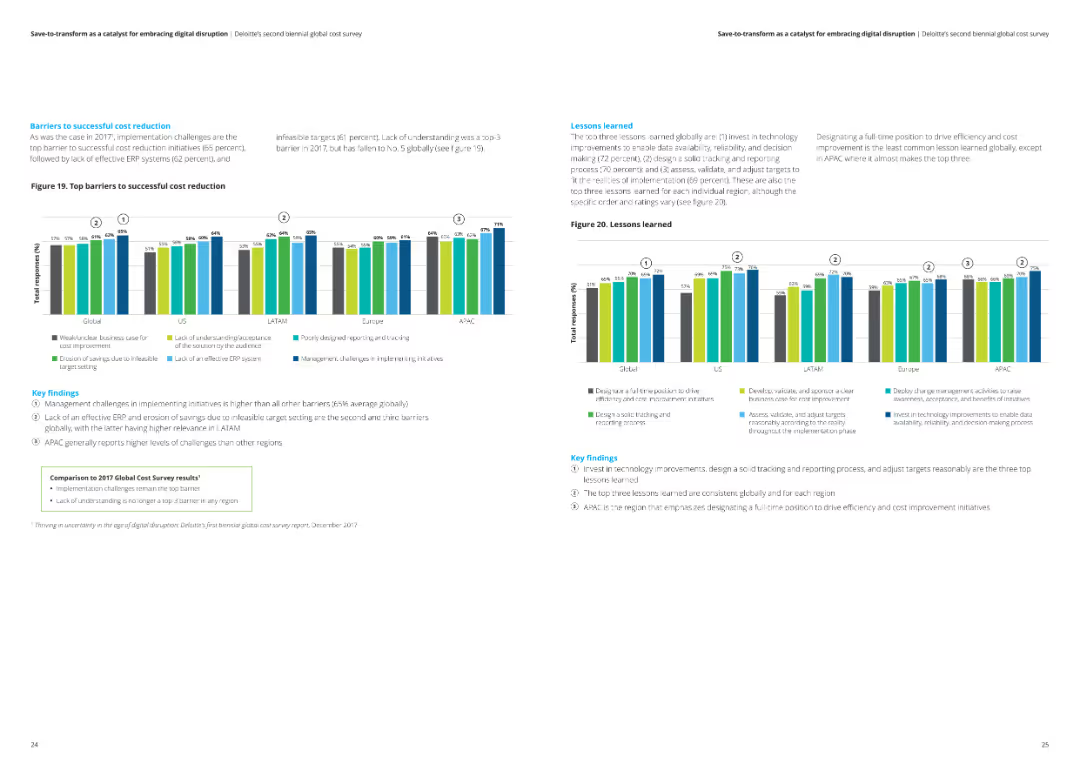
This slide includes a column chart illustrating the top barriers to successful cost reduction globally and regionally. Key findings are summarized in text boxes.
Risk Assessment and Management
Financial Services
The slide highlights the key barriers to successful cost reduction, including management challenges and ineffective ERP systems, with a comparison to the 2017 survey results.
Cost reduction, barriers, challenges, analysis, financial services
false
Barriers to successful cost reduction As was the case in 20171, implementation challenges are the top barrier to successful cost reduction initiatives (65 percent),Save-to-transform as a catalyst for embracing digital disruption Deloitte’s second biennial global cost survey
Multiple Chart
Deloitte
View slide
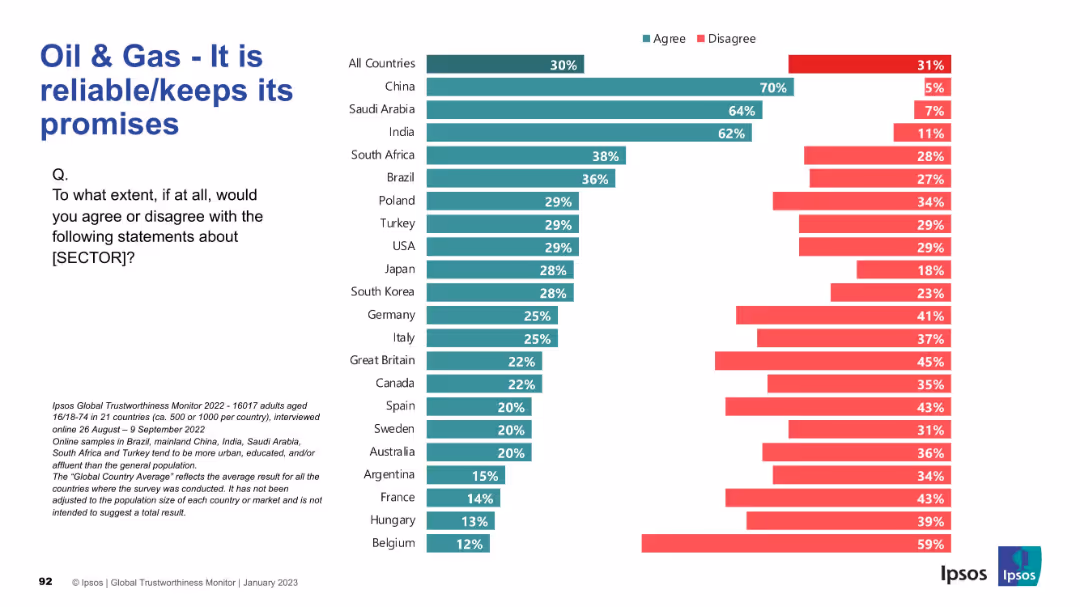
Horizontal stacked bar chart by country with left-side “agree” percentages and right-side “disagree”. Title and question placed top left.
Market Analysis and Trends
Energy & Utilities
This slide assesses the sector's reliability and its ability to keep promises. China, Saudi Arabia, and India again show high agreement. Western countries remain more critical, with low trust in promises from oil & gas companies.
Reliability, Promises, Trust, Oil & Gas Sector, Global Opinions, Ipsos Survey, Accountability, Market Perception, Country Trends
false
Oil & Gas - It is reliable/keeps its promisesIPSOS GLOBAL TRUSTWORTHINESS MONITOR January 2023
Mixed Chart
IPSOS
View slide
Features a text block on the left and a horizontal bar chart on the right comparing the deployment of blockchain in advertising strategies between those prioritizing regulatory environments and others.
Regulatory and Compliance
Financial Services
The slide discusses the adoption of blockchain technology in advertising to address regulatory environments, with a horizontal bar chart illustrating the difference in deployment rates between companies prioritizing regulation and others.
Blockchain, advertising, regulatory, deployment, comparison
false
FIGURE 2: Brands that are addressing increased regulation are adopting blockchain at significantly higher rates than their peers2023 Global Marketing Trends
Mixed Chart
Deloitte
View slide
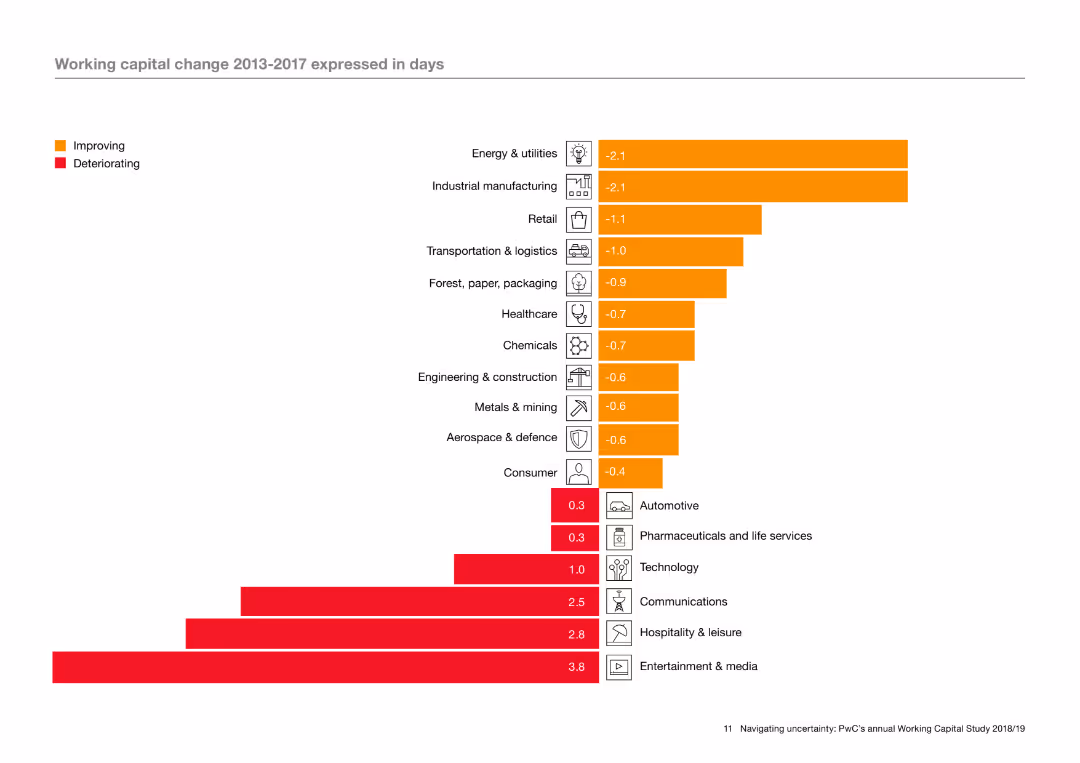
The slide features a column chart with horizontal bars indicating working capital change in various industries from 2013 to 2017. The bars are color-coded to show improving and deteriorating metrics. Icons representing different industries are aligned on the left of the chart.
Operational Efficiency
Industrial & Manufacturing
The slide analyzes working capital changes across different industries over a five-year period, using a column chart to illustrate which industries have seen improvements or deteriorations. The analysis highlights trends in operational efficiency within these sectors.
Working capital, operational efficiency, industry trends, improvement, deterioration, column chart
false
Working capital change 2013-2017 expressed in daysNavigating uncertainty: PwC’s annual global Working Capital Study
Single Chart
PwC/Strategy&
View slide
Features line charts and column charts detailing investment banking fees and market share from 2017 to 2021, including global and regional data.
Market Analysis and Trends
Financial Services
This slide reviews JP Morgan's investment banking division's performance, showing record fee collection and consistent market share leadership globally and in specific regions over five years. It highlights their dominance in the Americas and strong positions in EMEA and APAC, reflecting effective market penetration and financial strategies.
investment banking, fees, market share
false
Global Investment Banking achieved record fees in 2021, and delivered market share of 9.5%Corporate & Investment Bank 2022
Multiple Chart
JP Morgan
View slide
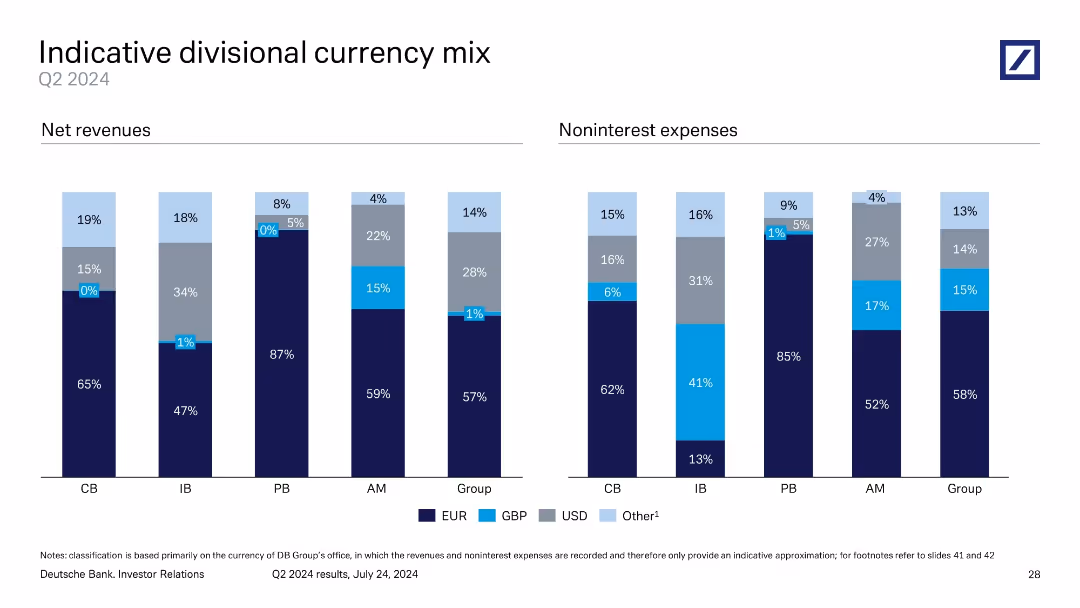
Two sets of grouped vertical bar charts showing net revenues and noninterest expenses across business divisions, broken down by currency (EUR, GBP, USD, Other).
Risk Assessment and Management
Financial Services
Illustrates the currency mix of revenues and expenses for Deutsche Bank's divisions in Q2 2024. EUR dominates most segments, especially in Private Banking. Helps assess currency exposure and hedging needs.
currency exposure, EUR, USD, GBP, noninterest expenses, revenues
false
Indicative divisional currency mixQ2 2024 results
Single Chart
Deutsche Bank
View slide
A line chart presents EPEX spot prices for selected countries (France, Germany, DK1, NO2, SE3), showing prices over 1,000 hours per year. The graph highlights the price peaks for wind and solar in 2030.
Market Analysis and Trends
Energy & Utilities
The slide discusses the opportunistic selling of P2P electricity in the spot market, noting that prices exceed the levelized cost of energy (LCOE) less than 1% of the time.
P2P, electricity, spot market, EPEX, LCOE, prices, wind, solar, energy, storage
false
EPEX spot prices: selected countriesHydrogen applications and business models
Mixed Chart
Kearney
View slide
Line chart comparing alternative sites of care being pursued by hospitals in developed and developing markets.
Strategic Planning
Healthcare & Pharmaceuticals
This slide illustrates the alternative care sites hospitals plan to establish to improve healthcare access in the next three years.
alternative care, hospitals, healthcare, APAC, planning
false
Hospitals are looking to set up alternative sites of care such as specialist outpatient centers and ambulatory surgery centers to provide better access2019 APAC Hospital Priority Study Overview
Mixed Chart
LEK
View slide
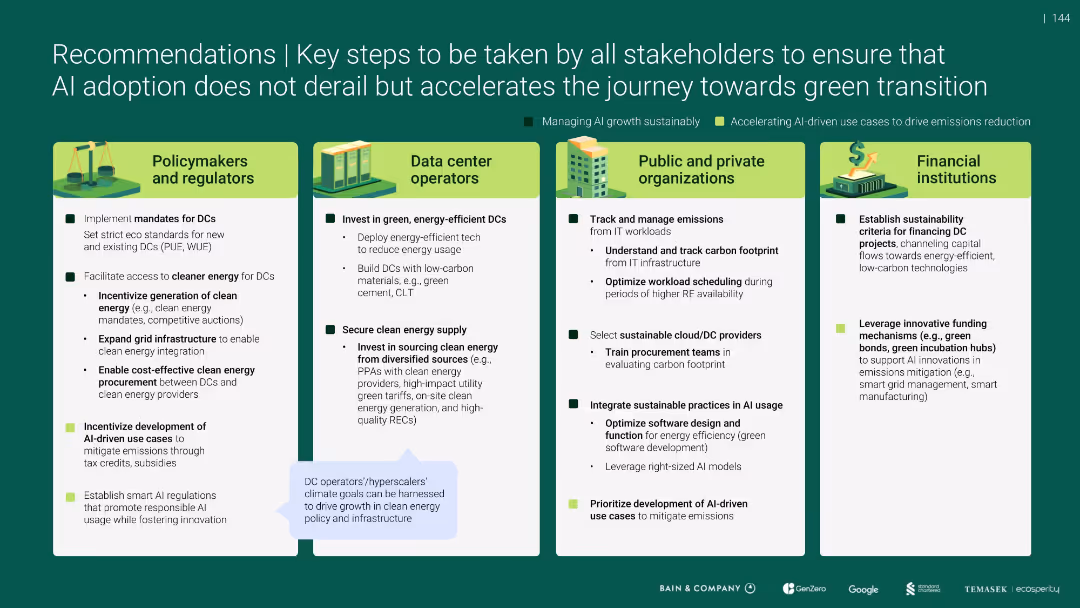
Four-column stakeholder action matrix with icons and checklist-style actions
Strategic Planning
Artificial Intelligence
Recommends policy, operational, and financial steps to align AI growth with green transition. Actions span across policymakers, DC operators, organizations, and investors, focusing on emission standards, clean energy procurement, sustainable tech, and financing innovation to manage AI’s environmental footprint.
stakeholders, AI, green transition, energy policy, emissions, DCs, regulators, sustainability
false
Recommendations | Key steps to be taken by all stakeholders to ensure that AI adoption does not derail but accelerates the journey towards green transitionSoutheast Asia's Green Economy
Pillar
Bain
1
...
Next
Load More
Hold On!
We are searching in our database
If nothing, comes up, please try different filters!
Create a FREE account to continue browsing
Receive Instant Access to 1,000+ slides from companies like McKinsey, Google, and Goldman Sachs
First Name
Last Name
Email
Password
I agree to all
Terms & Privacy Policy
Thank you! Your submission has been received!
Oops! Something went wrong while submitting the form.
Have an account?
Sign in
Column Chart
Heatmap
Chevron
Org Chart
Infographic
Callouts
Timeline
List
Graphic
Picture
Process Flow
Diagram
Paragraph
Map
Table
Framework
Subtitle
Takeaway Box
Icon
Other Chart
Radar Chart
Waterfall Chart
Mekko Chart
Pie Chart
Scatter Plot
Line Chart
Bar chart
Bullet points