My Account
My Slides
Search by Category
Templates
View All Templates
Download Template Slides
Leave Feedback
Login
Logout
Get Started
Browse all Slides
Browse all Slides
Create a FREE Account
Instant access to 1,000+ real slides from top companies like McKinsey, BCG, Goldman Sachs, Google and many more!
First Name
Last Name
Email
Password
I agree to all
Terms & Privacy Policy
Thank you! Your submission has been received!
Oops! Something went wrong while submitting the form.
Have an account?
Sign in
Instant access to the internet's best slides
Get access to 40+ advanced filters and more
Advanced Search and Filters
Access to
10,000+ slides
Access to Category Pages
Save/Bookmark Slides
PowerPoint Template Library (New)
Choose your plan
MONTHLY
$12/month
Billed every month, cancel anytime.
YEARLY
$9/month
Billed $108 annually, cancel anytime.
Checkout for $12/month
Checkout for $108/yr
Secured by Stripe | AES-256 bit encryption
Spark Your Next Big Idea with New Presentation Templates
VIEW ALL Templates
Welcome,
Welcome
Upgrade to SlideStart
Pro
Instant access to 15,000+ slides
Show Featured Only
Checkbox 8
Companies
Mckinsey
Bain
BCG
EY
Deloitte
Accenture
PwC/Strategy&
JP Morgan
Goldman Sachs
Morgan Stanley
Citigroup
Deutsche Bank
Barclays
LEK
Kearney
Oliver Wyman
Booz Allen Hamilton
Gartner
IPSOS
Nielsen
Slide type
Header Horizontal
Framework
Vertical Flow
Single Chart
Single Chart
Text Only
Mixed Chart
Header Vertical
Graphic
Pillar
Multiple Chart
Agenda
Title
Table
Linear Flow
Upgrade to SlideStart
Pro
Instant access to 40+ advanced filters
Industry
Upgrade to SlideStart
Pro
Instant access to 40+ advanced filters
Technology
Healthcare
Financial Services
Consumer Goods
Energy & Utilities
Manufacturing
Retail
E-commerce
Logistics
Telecommunications
Real Estate
Professional Services
Education
Media
Entertainment
Hospitatlity
Tourism
Agriculture
Food Production
Government & Public Sector
Environmental
Sustainability
Use Case
Upgrade to SlideStart
Pro
Instant access to 40+ advanced filters
Sales and Business Development
Mergers and Acquisitions
Corporate Finance and Valuation
Performance Metrics and KPIs
Client Case Studies
Competitive Landscape
Product and Service Analysis
Customer and Market Segmentation
Organizational Structure
Human Resources and Talent Management
Industry Overview
Regulatory and Compliance
Risk Assessment and Management
Agriculture & Food Production
Hospitality and Tourism
Government
Environmental
Sustainability
Clear all
Thank you! Your submission has been received!
Oops! Something went wrong while submitting the form.
Show Featured Only
Checkbox 8
Companies
Mckinsey
Bain
BCG
EY
Deloitte
Accenture
PwC/Strategy&
JP Morgan
Goldman Sachs
Morgan Stanley
Citigroup
Deutsche Bank
Barclays
LEK
Kearney
Oliver Wyman
Booz Allen Hamilton
Gartner
IPSOS
Nielsen
Slide type
Text Only
Linear Flow
Vertical Flow
Single Chart
Header Horizontal
Mixed Chart
Header Vertical
Pillar
Multiple Chart
Graphic
Agenda
Title
Table
Framework
Industry
Technology
Healthcare
Financial Services
Consumer Goods
Energy & Utilities
Manufacturing
Retail
E-commerce
Logistics
Telecommunications
Real Estate
Professional Services
Education
Media
Entertainment
Hospitatlity
Tourism
Agriculture
Food Production
Government & Public Sector
Environmental
Sustainability
Use Case
Sales and Business Development
Mergers and Acquisitions
Corporate Finance and Valuation
Performance Metrics and KPIs
Client Case Studies
Competitive Landscape
Product and Service Analysis
Customer and Market Segmentation
Organizational Structure
Human Resources and Talent Management
Industry Overview
Regulatory and Compliance
Risk Assessment and Management
Agriculture & Food Production
Hospitality and Tourism
Government
Environmental
Sustainability
Clear all
Thank you! Your submission has been received!
Oops! Something went wrong while submitting the form.
Tag
View slide
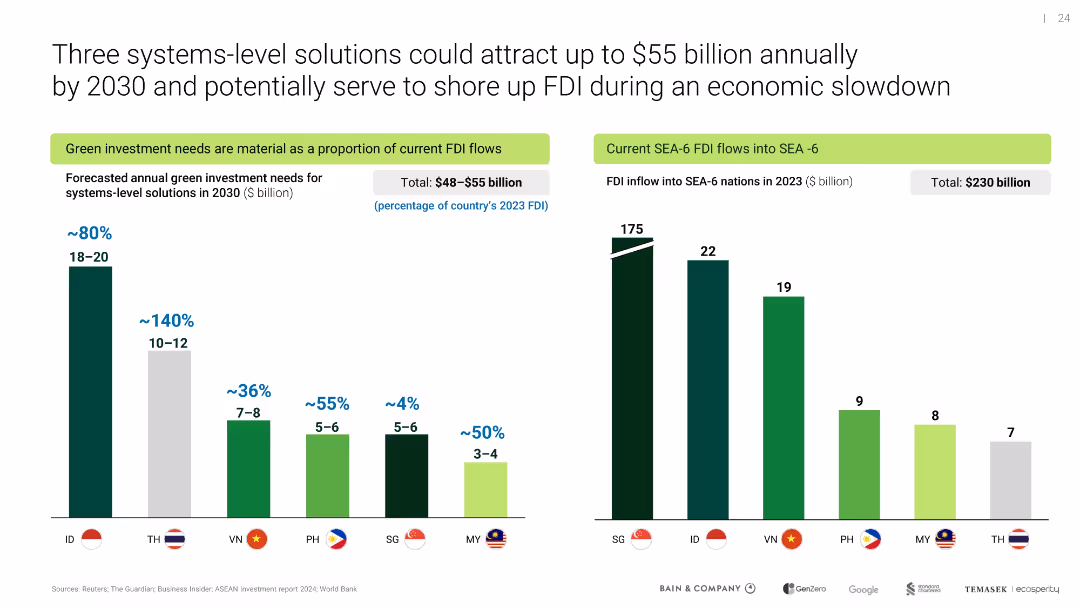
Two bar charts compare forecasted green investment needs and actual 2023 FDI inflows for SEA-6 nations
Investment Analysis
Environmental Services & Sustainability
Highlights investment potential of systems-level green solutions across Southeast Asia, showing material FDI alignment for future capital inflows in sectors like EVs and renewable infrastructure.
green investment, FDI, SEA-6, 2030 forecast, decarbonization finance
false
Three systems-level solutions could attract up to $55 billion annually by 2030 and potentially serve to shore up FDI during an economic slowdownSoutheast Asia's Green Economy
Multiple Chart
Bain
View slide
Contains icons and brief text blocks in a clean layout highlighting key opportunities for SEA in sustainability sectors like energy, nature, and corporate structure.
Market Analysis and Trends
Environmental Services & Sustainability
Discusses SEA's potential for sustainability leadership, focusing on renewable energy, infrastructural improvements, and corporate roles in sustainability, targeting business strategists and environmental advocates.
SEA, sustainability, renewable energy, corporate strategies, icons, opportunities, market analysis, text blocks, clean layout
false
There is no reason for inaction – there is significant upside for SEA if we get it rightSoutheast Asia’s Green Economy 2021 Report: Opportunities on the Road to Net Zero
Pillar
Bain
View slide
Slide shows a series of column charts illustrating the decrease in fire incidents and associated financial losses in a market post-solar adoption, supplemented with a small text box for additional data.
Risk Assessment and Management
Energy & Utilities
Highlights the decrease in fire incidents at Sabon Gari Market following solar energy adoption, emphasizing the financial benefits from reduced damages and operational interruptions.
solar, market, fire, reduction, safety
false
….and save ~USD2-7mn annually in sales, due to fewer fire incidents post solar deploymentSocio-economic case for deepening solar PV deployment in Nigeria
Mixed Chart
BCG
View slide
This slide contains two graphs: one showing the impact of capex on electrolysis costs and another depicting the effect of electricity prices and utilization rates.
Market Analysis and Trends
Energy & Utilities
The slide details how reducing capex and optimizing electricity prices and load factor can improve the LCOH for electrolysis, using visual data to support the points.
LCOH, electrolysis, capex, electricity price, load factor
false
Factors to improve electrolysis LCOHHydrogen applications and business models
Multiple Chart
Kearney
View slide
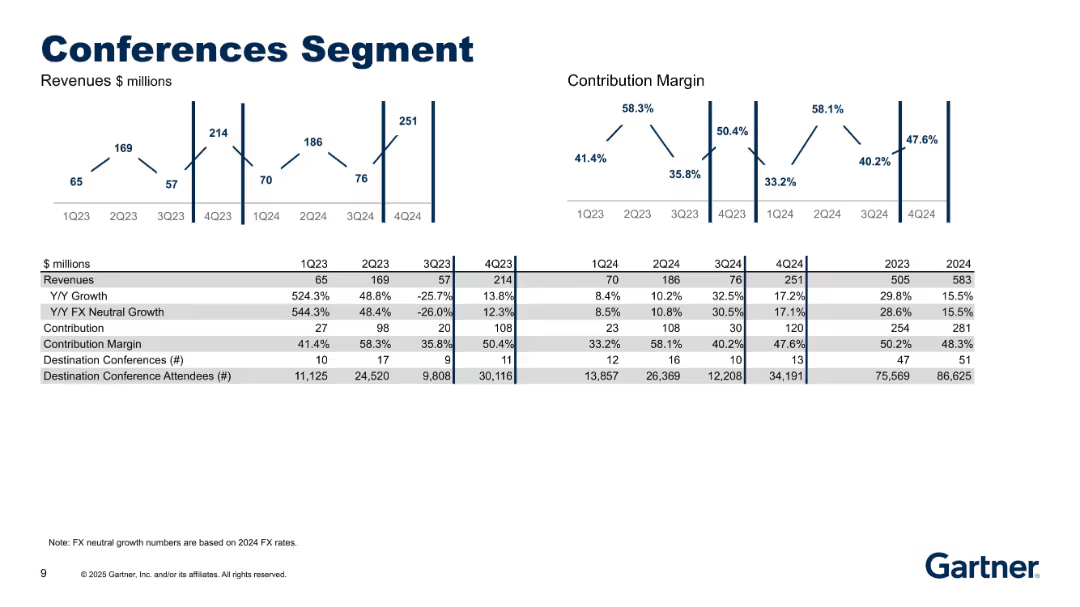
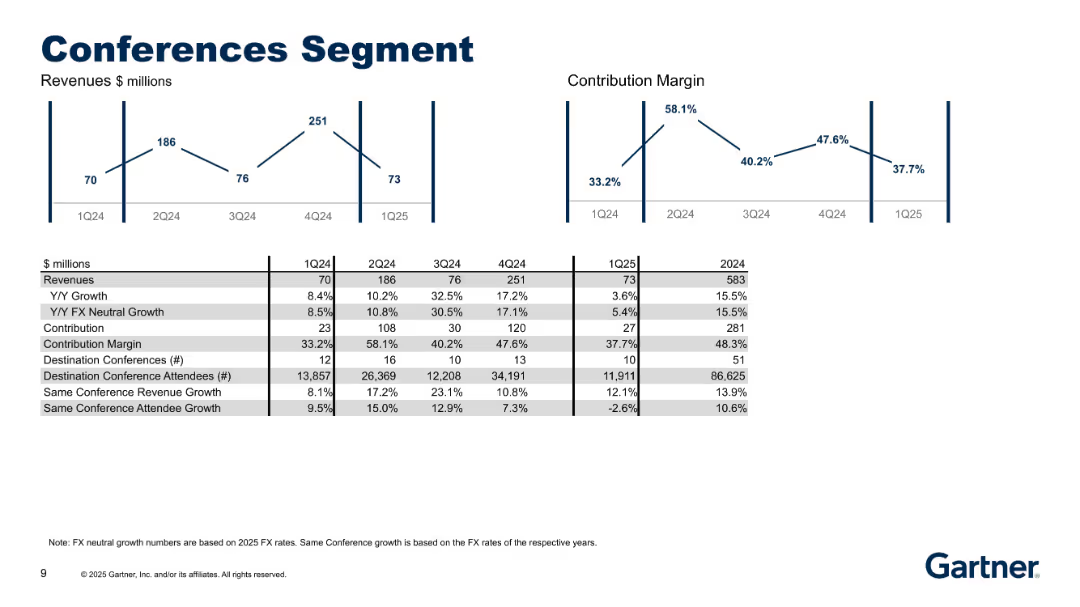
Dual charts above a data table: one for revenues and one for contribution margin. Includes conference counts and attendance. Structured layout with strong verticals.
Product and Service Analysis
Technology & Software
Highlights revenue and margin fluctuations in Gartner’s Conferences segment. Includes key metrics such as number of events, attendees, and their contribution to financial performance. Focuses on seasonality and operational efficiency.
conferences, revenue, contribution margin, attendees, event growth
false
Conferences SegmentFourth Quarter 2024 Results
Multiple Chart
Gartner
View slide
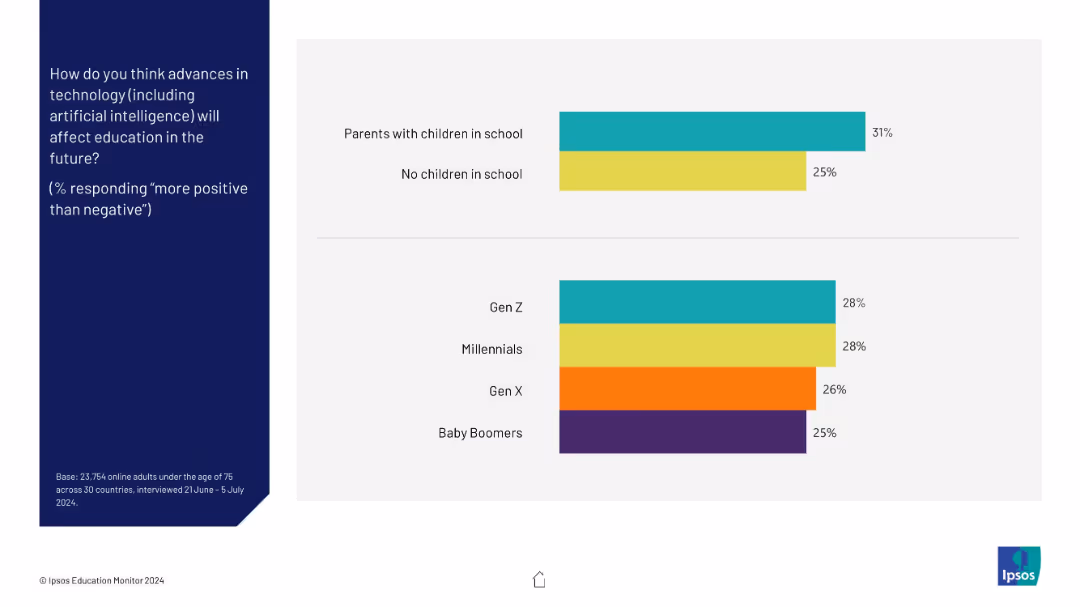
Two horizontal bar charts segmented by parental status and generation; left-aligned question text in blue
Market Analysis and Trends
Education & Training
This slide compares perceptions of tech’s positive impact on education by parental status and generation. Parents and younger generations are slightly more optimistic, though only marginally.
parental status, generation, Gen Z, education, technology, positive impact, perception
false
(% responding "more positive than negative")IPSOS EDUCATION MONITOR 2024
Mixed Chart
IPSOS
View slide
The slide features a column chart showing the energy demand for advanced biofuels from 2000 to 2017, with segments for different biofuels like bio jet kerosene, renewable municipal waste, biogases, biodiesel, and bioethanol.
Market Analysis and Trends
Energy & Utilities
This slide examines the energy demand for advanced biofuels from 2000 to 2017, highlighting technical, economic, and sociopolitical drivers affecting the growth and adoption of these biofuels.
advanced biofuels, energy demand, 2000-2017, bio jet kerosene, renewable waste, biogases, biodiesel, bioethanol
false
Advanced bioenergy has seen its growth slow down in the late 2000sDeveloping sustainable carbon circularity Looking at advanced applications and business models
Mixed Chart
Kearney
View slide
Slide features multiple column charts and lists, indicating changes in expenses. Utilizes arrows for visual emphasis.
Financial Performance
Financial Services
Analyzes quarterly financial changes in expenses, highlighting areas of growth and reduction in investment.
expenses, investment, financial, quarterly, analysis
false
1Q23 YoY Expense WalkFirst Quarter 2023 Earnings Results Presentation
Single Chart
Citigroup
View slide
Line chart and national flags illustrating expectations for a stronger economy in SEA.
Market Analysis and Trends
Financial Services
This slide indicates an upward trend in economic expectations among SEA respondents, highlighting future economic strength.
economy expectations, SEA, line chart, future, survey
false
WHILE WE SEE A POSITIVE UPWARD TREND, ONLY 51% OF THE POPULATION ARE EXPECTING THE ECONOMY TO IMPROVE IN THE NEXT 6 MONTHSIPSOS SEA AHEAD SHIFTS & SENTIMENTS
Mixed Chart
IPSOS
View slide
This slide features an image of people collaborating over a tablet on the right, with the rest of the slide divided into text sections. The layout is clean, with white text on a red background for the headings and black text for the body. The image is captioned, contributing to the overall narrative.
Regulatory and Compliance
Government & Public Sector
Discusses the collaborative investments in R&D for the Tempest program and its implications for technological development and defense, suitable for presentations on government-industry partnerships and investment strategies.
Collaboration, R&D, Defense Technology, Investment, Government-Industry Partnerships
false
The Government and the Tempest partners are investing in R&D to meet the demands of the Tempest programmeAssessment of the expected economic impact of the Tempest Programme (2021-2050)
Vertical Flow
PwC/Strategy&
View slide
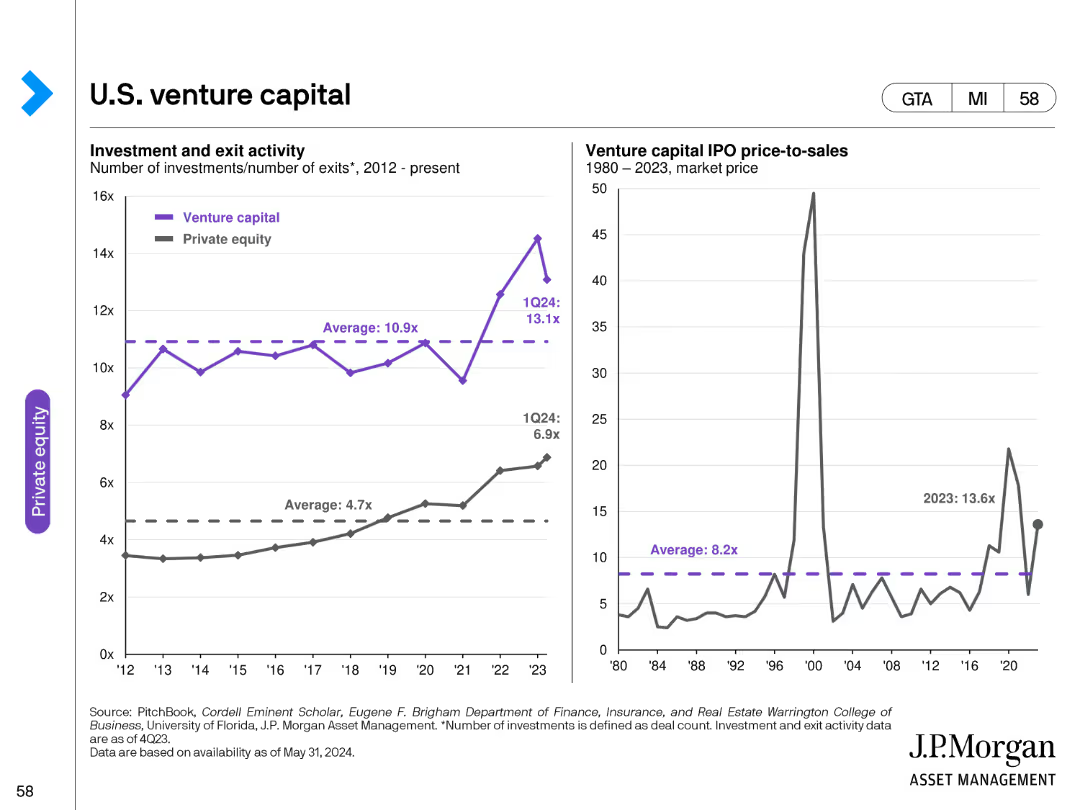
The slide features two line charts: one showing venture capital investment and exit activity, and the other depicting IPO price-to-sales ratios over time.
Investment Analysis
Financial Services
It provides a detailed analysis of U.S. venture capital activities, highlighting investment and exit trends as well as IPO price-to-sales ratios.
venture capital, U.S., investments, exits, IPO, price-to-sales, trends, financial, data analysis
false
U.S. venture capitalGuide to Alternatives
Multiple Chart
JP Morgan
View slide
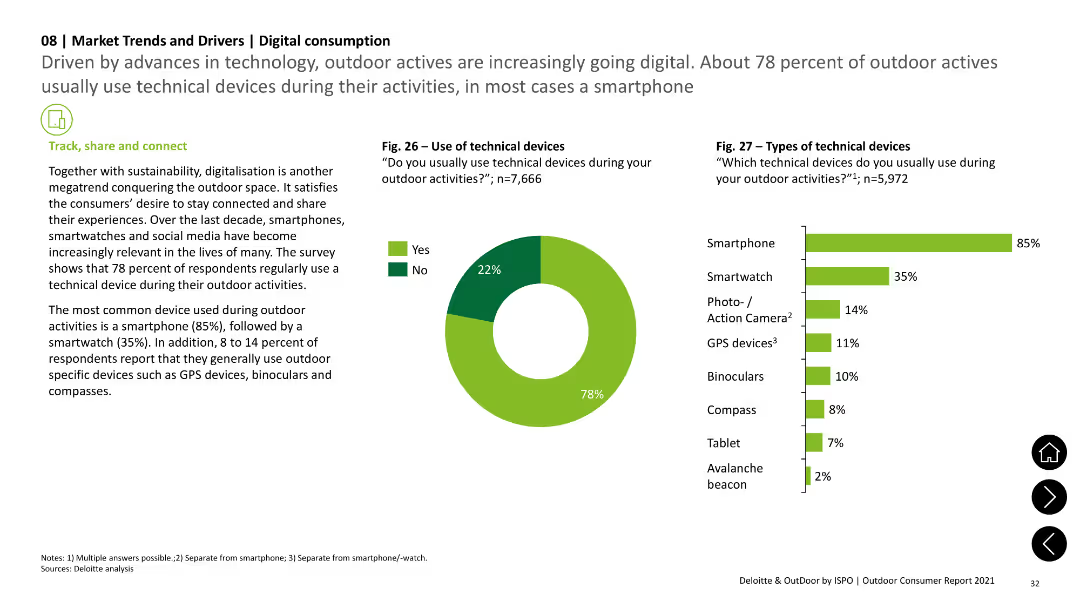
The slide includes a pie chart showing the use of technical devices during outdoor activities and a column chart illustrating the types of devices used, such as smartphones and smartwatches. Text sections provide additional context.
Technology and Digital Transformation
Technology & Software
The slide explores the increasing use of digital devices like smartphones and smartwatches by outdoor enthusiasts, supported by survey data on the prevalence and types of devices used.
digital consumption, technology, smartphones, smartwatches, survey data
false
Driven by advances in technology, outdoor actives are increasingly going digital. About 78 percent of outdoor actives usually use technical devices during their activities, in most cases a smartphoneOutdoor Consumer Report 2021 Deloitte & OutDoor by ISPO
Multiple Chart
Deloitte
View slide
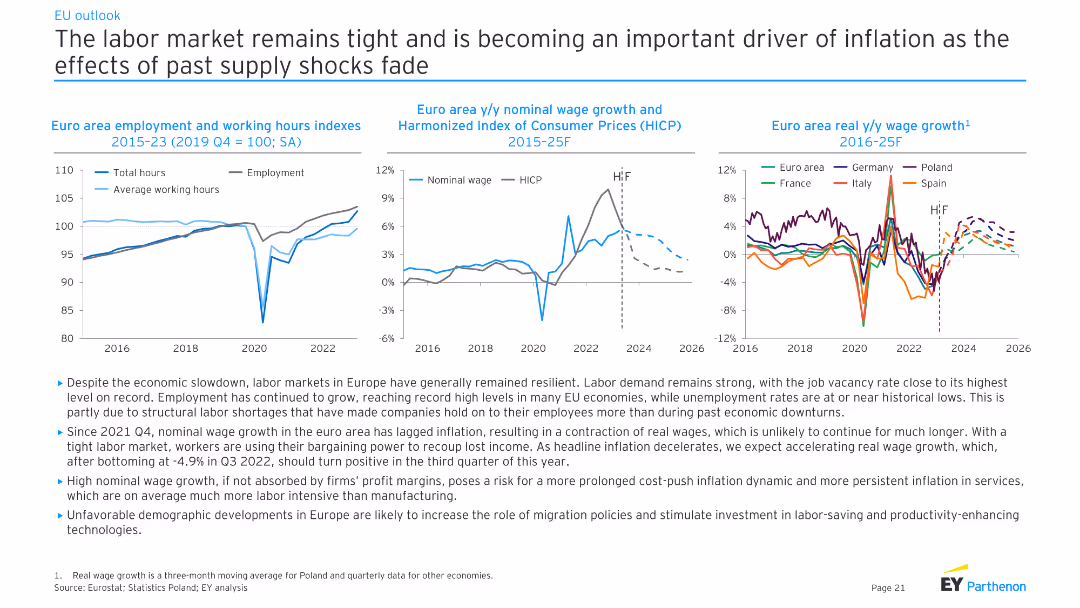
This slide contains three line charts showing employment and working hours indexes, nominal wage growth vs. HICP, and real wage growth across EU countries from 2015 to 2025. The text discusses the tight labor market and wage trends.
Market Analysis and Trends
Financial Services
The slide analyzes the tight labor market in the EU, highlighting employment growth, wage trends, and structural labor shortages. It discusses the implications of these trends for inflation and economic stability in the region.
EU labor market, wage growth, employment trends, inflation impact, structural shortages, economic stability, financial analysis, EY analysis
false
The labor market remains tight and is becoming an important driver of inflation as the effects of past supply shocks fadeGlobal economic outlook Macroeconomic outlook and impact on businesses
Multiple Chart
EY
View slide
Contains a column chart showing the reliance on marketing for creative ideas in high-growth companies, with text suggesting strategies to encourage creativity.
Strategic Planning
Professional Services
This slide discusses strategies for CMOs to foster creativity in their organizations, emphasizing the role of marketing in generating creative ideas in high-growth companies.
creativity, strategies, CMOs, professional services, marketing
false
FIGURE 2: High-growth companies rely more on marketing for creative ideas2023 Global Marketing Trends
Mixed Chart
Deloitte
View slide
Includes a column chart with blue and yellow columns, labeled with percentages and SEA country flags at the bottom.
Market Analysis and Trends
Technology & Software
Shows the proportion of new digital service consumers in SEA countries, highlighting how COVID-19 has affected digital adoption.
digital service, consumers, SEA, COVID-19, adoption
false
On average across SEA, 1 in 3 (~36%) of all digital service consumers are new to the service due to COVID-19e-Conomy SEA 2020 At full velocity: Resilient and racing ahead
Single Chart
Bain
View slide
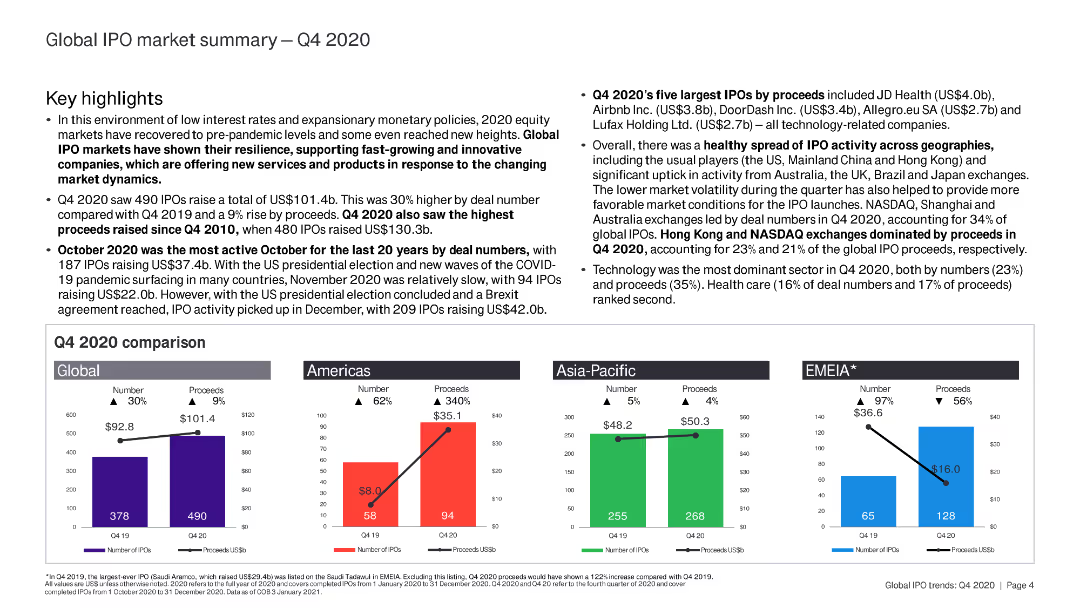
The slide is text-heavy with key highlights and comparative analysis of IPO markets in Q4 2020. It includes small bar charts for regional comparisons.
Market Analysis and Trends
Financial Services
This slide summarizes the global IPO market in Q4 2020, covering key highlights, largest IPOs, and regional analysis.
IPO, Q4 2020, global market, key highlights, regional analysis
false
Global IPO market summary — Q4 2020Is your business model resilient enough to weather any storm?
Multiple Chart
EY
View slide
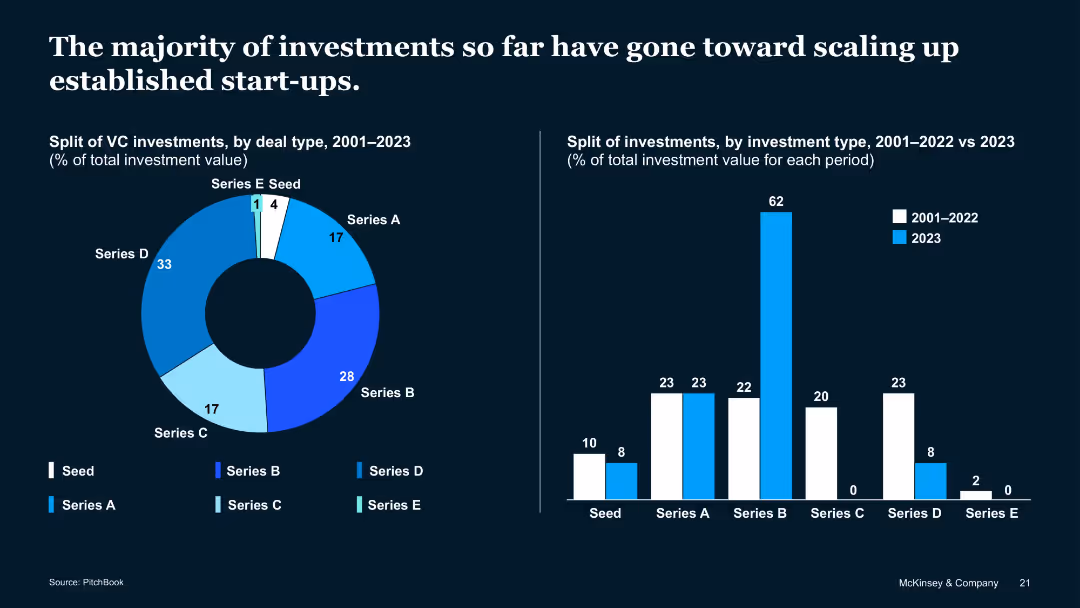
Pie and bar charts indicating split of VC investments by deal type (Series A-E, Seed) and year comparisons
Investment Analysis
Artificial Intelligence
Series D and B dominate QT VC deals, showing focus on scaling up mature start-ups. The 2023 data indicates a strong preference for Series B over earlier or later-stage funding. Seed and Series E are minimal.
VC Deal Type, Series Funding, Scaling Startups, QT, Investment Split
false
The majority of investments so far have gone toward scaling up established start-ups.Quantum Technology Monitor
Multiple Chart
McKinsey
View slide
This slide presents two scatter plots showing the projected decrease in capex for AE and PEM electrolyzers from 2010 to 2030.
Market Analysis and Trends
Energy & Utilities
The slide projects significant reductions in capex for AE and PEM electrolyzers by 2030, supported by historical and forecasted data points.
capex, electrolyzer, AE, PEM, cost reduction, market trends
false
Capex for electrolyzer is expected to dramatically decrease by 2030Hydrogen applications and business models
Multiple Chart
Kearney
View slide
The slide shows a dark theme with two divided column charts comparing the unsecured funding mix between years. Text blocks detail the growth in deposits and total assets in bank entities.
Financial Performance
Financial Services
Aimed at depicting the funding strategy improvement over time, the slide contrasts the wholesale unsecured and deposit percentages from 2019 to 2022.
Funding, Liquidity, Deposits, Unsecured, Assets, Banks, Growth, Strategy
false
Actively Managing Our Funding and Liquidity ProfileFinancial Roadmap
Mixed Chart
Goldman Sachs
View slide
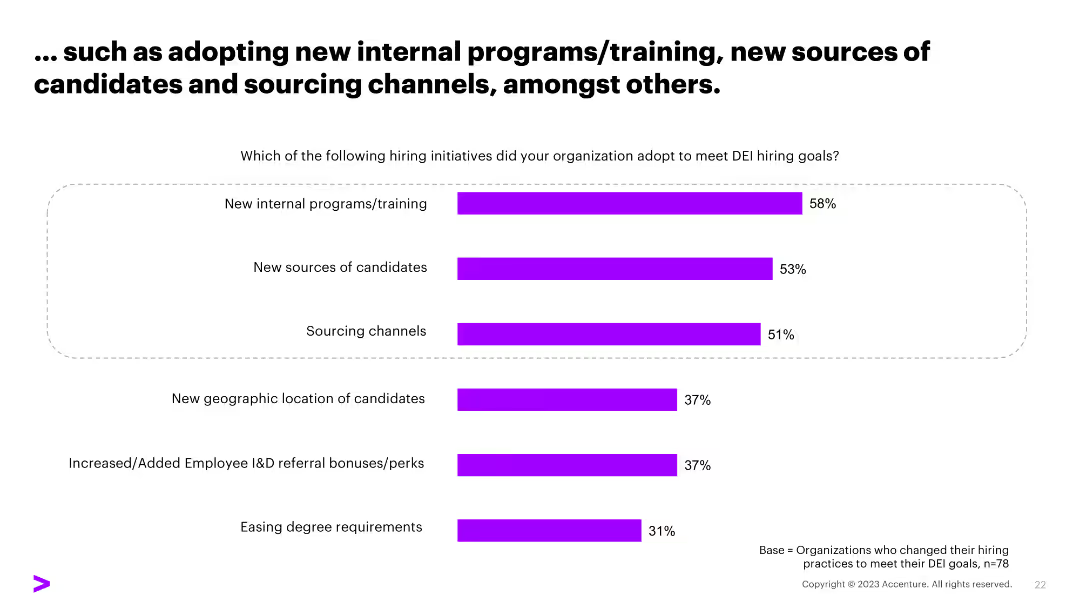
A column chart showing various hiring initiatives like new internal programs/training, new sources of candidates, and sourcing channels, with percentage values.
Human Resources and Talent Management
Professional Services
The slide lists various initiatives organizations adopted to meet DEI hiring goals, highlighting the most common methods and their adoption rates.
DEI, hiring initiatives, training programs, candidates, sourcing channels
false
… such as adopting new internal programs/training, new sources of candidates and sourcing channels, amongst others.Tech Talent Hiring Trends Survey
Single Chart
Accenture
View slide
Similar format as previous slide; charts for revenues and margins; data table includes attendees and events.
Performance Metrics and KPIs
Technology & Software
This slide presents detailed performance metrics for Gartner’s Conferences segment, highlighting revenue trends, growth in events and attendance, and contribution margins. It reflects recovery and growth from past volatility.
conferences, revenue, attendees, events, contribution margin, growth, FX neutral, KPIs, Gartner
false
Conferences SegmentFirst Quarter 2025 Results
Multiple Chart
Gartner
View slide
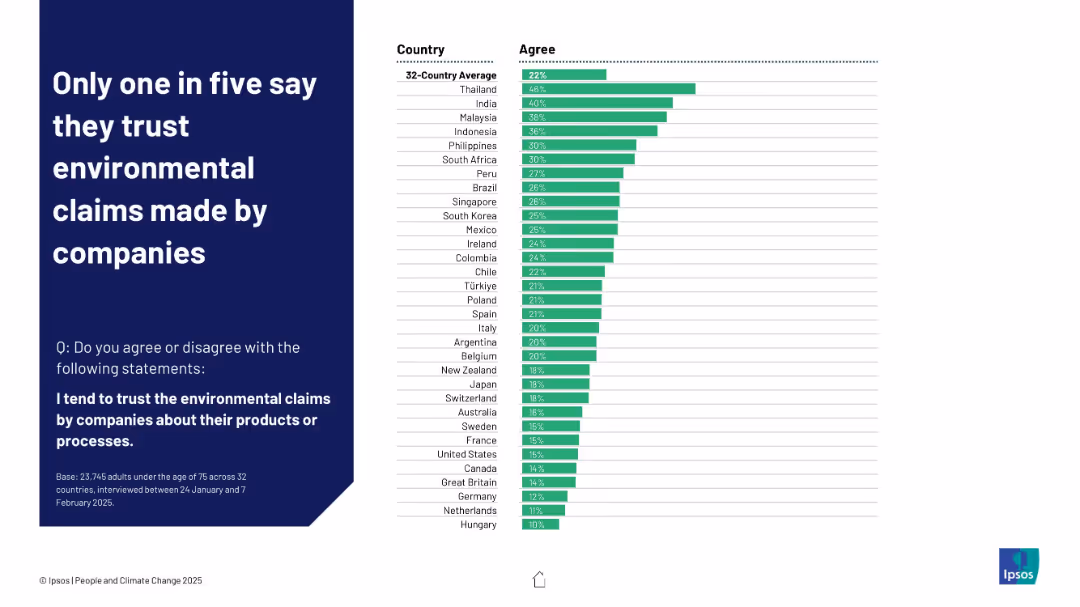
Horizontal bar chart with green bars showing agreement levels by country, average at top
Customer and Market Segmentation
Consumer Goods
This slide presents global trust levels in environmental claims made by companies. The 32-country average is 22%, with higher trust in Thailand and India and lowest in Hungary and the Netherlands, showing widespread skepticism.
environmental claims, trust, companies, Ipsos, public opinion, greenwashing, corporate credibility, perception, consumer behavior
false
Only one in five say they trust environmental claims made by companiesPEOPLE AND CLIMATE CHANGE
Mixed Chart
IPSOS
View slide
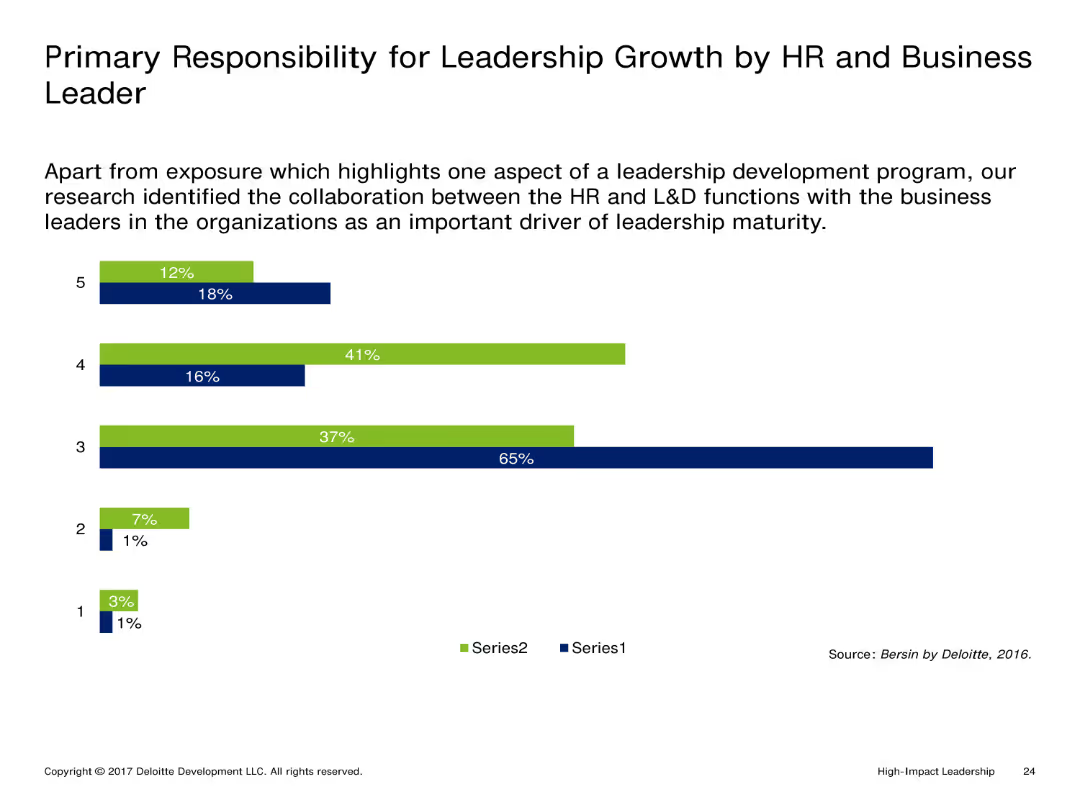
This slide features a vertical column chart with two series of data, each series represented by different colors (blue and green). The columns indicate the percentage responsibility of HR and business leaders in leadership growth.
Market Analysis and Trends
Professional Services
The slide compares the responsibility for leadership growth between HR and business leaders. The chart highlights the significant collaboration between these functions as a crucial factor for leadership maturity.
Leadership, Growth, HR, Business Leaders, Collaboration
false
Primary Responsibility for Leadership Growth by HR and Business LeaderHigh-Impact Leadership Master Deck
Single Chart
Deloitte
View slide
The slide presents a bar chart listing key criteria for selecting third-party DCRs, such as confidentiality, privacy by design, availability of enrichment partners, etc.
Technology and Digital Transformation
Technology & Software
The slide identifies the primary reasons why users select data clean rooms (DCRs), focusing on privacy protection, data control, and interoperability as critical factors.
DCR selection, privacy, data control, interoperability
false
Users are selecting DCRs for privacy p rotection, data controls, and interoperabilityState of Data 2023
Mixed Chart
IPSOS
View slide
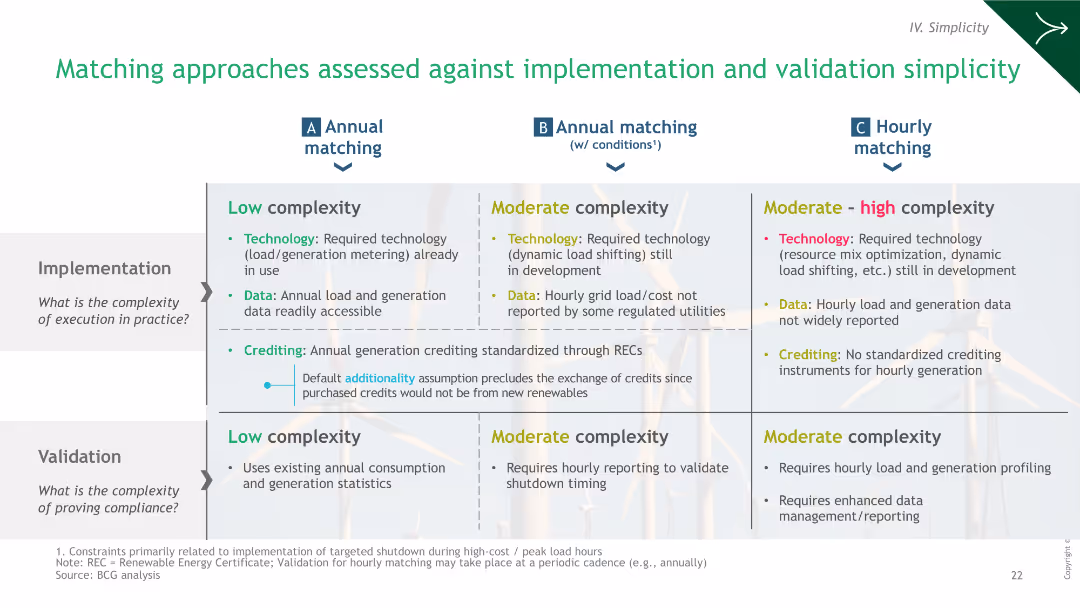
A comparative table evaluating the complexity of implementation and validation of different green hydrogen matching strategies.
Operational Efficiency
Energy & Utilities
The slide evaluates the implementation and validation complexities of different hydrogen matching approaches, assessing technology, data, and crediting.
hydrogen, implementation, validation, strategies, complexity
false
Matching approaches assessed against implementation and validation simplicityGreen Hydrogen: An assessment of near-term power matching requirements
Table
BCG
View slide
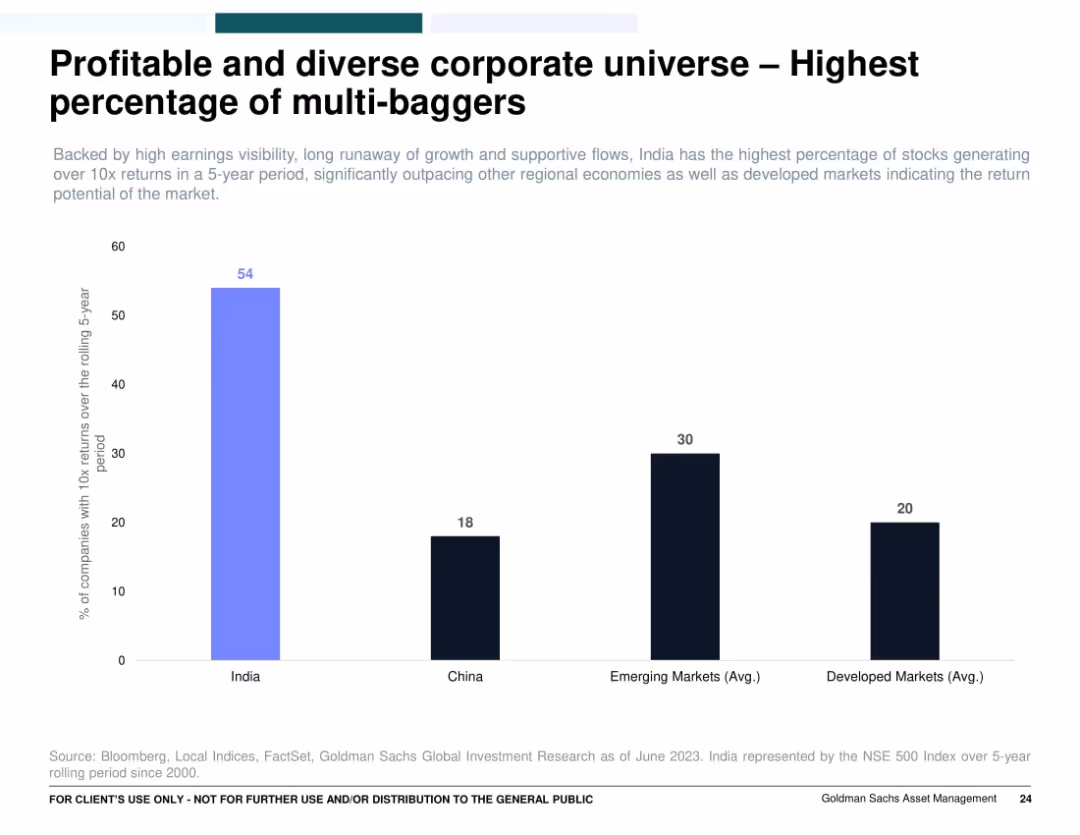
Single bar chart comparing the percentage of companies delivering 10x returns across countries/regions (India, China, EM, DM); clean layout with color-coded bars.
Investment Analysis
Financial Services
Emphasizes that India has the highest percentage of companies with 10x returns over a rolling 5-year period, far outpacing China, emerging markets, and developed markets. It highlights India’s market potential and wealth creation opportunity through multi-bagger investments.
multi-baggers, India equities, stock returns, investment opportunity, wealth generation, 10x returns
false
Profitable and diverse corporate universe – Highest percentage of multi-baggersIndien: Probleme und Chancen auf dem Subkontinent
Single Chart
Goldman Sachs
View slide
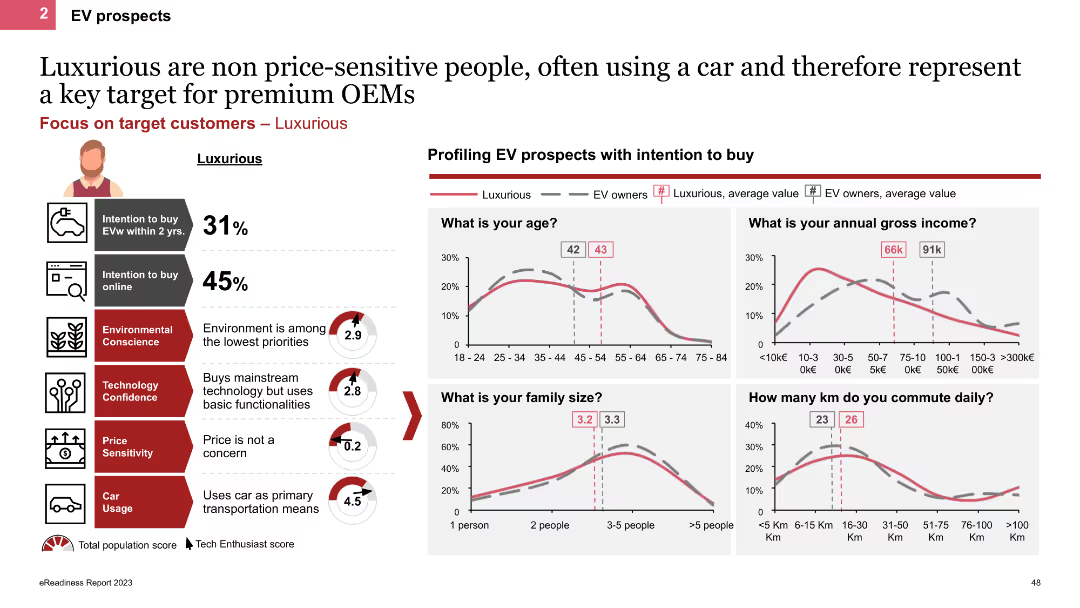
The slide profiles Luxurious personas using line charts and icons, showing demographic details like age, income, and family size. It highlights their high car usage and low price sensitivity, with charts comparing their characteristics to other EV owners.
Customer and Market Segmentation
Transportation & Logistics
This slide describes Luxurious personas, emphasizing their high income, frequent car usage, and lack of price sensitivity. It provides demographic comparisons and insights into their EV purchase behaviors and preferences.
EV prospects, Luxurious, line charts, demographics, high income
false
Luxurious are non price-sensitive people, often using a car and therefore represent a key target for premium OEMs4th edition eReadiness 2023
Multiple Chart
PwC/Strategy&
View slide
The slide contains column chart, tables, and a bullet-pointed textual analysis. It uses shades of green for the bars and a mix of bold and standard text for emphasis.
Regulatory and Compliance
Financial Services
Displaying the escalating costs of compliance, the slide breaks down expenditures into regulatory project and routine compliance costs, alongside an analysis of historical spending trends.
Compliance, Regulatory, Cost, Analysis, Trend
false
Costs of complianceMorgan Stanley Virtual Hong Kong Summit
Mixed Chart
Morgan Stanley
View slide
This slide includes a column chart comparing port costs in Australia, the US, and France, with bullet points discussing various factors affecting port costs and their implications for supply chains.
Market Analysis and Trends
Transportation & Logistics
It evaluates the direct port costs in Australia compared to the US and France, highlighting factors that influence these costs and the competitive position of Australian ports within the global market.
port costs, Australia, US, France, supply chain, comparison
false
Despite this, Australian direct port costs compare reasonably well with comparatorsInternational Comparison of Australia’s Freight and Supply Chain Performance Final Report - Cement
Mixed Chart
LEK
View slide
Two column charts show Eaton's segment operating margin and sales from 2000 to 2018, across different business divisions like Electrical Products and Hydraulics.
Financial Performance
Technology & Software
Tracks profitability changes in Eaton’s various business divisions over nearly two decades, useful for financial analysis and strategy planning.
Eaton, profitability, sales, financial analysis
false
This transformation adds to a long track record of improving profitability…Deutsche Bank Global Industrials & Materials
Multiple Chart
Deutsche Bank
View slide
Column charts for revenues by reporting unit, detailed lists, and text boxes
Financial Performance
Financial Services
Analysis of legacy franchise results, including net income and credit costs
Legacy, Franchise, Revenue, Net Income, Credit, Column Chart, Financials
false
Legacy Franchises ResultsEarnings Results Presentation
Mixed Chart
Citigroup
View slide
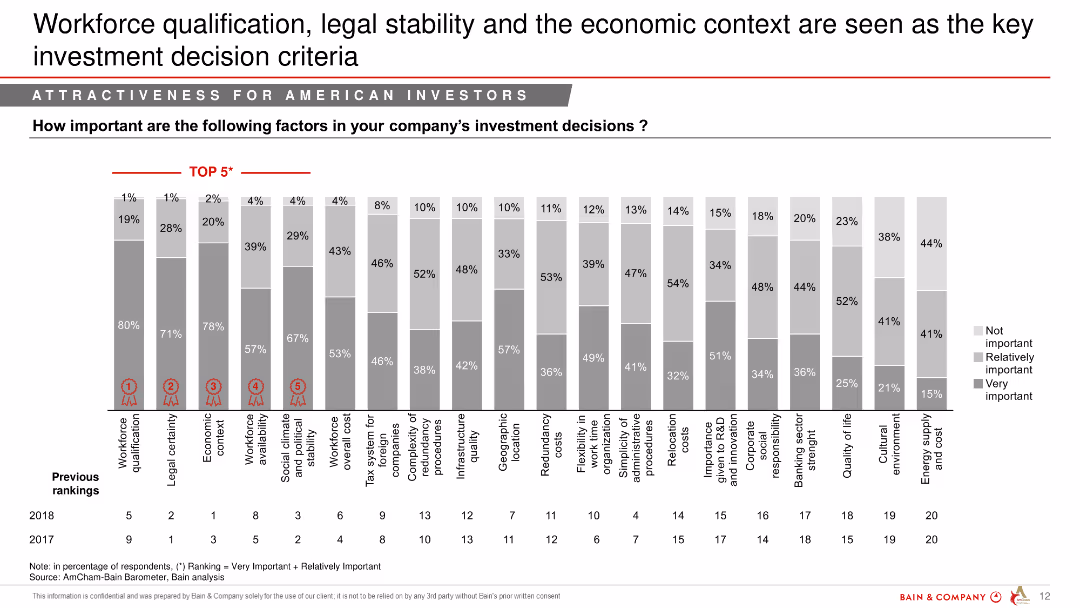
Column chart illustrating the importance of various factors in investment decisions for American investors in 2018 and 2017, with "Top 5" factors highlighted.
Market Analysis and Trends
Professional Services
This slide discusses key factors influencing investment decisions by American investors, highlighting workforce qualification, legal stability, and economic context.
workforce qualification, investment, decision criteria, American investors, key factors
false
Workforce qualification, legal stability and the economic context are seen as the key investment decision criteriaAmCham – Bain Barometer 20th – Edition
Single Chart
Bain
View slide
Dark background with blue circuit illustration and list-style table of contents
Industry Overview
Artificial Intelligence
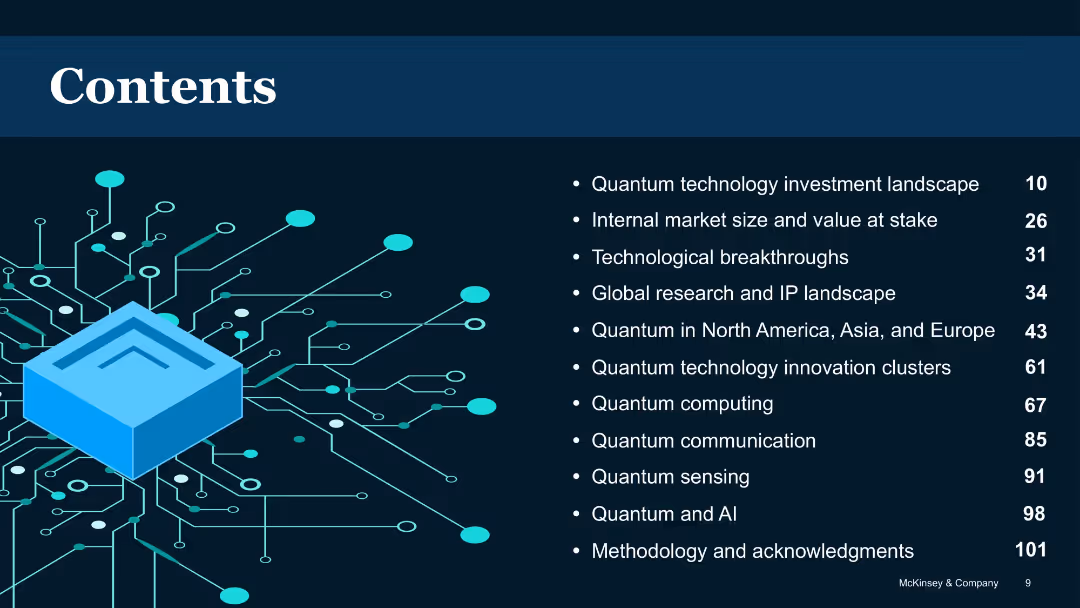
Provides a structured overview of the report’s sections, including topics like investment landscape, technological breakthroughs, global perspectives, and specific quantum technologies like computing, sensing, and communication.
Table of contents, report structure, quantum sections, chapter list
false
ContentsQuantum Technology Monitor
Agenda
McKinsey
View slide
This slide includes a header and a column chart. The charts compare employees' preferences for working remotely or in a hybrid setting against their expectations of what their employers will likely implement.
Technology and Digital Transformation
Technology & Software
Analyzes current trends and future expectations regarding hybrid and remote work arrangements, reflecting a strong preference for flexibility in work locations among employees, contrasted with their anticipation of employer policies.
hybrid working, remote work, employee preferences, employer expectations
false
Employees largely believe that their employers will provide the work options they prefer in the coming yearGlobal Workforce Hopes and Fears Survey 2022
Single Chart
PwC/Strategy&
View slide
Two-bar chart columns comparing 2024 vs. 2025 executive expectations for volume and price changes. Yellow theme consistent with related slides. Additional commentary on trends provided in side text.
Market Analysis and Trends
Consumer Goods
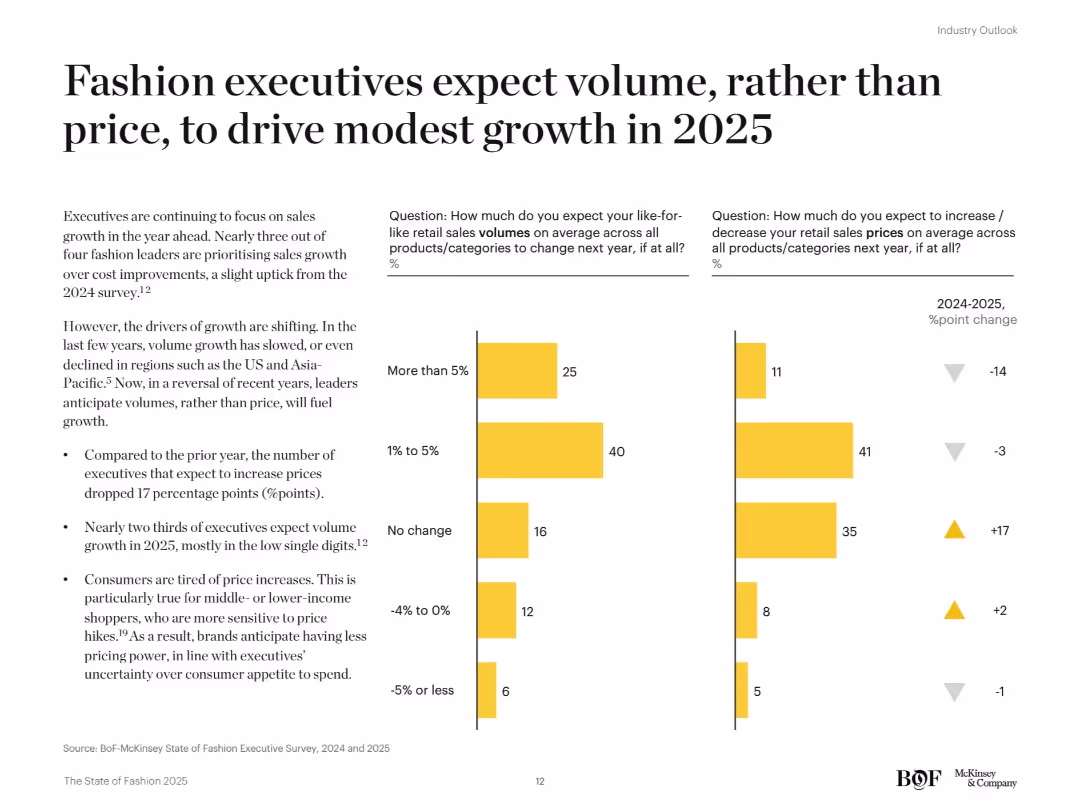
Executives are shifting their focus from price-driven growth to volume growth for 2025, especially in low single-digit ranges. Fewer expect price increases than in 2024. This reflects consumer resistance to pricing and a focus on affordability and competitive market positioning.
pricing strategy, volume growth, executive expectations, consumer spending, fashion industry, 2025 forecast
false
Fashion executives expect volume, rather than price, to drive modest growth in 2025The State of Fashion 2025
Mixed Chart
McKinsey
View slide
Features a mix of text and a column chart illustrating preferred working patterns for Gen Z and millennials. Includes benefits of remote work in text bubbles.
Operational Efficiency
Professional Services
The slide highlights the high demand for hybrid working models among Gen Z and millennials and the need for businesses to adapt to this preference. It includes data on preferred working patterns and the benefits of remote work, such as cost savings and improved work-life balance.
Hybrid work, remote work, Gen Z, millennials, work-life balance
false
here’s huge demand for more hybrid ways of working, but businesses have work to do to get it rightDeloitte Gen Z and Millennial Survey 2022
Mixed Chart
Deloitte
View slide
The slide is professionally designed with a clean white background. It has three columns with headers: 'Key questions', 'EY-Parthenon capabilities', 'Representative engagements', and bullet points under each. Text is black with the exception of the slide title in red, and there are no images or graphs.
Industry Overview
Financial Services
This slide showcases EY-Parthenon’s capabilities in assisting investors to evaluate potential distribution investments, highlighting key questions for market analysis, and listing previous engagements that showcase their expertise and experience.
EY-Parthenon, distribution investments, market analysis, due diligence, proprietary research, revenue forecasting, investment trends, sector analysis, HVAC, MRO market
false
Introduction to EY-Parthenon’s Industrials practiceEY-Parthenon Perspectives: Investing in distribution
Header Horizontal
EY
View slide
Text on the left and bar chart on the right showing effectiveness in aligning purpose with corporate structure across top vs. bottom ESG performers.
Organizational Structure and Change
Professional Services
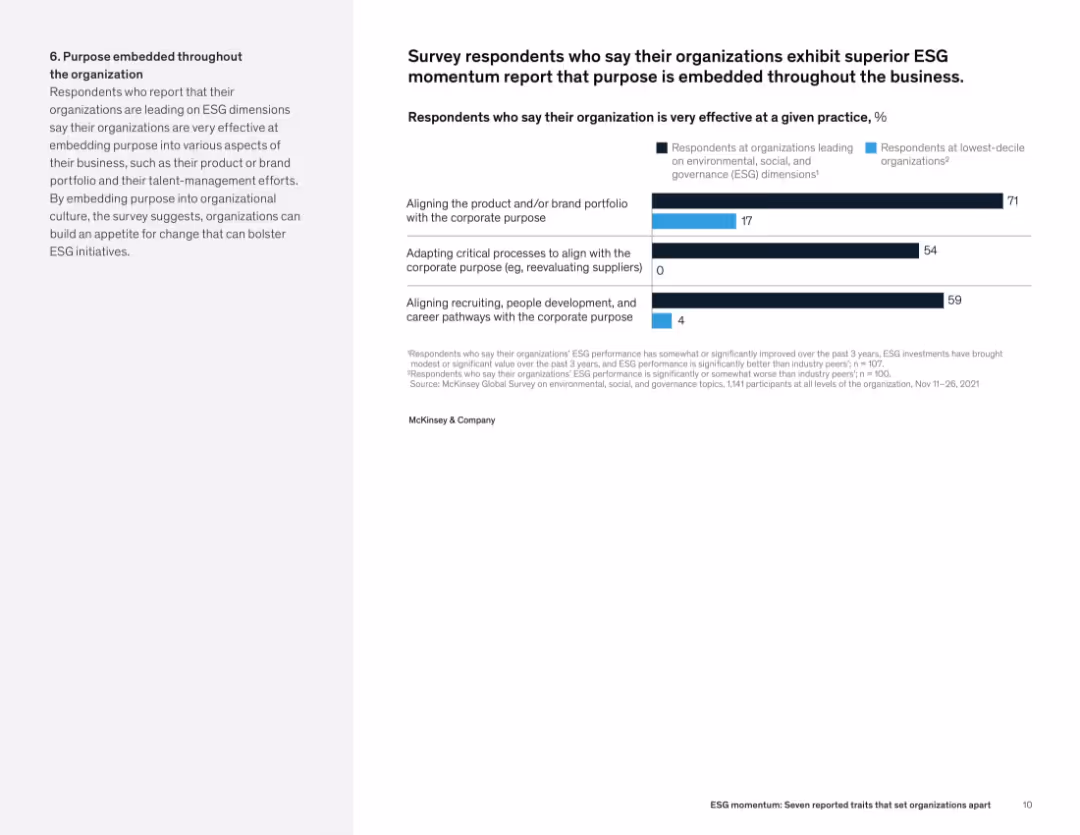
Organizations with strong ESG performance embed purpose into operations—aligning product portfolios, critical processes, and talent systems with ESG principles. The chart shows a stark difference in implementation effectiveness between leading and lagging firms.
corporate purpose, ESG integration, business alignment, sustainability strategy, organizational behavior, talent pathways
false
Survey respondents who say their organizations exhibit superior ESG momentum report that purpose is embedded throughout the businessESG momentum: Seven reported traits that set organizations apart
Mixed Chart
McKinsey
View slide
Line graph showing two trendlines over time (2014–2023): one for belief the world is more dangerous, and another for belief that more things are getting better.
Market Analysis and Trends
Media & Entertainment
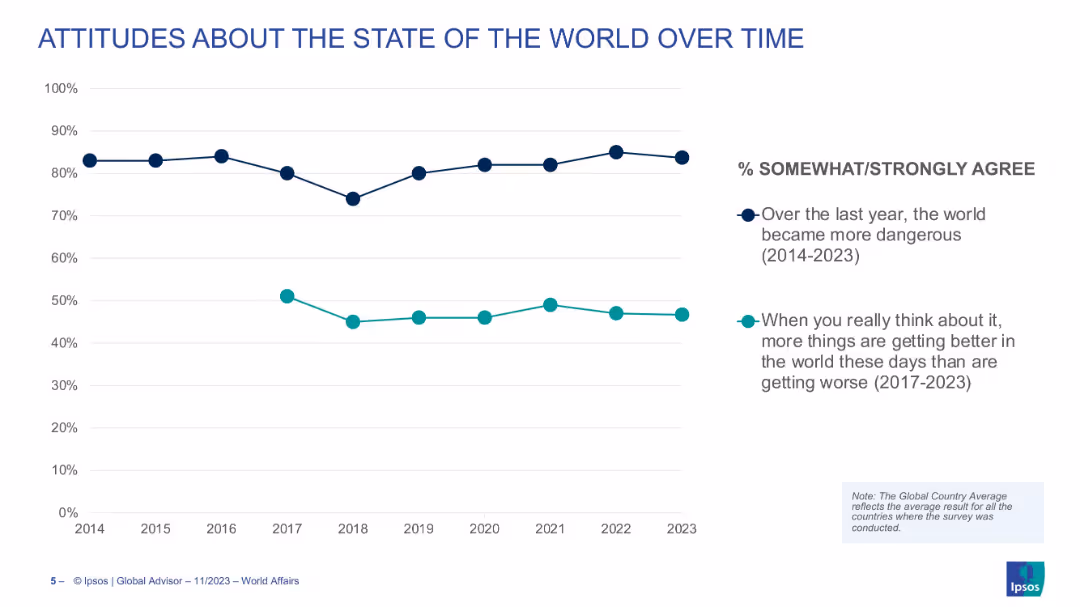
The slide tracks global attitudes toward danger and optimism over nearly a decade, showing consistent concern about safety and a more fluctuating view on global progress.
world views, optimism, danger, global trends, perceptions, time-series, sentiment
false
Attitudes About the State of the World Over TimeWORLD AFFAIRS 2023
Single Chart
IPSOS
View slide
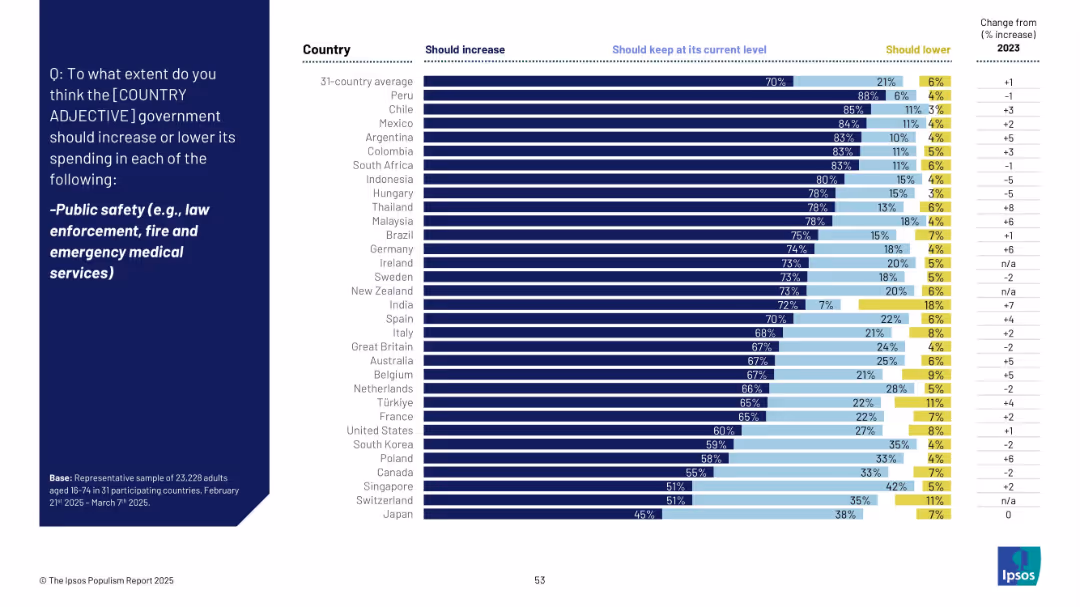
Bar chart with three response categories and a trend column for % change.
Strategic Planning
Government & Public Sector
Global sentiment favors increased spending on public safety, with 70% on average supporting it. Peru and Chile top the list, while Japan and Switzerland show the least support. The data suggest strong backing for law enforcement and emergency services funding globally.
public safety, law enforcement, fire services, emergency response, funding, government, Ipsos, survey
false
Public safety (e.g., law enforcement, emergency services)THE IPSOS POPULISM REPORT 2025
Mixed Chart
IPSOS
View slide
This slide contains a bar chart with horizontal bars comparing the actions taken by Millennials and Gen Z to protect the environment. The bars are color-coded to distinguish between the two groups. The slide also includes a block of text providing context and analysis.
Market Analysis and Trends
Environmental Services & Sustainability
The slide presents survey results showing the environmental actions taken by Millennials and Gen Z, with the text highlighting trends and impacts of these actions. It serves to inform stakeholders about generational differences in environmental responsibility and the influence of the pandemic on these behaviors.
Environment, Millennials, Gen Z, Sustainability, Survey
false
Millennials are taking action to protect the environment (primary survey)The Deloitte Global Millennial Survey 2020
Mixed Chart
Deloitte
View slide
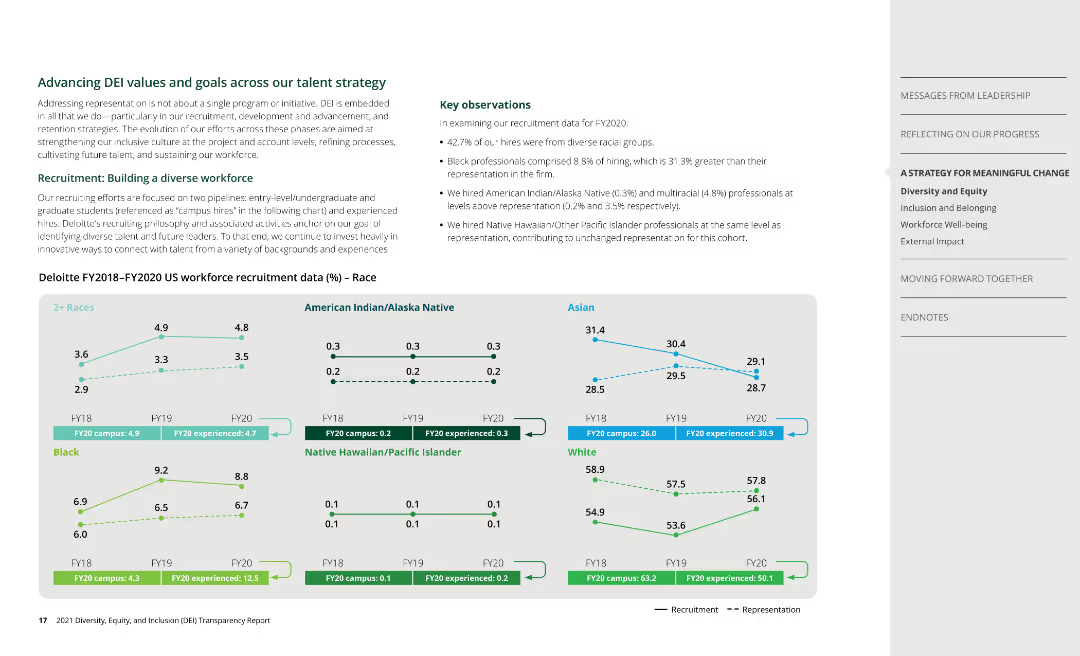
Line charts show recruitment data by race from FY2018 to FY2020 for different racial groups, with additional observations.
Human Resources and Talent Management
Professional Services
Discusses DEI efforts in recruitment, presenting data on hiring trends and goals to increase workforce diversity.
DEI, recruitment, race, diversity, Deloitte
false
Advancing DEI values and goals across our talent strategy2021 Diversity, Equity, and Inclusion (DEI) Transparency Report
Multiple Chart
Deloitte
View slide
This slide features two sets of column charts comparing fiscal year results with annotations explaining each financial figure. The color red is used for textual emphasis and outlining chart areas.
Financial Performance
Industrial & Manufacturing
It's a financial report slide transitioning from EBITA to net results, showing year-over-year changes. Such a slide would be used in financial presentations to stakeholders to outline the company’s financial health and operational results.
Financial Report, EBITA, Net Result, Fiscal Year, Corporate Finance
false
From EBITA to Net Result Stronger bottom line thanks to EBITA increaseGoldman Sachs Investor Meeting
Multiple Chart
Goldman Sachs
View slide
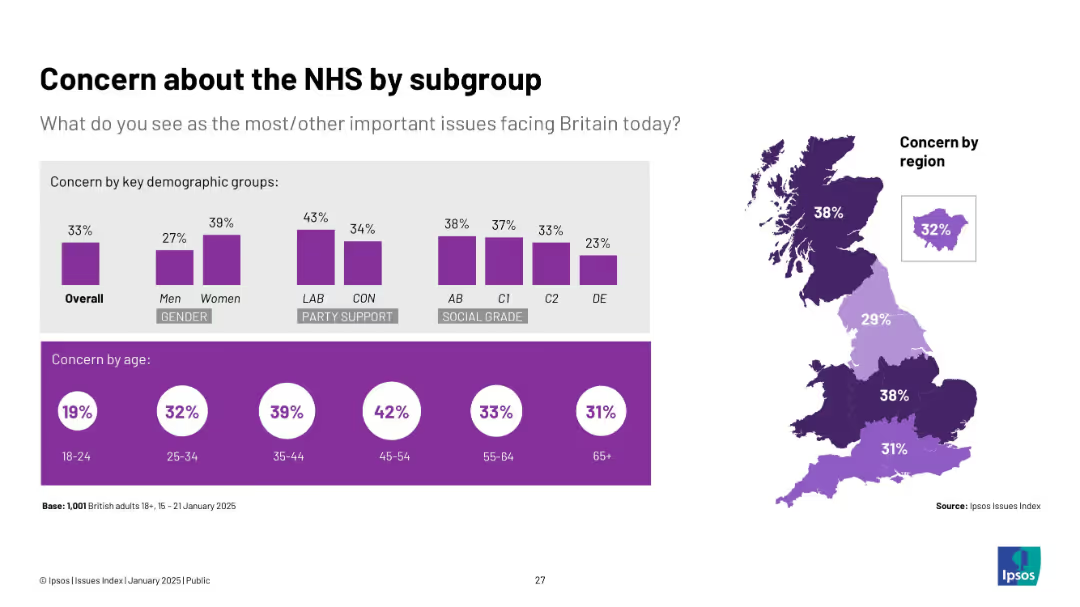
Mixed visuals: bar charts by gender, party, social grade, age + regional heat map.
Market Analysis and Trends
Healthcare & Pharmaceuticals
The slide presents concern about the NHS across key demographic groups. Women, Labour supporters, and those aged 35–54 show the highest concern. Regional analysis reveals Northern and Central England express greater NHS worries.
NHS, healthcare, gender, age, regional concern, Ipsos
false
Concern about the NHS by subgroupIpsos Issues Index January 2025
Multiple Chart
IPSOS
View slide
This slide presents a table with performance indicators for Australia's grain supply chain, using color coding to highlight areas of strength and weakness.
Operational Efficiency
Agriculture & Food Production
The slide evaluates the efficiency of Australia's grain supply chain, identifying areas where it meets or exceeds benchmarks, as well as areas needing improvement, particularly in rail and port operations.
Grain supply chain, Australia, performance indicators, rail efficiency, port efficiency, benchmarking, operational efficiency, agriculture
false
Australia’s grain supply chain benchmarks well overall, with gaps to efficiency best practice on rail and at portsInternational Comparison of Australia’s Freight and Supply Chain Performance
Table
LEK
View slide
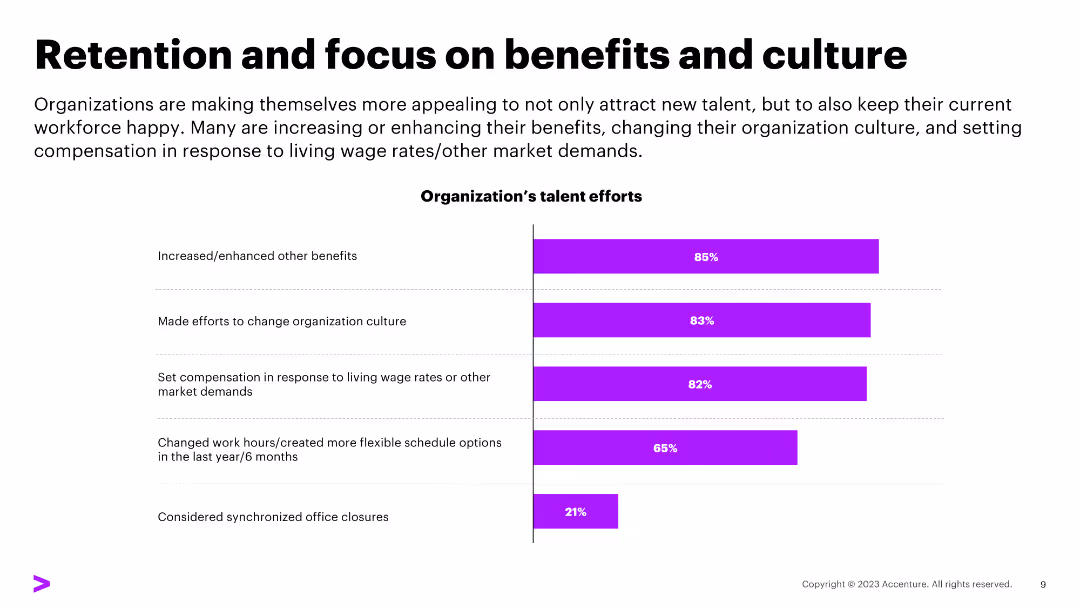
The slide contains a column chart with percentages indicating organizational efforts on benefits and culture. The design is moderately dense with text and visual elements.
Human Resources and Talent Management
Professional Services
Highlights organizational efforts to improve employee retention by enhancing benefits and organizational culture.
retention, benefits, culture, compensation, flexible schedule, office closures
false
Retention and focus on benefits and cultureTech Talent Hiring Trends Survey
Single Chart
Accenture
View slide
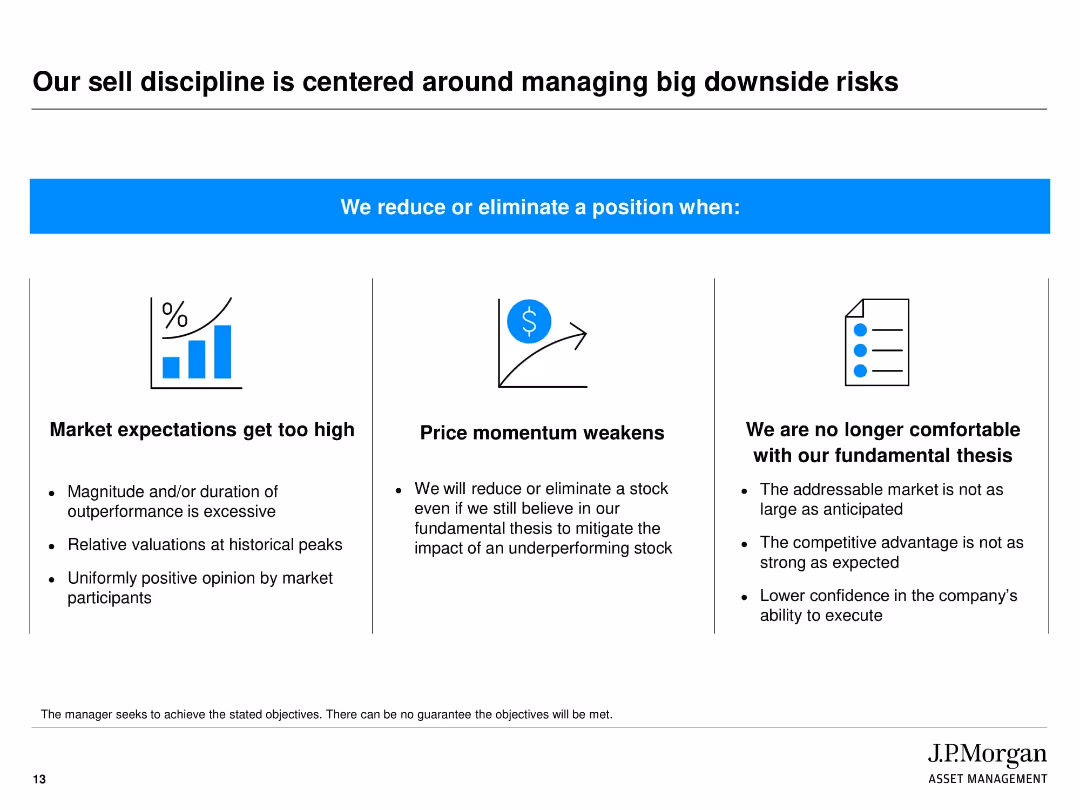
Three-column layout under a bold banner with conditions for reducing/eliminating positions, each supported by a visual icon
Risk Assessment and Management
Financial Services
This slide explains the criteria J.P. Morgan uses to reduce or eliminate investments. It lists three key triggers: market overvaluation, weakening price momentum, and failure of fundamental investment theses, highlighting the firm’s risk-averse discipline.
Sell discipline, downside risk, investment strategy, valuation, risk management, price momentum, fundamental analysis
false
Our sell discipline is centered around managing big downside risksJ.P. Morgan Large Cap Growth Strategy Separately Managed Account
Pillar
JP Morgan
View slide
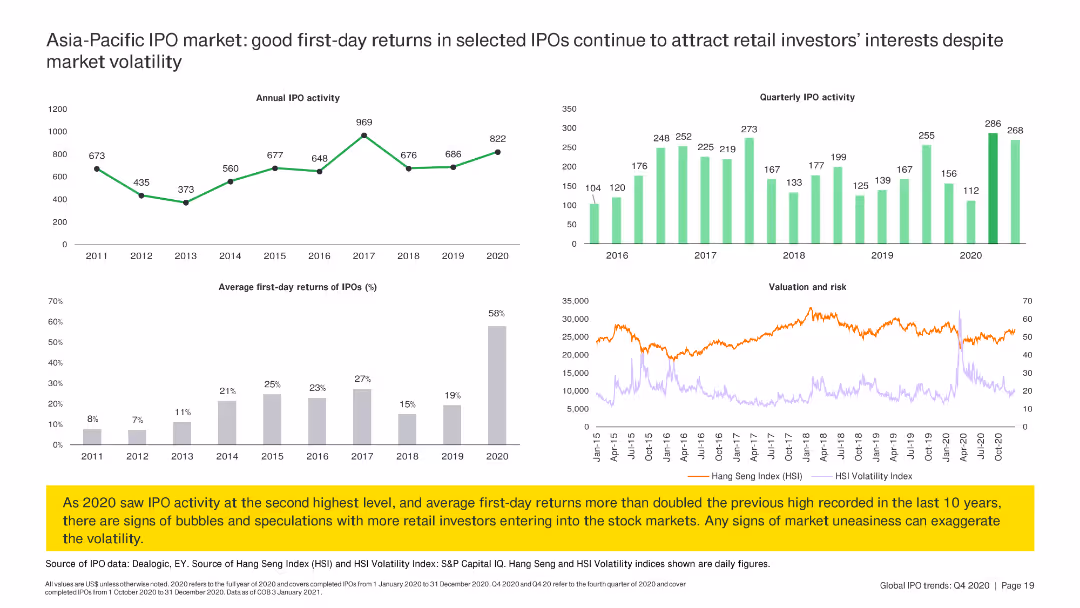
The slide includes line charts and column charts summarizing annual IPO activity, first-day returns, and quarterly IPO activity in the Asia-Pacific region.
Market Analysis and Trends
Financial Services
The slide reviews IPO activity in the Asia-Pacific region, focusing on good first-day returns and quarterly IPO trends, despite market volatility.
IPO, Asia-Pacific, returns, trends, volatility
false
Asia-Pacific IPO market: good first-day returns in selected IPOs continue to attract retail investors’ interests despite market volatilityIs your business model resilient enough to weather any storm?
Multiple Chart
EY
View slide
Three column charts show underlying sales growth and market winning by year and displays the market distribution.
Strategic Planning
Consumer Goods
Analyzes Unilever's sales performance and market competitiveness over the years with a focus on maintaining growth and addressing challenges in various markets.
Sales Growth, Competitiveness, Market Distribution, Strategic Planning, Unilever
false
Priority 1: Sustaining the step-up in growth and competitivenessUnilever at Deutsche Bank
Multiple Chart
Deutsche Bank
View slide
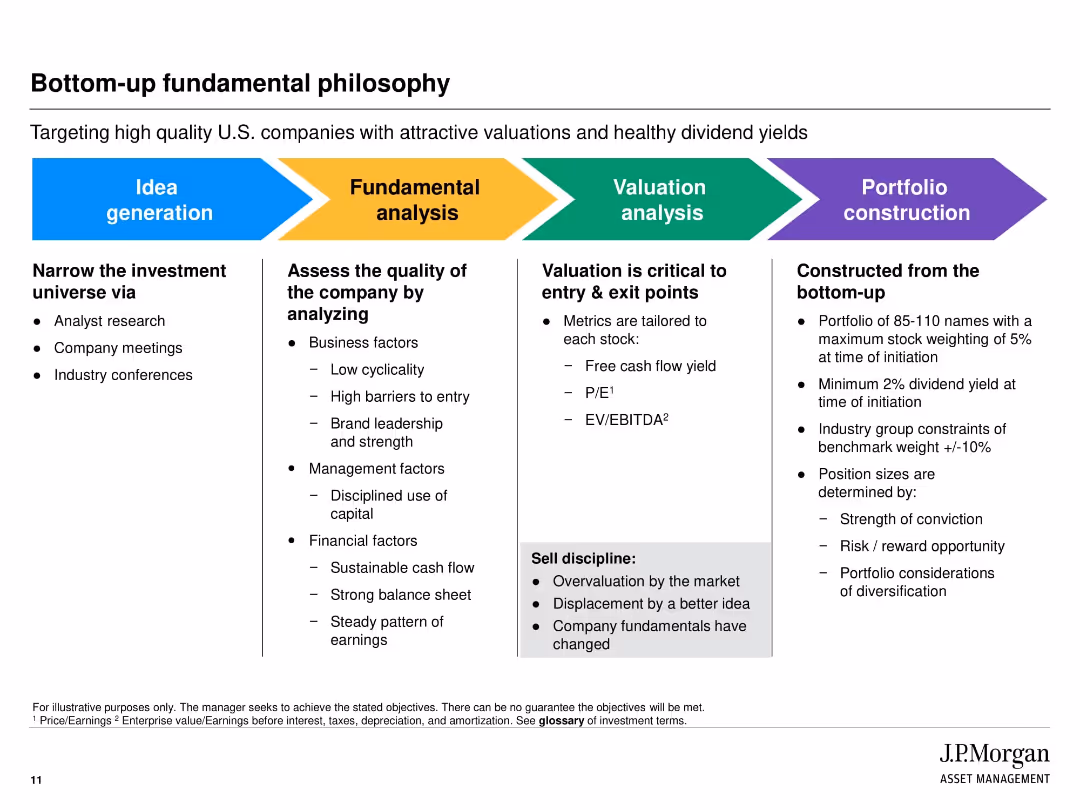
Horizontal multi-section layout with colored blocks representing process steps from idea generation to portfolio construction.
Strategic Planning
Financial Services
Outlines the step-by-step bottom-up investment process at JPMorgan. Focuses on narrowing the investment universe, analyzing company fundamentals, conducting valuations, and finalizing portfolio construction based on risk, conviction, and diversification.
investment strategy, valuation, bottom-up, stock selection, due diligence, portfolio construction, analysis
false
Bottom-up fundamental philosophyJPMorgan Equity Income Strategy
Linear Flow
JP Morgan
View slide
The slide features a project timeline with key phases and dates, including interviews, data collection, analysis, and reporting. The layout includes text boxes for each phase, detailing activities and objectives, and is visually structured with arrows and icons.
Strategic Planning
Professional Services
The slide features a project timeline with key phases and dates, including interviews, data collection, analysis, and reporting. The layout includes text boxes for each phase, detailing activities and objectives, and is visually structured with arrows and icons.
backlog, contract performance, book-to-bill, fiscal years, growth
false
New Hampshire engaged A&M to perform a ten week strategic assessment of DHHS operations. The following timeline describes the major steps and phases of this assessment.NH DHHS Operations Assessment
Linear Flow
Alvarez & Marsal
View slide
Includes a line chart detailing the historical and projected demand drivers for iron ore, marked against steel and scrap consumption.
Market Analysis and Trends
Industrial & Manufacturing
The slide analyzes the past and future challenges of the iron ore industry, highlighting the influence of steel demand and scrap consumption on iron ore demand.
iron ore, challenges, steel demand, scrap consumption, line chart
false
Emerging technologies can significantly raise copper demand requiring significant investmentTechnology’s role in mineral criticality
Multiple Chart
McKinsey
View slide
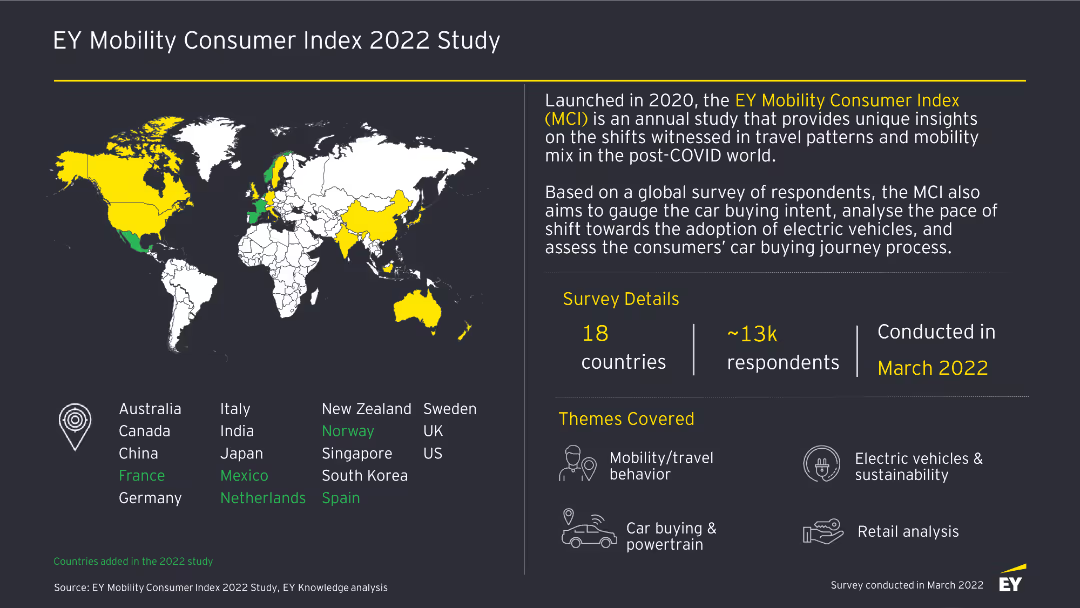
This slide features a world map highlighting countries included in the study, with accompanying text detailing survey details, themes, and respondent demographics.
Market Analysis and Trends
Transportation & Logistics
The slide introduces the EY Mobility Consumer Index 2022 Study, outlining the survey details, themes covered, and the global reach of the study across 18 countries and 13k respondents.
Mobility, Survey, 2022, Consumer Index, Transportation, Trends, Global, Study, Market Analysis
false
EY Mobility Consumer Index 2022 StudyEY Mobility Consumer Index (MCI) 2022 study
Graphic
EY
View slide
The slide contrasts fintech, metaverse, healthtech, and edtech sectors with lists of top drivers and barriers, and a feature image of a woman using a smartphone.
Market Analysis and Trends
Technology & Software
Highlights the main drivers and barriers to adoption for new technologies like e-wallets, AR, VR, and online courses, essential for strategic planning.
Tech Adoption, Drivers, Barriers, Fintech, Metaverse, Healthtech, Edtech, Strategic Planning
false
Practical benefits and convenience drive adoption and usage of new techSoutheast Asia's digital consumers: A new stage of evolution
Table
Bain
View slide
Three-part comparison: Physical world, Digital disruptor, NFT Case. Icons and descriptions for music rights ownership and revenue models.
Technology and Digital Transformation
Media & Entertainment
Compares traditional music rights ownership, digital disruption through streaming, and NFTs, highlighting shifts in ownership and revenue models in the music industry. Useful for discussions on digital transformation.
NFTs, Digital Goods, Music Rights, Ownership, Revenue Models, Streaming, Transformation
false
NFTs enable ownership of digital goods and can change the distribution and revenue model: Music exampleBlockchain and Digital Assets
Linear Flow
McKinsey
View slide
The slide contains two column charts. The first chart shows earnings growth by market for 2024 and 2025, and the second chart shows earnings growth by sector. Each chart uses color coding to differentiate between years.
Financial Performance
Financial Services
This slide provides earnings growth expectations for APAC ex-Japan equities, broken down by market and sector, for the years 2024 and 2025. It is used for financial performance analysis and investment planning.
APAC, earnings growth, market, sector, 2024, 2025, financial performance, investment planning
false
APAC ex-Japan equities: Earnings expectations by market and sectorGuide to the Markets Asia | 2Q 2024
Multiple Chart
JP Morgan
View slide
Features three circular icons representing the food industry, consumers, and government, each linked to a key focus area. The design is clean with a blue color scheme.
Strategic Planning
Environmental Services & Sustainability
Discusses the need for a radical transformation in the food system, emphasizing the roles of various stakeholders including the food industry, consumers, and government in achieving sustainable practices.
food industry, sustainability, stakeholders, transformation
false
Radical transformationThe Future of Food Challenges & opportunities
Pillar
Deloitte
View slide
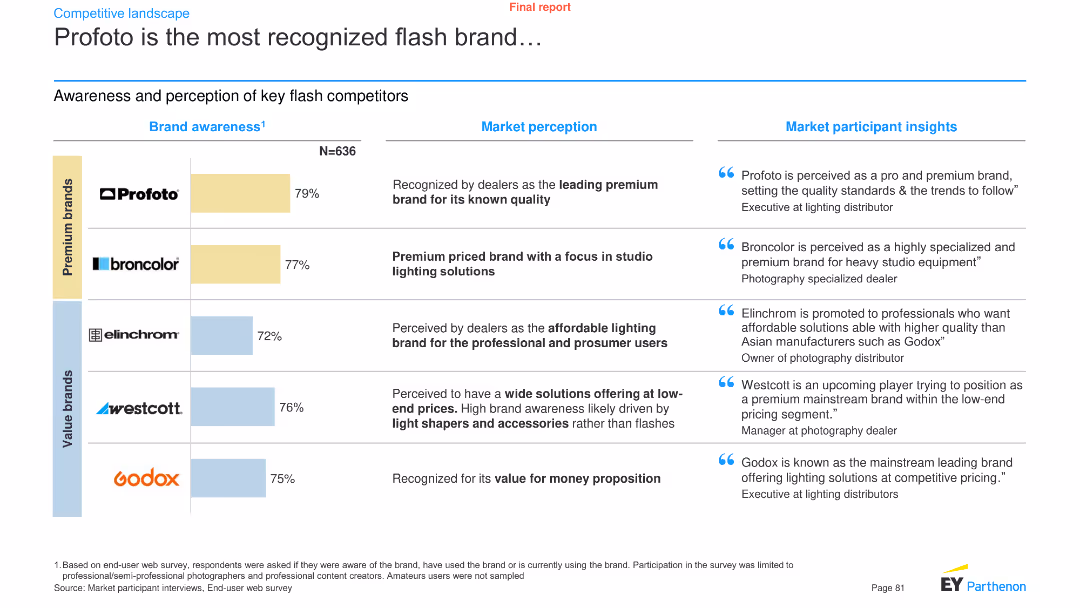
A combination of a bar chart and text boxes presents brand awareness data for key flash competitors, along with market perception and participant insights.
Pricing Strategies
Media & Entertainment
It showcases the brand awareness levels of key flash brands like Profoto, Broncolor, Elinchrom, Westcott, and Godox, with market perception and insights.
Brand awareness, flash brands, Profoto, market perception, participant insights, media, entertainment, analysis, trends
false
Profoto is the most recognized flash brand…Project Spiritus Final report Market Study
Mixed Chart
EY
View slide
Features an image of a student with headphones using a laptop on the left and two content columns on the right with icons. The slide is clear and uses a split-layout design.
Operational Efficiency
Financial Services
Details strategies to maximize revenue and manage costs within core business operations, suitable for financial and operational strategy discussions.
Revenue, Cost Management, Market Share, Operational Strategy
false
Maximize the Profitability and Growthof the Core BusinessMorgan Stanley - US Financials, Payments, & CRE Conference
Header Horizontal
Morgan Stanley
View slide
This slide includes multiple bar charts showing projections of electric vehicle adoption in the U.S. by 2030. It discusses light, medium, and heavy-duty vehicles.
Market Analysis and Trends
Transportation & Logistics
Focuses on the projected increase in electric vehicle sales by 2030, supported by incentives. It's helpful for strategic planning in automotive sectors and sustainability initiatives.
electric vehicles, sales projections, 2030, automotive industry, sustainability, incentives, strategic planning
false
Transportation | Close to half of vehicle sales likely to be electric by 2030US Inflation Reduction Act: Climate & Energy Featuresand Potential Implications
Multiple Chart
BCG
1
...
Load More
Hold On!
We are searching in our database
If nothing, comes up, please try different filters!
Create a FREE account to continue browsing
Receive Instant Access to 1,000+ slides from companies like McKinsey, Google, and Goldman Sachs
First Name
Last Name
Email
Password
I agree to all
Terms & Privacy Policy
Thank you! Your submission has been received!
Oops! Something went wrong while submitting the form.
Have an account?
Sign in
Column Chart
Heatmap
Chevron
Org Chart
Infographic
Callouts
Timeline
List
Graphic
Picture
Process Flow
Diagram
Paragraph
Map
Table
Framework
Subtitle
Takeaway Box
Icon
Other Chart
Radar Chart
Waterfall Chart
Mekko Chart
Pie Chart
Scatter Plot
Line Chart
Bar chart
Bullet points