🎉 Black Friday Sale!
- Save 20% on SlideStart Pro Annual plan! CODE:
BLACKFRIDAY
My Account
My Slides
Search by Category
Templates
View All Templates
Download Template Slides
Leave Feedback
Login
Logout
Get Started
Browse all Slides
Browse all Slides
Create a FREE Account
Instant access to 1,000+ real slides from top companies like McKinsey, BCG, Goldman Sachs, Google and many more!
First Name
Last Name
Email
Password
I agree to all
Terms & Privacy Policy
Thank you! Your submission has been received!
Oops! Something went wrong while submitting the form.
Have an account?
Sign in
Instant access to the internet's best slides
Get access to 40+ advanced filters and more
Advanced Search and Filters
Access to
10,000+ slides
Access to Category Pages
Save/Bookmark Slides
PowerPoint Template Library (New)
Choose your plan
MONTHLY
$12/month
Billed every month, cancel anytime.
YEARLY
$9/month
Billed $108 annually, cancel anytime.
Checkout for $12/month
Checkout for $108/yr
Secured by Stripe | AES-256 bit encryption
Spark Your Next Big Idea with New Presentation Templates
VIEW ALL Templates
Welcome,
Welcome
Upgrade to SlideStart
Pro
Instant access to 15,000+ slides
Show Featured Only
Checkbox 8
Companies
Mckinsey
Bain
BCG
EY
Deloitte
Accenture
PwC/Strategy&
JP Morgan
Goldman Sachs
Morgan Stanley
Citigroup
Deutsche Bank
Barclays
LEK
Kearney
Oliver Wyman
Booz Allen Hamilton
Gartner
IPSOS
Nielsen
Slide type
Header Horizontal
Framework
Vertical Flow
Single Chart
Single Chart
Text Only
Mixed Chart
Header Vertical
Graphic
Pillar
Multiple Chart
Agenda
Title
Table
Linear Flow
Upgrade to SlideStart
Pro
Instant access to 40+ advanced filters
Industry
Upgrade to SlideStart
Pro
Instant access to 40+ advanced filters
Technology
Healthcare
Financial Services
Consumer Goods
Energy & Utilities
Manufacturing
Retail
E-commerce
Logistics
Telecommunications
Real Estate
Professional Services
Education
Media
Entertainment
Hospitatlity
Tourism
Agriculture
Food Production
Government & Public Sector
Environmental
Sustainability
Use Case
Upgrade to SlideStart
Pro
Instant access to 40+ advanced filters
Sales and Business Development
Mergers and Acquisitions
Corporate Finance and Valuation
Performance Metrics and KPIs
Client Case Studies
Competitive Landscape
Product and Service Analysis
Customer and Market Segmentation
Organizational Structure
Human Resources and Talent Management
Industry Overview
Regulatory and Compliance
Risk Assessment and Management
Agriculture & Food Production
Hospitality and Tourism
Government
Environmental
Sustainability
Clear all
Thank you! Your submission has been received!
Oops! Something went wrong while submitting the form.
Show Featured Only
Checkbox 8
Companies
Mckinsey
Bain
BCG
EY
Deloitte
Accenture
PwC/Strategy&
JP Morgan
Goldman Sachs
Morgan Stanley
Citigroup
Deutsche Bank
Barclays
LEK
Kearney
Oliver Wyman
Booz Allen Hamilton
Gartner
IPSOS
Nielsen
Slide type
Text Only
Linear Flow
Vertical Flow
Single Chart
Header Horizontal
Mixed Chart
Header Vertical
Pillar
Multiple Chart
Graphic
Agenda
Title
Table
Framework
Industry
Technology
Healthcare
Financial Services
Consumer Goods
Energy & Utilities
Manufacturing
Retail
E-commerce
Logistics
Telecommunications
Real Estate
Professional Services
Education
Media
Entertainment
Hospitatlity
Tourism
Agriculture
Food Production
Government & Public Sector
Environmental
Sustainability
Use Case
Sales and Business Development
Mergers and Acquisitions
Corporate Finance and Valuation
Performance Metrics and KPIs
Client Case Studies
Competitive Landscape
Product and Service Analysis
Customer and Market Segmentation
Organizational Structure
Human Resources and Talent Management
Industry Overview
Regulatory and Compliance
Risk Assessment and Management
Agriculture & Food Production
Hospitality and Tourism
Government
Environmental
Sustainability
Clear all
Thank you! Your submission has been received!
Oops! Something went wrong while submitting the form.
Tag
View slide
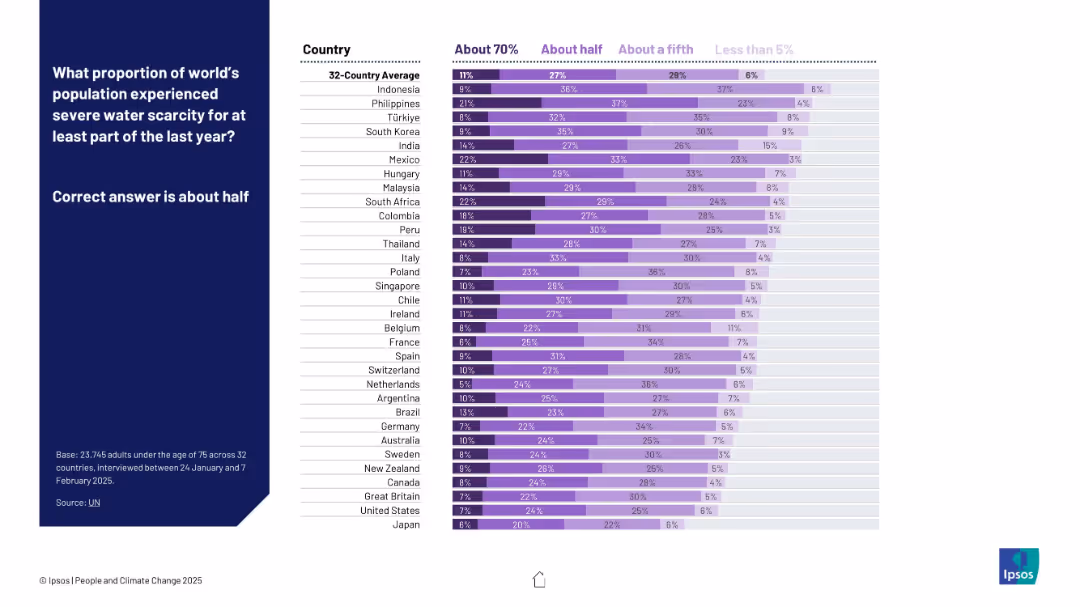
A horizontal bar chart with country names on the left and four response categories on the right, shaded in gradients of purple. A dark blue sidebar on the left presents the key question and correct answer.
Market Analysis and Trends
Environmental Services & Sustainability
The slide displays survey data from 32 countries, asking respondents about their perception of global water scarcity. It visually compares public estimates with the actual fact that about half the world experienced severe water scarcity in the past year.
water scarcity, perception, survey, climate, Ipsos, global, awareness, bar chart, countries, UN data
false
What proportion of world’s population experienced severe water scarcity...?PEOPLE AND CLIMATE CHANGE
Mixed Chart
IPSOS
View slide
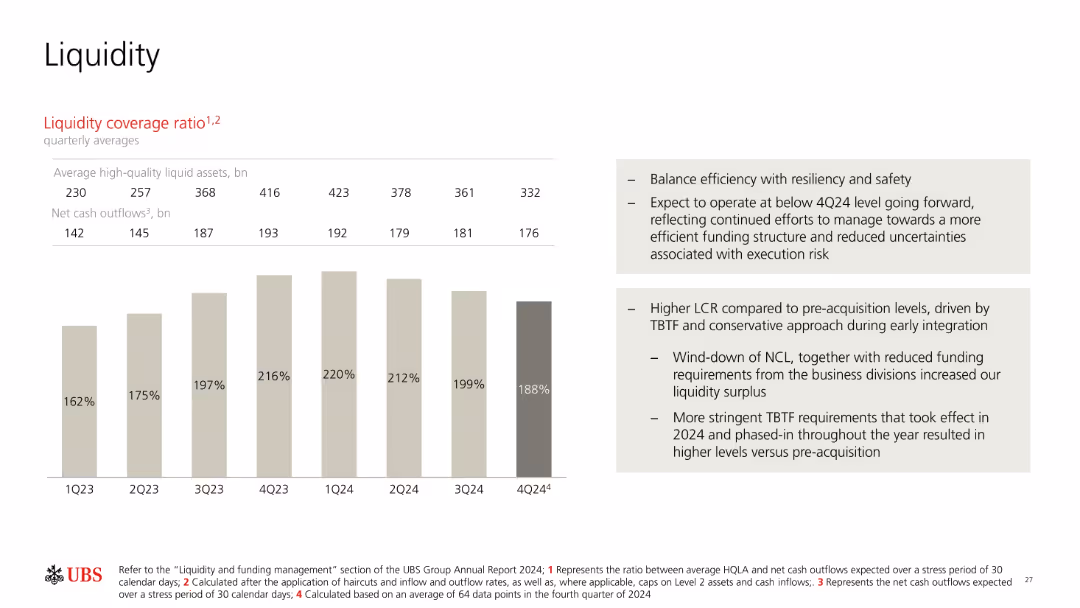
Bar chart showing liquidity coverage ratio (LCR) over 8 quarters; includes two text blocks explaining context and future expectations. Neutral color palette.
Risk Assessment and Management
Financial Services
Tracks UBS’s LCR over time from 1Q23 to 4Q24, noting shifts in liquid assets and net cash outflows. Provides interpretation regarding resilience, funding structure optimization, and higher post-acquisition LCRs due to regulatory requirements and risk management priorities.
LCR, liquidity, cash outflows, risk, funding structure, resilience
false
LiquidityFull-year and fourth quarter 2024 Fixed Income investor presentation
Mixed Chart
UBS
View slide
Slide includes multiple column charts displaying sector-specific data.
Market Analysis and Trends
Consumer Goods
Provides a comprehensive overview of the global luxury market in 2019, highlighting growth across various sectors like personal luxury goods and fine dining.
global market, luxury sectors, 2019, growth
false
GLOBAL LUXURY MARKETS REACHING ~€1,3T, WITH 4% GROWTH IN 2019 AT CONSTANT EXCHANGE RATESBAIN-ALTAGAMMA 2019 WORLDWIDE LUXURY MARKET MONITOR
Single Chart
Bain
View slide
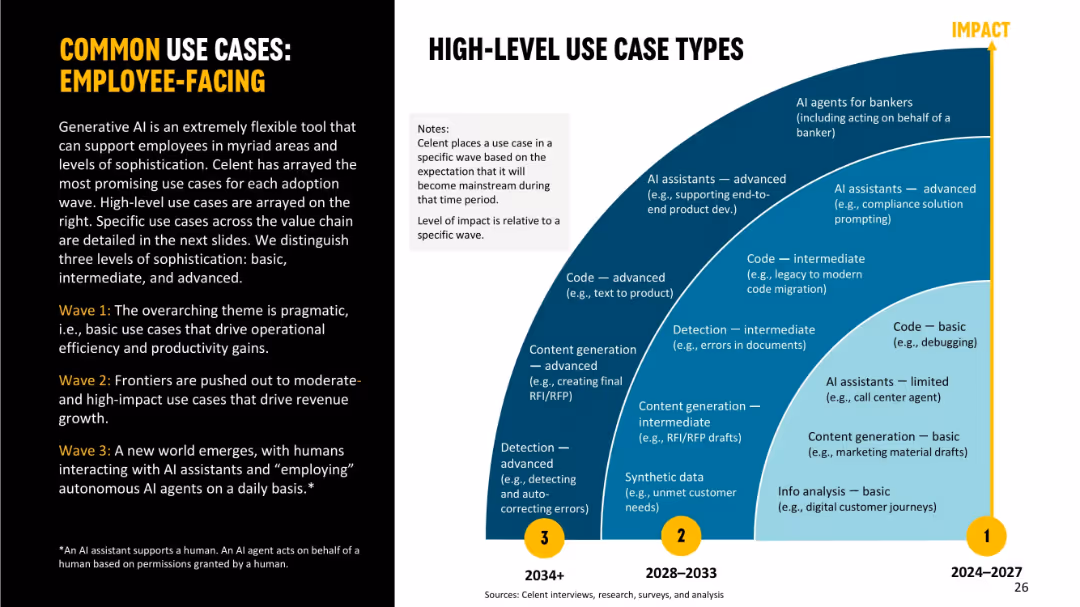
Left panel with wave description text and right semi-arch visual segmented into use case levels (basic → advanced). Use case types positioned by wave and impact.
Human Resources and Talent Management
Financial Services
Focuses on employee-facing GenAI applications over three waves. Wave 1 is basic efficiency use (e.g., debugging); Wave 2 introduces intermediate applications like document detection and code migration; Wave 3 features advanced AI agents acting on behalf of humans. Emphasizes transformation of employee tasks via increasing AI integration.
employee-facing, use cases, GenAI, code, detection, AI assistant, automation, productivity
false
COMMON USE CASES: EMPLOYEE FACINGGenerative AI Making Waves
Mixed Chart
Oliver Wyman
View slide
A bar chart comparing Millennials and Gen Z on financial responsibility, with various metrics such as budgeting, knowledge level, and financial goals.
Financial Performance
Financial Services
The slide highlights the financial responsibility of Millennials and Gen Z, comparing their budgeting habits, knowledge, and financial goal setting.
Financial responsibility, Millennials, Gen Z, budgeting, financial knowledge, financial goals, comparison, financial habits
false
Millennials and Gen Zs are financially responsibleThe Deloitte Global Millennial Survey 2020
Mixed Chart
Deloitte
View slide
Provides detailed demographics of survey respondents using pie charts, column and bar charts, set against a simple background to enhance readability.
Human Resources and Talent Management
Professional Services
Details the demographics and parameters of a global survey concerning AI, including roles, company revenue, and employee count.
survey, demographics, global, AI, respondents
false
Survey parameters 12,898 respondentsAI at Work: What People Are Saying
Multiple Chart
BCG
View slide
This slide combines a comprehensive text description with a flowing graphic depicting a wave, which symbolizes growth and profitability. The design employs shades of blue and white, conveying a sense of clarity and forward movement.
Market Analysis and Trends
Technology & Software
Offering a detailed analysis of e-commerce trends, this slide argues for persistent growth in SEA despite a shift back to offline shopping, with a focus on profitability. It’s insightful for discussions on market dynamics, particularly for strategizing around customer retention, value-add services, and adapting to evolving consumer preferences.
e-commerce, SEA, growth trends, offline shopping, profitability, market analysis, consumer behavior
false
E-commerce: Persistent growth despite resumption of offline shopping and greater focus on profitabilitye-Conomy SEA 2022 Through the waves, towards a sea of opportunity
Single Chart
Bain
View slide
The slide contains a line chart showing the Mood Monitor scores for Gen Zs and Millennials from 2019 to 2022. The layout includes a description of the Mood Monitor index and the questions used to gauge respondents' mood.
Performance Metrics and KPIs
Technology & Software
The slide tracks the Mood Monitor scores for Gen Zs and Millennials, indicating their optimism levels about economic, social/political, personal finance, environmental, and business outlooks over the years, showing a general decline in optimism.
Mood Monitor, Gen Z, Millennials, optimism, economic outlook
false
Mood MonitorDeloitte Gen Z and Millennial Survey 2022
Mixed Chart
Deloitte
View slide
A column chart showing the reduction in cost per private transaction over time, with significant drops from the prototype stage to Nightfall introduction and further with batching. Includes bullet points about the technological progress and regulatory compliance features.
Technology and Digital Transformation
Technology & Software
Details the technological advancements made in reducing transaction costs on public blockchains, highlighting significant milestones and the role of regulatory compliance.
Technological progress, private transactions, business agreements, public blockchains, cost reduction, regulatory compliance
false
Finally, we made enormous technological progress in 2019 around enabling private transactions and business agreements on public blockchainsGoing Public EY Global Blockchain Summit 2020
Mixed Chart
EY
View slide
Contains line charts and column charts comparing sovereign bond yields and credit default swap spreads for various countries and regions.
Financial Performance
Financial Services
Displays sovereign bond yields for a 10-year maturity period and credit default swap spreads across different countries and regions.
sovereign bonds, yields, spreads, countries
false
Sovereign bond yieldsGuide to Investing in Asia
Multiple Chart
JP Morgan
View slide
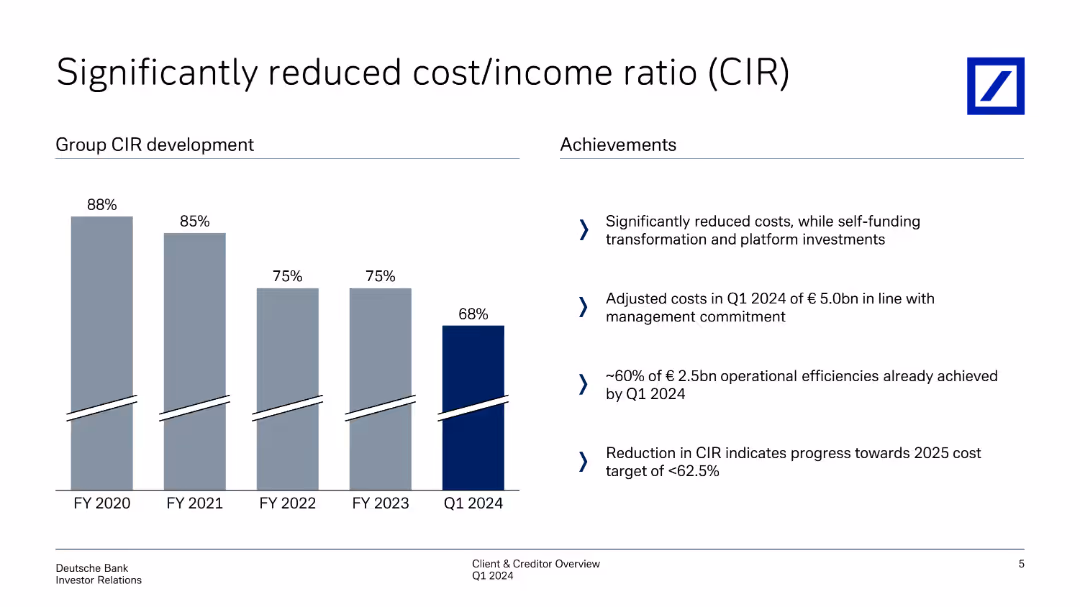
This slide shows column charts depicting the development of cost/income ratio (CIR) over fiscal years, with achievements listed on the right side.
Operational Efficiency
Financial Services
Analyzes the significant reduction in cost/income ratio over time, detailing operational efficiencies and management strategies that contributed to the reduction.
cost/income ratio, CIR, operational efficiency, cost reduction, management strategies
false
Significantly reduced cost/income ratio (CIR)Client & Creditor Overview May, 2024
Mixed Chart
Deutsche Bank
View slide
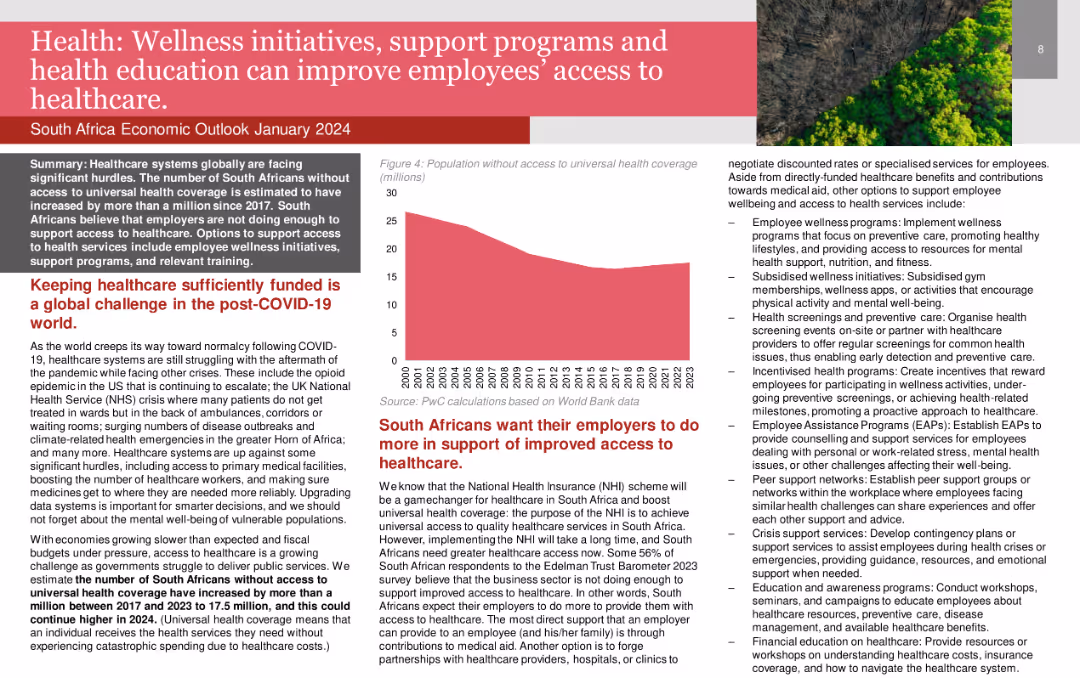
The slide contains a title in a red banner, multiple text boxes with detailed content, and a column chart displaying population without access to universal health coverage over time. The layout is dense with information.
Human Resources and Talent Management
Healthcare & Pharmaceuticals
The slide discusses the importance of wellness initiatives, support programs, and health education in improving employee access to healthcare. It highlights the challenges faced in keeping healthcare sufficiently funded and the role employers can play.
wellness, healthcare, employee support, health education, funding
false
Health: Wellness initiatives, support programs and health education can improve employees’ access to healthcare.South Africa Economic Outlook 2024 Turning short-term crises into opportunities for business value creation and societal impact.
Mixed Chart
PwC/Strategy&
View slide
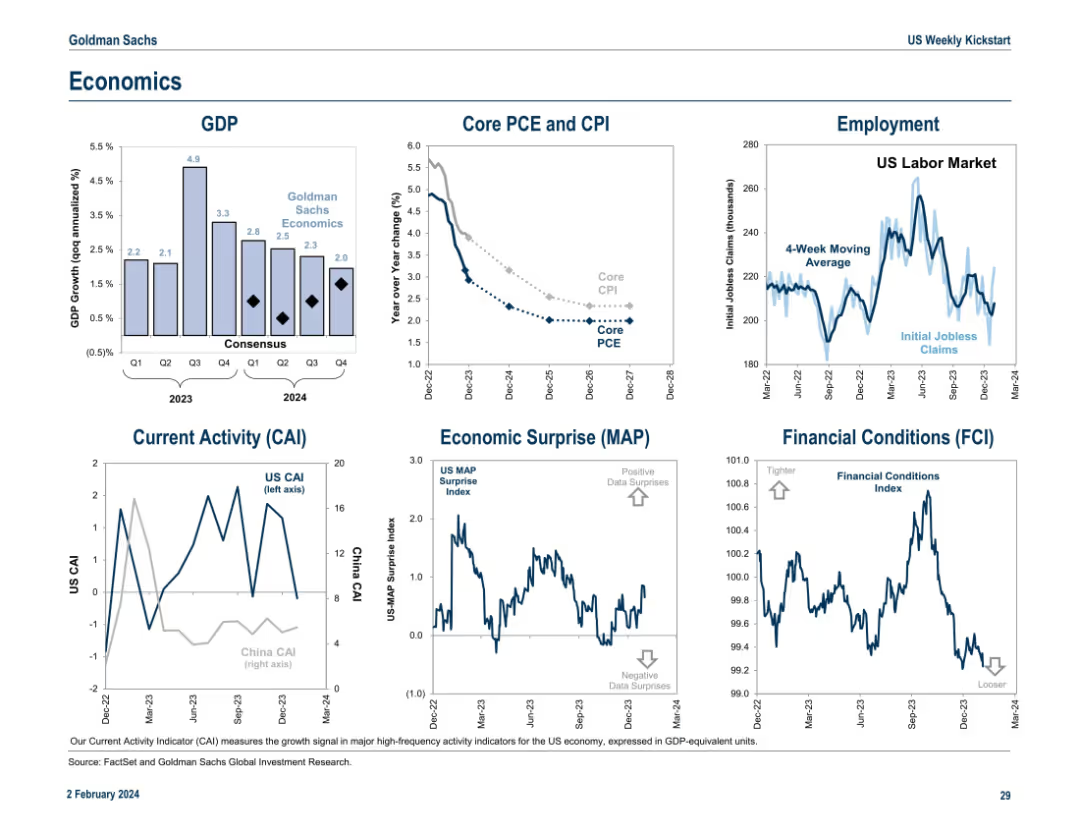
Six-chart grid layout covering GDP, inflation, labor market, current activity, economic surprises, and financial conditions. Well-annotated with labels and projections.
Industry Overview
Government & Public Sector
This slide compiles major macroeconomic indicators impacting the US economy, including GDP growth forecasts, inflation trends (CPI, PCE), labor market stats, activity indices, and financial conditions. It's intended to show broad economic health and expectations from both U.S. and global angles.
GDP, inflation, labor market, financial conditions, activity index
false
EconomicsUS Weekly Kickstart Fate of the ‘Magnificent 7’ stocks depends on their ability to deliver rapid revenue growth in 2024
Multiple Chart
Goldman Sachs
View slide
A column chart showing year-over-year percentage change in headline CPI from 2022 to 2025F for global and various regions including the US, Euro area, UK, Japan, China, India, LatAm, ASEAN, MENA, and SSA.
Market Analysis and Trends
Financial Services
The slide forecasts continued disinflation across most economies in 2024, assuming soft demand growth and steady supply conditions.
disinflation, CPI, economic forecast, 2024, demand growth, supply conditions
false
Disinflationary momentum should continue across most economies in 2024 assuming soft demand growth and rebounding to steady supply conditionsGlobal economic outlook: finding balance in 2024
Single Chart
EY
View slide
A simple text-based layout listing topics: industry overview, investment themes, and value chain segmentation.
Operational Efficiency
Agriculture & Food Production
This agenda slide outlines the main topics of the presentation, serving as a navigation guide for the discussion on the crop market.
agenda, crop market, industry overview, investment themes, value chain
false
Agenda: Crop market value chain segmentationEY-Parthenon Perspectives: Investing in the agricultural crop industry
Agenda
EY
View slide
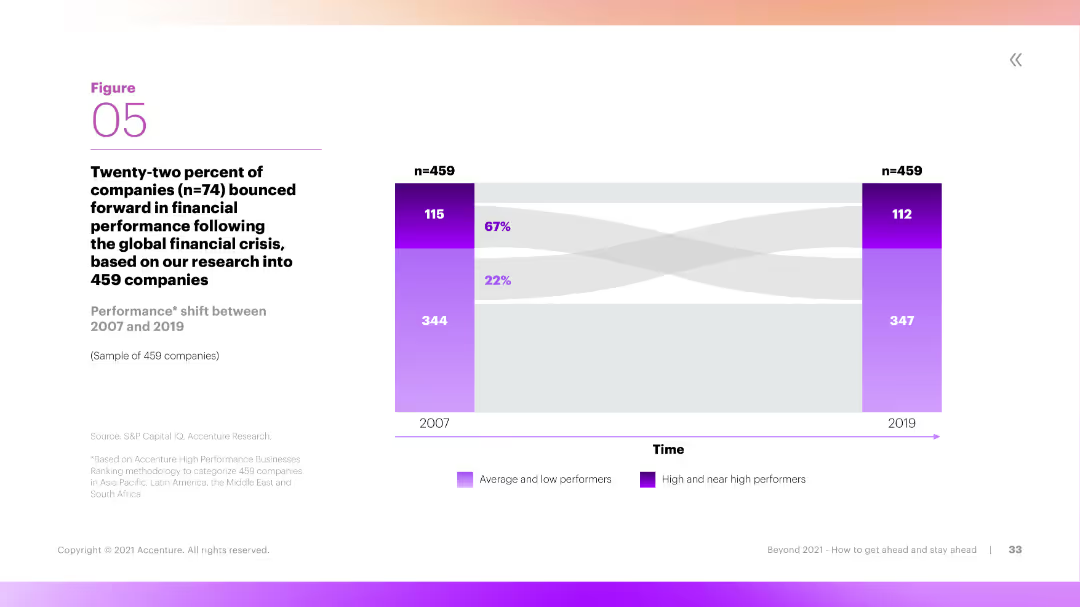
This slide includes a Sankey diagram showing the performance shift of companies between 2007 and 2019. The diagram is color-coded to differentiate between average, low, and high performers, with clear labels and flow directions.
Performance Metrics and KPIs
Financial Services
The slide illustrates the performance shift of companies over time, showing how many transitioned from low or average performance to high performance between 2007 and 2019. It provides insights into long-term financial performance trends.
Performance, Shift, Companies, Long-Term, Trends
false
Twenty-two percent of companies (n=74) bounced forward in financial performance following the global financial crisis,Beyond 2021: How to Get Ahead and Stay Ahead
Mixed Chart
Accenture
View slide
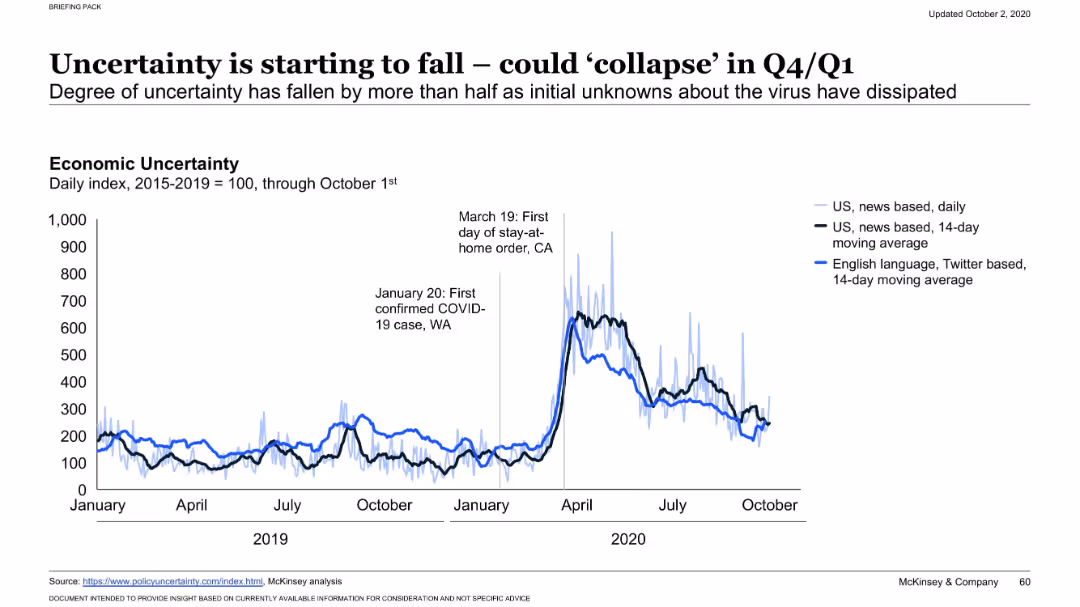
Time series line chart displaying economic uncertainty indices (news-based and Twitter-based) from 2019 to October 2020. Includes key event markers (first COVID case, stay-at-home order).
Risk Assessment and Management
Financial Services
Shows how economic uncertainty, driven by COVID-19 developments, peaked in early 2020 but has since decreased. Multiple data sources (news, social media) illustrate public sentiment, with annotations of major events for context.
economic uncertainty, COVID-19, sentiment index, market volatility, risk perception, trend analysis, news impact, public reaction, confidence indicators, timeline
false
Uncertainty is starting to fall –could ‘collapse’ in Q4/Q1COVID-19: Briefing materials
Single Chart
McKinsey
View slide
Bar chart showing the percentage of "Yes" responses regarding HR information system adoption across various sectors.
Human Resources and Talent Management
Professional Services
Explores the adoption rate of HR information systems across different sectors.
HR, information system, adoption, sectors, rate
false
Respondents’ having an HR information systemHR Pulse Survey Presentation of results
Multiple Chart
PwC/Strategy&
View slide
The slide contains a combination of text and graphics, including a timeline, key point markers, and a column chart depicting the trend in Russia exposure. The color blue is prominently used for graphical elements, signifying different aspects of exposure and impacts.
Risk Assessment and Management
Financial Services
This slide provides an update on the bank's financial exposure in Russia, outlining the implications of currency fluctuations, client activities, and strategic decisions made over several quarters. It is vital for investors and analysts monitoring geopolitical risks.
Russia Exposure, Financial Analysis, Geopolitical Risk, Currency Fluctuation, Strategic Decisions, Investors, Analysts, Risk Management
false
Update on Russia ExposureEarnings Results Presentation Second Quarter 2023
Mixed Chart
Citigroup
View slide
A split bar graph on the right shows the percentage of metro versus non-metro digital consumers. The left side of the slide has a large title and a descriptive text. The top-right corner has the same light blue overlay text as slide 1412.
Market Analysis and Trends
Technology & Software
Highlights the surge in new digital consumers from non-metro areas, providing insights into market segmentation and potential areas for expansion in the internet economy.
non-metro, internet economy, digital consumers, segmentation, market analysis, adoption rates
false
The pandemic has been a catalyst for existing digital users to adopt new online services and increase their frequency of use and spend in these services.e-Conomy SEA 2021 Roaring 20s: The SEA Digital Decade
Single Chart
Bain
View slide
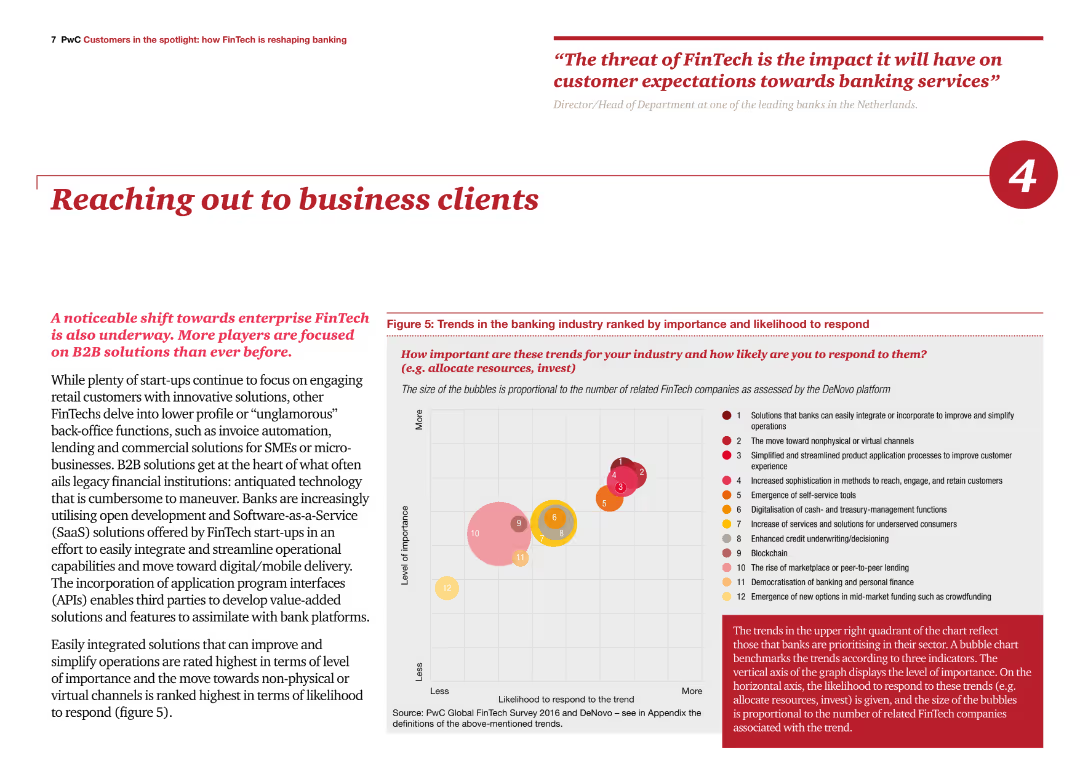
The slide includes a bubble chart ranking trends in the banking industry by importance and likelihood to respond. Text on the left discusses the focus on B2B solutions and their impact on business clients.
Sales and Business Development
Financial Services
The slide highlights the importance of B2B solutions in the FinTech industry, ranking various trends and emphasizing the need for banks to adopt these solutions to improve operations and client engagement.
FinTech, B2B solutions, trends, business clients, engagement
false
Reaching out to business clientsCustomers in the spotlight How FinTech is reshaping banking
Mixed Chart
PwC/Strategy&
View slide
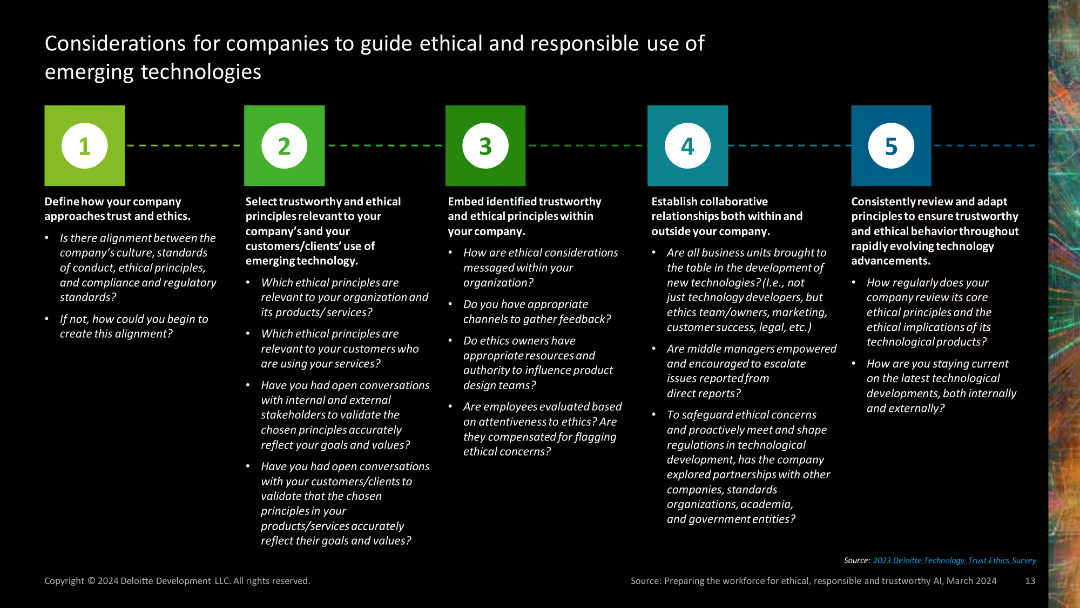
This slide contains five distinct sections, each represented by a colored number icon and text outlining considerations for ethical and responsible technology use. The layout is clear and structured with bullet points.
Regulatory and Compliance
Technology & Software
It outlines five key considerations for companies to guide ethical and responsible use of emerging technologies, covering alignment of ethics, trust principles, embedding ethics, collaboration, and adaptation.
ethics, responsible, principles, collaboration, adaptation
false
Considerations for companies to guide ethical and responsible use of emerging technologiesTechnology Trust Ethics Preparing the workforce for ethical, responsible, and trustworthy AI: C-suite perspectives
Linear Flow
Deloitte
View slide
The slide presents a table with multiple columns and rows detailing material-based technologies for hydrogen conversion, including their density, energy input, process maturity, advantages, and disadvantages. It uses color coding to differentiate technology advantages (Low, Medium, High).
Market Analysis and Trends
Energy & Utilities
This slide offers a comprehensive comparison of various hydrogen conversion and reconversion technologies. It includes key metrics like density, energy input, and process maturity, along with a summary of advantages and disadvantages for each technology.
Hydrogen, Conversion, Technology, Energy, Advantages
false
H2 conversion and reconversion key factsHydrogen applications and business models
Table
Kearney
View slide
The slide contains two column charts comparing the upstream emissions of the metals industry in the US and India by various sources. It is visually rich.
Market Analysis and Trends
Industrial & Manufacturing
This slide compares the upstream emissions in the metals industry between the United States and India, detailing emissions by different sources and tiers.
Metals industry, upstream emissions, US, India, source comparison, environmental impact, sustainability, column charts, data visualization, emission sources
false
Figure 8: Metals industry upstream emissions, United States and IndiaThought you knew the Scope 3 issues in your supply chain? Think again.
Multiple Chart
Accenture
View slide
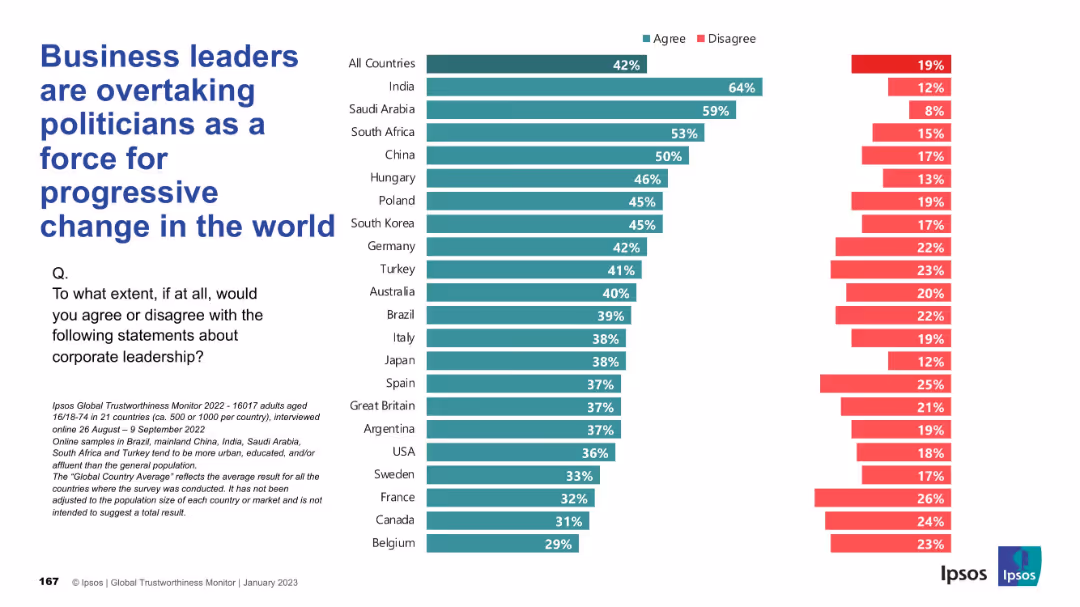
Same design as previous slides with vertical country list and agree/disagree bar chart; teal for "Agree", red for "Disagree".
Market Analysis and Trends
Government & Public Sector
This slide explores the perception that corporate leaders are becoming more progressive change agents than politicians. Agreement is highest in India and Saudi Arabia, showing a trend of growing corporate influence.
corporate influence, progressive change, politics, public perception, Ipsos, leadership, governance, reform
false
Business leaders are overtaking politicians as a force for progressive change in the worldIPSOS GLOBAL TRUSTWORTHINESS MONITOR January 2023
Mixed Chart
IPSOS
View slide
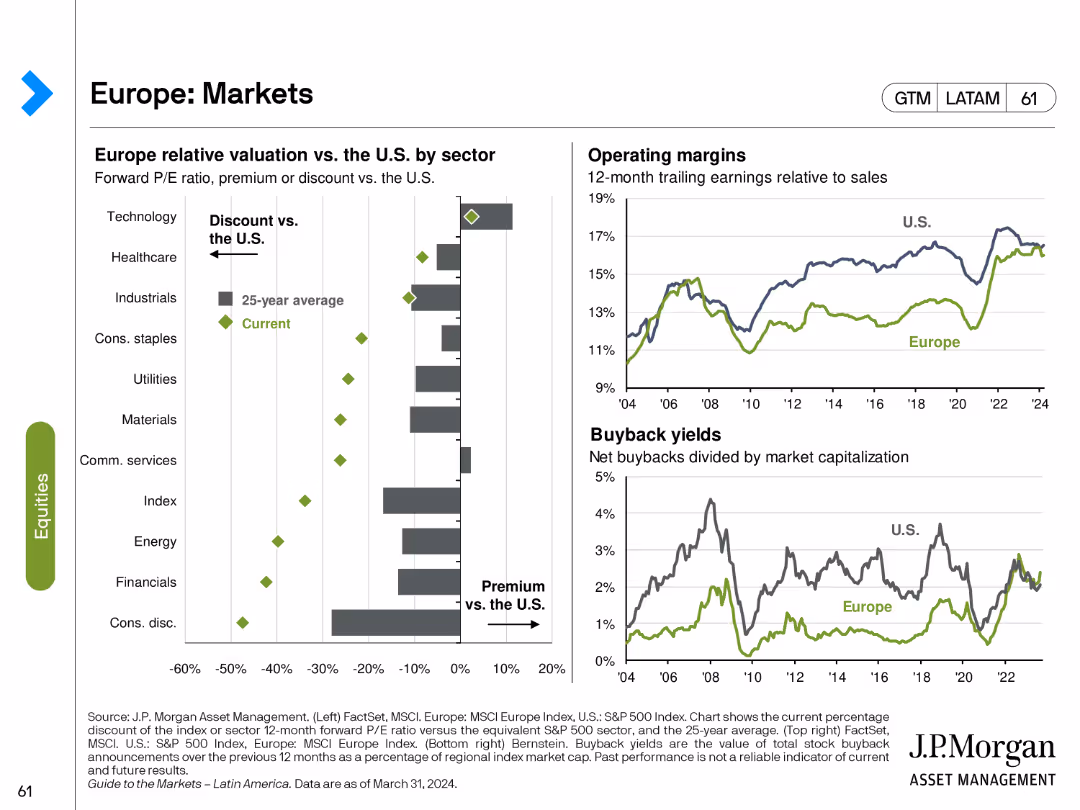
The slide features a bar chart showing Europe relative valuation vs. U.S. by sector, and two line charts depicting operating margins and buyback yields.
Market Analysis and Trends
Financial Services
This slide analyzes the European market, focusing on sector valuations relative to the U.S., as well as operating margins and buyback yields over time.
Europe, markets, sector valuation, operating margins, buyback yields
false
Europe: MarketsGuide to the Markets Latin America | 2Q 2024
Multiple Chart
JP Morgan
View slide
Table format showing countries and their vaccination priority status for different groups such as healthcare workers and elderly, marked with green check icons.
Strategic Planning
Healthcare & Pharmaceuticals
Lists countries and their strategies for prioritizing vaccine distribution among key demographic groups, indicating official guidelines and advisory recommendations.
vaccine distribution, priorities, countries, healthcare workers, elderly
false
Many countries plan to prioritize healthcare workers, elderly, and people with comorbiditiesCOVID-19 BCG Perspectives State of the World
Table
BCG
View slide
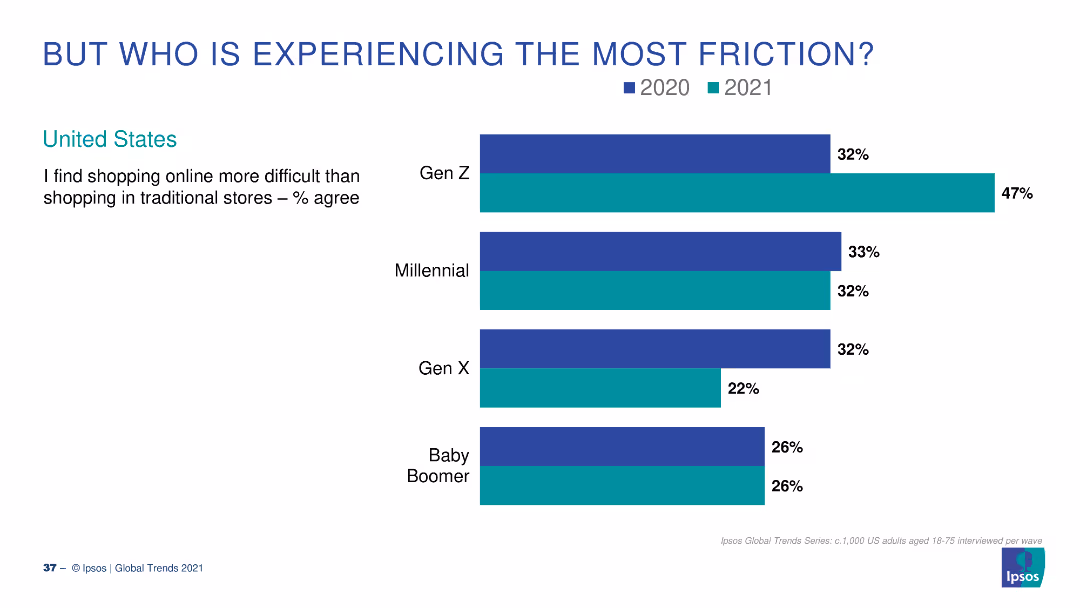
A column chart showing percentages of different generational groups in the US who find online shopping more difficult than traditional shopping for the years 2020 and 2021.
Market Analysis and Trends
Retail & E-commerce
This slide compares the percentage of various generational groups in the US who found online shopping more difficult in 2020 and 2021, focusing on Gen Z, Millennials, Gen X, and Baby Boomers.
generations, online shopping, friction, US, survey
false
BUT WHO IS EXPERIENCING THE MOST FRICTION?GLOBAL TRENDS 2021 Aftershocks and continuity
Single Chart
IPSOS
View slide
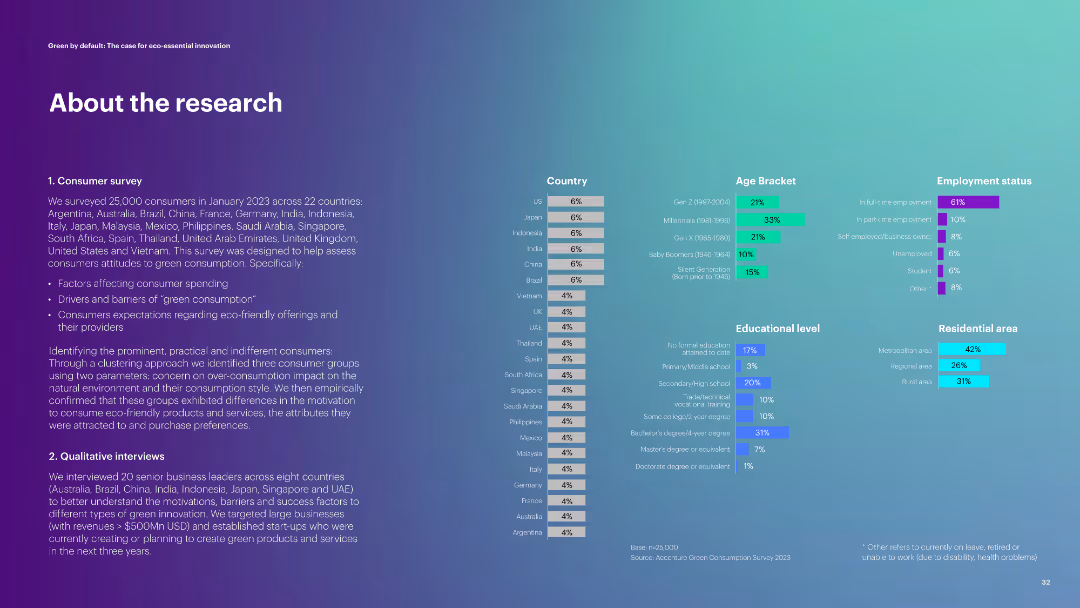
The slide has a purple gradient background with white text. It includes a detailed breakdown of a survey
Market Analysis and Trends
Consumer Goods
It details a consumer survey conducted across 22 countries and qualitative interviews with business leaders
Survey, Consumer Research, Demographics, Green Consumption, Interviews
false
About the research 1. Consumer surveyGreen by Default
Multiple Chart
Accenture
View slide
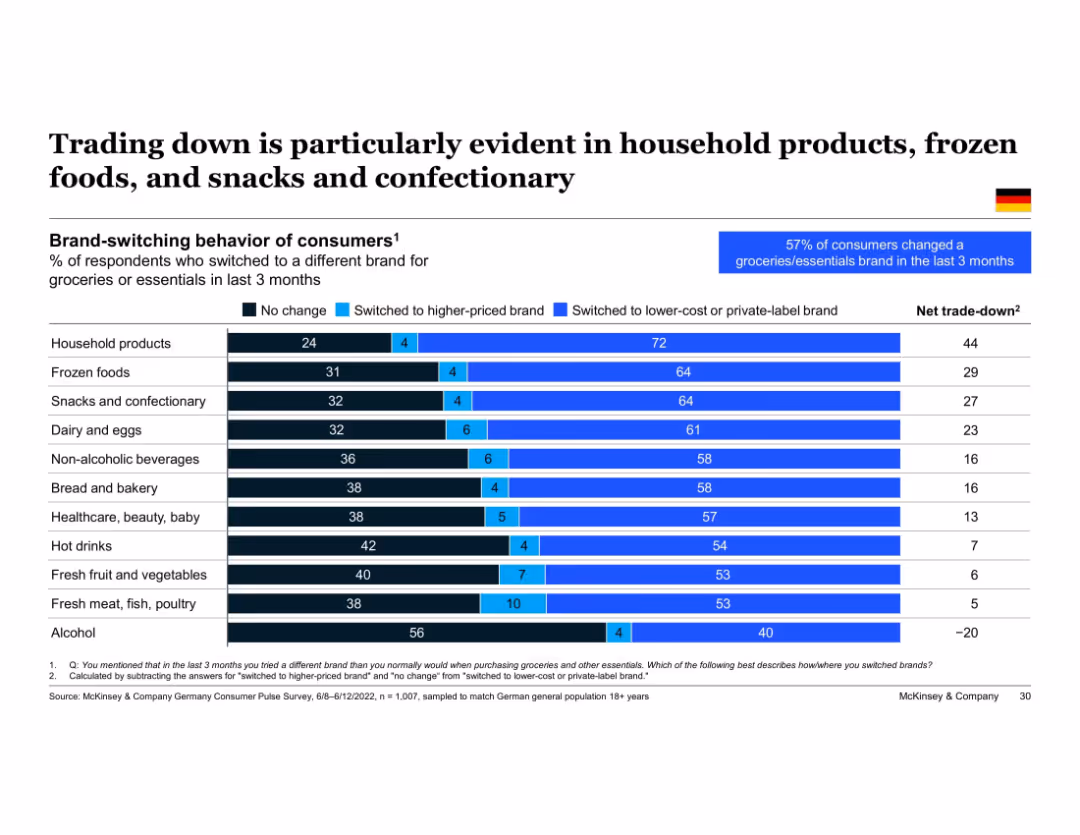
Horizontal bar chart showing brand-switching trends across product categories; dark blue (no change), light blue (switch down), and medium blue (switch up) bars; Germany focus
Product and Service Analysis
Retail & E-commerce
Consumers are switching to lower-cost or private-label brands, especially in household products and food categories. The slide quantifies net "trade-down" behaviors, with the strongest trend seen in household products and frozen food. Alcohol shows the opposite pattern with a net trade-up.
trade-down, brand switching, private label, frozen food, snacks, household products, consumer behavior, Germany
false
Trading down is particularly evident in household products, frozen foods, and snacks and confectionaryEuropean Consumer Sentiment Survey: How current events in Europe are shaping consumer behavior
Single Chart
McKinsey
View slide
A column chart showing the top marketing objectives for the next year, ranked by importance. The chart uses circles of varying sizes to represent different objectives like brand awareness, customer retention, and advocacy.
Market Analysis and Trends
Media & Entertainment
This slide identifies the top marketing objectives for the next year, with brand awareness being the most important. It highlights the relative importance of other objectives like customer retention and advocacy in different regions.
Objectives, Marketing, Awareness, Retention, Advocacy
false
Driving brand awareness has never been more importantEra of alignment
Mixed Chart
Nielsen
View slide
The slide features a column chart with main reasons for investing in cyber security.
Market Analysis and Trends
Technology & Software
The slide details various reasons companies invest in cyber security, with a focus on business continuity and compliance.
cyber security, investment, business continuity, compliance, regulation, reputation, data protection
false
Captains of IndustryMARKET DATA FROM SECONDARY SOURCES
Single Chart
IPSOS
View slide
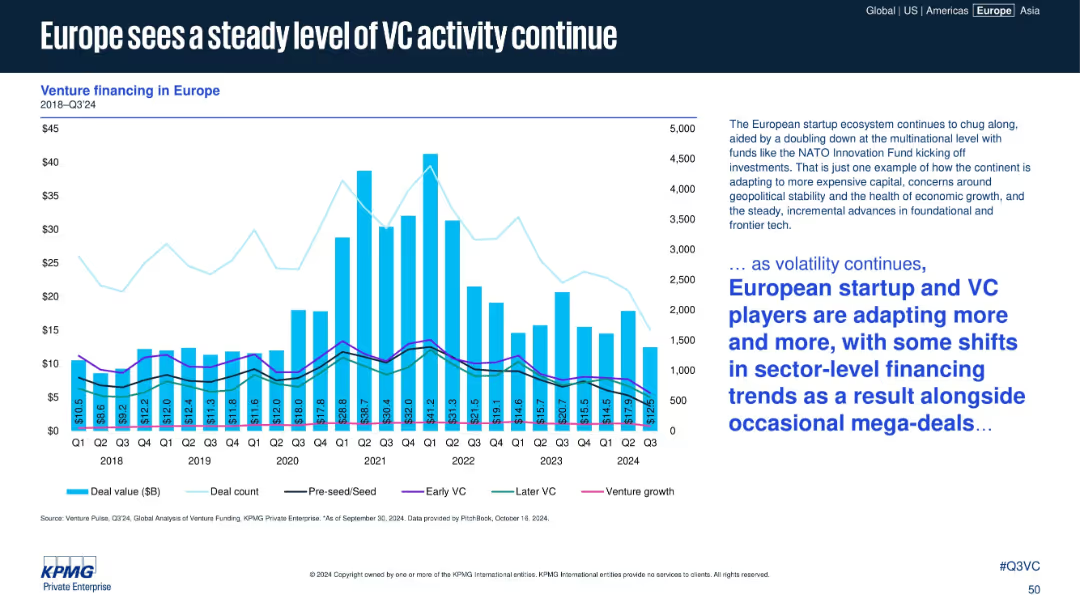
Bar and line chart combination on left, right-side text block with summary insights in blue and black font
Market Analysis and Trends
Financial Services
This slide highlights trends in venture financing in Europe from 2018 to Q3 2024. It presents deal value, deal count, and stage-wise VC activity. Commentary notes that the ecosystem remains stable despite macro volatility and sectoral shifts.
Venture capital, Europe, deal value, startup funding, financing trends
false
Europe sees a steady level of VC activity continueVenture Pulse Q3 2024
Mixed Chart
KPMG
View slide
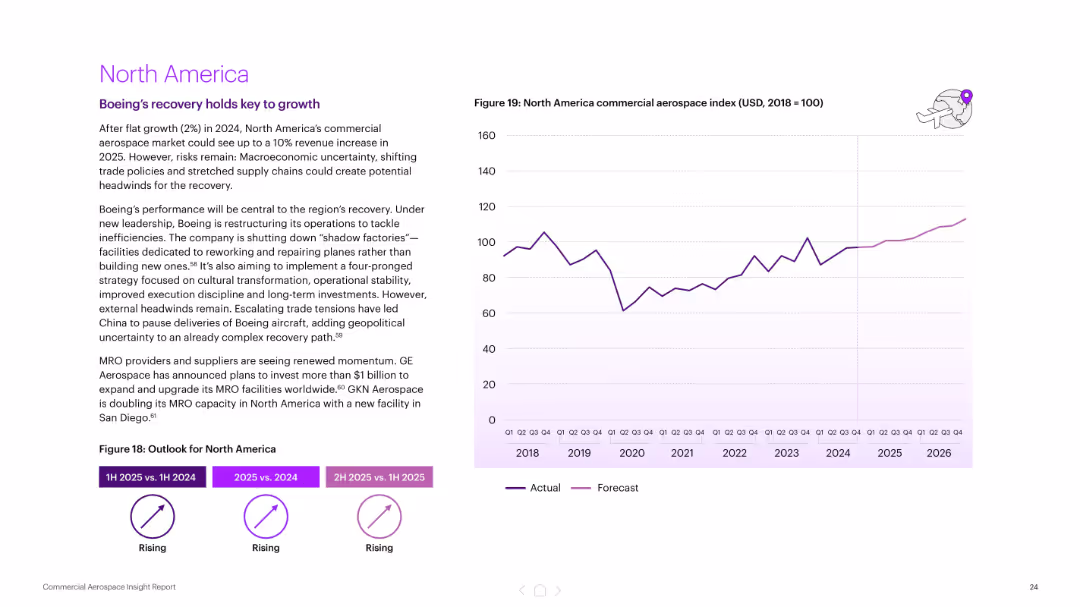
Left text with outlook and summary; right features a line chart (actual and forecast) of commercial aerospace index (2018–2026). Purple highlights.
Market Analysis and Trends
Industrial & Manufacturing
Describes North America’s modest recovery in aerospace, driven by Boeing's restructuring and renewed MRO investment. Notes risks from macroeconomics and trade. Forecasted 10% revenue growth for 2025.
North America, aerospace index, Boeing, recovery, forecast, MRO investment, commercial aviation, trade risks
false
North AmericaNavigating uncertain skies Commercial Aerospace Insight Report
Mixed Chart
Accenture
View slide
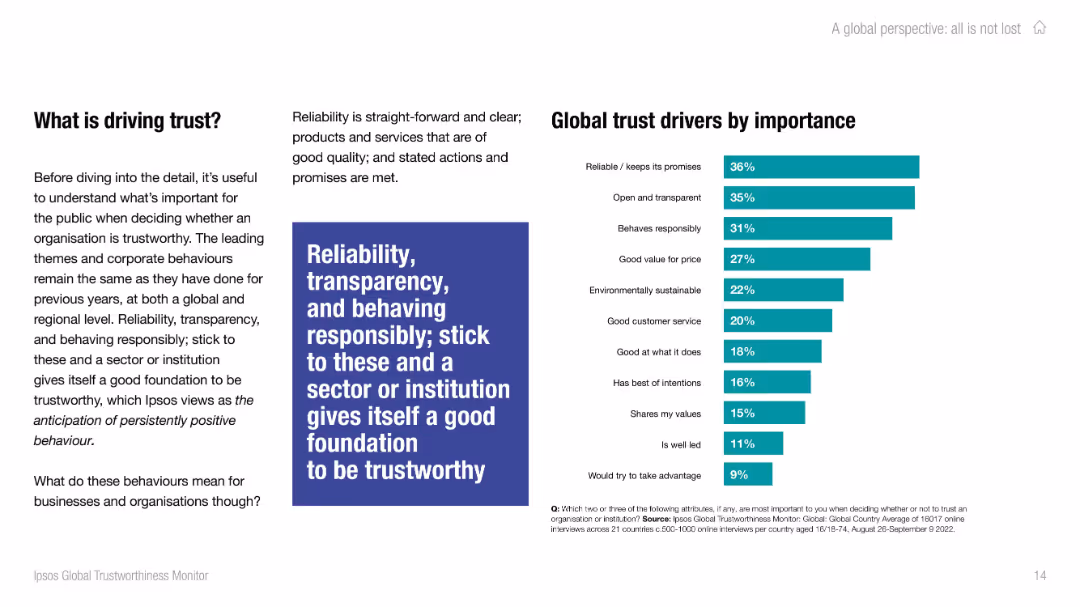
Split layout: left column with explanatory text; right column shows a bar chart ranking trust drivers. A large quote box emphasizes reliability.
Strategic Planning
Professional Services
The slide discusses key attributes that drive trust in organizations, with reliability, transparency, and responsibility as top contributors. A bar chart quantifies the importance of each attribute according to public opinion. It emphasizes actionable principles to build institutional trust.
trust drivers, public opinion, reliability, transparency, organizational behavior, trust foundation, trust strategy
false
What is driving trust?IPSOS GLOBAL TRUSTWORTHINESS MONITOR
Mixed Chart
IPSOS
View slide
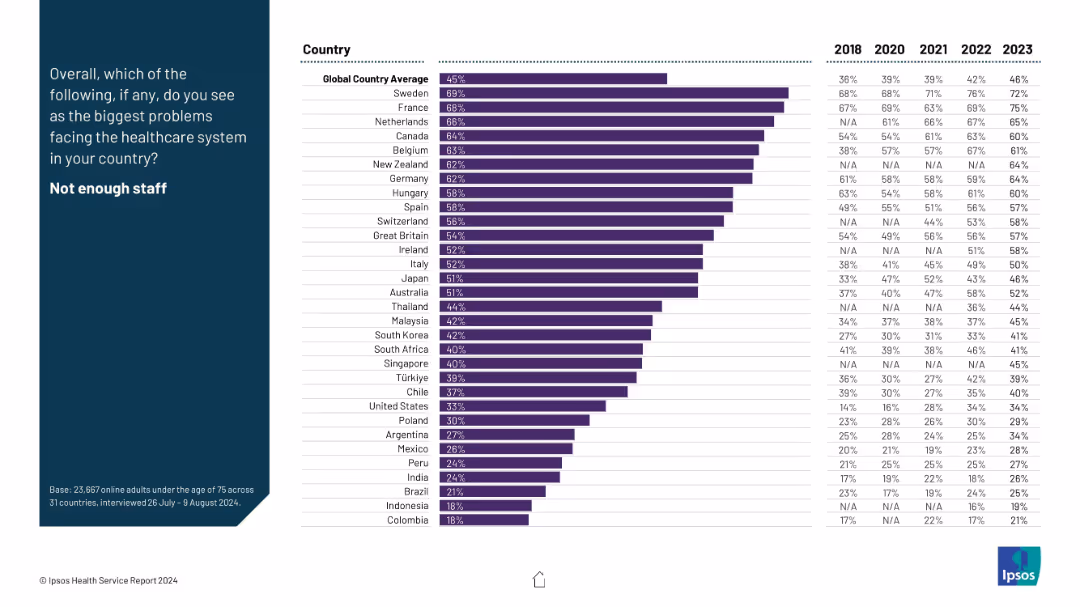
Horizontal bar chart with country-level data on perceived healthcare staffing shortages; includes 2018–2023 comparison.
Risk Assessment and Management
Healthcare & Pharmaceuticals
This slide addresses the global perception of healthcare staffing shortages. Country-specific agreement percentages are visualized alongside year-on-year trend data, highlighting increasing concerns in several regions, notably Sweden and France.
staffing shortages, healthcare personnel, public opinion, trends, Ipsos, health workforce, system issues, global sentiment
false
Not enough staffIPSOS HEALTH SERVICE REPORT 2024
Mixed Chart
IPSOS
View slide
Multiple column charts showing economic expectations per industry, including automotive, aerospace & defense, industrial products, chemicals/pharma, consumer goods, and financial services.
Market Analysis and Trends
Financial Services
The slide provides a detailed view of economic expectations across various industries, with a focus on the high percentage of leaders in the automotive sector anticipating an economic downturn in 2019. It contrasts these expectations with those from other industries, offering a comprehensive overview of sector-specific economic outlooks.
Economic Downturn, Industry Expectations, 2019
false
Especially leaders from the Automotive industry (>90%) expect an economic downturn for 2019 Other industries show a mixed picture10th Operations Efficiency Radar
Multiple Chart
Roland Berger
View slide
Text-heavy slide with headings and subheadings, outlining the document's objectives and leadership guidance.
Industry Overview
Government & Public Sector
Summarizes the global impact of COVID-19 and the need for an integrated response from leaders across sectors.
COVID-19, Health Crisis, Leadership, Integrated Response, Societal Impact
false
COVID-19 BCG Perspectives: Objectives of this documentCOVID-19 BCG Perspectives Series Global Restart: Key Dynamics
Text Only
BCG
View slide
The slide includes multiple pie charts and bar graphs showing various factors causing supply chain disruptions, such as logistics delays and input cost increases.
Operational Efficiency
Transportation & Logistics
The slide analyzes the significant supply chain disruptions faced by local organizations due to logistics delays, input cost increases, and labor shortages.
supply chain, logistics delays, input costs, disruptions, local organizations
false
Logistics-related delays and increasing input costs have been a major source of supply chain disruptions for local organizationsHow will you reframe your future?
Mixed Chart
EY
View slide
This slide features a flowchart with color-coded sections indicating different stages of a family law case process, accompanied by icons and a timeline.
Strategic Planning
Government & Public Sector
The slide outlines a future case management system for family law, suggesting improvements in process flow, aiming to expedite resolution and reduce litigation costs.
case management, family law, process improvement, timeline, flowchart, mediation, adjudication
false
A potential approach to family law case managementReview of efficiency of the operation of the federal courts
Diagram
PwC/Strategy&
View slide
A collection of column charts and feedback statements evaluating the pace of governmental reforms and sentiments towards governmental actions in France.
Regulatory and Compliance
Government & Public Sector
Analyzes opinions on the pace and effectiveness of governmental reforms in France, including insights into public sentiment and expectations from business leaders.
reforms, France, government, pace, public opinion
false
The pace of reforms is considered good by respondents, but they are divided on the presidential and governmental determination to succeedAmCham – Bain Barometer 19th Edition
Multiple Chart
Bain
View slide
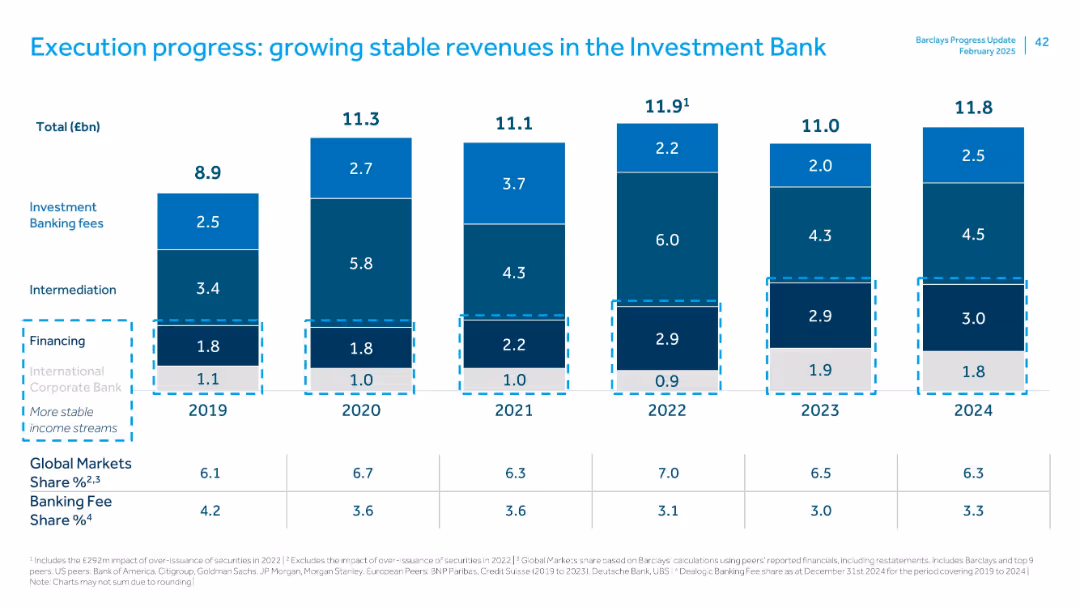
Stacked bar chart with segments labeled by revenue sources from 2019–2024. Color-coded by segment.
Financial Performance
Financial Services
Demonstrates stable investment bank revenue sources (fees, intermediation, financing) across 6 years. Shows relative share of Global Markets and Banking Fees across peer groups. Highlights consistent revenue contributions and peer comparisons.
investment bank, fees, financing, intermediation, peer comparison, revenue stability
false
Execution progress: growing stable revenues in the Investment BankFY 2024 Results Presentation
Single Chart
Barclays
View slide
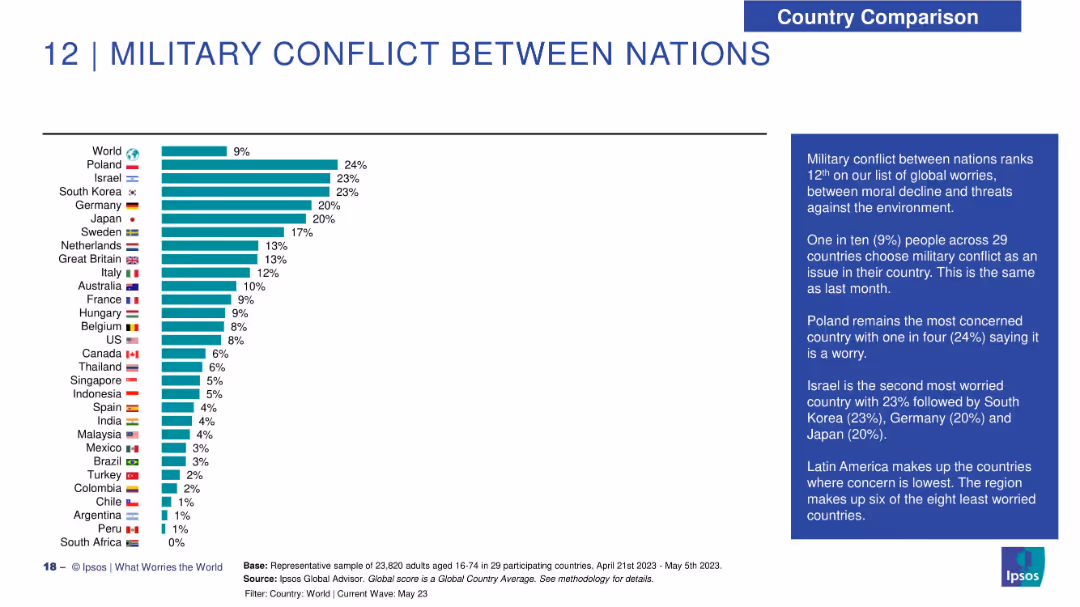
Bar chart of countries worried about military conflict; right side includes explanatory narrative.
Risk Assessment and Management
Government & Public Sector
This slide tracks concerns about military conflict globally. Poland (24%) is the most concerned, followed by Israel and South Korea (23%). Latin American nations show minimal concern. The global average is 9%, unchanged from the previous month.
military conflict, geopolitical risk, global survey, Ipsos, Poland, Israel, national security, global concerns
false
12 | MILITARY CONFLICT BETWEEN NATIONSWHAT WORRIES THE WORLD? 2023
Mixed Chart
IPSOS
View slide
Features column charts and tables detailing financial metrics such as net income, revenues, and credit costs. The slide is dense with numerical data and text highlights.
Financial Performance
Financial Services
Detailed breakdown of Citibank's legacy franchises showing trends in revenue, expenses, and net income, with highlights on geographic contributions. Useful for understanding historical financial impact and future financial planning.
legacy franchises, financial trends, Citibank, revenue breakdown, geographic analysis, expense tracking
false
Legacy Franchises ResultsThird Quarter 2023 Earnings Results Presentation
Mixed Chart
Citigroup
View slide
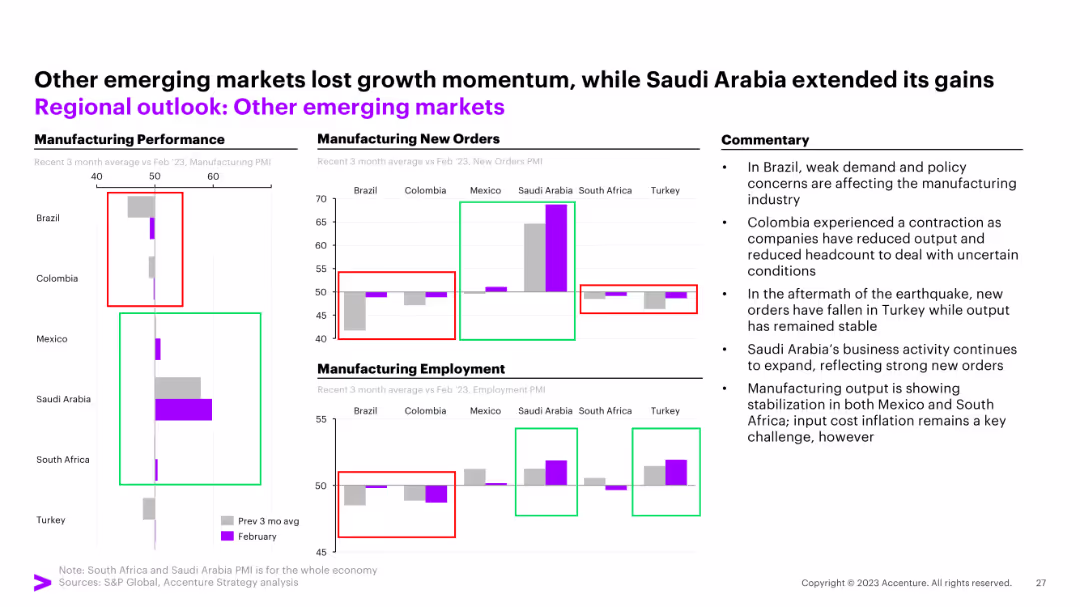
Combination of bar charts and column charts for manufacturing performance, new orders, and employment
Market Analysis and Trends
Financial Services
This slide focuses on other emerging markets, detailing manufacturing performance, new orders, and employment trends.
emerging markets, manufacturing performance, new orders, employment trends
false
Other emerging markets lost growth momentum, while Saudi Arabia extended its gainsMarch Macro Brief Financial fissures emerge
Multiple Chart
Accenture
View slide
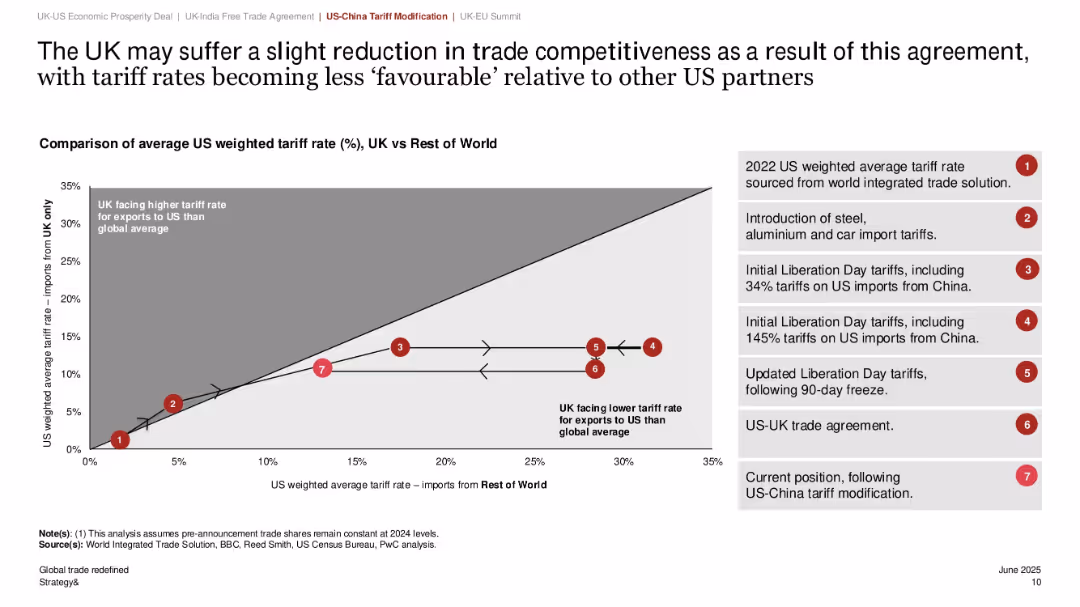
Line graph with arrows and numbered labels showing shifts in tariff positioning; side legend explains stages of tariff policy; grey-white shaded chart background.
Market Analysis and Trends
Government & Public Sector
This slide explains how recent changes to US-China tariffs may reduce UK trade competitiveness with the US. It compares the US weighted average tariff rates on UK vs. rest of world imports over time, with reference points detailing key policy changes. The UK is shown to be facing a relatively higher tariff rate under the current policy setup.
tariffs, trade competitiveness, UK-US trade, China, policy shift, weighted average, imports, global trade, protectionism, economic agreement
false
The UK may suffer a slight reduction in trade competitiveness...Global trade redefined: Early insights and economic impacts of new agreements
Single Chart
PwC/Strategy&
View slide
A dark-themed slide with two sets of horizontal bar graphs, accompanied by callouts with key percentages and notable quotes. The layout is well-structured to compare categories and provides insights through selected respondent quotes.
Customer and Market Segmentation
Retail & E-commerce
Focuses on how companies plan to incorporate ethical concerns into their operations, with emphasis on transparent communication, making it relevant for discussions on corporate responsibility and communication strategies.
Ethics, Transparency, Corporate Communication, Operational Strategy, Corporate Responsibility
false
Respondents see transparent communication as key to incorporating ethical concernsConsumers at 250
Mixed Chart
Kearney
View slide
Features multiple bar charts detailing subscription and cancellation rates for SVOD services, using contrasting colors to enhance data readability.
Risk Assessment and Management
Media & Entertainment
Analyzes the reasons for SVOD subscription cancellations, highlighting cost as a significant factor. Offers insights into consumer retention challenges in the streaming service industry.
SVOD, churn, cancellation, streaming, cost
false
Churn is an increasingly thorny challenge for SVOD providers, with a fifth of users having cancelled a service in the past year. However, half of cancellations are only temporary.Digital Consumer Trends 2023
Single Chart
Deloitte
View slide
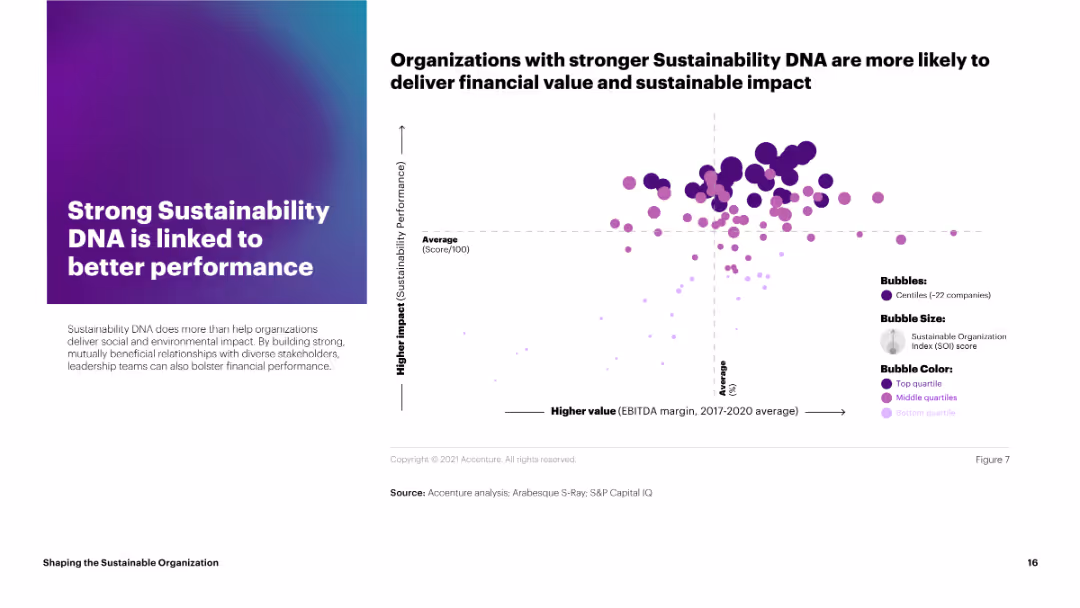
This slide features a bubble chart linking sustainability performance scores to EBITDA margins for various companies. The bubbles are color-coded by quartile and vary in size.
Strategic Planning
Environmental Services & Sustainability
The slide demonstrates that organizations with stronger sustainability DNA tend to achieve better financial performance, linking higher sustainability scores to improved EBITDA margins.
sustainability, performance, EBITDA, bubble chart, quartiles
false
Organizations with stronger Sustainability DNA are more likely to deliver financial value and sustainable impactShaping the Sustainable Organization
Mixed Chart
Accenture
View slide
Matrix showing the involvement of different stakeholders in the health insurance value chain, highlighting trends in product development, sales, underwriting, and claims.
Market Analysis and Trends
Financial Services
Analyzes the evolving landscape of health insurance, detailing how various stakeholders are expanding their roles across the value chain to enhance their value propositions.
health insurance, value chain, stakeholders, trends
false
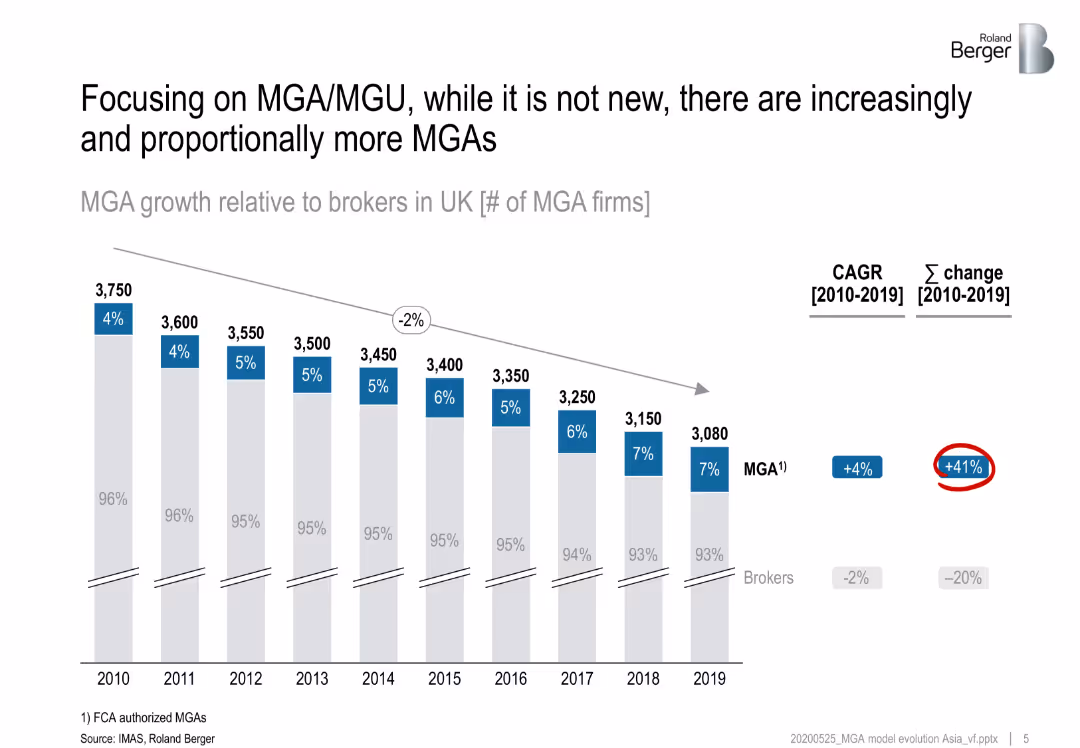
Focusing on MGA/ MGU , while it is not new, there are increasingly and proportionally more MGAsInsurance landscape evolution and emergence of MGA/ MGU model
Single Chart
Roland Berger
View slide
Column chart showing average views on official accounts, image of smartphone usage
Market Analysis and Trends
Media & Entertainment
Discusses the effectiveness of brand accounts on WeChat for engaging consumers
Digital Marketing, Brand Engagement, WeChat, Views
false
Brand Official Account becoming an impactful way to reach and engageChina Luxury Digital Playbook
Single Chart
BCG
View slide
The slide features a column chart showing the distribution of methane reduction efforts. It includes several text boxes outlining various technologies and solutions to reduce methane production in livestock and waste.
Technology and Digital Transformation
Agriculture & Food Production
This slide discusses strategies to reduce methane emissions in agriculture, focusing on livestock and waste. It details the potential abatement, associated costs, and specific technologies like feed supplements and biogas capture.
Methane reduction, Livestock, Emissions, Technology, Agriculture
false
Methane reductionHow can Australia’s agriculture sector realise opportunity in a low emissions future?
Mixed Chart
EY
View slide
Time series line chart showing 30+ days delinquency rates by issuer from 1Q18 to 1Q23. Bread shows the highest increase. YoY bps growth listed on the right.
Risk Assessment and Management
Financial Services
The chart shows a worsening trend in delinquency rates among issuers, especially Bread, CapOne, and Synchrony. This suggests potential for higher future charge-off rates. The data spans 5 years with consistent issuer tracking.
Delinquencies, Credit Cards, CapOne, Synchrony, Bread, Risk Trends
false
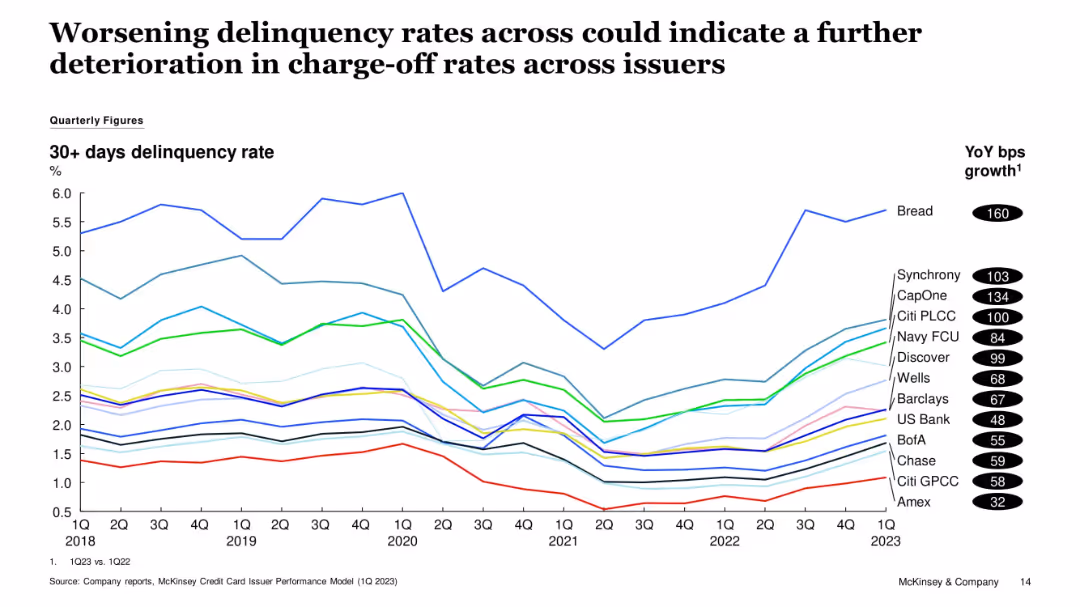
Worsening delinquency rates across could indicate a further deterioration in charge off rates across issuersUS Credit Card Issuer Performance, 1Q 2023
Single Chart
McKinsey
View slide
Horizontal bar chart with purple gradient bars illustrating percentages for top non-regulatory challenges in dealmaking. Clean and minimalist layout.
Risk Assessment and Management
Professional Services
Depicts top challenges in dealmaking, including data overload, integration issues, and tech/partner selection complexity. Emphasizes how data-related issues are dominant barriers.
data complexity, decision-making, deal challenges, technology, integration
false
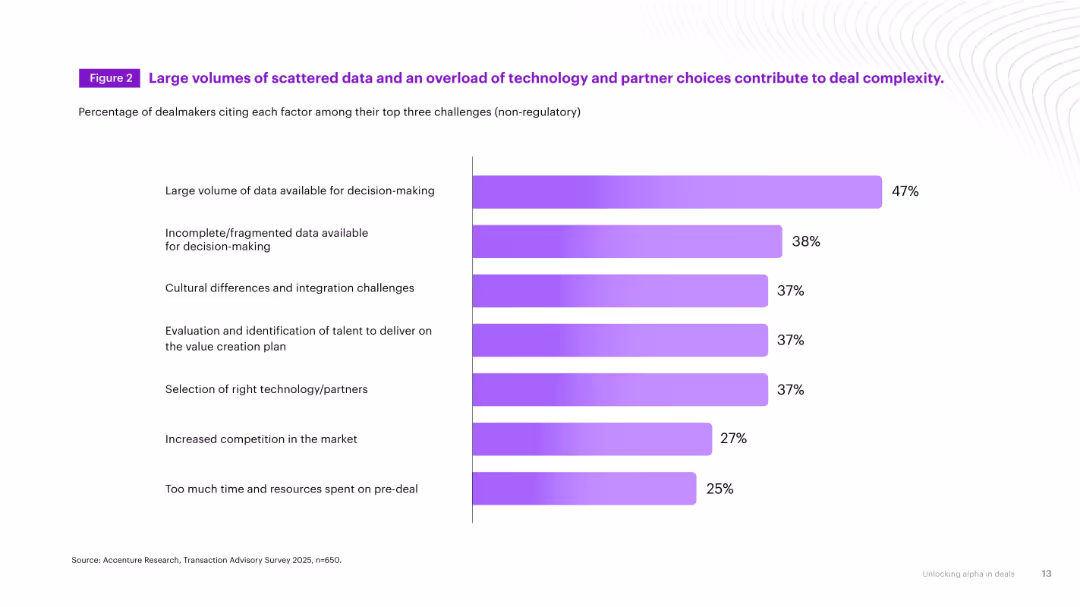
Large volumes of scattered data and an overload of technology and partner choices contribute to deal complexity.Unlocking alpha in deals
Single Chart
Accenture
View slide
The slide features a line chart showing the Composite Indicator of Systemic Stress Index from 2019 to 2023 for the UK, Euro area, and US.
Risk Assessment and Management
Financial Services
The slide assesses the levels of systemic financial stress in major economies post recent bank failures, noting stress trends and future expectations.
financial stress, systemic indicators, UK, Euro area, US, risk management
false
Systemic financial stress in major economies has spiked in the aftermath of recent bank failures but remains below peaks reached in recent yearsMarch Macro Brief Financial fissures emerge
Mixed Chart
Accenture
View slide
The slide features a line chart showing trends in the perceived risks of Brexit for Germany over time, with data on EU disintegration and trade concerns.
Risk Assessment and Management
Government & Public Sector
This slide shows how perceptions of Brexit risks for Germany have changed over time, focusing on issues like EU disintegration and trade. It helps in tracking risk perception trends.
Brexit, Germany, risk trends, EU disintegration, trade concerns
false
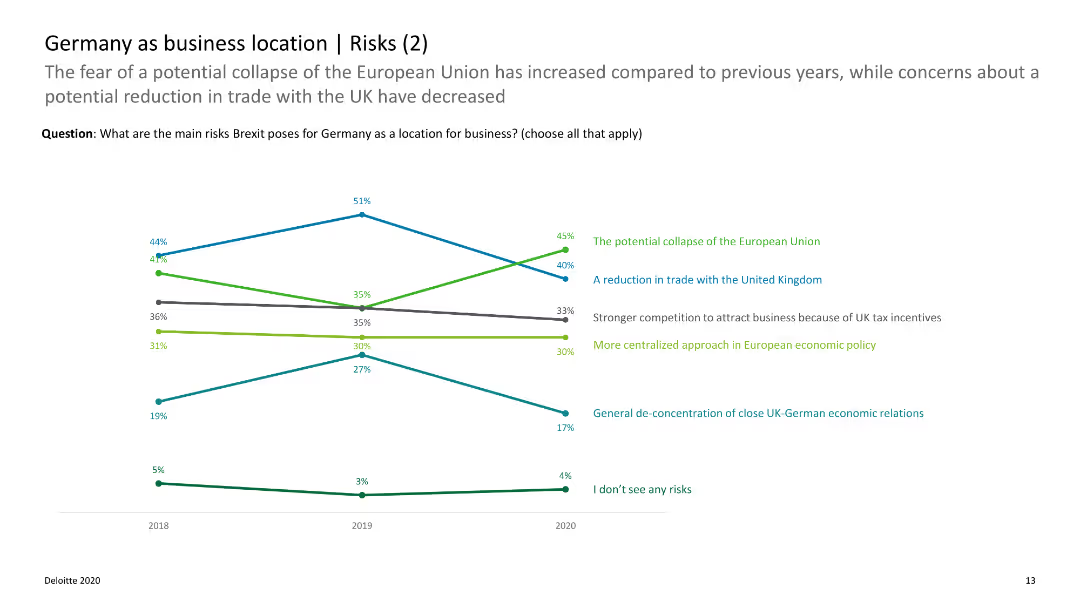
Germany as business location | Risks (2)Deloitte Brexit Briefing | 13 Brexit Survey: Expectations and preparations of German enterprises
Single Chart
Deloitte
View slide
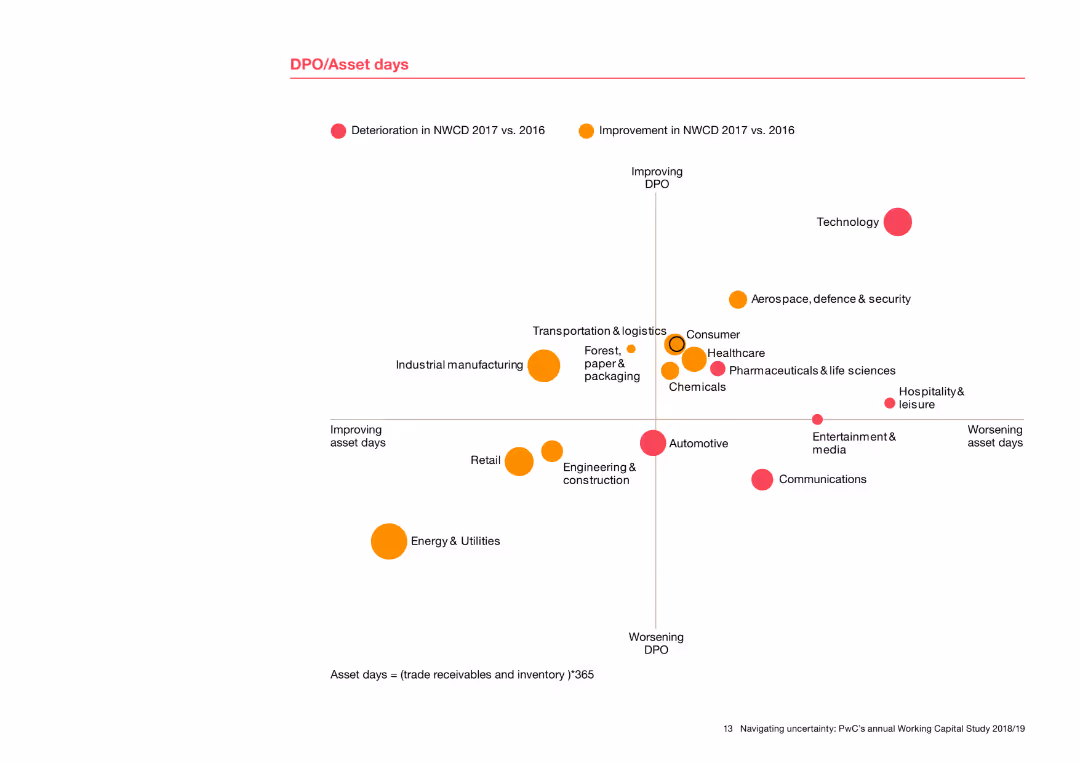
The slide includes a scatter plot showing DPO (Days Payable Outstanding) against asset days for various industries. Dots are color-coded to indicate improvement or deterioration from 2016 to 2017. Industries are labeled around the dots, providing a clear comparison of performance.
Risk Assessment and Management
Financial Services
This slide presents a detailed analysis of DPO and asset days across industries, showing trends in payables and asset management. The scatter plot visualizes how different sectors have improved or worsened in these metrics, offering insights into risk management and operational efficiency.
DPO, asset days, scatter plot, industry comparison, performance trends, risk management
false
DPO/Asset daysNavigating uncertainty: PwC’s annual global Working Capital Study
Single Chart
PwC/Strategy&
View slide
Features a gauge chart and a bar chart detailing the percentage of organizations investing in managerial development programs across various sectors. Charts are clearly labeled and easy to interpret.
Human Resources and Talent Management
Professional Services
Highlights investment in managerial development across different sectors, useful for HR strategic planning and assessing competitive practices.
development, investment, managers, HR
false
Does your organisation invest in a development programme for its Managers?HR Pulse Survey Presentation of results
Multiple Chart
PwC/Strategy&
View slide
Text and circular graph detailing online marketplace spend.
Customer and Market Segmentation
Retail & E-commerce
Examines the dominance of online marketplaces and alternative eCommerce at the purchase stage.
online marketplaces, eCommerce, purchase stage, consumer trends, retail
false
Online marketplaces and alternative eCommerce dominate in Purchase stageSoutheast Asia's digital consumers: A new stage of evolution
Single Chart
Bain
View slide
Contains a column chart detailing Australian infrastructure work from FY07 to FY25, with actual and projected values. Features clear scenario distinctions and annotations for clarity.
Market Analysis and Trends
Real Estate & Construction
Discusses projections for infrastructure development in Australia, highlighting potential growth scenarios and their drivers, useful for policy making and investment decisions.
infrastructure, Australia, projections, growth scenarios, investment
false
Step 4: Outlook for infrastructure work done AustraliaFletcher Building – economic uncertainty analysis
Mixed Chart
Deloitte
View slide
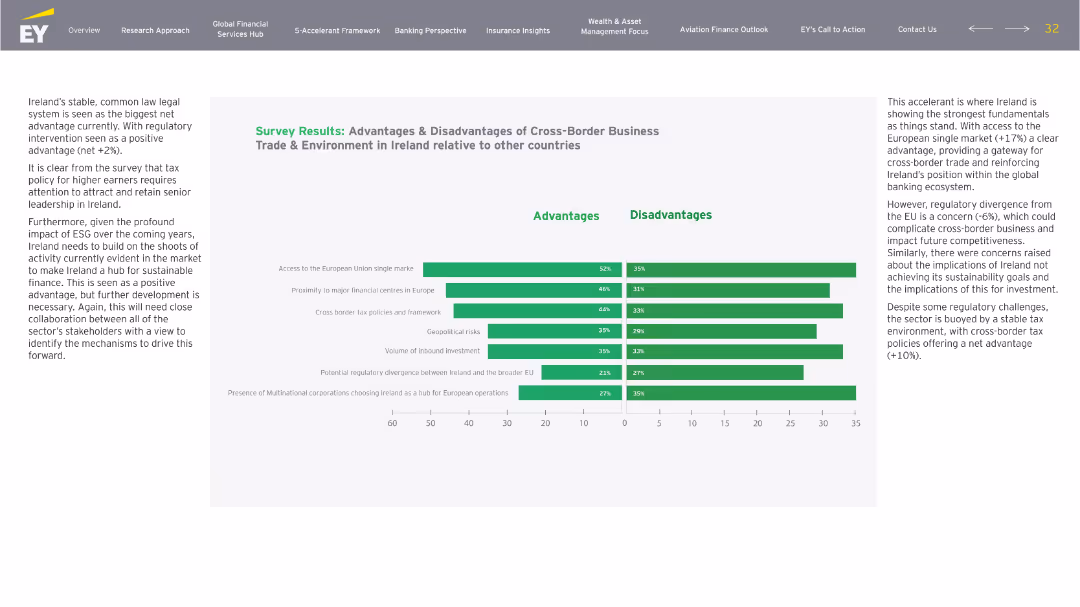
Side-by-side bar chart analysis with descriptive paragraph to the left and horizontal bar charts in green to the right. Advantages and disadvantages split, same categories reused from earlier.
Market Analysis and Trends
Financial Services
Expands on the earlier trade slide with more granular survey data. Reinforces Ireland’s edge in EU access and global HQ proximity, but flags regulatory divergence and sustainability gaps as concerns. Presents stakeholders’ feedback for future policy alignment.
cross-border, EU, trade, sustainability, regulation, investment
false
Survey Results: Advantages & Disadvantages of Cross-Border Business Trade & Environment in Ireland relative to other countriesBuilding a Better Financial Services Ireland: Accelerate to Elevate
Mixed Chart
EY
View slide
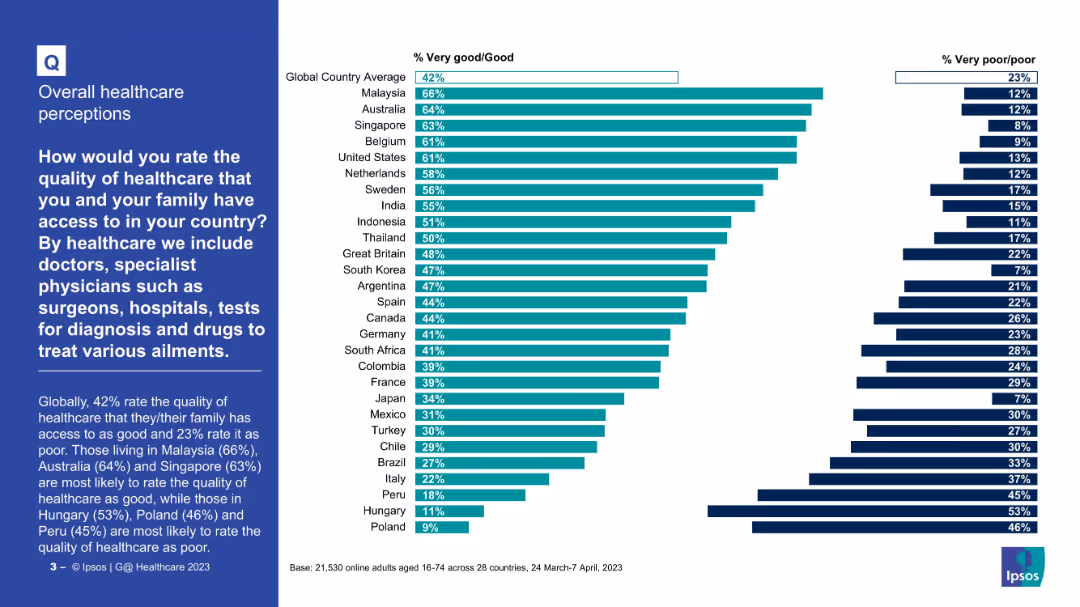
Horizontal bar chart comparing countries by percent rating healthcare as “Very good/Good” or “Poor”
Market Analysis and Trends
Healthcare & Pharmaceuticals
The chart compares how people in 28 countries rate the quality of healthcare. Malaysia, Australia, and Singapore top the list positively. Hungary, Peru, and Poland have the lowest satisfaction levels with highest “poor” ratings.
Healthcare quality, international comparison, satisfaction, global survey, medical care, Ipsos
false
Quality of HealthcareIPSOS GLOBAL ADVISOR Global Perceptions of Healthcare
Mixed Chart
IPSOS
View slide
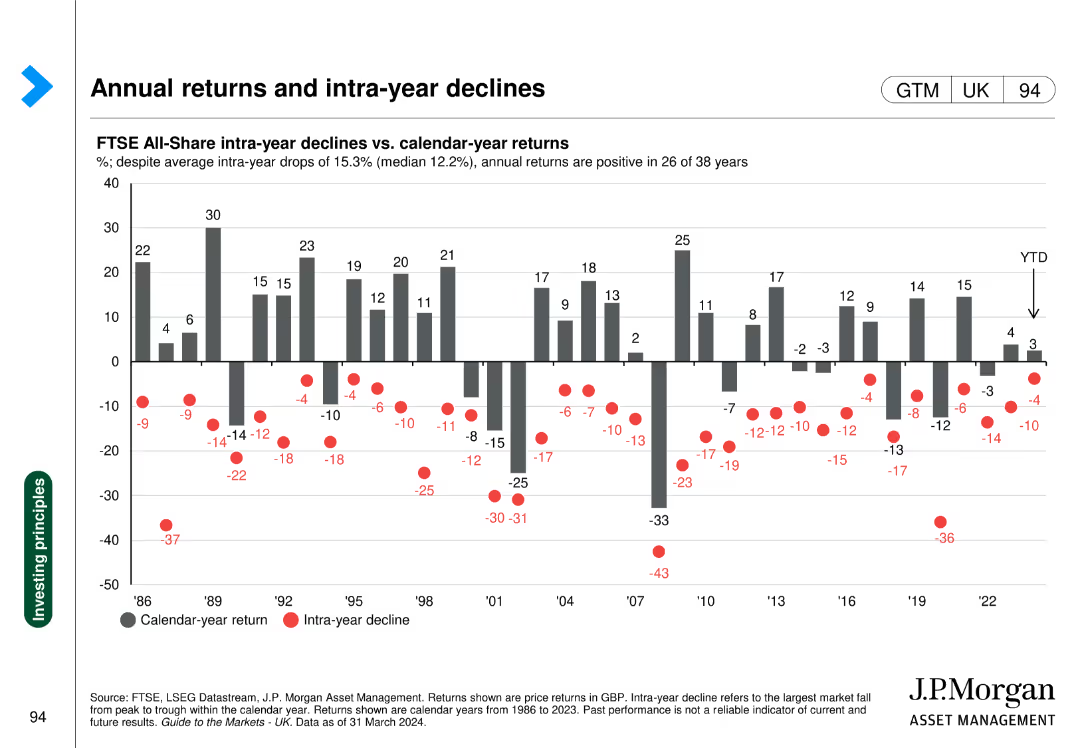
The slide features a column chart with annual returns and a scatter plot of intra-year declines represented as red dots for FTSE All-Share from 1986-2023.
Investment Analysis
Financial Services
This slide compares FTSE All-Share annual returns against intra-year declines, showing the volatility and overall performance trends over multiple years.
FTSE, annual returns, intra-year declines, volatility, investment analysis
false
Annual returns and intra year declinesGuide to the Markets UK | Q2 2024
Single Chart
JP Morgan
View slide
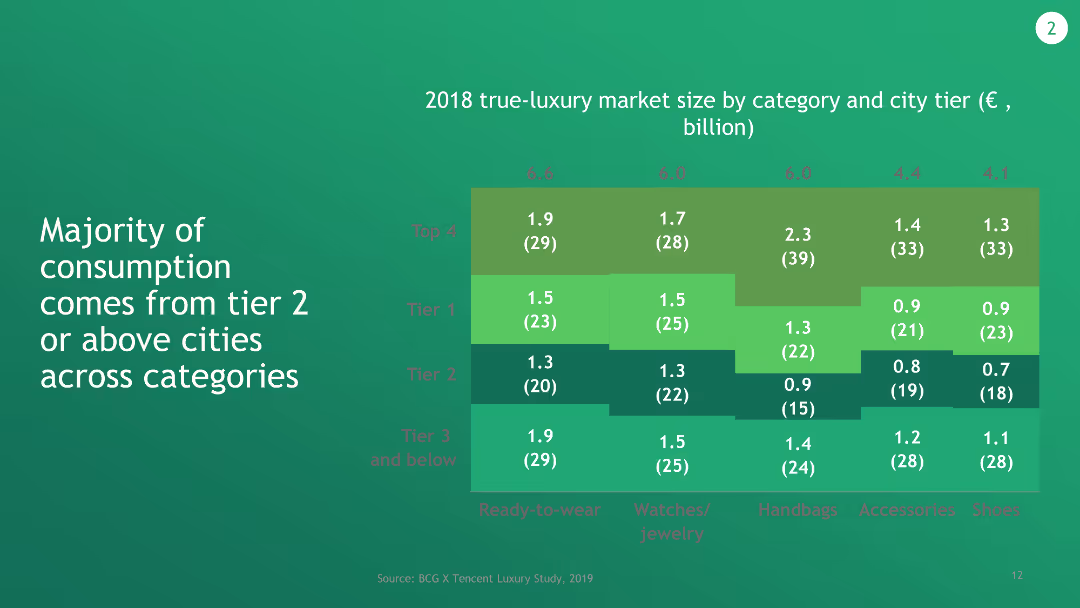
The slide includes a column chart that shows the 2018 true-luxury market size by category and city tier in billion euros. The chart uses various shades of green to represent data points.
Market Analysis and Trends
Consumer Goods
This slide details the market size of true-luxury categories across different city tiers in 2018. It highlights the predominance of tier 2 or above cities in luxury consumption.
luxury market, city tier, market size, consumption, true-luxury
false
2018 true-luxury market size by category and city tier (€, billion)China Luxury Digital Playbook
Mixed Chart
BCG
View slide
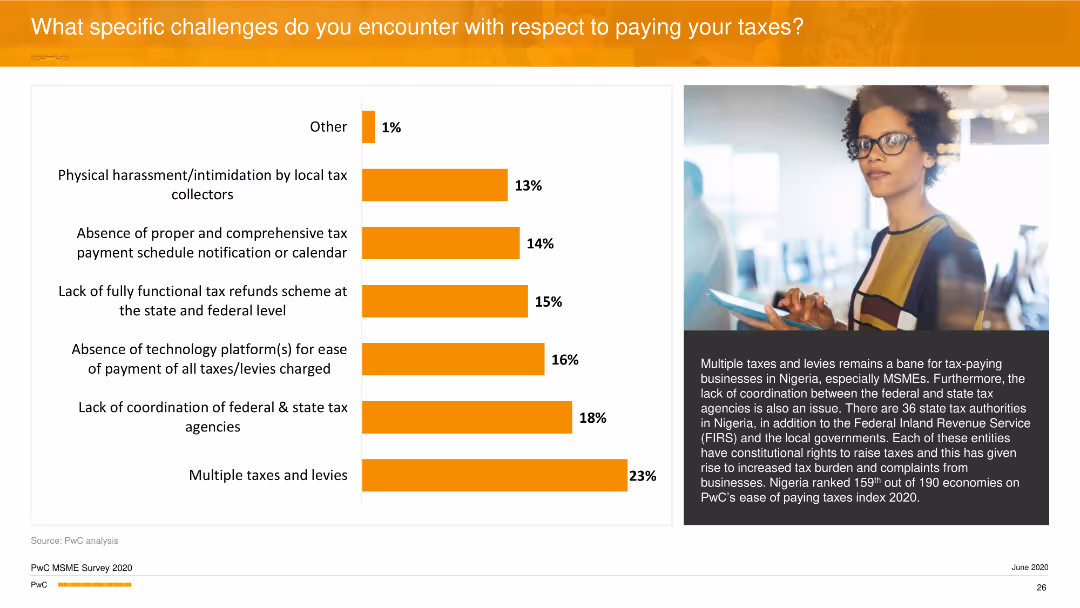
The slide features a horizontal bar chart illustrating challenges in tax payment, such as multiple taxes and lack of coordination. An image of a woman with glasses is on the right side.
Regulatory and Compliance
Financial Services
It highlights the specific tax-related challenges businesses face, with multiple taxes and levies, and lack of coordination between federal and state tax agencies being prominent. It elaborates on the systemic issues in Nigeria's tax system.
Taxes, Challenges, Compliance, Coordination, PwC
false
What specific challenges do you encounter with respect to paying your taxes?PwC’s MSME Survey 2020 Building to Last
Mixed Chart
PwC/Strategy&
View slide
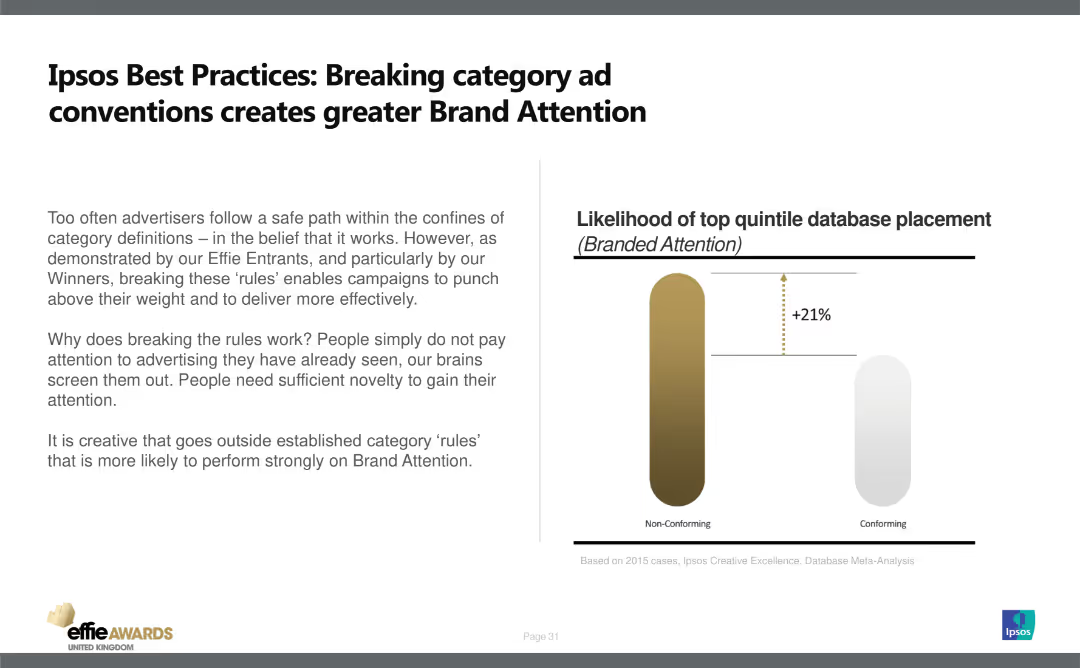
The slide has a title at the top, text on the left, and a column chart on the right. It features a simple design with minimal visual elements.
Strategic Planning
Media & Entertainment
Explains the importance of breaking category conventions in advertising to enhance brand attention. Uses data to show non-conforming ads have 21% higher likelihood of top quintile database placement.
Brand Attention, Advertising, Strategy, Conventions, Effectiveness
false
Ipsos Best Practices: Breaking category ad conventions creates greater Brand Attention2020 Effie UK Report • In partnership withIpsos
Mixed Chart
IPSOS
View slide
Slide presents line charts and stacked column charts that outline credit trends and portfolio quality, focusing on FICO scores over several years. The design is simple yet informative, employing a blue color palette with clear distinctions between different data sets and annotations for clarity.
Risk Assessment and Management
Financial Services
Provides an overview of stable credit trends in Citigroup’s branded card segment, influenced by strategic portfolio management. Highlights improvements in credit quality through higher FICO scores of new accounts and a reduction in lower score accounts, offering insights into risk management and underwriting strategies. A valuable tool for discussions on risk mitigation and credit management.
credit trends, FICO scores, risk management, portfolio quality, strategic planning
false
U.S. Branded Cards: Credit Trends Remain Stable, Driven by Portfolio QualityGlobal Consumer Banking
Multiple Chart
Citigroup
View slide
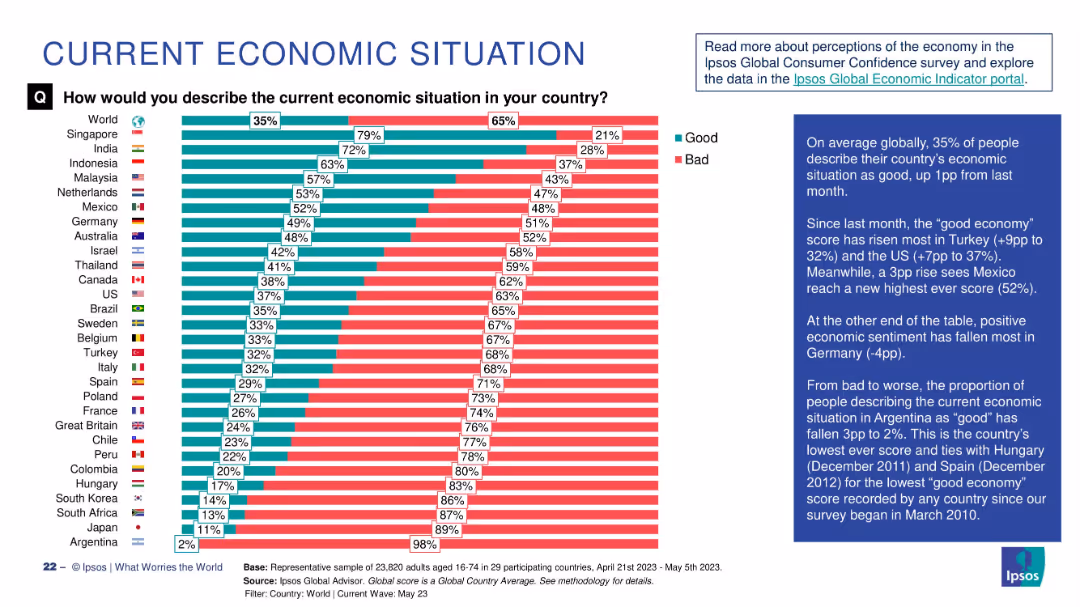
Stacked horizontal bar chart showing “Good” vs “Bad” economic sentiment per country; global average is shown first.
Strategic Planning
Financial Services
The chart compares perceptions of national economic situations. Singapore leads in positive sentiment (79%), while Argentina is lowest (2%). The red-green contrast highlights optimism vs pessimism. Commentary calls out notable shifts in Mexico (+3pp) and Germany (-4pp).
economy, public sentiment, Ipsos, global survey, good vs bad, economic perception, strategic insight, Argentina, Mexico
false
CURRENT ECONOMIC SITUATIONWHAT WORRIES THE WORLD? 2023
Single Chart
IPSOS
View slide
Complex visual with icons and pathways indicating steps in the luxury purchase process
Market Analysis and Trends
Retail & E-commerce
Details the fragmented journey of luxury purchasing across various channels
Luxury, Purchase Pathways, Consumer Journey, Fragmentation
false
Luxury purchase pathway is highly fragmented …China Luxury Digital Playbook
Pillar
BCG
View slide
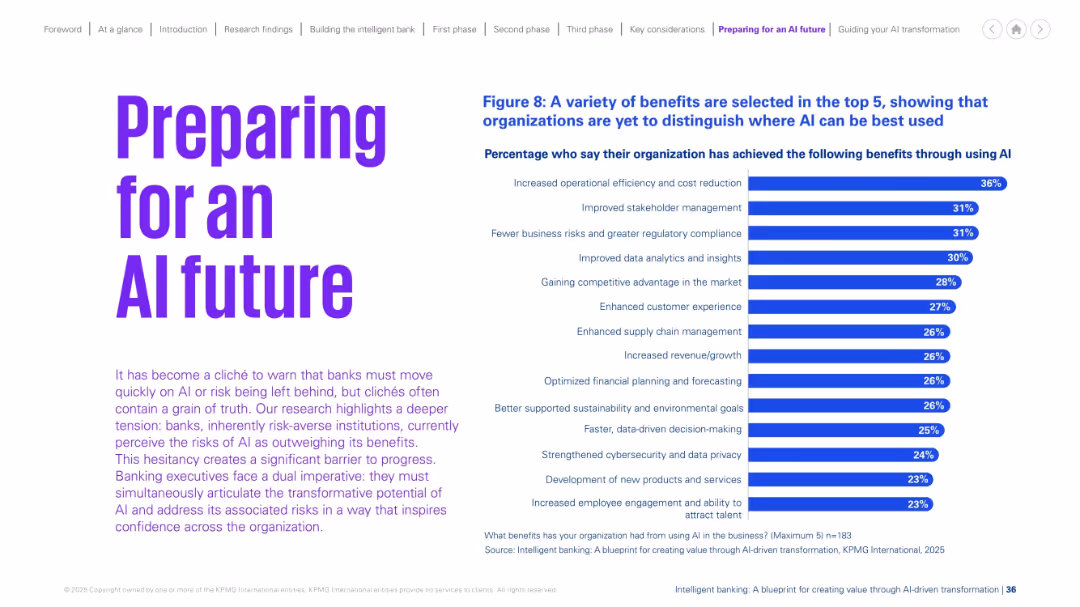
Left-aligned bold heading with a paragraph of explanatory text and a right-aligned bar chart showing benefits of AI.
Technology and Digital Transformation
Financial Services
Highlights benefits achieved through AI such as efficiency, stakeholder management, compliance, and analytics. The data implies organizations are still unclear on where AI yields the greatest value.
AI benefits, operational efficiency, stakeholder management, cost reduction, analytics, transformation, financial planning, sustainability
false
Preparing for an AI futureIntelligent banking
Mixed Chart
KPMG
View slide
Slide presents diagrams and statistics in a visually segregated format, enhancing readability and focus on specific data points. The layout is effectively utilized to present complex data.
Strategic Planning
Environmental Services & Sustainability
Explores the potential expansion of Copernicus user base beyond traditional commercial markets, specifically targeting public authorities and academics. Useful for strategic planning in expanding market reach and user engagement.
Copernicus, user base, market expansion, public authorities, academics
false
COPERNICUS CONTESTABLE USER BASECOPERNICUS Market report February 2019
Multiple Chart
PwC/Strategy&
View slide
The slide shows a stacked column chart illustrating the impact of netting and collateral on IFRS derivative trading assets, alongside bullet points for additional context. The design is minimalistic yet effective in conveying complex financial concepts.
Financial Performance
Financial Services
Reviews the net positions of derivative trading assets after adjustments for netting and collateral, serving as an analysis tool for understanding financial risk and asset management in banking.
derivatives, financial risk, banking, assets management
false
Derivatives bridge 26 Note: For footnotes refer to slides 29 and 30 Q1 2023, IFRS derivative trading assets and the impact of netting and collateral, in € bnClient & Creditor Overview July 2023
Mixed Chart
Deutsche Bank
View slide
Descriptions of extended reality (XR), mixed reality (MR), augmented reality (AR), and virtual reality (VR), with a column chart showing the projected market size of XR technologies from 2018 to 2030.
Technology and Digital Transformation
Technology & Software
The slide discusses the different types of extended reality technologies, including XR, MR, AR, and VR. It emphasizes the potential impact of these technologies on various sectors and projects significant market growth for XR technologies by 2030.
Extended Reality, XR, AR, VR, Market Size
false
Our immersive future: The concept of extended reality merges physical and digital worlds …Megatrend 5 - Technology & Innovation
Mixed Chart
Roland Berger
View slide
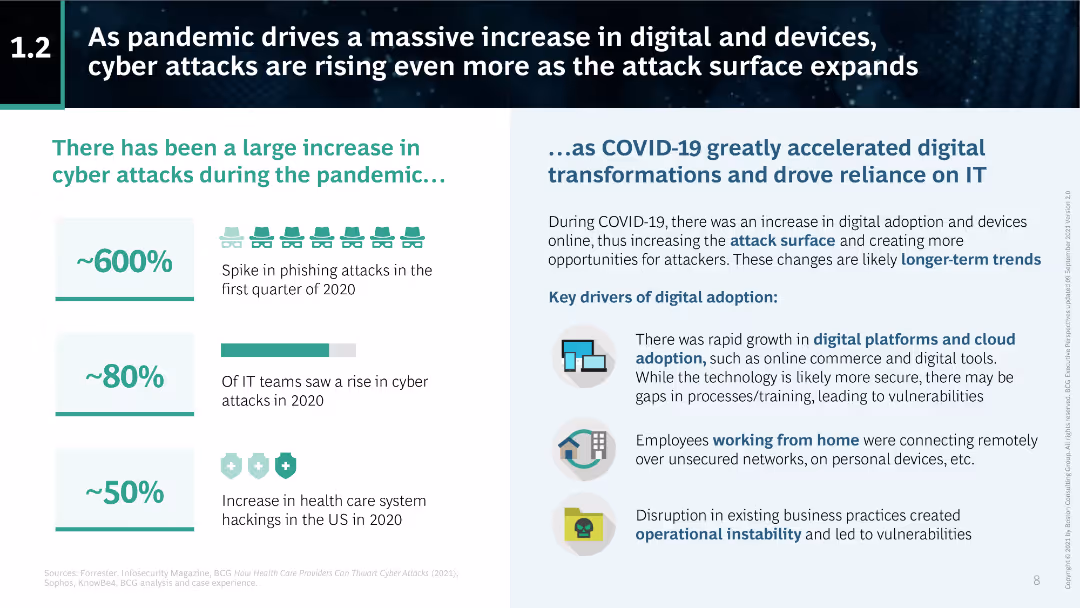
The slide includes several statistics and icons highlighting the increase in cyber attacks during the pandemic and the drivers of digital adoption.
Risk Assessment and Management
Technology & Software
This slide explains the rise in cyber attacks during the COVID-19 pandemic, citing a 600% increase in phishing attacks and an 80% rise in cyber attacks on IT teams. It also discusses key drivers of digital adoption.
pandemic, digital adoption, cyber attacks, COVID-19, phishing, IT security, statistics, cybersecurity, BCG
false
As pandemic drives a massive increase in digital and devices, cyber attacks are rising even more as the attack surface expandsThe CEO’s Guide to Cybersecurity
Boxed
BCG
View slide
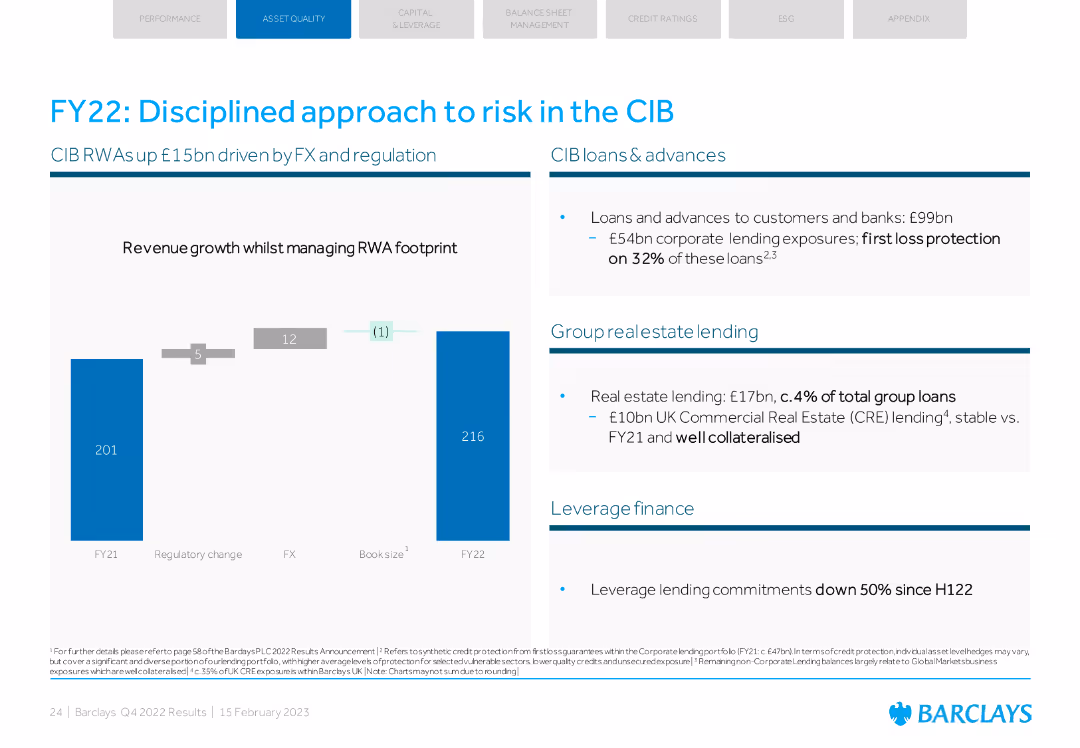
Column chart showing RWA changes and key lending metrics. Insights into real estate and leverage finance.
Risk Assessment and Management
Financial Services
Discusses disciplined risk management in Barclays' CIB with focus on RWA changes, lending, and real estate.
risk management, CIB, RWA, lending, real estate
false
FY22: Disciplined approach to risk in the CIBBarclays PLC Q4 2022 Fixed Income Investor Presentation
Mixed Chart
Barclays
View slide
The slide features a professional setting with individuals in a discussion. The text highlights the need for collaboration and the development of future risk leaders within businesses. It emphasizes the importance of aligning risk management strategies with business goals to foster organizational growth and resilience.
Strategic Planning
Professional Services
This slide discusses the strategic approach to nurturing future leaders in risk management, focusing on integrating risk considerations into broader business strategies and decision-making processes. It advocates for a proactive and integrated approach to risk management as essential for sustainable business growth and competitive advantage in a volatile business environment.
future leaders, risk management, strategic planning, collaboration, business growth, professional, discussion
false
STEP 2 Create risk leaders of the futureHyper-disruption demands constant reinvention
Mixed Chart
Accenture
View slide
Features a female character next to a large table with data explaining reforms in passive income taxation.
Regulatory and Compliance
Financial Services
Summarizes major tax reforms, focusing on changes in tax rates for foreign and domestic corporations, highlighting exemptions and reductions.
taxation, reforms, corporate, passive income, tax rates, CREATE, Philippines
false
Reforms on taxation of passive incomeDoing business in the Philippines 2021
Table
Deloitte
View slide
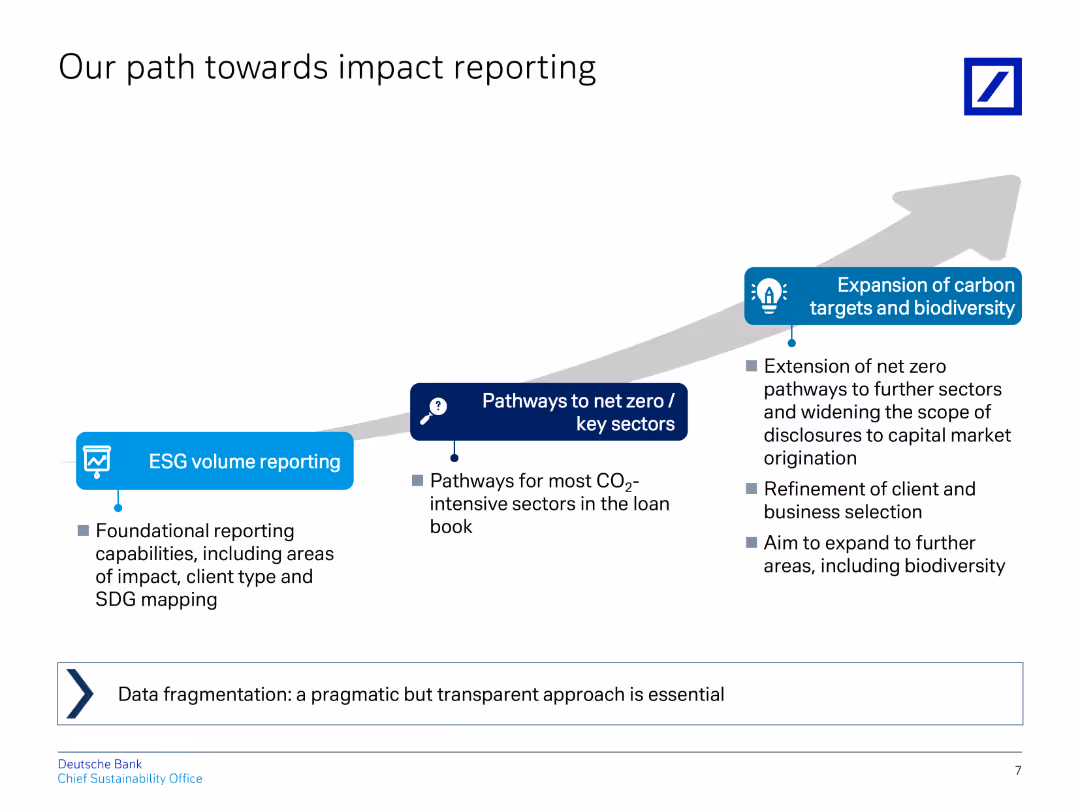
The slide uses a flow diagram to illustrate the progression from ESG volume reporting to net zero pathways and carbon target expansion.
Regulatory and Compliance
Financial Services
Outlines steps for improving impact reporting, including ESG volume reporting, net zero pathways, and carbon target expansion.
impact, reporting, ESG, net zero, carbon targets
false
Our path towards impact reportingHow we measure and drive success
Linear Flow
Deutsche Bank
View slide
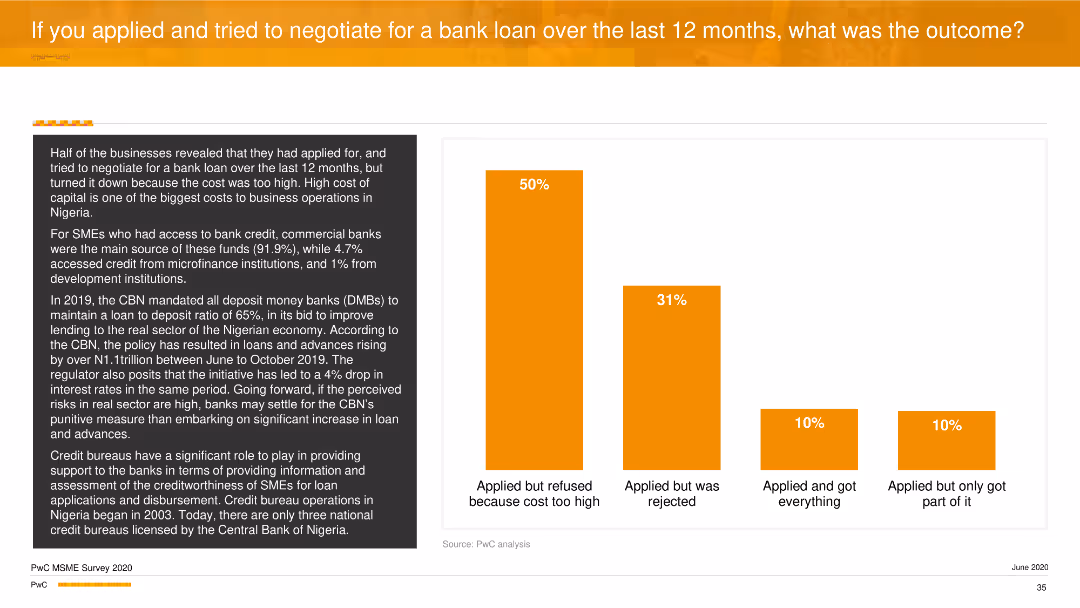
The slide features a vertical column chart showing outcomes of bank loan applications. Half were refused due to high costs. Detailed text on loan negotiation outcomes is on the left.
Risk Assessment and Management
Financial Services
It discusses the outcomes of loan applications, revealing that high costs were the primary reason for refusals. It provides insights into the challenges faced by SMEs in securing bank loans and highlights the role of credit bureaus.
Bank Loans, Negotiation, SMEs, Financing, PwC
false
Half of the businesses revealed that they had applied for, and tried to negotiate for a bank loan over the last 12 months, but turned it down because the cost was too high. High cost ofPwC’s MSME Survey 2020 Building to Last
Mixed Chart
PwC/Strategy&
View slide
The slide uses a scatter plot to display the distribution of organizations based on their AI capabilities. Different colors indicate various categories of AI proficiency.
Performance Metrics and KPIs
Technology & Software
It identifies different levels of AI adoption among organizations, categorizing them into Achievers, Builders, Innovators, and Experimenters based on their AI capabilities and performance.
AI achievers, capabilities, scatter plot, performance, categorization
false
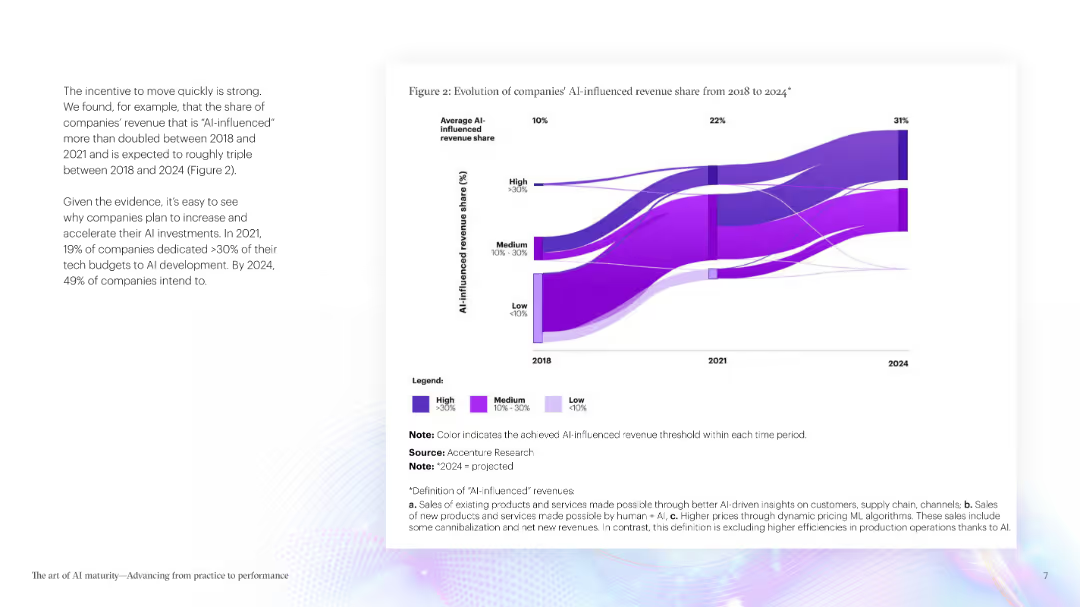
Figure 2: Evolution of companies' AI-influenced r The incentive to move quickly is strong. evenue share from 2018 to 2024*The art of AI maturity Advancing from practice to performance
Mixed Chart
Accenture
View slide
Several lists with bullet points, divided into four sections with different colored headers, describing various business strategies.
Strategic Planning
Financial Services
Describes strategic investments in distribution, products, technology, and cost efficiency to strengthen the franchise.
Strategic investment, distribution, product expansion, technology, cost efficiency
false
Investments have strengthened our franchise and resiliency in a more challenging environmentFIRM OVERVIEW 2020
Table
JP Morgan
View slide
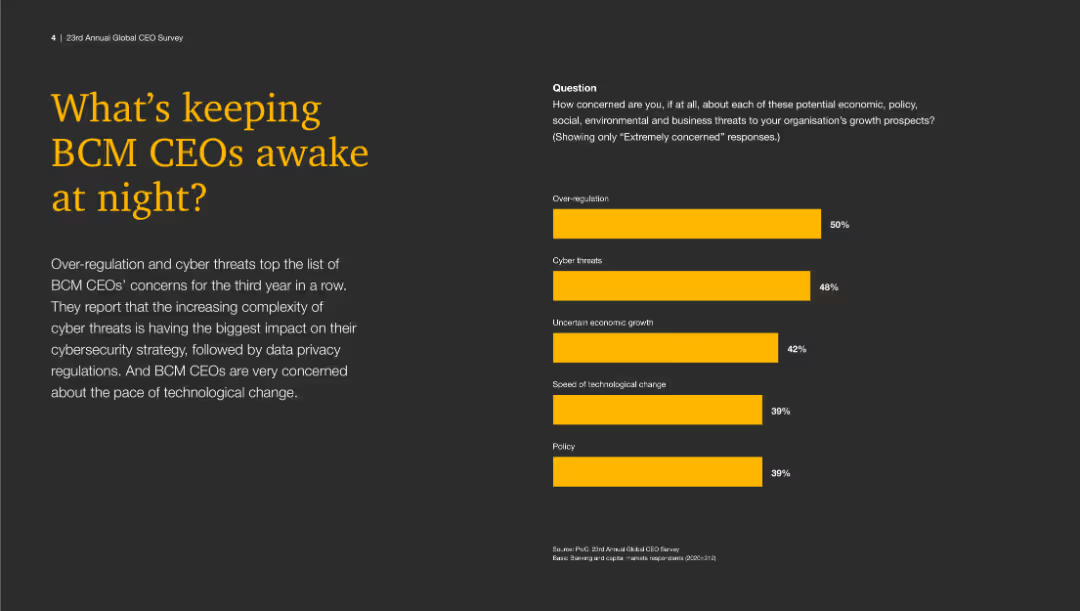
The slide uses a dark background with a large yellow title on the left. On the right, a column chart with yellow bars indicates different concerns for BCM CEOs.
Risk Assessment and Management
Financial Services
This slide shows the top concerns for BCM CEOs, including over-regulation, cyber threats, uncertain economic growth, speed of technological change, and policy concerns.
BCM, CEOs, risks, concerns, cybersecurity, regulation, growth, technology, policy
false
What’s keeping BCM CEOs awake at night?Banking and capital markets trends 2020: Laying the foundations for growth
Mixed Chart
PwC/Strategy&
View slide
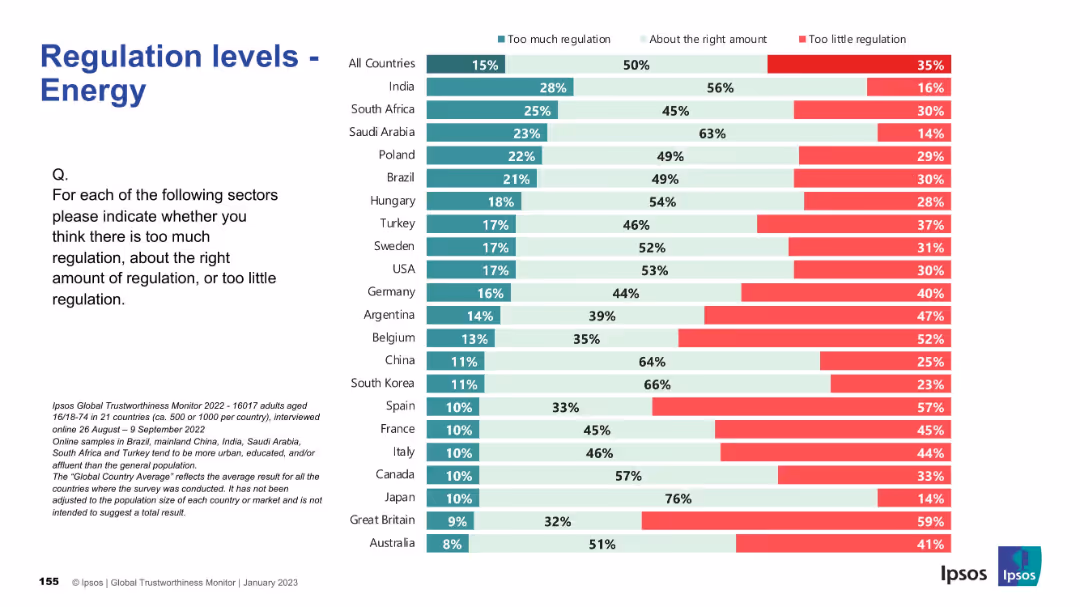
Similar layout to 19301; bar chart with red, teal, and mint green segments; country list ranked.
Regulatory and Compliance
Energy & Utilities
This slide shows perceptions of regulation in the energy sector across 21 countries. It highlights a global average sentiment that current regulation is mostly appropriate, though several countries like Belgium and Spain show higher concern over too little regulation.
energy sector, regulation, survey, Ipsos, policy, governance, international comparison, compliance, public opinion, bar chart
false
Regulation levels – EnergyIPSOS GLOBAL TRUSTWORTHINESS MONITOR January 2023
Mixed Chart
IPSOS
View slide
The slide features a colorful pie chart breaking down sales by category and a sidebar with percentage breakdowns by international region. It includes text labels and the Clorox Company logo.
Market Analysis and Trends
Consumer Goods
This slide details $6.1B in sales for FY18, broken down by product categories like Cleaning and Household, and regions like Latin America and Canada, with future projections for Nutranext. Used for market analysis and strategic planning.
sales, market, regional distribution, projections, Clorox
false
Mid-Sized CategoriesBarclays Global Consumer Staples Conference
Mixed Chart
Barclays
View slide
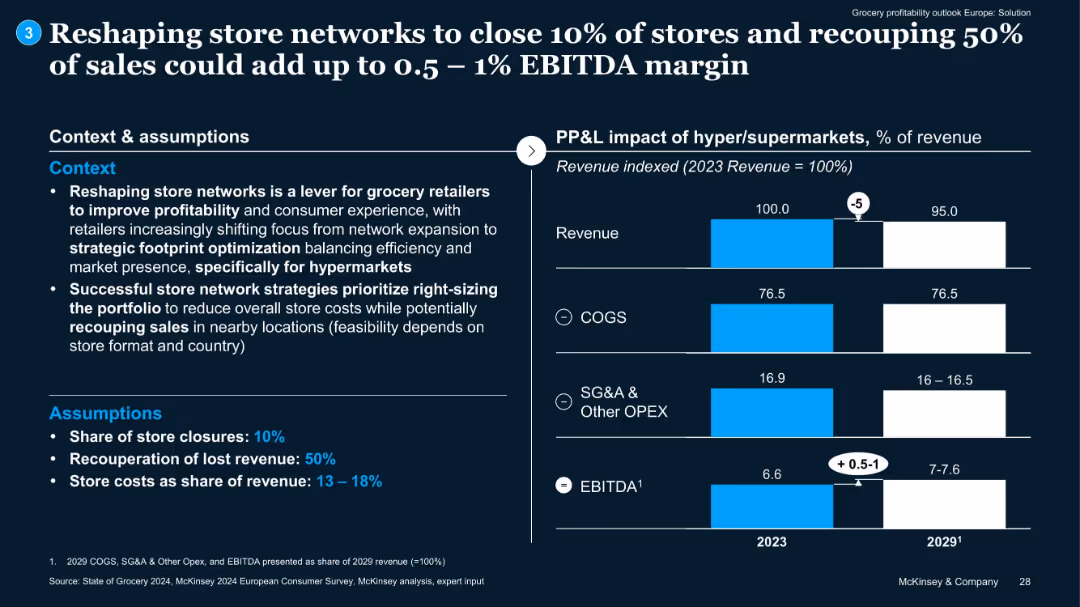
Context and assumptions on left; bar chart on right comparing 2023 and 2029 cost components. EBITDA uplift is marked with arrows.
Operational Efficiency
Retail & E-commerce
Proposes store network reshaping (10% closure) with 50% sales recouped to drive 0.5–1% EBITDA uplift. Assumptions on cost reduction and efficiency gains included.
store optimization, EBITDA, cost reduction, footprint, hypermarkets
false
Reshaping store networks to close 10% of stores and recouping 50% of sales could add up to 0.5 – 1% EBITDA marginGrocery profitability outlook –Europe
Mixed Chart
McKinsey
View slide
Features stacked column charts and icons to illustrate the preferred sustainability criteria.
Product and Service Analysis
Environmental Services & Sustainability
Highlights different sustainability criteria valued by consumers when purchasing luxury goods.
sustainability, luxury goods, consumer preferences, criteria
false
…with Environmental and Animal criteria most valued when purchasing luxury goods, driven by younger generations2019 True-Luxury Global Consumer I nsight
Multiple Chart
BCG
View slide
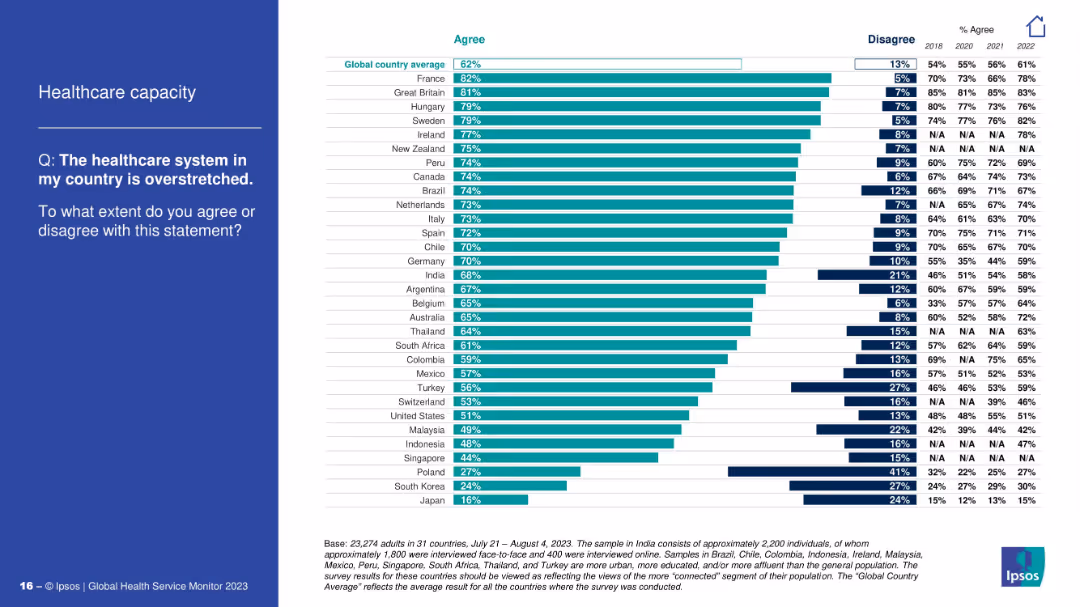
Similar design: left-aligned question, right side with bar chart and agree/disagree stats.
Operational Efficiency
Healthcare & Pharmaceuticals
This slide explores how overstretched people perceive their national healthcare systems to be. France and Great Britain have the highest agreement. It tracks opinion shifts since 2018 and identifies which populations feel most strain.
healthcare system, overstretched, survey, operational pressure, Ipsos, public sentiment, capacity, country stats
false
Healthcare capacityIPSOS GLOBAL HEALTH SERVICE MONITOR 2023
Mixed Chart
IPSOS
View slide
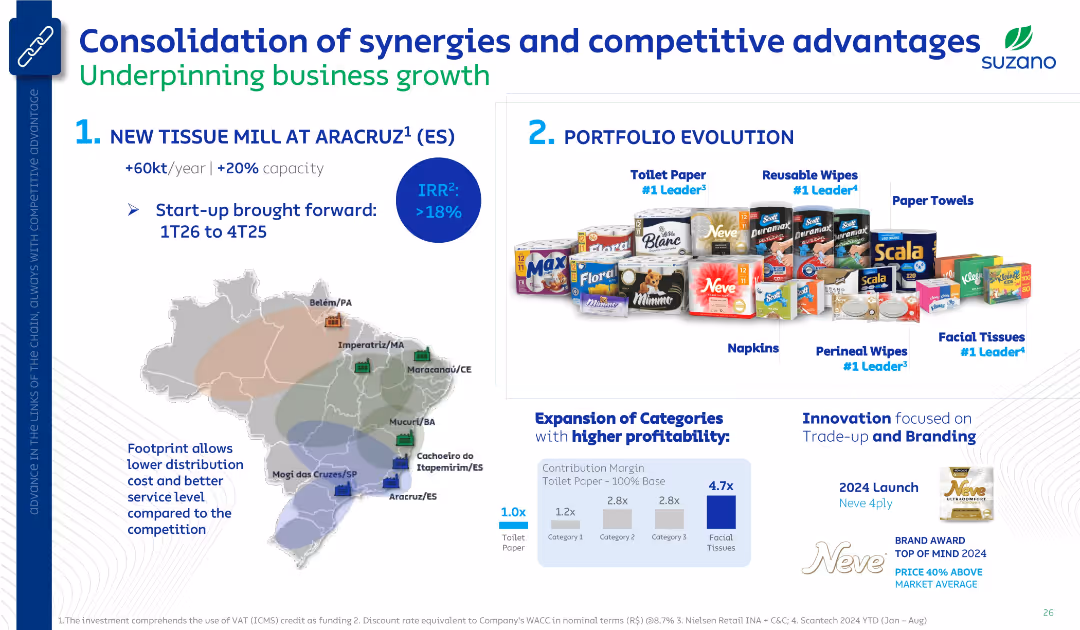
Two-section layout: left side features a map and mill expansion plan; right side shows product portfolio and profitability analysis. Clean corporate style with product visuals and icons.
Strategic Planning
Consumer Goods
The slide outlines Suzano's strategic initiatives, highlighting a new tissue mill in Aracruz and the evolution of its product portfolio. It emphasizes expansion in higher-margin categories like facial tissues and highlights innovation in branding. A map shows Suzano’s Brazilian footprint for logistical advantage.
tissue mill, product portfolio, brand leadership, Suzano, IRR, profitability, logistics, trade-up, branding
false
Consolidation of synergies and competitive advantagesGoldman Sachs Brazil Commodities Days
Mixed Chart
Goldman Sachs
View slide
The slide includes three line charts showing Euro area employment and unemployment rate (2015-25F), Euro area labor demand and supply (2016-23), and Euro area y/y wage growth and HICP (2015-25F). The charts are well-organized, with detailed explanations provided in the text.
Market Analysis and Trends
Financial Services
This slide examines the resilience of the Euro area labor market, projecting wage growth trends amid gradual rebalancing. It highlights key indicators of employment, labor demand and supply, and wage growth, discussing their impact on the overall economy.
labor market, employment, wage growth, euro area, resilience
false
The labor market has remained resilient, while gradually rebalancing, though wage growth will remain elevated on the back of indexation to past inflationGlobal economic outlook: finding balance in 2024
Multiple Chart
EY
View slide
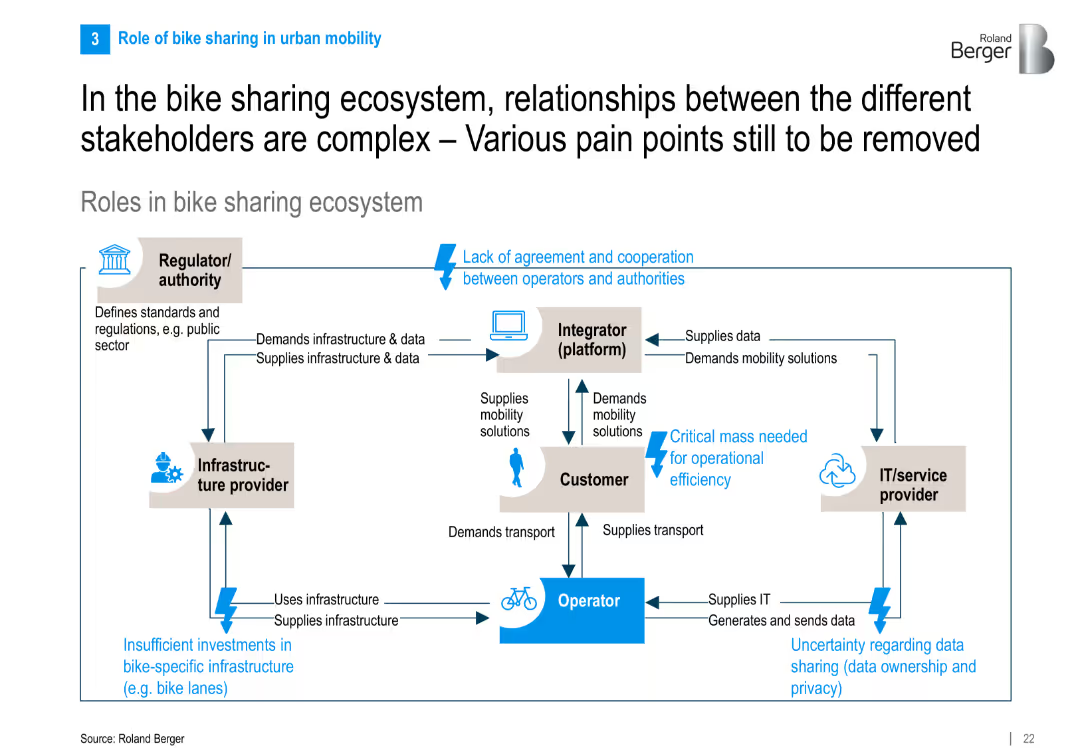
Flowchart-style diagram showing stakeholder interactions in the ecosystem with directional arrows, text boxes, and pain points highlighted in blue.
Operational Efficiency
Transportation & Logistics
The slide maps out interactions among key stakeholders in bike sharing—operators, customers, regulators, integrators, and IT providers—highlighting collaboration pain points like regulation, infrastructure, and data issues.
bike sharing, ecosystem, stakeholder roles, pain points, infrastructure, IT providers, mobility
false
In the bike sharing ecosystem, relationships between the different stakeholders are complex – Various pain points still to be removedBike Sharing 5.0
Diagram
Roland Berger
1
...
Next
Load More
Hold On!
We are searching in our database
If nothing, comes up, please try different filters!
Create a FREE account to continue browsing
Receive Instant Access to 1,000+ slides from companies like McKinsey, Google, and Goldman Sachs
First Name
Last Name
Email
Password
I agree to all
Terms & Privacy Policy
Thank you! Your submission has been received!
Oops! Something went wrong while submitting the form.
Have an account?
Sign in
Column Chart
Heatmap
Chevron
Org Chart
Infographic
Callouts
Timeline
List
Graphic
Picture
Process Flow
Diagram
Paragraph
Map
Table
Framework
Subtitle
Takeaway Box
Icon
Other Chart
Radar Chart
Waterfall Chart
Mekko Chart
Pie Chart
Scatter Plot
Line Chart
Bar chart
Bullet points