🎉 Black Friday Sale!
- Save 20% on SlideStart Pro Annual plan! CODE:
BLACKFRIDAY
My Account
My Slides
Search by Category
Templates
View All Templates
Download Template Slides
Leave Feedback
Login
Logout
Get Started
Browse all Slides
Browse all Slides
Create a FREE Account
Instant access to 1,000+ real slides from top companies like McKinsey, BCG, Goldman Sachs, Google and many more!
First Name
Last Name
Email
Password
I agree to all
Terms & Privacy Policy
Thank you! Your submission has been received!
Oops! Something went wrong while submitting the form.
Have an account?
Sign in
Instant access to the internet's best slides
Get access to 40+ advanced filters and more
Advanced Search and Filters
Access to
10,000+ slides
Access to Category Pages
Save/Bookmark Slides
PowerPoint Template Library (New)
Choose your plan
MONTHLY
$12/month
Billed every month, cancel anytime.
YEARLY
$9/month
Billed $108 annually, cancel anytime.
Checkout for $12/month
Checkout for $108/yr
Secured by Stripe | AES-256 bit encryption
Spark Your Next Big Idea with New Presentation Templates
VIEW ALL Templates
Welcome,
Welcome
Upgrade to SlideStart
Pro
Instant access to 15,000+ slides
Show Featured Only
Checkbox 8
Companies
Mckinsey
Bain
BCG
EY
Deloitte
Accenture
PwC/Strategy&
JP Morgan
Goldman Sachs
Morgan Stanley
Citigroup
Deutsche Bank
Barclays
LEK
Kearney
Oliver Wyman
Booz Allen Hamilton
Gartner
IPSOS
Nielsen
Slide type
Header Horizontal
Framework
Vertical Flow
Single Chart
Single Chart
Text Only
Mixed Chart
Header Vertical
Graphic
Pillar
Multiple Chart
Agenda
Title
Table
Linear Flow
Upgrade to SlideStart
Pro
Instant access to 40+ advanced filters
Industry
Upgrade to SlideStart
Pro
Instant access to 40+ advanced filters
Technology
Healthcare
Financial Services
Consumer Goods
Energy & Utilities
Manufacturing
Retail
E-commerce
Logistics
Telecommunications
Real Estate
Professional Services
Education
Media
Entertainment
Hospitatlity
Tourism
Agriculture
Food Production
Government & Public Sector
Environmental
Sustainability
Use Case
Upgrade to SlideStart
Pro
Instant access to 40+ advanced filters
Sales and Business Development
Mergers and Acquisitions
Corporate Finance and Valuation
Performance Metrics and KPIs
Client Case Studies
Competitive Landscape
Product and Service Analysis
Customer and Market Segmentation
Organizational Structure
Human Resources and Talent Management
Industry Overview
Regulatory and Compliance
Risk Assessment and Management
Agriculture & Food Production
Hospitality and Tourism
Government
Environmental
Sustainability
Clear all
Thank you! Your submission has been received!
Oops! Something went wrong while submitting the form.
Show Featured Only
Checkbox 8
Companies
Mckinsey
Bain
BCG
EY
Deloitte
Accenture
PwC/Strategy&
JP Morgan
Goldman Sachs
Morgan Stanley
Citigroup
Deutsche Bank
Barclays
LEK
Kearney
Oliver Wyman
Booz Allen Hamilton
Gartner
IPSOS
Nielsen
Slide type
Text Only
Linear Flow
Vertical Flow
Single Chart
Header Horizontal
Mixed Chart
Header Vertical
Pillar
Multiple Chart
Graphic
Agenda
Title
Table
Framework
Industry
Technology
Healthcare
Financial Services
Consumer Goods
Energy & Utilities
Manufacturing
Retail
E-commerce
Logistics
Telecommunications
Real Estate
Professional Services
Education
Media
Entertainment
Hospitatlity
Tourism
Agriculture
Food Production
Government & Public Sector
Environmental
Sustainability
Use Case
Sales and Business Development
Mergers and Acquisitions
Corporate Finance and Valuation
Performance Metrics and KPIs
Client Case Studies
Competitive Landscape
Product and Service Analysis
Customer and Market Segmentation
Organizational Structure
Human Resources and Talent Management
Industry Overview
Regulatory and Compliance
Risk Assessment and Management
Agriculture & Food Production
Hospitality and Tourism
Government
Environmental
Sustainability
Clear all
Thank you! Your submission has been received!
Oops! Something went wrong while submitting the form.
Tag
View slide
A series of circular graphics and arrows guide the eye through various stages of talent development. Ample text supports the visuals, creating a moderately dense slide.
Operational Efficiency
Education & Training
This slide outlines the stages in building and managing a talent pool for the Tempest partners. It addresses workforce development strategies from school outreach to inclusive opportunities.
talent management, school outreach, apprenticeships, graduates, skills policy, inclusive opportunities, STEM, workforce development
false
The Tempest partners will need to recruit, upskill and retrain a large number of people, many of whom will need to develop new skillsAssessment of the expected economic impact of the Tempest Programme (2021-2050)
Linear Flow
PwC/Strategy&
View slide
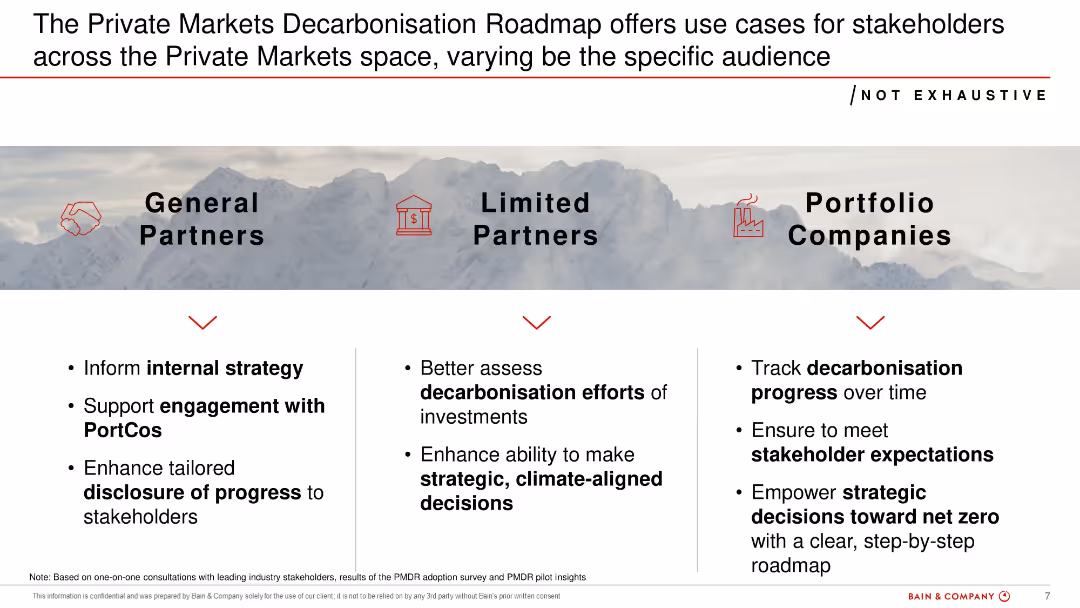
Three-column layout showing stakeholder-specific use cases for general partners, limited partners, and portfolio companies. Minimalistic icons and a mountain backdrop.
Strategic Planning
Financial Services
Explains how different stakeholders (GPs, LPs, PortCos) can use the PMDR to support climate-aligned strategy and expectations. Focuses on strategic value and communication benefits across internal and external stakeholders.
decarbonisation, GPs, LPs, PortCos, strategy, stakeholder, roadmap
false
The Private Markets Decarbonisation Roadmap offers use cases for stakeholders across the Private Markets space, varying be the specific audiencePrivate Markets Decarbonisation Roadmap Summary
Pillar
Bain
View slide
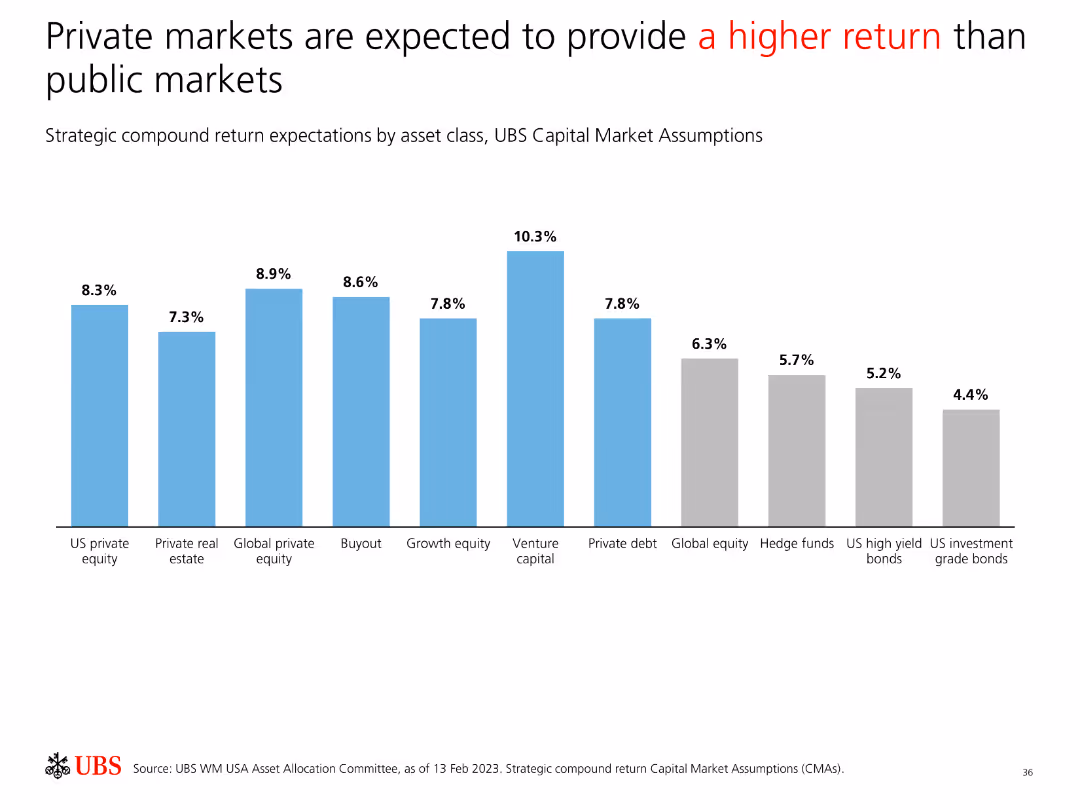
Features a bar chart comparing strategic compound return expectations by asset class, indicating higher returns for private markets compared to public markets.
Investment Analysis
Financial Services
Compares strategic compound return expectations, demonstrating that private markets are projected to offer higher returns than public markets across various asset classes.
Private Markets, Public Markets, Return Expectations, Asset Classes, Investment, Analysis, Comparison, Strategy, Performance
false
Private markets are expected to provide a higher return than public marketsPrivate markets asset allocation guide
Single Chart
UBS
View slide
The slide includes two main sections: one on the left with text and bullet points, and one on the right with three column charts showing percentages of boards' responses to various ESG-related actions.
Operational Efficiency
Environmental Services & Sustainability
It explains the different behaviors of highly resilient boards compared to less resilient ones, focusing on their actions and perceptions towards ESG issues, including climate change and governance.
resilience, behavior, climate change, governance, ESG
false
Our analysis reveals a 40-point gap or more in many of the questions related to ESG governance between highly resilient and less resilient boards.How can boards prioritize resilience to build trust and create value?
Multiple Chart
EY
View slide
Two column charts compare the market capitalization growth between US and China from 2010 to 2019, using flags for country identification and growth multiples noted on lines connecting the columns.
Market Analysis and Trends
Financial Services
This slide compares the growth in market capitalization of the top 10 companies in the US and China over nearly a decade, highlighting significant growth particularly in the US.
market capitalization, growth, US, China, top companies
false
Top 10 companies market cap¹ USD BBrazil Digital Report
Multiple Chart
McKinsey
View slide
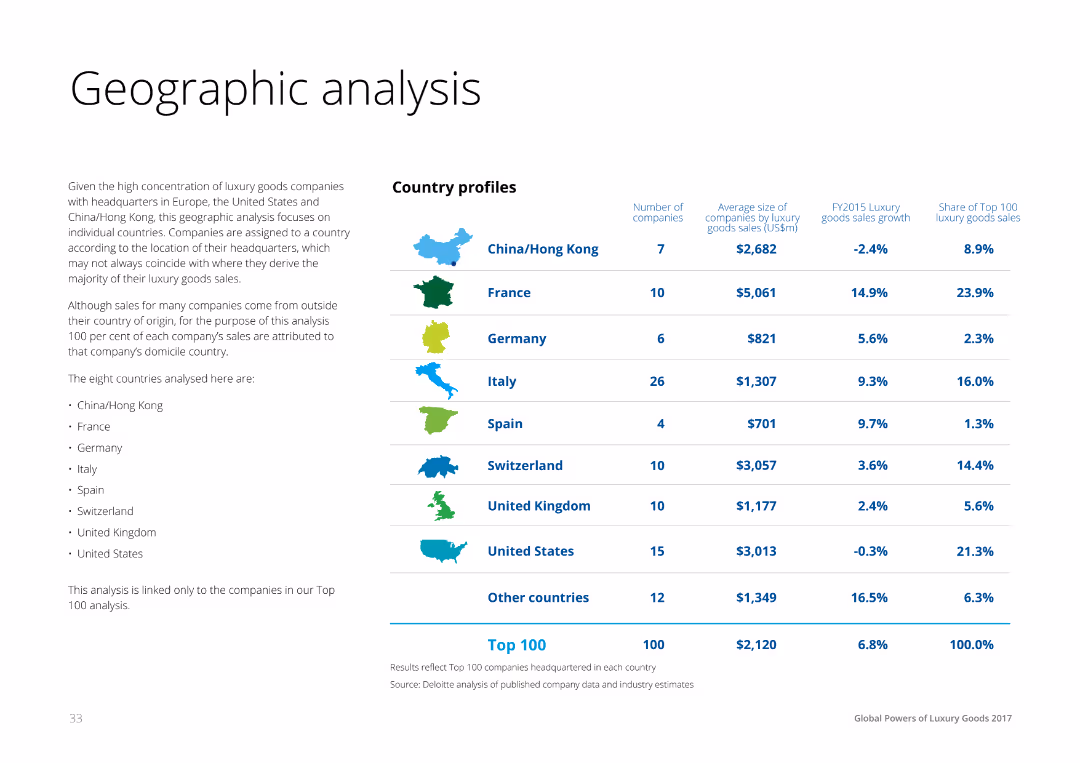
Text on the left with a table on the right showing country profiles for luxury goods markets, including the number of companies, average sales size, growth rates, and share of top 100 sales for countries like China, France, Germany, etc.
Market Analysis and Trends
Consumer Goods
This slide presents a geographic analysis of luxury goods markets, comparing countries by the number of companies, average sales size, growth rates, and market share. It provides insights into regional market dynamics and growth opportunities.
Geographic, Analysis, Luxury, Market, Countries
false
Geographic analysis Given the high concentration of luxury goods companies with headquarters in EuropeGlobal Powers of Luxury Goods 2017 The new luxury consumer
Table
Deloitte
View slide
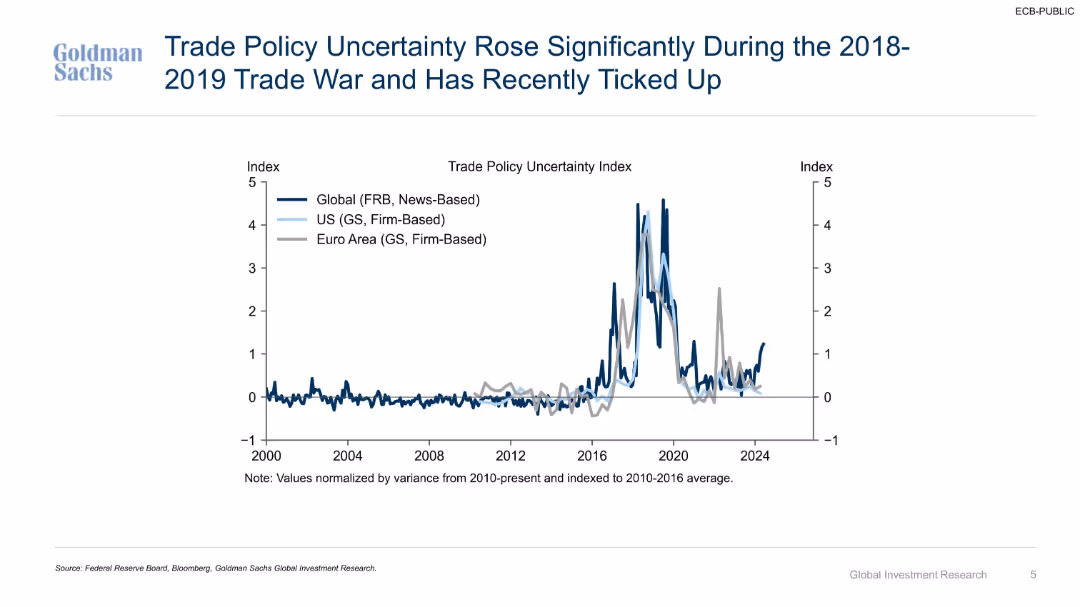
Time series line chart showing trade policy uncertainty indexes for global, U.S., and Euro Area from 2000–2024.
Risk Assessment and Management
Government & Public Sector
Tracks trade policy uncertainty using multiple indices, noting a major spike during the 2018–2019 trade war and a recent uptick. Demonstrates variance in global, U.S., and Euro Area trends over time.
trade war, uncertainty index, policy risk, historical trend, U.S., global, Euro Area, volatility, index analysis
false
Trade Policy Uncertainty Rose Significantly During the 2018–2019 Trade War and Has Recently Ticked UpImplications of Higher Tariffs for Euro Area and US Monetary Policy
Single Chart
Goldman Sachs
View slide
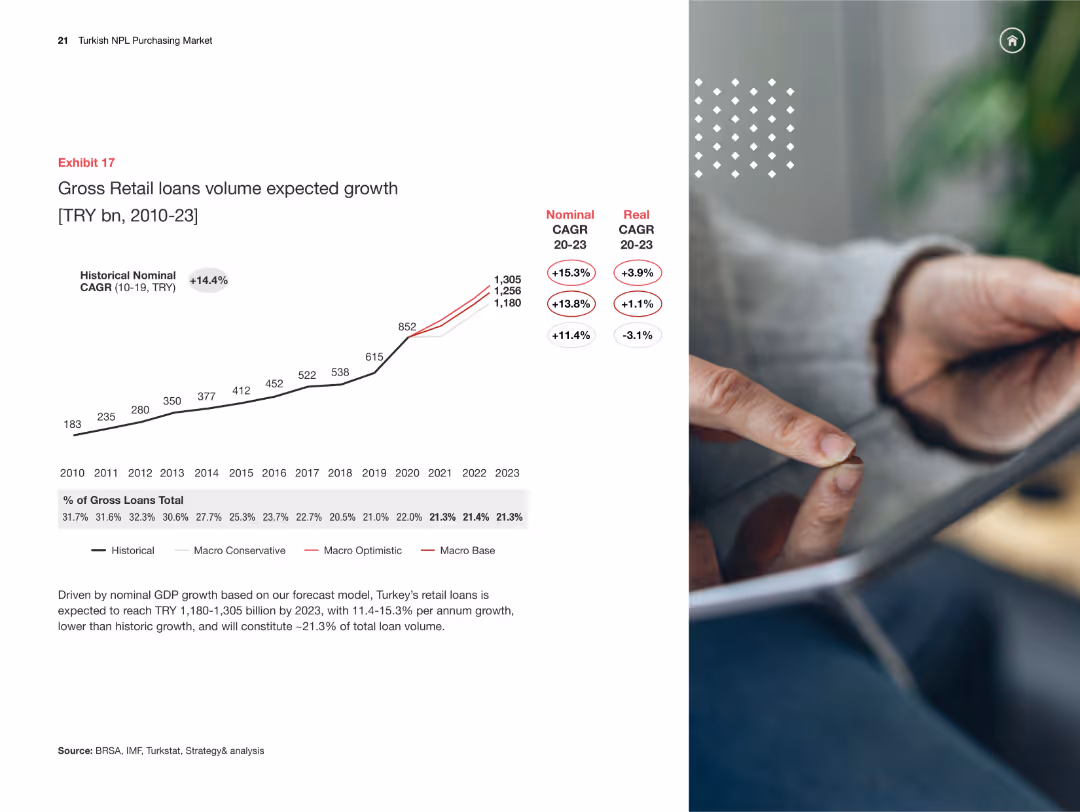
Line chart predicting gross retail loans volume growth from 2010-2023, with various growth scenarios.
Market Analysis and Trends
Financial Services
The slide projects the growth of retail loan volumes in Turkey from 2010-2023, analyzing different growth rates and economic conditions.
retail loans, growth forecast, macroeconomic analysis, financial trends, Turkey
false
Exhibit 17 Gross Retail loans volume expected growthTurkish NPL Purchasing Market Overview and the way forward
Mixed Chart
PwC/Strategy&
View slide
The slide features a column chart comparing reasons for holding value-referenced crypto assets (VRCAs) between 2022 and 2023, with horizontal bars for each reason.
Market Analysis and Trends
Financial Services
The slide presents data on why individuals hold VRCAs, highlighting the stability, ease of payment, portfolio diversification, and investment opportunities as key reasons.
Crypto assets, VRCAs, reasons, 2023, 2022, investment, portfolio, stability, payment ease, diversification
false
Reason(s) For Holding Value-Referenced Crypto Assets (VRCAs)CRYPTO ASSET SURVEY 2023
Mixed Chart
IPSOS
View slide
The slide features a circular diagram representing Citi's new organizational structure with segments like services, markets, banking, and wealth, accompanied by text detailing strategic changes.
Operational Efficiency
Financial Services
The slide explains Citi's revamped organizational structure to align with strategic goals, aiming to enhance efficiency, client focus, and governance.
Organizational Structure, Strategic Vision, Citi, Services, Markets, Banking, Wealth, Diagram, Alignment
false
New organizational structure is now aligned with strategic visionEarnings Results Presentation Fourth Quarter and Full Year 2023
Diagram
Citigroup
View slide
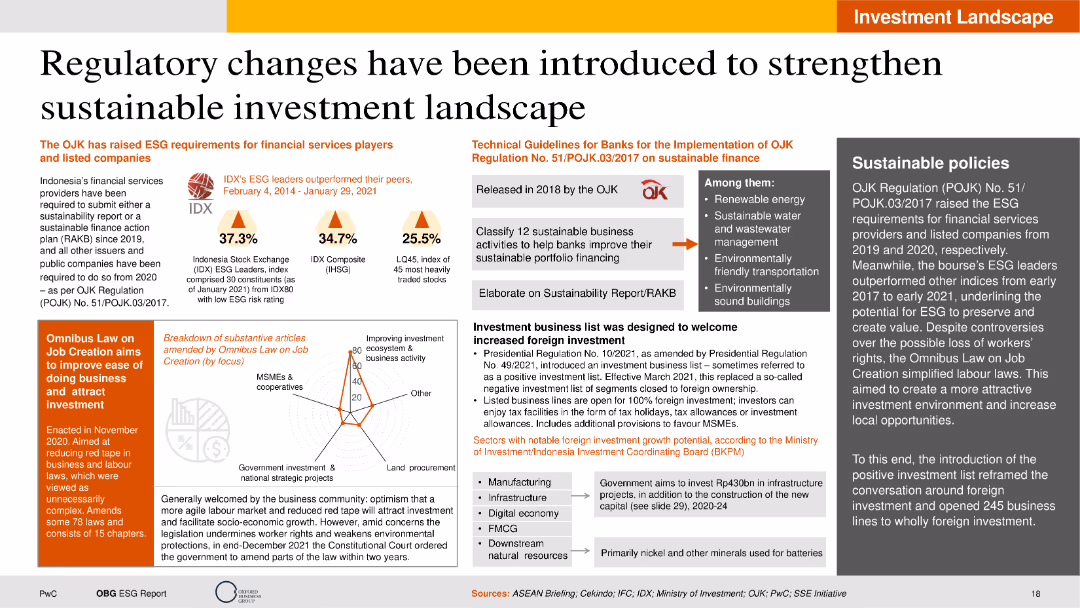
The slide is moderately dense with a combination of text, column charts, icons, and infographics. It has a clear layout featuring sections with distinct background colors for easy distinction. Key metrics are highlighted using column charts.
Regulatory and Compliance
Financial Services
The slide discusses recent regulatory changes in Indonesia aimed at strengthening the sustainable investment landscape. It covers the introduction of ESG requirements, technical guidelines for banks, and the impact of the Omnibus Law on job creation. The slide includes statistical performance data of IDX ESG leaders and highlights key areas for sustainable business activities.
Regulatory changes, ESG requirements, sustainable finance, Omnibus Law, IDX performance
false
Regulatory changes have been introduced to strengthen sustainable investment landscapeIndonesia’s Sustainable Transformation
Mixed Chart
PwC/Strategy&
View slide
The slide displays stacked column charts for client assets and various icons for future growth strategies. The colors include shades of brown, blue, and green, with clear data annotations.
Strategic Planning
Financial Services
The slide outlines the growth of client assets in alternative investments and the strategic initiatives for future growth in real estate, infrastructure, and private equity.
Alternatives, Innovation, Growth, Client Assets, Investment, Real Estate, Infrastructure, Private Equity, Strategy
false
Alternatives: Harnessing 50 years of innovation to drive growth Asset & Wealth Management 2020
Multiple Chart
JP Morgan
View slide
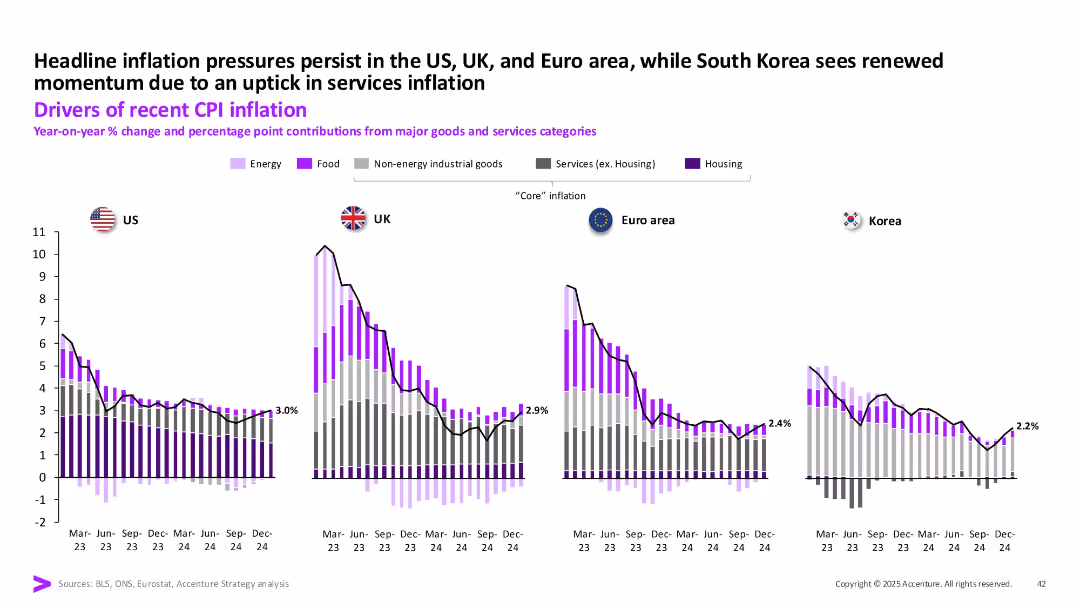
Four-panel bar and line chart visualizing year-on-year % CPI changes in US, UK, Euro Area, and Korea, with colored bar segments for different goods and services categories.
Market Analysis and Trends
Financial Services
This slide analyzes the persistence of inflation across the US, UK, Euro area, and Korea. It highlights contributions of various sectors like energy, food, housing, and services to inflation and notes regional differences in inflation momentum, especially South Korea’s services-led uptick.
CPI, inflation, US, UK, Euro area, Korea, services inflation, housing, food, energy
false
Headline inflation pressures persist in the US, UK, and Euro area, while South Korea sees renewed momentum due to an uptick in services inflationFebruary Macro Brief
Single Chart
Accenture
View slide
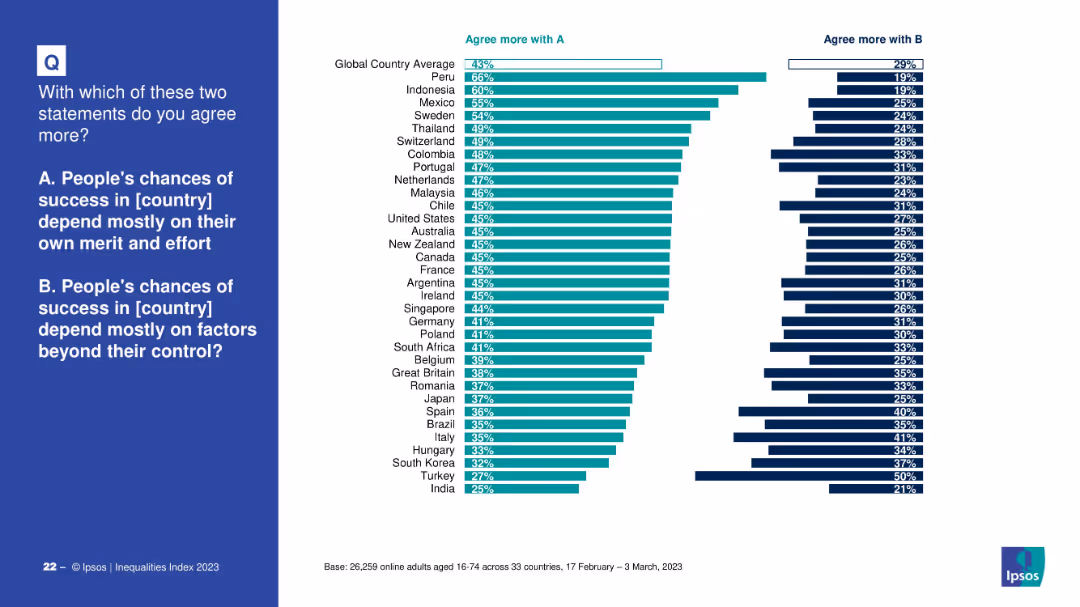
Bar chart comparing global and country-level agreement with: A) Success depends on merit and effort; B) Success depends on external factors. Dark teal vs. dark blue colors distinguish responses.
Market Analysis and Trends
Government & Public Sector
The slide captures attitudes across countries on whether success is determined by personal merit or external conditions. The global average leans slightly toward merit-based views, but with large variation between countries such as Peru (high merit belief) and India (low merit belief).
success, merit, external factors, perception, Ipsos, socioeconomics, global attitudes, inequality, control
false
With which of these two statements do you agree more?IPSOS EQUALITIES INDEX 2023
Mixed Chart
IPSOS
View slide
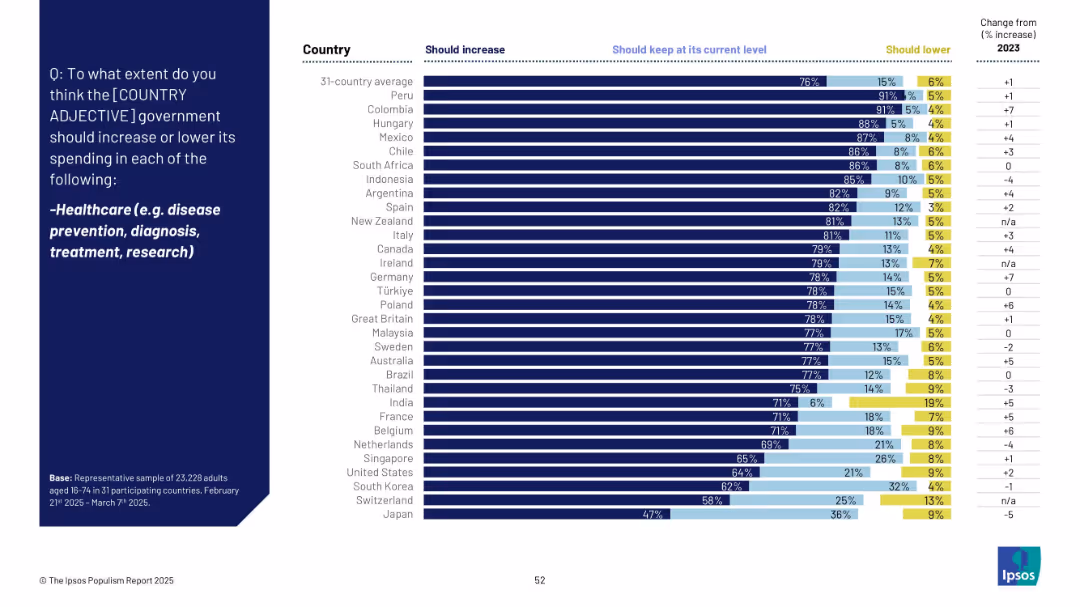
Horizontal bar chart showing public opinion on whether healthcare spending should be increased, maintained, or lowered, with % change from 2023.
Strategic Planning
Healthcare & Pharmaceuticals
The majority of respondents in most countries (76% avg) favor increased government spending on healthcare. Support is highest in Peru, Colombia, and Hungary. Japan and Switzerland have lower percentages, possibly reflecting different national contexts.
healthcare, disease prevention, spending, public services, medical care, Ipsos, global, bar chart
false
Healthcare (e.g., disease prevention, diagnosis, treatment, research)THE IPSOS POPULISM REPORT 2025
Mixed Chart
IPSOS
View slide
This slide presents two line charts showing the long-term and recent market performance of the waste management and environmental services sectors, compared to the S&P 500 Index.
Financial Performance
Environmental Services & Sustainability
The slide analyzes the market performance of waste management and environmental services sectors, highlighting their recovery from COVID-19 impacts and long-term growth trends, with detailed financial data and comparative analysis.
Market performance, COVID-19 recovery, environmental services, waste management, financial analysis, S&P 500, long-term growth
false
Sector public valuations have largely recovered from the initial market shock brought on by COVID-19Environmental Services Outlook
Multiple Chart
LEK
View slide
The slide uses a structured three-column layout with icons, bullet points, and a case study scenario header. It highlights the client's background and requirements on the left, with the provided solutions on the right. The design is clean and organized, ensuring focus on content.
Client Case Studies
Technology & Software
Showcasing a client case study, the slide details how a quick-service restaurant built a digital presence through a comprehensive mobile solution and payment system, illustrating the effectiveness of digital solutions in enhancing customer service and operational efficiency.
digital presence, client case study, mobile solutions, payment systems, customer loyalty, security, transaction processing, order-ahead
false
How one client built a strong digital presenceKEEP MOVING FORWARD
Boxed
JP Morgan
View slide
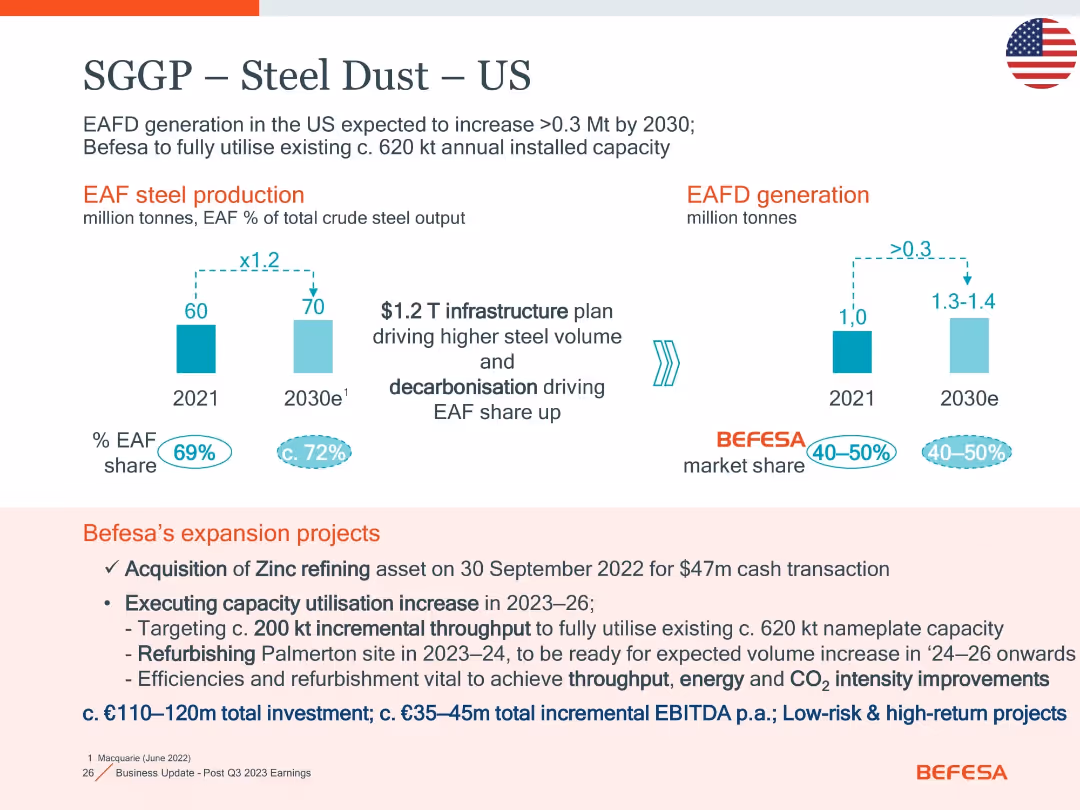
Two bar charts for EAF production and EAFD generation; bottom section lists Befesa’s US expansion actions and investment details.
Strategic Planning
Industrial & Manufacturing
Focuses on EAFD growth and market share in the US through 2030. It outlines Befesa’s strategic projects, including zinc refining and Palmerton refurbishment, with low-risk high-return investments (€110–120m) aimed at capacity and efficiency improvement.
EAFD, expansion, zinc refining, Palmerton, CO2, throughput, investment
false
SGGP – Steel Dust – USGoldman Sachs 4th Annual Carbonomics Conference
Mixed Chart
Goldman Sachs
View slide
This slide shows a column chart illustrating a 10-year financial performance with another line graph overlay showing the growth rate. It uses shades of blue to distinguish years and performance metrics, with annotations for key statistics.
Financial Performance
Financial Services
Designed for financial review, the slide shows long-term growth and returns, making it suitable for investor presentations, annual reports, and financial analysis discussions.
growth, returns, financial, performance, analysis, long-term, metrics, banking, investment, trends
false
We have consistently driven core growth and strong returns over the long termConsumer & Community Banking
Single Chart
JP Morgan
View slide
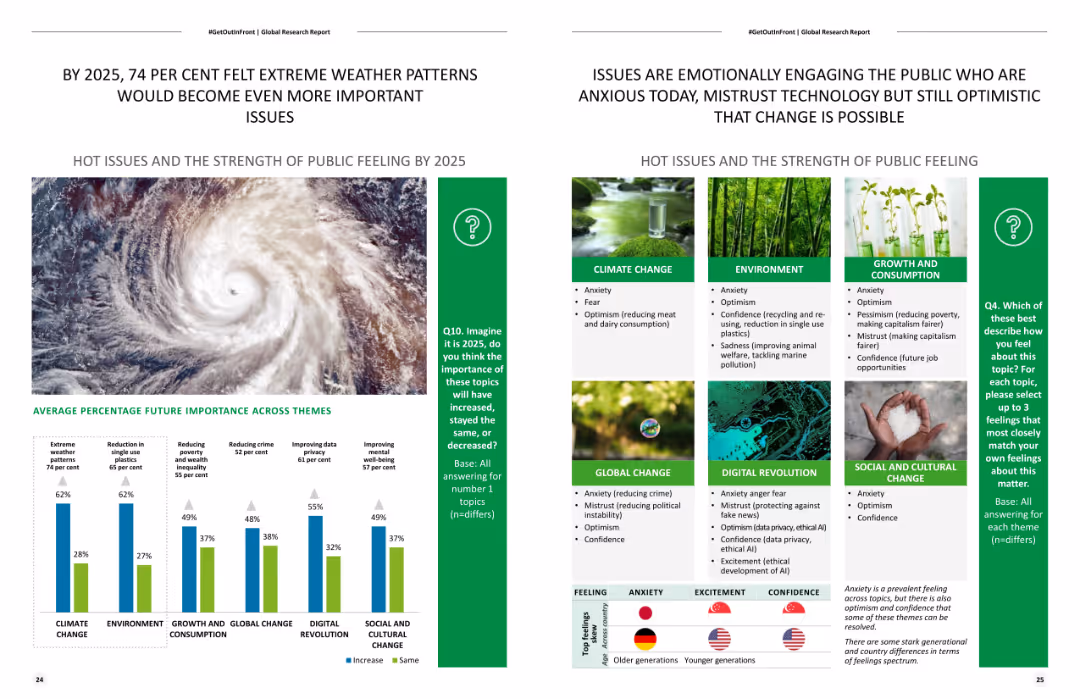
Features a column chart and a list of themes with percentages showing expected future importance of various issues. It also includes a large image of a hurricane.
Strategic Planning
Environmental Services & Sustainability
Predicts the future importance of various global issues by 2025, with a focus on extreme weather patterns and public sentiment analysis on environmental changes.
Future trends, extreme weather, environmental impact, strategic planning, public sentiment
false
BY 2025, 74 PER CENT FELT EXTREME WEATHER PATTERNS WOULD BECOME EVEN MORE IMPORTANTISSUES#GetOutInFront
Mixed Chart
Deloitte
View slide
This slide presents a simple, three-part horizontal comparison layout, using arrows to indicate reductions and green bars to visualize savings for clients in different financial areas.
Financial Performance
Financial Services
The slide demonstrates JPMorgan’s efforts in reducing various fees and commissions, quantifying the annual savings for clients, intended to showcase cost efficiency.
cost reduction, client savings, JPMorgan, fees, commissions, percentage decrease, financial services
false
Consistent: Actively reducing costs for our clientsAsset & Wealth Management 2019
Multiple Chart
JP Morgan
View slide
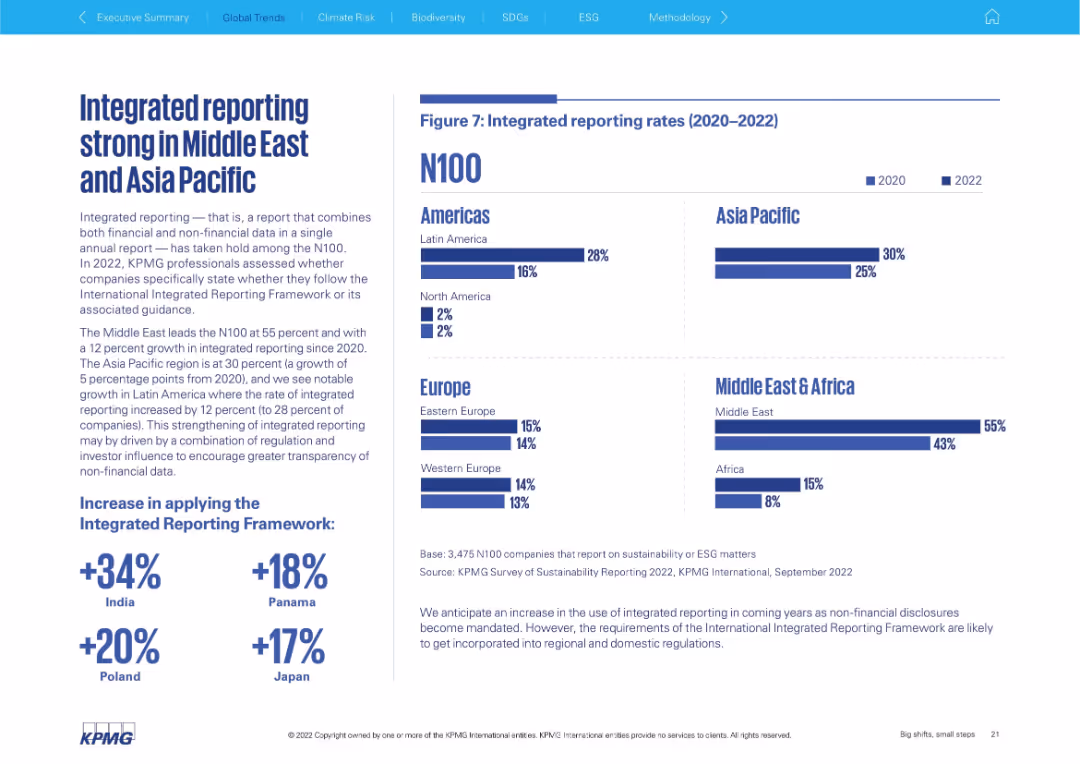
Text block on left explaining integrated reporting; right side has horizontal bar chart by region (2020 vs 2022)
Technology and Digital Transformation
Professional Services
Highlights the rise of integrated reporting (financial + non-financial data) among N100 companies, especially in the Middle East (55%) and Asia Pacific (30%). Bar chart compares 2020 vs 2022 across all regions.
integrated reporting, ESG, non-financial data, Middle East, Asia Pacific, transparency, framework adoption
false
Integrated reporting strong in Middle East and Asia PacificBig shifts, small steps Survey of Sustainability Reporting 2022
Mixed Chart
KPMG
View slide
Slide contains column charts tracking litigation provisions and contingent liabilities across multiple quarters, complemented by textual highlights that summarize key changes and implications for the bank.
Regulatory and Compliance
Financial Services
Offers an update on the bank's litigation provisions and contingent liabilities, essential for legal and financial risk management. Provides insights into potential financial impacts and compliance issues, aiding in strategic planning and investor relations.
litigation, contingent liabilities, risk management, financial impact, legal compliance
false
Litigation update In € bn, period endQ4 / FY 2023 results
Multiple Chart
Deutsche Bank
View slide
Four quadrant-style bar charts with percentile ranks and color-coded results; includes titles and subheadings in purple for emphasis
Performance Metrics and KPIs
Financial Services
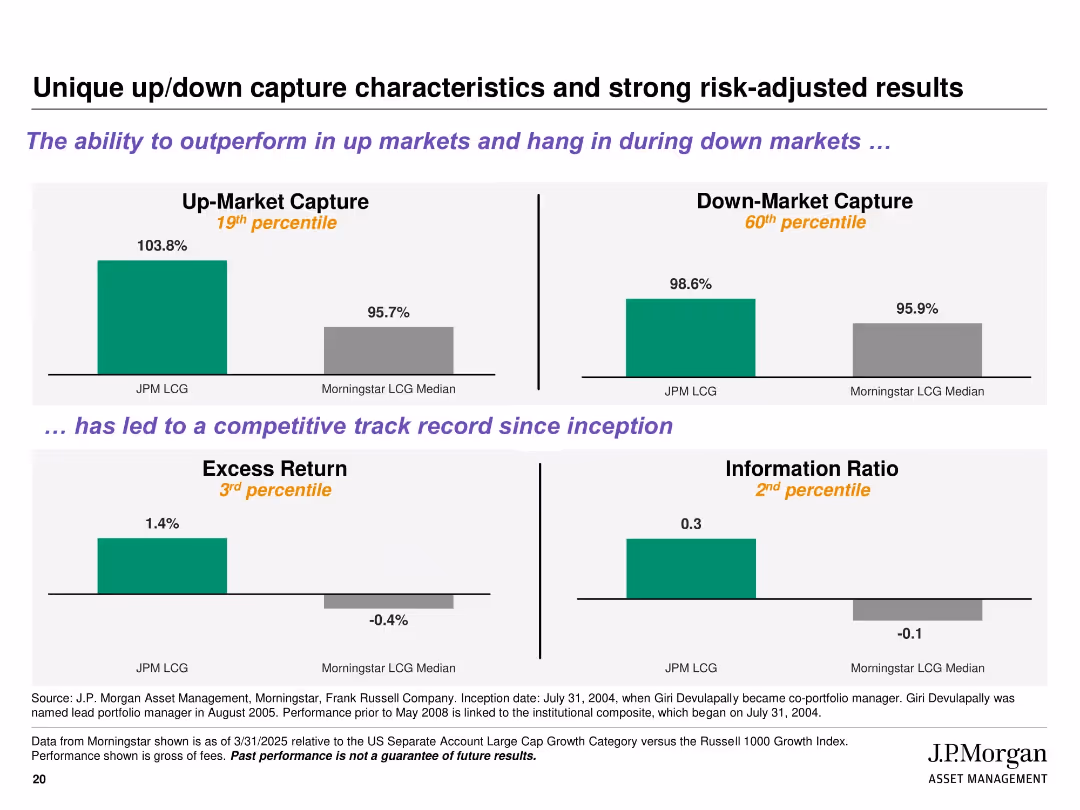
Illustrates the strategy's ability to outperform in up markets and remain resilient in down markets. Key metrics shown include Up/Down Market Capture, Excess Return, and Information Ratio, benchmarked against Morningstar LCG median, with percentile ranks indicating strong risk-adjusted returns.
up-market capture, down-market capture, excess return, risk-adjusted, percentile, J.P. Morgan, performance, Morningstar
false
Unique up/down capture characteristics and strong risk-adjusted resultsJ.P. Morgan Large Cap Growth Strategy Separately Managed Account
Multiple Chart
JP Morgan
View slide
The slide features column charts and lists showing the reasons for esports consumption and criteria for content selection. The layout is organized with clear visual hierarchy.
Customer and Market Segmentation
Media & Entertainment
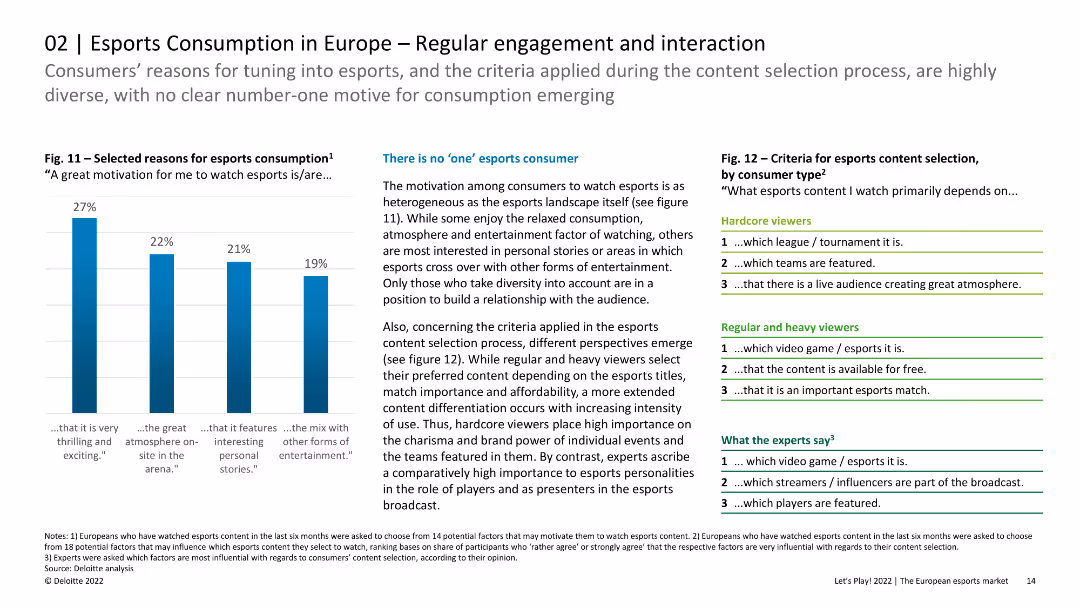
The slide discusses the diverse motivations and criteria for esports consumption among European viewers, indicating that there is no single dominant reason. It highlights the importance of content differentiation for hardcore, regular, and heavy viewers.
Esports, Engagement, Interaction, Content Selection
false
Consumers’ reasons for tuning into esports, and the criteria applied during the content selection process, are highly diverse, with no clear number-one motive for consumption emergingLet’s Play! 2022 The European esports market
Mixed Chart
Deloitte
View slide
Horizontal bar chart with annual LIF data from 2014–2023 and corresponding % coverage below.
Performance Metrics and KPIs
Financial Services
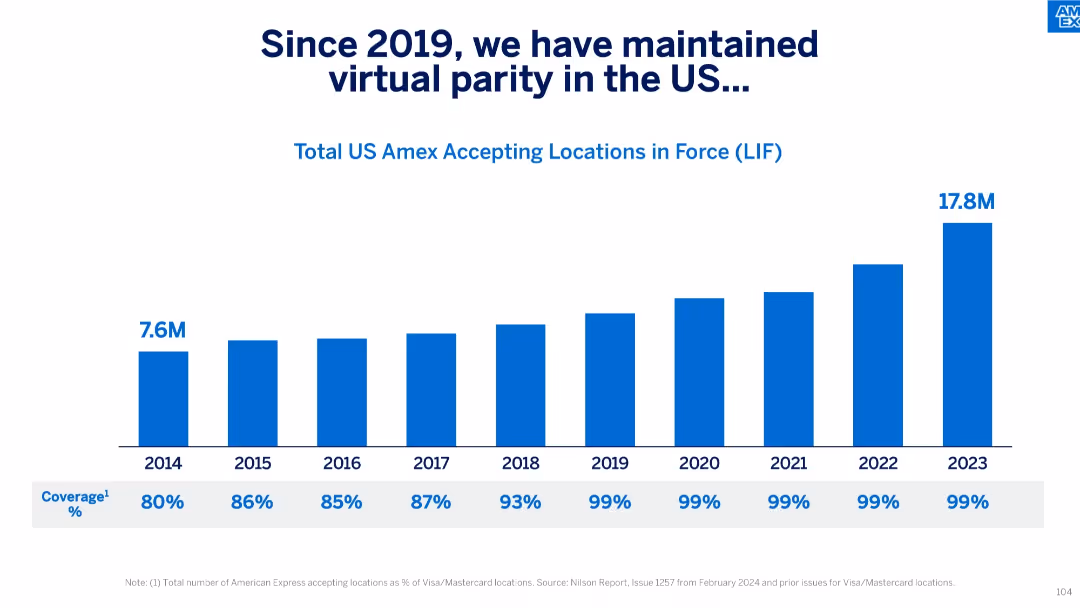
The slide tracks the number of US locations accepting Amex from 2014 to 2023, reaching 17.8M and achieving 99% parity with Visa/Mastercard since 2019. It highlights consistent improvements in card acceptance coverage in the US market.
Amex Acceptance, US Market, Coverage, LIF, Visa Parity, Metrics, Annual Growth, KPIs
false
Since 2019, we have maintained virtual parity in the USAmerican Express Investor Day 2024
Single Chart
McKinsey
View slide
This slide features a column chart listing various environmental actions and the likelihood of people taking them in 2021. The chart uses two colors to indicate "Likely" and "Unlikely."
Market Analysis and Trends
Environmental Services & Sustainability
The slide shows survey results on the likelihood of individuals taking different environmental actions in 2021, highlighting the popularity of lower-impact actions over higher-impact ones.
environmental actions, likelihood, survey, 2021, impact
false
Many feel they are likely to take action in 2021, though lower impact actions are more popular than higher impact actionsEARTH DAY 2021 GLOBAL ADVISOR https://www.ipsos.com/en/earth-day-2021-globally-people-wonder-whats-plan-tackle-climate-change Public opinion and action on climate change
Multiple Chart
IPSOS
View slide
Bar chart by country, showing support levels for family reunification policies; full/limited/no access.
Regulatory and Compliance
Government & Public Sector
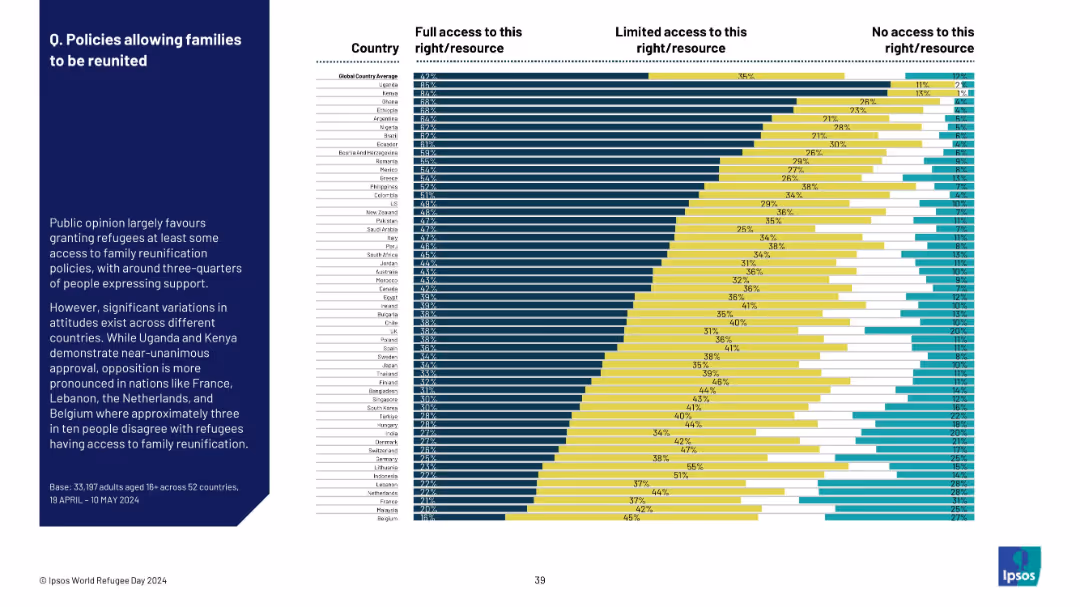
This slide shows public support for refugee family reunification policies. Uganda and Kenya display strong support, while countries like Belgium, Malaysia, and France show notable opposition to such access.
refugees, family reunification, access rights, support levels, policy perception, public sentiment, Ipsos
false
Q. Policies allowing families to be reunitedWORLD REFUGEE DAY
Mixed Chart
IPSOS
View slide
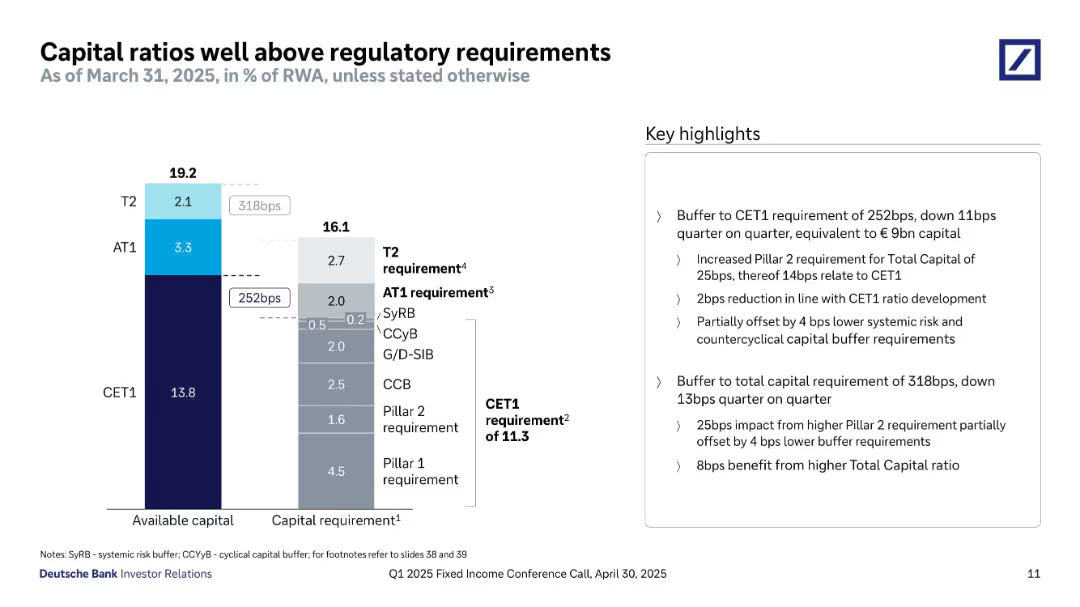
A vertical stacked bar chart compares available capital (T2, AT1, CET1) against regulatory requirements. A clear side-by-side layout with consistent color codes for capital types. Key highlights are listed on the right.
Regulatory and Compliance
Financial Services
This slide shows Deutsche Bank’s capital ratios are significantly above minimum regulatory requirements. The CET1 ratio has a 252bps buffer, while total capital has a 318bps buffer. The slide also breaks down regulatory minimums including Pillar 1 and 2, G-SIB, and countercyclical buffers. Highlights explain drivers of changes in buffer sizes and the impact of increased Pillar 2 requirements and changes in systemic buffer levels.
CET1, capital buffer, regulatory requirements, AT1, T2, Pillar 1, Pillar 2, G-SIB, capital adequacy
false
Capital ratios well above regulatory requirementsQ1 2025 Fixed Income Investor Conference Call
Mixed Chart
Deutsche Bank
View slide
Column chart comparing the top ten countries where physical health is prioritized over mental health, along with text comparing mental and physical health priorities in selected countries.
Customer and Market Segmentation
Healthcare & Pharmaceuticals
This slide compares the emphasis on physical versus mental health across various countries, identifying those where physical health is given more priority, with specific data from Kenya, Panama, etc.
physical health, mental health, priority, comparison, survey
false
Physical health remains a greater priority than mental health in some marketsA NEW WORLD DISORDER?
Mixed Chart
IPSOS
View slide
Depicts pie charts and a bar graph detailing respondent demographics by job title and company revenue for a consumer survey, titled 'Sample Composition'.
Market Analysis and Trends
Media & Entertainment
Analyzes respondent demographics of an executive survey, including titles and company revenue, relevant for market segmentation studies.
Demographics, Executive Survey, Job Titles, Company Revenue, Market Segmentation, Consumer Goods
false
Sample CompositionConsumers at 250
Multiple Chart
Kearney
View slide
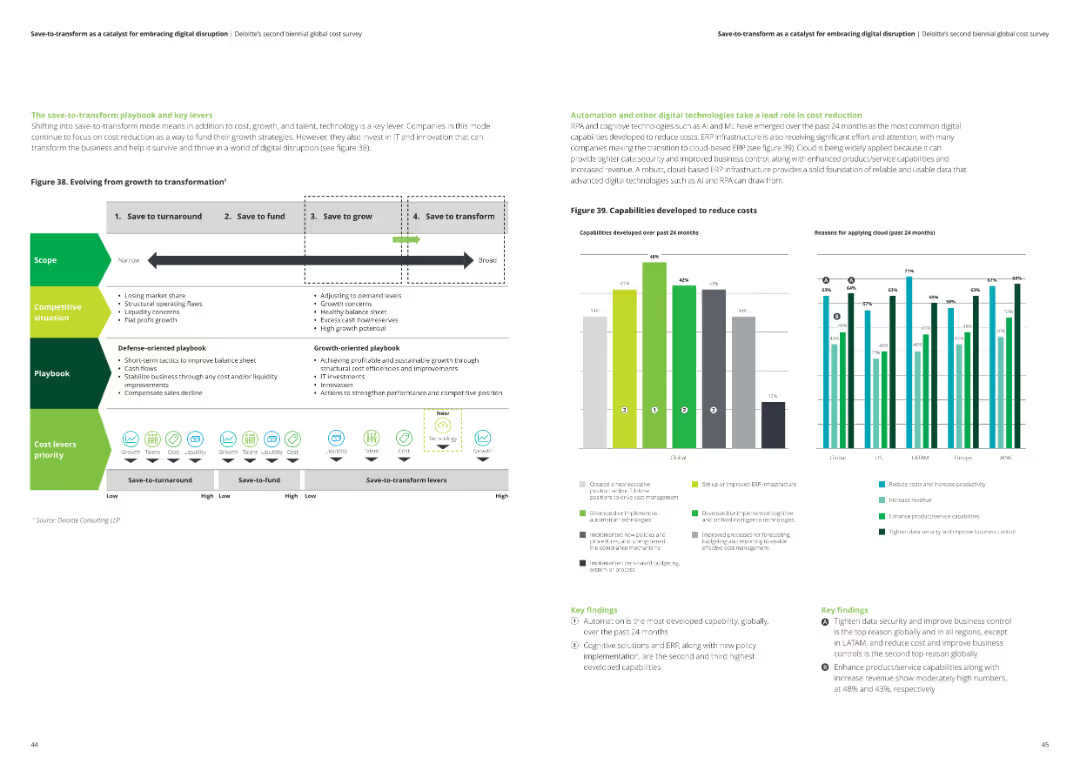
The slide includes a roadmap with phases such as "save-to-turnaround," "save-to-fund," "save-to-grow," and "save-to-transform." There are bar charts showing capabilities developed to reduce costs over the past 24 months.
Strategic Planning
Professional Services
This slide describes the progression from cost-saving strategies to transformative growth initiatives. It also highlights capabilities like automation and cloud adoption, developed to reduce costs and enhance productivity.
transformation, growth, cost reduction, automation, cloud adoption, roadmap
false
The save-to-transform playbook and key leversSave-to-transform as a catalyst for embracing digital disruption Deloitte’s second biennial global cost survey
Multiple Chart
Deloitte
View slide
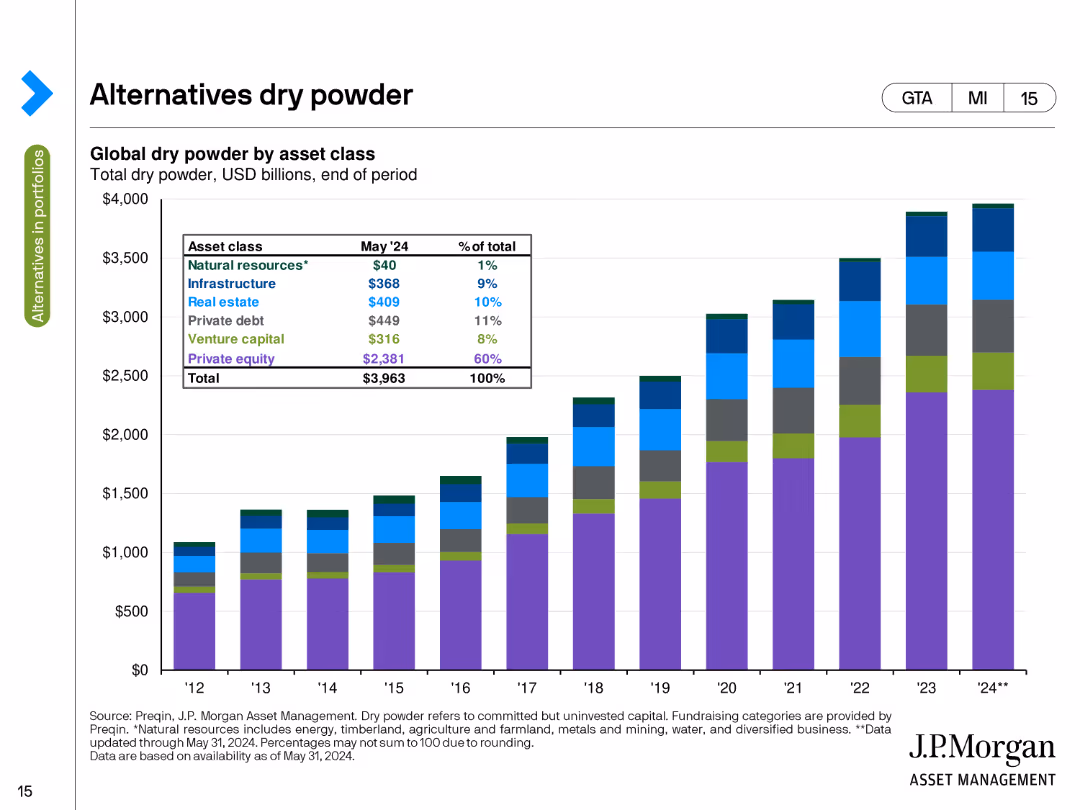
The slide presents a stacked column chart showing global dry powder by asset class in USD billions as of the end of May 2024. The chart uses different colors to depict natural resources, infrastructure, private equity, and other categories.
Investment Analysis
Financial Services
This slide details the amount of uninvested capital (dry powder) available in various asset classes, such as natural resources, infrastructure, and private equity, highlighting the total capital ready for deployment at the end of May 2024.
Dry Powder, Asset Classes, Uninvested Capital, USD Billions, Deployment
false
Alternatives dry powderGuide to Alternatives
Single Chart
JP Morgan
View slide
This slide includes a section for core strengths with text, business highlights, and a graphical strategy focus area with icons.
Market Analysis and Trends
Financial Services
It details the commercial banking strategy and performance, with a focus on revenue growth, highlighting the bank's strengths and strategic initiatives.
performance, strategy, commercial banking, assets, revenue growth, market expansion, client acquisition, capital markets
false
Commercial Banking | Executive Summary2022-2024 Bank Handlowy Group Strategy
Text Only
Citigroup
View slide
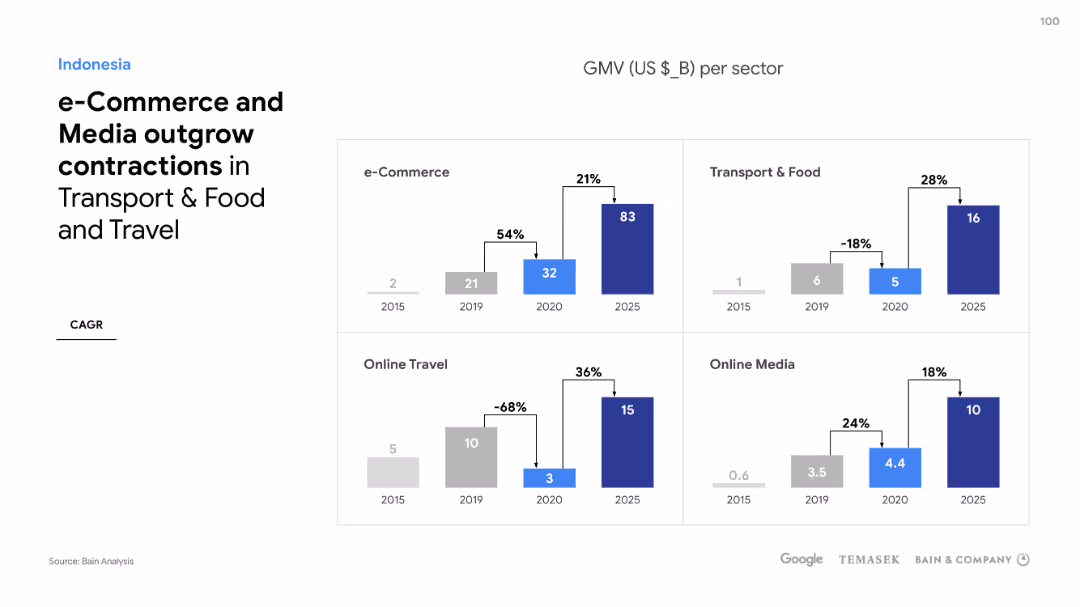
Four separate column charts compare sector growths such as e-Commerce, Online Travel, Transport & Food, and Online Media in Indonesia, with percentage changes.
Market Analysis and Trends
Technology & Software
Discussing sector performance in Indonesia's digital economy, the slide shows e-Commerce and Media outgrowing other sectors despite market downturns.
e-Commerce, Media, Sector growth, Indonesia, Digital economy, Market downturns, Online Travel, Transport & Food
false
Indonesia e-Commerce and Media outgrow contractions in Transport & Food and Travele-Conomy SEA 2020 At full velocity: Resilient and racing ahead
Multiple Chart
Bain
View slide
Minimalistic design; clean white background with grey tables; financial metrics across 2021–Q1 2024
Financial Performance
Financial Services
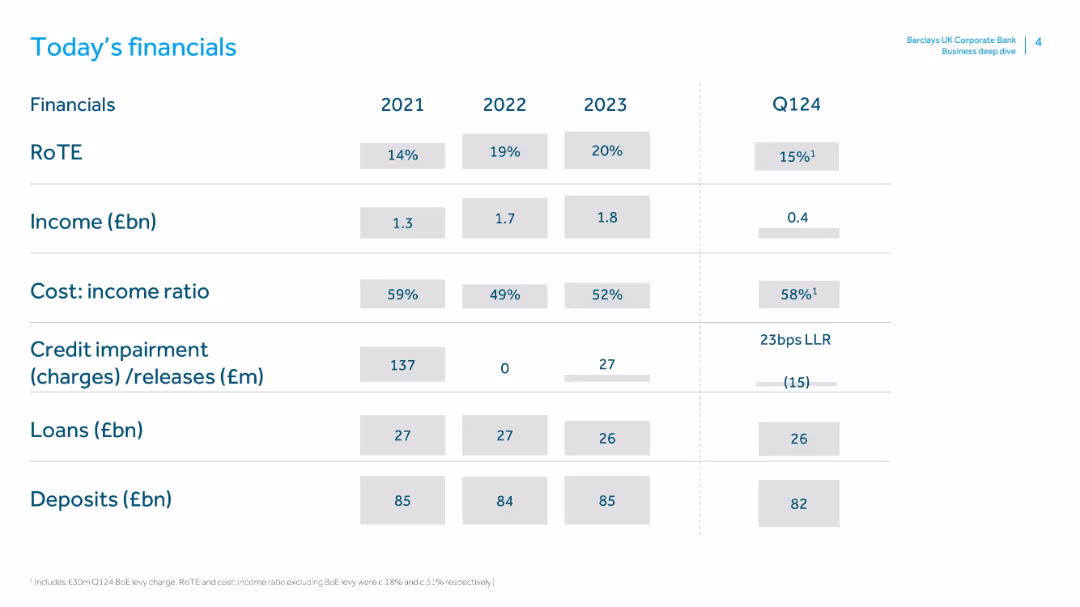
This slide summarizes Barclays UK Corporate Bank's financial performance across 2021–Q1 2024. Metrics include RoTE, income, cost:income ratio, credit impairment, loans, and deposits. It shows income growth and improved cost efficiency from 2021–2023, with Q1 2024 metrics still in early reporting phase. Provides snapshot of profitability and operational performance.
Barclays, RoTE, income, cost efficiency, credit impairment, deposits, loans, UK bank, Q1 2024, financial overview
false
Today’s financialsBarclays UK Corporate Bank Business deep dive: 18th June 2024
Single Chart
Barclays
View slide
Line chart tracking public sentiment over time; two lines (good vs. bad); minimal text; annotated endpoints.
Market Analysis and Trends
Financial Services
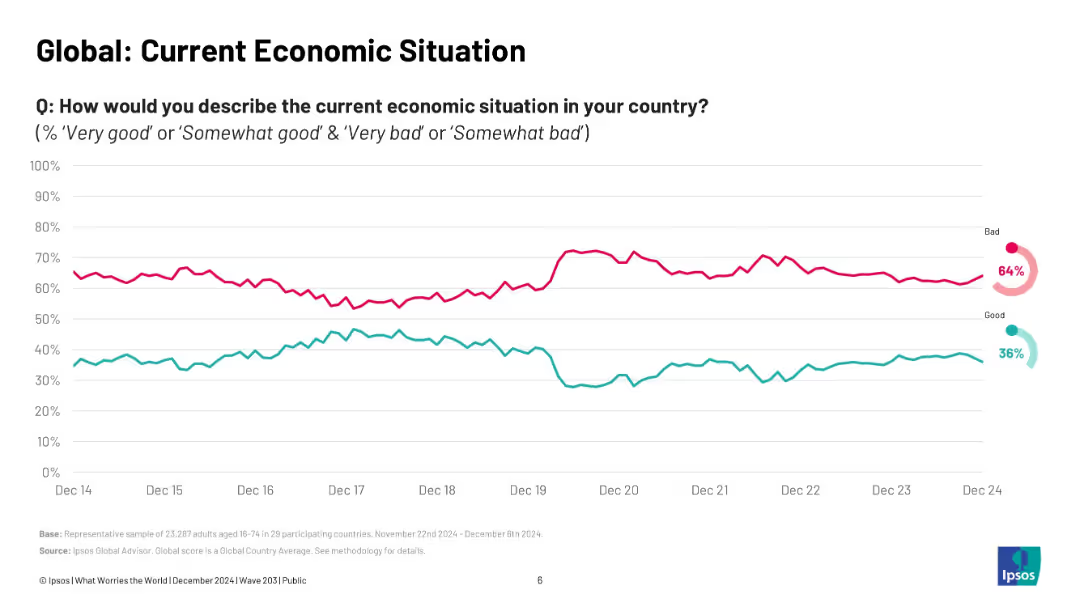
The slide shows a long-term trend of public perception regarding national economic situations globally. Since 2020, sentiment has been increasingly negative, with a persistent majority rating conditions as "bad."
economy, perception, Ipsos, long-term trend, financial sentiment, economic health, global view, timeline, data tracking, public outlook
false
Global: Current Economic SituationWHAT WORRIES THE WORLD? 2024
Multiple Chart
IPSOS
View slide
Line chart comparisons across EUR, US, and UK regions with national flags and CET1 depletion vs. capital flexibility axes. Uses color-coded backgrounds for impact zones.
Risk Assessment and Management
Financial Services
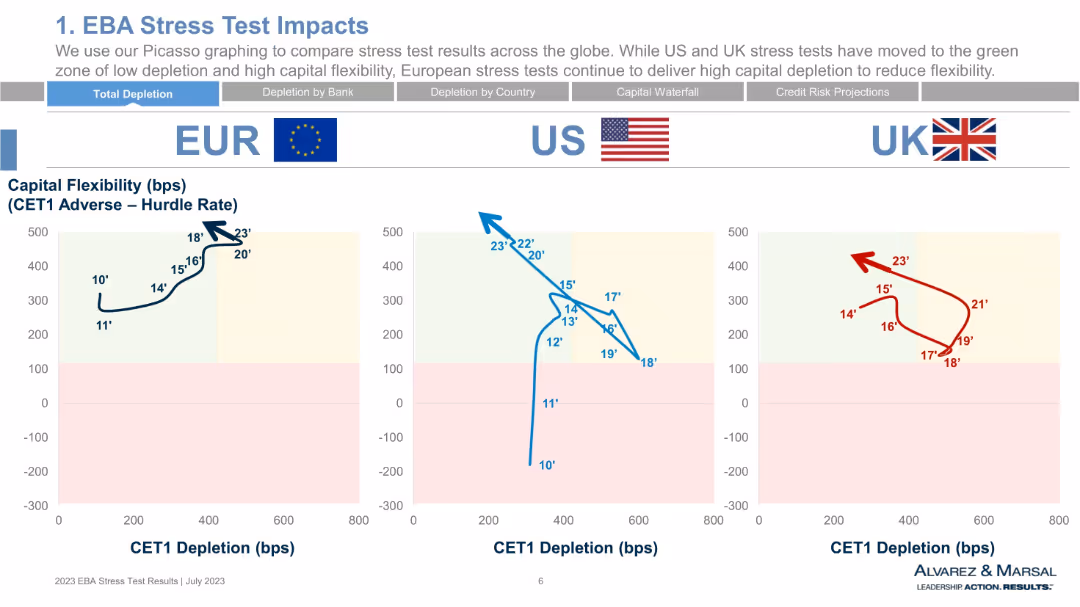
This slide compares CET1 depletion and capital flexibility by region (EU, US, UK) from 2010 to 2023. It shows regional trends and positions banks in “green” or “red” zones based on stress test outcomes. The EU shows high capital flexibility with moderate depletion, unlike the UK and US.
CET1, capital flexibility, EU vs US vs UK, stress testing, depletion, risk zones
false
We use our Picasso graphing to compare stress test results across the globe. While US and UK stress tests have moved to the green zone of low depletion and high capital flexibility, European stress tests continue to deliver high capital depletion to reduce flexibility.2023 EU Wide EBA Stress Test Our First Glance at Results
Single Chart
Alvarez & Marsal
View slide
Features a comparative line graph analyzing the performance of M&A deals during weak and strong economic conditions.
Mergers and Acquisitions
Financial Services
Compares the outcomes of mergers and acquisitions during different economic conditions, highlighting the superior performance of deals made during economic downturns.
M&A, economic conditions, downturns, performance, comparative analysis
false
Weak-economy M&A deals outperform strong-economy dealsFacts, scenarios, and actions for leaders Publication #3 with a focus on Emerging Stronger from the Crisis
Single Chart
BCG
View slide
Text and chart layout showing projected supply and demand gaps for lithium, nickel, and cobalt to 2030. Left side contains risk assessment text, right shows stacked bar charts.
Risk Assessment and Management
Energy & Utilities
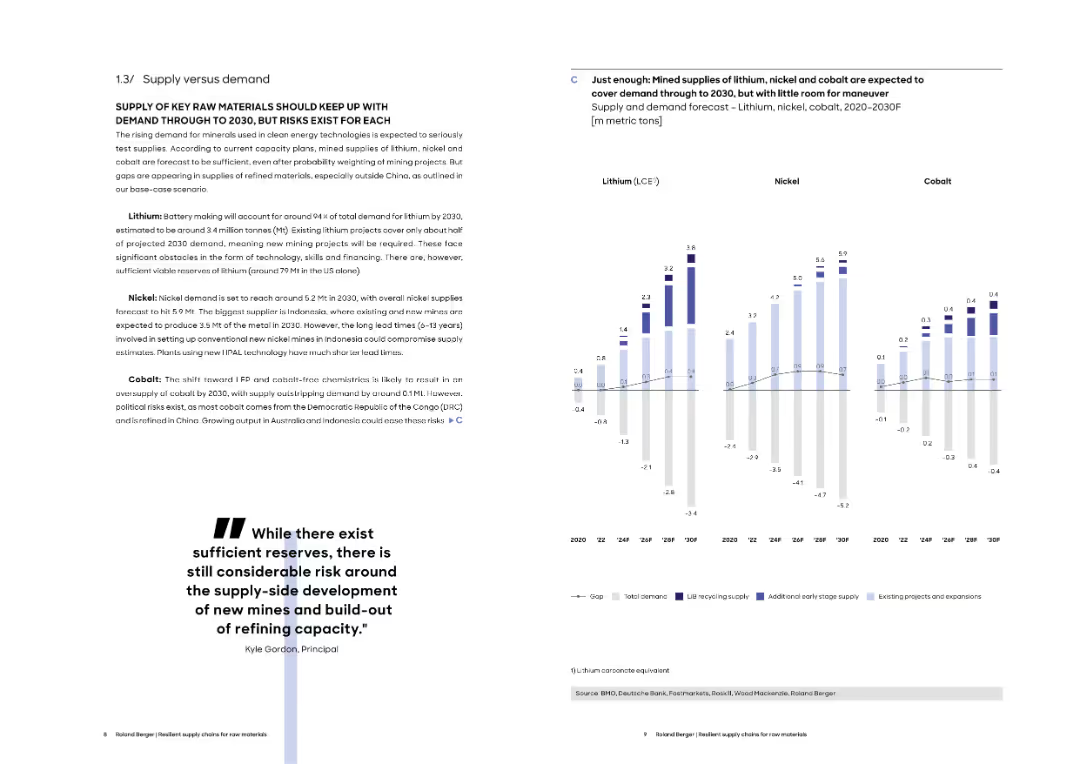
The slide assesses future supply-demand dynamics of lithium, nickel, and cobalt, projecting that while supplies may meet demand by 2030, risks remain due to long lead times and geopolitical constraints. Charts illustrate projected shortfalls and recovery trajectories.
supply demand, lithium, cobalt, nickel, raw materials, mining, shortages, projections
false
Just enough: Mined supplies of lithium, nickel and cobalt are expected to cover demand through to 2030, but with little room for maneuverResilient supply chains for raw materials
Mixed Chart
Roland Berger
View slide
This slide is divided into three sections colored in shades of green, detailing organizational, technical, and connection-building steps towards digital marketing maturity. Icons and checklists summarize the actions required at each stage of maturity, from nascent to multi-moment levels.
Market Analysis and Trends
Media & Entertainment
Provides a structured roadmap for brands to enhance their digital marketing effectiveness, highlighting steps like ensuring C-suite sponsorship, leveraging partnerships, and embedding a 'data-first' mindset. The slide is a practical guide for developing a comprehensive digital marketing strategy.
digital marketing, roadmap, strategy, C-suite, partnerships, data, maturity
false
There is a clear path brands can follow to achieve full benefits of digital marketingUnderstanding the path to digital marketing maturity
Linear Flow
BCG
View slide
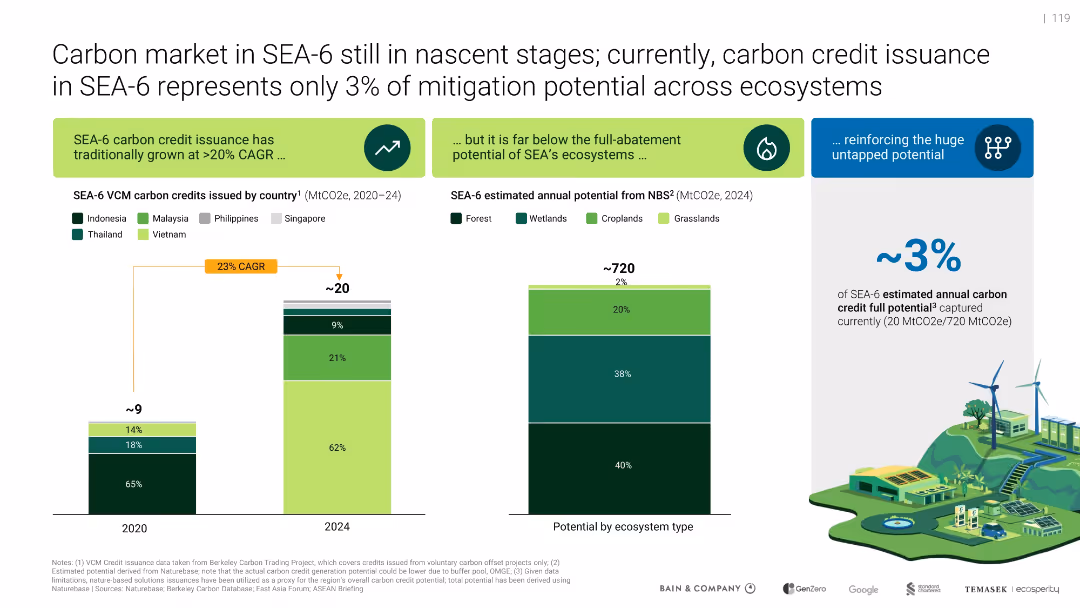
Side-by-side bar charts: carbon credits by country and mitigation potential by ecosystem type; includes CAGR arrow and ecosystem illustration.
Market Analysis and Trends
Environmental Services & Sustainability
Shows SEA-6 carbon market issuance (~3% of potential), with a CAGR of 23% (2020–2024). Emphasizes vast untapped mitigation potential across forest, wetlands, croplands. Illustrates current underperformance relative to ecosystem capacity.
carbon market, SEA-6, mitigation, VCM, ecosystems, CAGR
false
Carbon market in SEA-6 still in nascent stages; currently, carbon credit issuance in SEA-6 represents only 3% of mitigation potential across ecosystemsSoutheast Asia's Green Economy
Multiple Chart
Bain
View slide
The slide has a text area with a header and two line graphs comparing the perspectives of millennials and Gen Z on businesses' societal impact from 2016 to 2021. The design is straightforward with a mix of green and yellow lines against a white backdrop.
Organizational Structure and Change
Technology & Software
This slide reflects the shifting perspectives of millennials and Gen Z regarding the role of businesses in society. It discusses a trend where fewer individuals view businesses as a force for good, with line graphs showing the percentage of those who agree with this sentiment from 2016 to 2021. The information is vital for understanding corporate reputation and social responsibility practices.
Business Impact, Society, Millennials, Gen Z, Line Graph, Corporate Responsibility, Trends, Sentiment Analysis
false
Opinions of business stabilizeThe Deloitte Global 2021 Millennial and Gen Z Survey
Mixed Chart
Deloitte
View slide
Two sets of column charts detailing negative goodwill and purchase price adjustments, including PPA adjustments.
Mergers and Acquisitions
Financial Services
Explains the negative goodwill and purchase price allocation adjustments for the acquisition of Credit Suisse, including financial impacts and fair value adjustments.
goodwill, purchase price, PPA, adjustments, Credit Suisse
false
Negative goodwill and overview of purchase price allocation adjustmentsSecond quarter 2023 Fixed Income investor presentation
Multiple Chart
UBS
View slide
This slide has a colorful design with hexagonal graphics representing different areas of sustainability, connected by lines to central icons. It is text-heavy, detailing the bank's sustainability strategy with bullet points in each hexagonal section.
Market Analysis and Trends
Financial Services
The slide summarizes Citi Handlowy's sustainable strategy, detailing commitments to ESG products, risk management, and carbon footprint reduction, aiming to incorporate sustainability into business decision-making.
Sustainability, ESG, Strategy, Finance, Risk Management, Green Transformation, Carbon Footprint, Corporate Responsibility, Social Impact, Banking
false
2022 2024 Citi Handlowy sustainable strategy |2022-2024 Bank Handlowy Group Strategy
Framework
Citigroup
View slide
Column chart showing the market value of crypto investment funds held, with categories ranging from less than $1,000 to over $1,000,000.
Market Analysis and Trends
Financial Services
Shows the market value distribution of crypto investment funds held by owners, highlighting the various ranges of investment amounts.
investment funds, crypto market, value distribution, financial analysis, investment trends
false
Market Value of Crypto Investment Funds HeldCRYPTO ASSET SURVEY
Single Chart
IPSOS
View slide
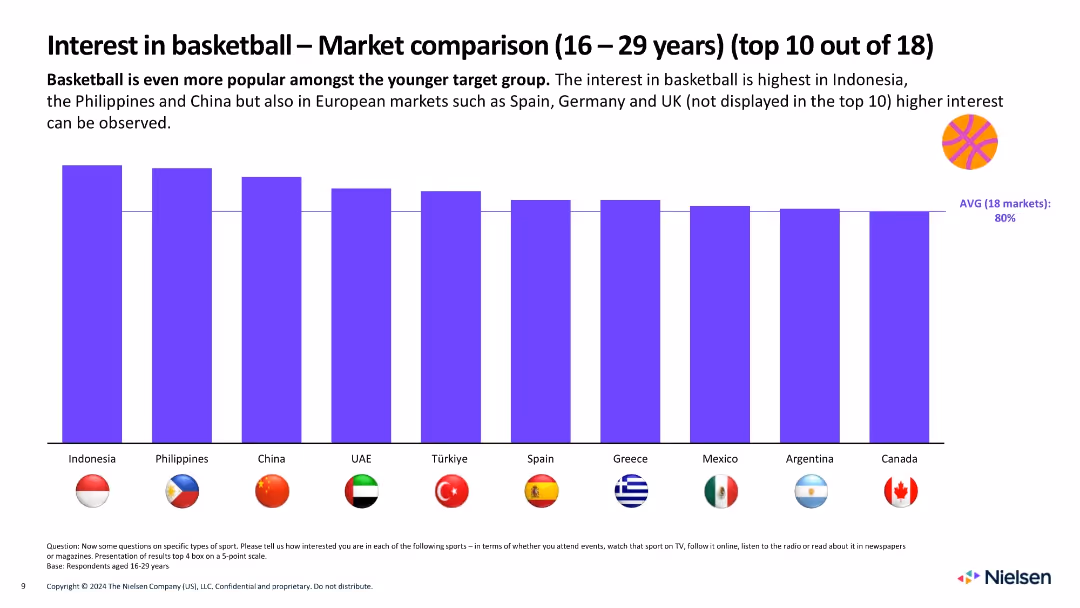
Bar chart with flags and bars representing top 10 countries by basketball interest among 16–29-year-olds; bold title, clean layout
Market Analysis and Trends
Media & Entertainment
Highlights the popularity of basketball among youth, especially in Indonesia, Philippines, and China. Visuals show rankings vs. 80% average interest across markets.
basketball, youth, market comparison, interest, global, Nielsen, countries, age group, bar chart, popularity
false
Interest in basketball – Market comparison (16–29 years)Nielsen Fan Insights
Single Chart
Nielsen
View slide
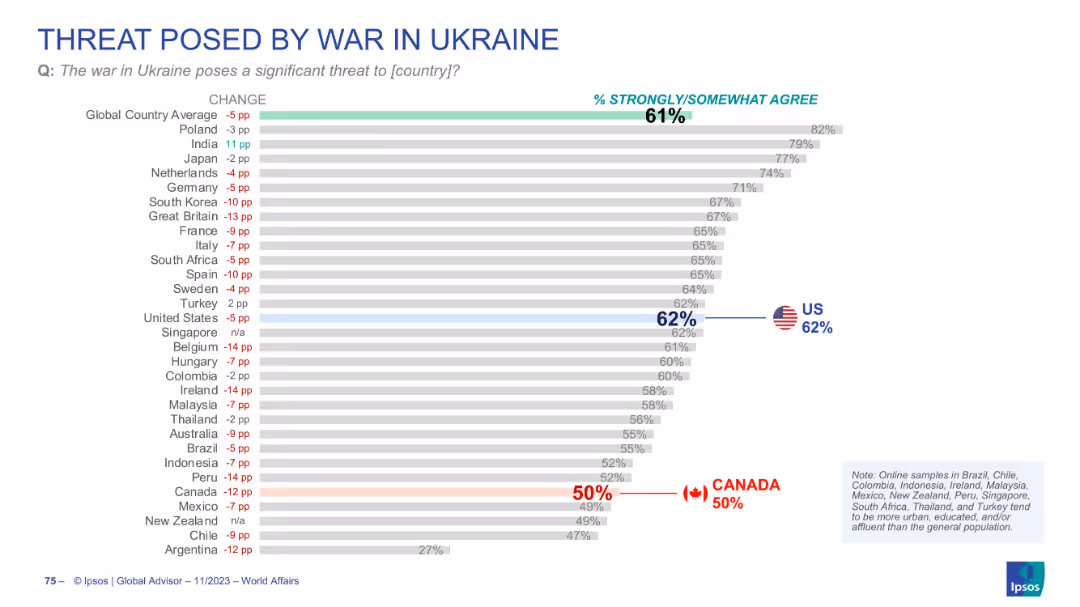
Bar chart with % agreement by country; change indicators in red/blue; US and Canada flagged. Clean, neutral color palette.
Risk Assessment and Management
Government & Public Sector
Depicts global perceptions of the war in Ukraine as a threat to one’s own country. 61% globally agree, 62% in the US, but only 50% in Canada. The slide suggests waning concern, especially in some Western countries.
Ukraine war, threat perception, geopolitical conflict, Canada, US
false
THREAT POSED BY WAR IN UKRAINEWORLD AFFAIRS 2023
Single Chart
IPSOS
View slide
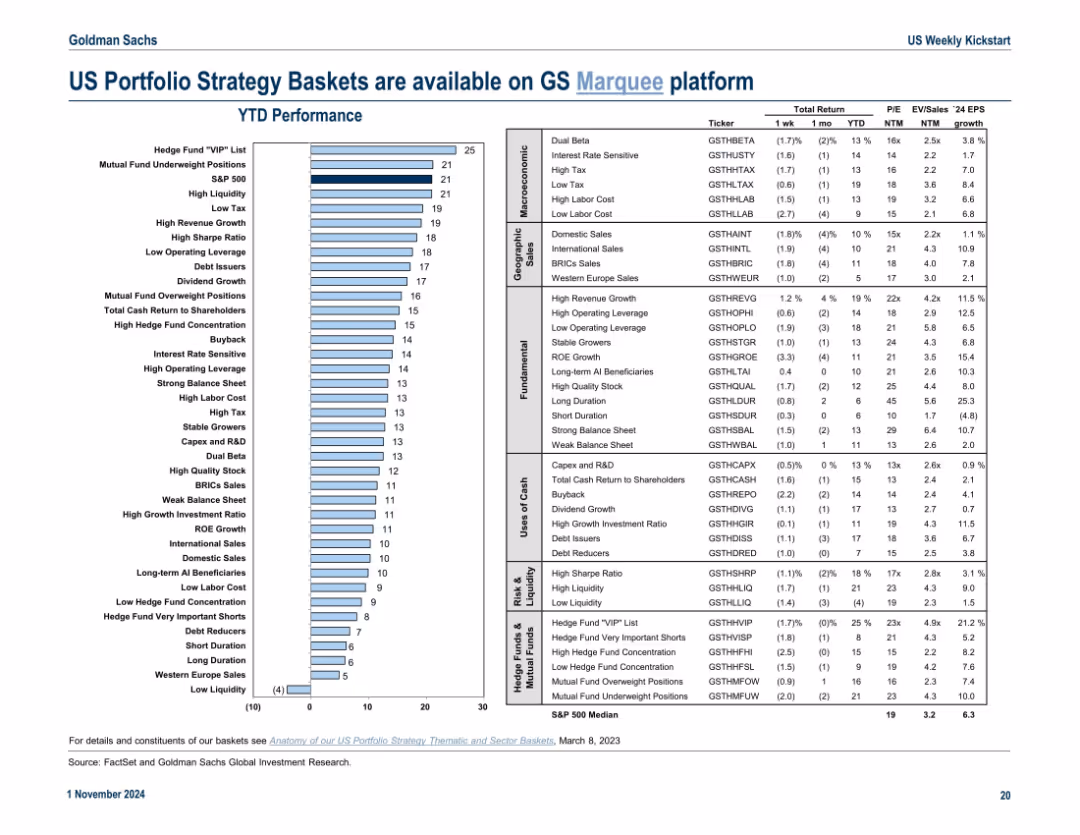
Bar chart of YTD returns for strategy baskets with supporting table showing valuation metrics, EPS growth, and tickers
Product and Service Analysis
Financial Services
Highlights performance of Goldman Sachs strategy baskets like "Hedge Fund VIP" and "High Liquidity", with detailed valuation and earnings data. Meant for investors evaluating thematic portfolios.
strategy baskets, hedge funds, EPS growth, valuation, thematic investing, Marquee
false
US Portfolio Strategy Baskets are available on GS Marquee platformUS Weekly Kickstart The rise of passive ownership
Mixed Chart
Goldman Sachs
View slide
Two side-by-side stacked bar charts for Q1 2024: net revenues and noninterest expenses by currency
Financial Performance
Financial Services
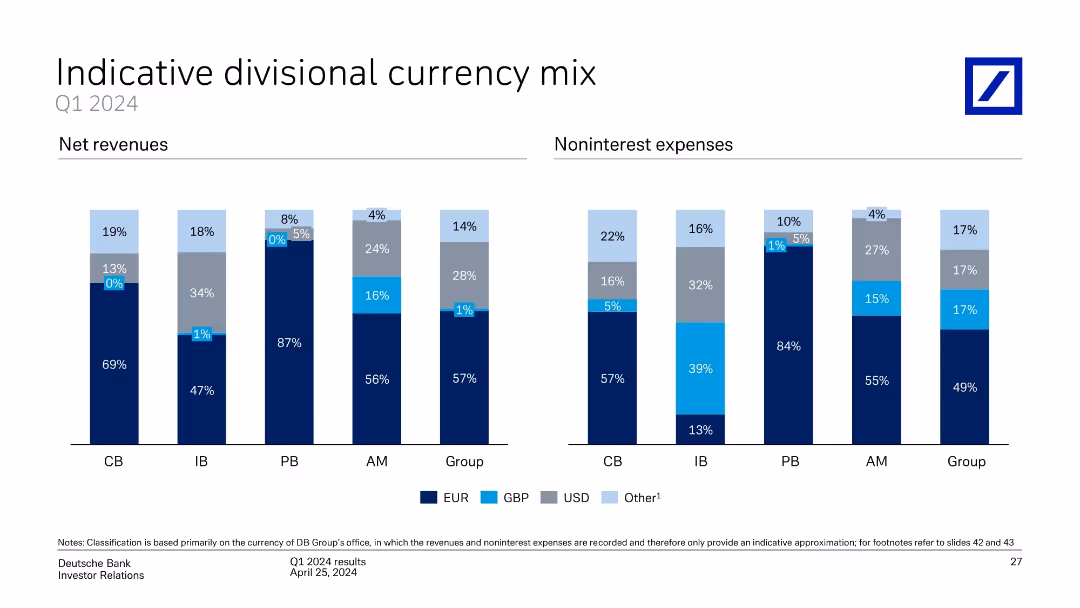
Depicts the currency composition of revenues and expenses across Deutsche Bank divisions. EUR dominates most segments, but some variation exists in USD and GBP exposure. Provides insight into forex sensitivity across business lines.
currency mix, EUR, USD, GBP, net revenue, expenses, forex exposure
false
Indicative divisional currency mixQ1 2024 results
Single Chart
Deutsche Bank
View slide
The slide features a column chart comparing crypto fundraising deal counts by investor type for the years 2018 and 2019. Investor types include traditional VCs, corporate VCs, tech startups, and private investors.
Market Analysis and Trends
Financial Services
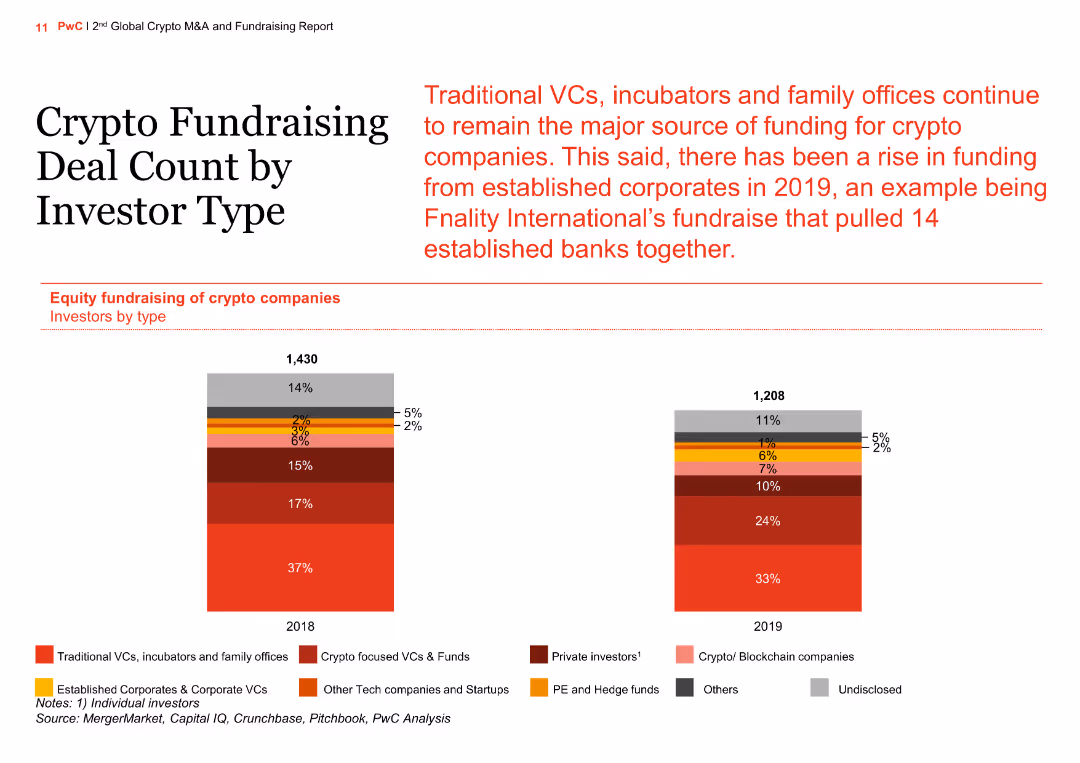
The slide details the distribution of fundraising deals among different investor types, noting an increase in deals by established corporates and a continued dominance by traditional VCs and family offices in 2019.
crypto, fundraising, investor type, column chart, comparison
false
Crypto Fundraising Deal Count by Investor Type2nd Global Crypto M&A and Fundraising Report
Multiple Chart
PwC/Strategy&
View slide
Two pie charts highlight a 47% private finance volume and 35% by project count. Key projects list includes financing type. Visuals and text are balanced.
Investment Analysis
Transportation & Logistics
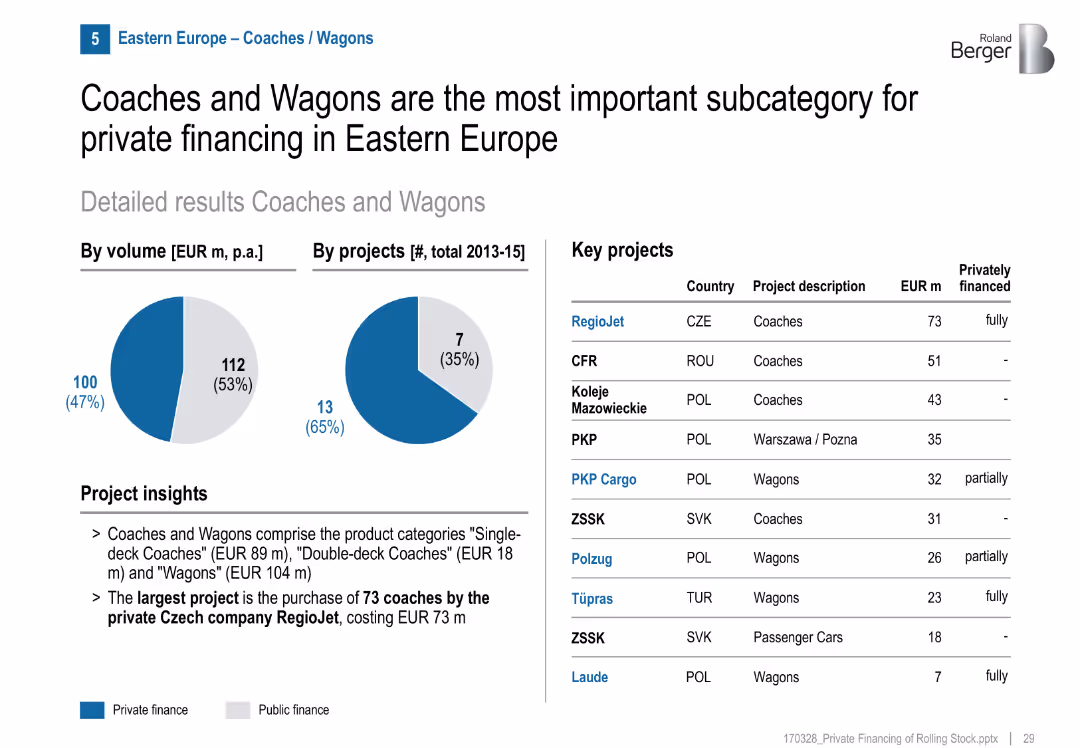
Coaches and wagons receive the highest level of private investment among rolling stock categories. RegioJet's coach project is the largest privately funded project.
coaches, wagons, private financing, Eastern Europe, rolling stock, RegioJet, rail investment, transportation
false
Coaches and Wagons are the most important subcategory for private financing in Eastern EuropePrivate financing of rolling stock
Mixed Chart
Roland Berger
View slide
Full-page photo on left with humanoid robot, right side includes text block and yellow horizontal bar chart.
Market Analysis and Trends
Artificial Intelligence
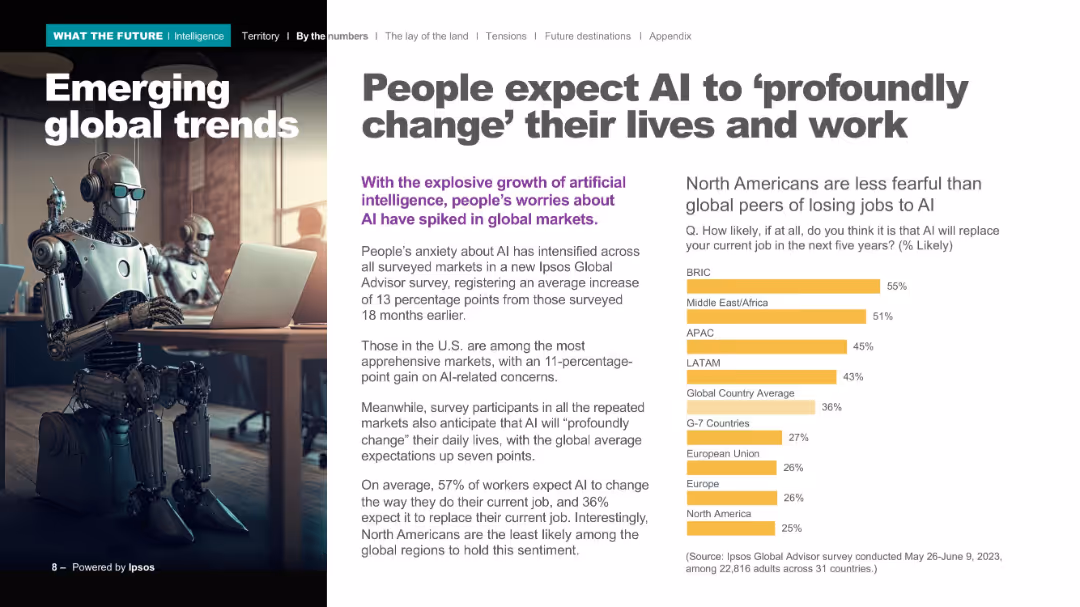
Details global perspectives on AI’s impact on jobs and daily life. Emphasizes rising concern levels, with a breakdown of expected job displacement likelihood by region. North America is shown as least concerned compared to others.
AI transformation, job loss, global sentiment, Ipsos Global Advisor, survey, BRIC, regional trends
false
People expect AI to 'profoundly change' their lives...WHAT THE FUTURE: INTELLIGENCE
Mixed Chart
IPSOS
View slide
Contains three pie charts displaying awareness and usage of Mobility-as-a-Service (MaaS), and its availability.
Market Analysis and Trends
Transportation & Logistics
Analyzes consumer awareness and engagement with Mobility-as-a-Service (MaaS), indicating low familiarity and usage despite available services.
MaaS, awareness, usage, transportation services, availability
false
Less than a quarter of consumers are aware of mobility-as-a-service (MaaS)*. Among them, only 30% said MaaS is available where they live and only 5% have used a MaaS app.2024 Global Automotive Consumer Study
Multiple Chart
Deloitte
View slide
Contains bullet points explaining industry-wide solvency ratios for Mexico, a table with top 10 Mexican life insurers' data, and column charts showing ratios.
Market Analysis and Trends
Financial Services
This slide analyzes the solvency ratios of Mexican life insurers, highlighting data inconsistencies, volatility, and proposing a subset for company data inclusion.
Mexico, solvency ratios, insurers, analysis, company data, financial services, market trends
false
COUNTRY-SPECIFIC DETAILED ANALYSIS – MEXICOScalar calibration For Life insurance business
Mixed Chart
Oliver Wyman
View slide
This slide features two stacked column charts: one showing PE/VC investments by deal segments in terms of value, and another showing the number of deals. The charts use different colors to differentiate between segments like Growth, Buyout, Start-up, PIPE, and Credit Investment, with detailed numerical data.
Market Analysis and Trends
Financial Services
This slide breaks down the PE/VC investments across various deal segments by both value and number of deals, providing a comprehensive view of how different segments are performing over time. This information is essential for strategic planning and investment analysis.
PE/VC, deal segments, investment value, number of deals, growth, buyout
false
PE/VC monthly headline trends: investments PE/VC investments: split across deal segments (value in US$m)Why do uncertain times need a certainty of purpose? April 2023
Multiple Chart
EY
View slide
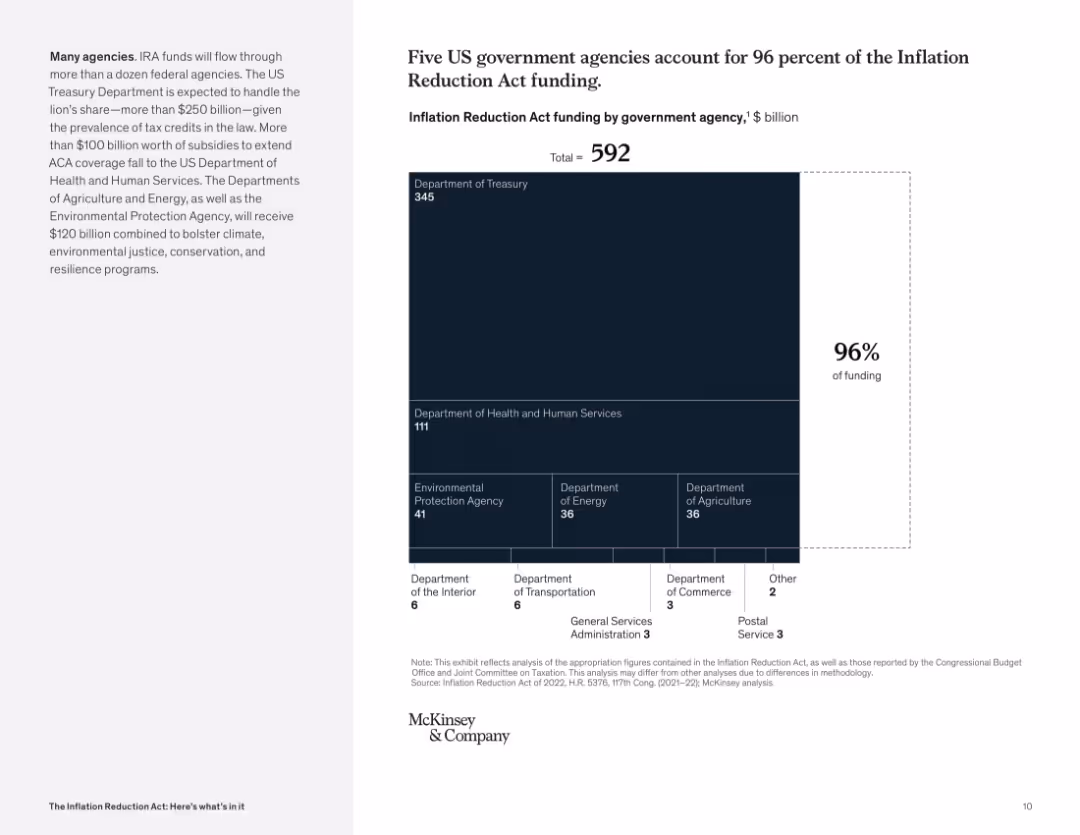
Treemap visualization with large central block for Treasury; supporting agencies in smaller blocks below; numeric data label on the right.
Operational Efficiency
Government & Public Sector
This visual shows how IRA funds are distributed across federal agencies, with the Department of Treasury and HHS receiving the bulk. It underscores administrative concentration for efficient deployment.
federal funding, government agencies, Treasury, HHS, IRA distribution, efficiency
false
Five US government agencies account for 96 percent of the Inflation Reduction Act funding.The Inflation Reduction Act: Here’s what’s in it
Mixed Chart
McKinsey
View slide
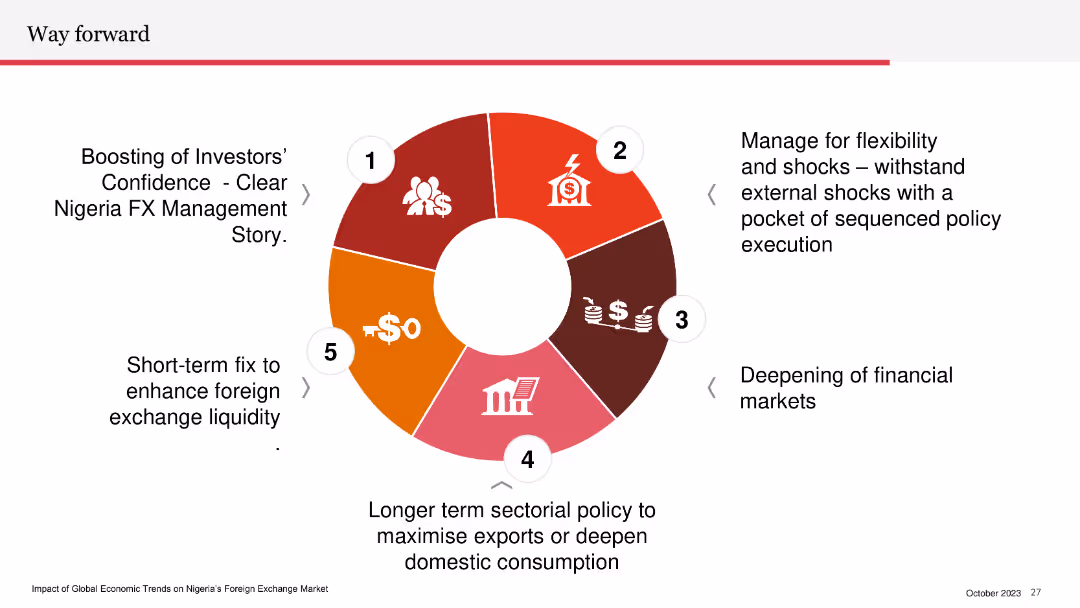
Circular diagram with five segments outlining steps for Nigeria's FX management strategy. Each segment has an icon and a brief description.
Strategic Planning
Financial Services
The slide outlines a strategic plan for managing Nigeria's foreign exchange market, focusing on boosting investor confidence, managing external shocks, deepening financial markets, sectorial policy, and enhancing foreign exchange liquidity.
strategic plan, FX management, investor confidence, financial markets, liquidity
false
Way forward Boosting of Investors’ Confidence Clear Nigeria FX Management Story.Nigeria (Bi-monthly) Economic Outlook
Vertical Flow
PwC/Strategy&
View slide
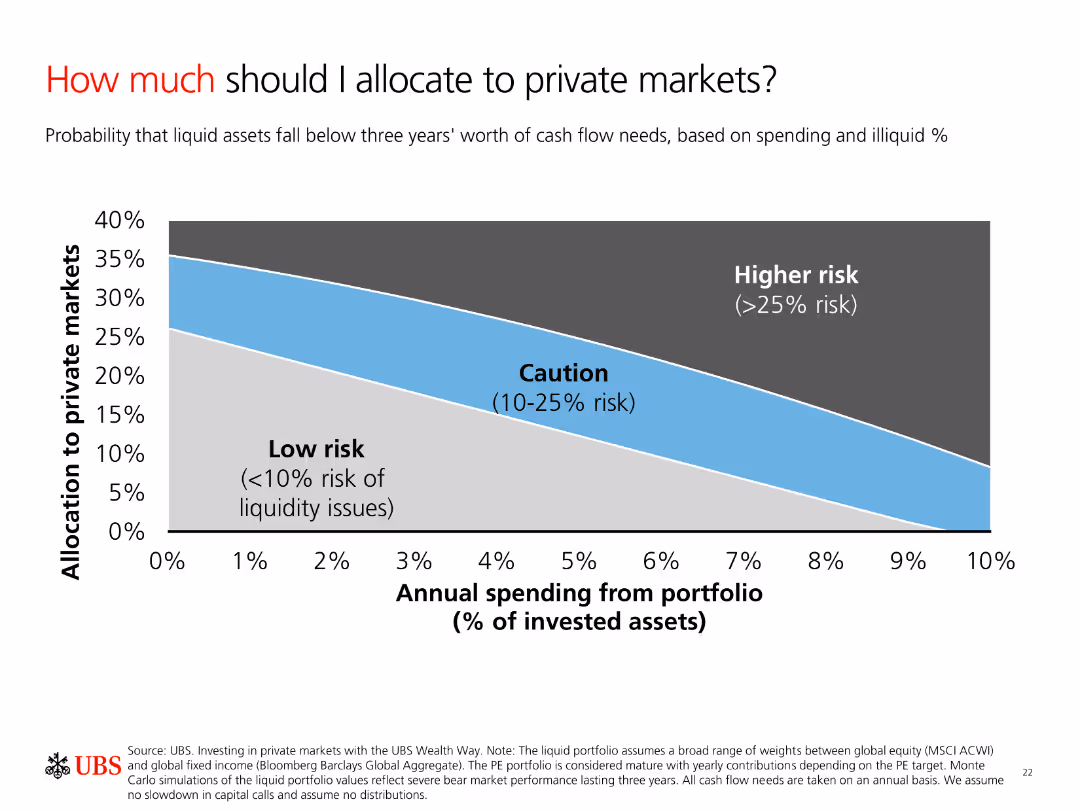
A column chart showing allocation to private markets based on risk levels. The chart categorizes risks into Low risk, Caution, and Higher risk with a smooth gradient background.
Investment Analysis
Financial Services
The slide explains the allocation of investments to private markets based on annual spending and risk levels. It helps investors understand potential liquidity risks.
Allocation, Risk, Private Markets, Spending, Liquidity
false
How much should I allocate to private markets?Private markets asset allocation guide
Single Chart
UBS
View slide
The slide contains several data blocks with statistics on employer and workforce sentiments regarding returning to work post-pandemic. It includes bar charts and text descriptions to explain the trends.
Market Analysis and Trends
Professional Services
The slide examines trends in workforce and employer sentiments about returning to work after the pandemic. It highlights key statistics, such as the percentage of CEOs expecting remote work to continue and workers' preferences for remote work. This data is critical for planning future workplace strategies and policies.
Workforce, Employer Sentiment, Remote Work, Trends, Statistics
false
Workforce and employer sentiment are driving decisions around returning to workRemote work: Setting the right strategy The Dbriefs Global Mobility, Talent & Rewards series
Mixed Chart
Deloitte
View slide
This slide includes a header, body text, and three percentage indicators in different colored boxes (green, blue, red). The percentages are displayed above each box, showing the perceived performance of healthcare systems in optimizing patient experience.
Customer and Market Segmentation
Healthcare & Pharmaceuticals
This slide highlights the importance of the healthcare experience for US consumers, emphasizing equitable treatment and optimization of the health experience regardless of personal circumstances. It shows varied ratings for healthcare system performance.
healthcare, experience, US, equitable treatment
false
‘The experience is important to me.’ Consumers: United StatesHealth care consumer views on value
Mixed Chart
EY
View slide
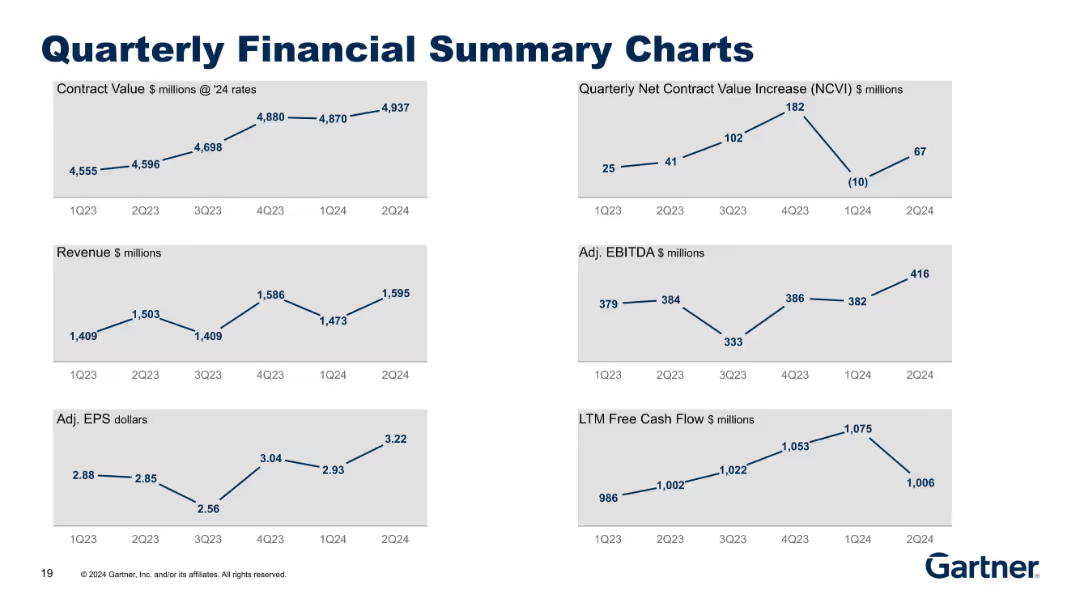
Six compact line charts arranged in a 2x3 grid layout, each with minimal text and numerical data points. Blue lines on light gray backgrounds, simple styling.
Financial Performance
Technology & Software
This slide summarizes key financial metrics across six quarters, including Contract Value, NCVI, Revenue, Adj. EBITDA, EPS, and Free Cash Flow. It highlights both growth trends and fluctuations in core financial KPIs, giving a quick visual overview of financial performance.
revenue, contract value, EBITDA, EPS, cash flow, quarterly, trend, KPIs
false
Quarterly Financial Summary ChartsSecond Quarter 2024 Results
Multiple Chart
Gartner
View slide
Features a line chart with projections of 'FTE Automation Output' against 'Historical FTE' trends, presented in blue and orange lines. The background is a simple gradient.
Financial Performance
Financial Services
Explores the impact of automation on GDP per capita growth, showing projected increases in productivity necessary to meet future GDP growth rates, based on automation scenarios.
GDP, Automation, Productivity, Economic Growth, Forecast
false
Good for the economy - Automation can contribute to growth in GDP per capitaA FUTURE THAT WORKS: AI, AUTOMATION, EMPLOYMENT, AND PRODUCTIVITY
Single Chart
McKinsey
View slide
Bar chart of population by continent (2023 vs. 2050) and table listing top 5 populous countries by region; clear color-coding
Market Analysis and Trends
Government & Public Sector
The slide shows global population growth trends, highlighting a significant increase in Africa's population and continued dominance by Asia. It details population growth rates and identifies key countries driving regional changes by 2050.
Population Growth, Africa, Asia, 2050, Regional Trends, Demographics, Global Distribution
false
Over the next three decades, Africa's population will increase by more than 1 billion – Asia remains the world's population giantTrend Compendium 2050 Six megatrends that will shape the world
Mixed Chart
Roland Berger
View slide
Features a column chart depicting year-over-year volume percentage changes in the food sector, with gray bars showing slight increases and decreases. The graph is straightforward, using minimal color to emphasize the changes.
Market Analysis and Trends
Agriculture & Food Production
This slide provides a snapshot of the food industry's modest growth trends over recent fiscal years. It aims to offer stakeholders a quick overview of market dynamics, focusing on minimal growth fluctuations, which could influence strategic decisions in product development or market entry.
Food, Volume, Growth, Yearly, Market Trends, Analysis
false
Growth in food has been modestBarclays Global Consumer Staples Conference
Single Chart
Barclays
View slide
A visually striking contents page with hexagonal yellow icons labeled 1–6 corresponding to sections, over a blue-toned futuristic background with a hand touching digital blocks.
Strategic Planning
Technology & Software
This slide serves as a table of contents, outlining the report's sections: Key Insights, Overview, IT Services, Engineering R&D, BPM, and Outlook. Each section is paired with a page number, providing a clear roadmap for the presentation. The modern, tech-oriented design implies a focus on digital and innovation-heavy topics.
contents, roadmap, IT, business, structure, BPM, ER&D, digital
false
ContentsA Year of Paradoxes: M&A Trends and Outlook in the Technology Services Sector
Agenda
EY
View slide
Timeline from 1871 to 2020 showing major milestones for Handelsbanken, including restructures and financial crises, with a large image of a bank building, text annotations detailing each phase.
Strategic Planning
Financial Services
Chronicles the history and significant events in the development of Handelsbanken, emphasizing its stability and resilience through financial crises. Useful for corporate presentations and history lessons on banking.
Handelsbanken, banking, history, financial stability, crises, corporate resilience, timeline
false
Handelsbanken 1871Introduction to Bain & Company
Linear Flow
Bain
View slide
Comparative column chart with additional highlighted focus on environmental harm reduction.
Strategic Planning
Environmental Services & Sustainability
Same as previous with an emphasis circle on the importance of reducing harm to the environment.
business, opportunity, taxes, environment, global
false
#4: An opportunity for business? (2)ENVIRONMENT EMERGENCY?
Multiple Chart
IPSOS
View slide
The slide features a detailed text-based content with a categorized list of economic indicators and their respective changes. Each category is color-coded to signify different levels of improvement or decline.
Market Analysis and Trends
Financial Services
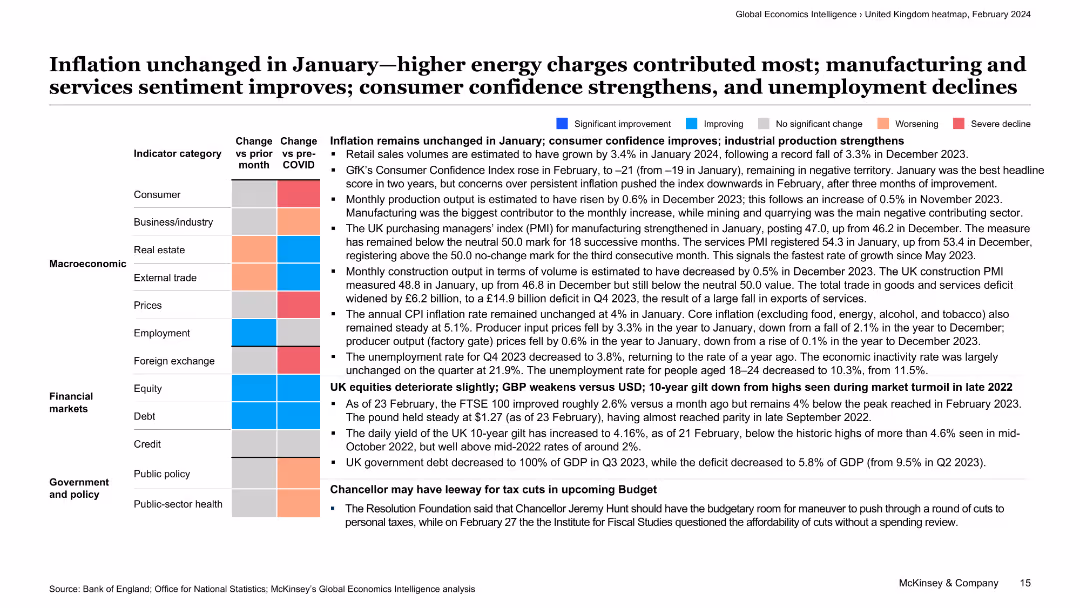
This slide discusses the inflation status in January, highlighting that higher energy charges were a major factor. It provides insights into various economic indicators, including consumer confidence, industrial production, and unemployment rates.
inflation, energy charges, economic indicators, consumer confidence, unemployment
false
Inflation unchanged in January—higher energy charges contributed most; manufacturing and services sentiment improves; consumer confidence strengthens, and unemployment declinesGlobal Economics Intelligence January 2024
Table
McKinsey
View slide
The slide features a table and a column chart presenting 2022 performance data against targets set at the 2022 Investor Day, with future outlooks. Color differentiation is used to distinguish between various types of data and forecasts, with textual annotations for clarification.
Financial Performance
Financial Services
Provides a comprehensive review of a financial firm's performance relative to its targets, showing areas of growth and projections for future earnings. It could serve to evaluate business performance, communicate financial results to stakeholders, or strategize for upcoming fiscal periods.
financial performance, targets, investor day, revenue growth
false
We delivered on our promises made last year and will continue to work towards sustained growth and higher operating leverageInverstors Day 2023
Single Chart
JP Morgan
View slide
This slide features a central circular graphic and several textual elements. It has a clean design with blue tones and clearly labeled sections. The pie chart is centrally positioned and surrounded by key data points.
Market Analysis and Trends
Financial Services
Discussing Goldman Sachs’ position as a leading asset and wealth manager, this slide showcases their scale and scope in the industry. It's designed for presentations emphasizing market leadership and client-oriented approaches.
asset management, wealth management, global, Goldman Sachs, AUS, client-oriented, scale
false
Asset Management & Wealth Management: Integrated, Client-Oriented Businesses At ScaleGoldman Sachs Strategic Update
Framework
Goldman Sachs
View slide
The slide contains a table with data on non-performing assets and allowance for credit losses, column charts showing net charge-offs and core provision for credit losses trending, and text.
Risk Assessment and Management
Financial Services
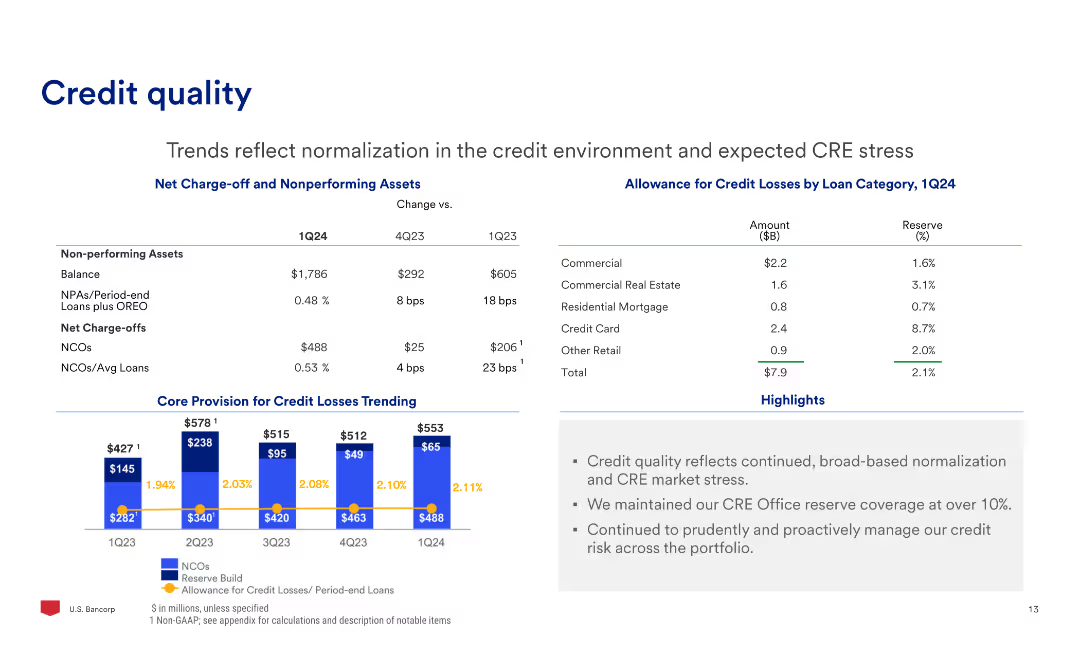
The slide reviews trends in credit quality, focusing on the normalization in the credit environment and expected CRE stress, with data on charge-offs and credit loss allowances.
Credit, Quality, Risk, Assets, Allowance, Losses
false
Credit quality Trends reflect normalization in the credit environment and expected CRE stressBarclays Americas Select Franchise Conference 2024
Mixed Chart
Barclays
View slide
This slide includes a column chart comparing the holding of various stablecoins in 2022 and 2023, with specific percentages for each stablecoin listed.
Market Analysis and Trends
Financial Services
It details the types of stablecoins held by Canadians, including Binance USD and CAD Coin, noting changes in holding percentages from 2022 to 2023.
Stablecoins, VRCAs, 2023, 2022, holdings, Binance USD, CAD Coin, crypto assets
false
Crypto Assets Held: VRCAs (Stablecoins)CRYPTO ASSET SURVEY 2023
Multiple Chart
IPSOS
View slide
Dual line charts (delivery times left, backlogs right) by region with consistent styling, labeled axis and arrows.
Operational Efficiency
Industrial & Manufacturing
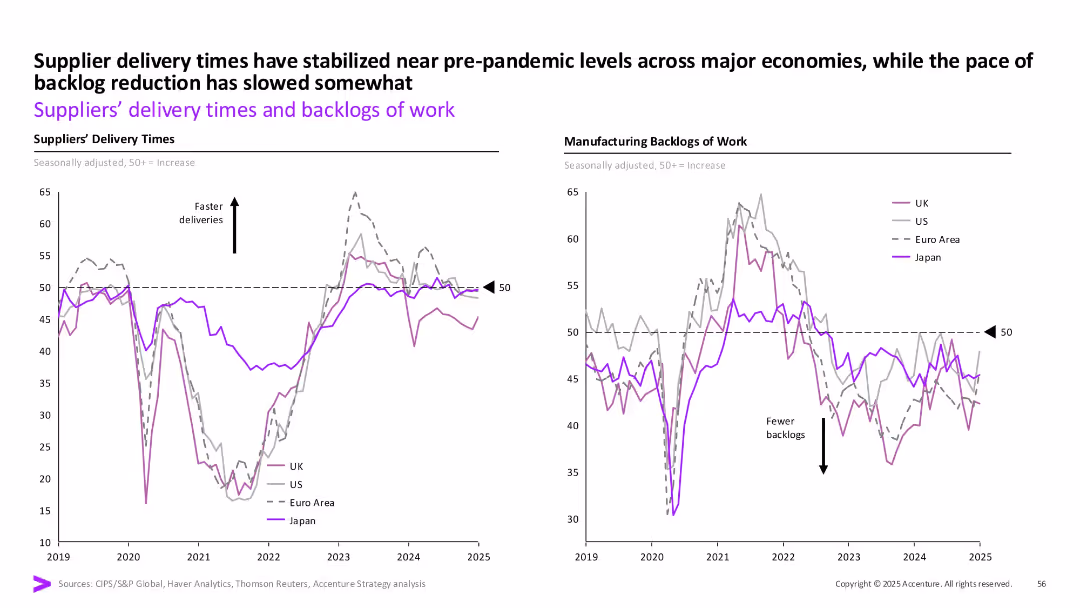
The slide shows that supplier delivery times have returned to near pre-pandemic levels across regions while backlog reduction has slowed. It emphasizes operational recovery with regional disparities post-COVID.
Delivery times, manufacturing, UK, US, Euro Area, Japan, backlog, stabilization
false
Supplier delivery times have stabilized near pre-pandemic levels across major economies, while the pace of backlog reduction has slowed somewhatFebruary Macro Brief
Multiple Chart
Accenture
View slide
Two circular infographic metrics with accompanying explanation on right
Technology and Digital Transformation
Artificial Intelligence
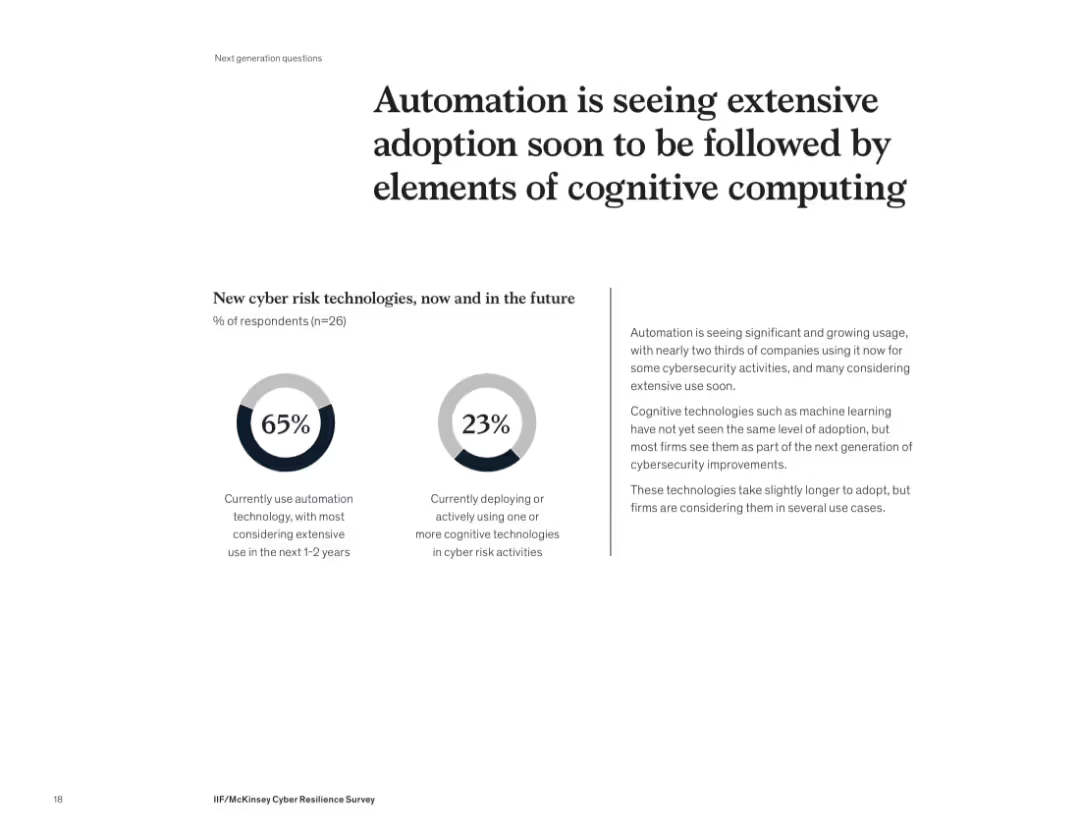
This slide highlights the growing use of automation and anticipated rise in cognitive computing in cybersecurity. 65% of companies currently use automation, while only 23% are using cognitive tools like AI or machine learning, suggesting a future shift toward more intelligent cyber risk technologies.
automation, cognitive computing, AI, cybersecurity, adoption, innovation, machine learning, technology
false
Automation is seeing extensive adoption soon to be followed by elements of cognitive computingIIF/McKinsey Cyber Resilience Survey
Mixed Chart
McKinsey
View slide
Dual line graphs tracking US and China GDP projections (indexed from 2024); colored lines compare forecast scenarios against IMF baseline.
Financial Performance
Government & Public Sector
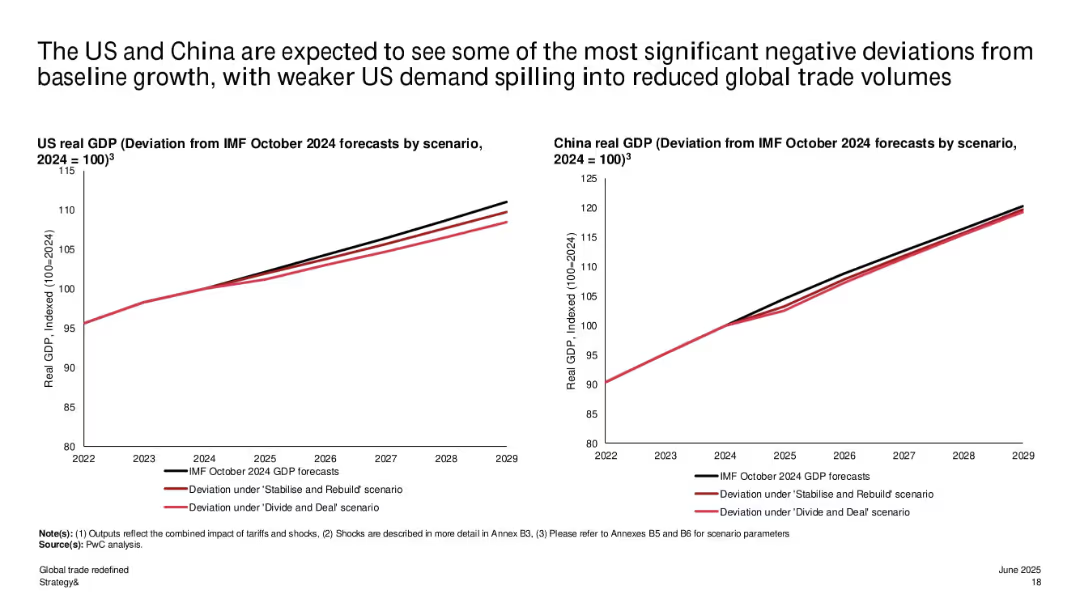
This slide illustrates forecasted GDP paths for the US and China under different trade scenarios. Both countries are projected to fall below IMF baseline expectations, with greater deviation under "Divide and Deal", implying weaker demand and trade volume.
GDP forecast, US-China, trade volume, IMF projections, deviation, real GDP, trade disruption, economic modeling
false
The US and China are expected to see...Global trade redefined: Early insights and economic impacts of new agreements
Multiple Chart
PwC/Strategy&
View slide
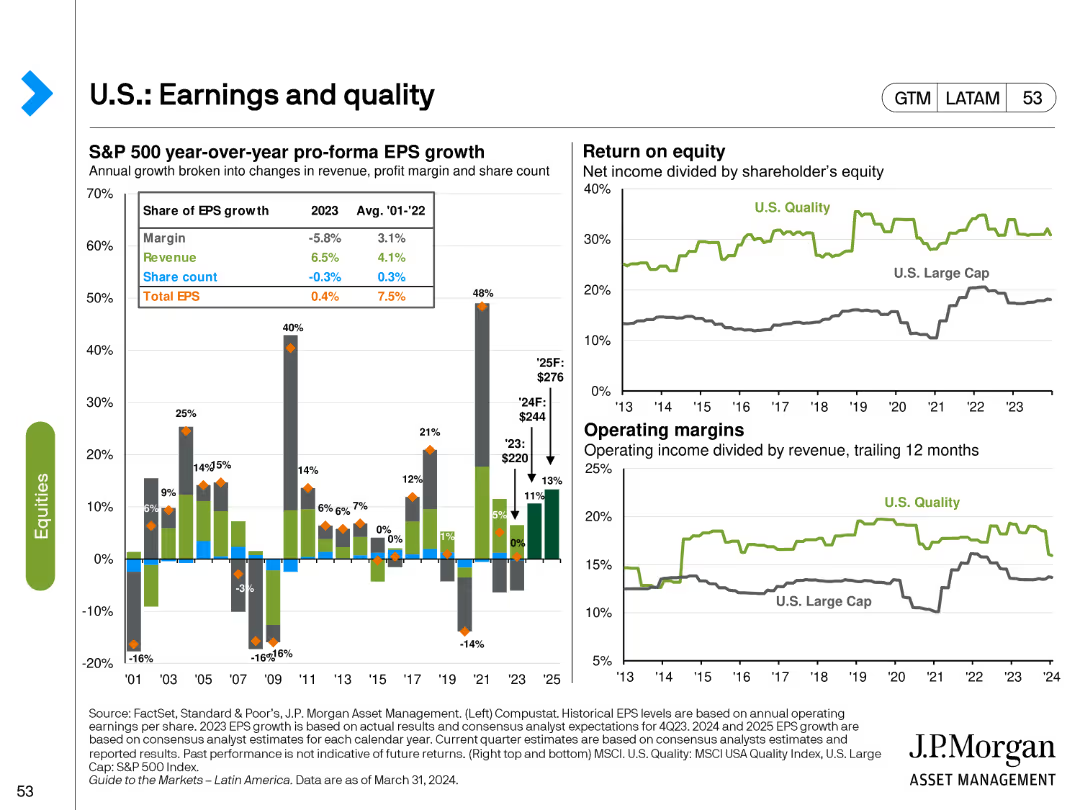
The slide features a bar chart for S&P 500 EPS growth components and line charts for return on equity and operating margins. Different colors and markers highlight various aspects of earnings growth and quality.
Financial Performance
Financial Services
It analyzes the components of EPS growth, return on equity, and operating margins for U.S. equities, providing insights into the quality and sustainability of earnings in the S&P 500 index.
EPS growth, return on equity, operating margins, S&P 500, financial quality
false
U.S.: Earnings and qualityGuide to the Markets Latin America | 2Q 2024
Multiple Chart
JP Morgan
View slide
Line graph showing agreement percentages by gender (male and female) across four generations (Baby Boomers, Gen X, Millennials, Gen Z). Purple lines represent males, orange lines represent females.
Market Analysis and Trends
Environmental Services & Sustainability
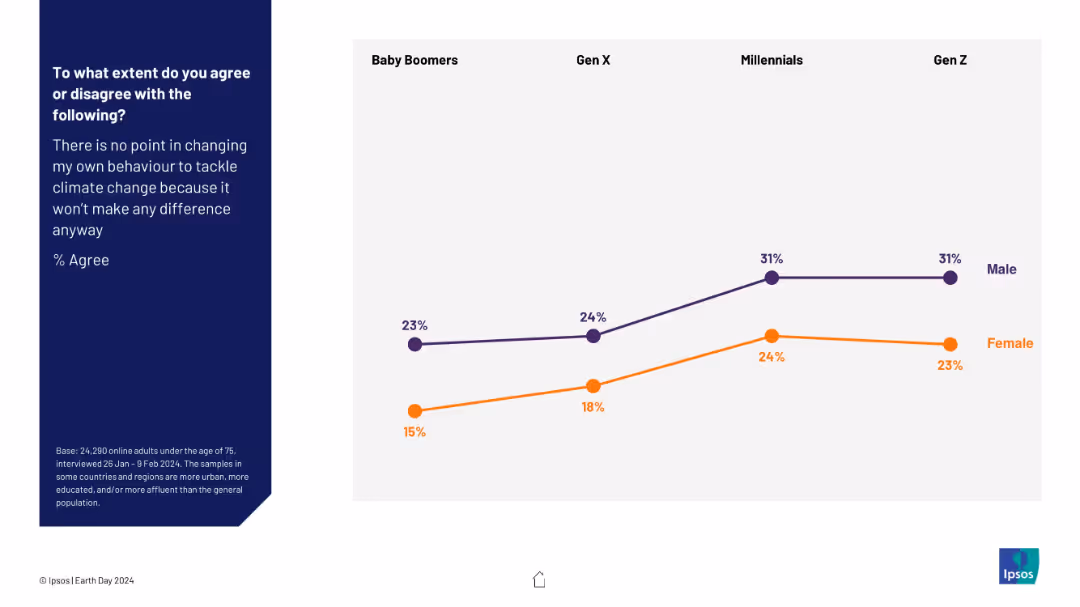
The slide shows generational and gender-based differences in agreement with the statement that individual behavior change does not impact climate change. Male agreement rises with younger generations, peaking at 31% among Millennials and Gen Z. Female agreement is consistently lower, showing stronger belief in the effectiveness of personal action.
generational trends, gender gap, climate beliefs, survey data, public opinion, behavior change, environment, youth perspective, Ipsos, Earth Day
false
To what extent do you agree or disagree with the following?EARTH DAY 2024
Mixed Chart
IPSOS
View slide
Mixed visuals: bar charts by gender, party, social grade, age + regional heat map.
Market Analysis and Trends
Government & Public Sector
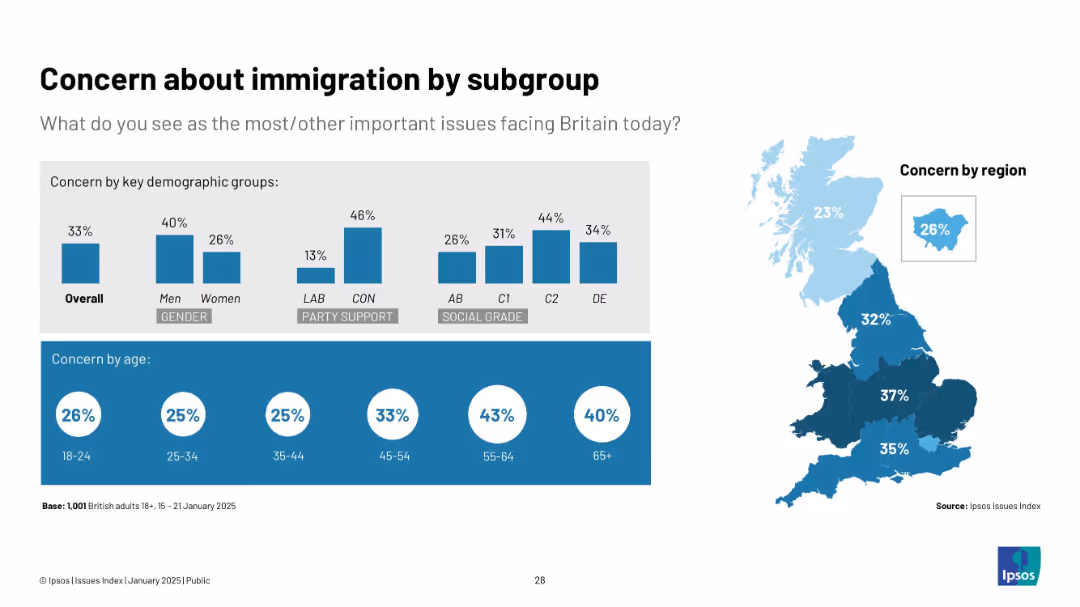
This slide shows which subgroups are most concerned about immigration. Older adults and Conservative supporters show highest concern, while younger age groups show lower interest. Regional differences are also mapped.
immigration, region, age, politics, Ipsos, concern
false
Concern about immigration by subgroupIpsos Issues Index January 2025
Multiple Chart
IPSOS
View slide
Slide features a world map pinpointing major hydrogen projects globally, supplemented by logos of participating companies.
Strategic Planning
Energy & Utilities
Highlights global investment in hydrogen projects, showing collaborations that aim to achieve technological and commercial maturity in the energy sector.
hydrogen projects, global investment, strategic planning, energy sector, industrial collaboration
false
Investment has been led by large industrials teaming up for large flagship projects – to reach technological and commercial maturityChilean Hydrogen Pathway
Graphic
McKinsey
View slide
Slide includes column charts and a summary section.
Financial Performance
Financial Services
Summarizes Q4 financial highlights and divisional revenues.
Q4, revenue, financial, highlights
false
Q4 2023 highlightsQ4 / FY 2023 results
Mixed Chart
Deutsche Bank
View slide
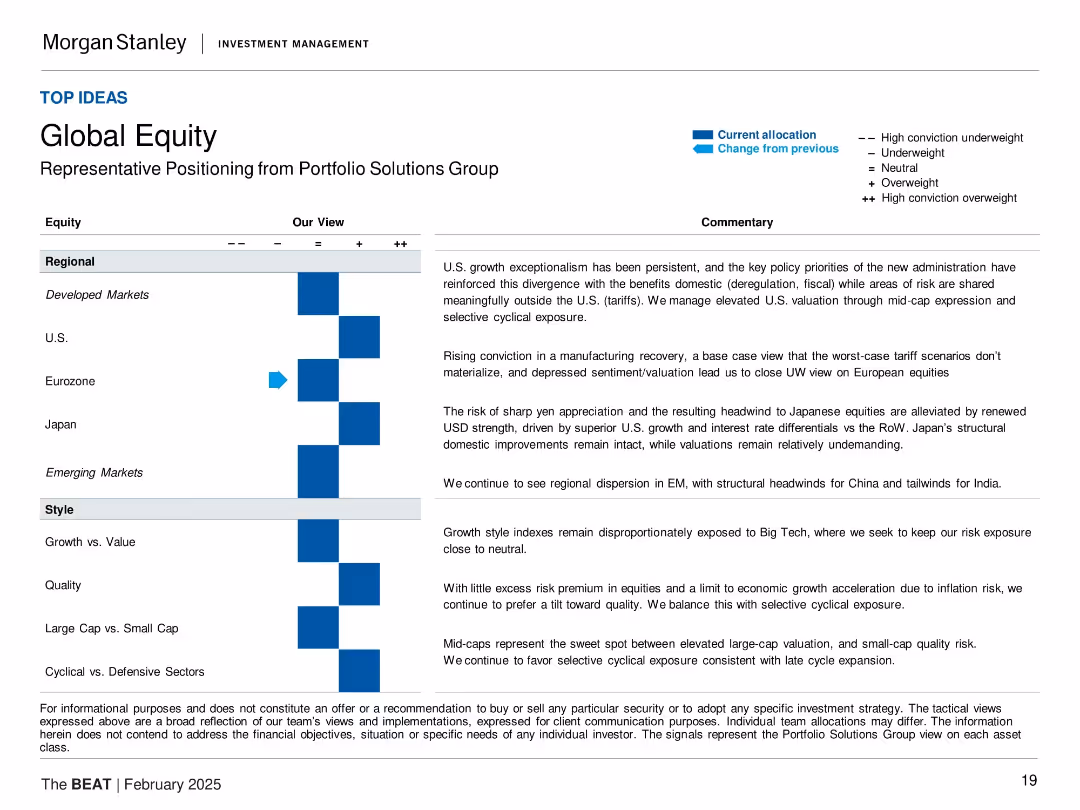
Structured by region and style factors with commentary alongside sentiment views
Market Analysis and Trends
Financial Services
Offers a regional and stylistic perspective on equity positioning. It explains favorable U.S. exposure, cautious stance on Eurozone equities, and a preference for quality and mid-cap stocks. Emphasis is placed on U.S. growth, macro divergence, and risk-adjusted positioning.
global equity, regional exposure, style factors, developed markets, growth vs value, mid-cap, quality equities
false
Global EquityThe BEAT February 2025
Table
Morgan Stanley
View slide
The slide presents column charts breaking down expense growth by category from 2019 to 2022 and details on investment spending for technology and business sectors.
Operational Efficiency
Financial Services
This slide analyzes the drivers behind JP Morgan's expense growth, categorized by investments, revenue growth, and structural changes over four years. It highlights significant financial allocations in technology and operational areas, showcasing their approach to scaling business operations efficiently.
expenses, investments, growth, technology
false
Expense growth was mainly driven by business volume / revenue growth and investmentsCorporate & Investment Bank 2022
Mixed Chart
JP Morgan
View slide
Slide features multiple icons with annotations explaining digital impacts on decarbonization and decentralization.
Technology and Digital Transformation
Energy & Utilities
Discusses key digital trends impacting the electricity sector, focusing on decarbonization, decentralization, and technological growth.
digital trends, electricity industry, decarbonization, decentralization, technology impact, energy sector
false
Digital trends in the electricity industryWorld Economic Forum Digital Transformation Initiative: In collaboration with Accenture
Header Horizontal
Accenture
View slide
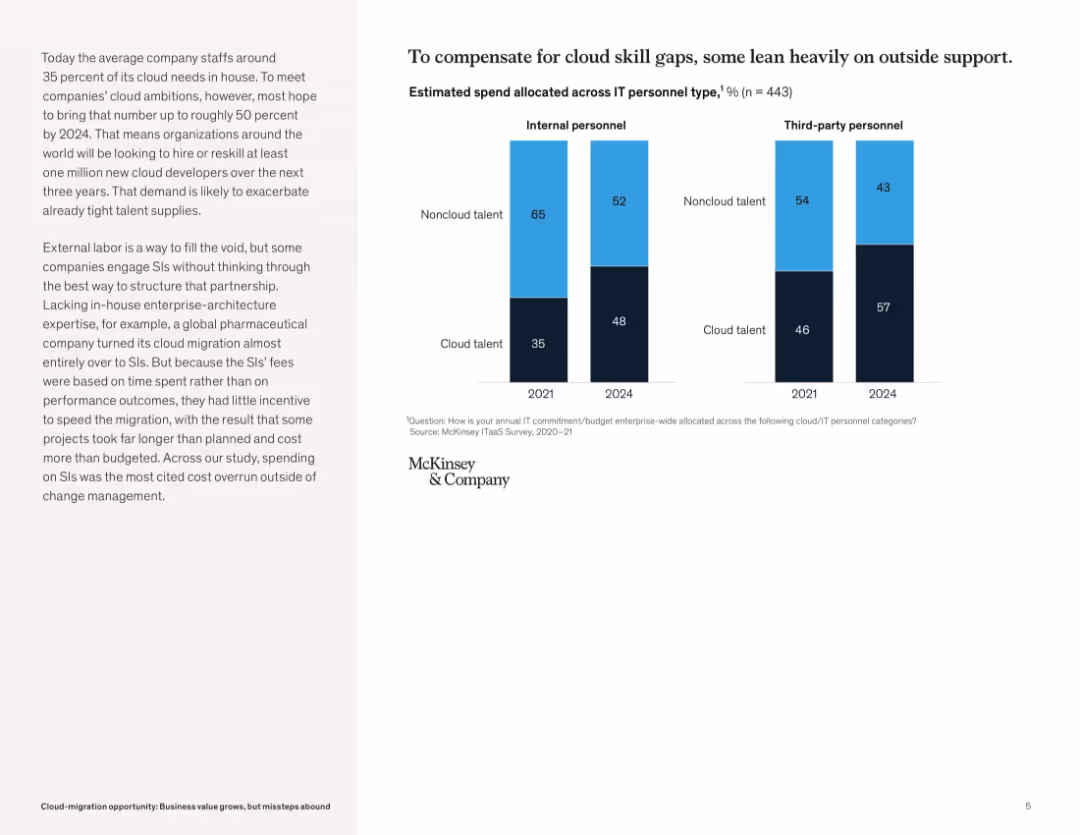
Clean bar chart layout comparing 2021 and 2024 projected allocations to internal vs third-party personnel, segmented by cloud vs noncloud talent.
Human Resources and Talent Management
Technology & Software
This slide reveals that companies are increasingly turning to third-party vendors to fill cloud skill gaps. By 2024, internal cloud talent will increase, but third-party usage remains high. It emphasizes the need for strategic outsourcing to avoid inefficiencies and higher costs.
cloud talent, IT personnel, skill shortage, outsourcing, third-party vendors, cloud staffing, digital transformation, workforce strategy
false
To compensate for cloud skill gaps, some lean heavily on outside supportCloud-migration opportunity: Business value grows, but missteps abound
Mixed Chart
McKinsey
View slide
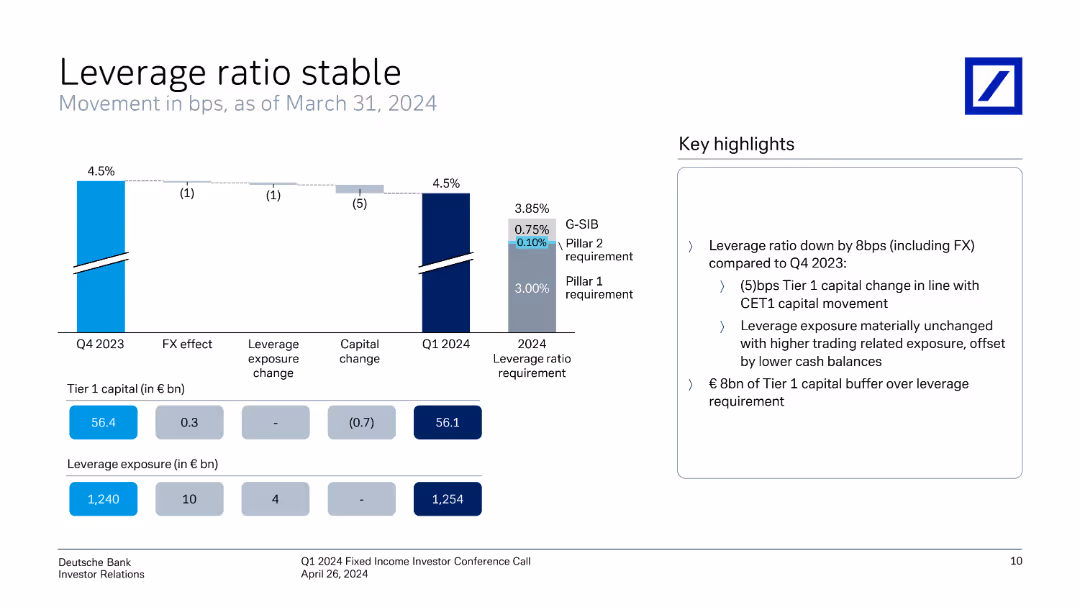
The slide includes a vertical column chart showing leverage ratio movements, supported by key highlights on the right.
Risk Assessment and Management
Financial Services
The slide details Deutsche Bank's leverage ratio stability, illustrating changes and factors affecting the ratio from Q4 2023 to Q1 2024.
leverage ratio, financial stability, risk management, Deutsche Bank, Q1 2024, investor relations, financial metrics, quarterly performance, capital adequacy
false
Leverage ratio stable Movement in bps, a s of March 31, 2024Q1 2024 Fixed Income Investor Conference Call
Mixed Chart
Deutsche Bank
View slide
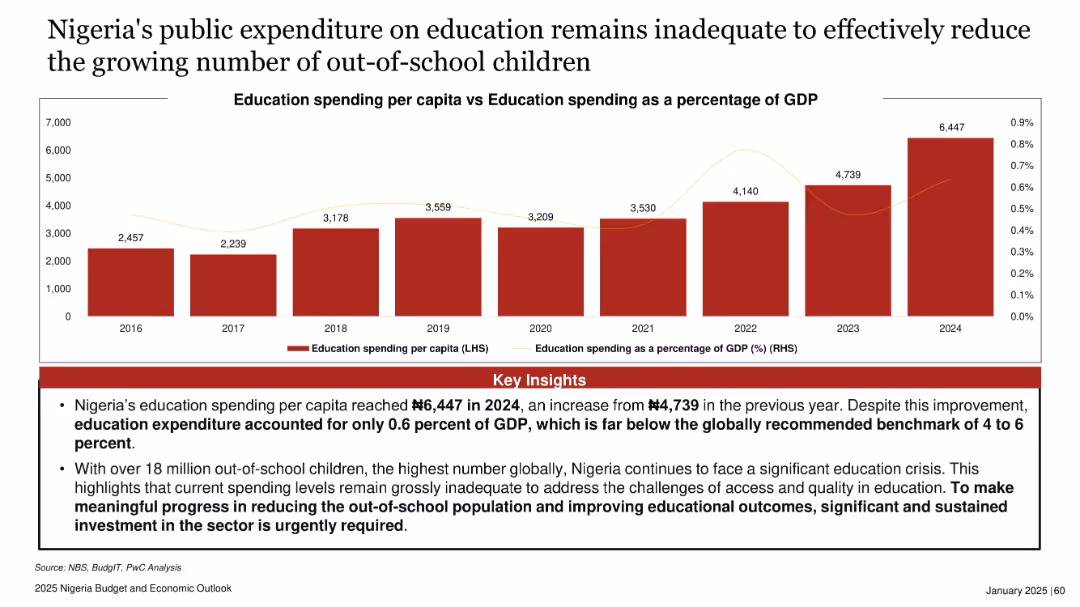
Bar chart showing education spending per capita (2016–2024) and line showing percentage of GDP. Red theme with emphasis on key insights.
Regulatory and Compliance
Education & Training
The slide criticizes Nigeria’s education funding, showing low per capita spending and GDP share. Despite increases, the current levels are far below global benchmarks. With 18 million out-of-school children, major investment is urgently needed.
education, spending, GDP, Nigeria, out-of-school children, budget, policy, 2024 data
false
Nigeria's public expenditure on education remains inadequate to effectively reduce the growing number of out-of-school children2025 Nigeria Budget and Economic Outlook
Mixed Chart
PwC/Strategy&
View slide
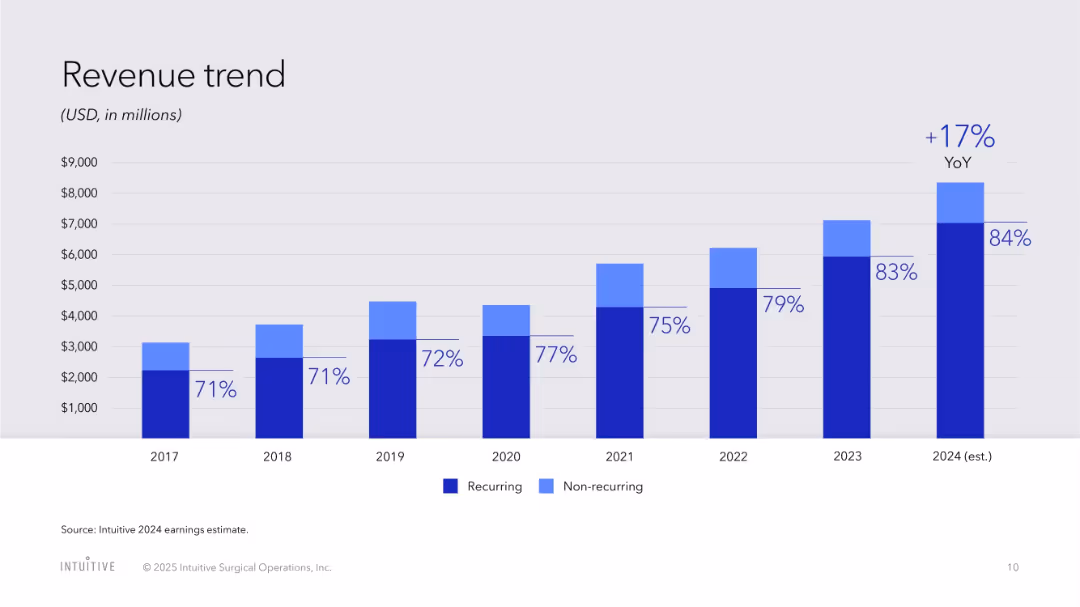
Vertical bar chart showing annual revenue (recurring vs. non-recurring) with percentages and YoY growth
Financial Performance
Healthcare & Pharmaceuticals
Displays the trend in recurring and non-recurring revenue from 2017 to 2024, showing increasing reliance on recurring income and overall positive revenue trajectory.
revenue mix, recurring income, earnings, non-recurring, YoY growth, financials, healthcare technology
false
Revenue trendJ.P. Morgan Healthcare Conference 2025
Single Chart
JP Morgan
View slide
Combination of column charts for industry performance and a line graph for regional performance trends
Market Analysis and Trends
Financial Services
The slide provides an overview of regional PMI performance, comparing the US, Europe, and Asia, with a focus on financial conditions.
regional PMI, industry performance, US, Europe, Asia
false
Tightening financial conditions continue to weigh on US demand while Europe and Asia remained resilientMarch Macro Brief Financial fissures emerge
Multiple Chart
Accenture
View slide
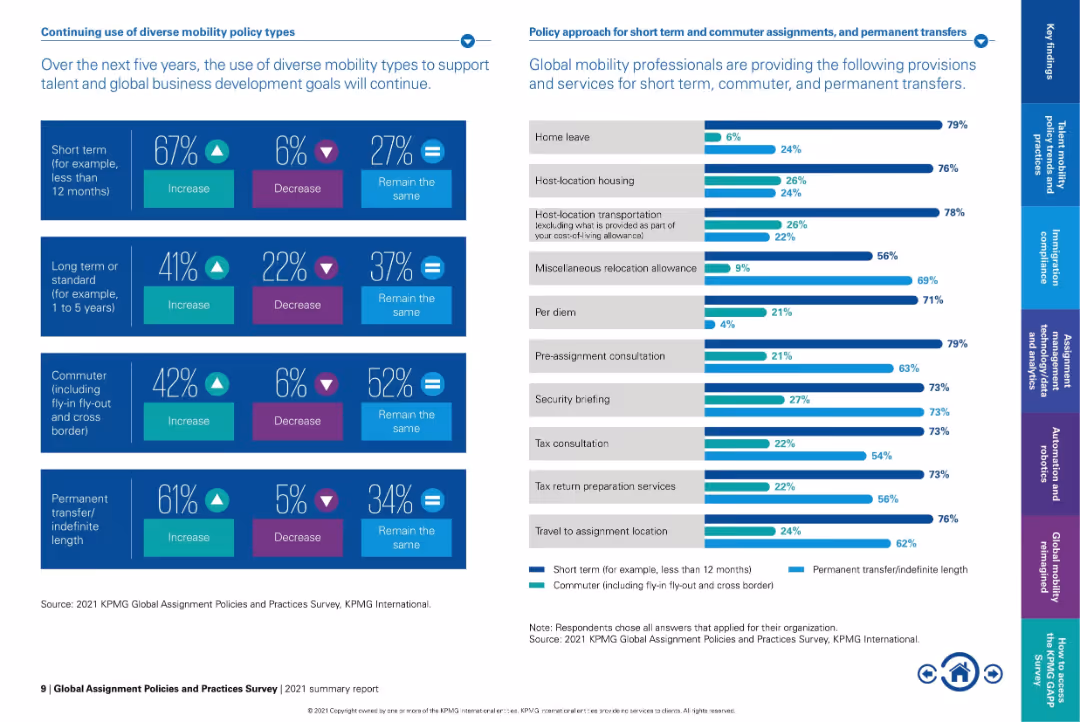
Split-panel layout with infographic bars and percentage stats on left, and horizontal bar chart on right.
Strategic Planning
Professional Services
The slide outlines the expected evolution in mobility policy types over the next five years, showing a strong trend toward increasing short-term and permanent transfers. It also lists provisions most often offered for short-term and commuter assignments.
mobility policies, short-term assignment, permanent transfer, global workforce, relocation provisions, commuter assignment, global mobility, policy trends, workforce planning
false
Continuing use of diverse mobility policy typesGlobal Assignment Policies and Practices Survey
Mixed Chart
KPMG
1
...
Next
Load More
Hold On!
We are searching in our database
If nothing, comes up, please try different filters!
Create a FREE account to continue browsing
Receive Instant Access to 1,000+ slides from companies like McKinsey, Google, and Goldman Sachs
First Name
Last Name
Email
Password
I agree to all
Terms & Privacy Policy
Thank you! Your submission has been received!
Oops! Something went wrong while submitting the form.
Have an account?
Sign in
Column Chart
Heatmap
Chevron
Org Chart
Infographic
Callouts
Timeline
List
Graphic
Picture
Process Flow
Diagram
Paragraph
Map
Table
Framework
Subtitle
Takeaway Box
Icon
Other Chart
Radar Chart
Waterfall Chart
Mekko Chart
Pie Chart
Scatter Plot
Line Chart
Bar chart
Bullet points