SELECT YOUR MODE
Charts, diagrams, frameworks, and more. Download individual slides in PowerPoint or Google Slides format. Mix and match to build your perfect deck.


PRO
Table with 5 columns and 5 rows. Bold left-side headers, grid lines, and dark blue blocks for headers. Clean and structured format.

PRO
Horizontal Gantt chart with labeled tasks and color-coded bars across time phases; grid background.

PRO
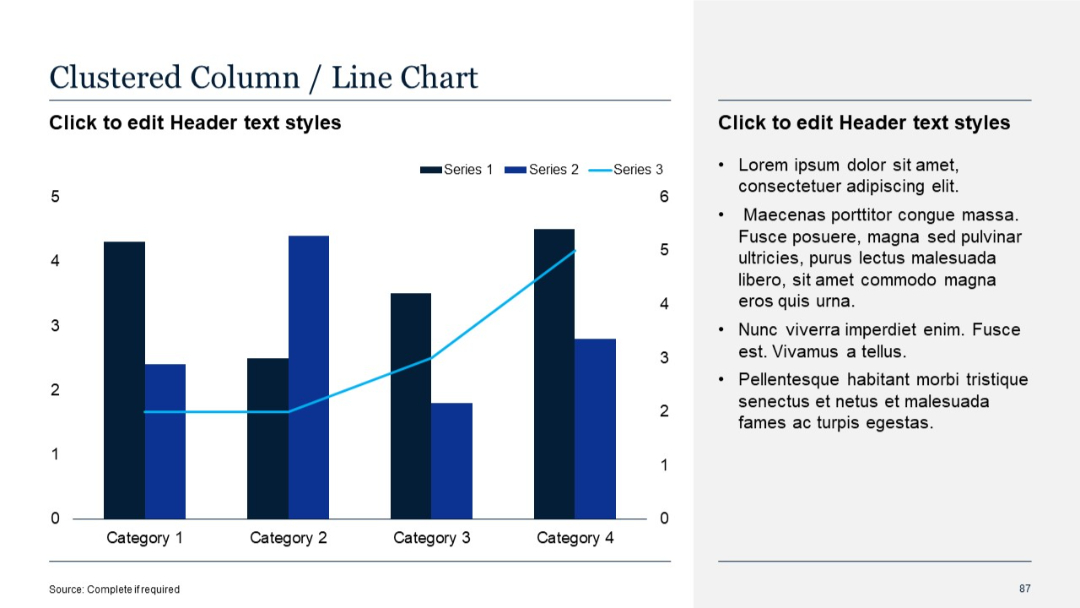
Clustered column chart with a secondary line series; text section on right
PRO
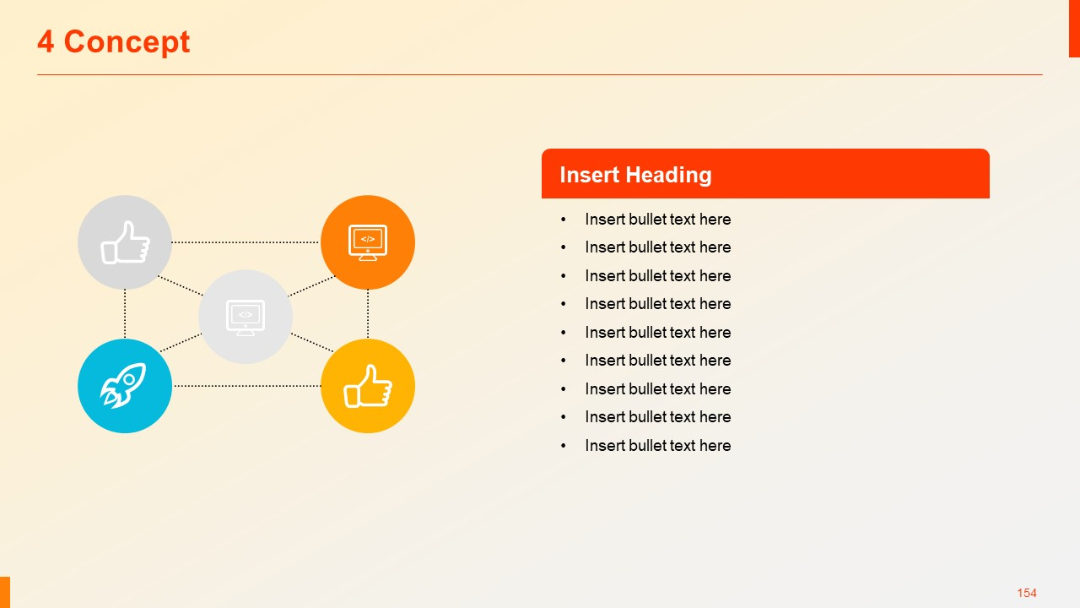
Grid network of five icons connected by dotted lines; a symmetrical structure with bullet list to the right.
PRO
Starburst layout with seven icons and headers positioned around a star. Icons include thumbs-up, computers, globe, and star.

PRO
Two side-by-side bar charts, each with identical structure, above bullet-pointed text. Standard 5-series, 4-category chart layout.

PRO
Four side-by-side pillar columns with circular icons and bullet point text below each header. Neatly segmented for clarity.

PRO
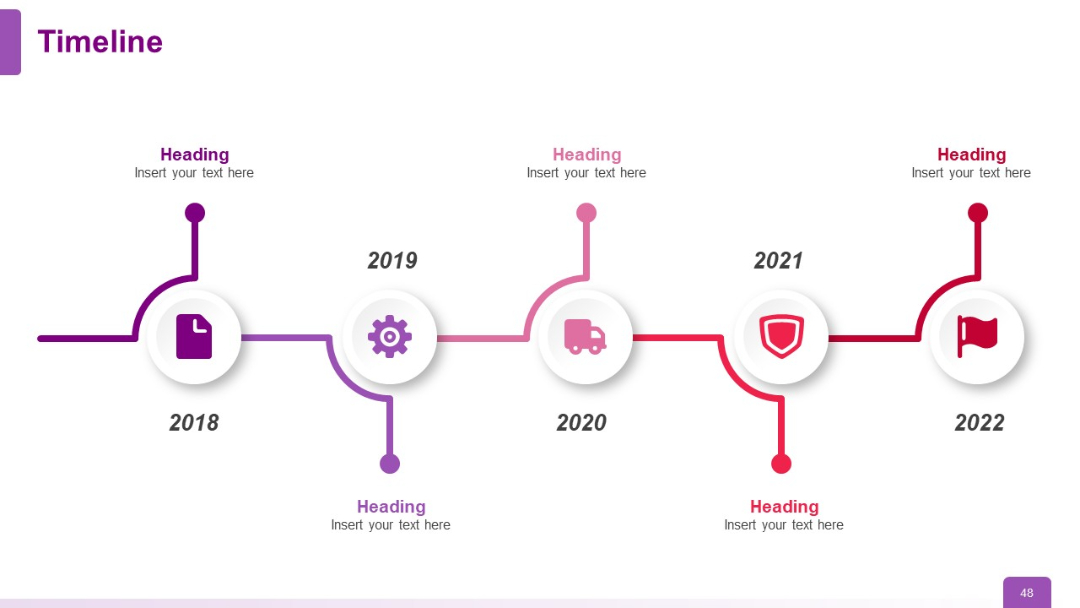
Horizontal timeline with 5 milestones (2018–2022). Each milestone has an icon and space for headings and text. Color-coded per year.
PRO
Two-row, five-column table with dominant purple title blocks in the first column. Minimalist, structured layout with text placeholders.
PRO
Numbered banner-style blocks in vertical order with modern arrow-tab designs.
PRO
A two-column layout with two red header blocks. Content cells underneath include section titles and placeholder text.
PRO
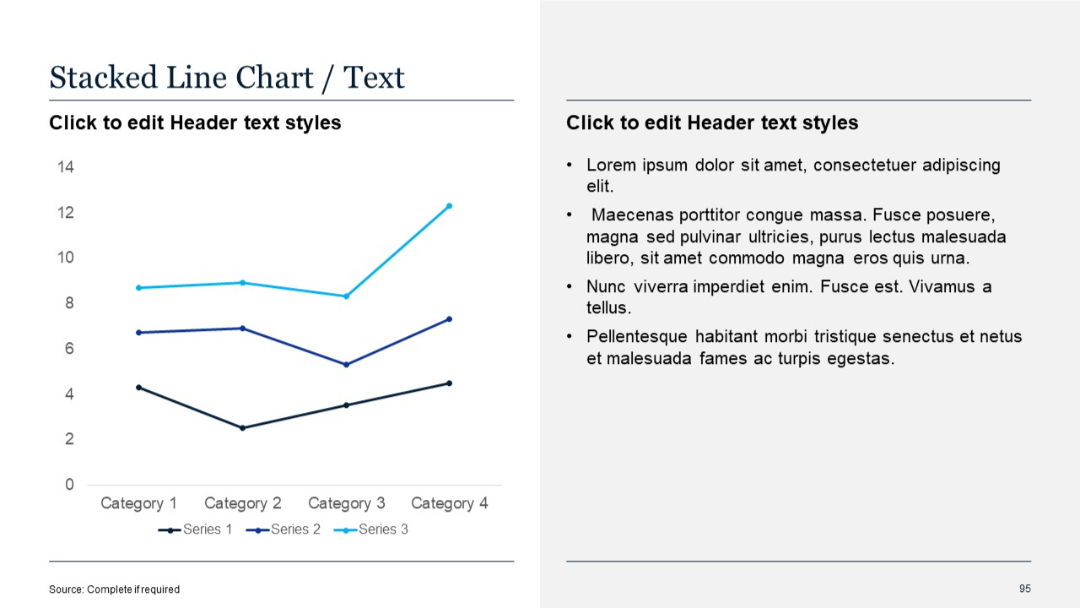
Multi-series line chart with three data series; right side with text bullets.
PRO
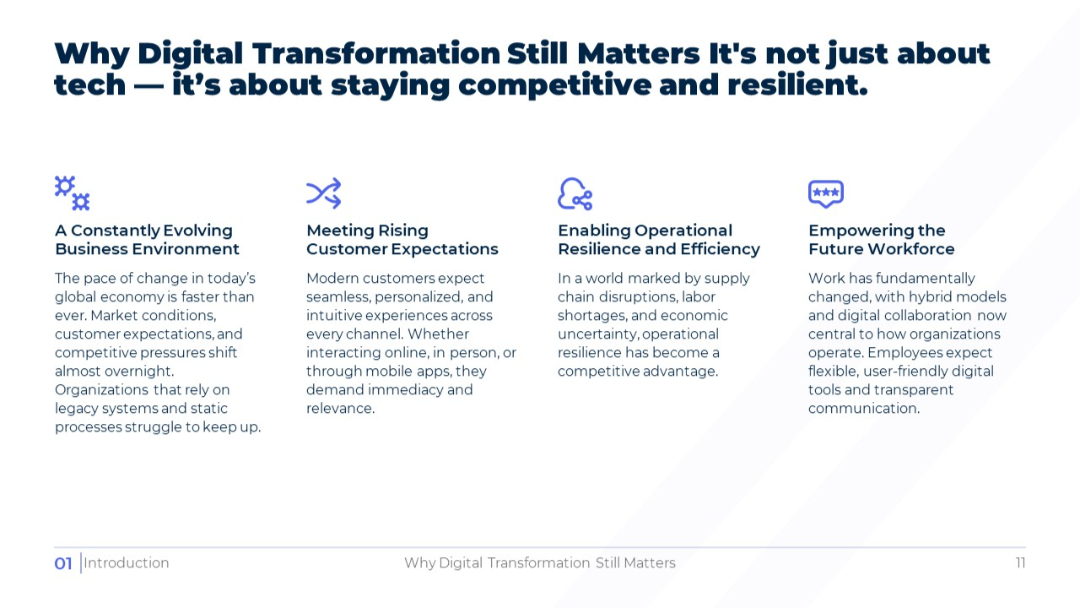
Four-column layout with icons and short paragraphs; clean white background with bold blue headings and minimal design accents.
PRO
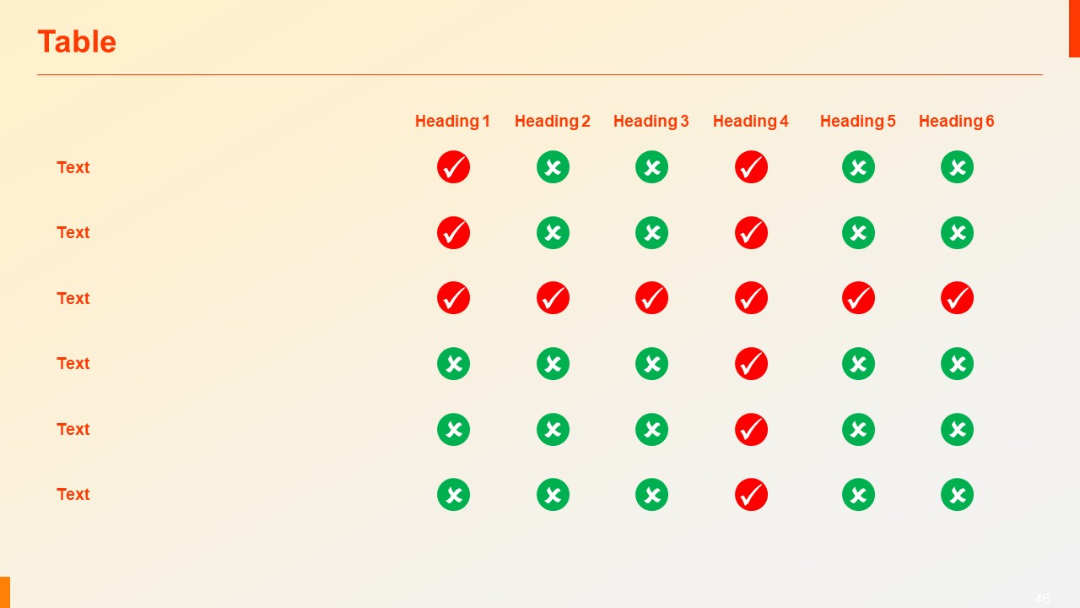
Matrix-style table with rows of text vs six column headers using green check and red cross icons. Highly visual and simple.
PRO
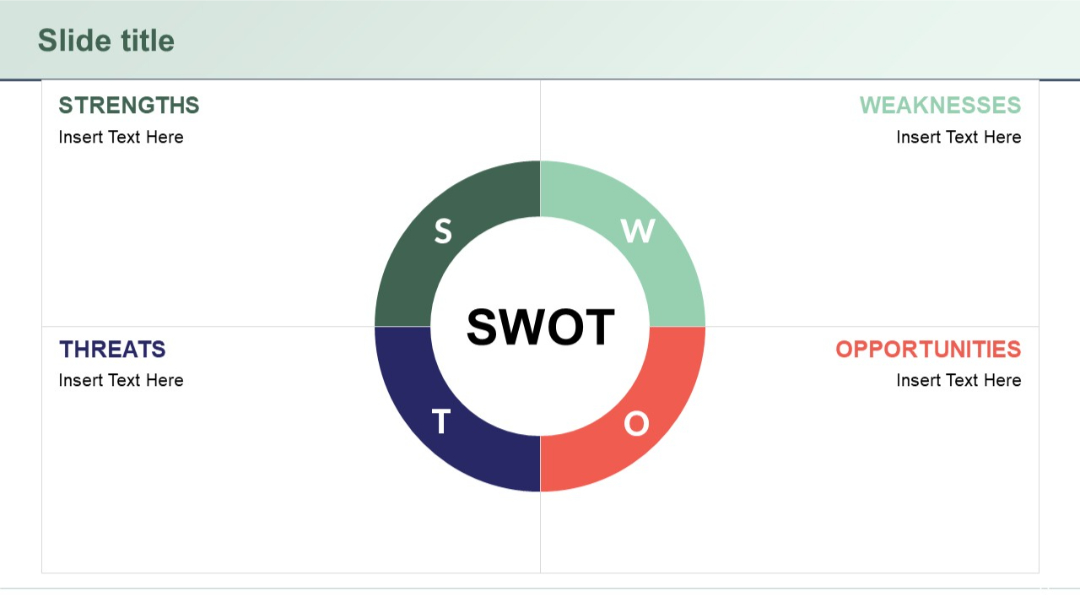
Circular SWOT layout with each quadrant labeled. Central circle says "SWOT", surrounding text includes Strengths, Weaknesses, Opportunities, Threats.
PRO
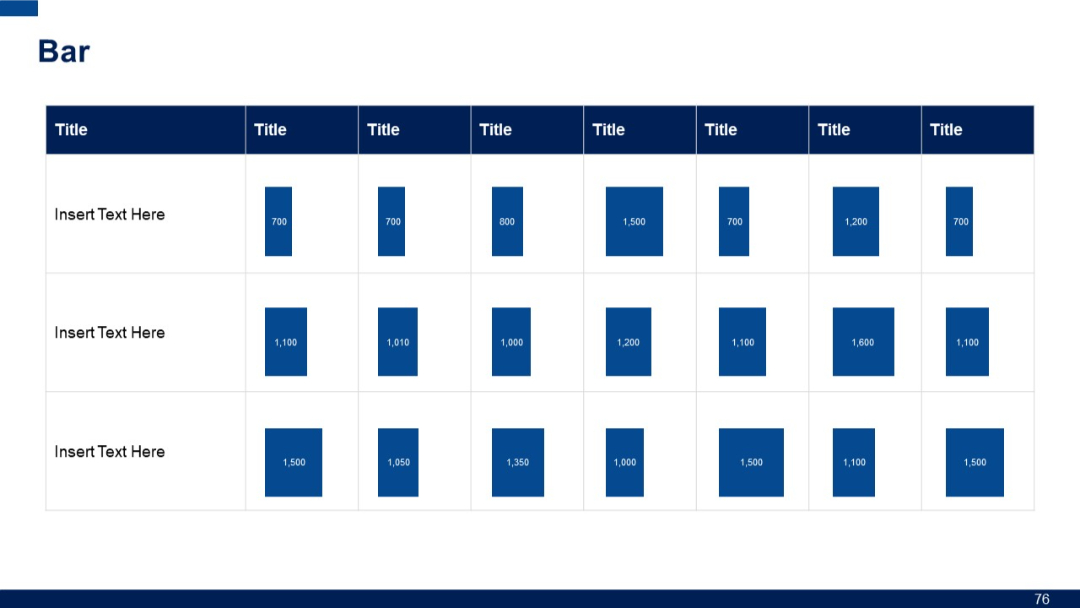
Grid layout with rows of vertical bar charts embedded in a table format. Each cell includes a value and a corresponding bar.
PRO
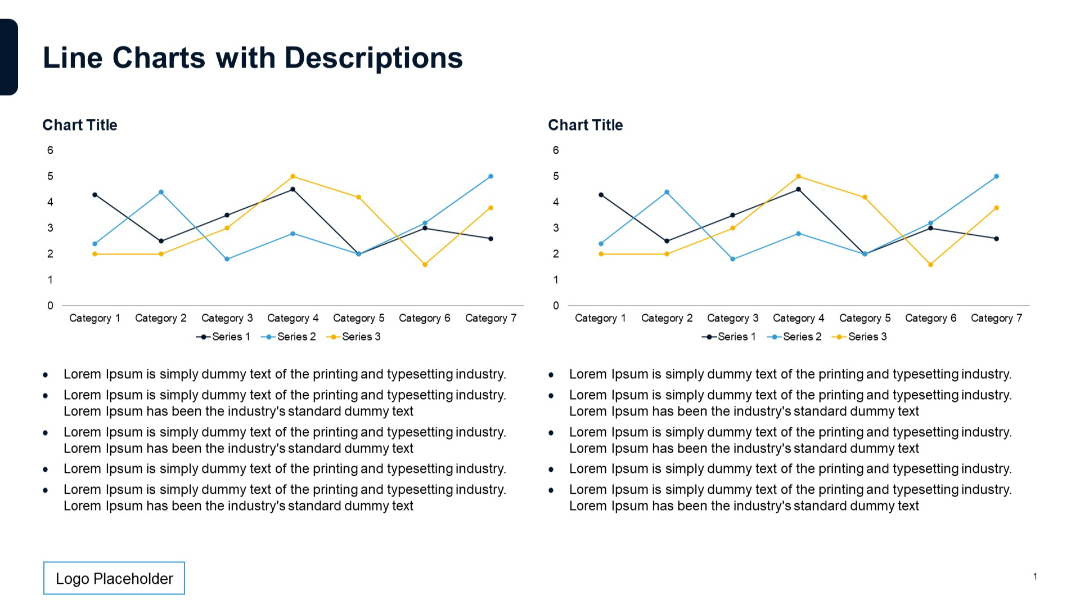
Dual line charts at the top with two sets of legend and axis labels. Bottom has bullet points in two columns for descriptive text.
PRO
Four colorful circular speech bubble icons with center-aligned graphics, positioned in a 2x2 grid. Each has accompanying title and descriptive text.

PRO
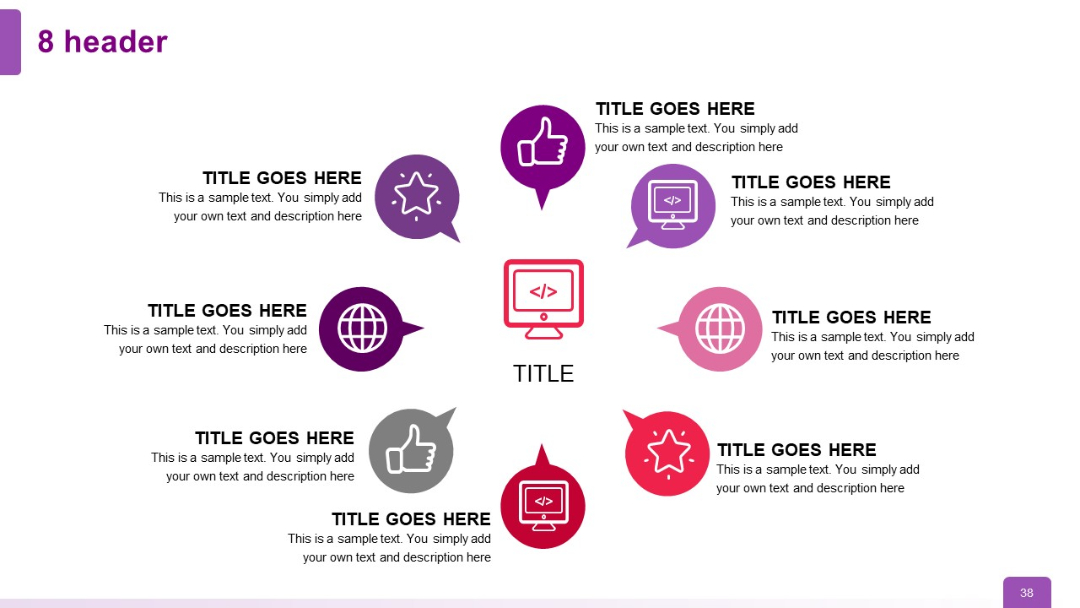
Symmetrical circular infographic with eight headers evenly spaced around a central code icon; each with its own unique color and icon.
PRO
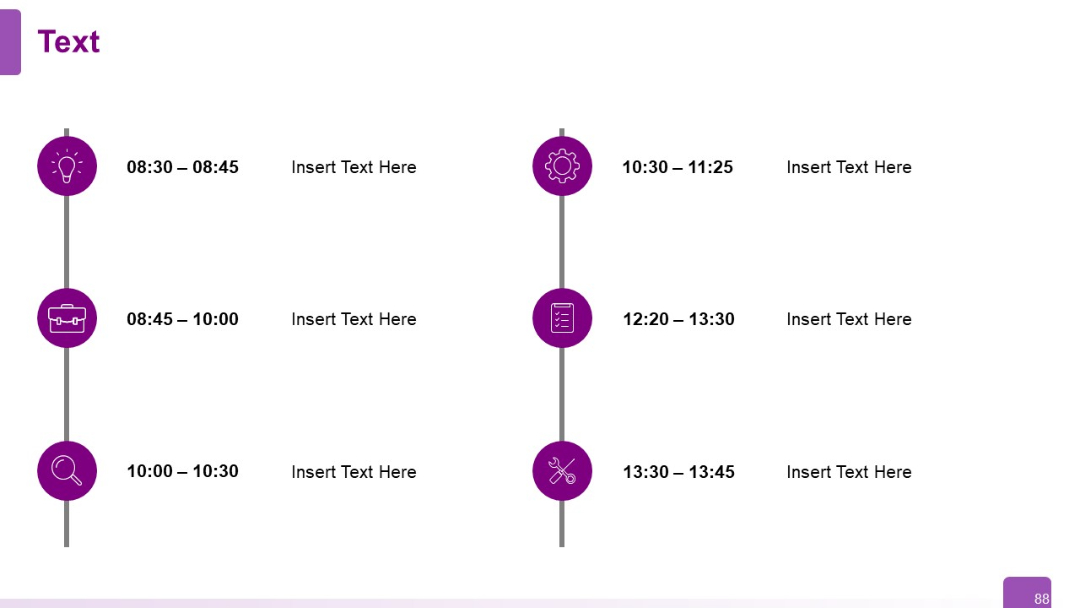
Vertical timeline with large circular icons and matching symbols. Time slots on the left, event descriptions to the right.
PRO
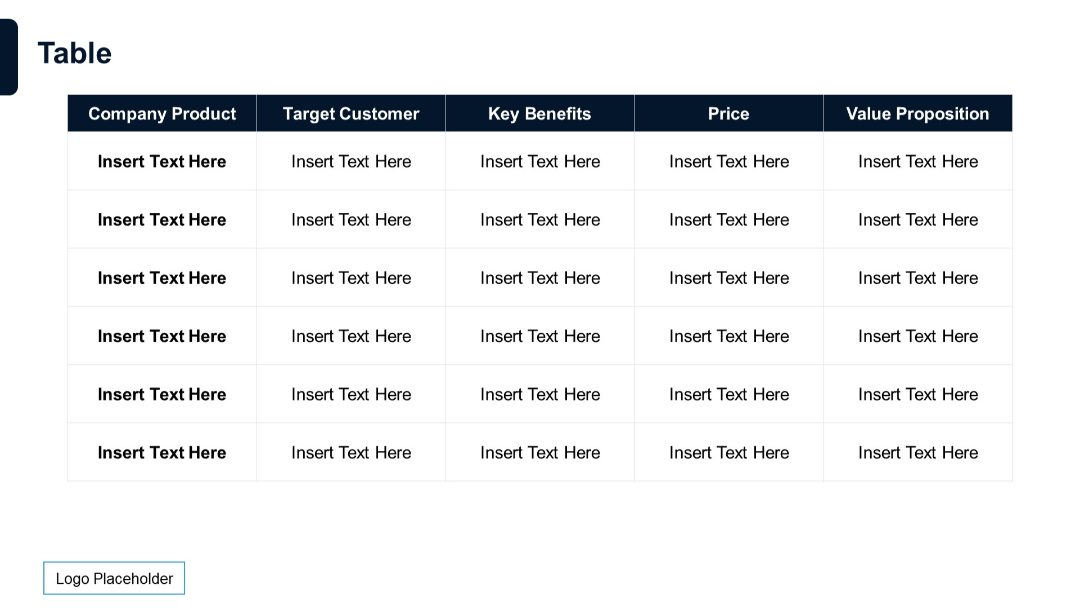
Six-row, five-column table with same format and styling; increased row entries for deeper analysis.
PRO
Pie chart on the left and vertical column chart on the right.

PRO
Grid of four testimonials featuring avatars, quote marks, and text boxes. Balanced two-column layout with user profile icons.
PRO
Two-column checklist layout with purple headers and check icons for each point; equal spacing and mirrored columns.
PRO
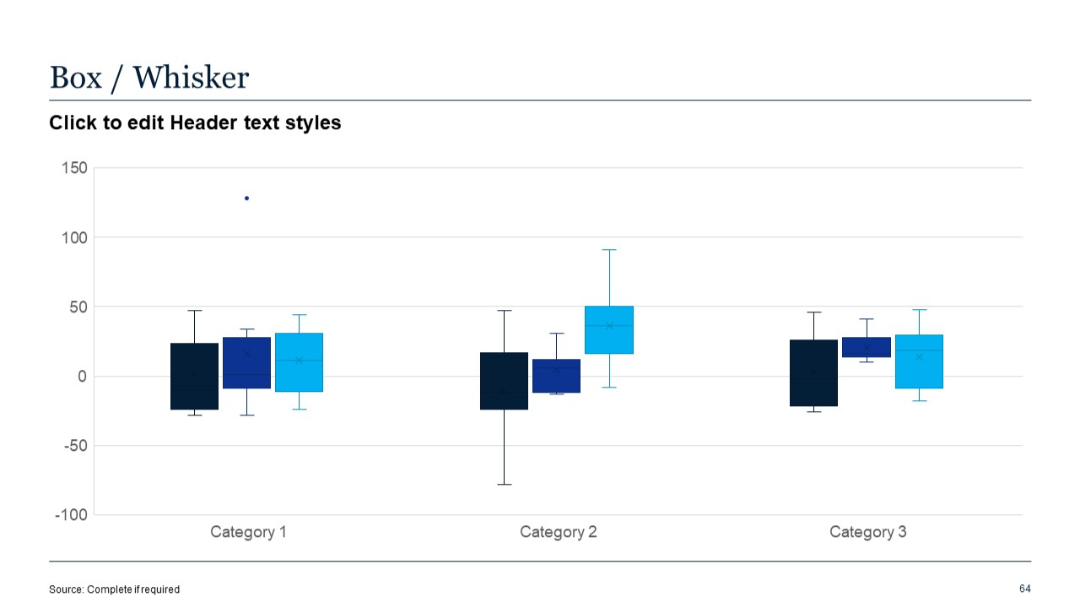
Box-and-whisker plot with three category groups and color-coded series; grid background.
PRO
Two-row, two-column layout with left-aligned colored side tabs (numbered and titled) and adjacent text boxes. Stylized rectangular segments.
PRO
Side-by-side world maps for 2020 and 2025 showing country adoption maturity in darker/lighter shades; explanatory text at the bottom.

PRO
Symmetrical dual-column timeline with vertical lines and circular nodes connecting horizontally placed text.
PRO
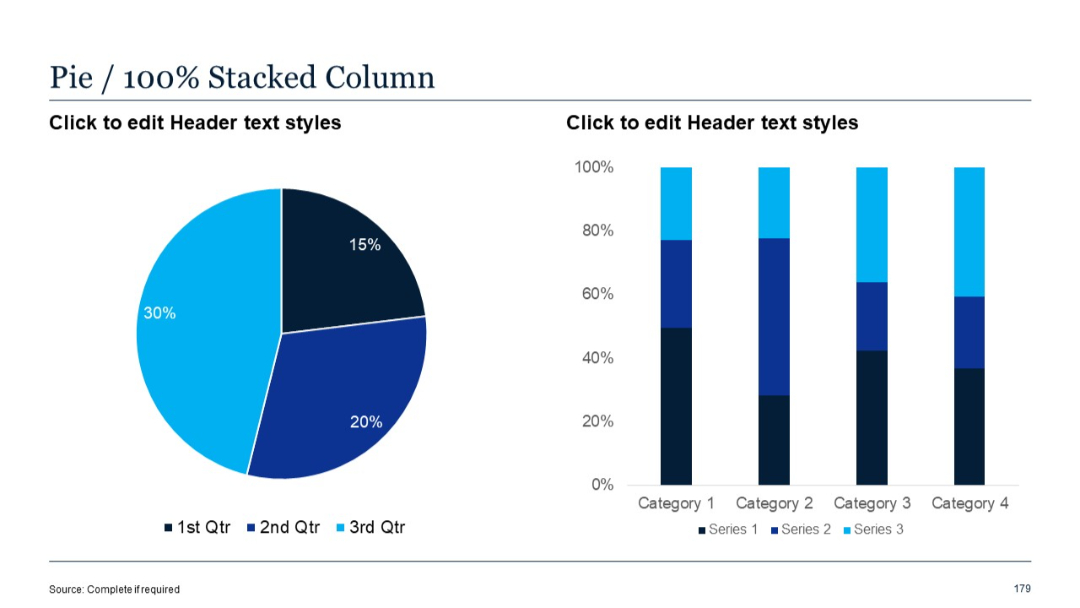
Pie chart on the left and 100% stacked vertical bar chart on the right.
PRO
Minimalist grid layout on a light background showing 8 numbered agenda sections.