PRO
Similar to slide 14 but with four rows. Vertical table-like layout with blue header sections and right-aligned details.

PRO
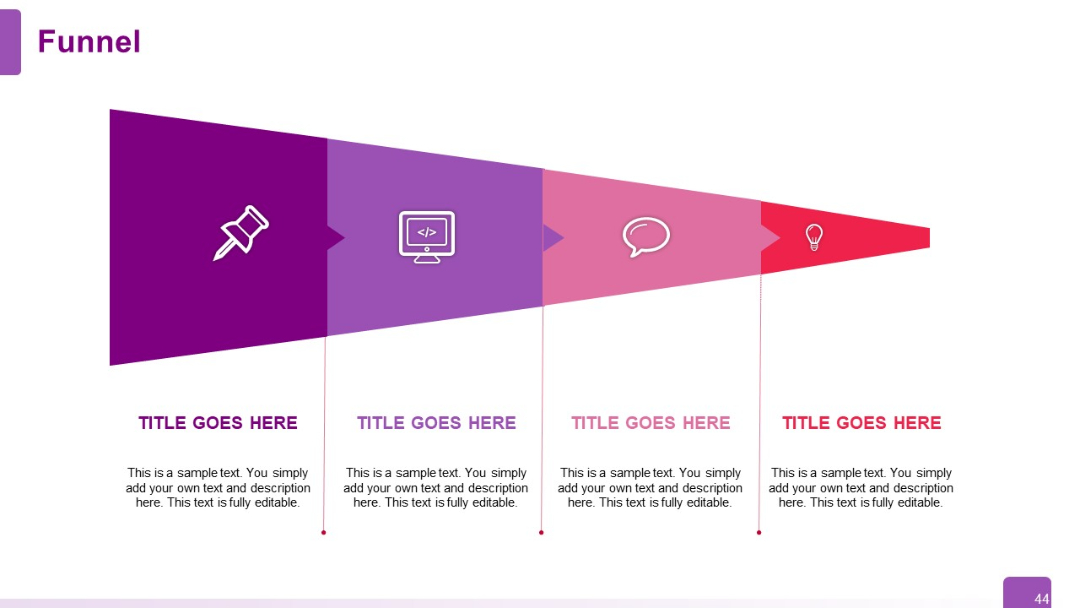
Horizontal funnel with four descending sections, each with a different icon and color. Includes titles and sample description below each section.
PRO
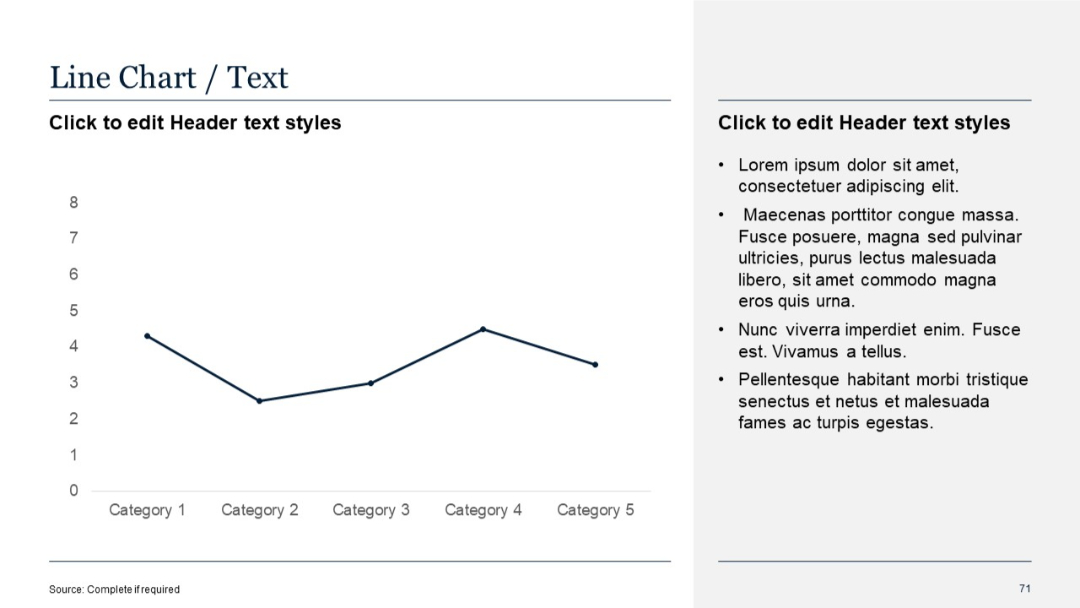
Split layout with a simple single-line chart on the left and bullet text section on the right. Minimalist design with a light background.
PRO
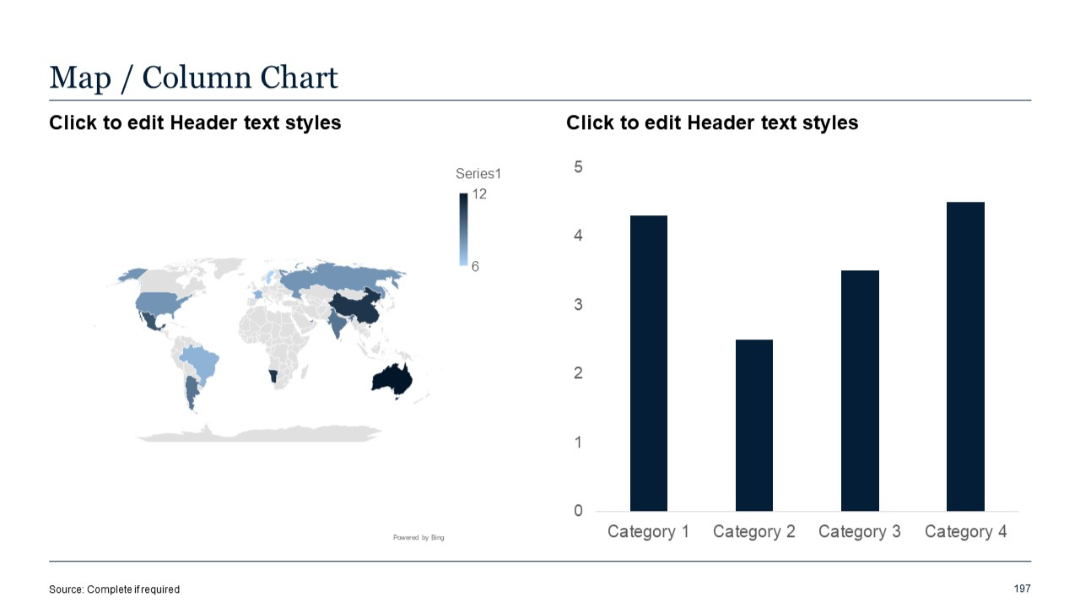
Left: world heat map; Right: vertical column chart comparing four categories.
PRO
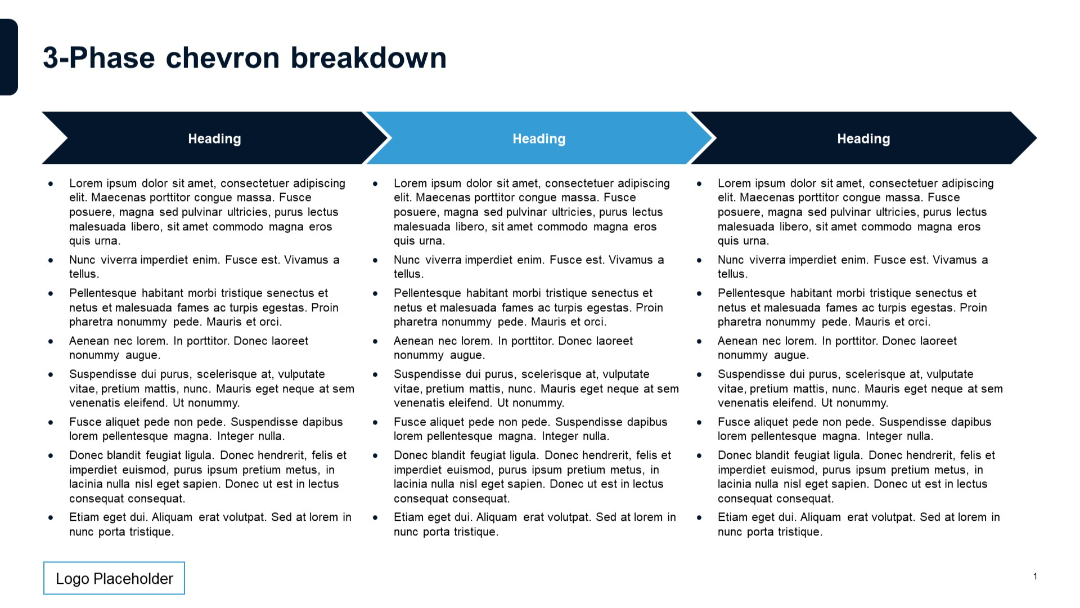
Three horizontal chevrons pointing right, each with a title inside. Below each chevron is a bulleted list of text in three evenly spaced columns. Blue and dark blue alternating colors for chevrons. Logo placeholder bottom left.
PRO
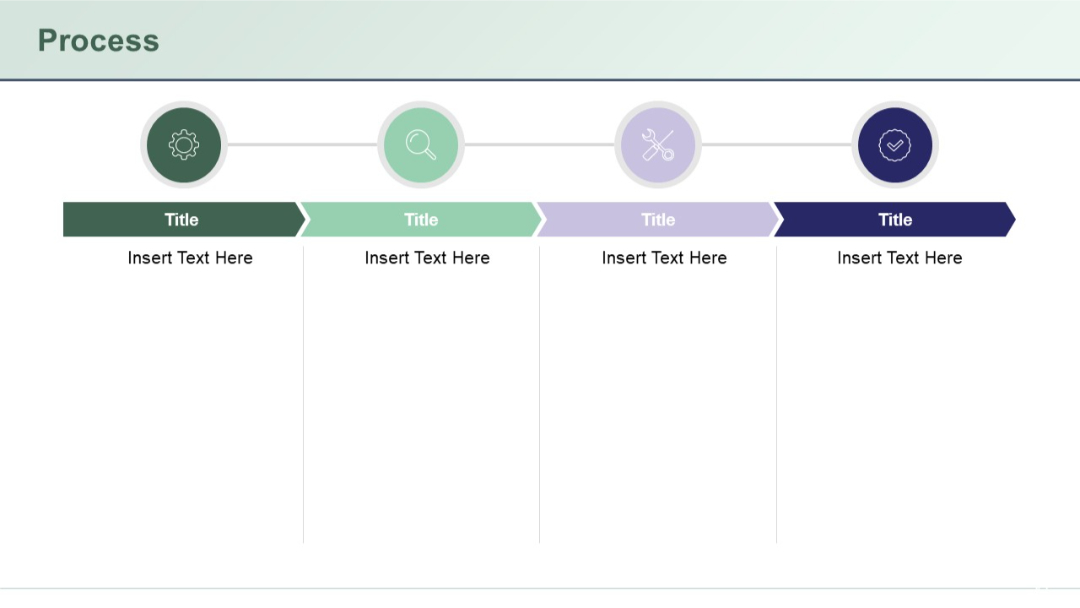
Horizontal process diagram with icons in circles connected by a line, underlined by colored arrow boxes.
PRO
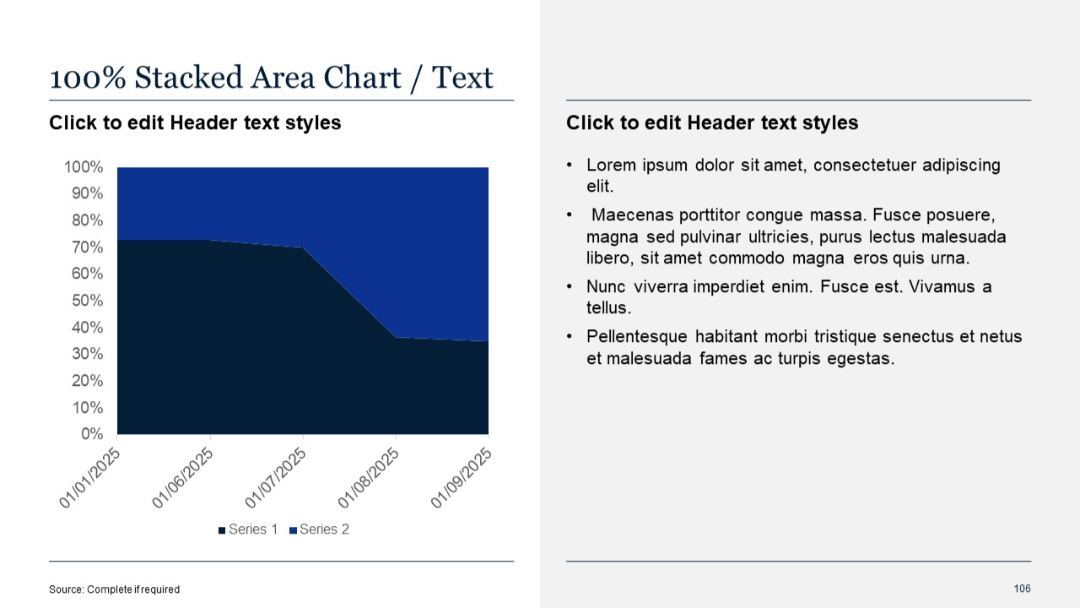
100% stacked area chart on the left with angled date labels; standard text panel on the right.
PRO
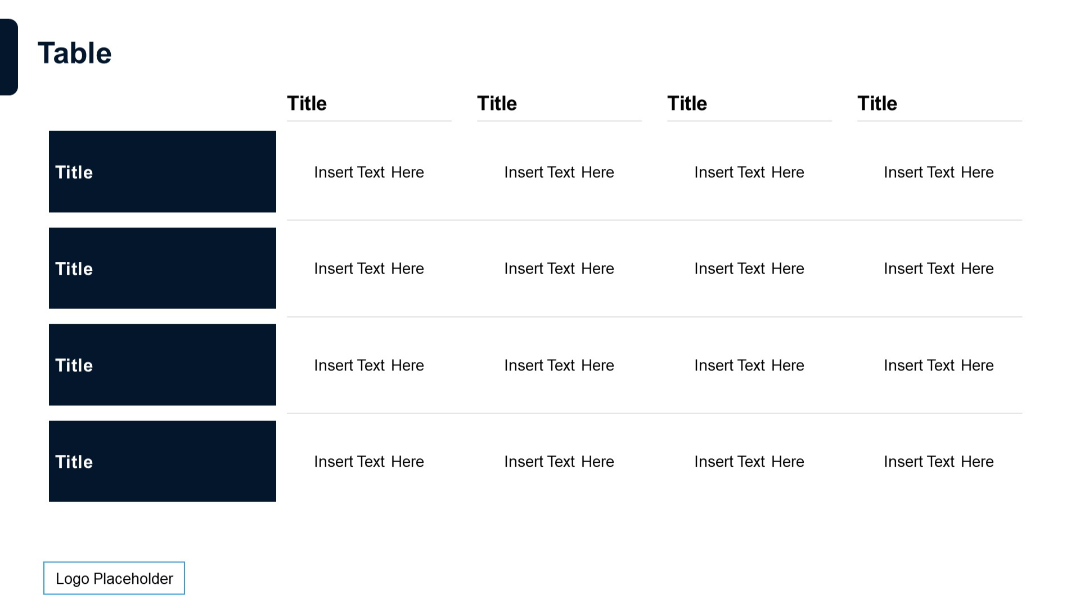
Table with 4 rows and 4 columns; left column has shaded title blocks; remaining cells are plain with text placeholders.
PRO
Minimalist layout with two text boxes (subtitles) on either side of a blank white canvas; very basic structure.
PRO
Four-column SWOT-style layout with circular progress bars and bullets

PRO
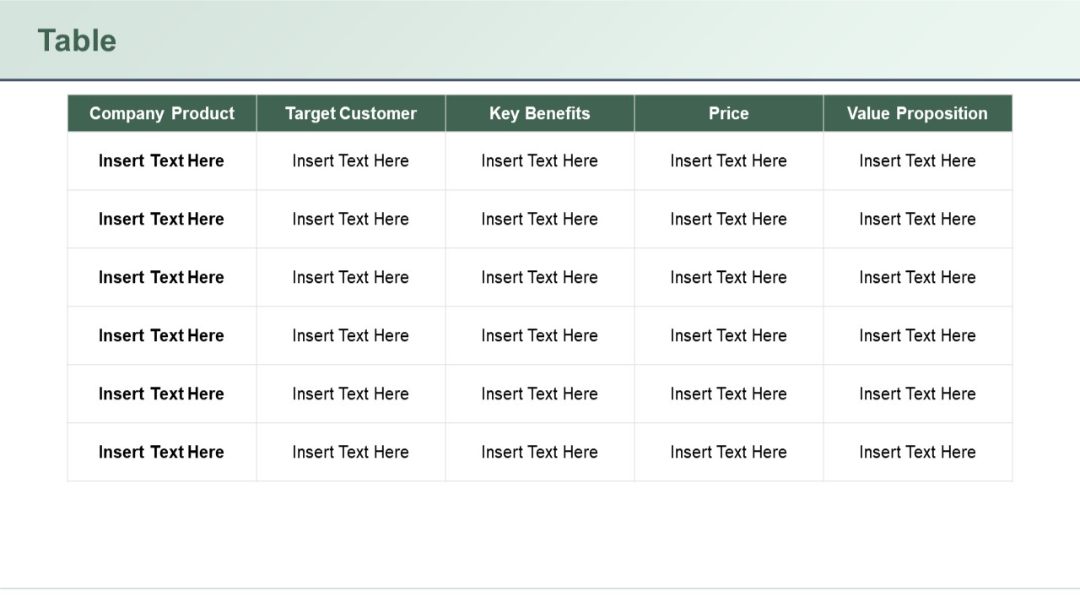
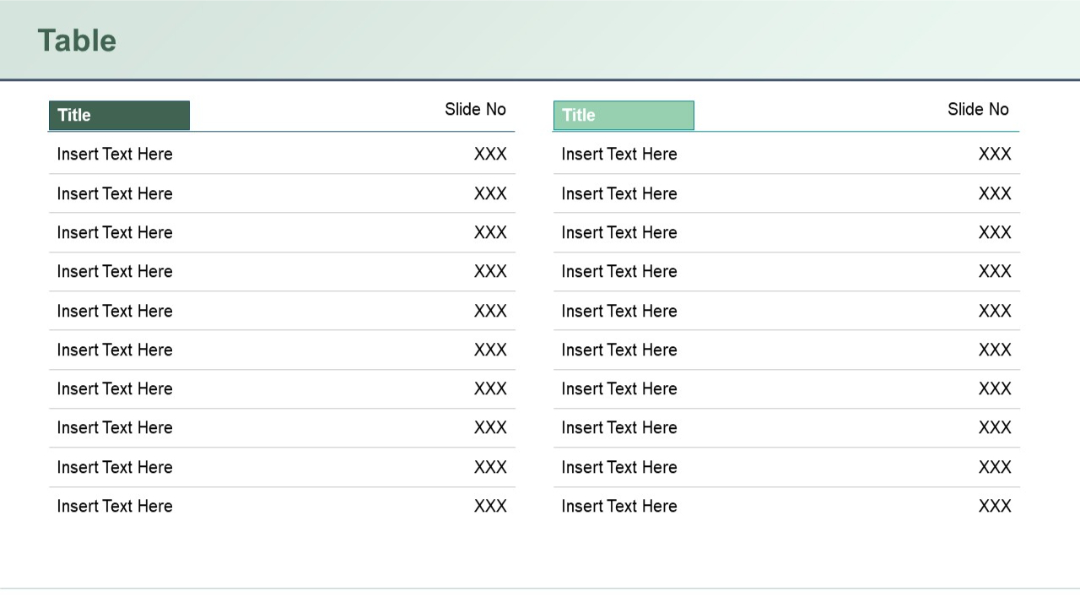
Six-row table format; consistent with previous product comparison layouts; uniform green-topped column headers.
PRO
Four colorful circular speech bubble icons with center-aligned graphics, positioned in a 2x2 grid. Each has accompanying title and descriptive text.

PRO
Split background with a gradient green upper half and white bottom. Minimalist design with large numeric indicator and bold section label.

PRO
Left-aligned background image with circular progress-style graphics for 30, 60, and 90-day milestones.

PRO
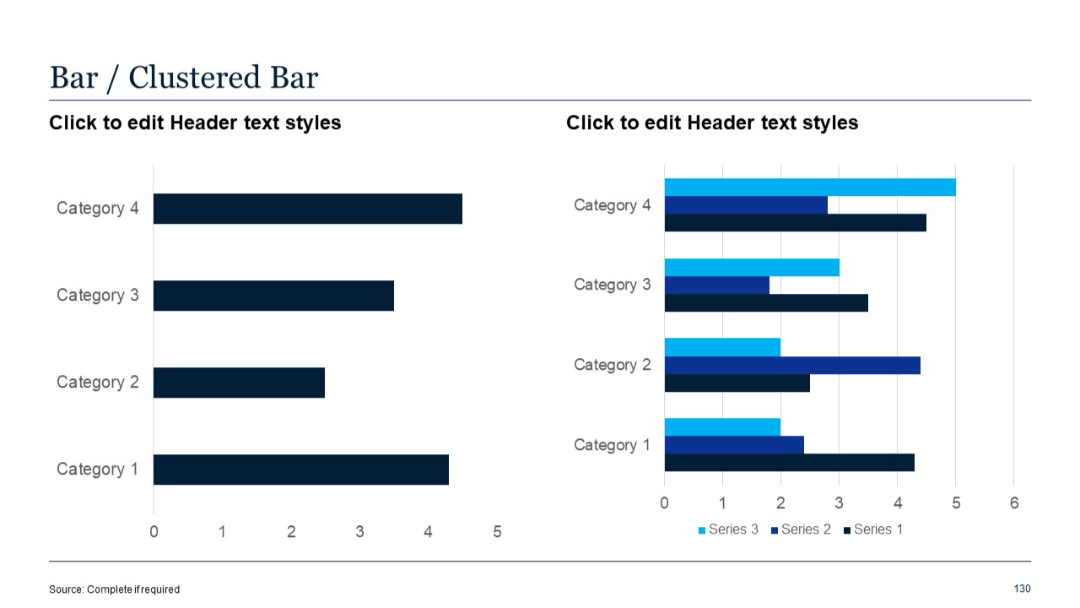
Left: plain bar chart; Right: clustered bar chart showing three series side-by-side per category.
PRO
Two-row horizontal layout with numbered, icon-labeled steps and rounded rectangles for descriptions.
PRO
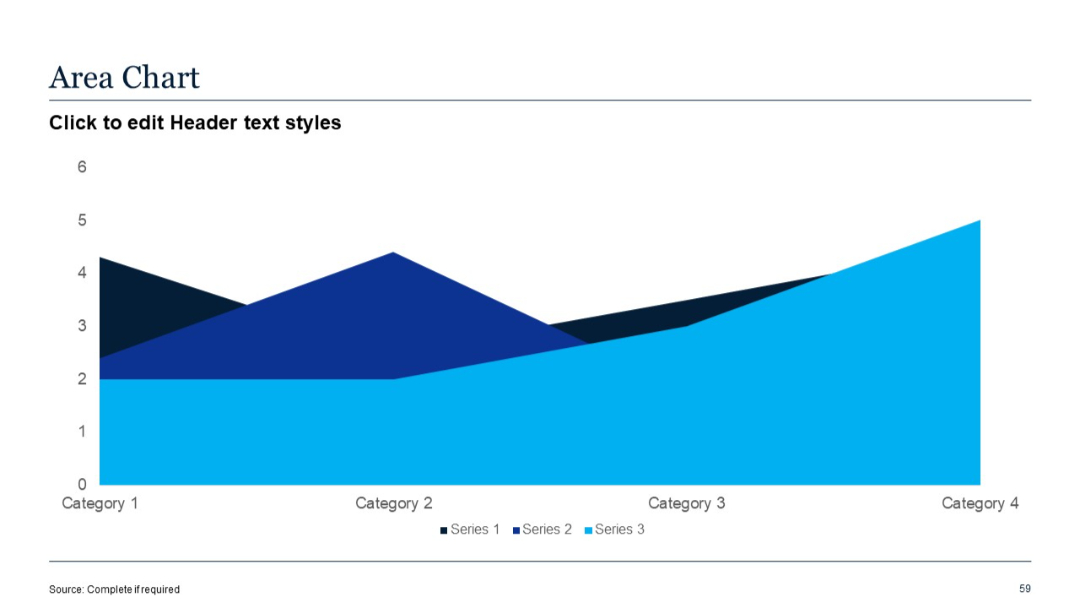
Layered area chart with three data series; smooth curves; partially overlapping colors.
PRO
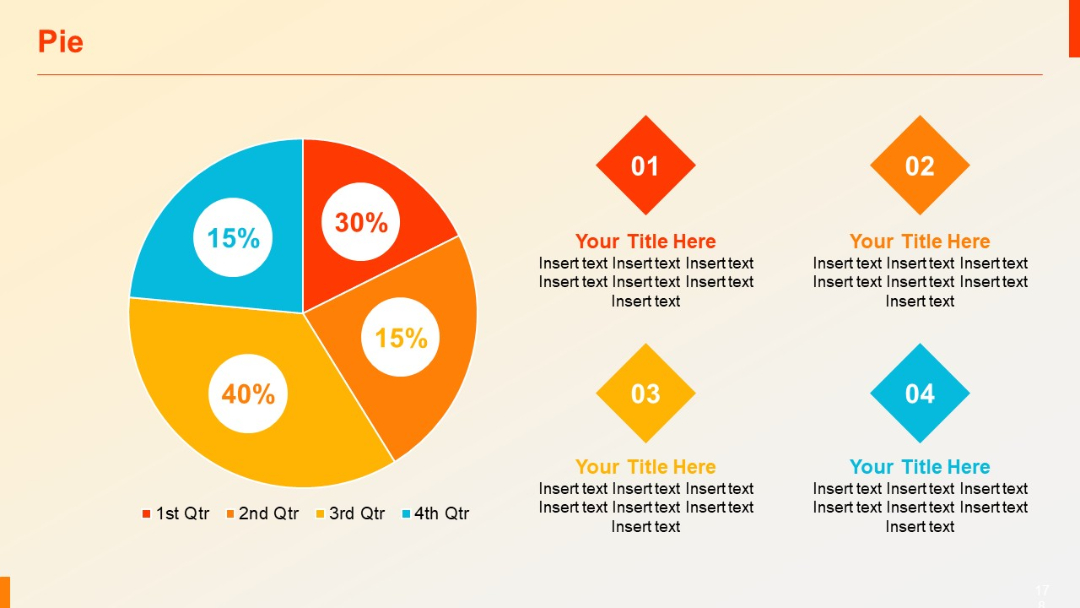
Colorful pie chart (4 segments) with percentages inside each slice. Right side includes four diamond-shaped icons with placeholder text and labels.
PRO
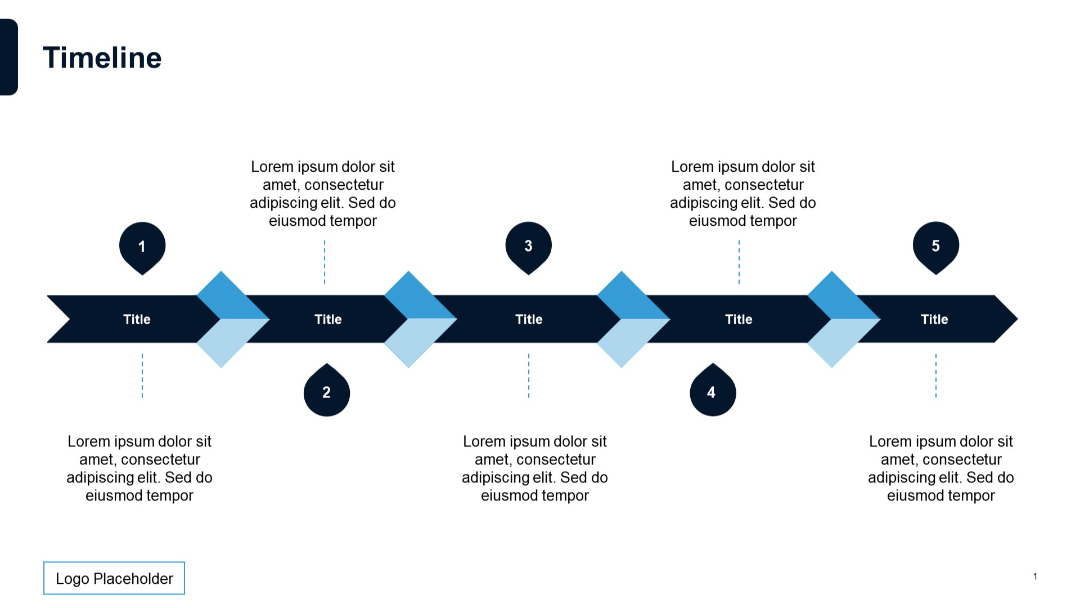
Horizontal arrow timeline with five marked steps, alternating text positions above and below.
PRO
Dark blue background, bold gradient text, minimal elements with a date in the top-right corner.

PRO
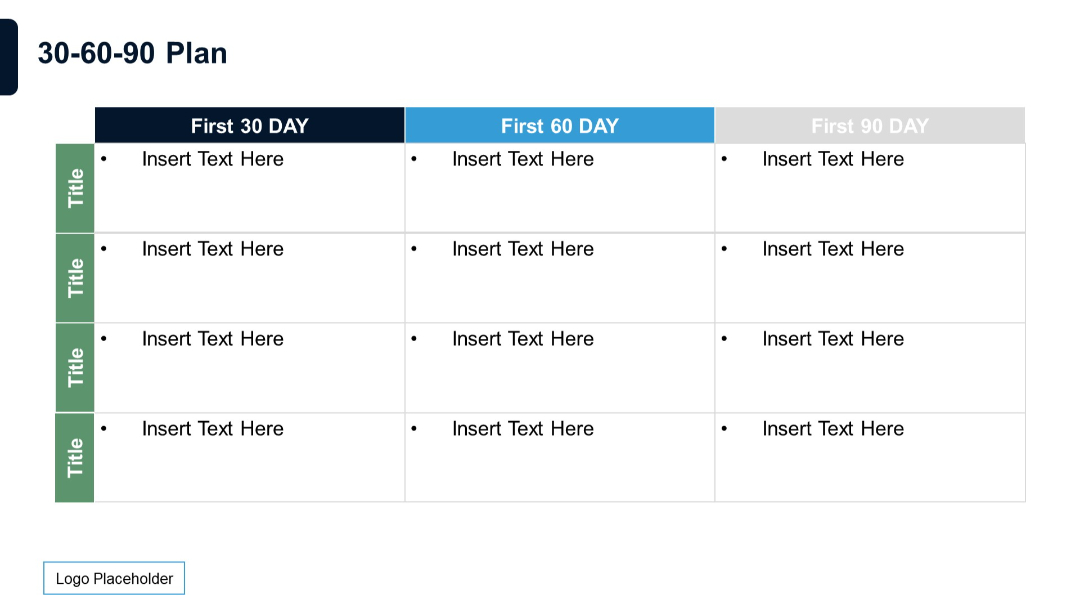
Table format with row titles and column headers labeled for each 30-60-90 day phase, featuring bullet points.
PRO
A dense feature comparison table with green checkmarks and red Xs across 7 columns. Only two rows are shown for contrast.
PRO
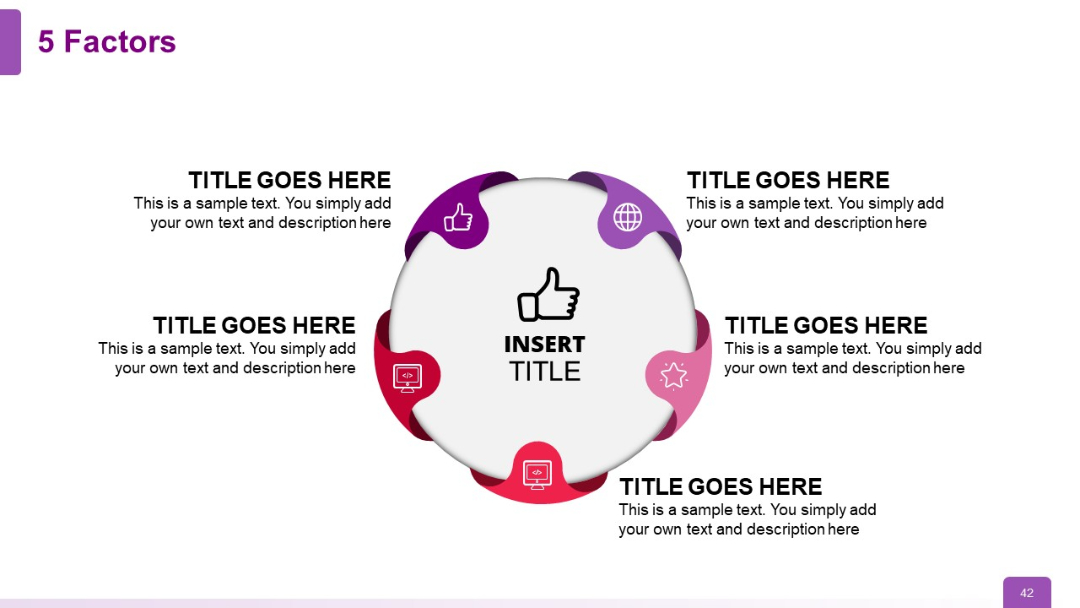
Similar circular layout to previous, with 5 evenly spaced icons and text sections around a central icon. Balanced design with slight color variations.
PRO
Title slide with a vertical orientation and rounded corner on the right; blue background dominates right side; white left margin.

PRO
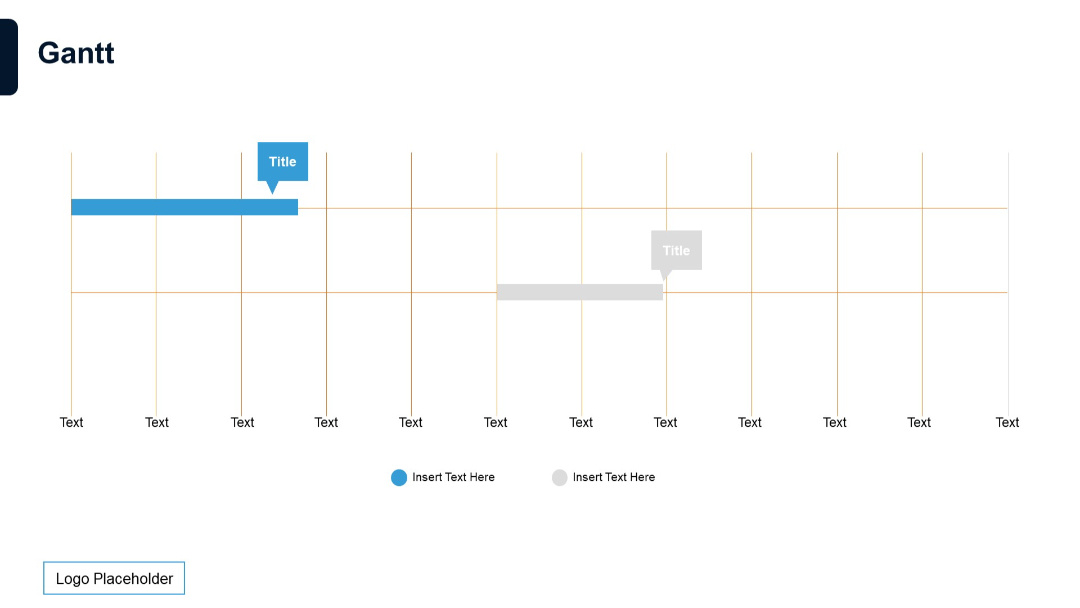
Minimalist slide with a horizontal Gantt chart layout, two horizontal bars, gridlines, and color-coded labels.
PRO
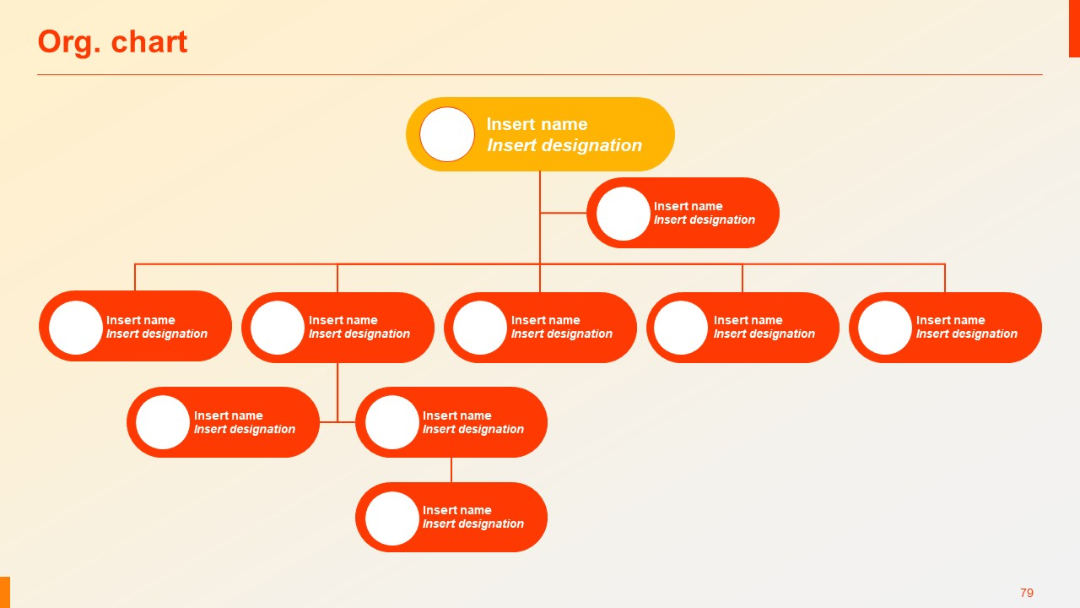
Modern horizontal org chart using rounded rectangles and photos/icons for each position.
PRO
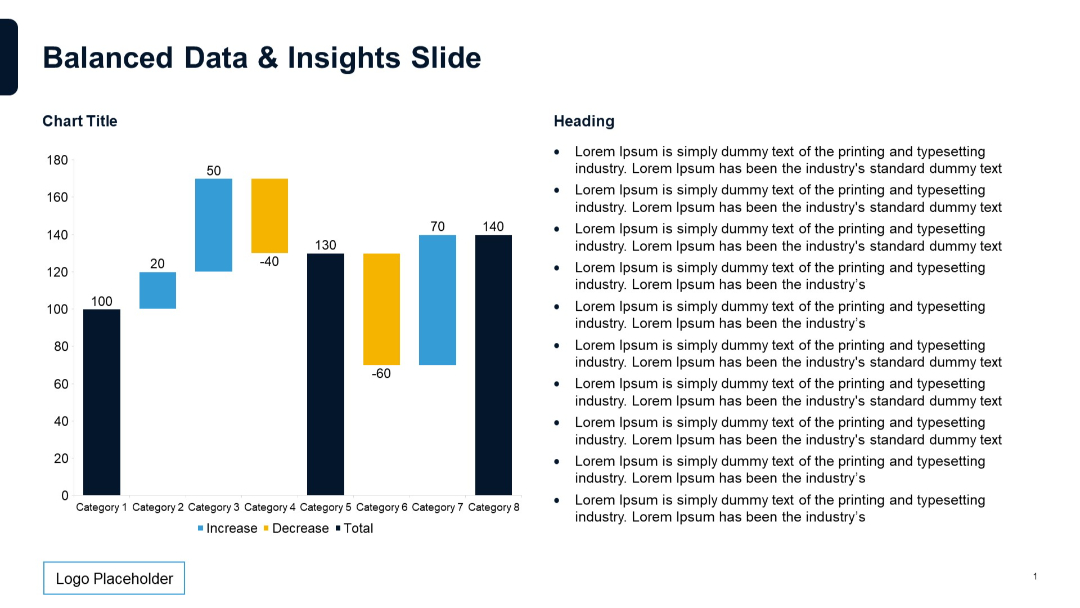
Waterfall chart on the left with increase/decrease values and total. Right side has bullet-point placeholders.
PRO
Message board-style layout with a large header bar and four speech bubble icons. Each row includes bolded and italicized text areas.
PRO
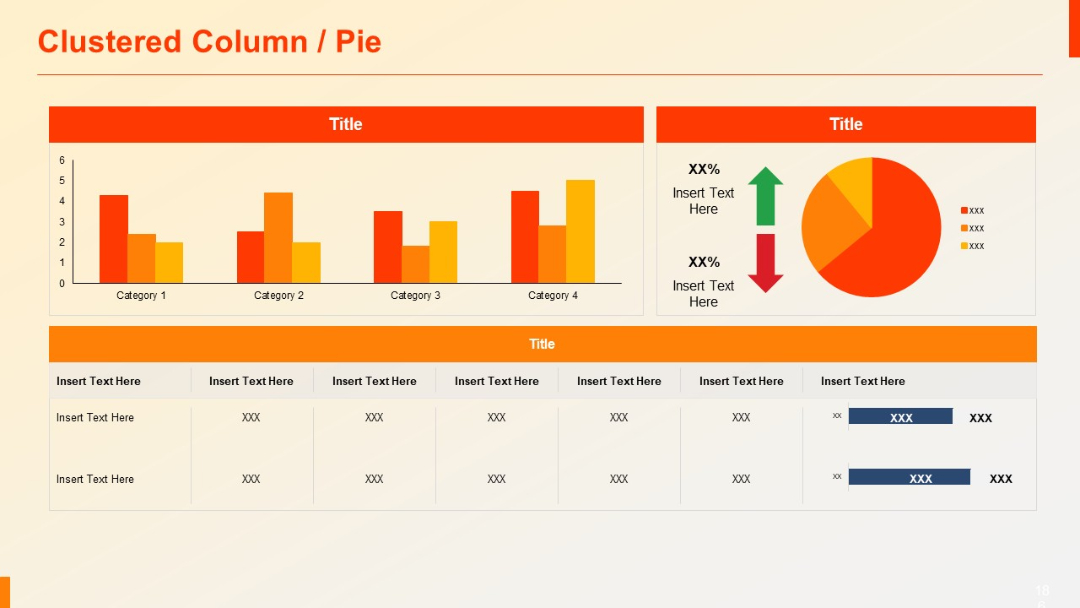
Dual visual layout: clustered column chart on the left and pie chart with up/down arrows on the right. A data table is placed at the bottom.
PRO
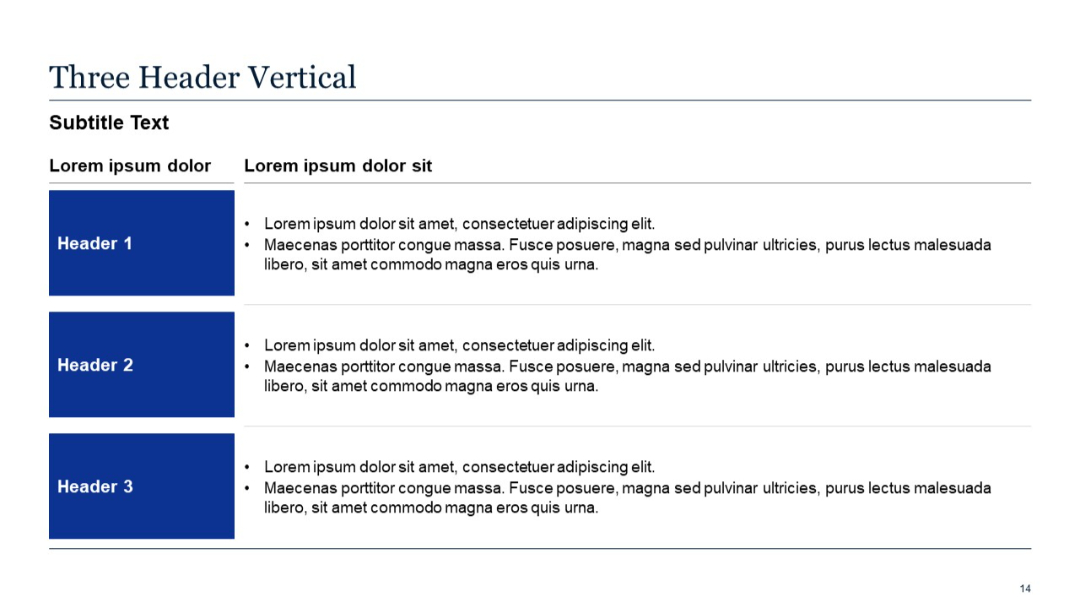
A vertical layout with three blue-colored header boxes on the left and corresponding detailed text on the right. Structured like a table.