PRO
A professional slide with six segments and six corresponding white circular text boxes evenly spaced around the ring.
PRO
Vertical timeline agenda with time ranges, icons, and two columns for content distribution.
PRO
Four-column SWOT-style layout with circular progress bars and bullets

PRO
3-column version of Slide 29. Still includes feature list with visual check/cross icons, pricing headers, and bottom CTA buttons.
PRO
World map centered with labeled placeholder texts. Left vertical sidebar for notes. Simple, grayscale layout.
PRO
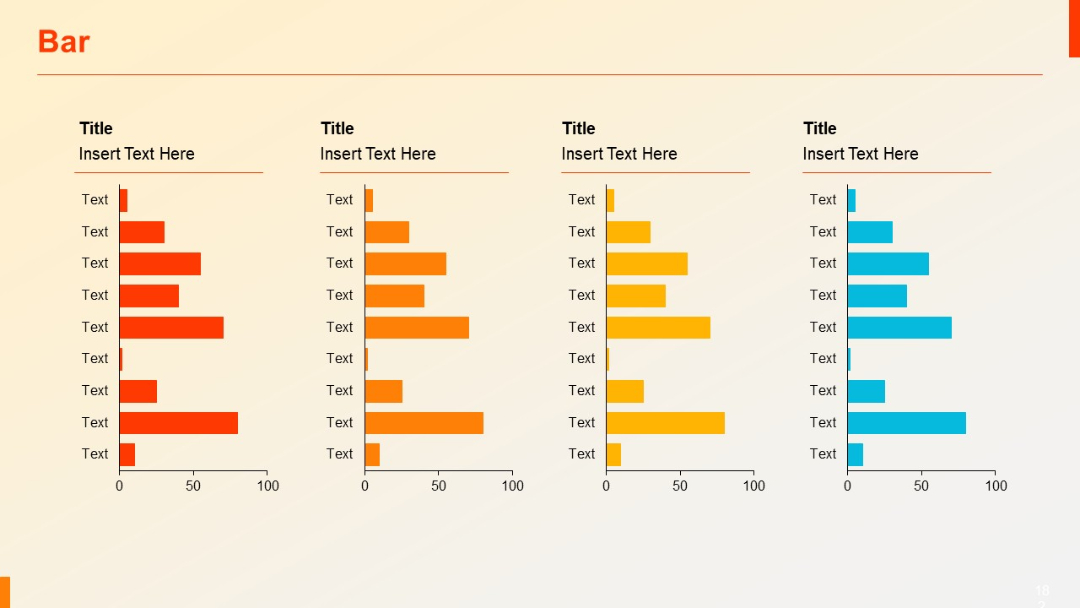
Four horizontal bar charts arranged in columns, each with a title above and x-axis ranging from 0–100, with varying shades of orange and blue.
PRO
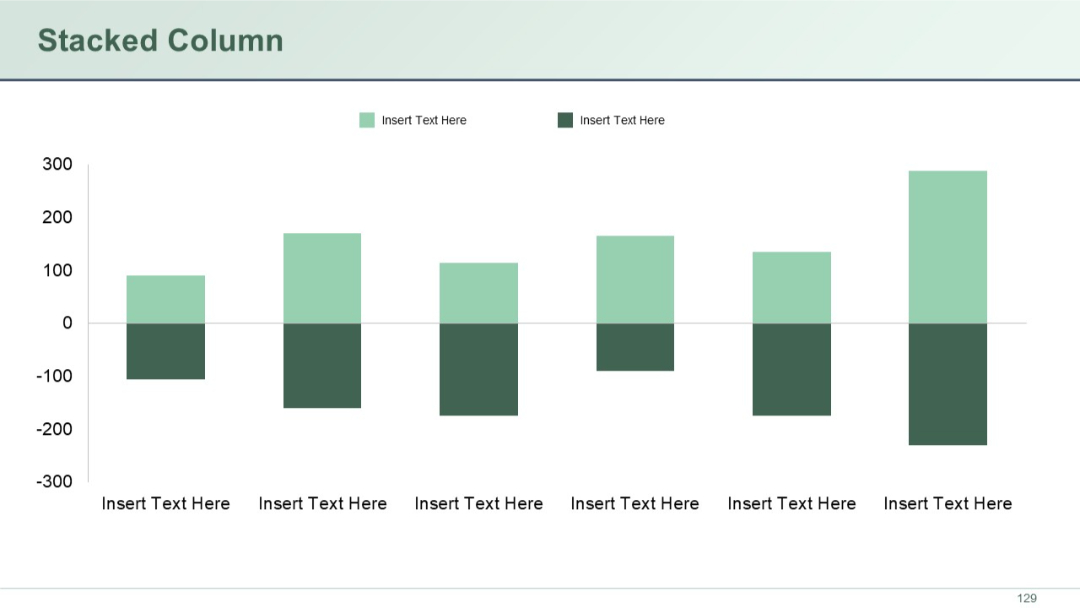
Stacked column chart showing continuous yearly data (Year 1 to Year 8) across five series, each stacked segment with a unique color.
PRO
Horizontal process diagram with five milestone icons inside location pins connected by arrows. Text headers below each icon. Subheading box underneath the row.
PRO
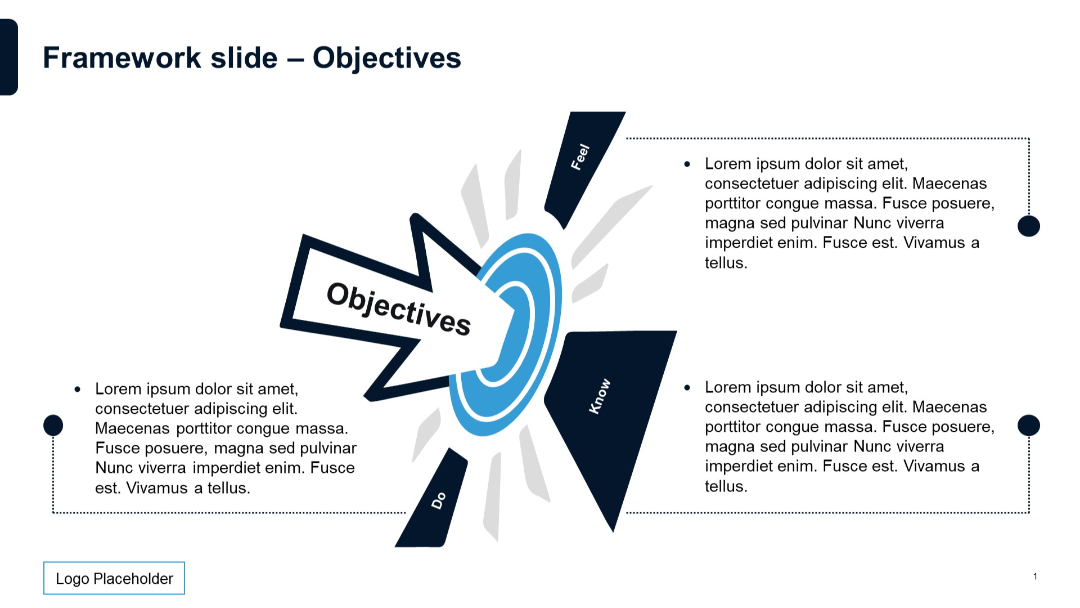
Central target icon with arrow and “Objectives” text; surrounding labeled points with descriptions.
PRO
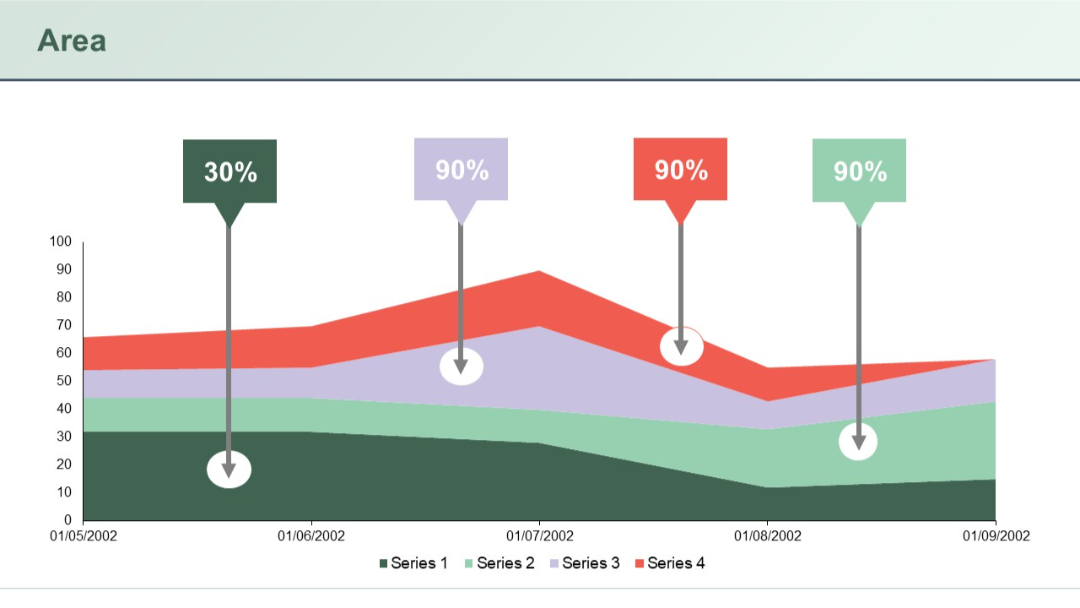
A colorful, multi-series stacked area chart with four data series, each highlighted with prominent percentage labels above.
PRO
3D multicolored layered pyramid on the left; each layer connects to editable text on the right with thin gray lines. Clean, balanced layout.

PRO
Three-column layout titled “Subtitle” each, all blue headers with text underneath. Highly symmetrical and evenly spaced.
PRO
Two-row, six-column table with bold purple headers and shaded first column. Dotted separators; minimalist look.
PRO
Horizontal blocks with arrow icons and left-aligned text; top title bar in dark blue.
PRO
Semi-circular arc with five labeled segments and a central circular heading. Each segment contains icons and text areas.

PRO
Four tall vertical boxes side by side, labeled Strength, Weakness, Opportunity, and Threats. Simple rectangular layout with header in each section.
PRO
Same layout as previous slide but on a white background with light blue wave design. Includes editable title and subtitle placeholders and logo placeholder.

PRO
Three interlocked horizontal puzzle pieces in navy, green, and red, each with a central text box labeled "Title" and placeholder text beneath.
PRO
Four-column table layout with three rows; first column uses large red vertical blocks for category headers; remaining cells are for editable text.
PRO
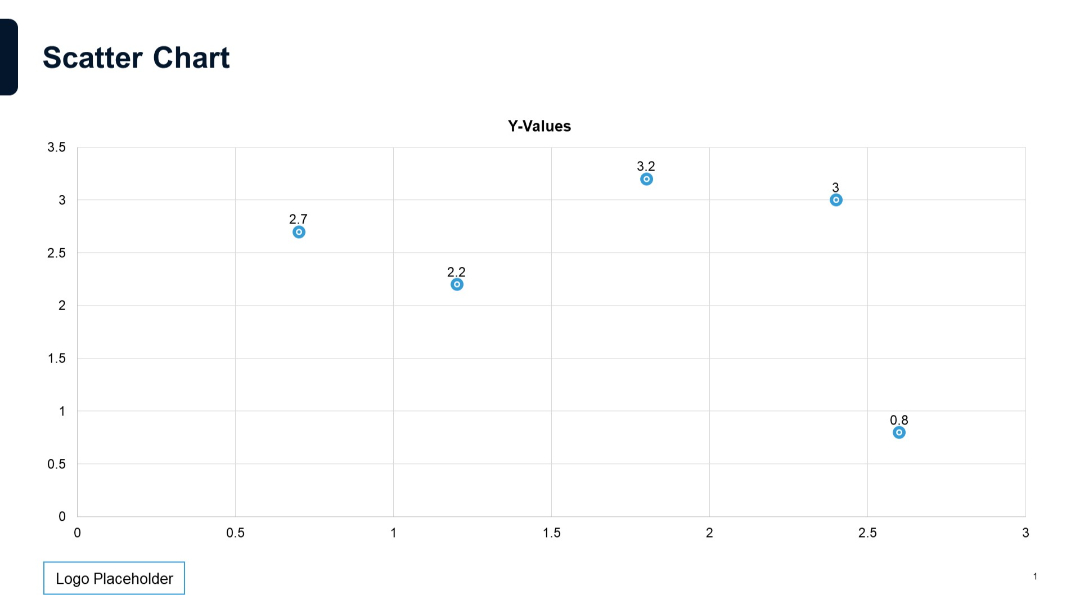
Basic scatter plot with labeled data points, x- and y-axes with gridlines, minimal background, and dot markers with numeric values.
PRO
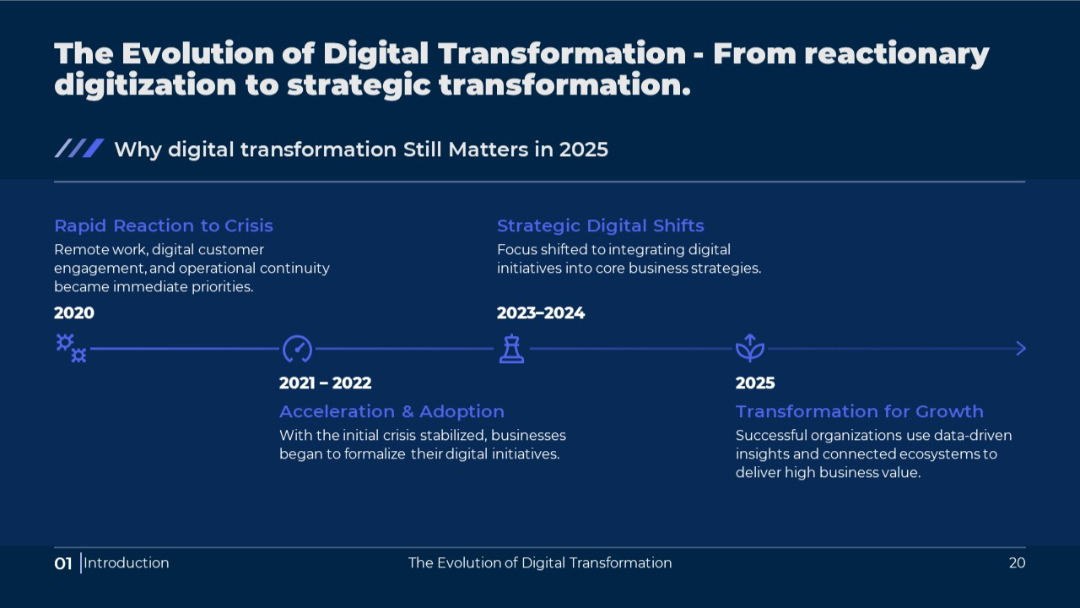
Simplified horizontal timeline with year ranges, key phrases, and supporting text; visually streamlined compared to Slide 19.
PRO
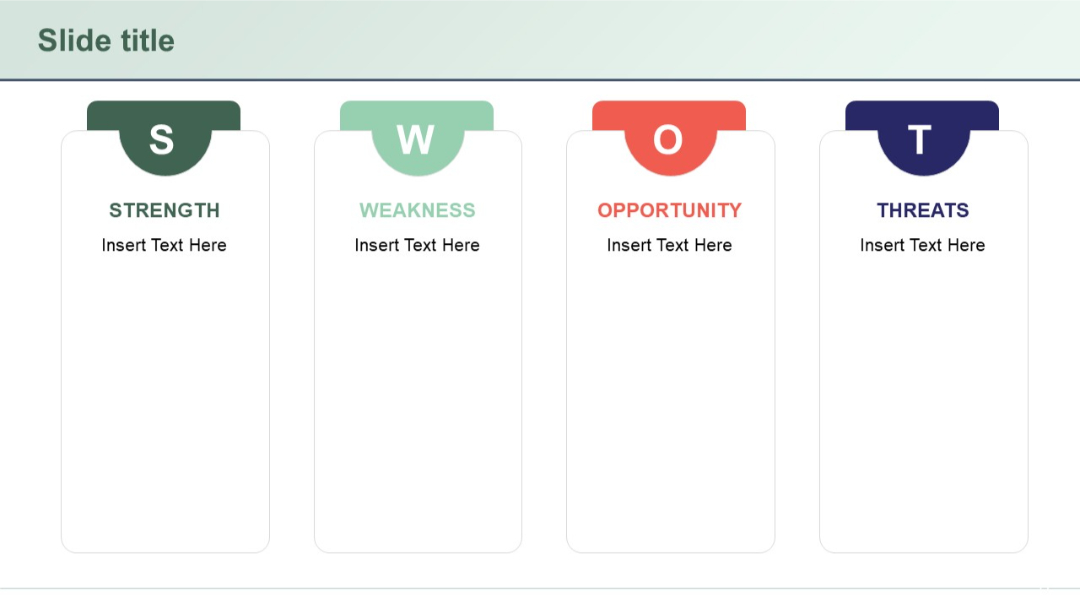
Modern layout with rounded-top cards and large letter icons (S, W, O, T) above each section. Clean and minimal.
PRO
Section divider slide with a large “02” and the subtitle “Quantitative Slides” over a blue gradient banner.

PRO
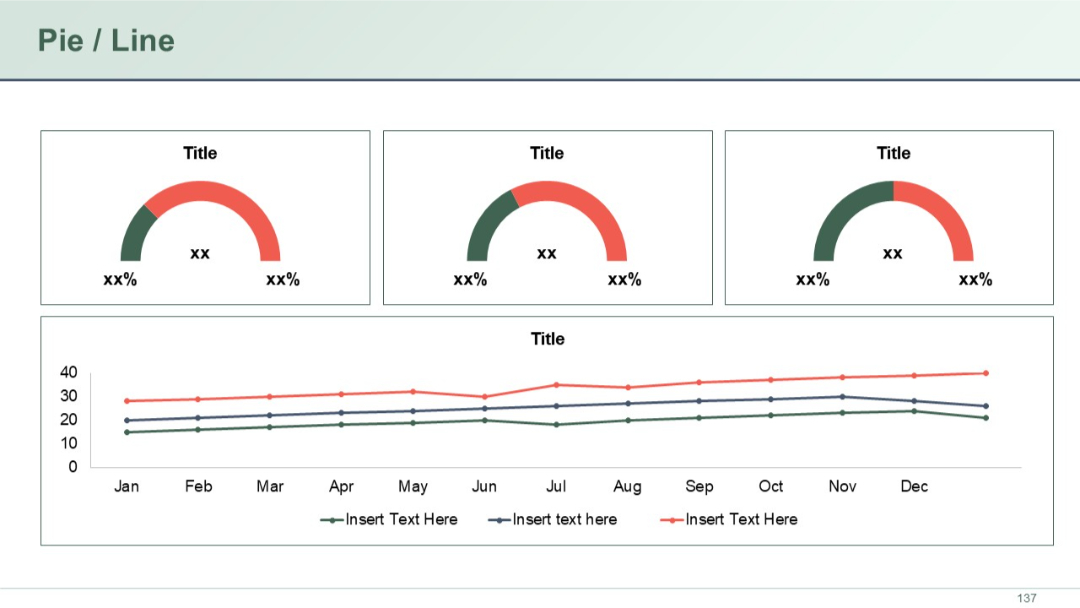
Three semi-circle gauge charts on top and one line chart on the bottom. Consistent use of red and green colors for emphasis.
PRO
Stacked column chart on the left, clustered column chart on the right. Both compare three series across four categories.

PRO
Two-column layout with rounded-top dark green headers connected by a curved line. White background and minimal placeholder text.

PRO
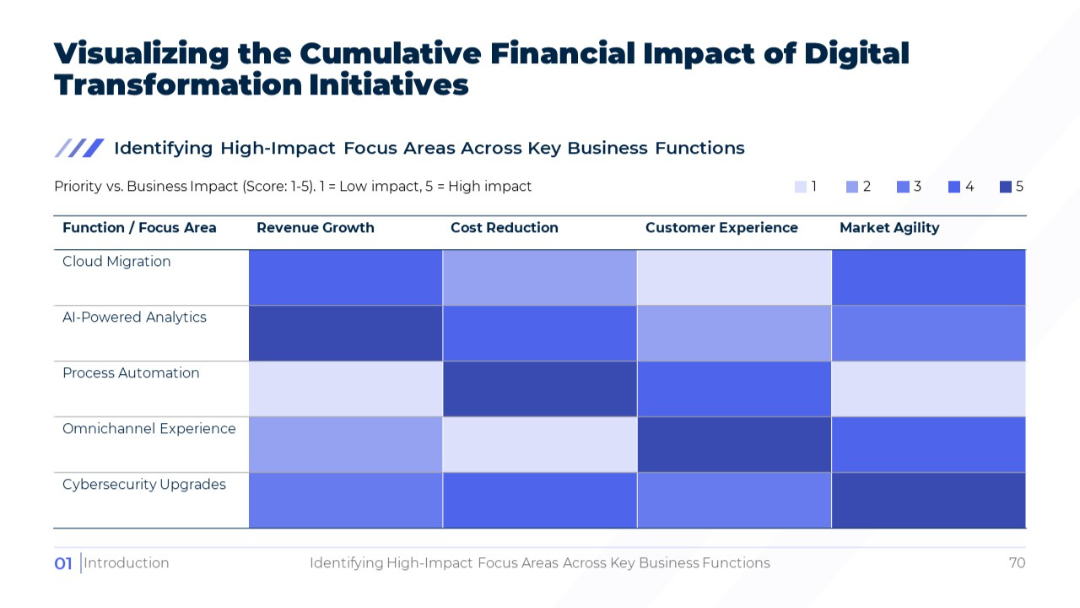
Heatmap matrix showing impact scores (1–5) across functions like cloud migration and AI-powered analytics. Blue gradient used to indicate impact intensity.
PRO
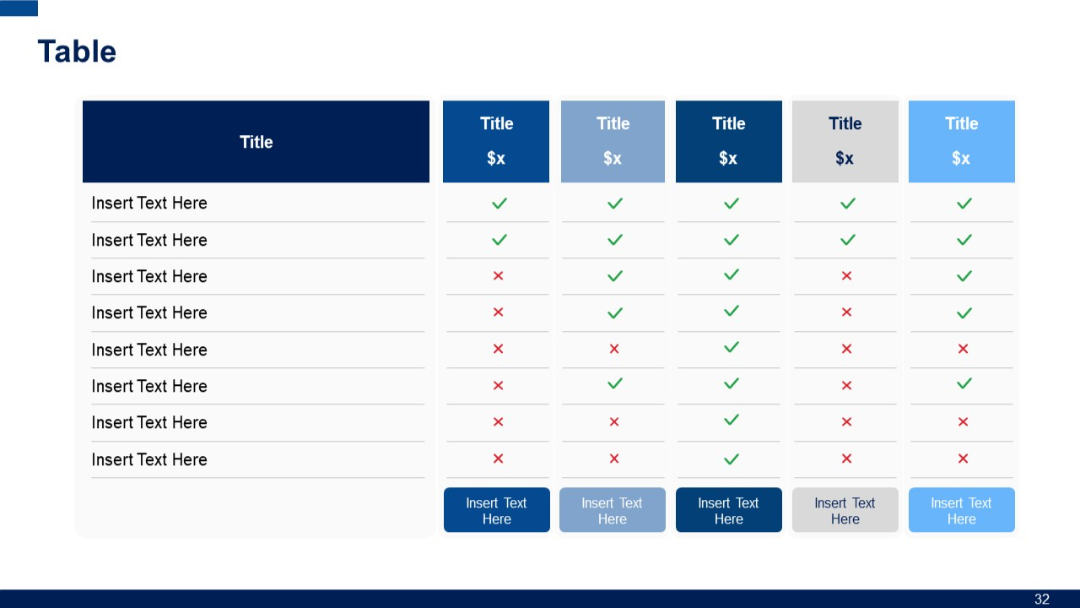
Extended horizontal table with six columns and eight rows; consistent use of checkmarks/crosses for feature comparison; each column uses different color tones.
PRO
Four quotes with avatar icons for speaker identity and bold open/close quote marks. Balanced and structured for multiple voices.
PRO
Seven-line radial infographic with alternating sides of the center circle, using icons and placeholder text.