My Account
My Slides
Search by Category
Pricing
Templates
View All Templates
Download Template Slides
✦ AI Search
Feedback
Login
Logout
Get Started
Browse all Slides
Browse all Slides
Create a FREE Account
Instant access to 1,000+ real slides from top companies like McKinsey, BCG, Goldman Sachs, Google and many more!
First Name
Last Name
Email
Password
I agree to all
Terms & Privacy Policy
Thank you! Your submission has been received!
Oops! Something went wrong while submitting the form.
Have an account?
Sign in
Saved Slides
Total No. of slides saved
0
↻ Refresh
✖ Clear all
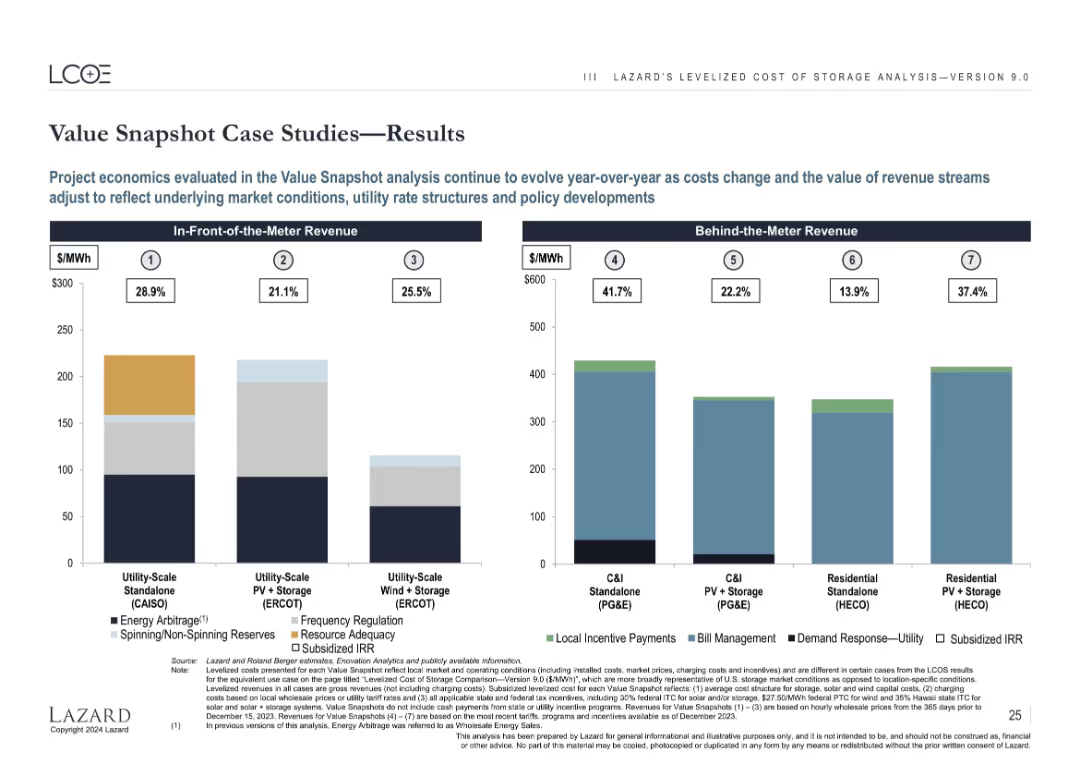
Split bar charts showing revenue breakdowns by use case, with value percentages and revenue sources.
Investment Analysis
Energy & Utilities
Visualizes revenue composition from each of the 7 case studies listed earlier. In-front-of-the-meter and behind-the-meter projects are separated, with revenue split across categories like energy arbitrage, subsidies, and demand response, including IRR estimates.
project economics, revenue, arbitrage, incentives, IRR, behind-the-meter, in-front
false
Investment Analysis
Energy & Utilities
Multiple Chart
Roland Berger
Add to my slides
Remove from favorites
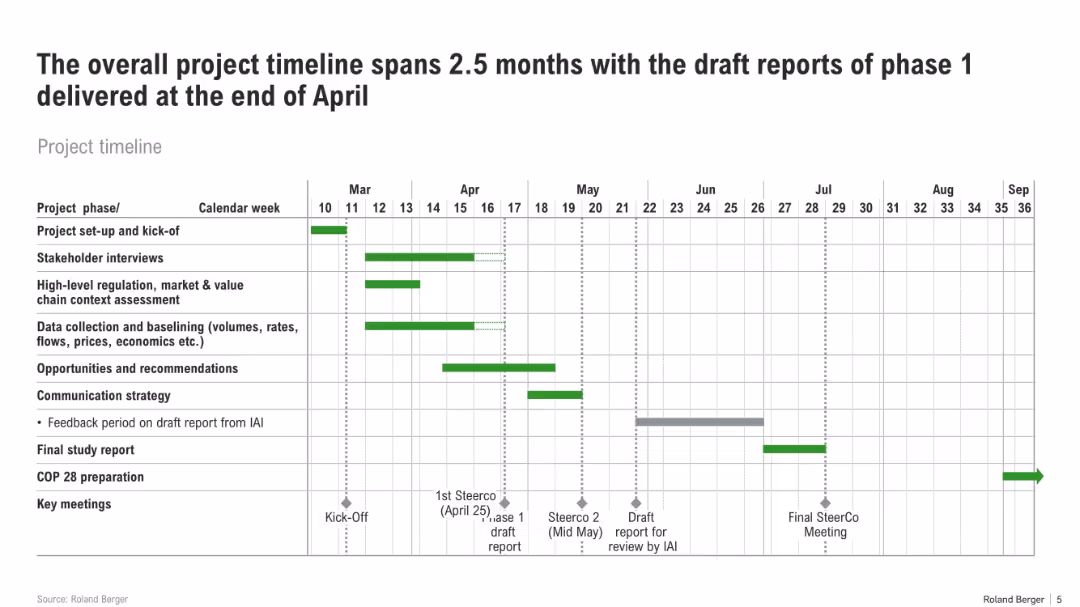
Gantt chart showing tasks across calendar weeks from March to July. Phases include setup, interviews, data collection, and reporting.
Strategic Planning
Professional Services
This slide provides a structured timeline for a project, detailing phases like stakeholder engagement, data analysis, and report drafting. It marks key milestones such as Steering Committee meetings and COP28 prep.
project plan, timeline, Gantt chart, stakeholder interviews, COP28, deliverables, report drafting
false
Strategic Planning
Professional Services
Single Chart
Roland Berger
Add to my slides
Remove from favorites
The slide contains text boxes and diagrams outlining the inputs (e.g., literature review, surveys) and outputs (e.g., target outcomes, recommendations) for a project on fashion returns.
Strategic Planning
Retail & E-commerce
Describes the scope of a project aimed at addressing fashion returns, detailing the methodology, inputs from stakeholders, and expected outcomes and recommendations.
Project scope, Inputs, Outputs, Recommendations, Fashion returns
false
Strategic Planning
Retail & E-commerce
Diagram
Roland Berger
Add to my slides
Remove from favorites
The slide uses a column chart to display a timeline spanning three months. It includes tasks with bars in different shades of blue, indicating core focus and secondary focus. There are months labeled along the top and tasks listed along the left side.
Strategic Planning
Professional Services
The slide details a project timeline with a three-month duration, outlining tasks such as reviewing materials, collecting data, developing a tool, evaluating design decisions, and finalizing scalars.
project timeline, core focus, secondary focus, design decisions, scalars
false
Strategic Planning
Professional Services
Table
Oliver Wyman
Add to my slides
Remove from favorites
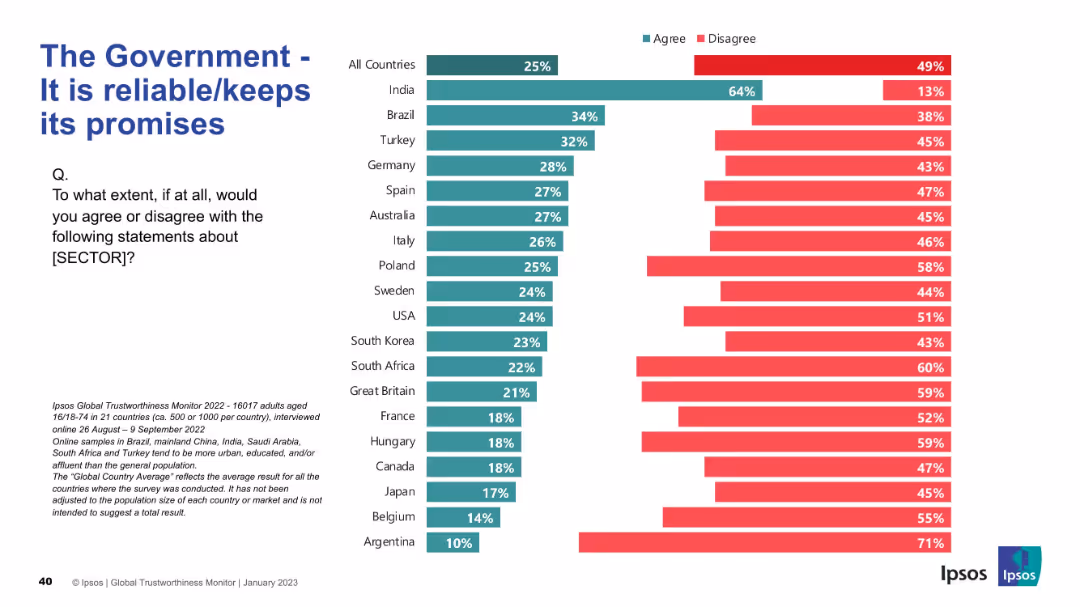
Country-wise bar chart showing perceptions of government reliability
Risk Assessment and Management
Government & Public Sector
The slide assesses public confidence in governments keeping promises. India stands out in agreement; most countries show high levels of skepticism.
promises, reliability, trust, governance, survey, Ipsos, international, skepticism, expectations
false
Risk Assessment and Management
Government & Public Sector
Mixed Chart
IPSOS
Add to my slides
Remove from favorites
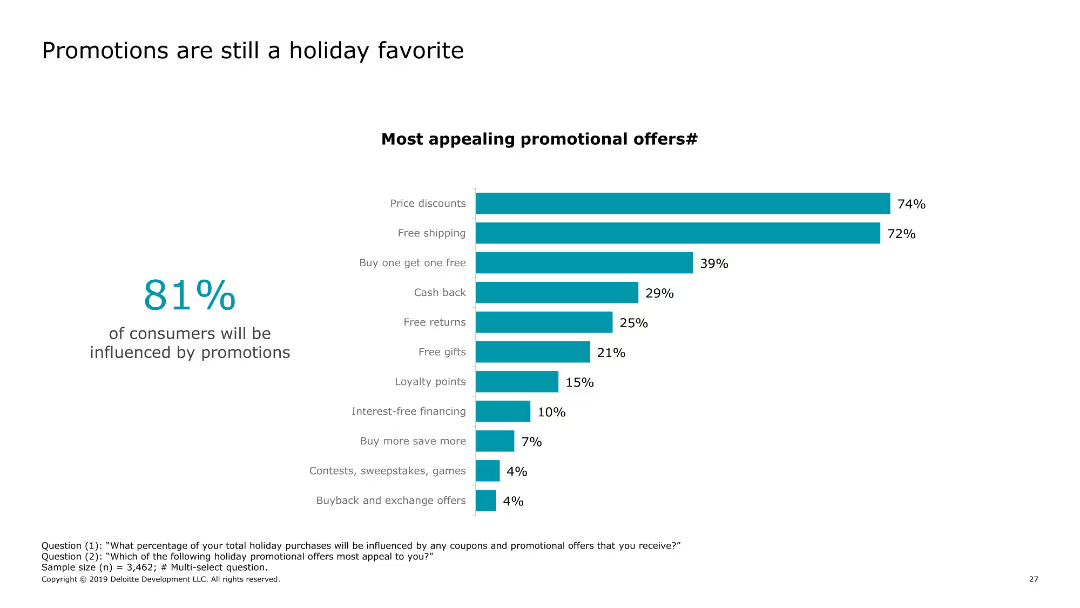
The slide features a column chart listing various promotional offers and their appeal to consumers, such as price discounts, free shipping, buy one get one free, cash back, and loyalty points.
Market Analysis and Trends
Retail & E-commerce
The slide indicates that promotions significantly influence consumer holiday shopping behaviors, with a high percentage of shoppers being swayed by various promotional offers.
promotional offers, holiday shopping, consumer behavior, discounts, loyalty programs
false
Market Analysis and Trends
Retail & E-commerce
Mixed Chart
Deloitte
Add to my slides
Remove from favorites
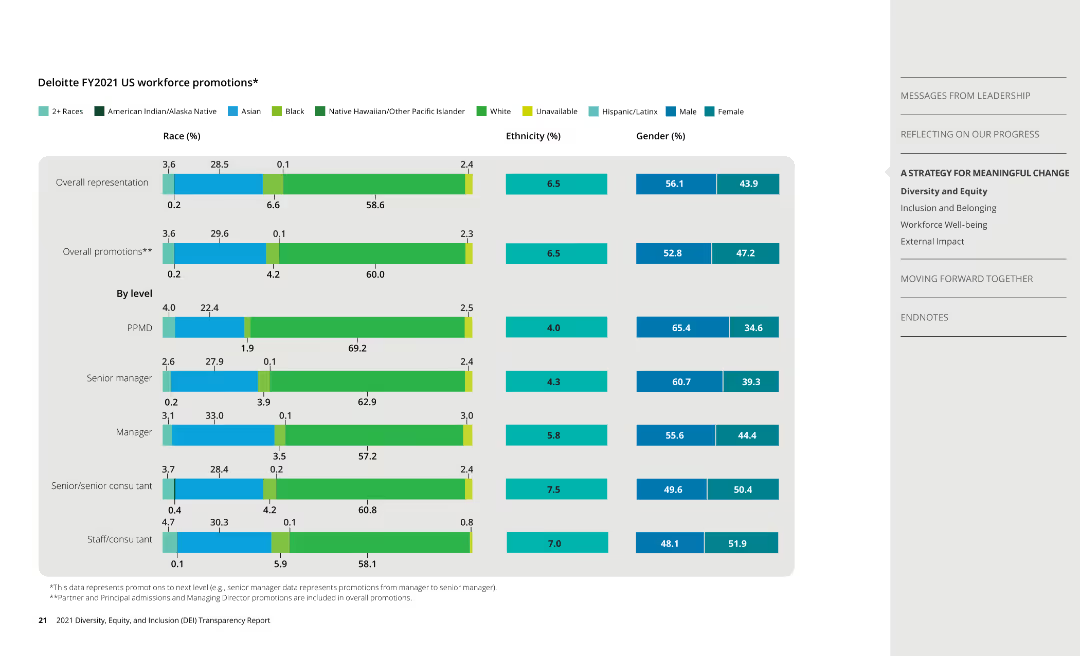
Column charts display promotion data by race, ethnicity, and gender, along with overall representation data.
Human Resources and Talent Management
Professional Services
Presents promotion statistics at Deloitte, analyzing diversity in career advancement opportunities.
promotions, diversity, race, ethnicity, gender
false
Human Resources and Talent Management
Professional Services
Single Chart
Deloitte
Add to my slides
Remove from favorites
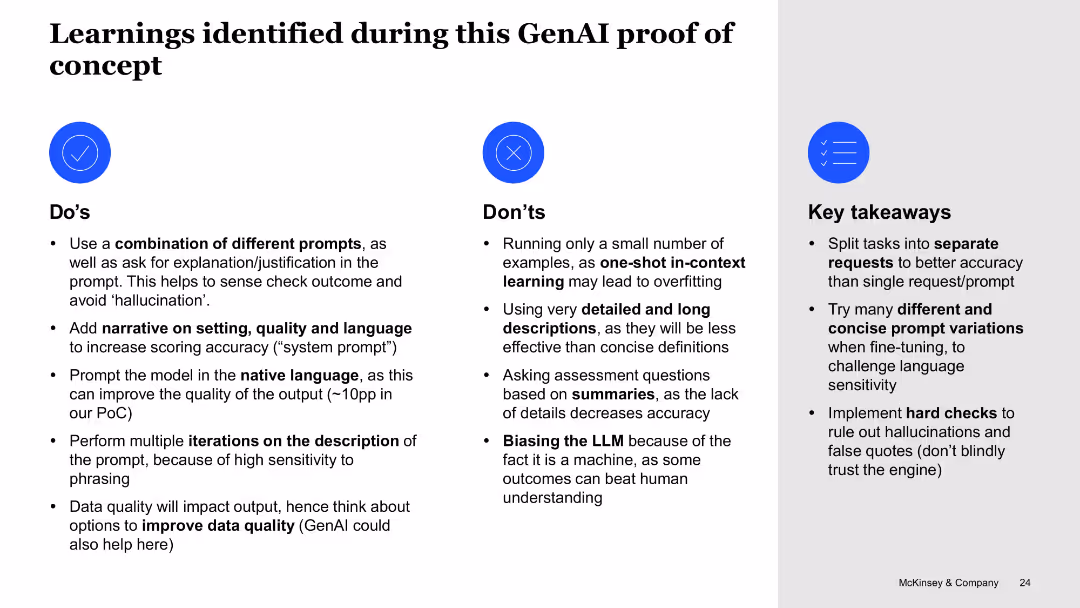
Three-column white slide divided into Do’s, Don’ts, and Key takeaways with checkmark and list icons
Strategic Planning
Artificial Intelligence
Summarizes lessons learned from a GenAI proof of concept. Highlights effective prompting strategies, common mistakes, and suggestions like improving data quality and using varied, concise prompts to reduce hallucinations and boost accuracy.
prompting, best practices, lessons learned, GenAI, accuracy, data quality, hallucination
false
Strategic Planning
Artificial Intelligence
Pillar
McKinsey
Add to my slides
Remove from favorites
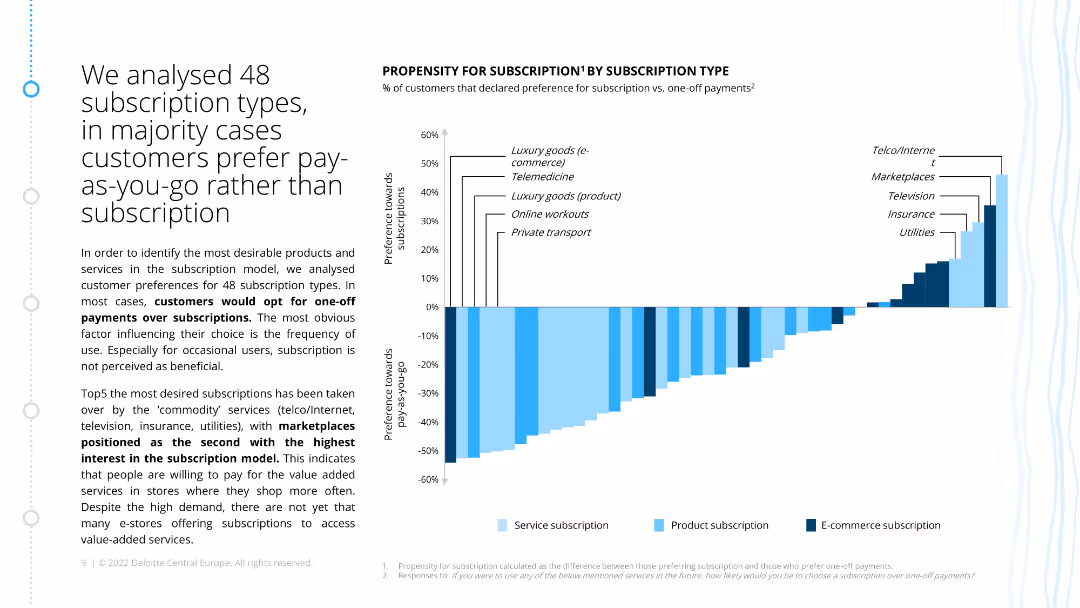
The slide has a bar chart displaying the propensity for subscription versus one-off payments for different product and service types, with bars indicating preferences across categories.
Market Analysis and Trends
Consumer Goods
The slide analyzes customer preferences for subscriptions over one-off payments, showing that luxury goods and telemedicine have the highest propensity for subscriptions.
propensity, subscription, one-off payments, customer preferences, survey
false
Market Analysis and Trends
Consumer Goods
Mixed Chart
Deloitte
Add to my slides
Remove from favorites
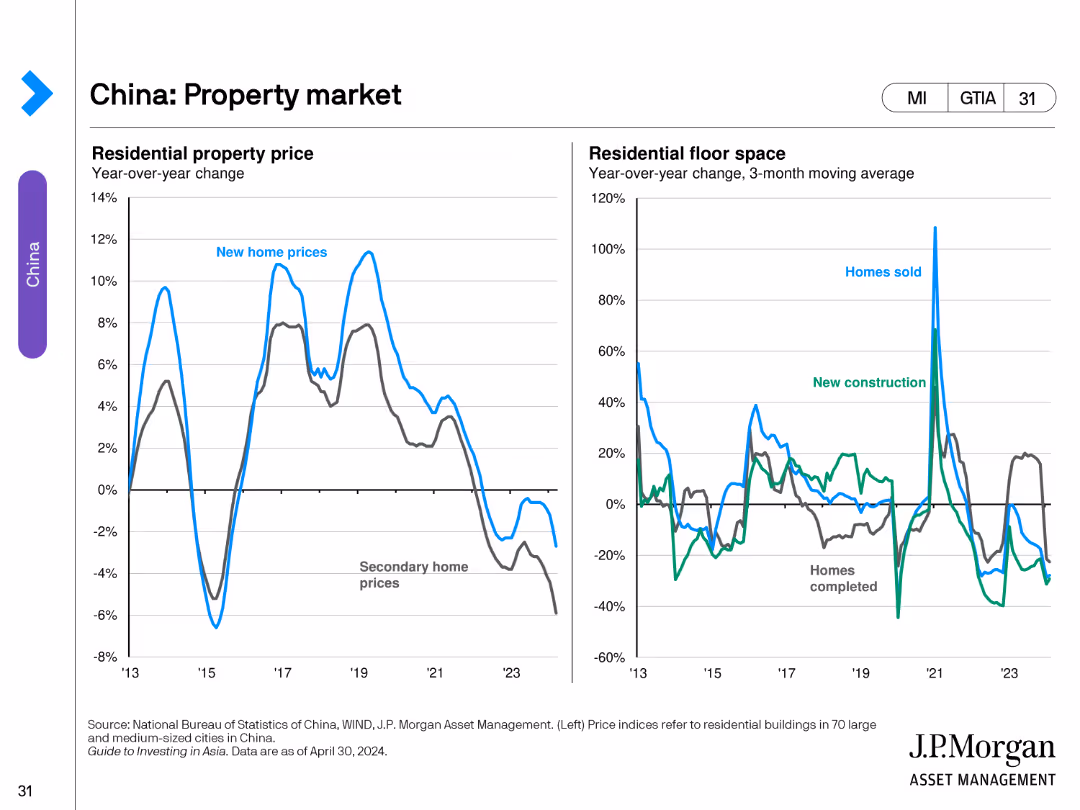
The slide includes two line charts. The left chart shows year-over-year changes in residential property prices. The right chart illustrates year-over-year changes in residential floor space for homes sold and new constructions.
Market Analysis and Trends
Real Estate & Construction
This slide evaluates the property market in China, analyzing trends in residential property prices and residential floor space changes.
Property, Market, China, Prices, Construction
false
Market Analysis and Trends
Real Estate & Construction
Multiple Chart
JP Morgan
Add to my slides
Remove from favorites
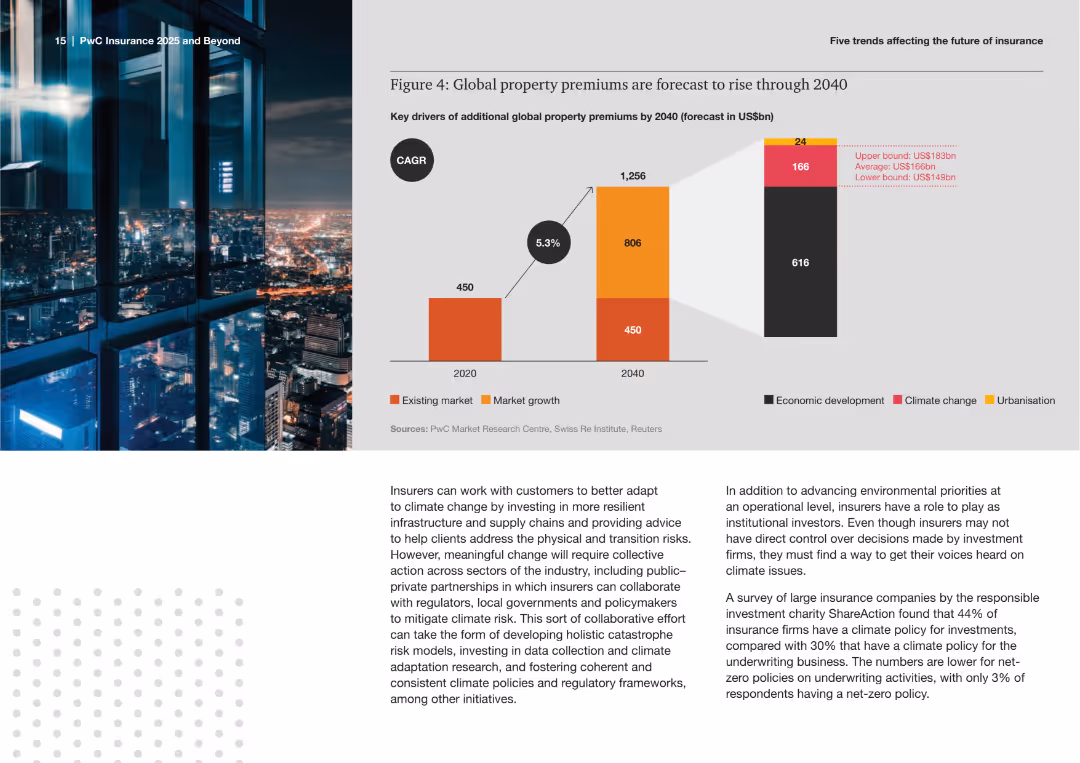
The slide features a bar chart forecasting additional global property premiums by 2040, broken down by economic development, climate change, and urbanization. It shows projections in existing and growth markets.
Market Analysis and Trends
Financial Services
This slide presents forecasts for the rise in global property premiums through 2040, attributing increases to factors like economic development, climate change, and urbanization. It offers insights into future market growth and risks.
Property Premiums, Forecast, Insurance, Market Growth, Climate Change, Urbanization, Economic Development, Bar Chart, Trends, Projections
false
Market Analysis and Trends
Financial Services
Mixed Chart
PwC/Strategy&
Add to my slides
Remove from favorites
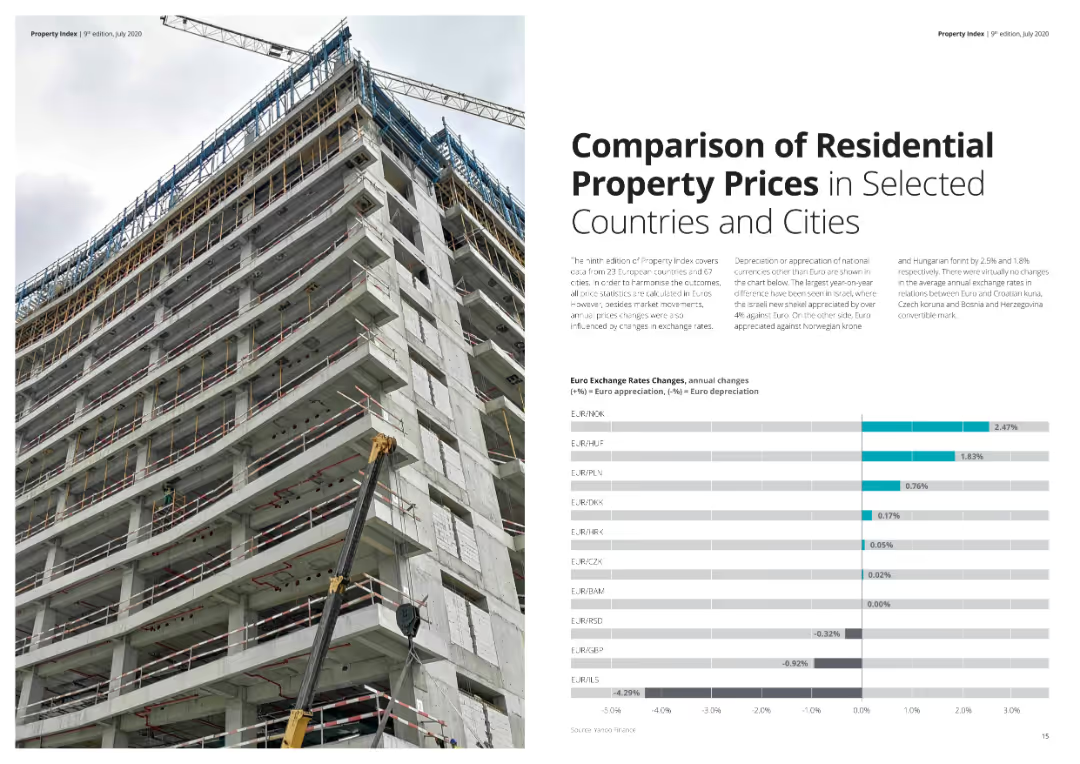
The slide features a bar chart comparing property prices in selected European countries and cities, along with text detailing exchange rate changes. The visual presentation is clear with distinct color usage for data points. Visual complexity is moderate.
Market Analysis and Trends
Real Estate & Construction
Compares residential property prices across European countries and cities, highlighting changes in exchange rates and their impact on property prices. Useful for investors and analysts monitoring the real estate market.
Property prices, residential, Europe, comparison, exchange rates
false
Market Analysis and Trends
Real Estate & Construction
Mixed Chart
Deloitte
Add to my slides
Remove from favorites
The slide features a line chart comparing the likelihood of listing investment properties for sale from Fall 2018 to Fall 2020.
Market Analysis and Trends
Real Estate & Construction
This slide presents data on the likelihood of investment property owners listing their properties for sale, comparing trends over three years.
property sale, market trends, investment, likelihood, line chart, historical data, real estate
false
Market Analysis and Trends
Real Estate & Construction
Single Chart
IPSOS
Add to my slides
Remove from favorites
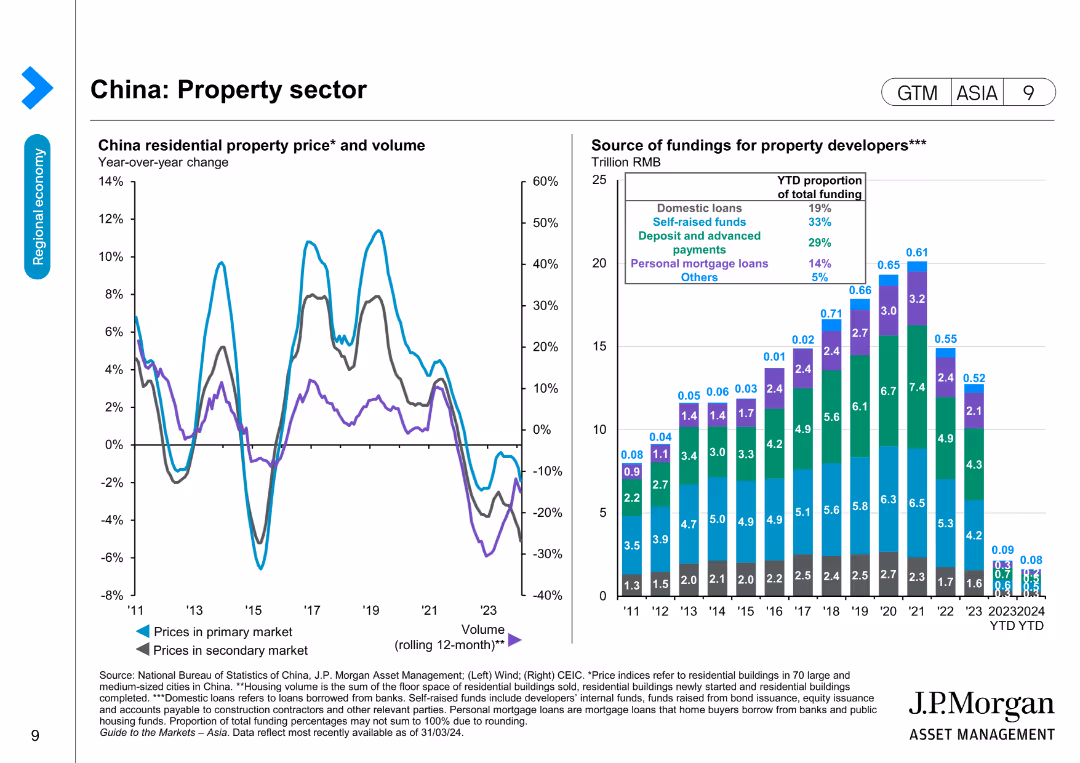
Features two line charts and a bar chart showing China residential property prices and volume, and the source of funding for property developers over time.
Market Analysis and Trends
Real Estate & Construction
Examines the property sector in China by tracking residential property prices and funding sources, useful for market and investment analysis in real estate.
Property sector, China, Real estate, Funding, Residential prices, Market trends, Investment, Economic data
false
Market Analysis and Trends
Real Estate & Construction
Multiple Chart
JP Morgan
Add to my slides
Remove from favorites
The slide features three sections titled Respondent Access, Survey, and Analysis & Reporting, each with icons and brief descriptions. It uses a three-column layout with hexagonal shapes and company logos.
Technology and Digital Transformation
Technology & Software
The slide details the capabilities and benefits of an end-to-end proprietary platform, highlighting respondent access, survey capabilities, and analysis & reporting functionalities.
Proprietary, platform, survey, analysis, reporting, capabilities, respondent, access, AI, efficiency
false
Technology and Digital Transformation
Technology & Software
Linear Flow
IPSOS
Add to my slides
Remove from favorites
Contains column chart comparing revenue mix and production type mix in 2020 and projected for 2025, showing shifts towards more diversified propulsion types. Color coding aids in distinguishing between BEV, HEV, and ICE types.
Strategic Planning
Industrial & Manufacturing
Analyzes how TI Fluid Systems plans to balance its revenue according to different propulsion types, forecasting a strategic shift towards a more balanced mix by 2025. This aligns with broader industry trends towards diversification.
propulsion types, revenue mix, 2020, 2025, bar graphs
false
Strategic Planning
Industrial & Manufacturing
Mixed Chart
Deutsche Bank
Add to my slides
Remove from favorites
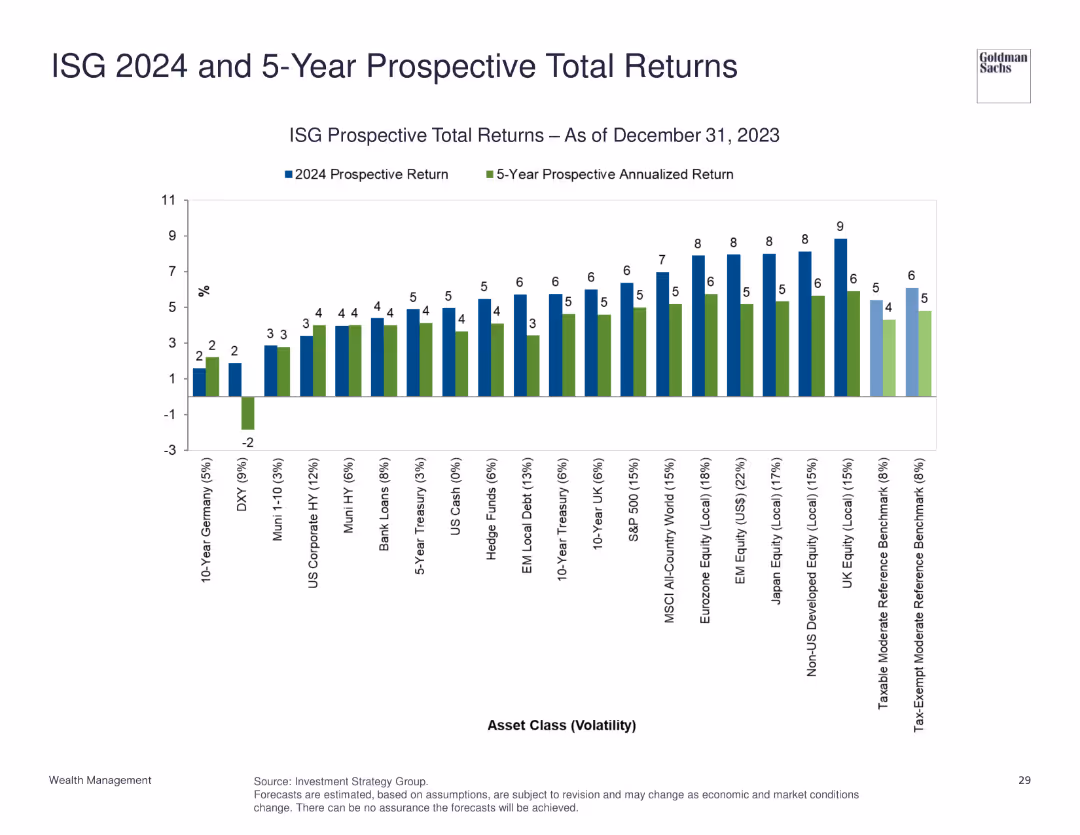
The slide shows a bar chart comparing prospective total returns and 5-year prospective annualized returns for various asset classes as of December 31, 2023.
Investment Analysis
Financial Services
This slide provides prospective total returns and annualized returns for different asset classes, assisting in investment decision-making.
prospective returns, asset classes, annualized returns, investment, financial projection
false
Investment Analysis
Financial Services
Single Chart
Goldman Sachs
Add to my slides
Remove from favorites
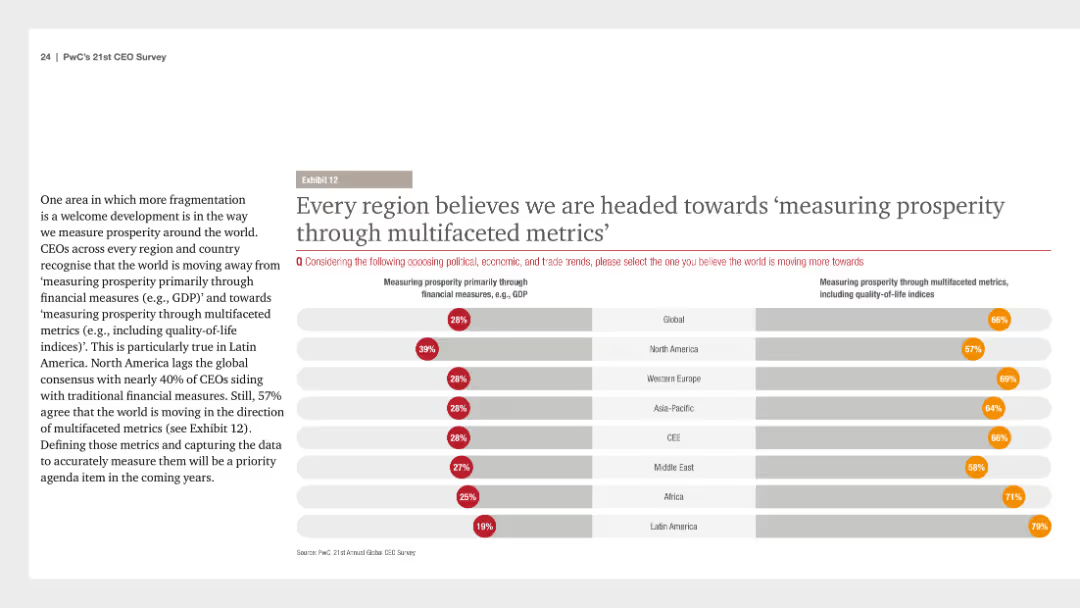
A column chart depicting regional perspectives on measuring prosperity through multifaceted metrics versus financial measures. Text provides context about global CEO opinions.
Market Analysis and Trends
Financial Services
CEOs across regions believe that measuring prosperity is moving towards multifaceted metrics including quality-of-life indices. The chart shows the percentage split between traditional financial measures and multifaceted metrics.
prosperity, metrics, CEOs, financial, regional
false
Market Analysis and Trends
Financial Services
Multiple Chart
PwC/Strategy&
Add to my slides
Remove from favorites
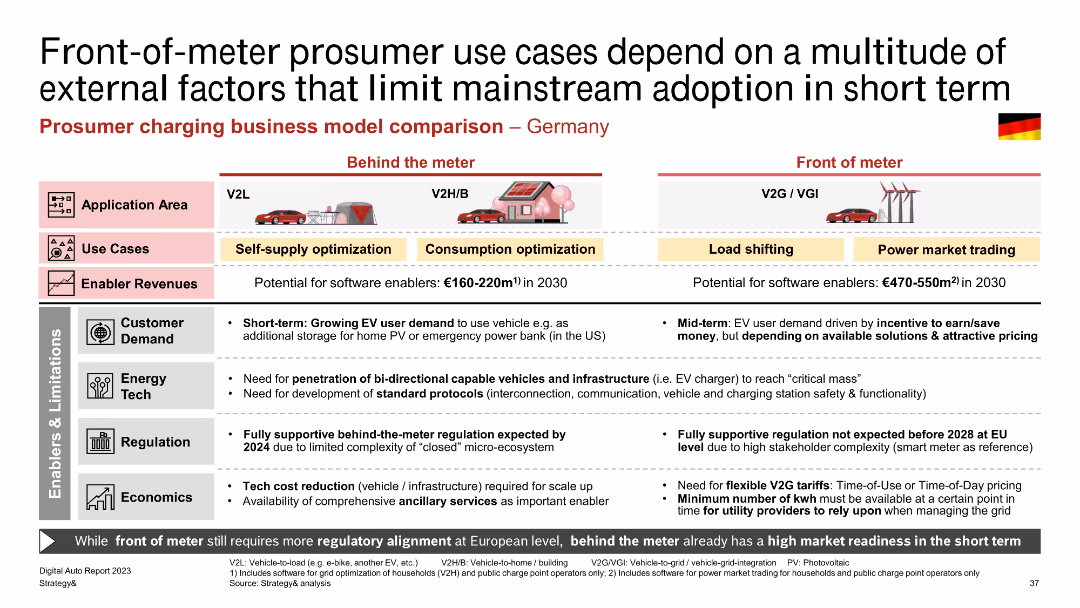
The slide compares different prosumer charging business models (V2L, V2H/B, V2G/VGI) using tables and icons. It includes detailed text on enablers and limitations across customer demand, energy tech, regulation, and economics.
Regulatory and Compliance
Energy & Utilities
The slide provides a detailed comparison of prosumer charging business models, focusing on the different use cases behind and in front of the meter. It discusses potential revenues, customer demand, technology needs, regulatory support, and economic factors influencing adoption.
Prosumer, Charging, V2L, V2H/B, V2G/VGI, Business Models, Revenue, Customer Demand, Regulation, Economics
false
Regulatory and Compliance
Energy & Utilities
Table
PwC/Strategy&
Add to my slides
Remove from favorites
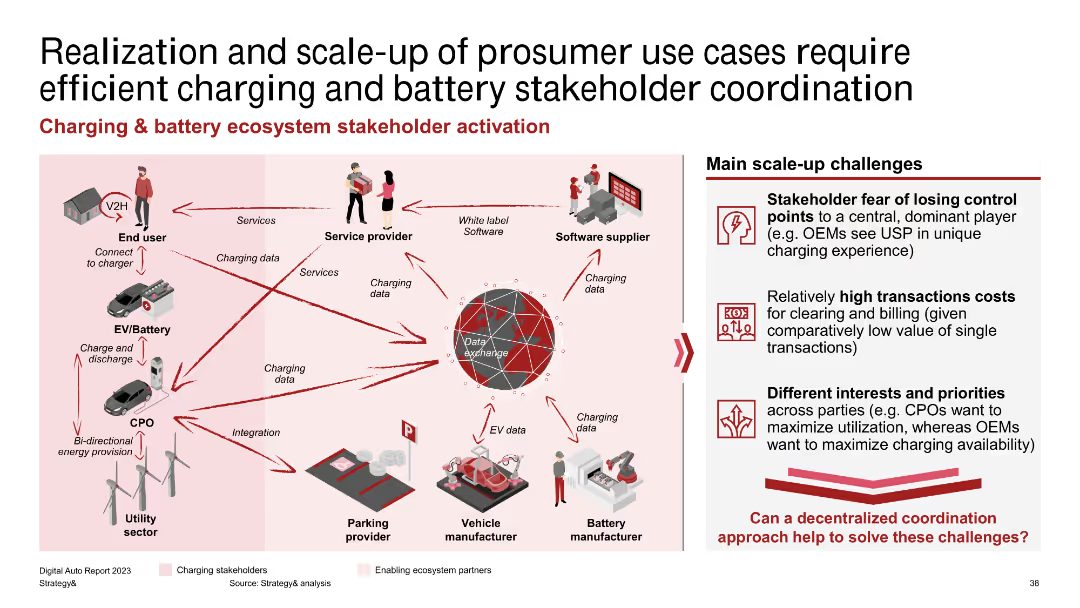
The slide features a stakeholder map with icons and arrows depicting interactions between end users, service providers, software suppliers, CPOs, and utility sectors. The right side lists main scale-up challenges.
Strategic Planning
Energy & Utilities
The slide outlines the ecosystem required for scaling up prosumer use cases, emphasizing the coordination among various stakeholders like end users, service providers, and utility sectors. It highlights challenges such as high transaction costs and differing stakeholder priorities.
Prosumer, Stakeholders, Coordination, Charging, Battery, Scale-up, Challenges, Ecosystem, End Users, Service Providers
false
Strategic Planning
Energy & Utilities
Diagram
PwC/Strategy&
Add to my slides
Remove from favorites
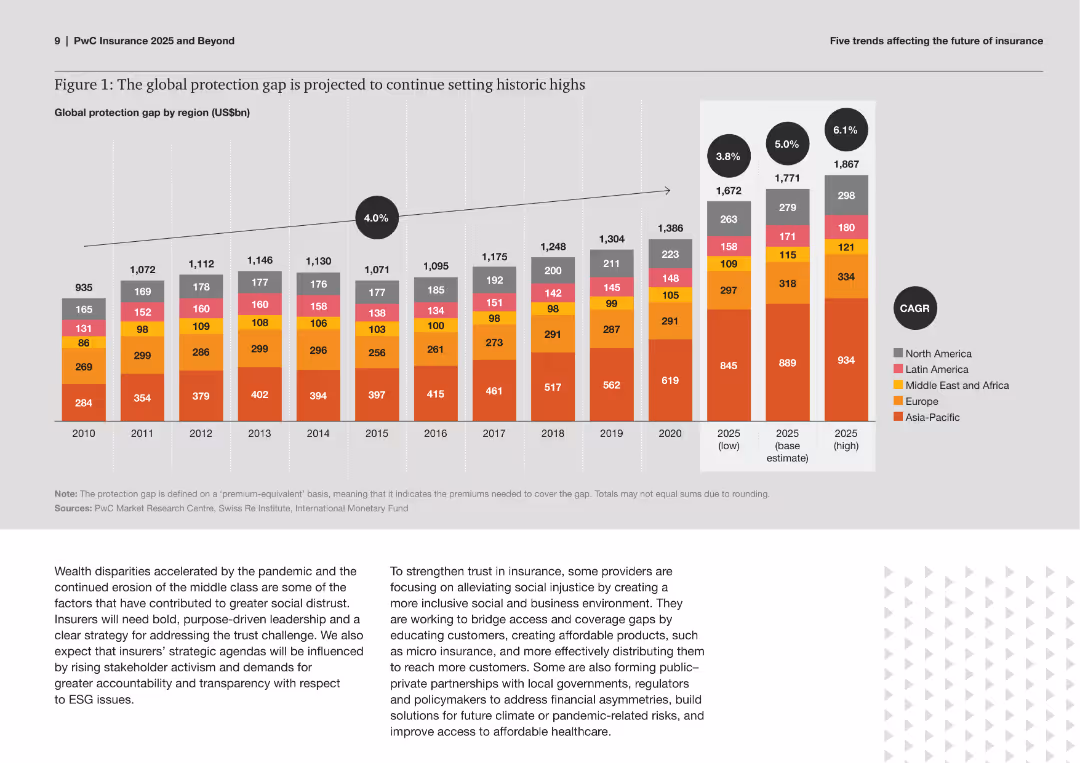
The slide features a stacked column chart showing the global protection gap by region (North America, Latin America, Middle East and Africa, Europe, Asia-Pacific) from 2010 to 2020, with projections to 2025.
Risk Assessment and Management
Financial Services
This slide analyzes the increasing global protection gap, detailing the premiums needed to cover the gap across various regions. It includes historical data and future projections, stressing the need for strategic actions in the insurance sector.
Protection Gap, Insurance, Risk Management, Global, Regions, Historical Data, Projections, Stacked Column Chart, Trends, Analysis
false
Risk Assessment and Management
Financial Services
Mixed Chart
PwC/Strategy&
Add to my slides
Remove from favorites
The slide includes two main visual components: a pie chart showing the percentage of people increasing their protein intake, and a column chart comparing the volume percentage change in total edible products versus total protein. The design is clean, using blues and neutrals to highlight key data.
Market Analysis and Trends
Agriculture & Food Production
Analyzes consumer trends in protein consumption and its impact on market growth. The data suggests a growing consumer preference for protein-rich diets, which is driving retail sales in the protein segment. This insight could be pivotal for businesses looking to capitalize on health and wellness trends.
Protein, Market Growth, Trends, Health, Consumer Behavior
false
Market Analysis and Trends
Agriculture & Food Production
Multiple Chart
Barclays
Add to my slides
Remove from favorites
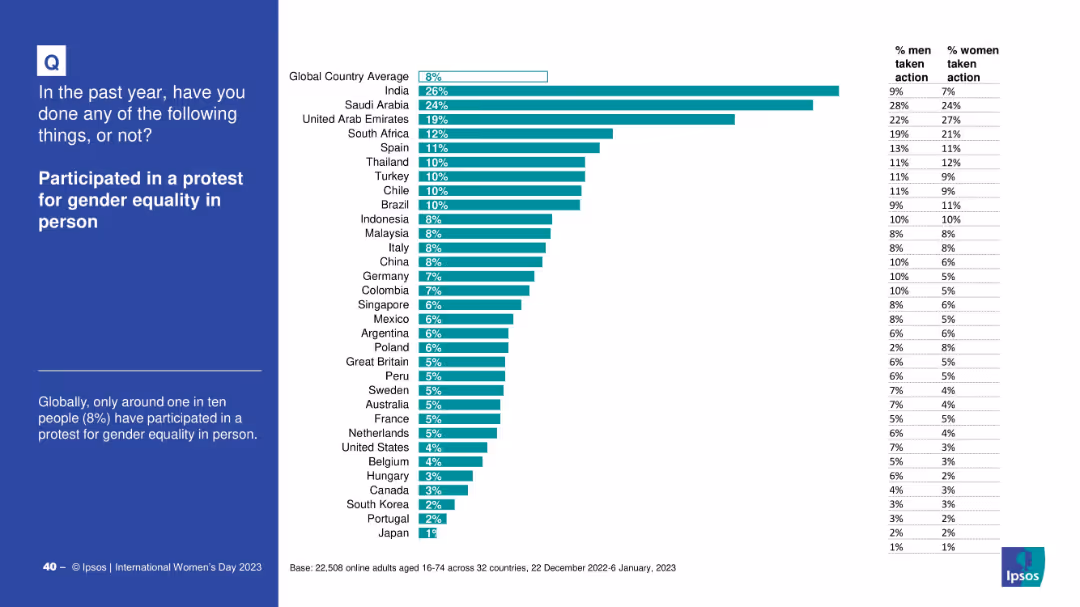
Uses the standard visual format with country bar chart and gender-specific stats
Strategic Planning
Government & Public Sector
This slide reports the percentage of people who attended a gender equality protest in the past year across different countries. It also displays the respective percentages for men and women participants.
protest, activism, gender rights, civic participation, equality, international, Ipsos
false
Strategic Planning
Government & Public Sector
Mixed Chart
IPSOS
Add to my slides
Remove from favorites
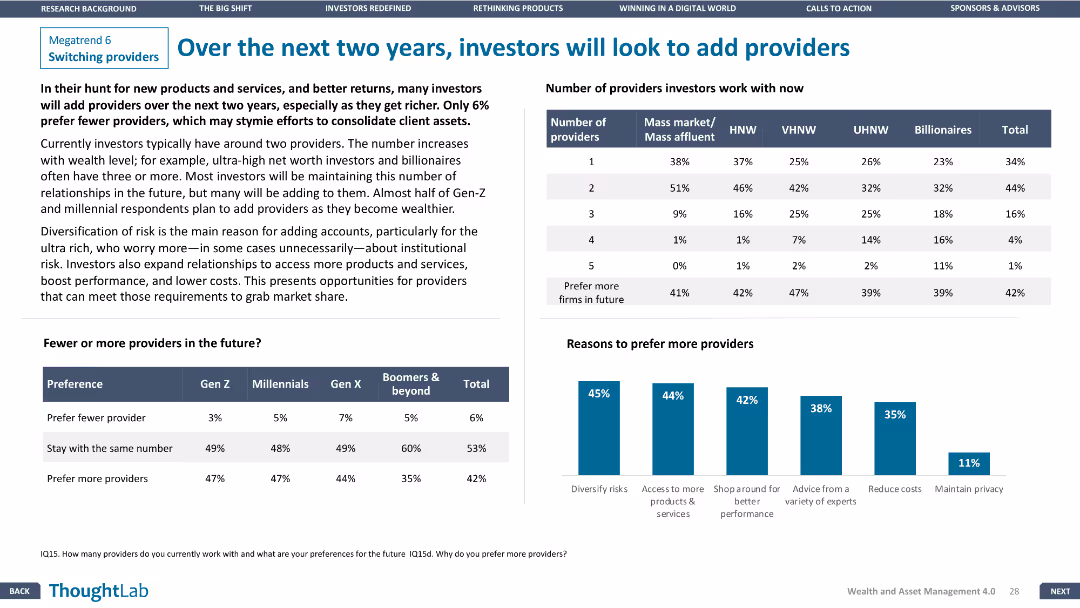
Column chart and bar graph showing investor preferences for number of providers and reasons for preferring more providers. Design is informative and clear.
Customer and Market Segmentation
Financial Services
Discusses future trends in investor preferences for the number of financial service providers and the main reasons for preferring more providers.
providers, investors, preferences, trends, reasons
false
Customer and Market Segmentation
Financial Services
Mixed Chart
Deloitte
Add to my slides
Remove from favorites
Circular infographic with percentage values around capabilities of AADA providers. Highlights include transformation, GenAI implementation, and sustainability.
Client Case Studies
Artificial Intelligence
Based on interviews, this slide shows enterprise perceptions of AADA providers' strengths—such as executing transformations, eliminating silos, scaling GenAI, and sustainability. High agreement levels indicate strong provider confidence.
provider strengths, AADA, GenAI, transformation, enterprise trust, sustainability, client sentiment
false
Client Case Studies
Artificial Intelligence
Mixed Chart
KPMG
Add to my slides
Remove from favorites
The slide features a column chart showing the percentage of people providing various types of help to others. Text boxes highlight key activities and their respective percentages.
Customer and Market Segmentation
Government & Public Sector
This slide highlights the types of help people are providing to others, showing the percentage of people engaging in various helping activities, based on survey data.
providing help, survey, types, activities, column chart, public opinion, percentage, healthcare, helping
false
Customer and Market Segmentation
Government & Public Sector
Mixed Chart
IPSOS
Add to my slides
Remove from favorites
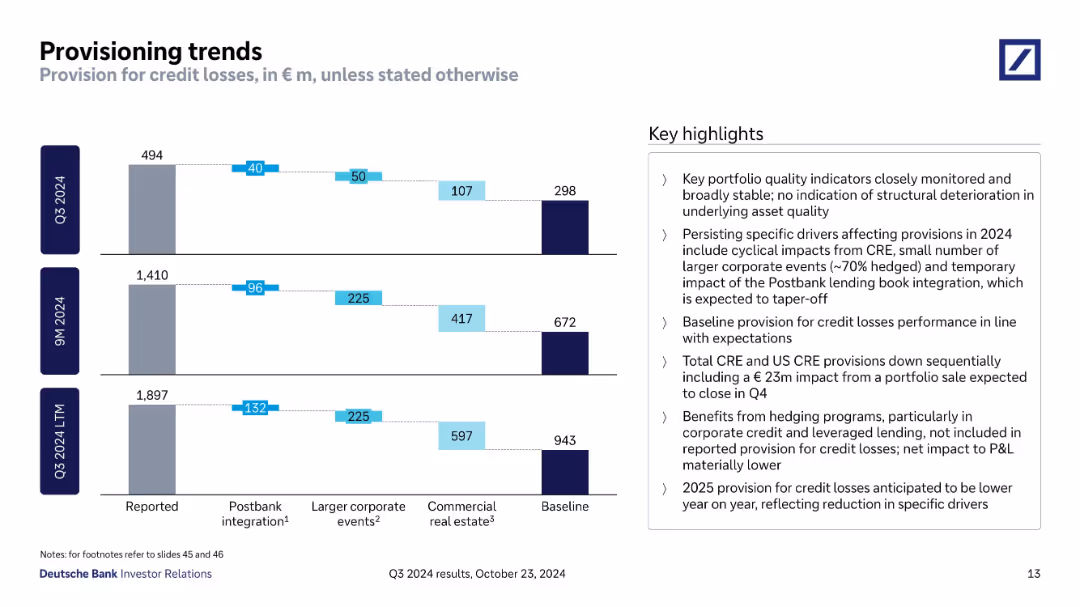
Three stacked bar charts (Q3, 9M, LTM); waterfall-style attribution of key drivers.
Risk Assessment and Management
Financial Services
Details drivers of credit loss provisions, including Postbank integration, corporate events, and commercial real estate. Trends show tapering impacts expected in 2025. Provides baseline forecasts and notes on hedging benefit exclusion from P&L.
provisioning, Postbank, CRE, credit risk, loss drivers, baseline
false
Risk Assessment and Management
Financial Services
Mixed Chart
Deutsche Bank
Add to my slides
Remove from favorites
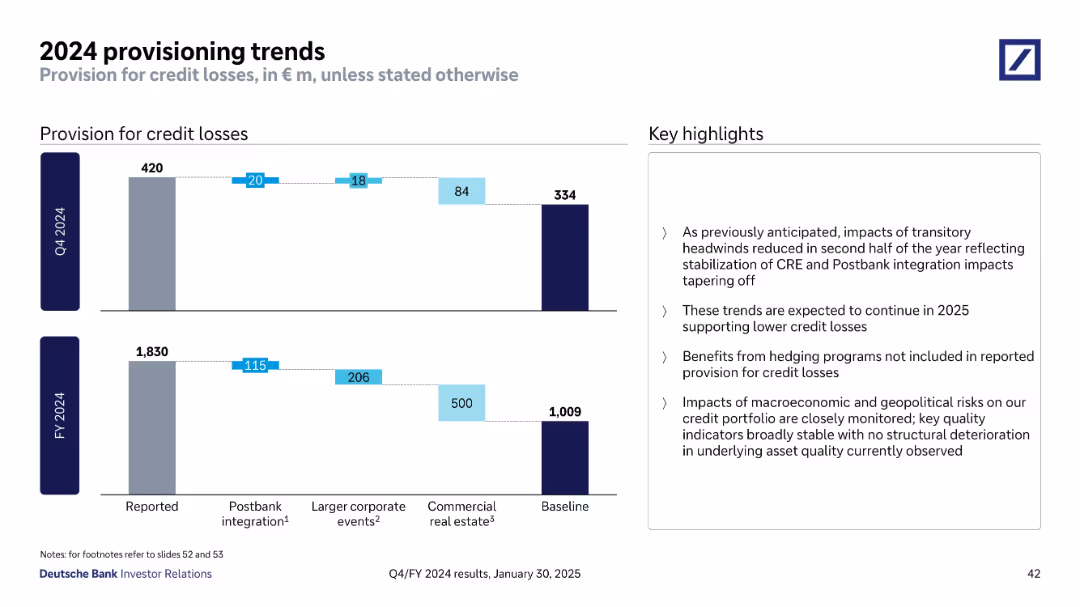
Waterfall charts for Q4 and FY 2024 provisioning breakdown; highlights on the right explain components and forecast
Risk Assessment and Management
Financial Services
Highlights drivers behind credit loss provisions, such as Postbank integration, commercial real estate, and large events. Provisions are expected to taper in 2025 as risks normalize. Key messages stress portfolio stability, stable indicators, and expected reduction in losses.
provisioning trends, FY2024, Postbank, CRE, hedging, credit losses
false
Risk Assessment and Management
Financial Services
Mixed Chart
Deutsche Bank
Add to my slides
Remove from favorites
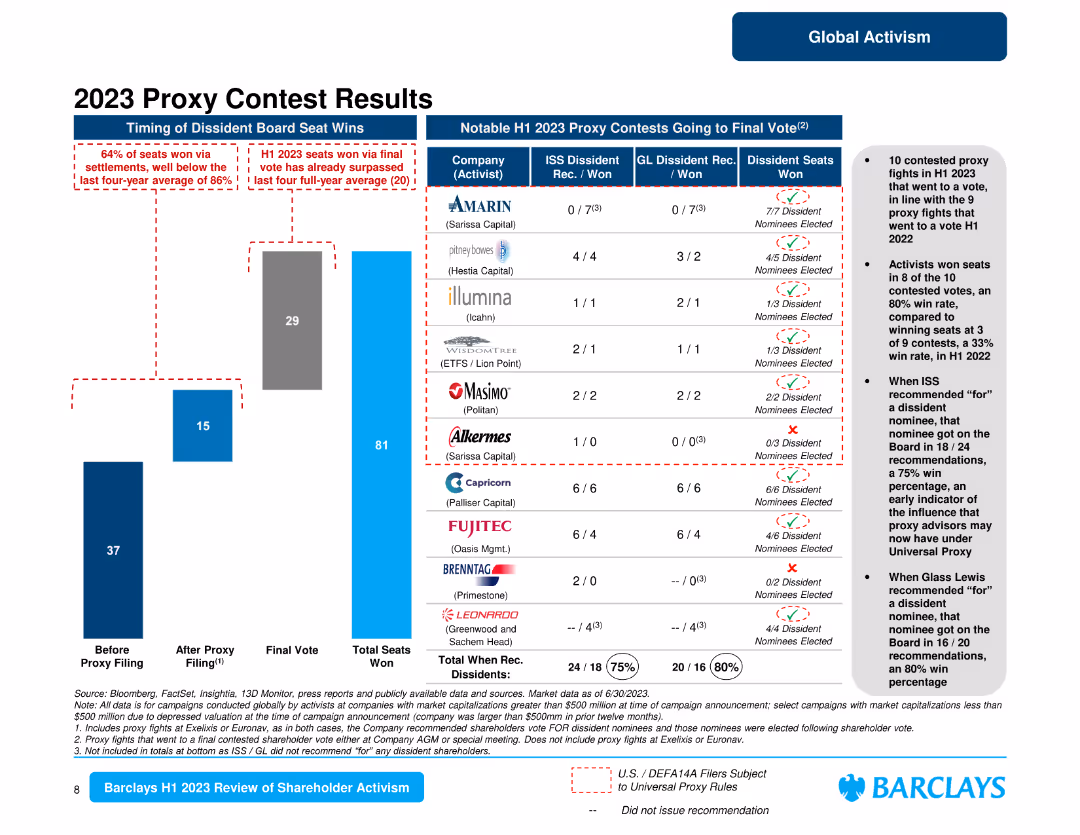
The slide presents a column chart comparing timing of dissident board seat wins with historical averages and a table summarizing proxy contests results with icons indicating success.
Market Analysis and Trends
Financial Services
It discusses the proxy contest results for 2023, highlighting the number of dissident board seat wins via settlements versus final votes and providing specific contest results.
proxy contests, dissident board, 2023 results, settlements, final votes, ISS recommendations, Glass Lewis recommendations, dissident seats won, shareholder activism
false
Market Analysis and Trends
Financial Services
Mixed Chart
Barclays
Add to my slides
Remove from favorites
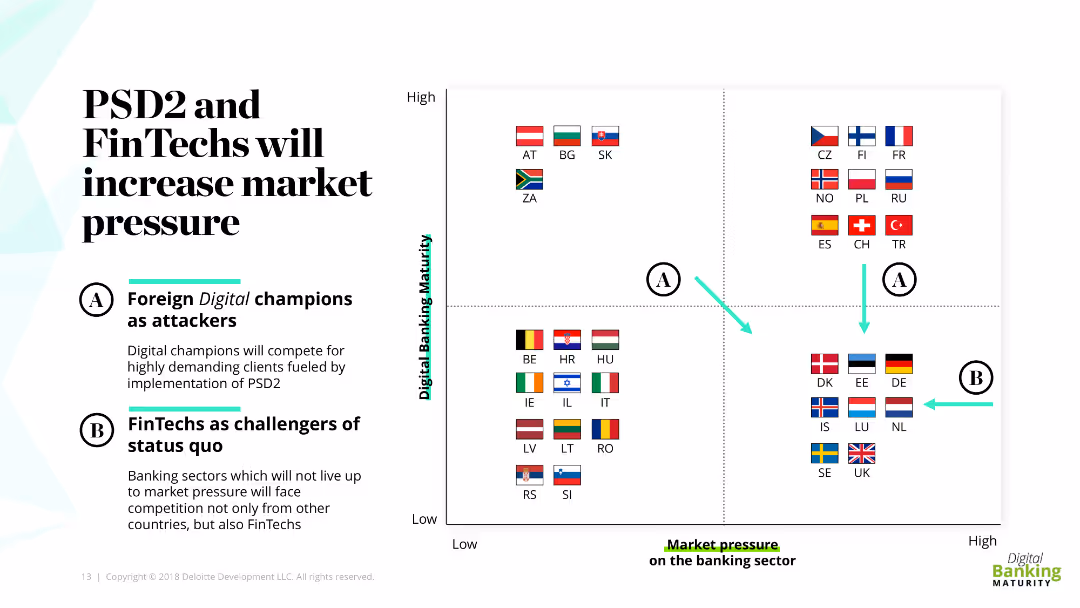
The slide features a quadrant chart with flags of various countries, representing different levels of digital banking maturity and market pressure. It also includes descriptive text boxes labeled A and B explaining the roles of digital champions and FinTechs as challengers.
Market Analysis and Trends
Financial Services
This slide discusses how PSD2 and FinTechs are increasing market pressure in banking, categorizing countries based on their digital banking maturity. It emphasizes the roles of foreign digital champions and FinTechs as challengers to the status quo.
PSD2, FinTechs, digital banking, market pressure, challengers
false
Market Analysis and Trends
Financial Services
Diagram
Deloitte
Add to my slides
Remove from favorites
The slide contains a single column chart showing pre-tax income over three periods (9M17, 9M18, 9M19) with accompanying metrics for C/I ratio and RoRC.
Financial Performance
Financial Services
This slide shows improvements in pre-tax income for the first nine months of 2019, compared to previous years, with additional metrics for cost/income ratio and RoRC.
PTI improvement, pre-tax income, C/I ratio, RoRC, financial performance
false
Financial Performance
Financial Services
Single Chart
Credit Suisse
Add to my slides
Remove from favorites
Four numbered sections with text boxes outlining benefits such as brand recognition, resilience, understanding society, and methodological rigor.
Strategic Planning
Professional Services
Explains the benefits of Ipsos' public affairs service line, focusing on brand recognition, resilience to market shocks, understanding of society, and high methodological standards.
Public Affairs, Benefits, Brand Recognition, Society, Resilience
false
Strategic Planning
Professional Services
Linear Flow
IPSOS
Add to my slides
Remove from favorites
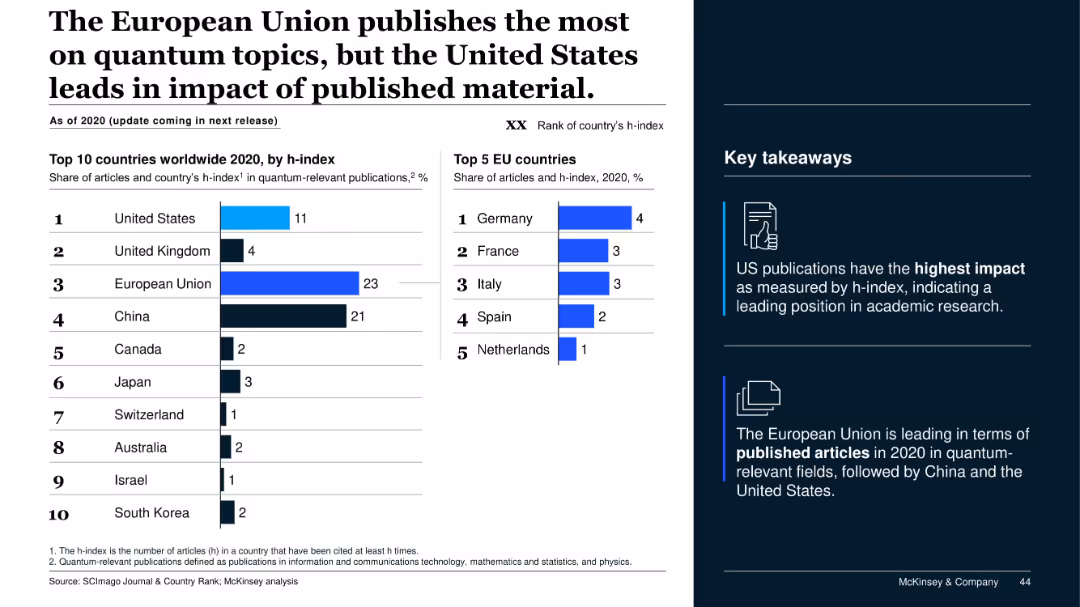
Dual bar graphs ranking countries by h-index and publication share, with special callout for EU countries; supporting key points at right.
Industry Overview
Education & Training
The slide compares publication quantity vs. quality in quantum topics, showing the EU leads in volume while the US leads in impact (h-index). China ranks third in volume. Germany and France top EU contributions.
publications, quantum topics, h-index, research impact, EU, US, China, academic output
false
Industry Overview
Education & Training
Mixed Chart
McKinsey
Add to my slides
Remove from favorites
A column chart showing the likelihood of enterprise executives using public blockchains in the future, with 75% believing public blockchains are in their future. Accompanied by text explaining the challenges of private blockchains and the advantages of public networks.
Market Analysis and Trends
Technology & Software
Shows survey results indicating a strong trend among enterprises towards adopting public blockchains due to the challenges faced with private blockchain networks.
Public blockchains, enterprise, challenges, private blockchains, survey, future adoption, power of public networks
false
Market Analysis and Trends
Technology & Software
Mixed Chart
EY
Add to my slides
Remove from favorites
A diagram showing a model of siloed private networks and a bar chart displaying the participation in private blockchain networks. It contrasts the traditional isolated networks with emerging trends of openness to public blockchains.
Market Analysis and Trends
Technology & Software
Highlights the shift from isolated private networks to a growing interest in public blockchains among enterprises, driven by the limitations of current siloed models.
Public blockchains, enterprise, trends, private networks, isolation, openness, participation, 2019, accelerated interest
false
Market Analysis and Trends
Technology & Software
Mixed Chart
EY
Add to my slides
Remove from favorites
Column chart and satisfaction/importance grid showing key issues with public charging, including location, availability, price, and waiting time. The slide uses multiple visual elements to present dissatisfaction reasons.
Customer and Market Segmentation
Transportation & Logistics
This slide highlights the main areas of dissatisfaction among EV owners with public charging stations, focusing on issues like location availability, waiting times, and pricing. It uses a grid to map satisfaction and importance levels.
public charging issues, location availability, EV owners, dissatisfaction factors, waiting times
false
Customer and Market Segmentation
Transportation & Logistics
Multiple Chart
PwC/Strategy&
Add to my slides
Remove from favorites
Horizontal bar graph showing % concerned by country; countries sorted top to bottom; past year comparison included.
Market Analysis and Trends
Environmental Services & Sustainability
Reveals national concern levels about climate change impacts already occurring. Philippines, South Africa, and Indonesia rank highest in concern, while Switzerland and Sweden show lower levels.
public concern, domestic climate effects, country ranking, Ipsos, perception tracking, environmental anxiety
false
Market Analysis and Trends
Environmental Services & Sustainability
Mixed Chart
IPSOS
Add to my slides
Remove from favorites
This slide features two column charts depicting "Public Debt", "Budget Deficit", and "Fiscal Weakness". Each chart is labeled with years and financial data in billions and percentage of GDP.
Regulatory and Compliance
Government & Public Sector
This slide compares public debt, budget deficits, and fiscal weaknesses over several fiscal years to illustrate government financial challenges.
Public debt, budget deficit, GDP, fiscal analysis, financial data
false
Regulatory and Compliance
Government & Public Sector
Multiple Chart
PwC/Strategy&
Add to my slides
Remove from favorites
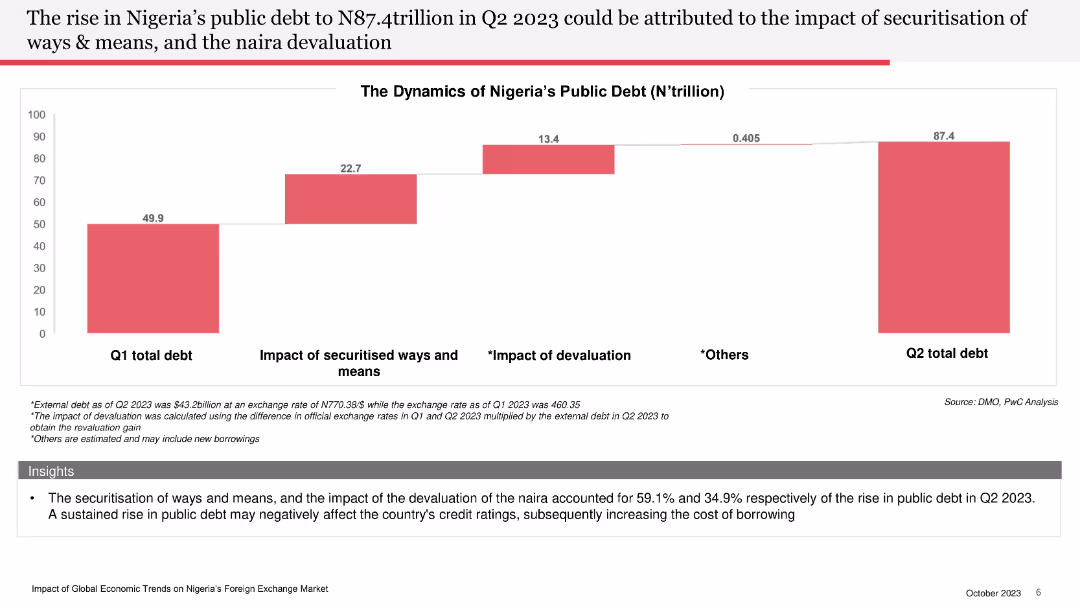
Shows a column chart of public debt components and their contributions to the total debt in Q2 2023.
Financial Performance
Financial Services
Discusses the rise in public debt and the factors contributing to it, including naira devaluation and securitisation of ways and means.
public debt, Nigeria, Q2 2023, securitisation, naira devaluation, financial performance, debt components
false
Financial Performance
Financial Services
Mixed Chart
PwC/Strategy&
Add to my slides
Remove from favorites
The slide includes two vertical column charts comparing survey responses from 2013 and 2022 in Japan, Sweden, GB, and South Africa.
Market Analysis and Trends
Technology & Software
The slide analyzes the increase in public concerns about technology over time in different countries.
Public disquiet, technology, survey, public opinion, technology growth
false
Market Analysis and Trends
Technology & Software
Multiple Chart
IPSOS
Add to my slides
Remove from favorites
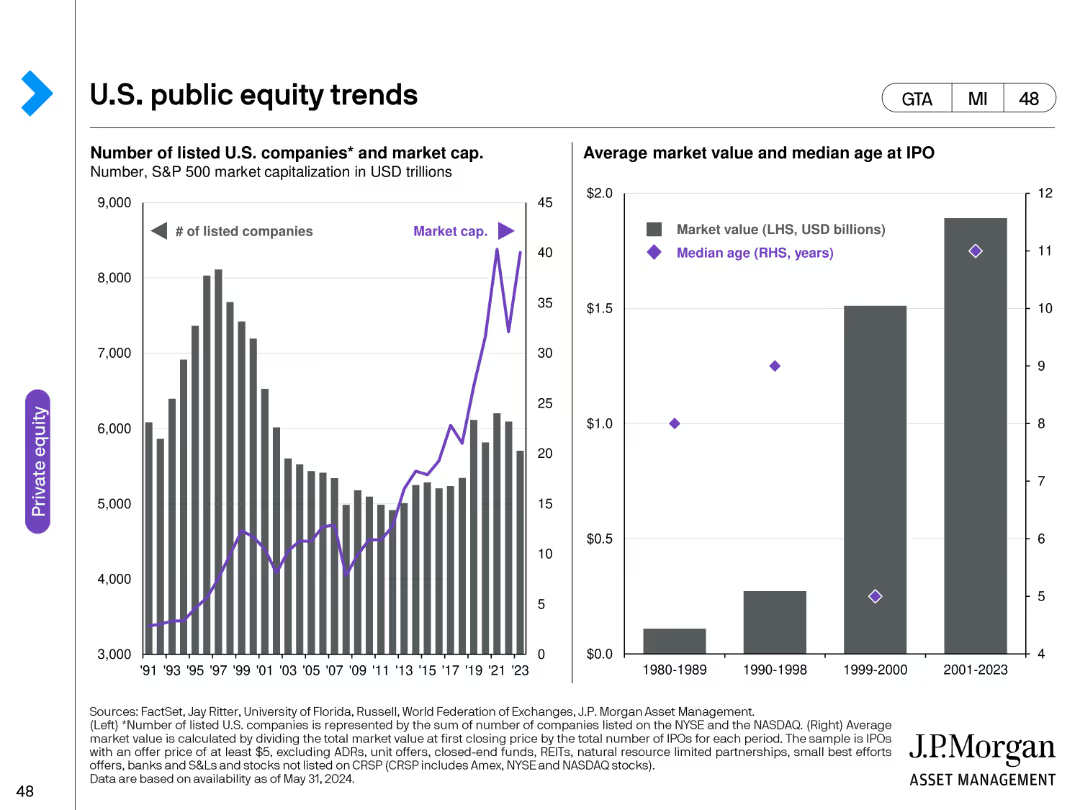
The slide includes two charts: a line chart on the left showing the number of listed U.S. companies and their market cap from 1991 to 2023, and a column chart on the right depicting the average market value and median age at IPO for different periods. The line chart uses a dual-axis to show both company count and market cap.
Market Analysis and Trends
Financial Services
This slide examines trends in the U.S. public equity market, detailing the number of listed companies, their market capitalization, and the average market value and age at IPO. It is useful for understanding the evolution and dynamics of the public equity market.
Public equity, market cap, listed companies, IPO trends, equity market analysis, financial trends
false
Market Analysis and Trends
Financial Services
Multiple Chart
JP Morgan
Add to my slides
Remove from favorites
Vertical bar charts compare the main factors of concern for EV charging at public facilities in different regions, using distinct colors for each factor.
Market Analysis and Trends
Transportation & Logistics
This slide covers key issues like charging costs and long wait times at public charging facilities, showing how these concerns vary globally.
Public EV charging, costs, waiting times, regional concerns, charging facilities
false
Market Analysis and Trends
Transportation & Logistics
Multiple Chart
EY
Add to my slides
Remove from favorites
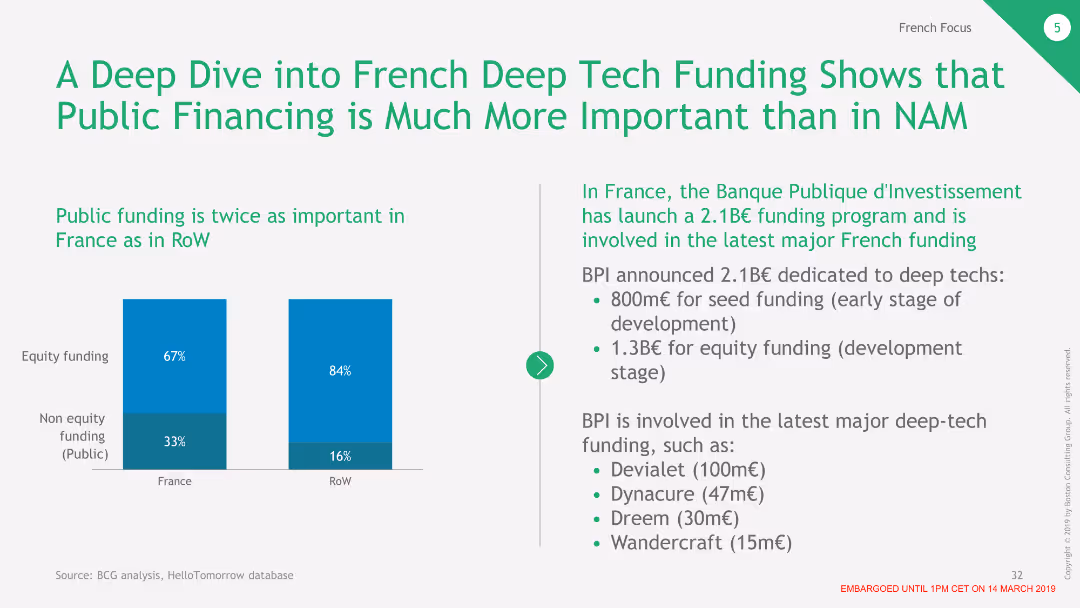
This slide includes two column charts comparing public funding importance between France and the RoW, with text detailing BPI's actions.
Financial Performance
Financial Services
Illustrates the significant role of public funding in France's deep tech sector and details major investments and funding programs.
public funding, BPI, equity funding, deep tech, France
false
Financial Performance
Financial Services
Mixed Chart
BCG
Add to my slides
Remove from favorites
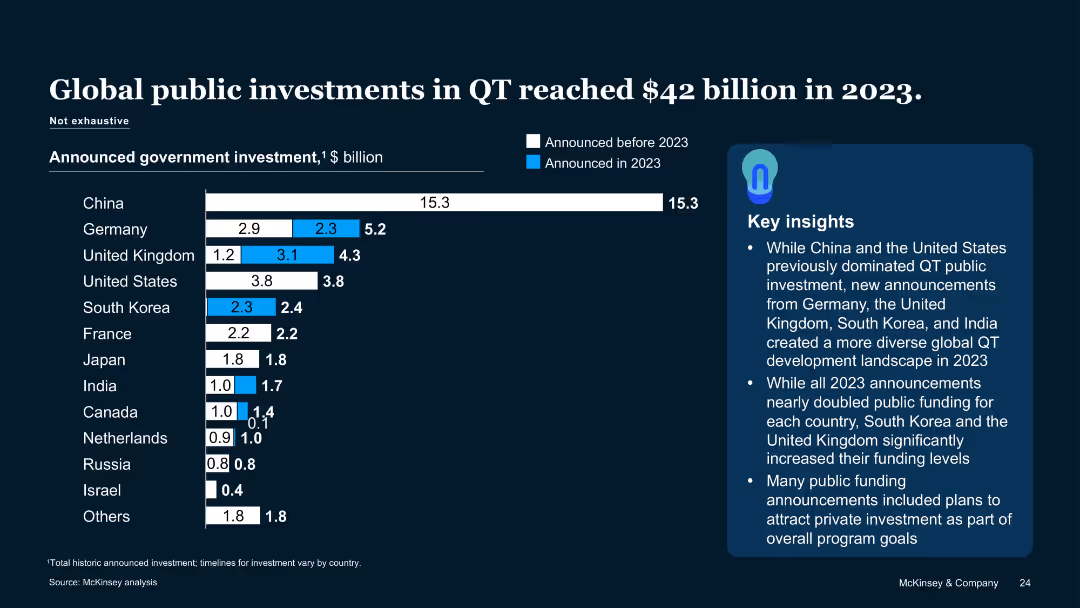
Horizontal bar chart showing public QT investment by country with 2023 additions marked separately
Financial Performance
Government & Public Sector
The slide reveals national government investments in QT, led by China, Germany, UK, and the US. Many 2023 announcements doubled earlier commitments. The chart highlights a broadening global base for QT public funding.
Public Funding, QT Investment, Government Spending, 2023 Announcements
false
Financial Performance
Government & Public Sector
Mixed Chart
McKinsey
Add to my slides
Remove from favorites
The slide has a bar chart showing announced governmental investment in QT by country (China, EU, US, Japan, UK, etc.), and a pie chart detailing EU public investment sources.
Regulatory and Compliance
Financial Services
This slide outlines the public funding announcements for QT in 2022, highlighting China's leading position in public investment and providing a breakdown of EU funding sources.
public funding, QT investments, China, EU, US, government investment
false
Regulatory and Compliance
Financial Services
Multiple Chart
McKinsey
Add to my slides
Remove from favorites
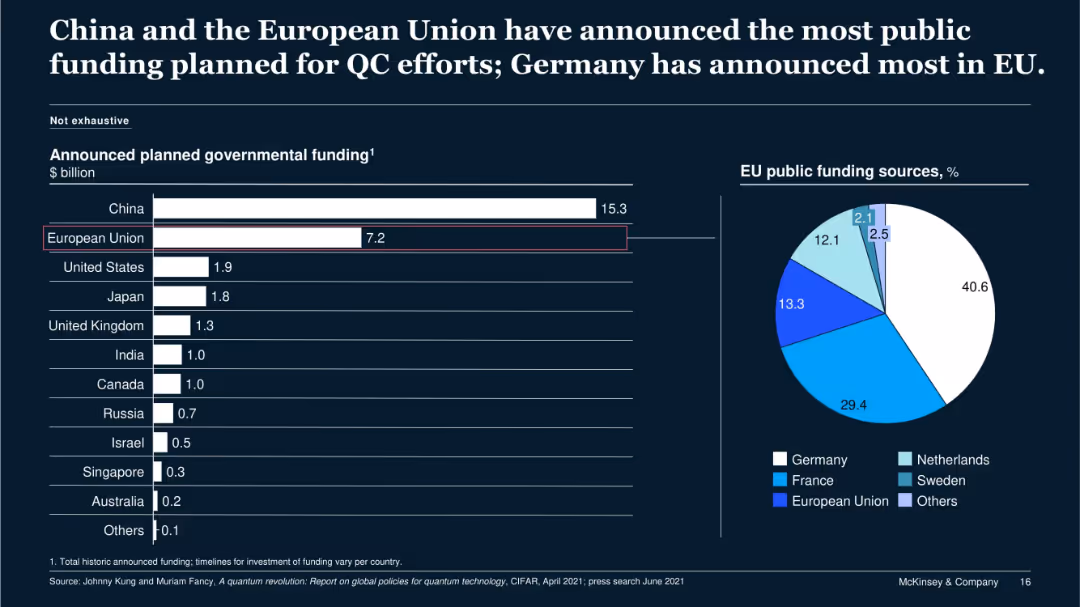
Bar chart and pie chart on dark background; shows announced QC funding by country and EU member source breakdown.
Regulatory and Compliance
Government & Public Sector
This slide compares global government funding commitments for quantum computing. China leads with $15.3B, followed by the EU at $7.2B. The pie chart reveals Germany’s dominance within the EU’s QC funding sources, followed by France and EU central programs.
public funding, quantum computing, China, EU, Germany, QC
false
Regulatory and Compliance
Government & Public Sector
Multiple Chart
McKinsey
Add to my slides
Remove from favorites
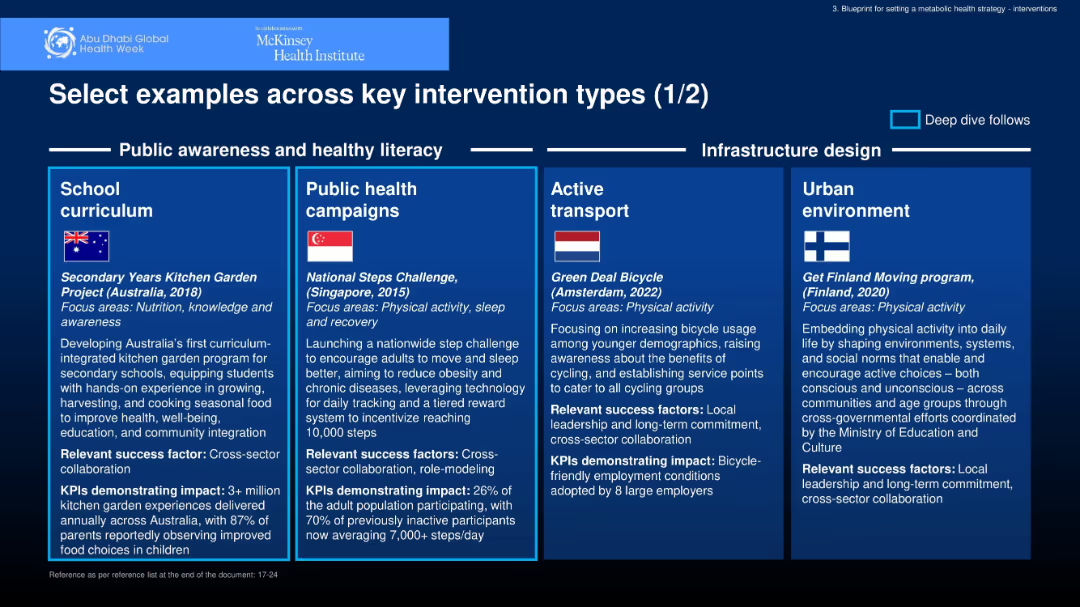
Four-panel layout with boxed sections, each featuring a country flag, initiative title, year, and detailed description; color-coded segments under a "Public awareness and healthy literacy" and "Infrastructure design" header.
Strategic Planning
Healthcare & Pharmaceuticals
Highlights global interventions promoting health through school curriculum, public campaigns, active transport, and urban planning. Examples include Australia’s kitchen garden program, Singapore’s steps challenge, Amsterdam’s bike scheme, and Finland’s active environments.
public health, awareness, transport, nutrition, physical activity
false
Strategic Planning
Healthcare & Pharmaceuticals
Pillar
McKinsey
Add to my slides
Remove from favorites
Left panel lists two-tier imperatives (health and economy), right panel features simple line charts showing trends in virus and economic recovery.
Strategic Planning
Government & Public Sector
This slide outlines a dual-focus imperative: safeguarding both lives and livelihoods. It emphasizes virus suppression, testing, and treatment, alongside economic recovery actions such as supporting businesses and preparing for reopening. Illustrative curves show how interventions can affect virus spread and economic impact.
public health, economy, virus suppression, recovery, imperatives
false
Strategic Planning
Government & Public Sector
Mixed Chart
McKinsey
Add to my slides
Remove from favorites
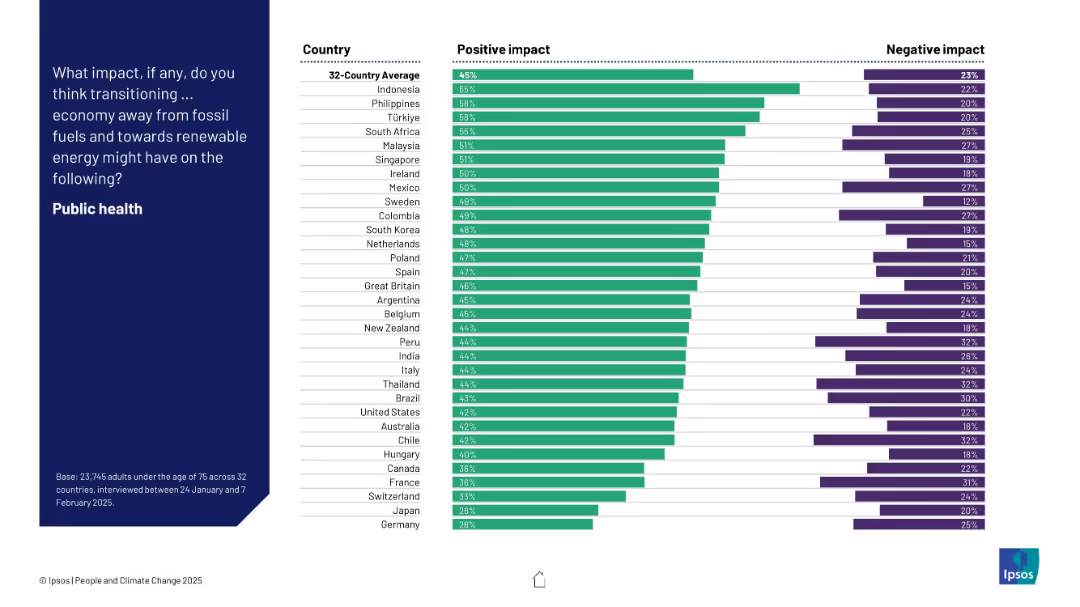
Bar chart ranking 32 countries by their perception of the public health benefits of switching to renewable energy. Positive vs. negative shown side-by-side.
Technology and Digital Transformation
Environmental Services & Sustainability
This slide reveals public opinion across countries on whether transitioning to renewables improves public health. Indonesia leads with 65% seeing benefits, while Germany ranks lowest. Overall, perceptions are more positive than negative.
public health, renewables, perception, energy transition, survey, Ipsos, bar chart, country ranking
false
Technology and Digital Transformation
Environmental Services & Sustainability
Mixed Chart
IPSOS
Add to my slides
Remove from favorites
Bar chart comparing public health staff counts and budgets per 100,000 residents across states. Text explains findings and implications.
Operational Efficiency
Healthcare & Pharmaceuticals
Review of NH public health staff and budget allocation per resident, identifying NH as understaffed relative to peer states during COVID-19 pandemic.
Public Health, Staffing, Budget, COVID-19, Comparison
false
Operational Efficiency
Healthcare & Pharmaceuticals
Mixed Chart
Alvarez & Marsal
Add to my slides
Remove from favorites
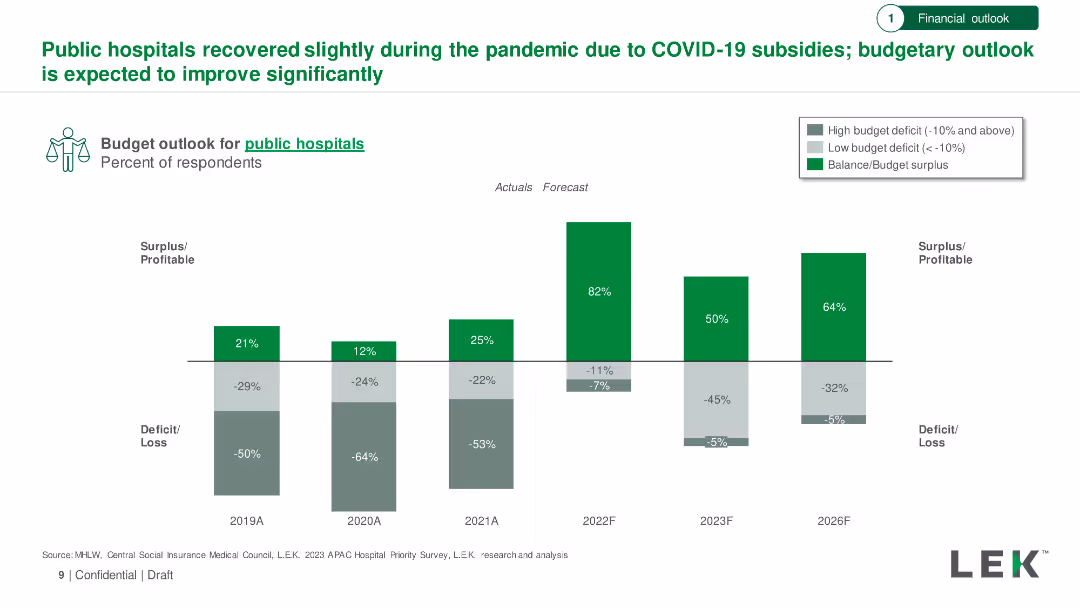
Bar chart showing budget outlook for public hospitals from 2019 to 2026, with actuals and forecasts. Includes surplus/deficit percentages.
Financial Performance
Healthcare & Pharmaceuticals
Analysis of the financial recovery of public hospitals during the pandemic, with an optimistic budget outlook forecasted through 2026.
Public Hospitals, Budget Outlook, COVID-19, Financial Recovery, Forecast
false
Financial Performance
Healthcare & Pharmaceuticals
Single Chart
LEK
Add to my slides
Remove from favorites
The slide includes column charts showing the budget outlook for medium-size and large-size public hospitals over the last three years, current year, and next three years.
Financial Performance
Healthcare & Pharmaceuticals
This slide details the budget outlook for public hospitals in APAC, comparing medium-size and large-size facilities. It highlights budget deficit and surplus trends over a three-year period.
public, hospitals, budget, outlook, financial
false
Financial Performance
Healthcare & Pharmaceuticals
Multiple Chart
LEK
Add to my slides
Remove from favorites
Three sections: a column chart on the use of economic incentives, a column chart on awareness sources, and satisfaction with incentive information.
Market Analysis and Trends
Transportation & Logistics
Explores the role of public incentives in EV purchases, sources of awareness about incentives, and satisfaction with the information provided.
public incentives, EV purchases, awareness sources, survey, satisfaction
false
Market Analysis and Trends
Transportation & Logistics
Multiple Chart
PwC/Strategy&
Add to my slides
Remove from favorites
The slide features a line graph showing the trading multiples of publicly traded automation companies, segmented into process industry automation, discrete automation, and warehouse automation.
Financial Performance
Industrial & Manufacturing
The slide analyzes the trading multiples of publicly traded automation companies, indicating their market performance and valuation metrics.
publicly traded, automation companies, EBITDA, trading multiples, market performance
false
Financial Performance
Industrial & Manufacturing
Mixed Chart
LEK
Add to my slides
Remove from favorites
A slide with a column chart illustrating the public funding value for 2020, 2021, and H1 2022, accompanied by a deal count. The chart shows a significant peak in 2021 compared to a steep decline in H1 2022. Annotations provide context about a bull run in 2021 and a cool-off period happening in 2022 due to various market conditions.
Investment Analysis
Financial Services
The slide shows a marked decline in public market funding, including IPOs and post-IPO financing, in H1 2022, contrasting with the previous year's bull run and outlining contributing economic factors like rising interest rates and stock valuation challenges.
public markets, funding, IPO, post-IPO, bull run, economic factors, decline
false
Investment Analysis
Financial Services
Single Chart
Bain
Add to my slides
Remove from favorites
A slide with dual charts contrasting public market and tech performance with U.S. venture investment, accompanied by a second chart on key inflation indicators and treasury interest rates. Each chart uses different colored lines for comparison and has annotations for additional context.
Market Analysis and Trends
Technology & Software
This slide analyzes the trend of public market rallies driven by technology companies contrasted against a drop in venture investments. It also provides a secondary focus on inflation and interest rates, aiming to discuss the financial climate and its effects on investment strategies. It can be used to guide discussions on economic trends and investment decisions, especially in technology-driven markets.
Public Markets, Technology, Venture Investment, Inflation, Interest Rates, Economic Trends
false
Market Analysis and Trends
Technology & Software
Multiple Chart
JP Morgan
Add to my slides
Remove from favorites
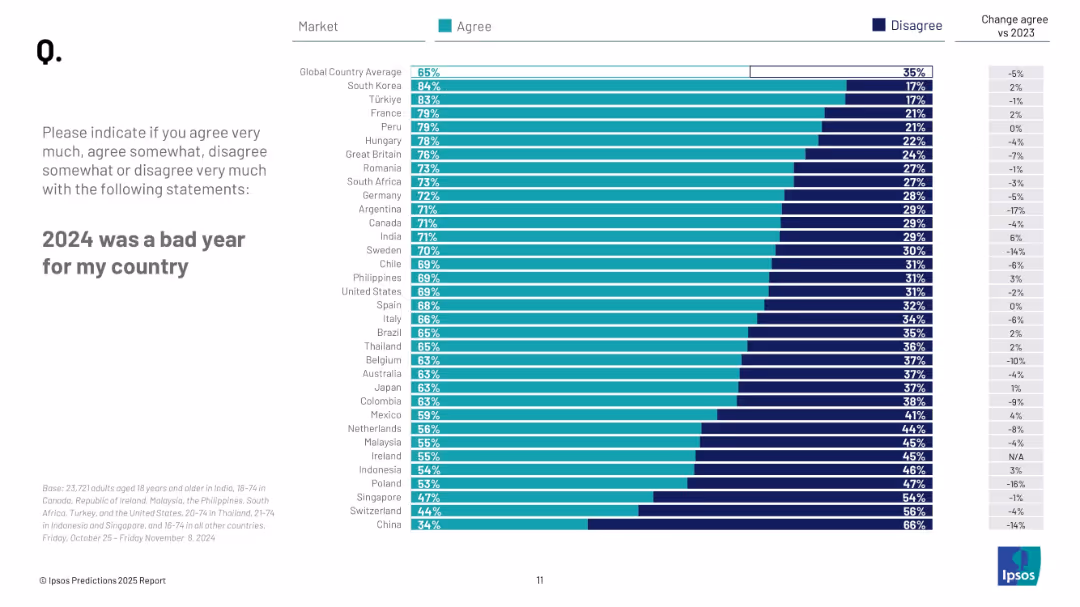
Horizontal bar chart ranking countries by agreement with the statement. Three columns show % agree, % disagree, and year-over-year change.
Market Analysis and Trends
Professional Services
Country-level breakdown of sentiment about 2024 shows South Korea (84%) and Türkiye (83%) at the top, while China (34%) is lowest. The global average is 65%, with some countries showing sharp declines compared to 2023.
public opinion, 2024 reflection, national hardship, global sentiment, Ipsos data, country comparison
false
Market Analysis and Trends
Professional Services
Mixed Chart
IPSOS
Add to my slides
Remove from favorites
Slide features multiple column charts displaying public concern about social climate and government debt. It includes quotes from professionals on the social and economic implications.
Risk Assessment and Management
Government & Public Sector
Summarizes public concern about government measures and their questioning about the social climate and public debt under the Macron administration.
public opinion, government measures, Macron, social climate, public debt, economic impact
false
Risk Assessment and Management
Government & Public Sector
Multiple Chart
Bain
Add to my slides
Remove from favorites
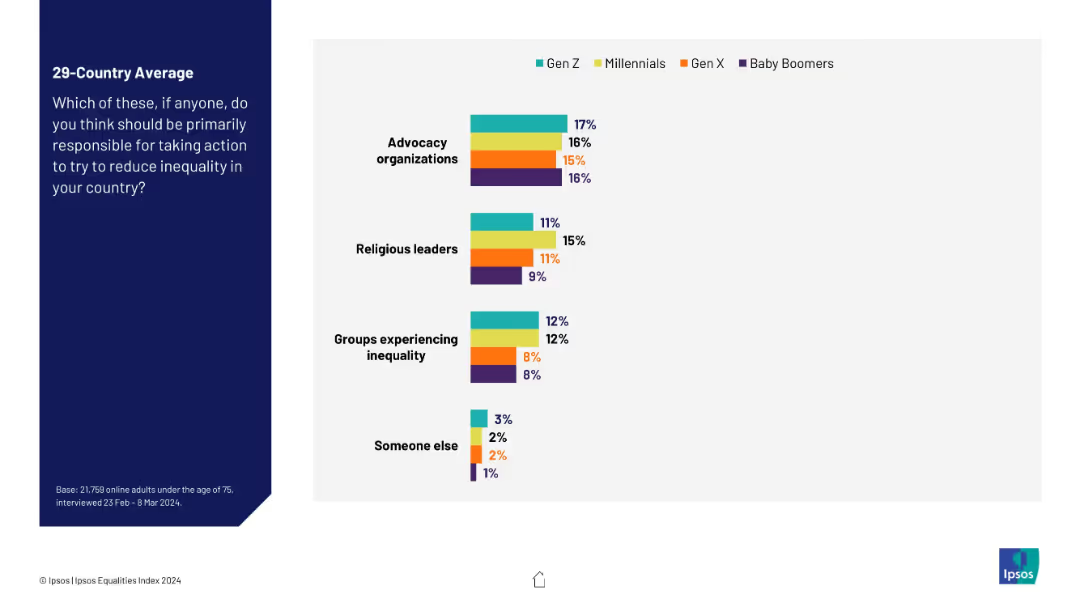
Continuation of 19345 with less commonly chosen actors (advocacy, religious leaders, etc.), horizontal grouped bar chart. Consistent design.
Strategic Planning
Government & Public Sector
This slide expands on slide 19345 by showing lesser-chosen actors for inequality reduction. Advocacy organizations and religious leaders receive moderate to low attribution, while “someone else” and “groups experiencing inequality” score lowest. Generational variance is moderate.
public opinion, minority voices, responsibility, inequality, Ipsos, generational divide, advocacy, religion
false
Strategic Planning
Government & Public Sector
Mixed Chart
IPSOS
Add to my slides
Remove from favorites
The slide features a pie chart with multiple segments showing public opinions on their influence over local decisions. Text boxes highlight net agreement and disagreement percentages.
Customer and Market Segmentation
Government & Public Sector
This slide presents survey results on public perceptions regarding their ability to influence local decisions, showcasing net agreement and disagreement percentages, and comparisons with past data.
public opinion, survey, influence, local decisions, perception, agreement, disagreement, comparison, pie chart
false
Customer and Market Segmentation
Government & Public Sector
Mixed Chart
IPSOS
Add to my slides
Remove from favorites
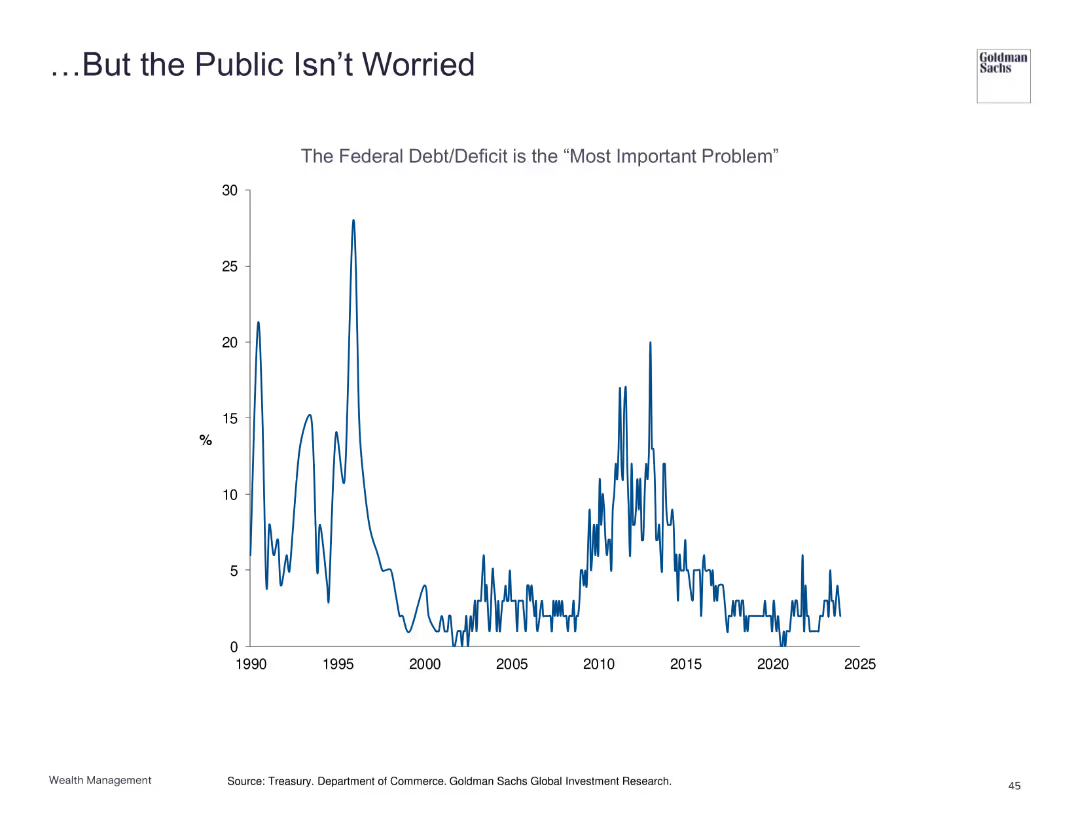
Line chart illustrating the public perception of federal debt/deficit as the "most important problem."
Market Analysis and Trends
Financial Services
Highlights the discrepancy between rising debt concerns and public worry levels, indicating low current public concern despite potential risks.
public perception, debt, deficit, concern
false
Market Analysis and Trends
Financial Services
Single Chart
Goldman Sachs
Add to my slides
Remove from favorites
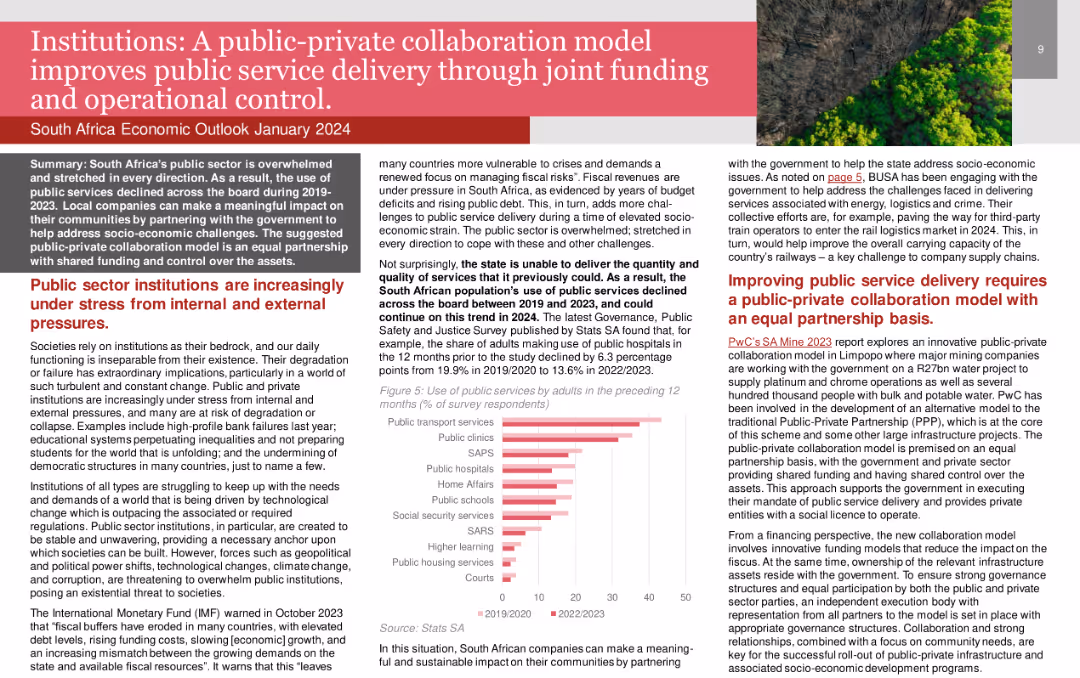
The slide features a title in a red banner, text boxes with detailed content, and a column chart illustrating the use of public services by adults. The layout is dense and informative.
Strategic Planning
Government & Public Sector
The slide discusses the benefits of public-private collaboration in enhancing public service delivery. It outlines the stress public sector institutions face and the potential of collaboration to address socio-economic challenges.
public-private collaboration, public service, operational control, government, institutions
false
Strategic Planning
Government & Public Sector
Mixed Chart
PwC/Strategy&
Add to my slides
Remove from favorites
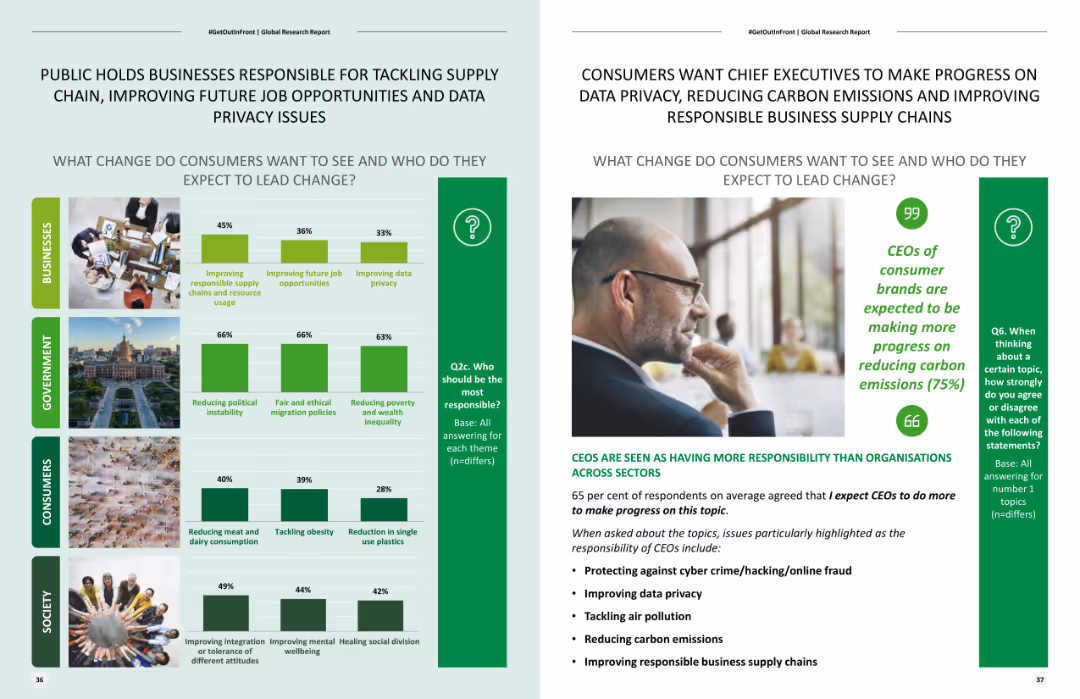
Includes column charts and images depicting different sectors like businesses, government, and society, indicating responsibility for leading changes.
Organizational Structure and Change
Professional Services
Evaluates public opinion on who should be responsible for addressing issues like supply chain improvements and job opportunities, focusing on businesses' roles.
Public responsibility, supply chain, job opportunities, business roles, public opinion
false
Organizational Structure and Change
Professional Services
Multiple Chart
Deloitte
Add to my slides
Remove from favorites
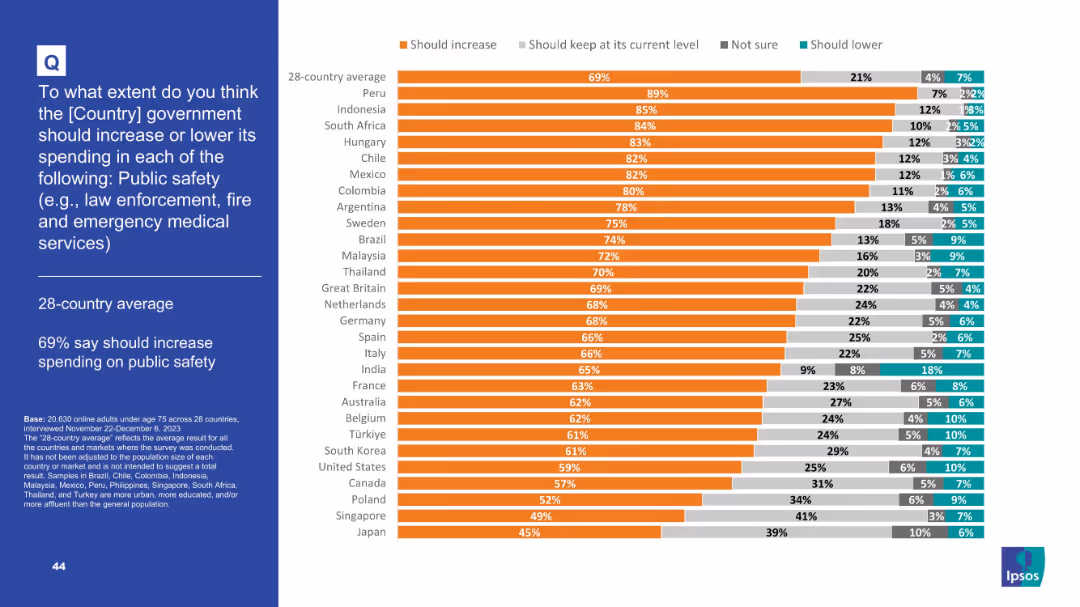
Bar chart ranked by country, orange and gray bars showing opinion on increasing public safety funding
Strategic Planning
Government & Public Sector
The slide presents public opinion across 28 countries on whether government spending on public safety (law enforcement, fire, EMS) should increase. 69% on average support an increase, with Peru showing the highest support (89%).
Public safety, government spending, survey, law enforcement, emergency services, international comparison, bar chart, Ipsos, policy priorities, global views
false
Strategic Planning
Government & Public Sector
Mixed Chart
IPSOS
Add to my slides
Remove from favorites
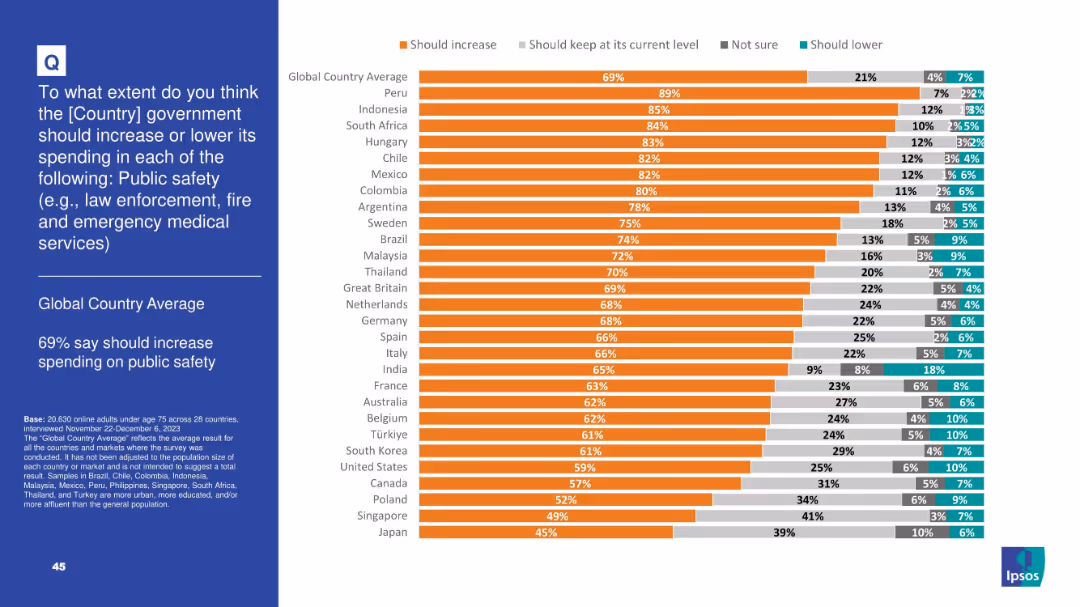
Bar chart reflecting opinions on government spending for law enforcement, fire, and emergency services across countries
Strategic Planning
Government & Public Sector
Globally, 69% want more spending on public safety. Latin American countries show the highest demand. The data suggests widespread prioritization of emergency services, with few respondents supporting spending cuts.
public safety, law enforcement, fire services, emergency medical, spending, governance, Ipsos, priorities, security
false
Strategic Planning
Government & Public Sector
Mixed Chart
IPSOS
Add to my slides
Remove from favorites
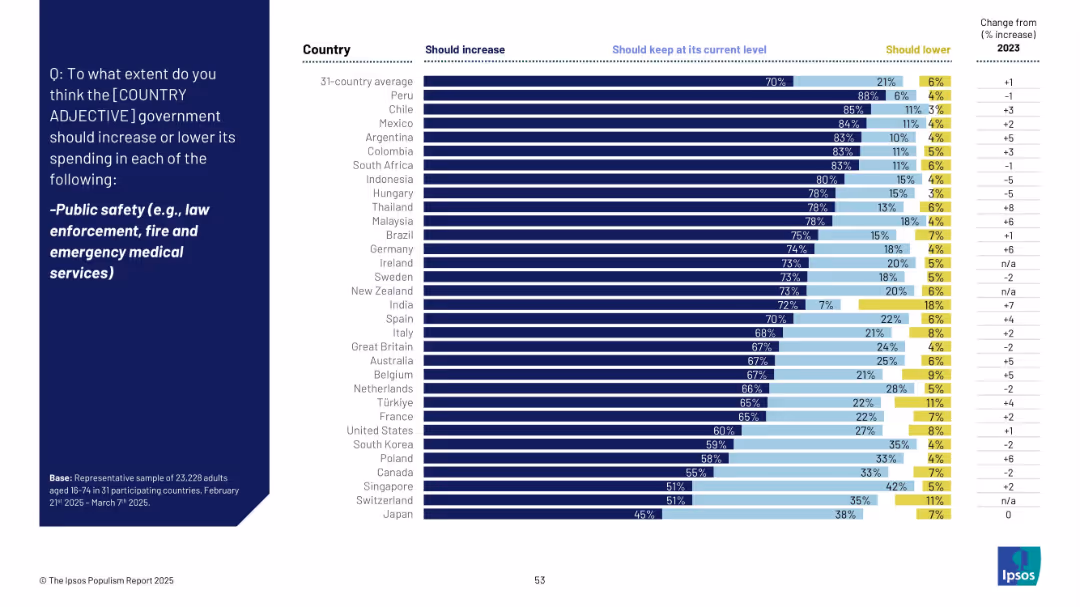
Bar chart with three response categories and a trend column for % change.
Strategic Planning
Government & Public Sector
Global sentiment favors increased spending on public safety, with 70% on average supporting it. Peru and Chile top the list, while Japan and Switzerland show the least support. The data suggest strong backing for law enforcement and emergency services funding globally.
public safety, law enforcement, fire services, emergency response, funding, government, Ipsos, survey
false
Strategic Planning
Government & Public Sector
Mixed Chart
IPSOS
Add to my slides
Remove from favorites
Displays a bar graph tracking the submission of annual reports by non-listed entities, with a stark visual question mark emphasizing missing data.
Regulatory and Compliance
Government & Public Sector
Examines report submission compliance among public and semi-public entities, highlighting gaps in submissions over the years. Useful for regulatory discussions and public sector transparency initiatives.
public sector, compliance, reports, transparency
false
Regulatory and Compliance
Government & Public Sector
Single Chart
PwC/Strategy&
Add to my slides
Remove from favorites
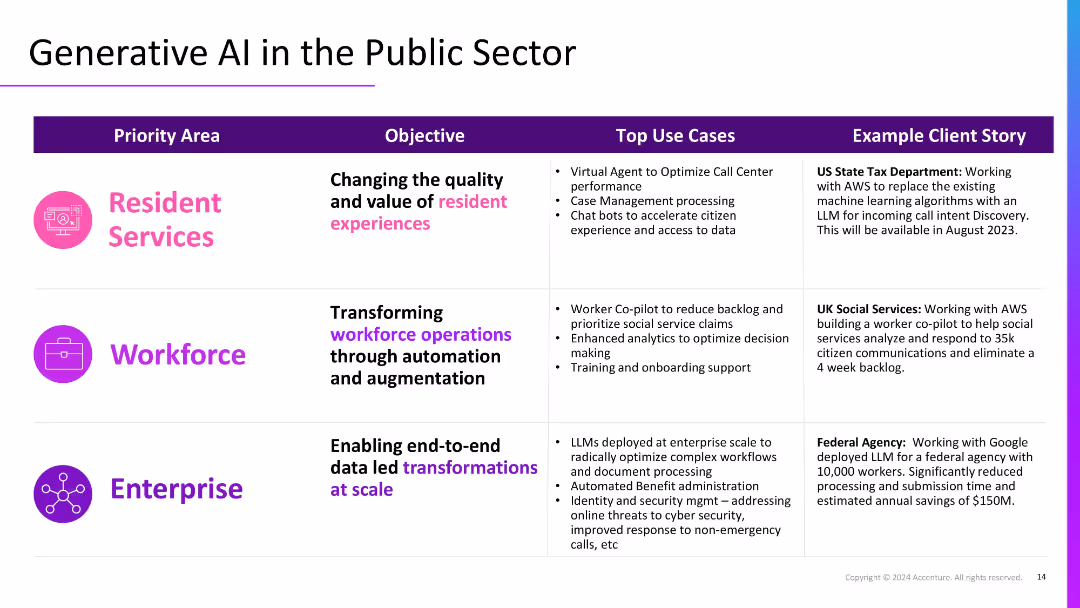
Table format with three horizontal rows, each representing a priority area. Includes icons, objectives, use cases, and real-world client stories.
Technology and Digital Transformation
Government & Public Sector
Illustrates how Generative AI supports resident services, workforce automation, and enterprise transformation at scale. Includes case studies of tax departments, social services, and federal agencies utilizing LLMs and AI tools to reduce costs, improve efficiency, and enhance citizen experience.
public sector, GenAI, resident services, automation, transformation
false
Technology and Digital Transformation
Government & Public Sector
Table
Accenture
Add to my slides
Remove from favorites
Detailed text and infographic highlighting the public sector's 12% organic growth in 2022, including points on professionalization, global leadership, and sector-specific projects.
Market Analysis and Trends
Government & Public Sector
The slide discusses the factors driving growth in the public sector, such as professionalization and global leadership, along with specific projects and their impacts.
public sector, growth, professionalization, leadership, projects
false
Market Analysis and Trends
Government & Public Sector
Vertical Flow
IPSOS
Add to my slides
Remove from favorites
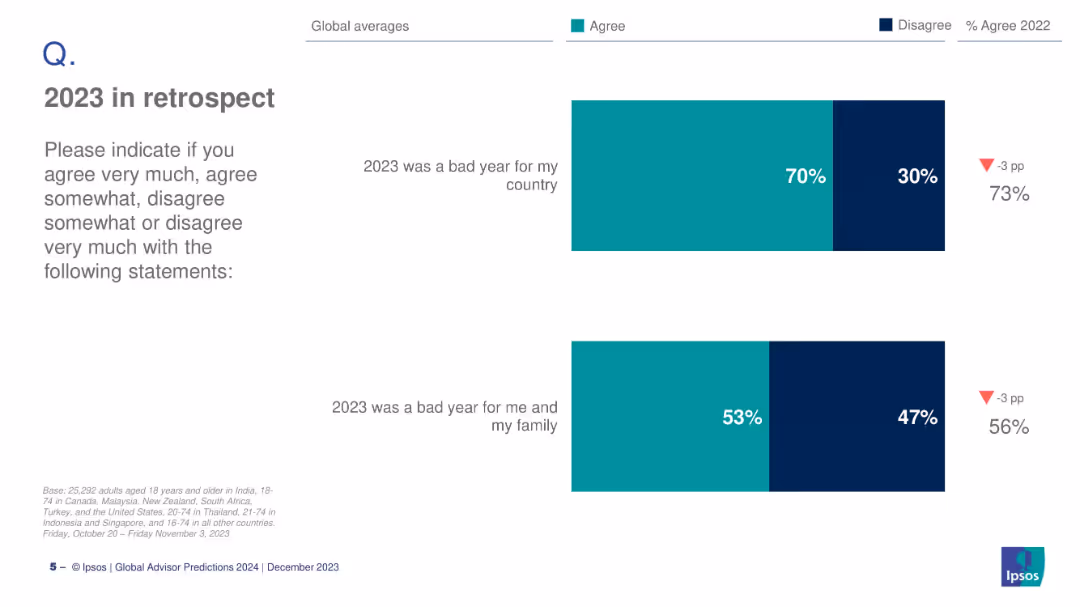
Horizontal bar charts with survey data on public sentiment about 2023.
Market Analysis and Trends
Government & Public Sector
The slide presents global survey results showing that 70% believe 2023 was a bad year for their country, and 53% for their family. It reflects public sentiment and perceived socio-economic challenges.
public sentiment, 2023 review, Ipsos, survey data, global averages, country outlook, personal impact, socio-economic sentiment
false
Market Analysis and Trends
Government & Public Sector
Mixed Chart
IPSOS
Add to my slides
Remove from favorites
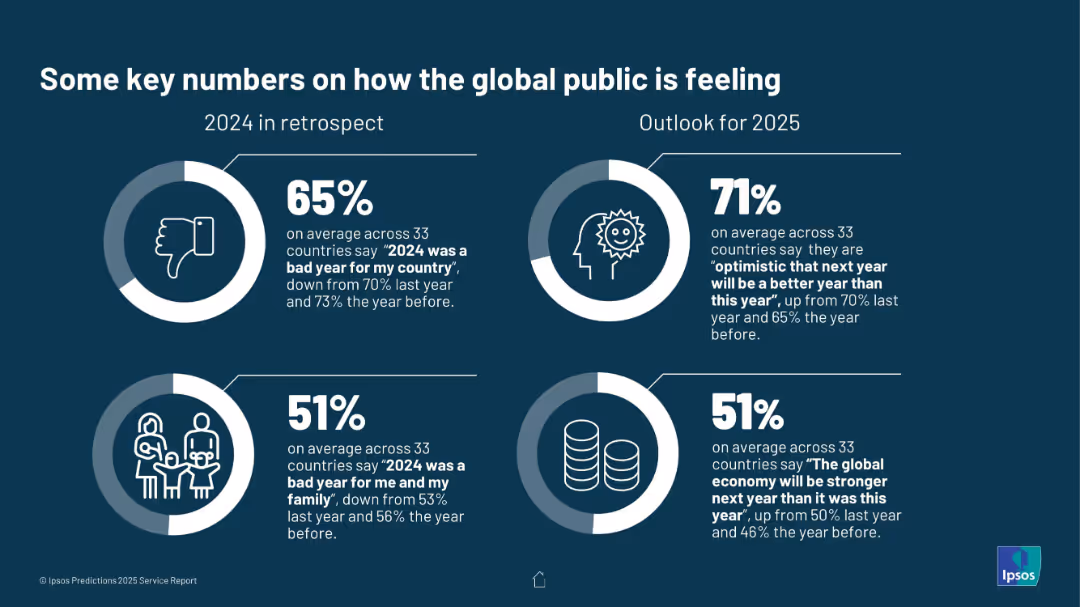
Full-slide dark background with four circular infographic segments split between 2024 reflections and 2025 outlooks; uses icons, bold percentages, and small supporting text.
Market Analysis and Trends
Professional Services
The slide compares sentiment about 2024 and expectations for 2025 across 33 countries. Key figures show that 65% thought 2024 was bad for their country, while 71% feel optimistic about 2025. Half of respondents believe the economy will strengthen.
public sentiment, optimism, 2025 outlook, 2024 review, global opinion, economy, mental health, family impact
false
Market Analysis and Trends
Professional Services
Single Chart
IPSOS
Add to my slides
Remove from favorites
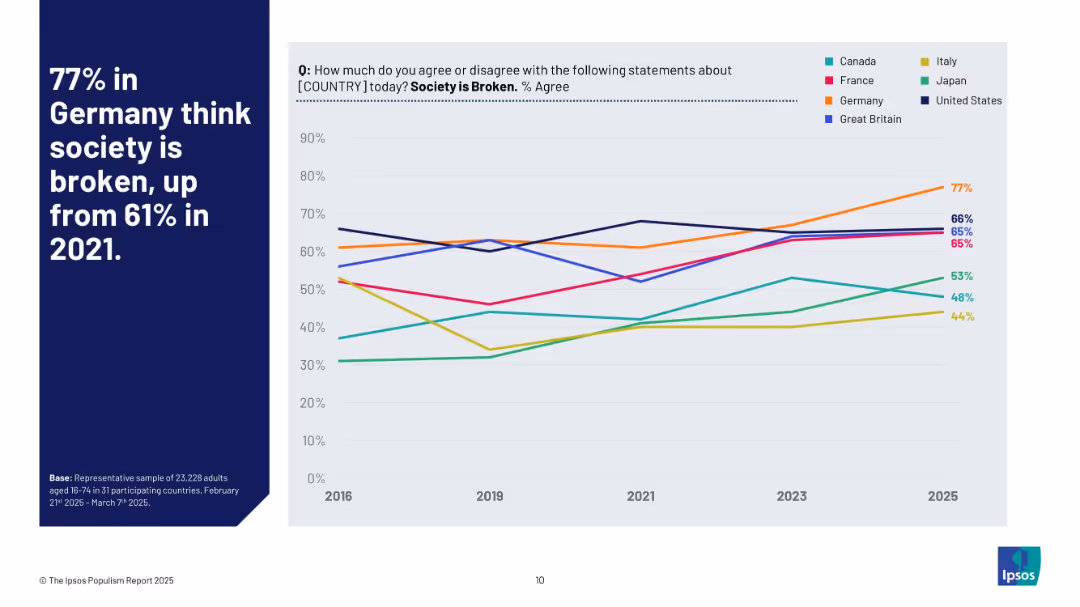
Line graph tracking changes in agreement that society is broken (2016–2025) for 8 selected countries.
Market Analysis and Trends
Government & Public Sector
A time-series line chart highlighting the rising sentiment in Germany that society is broken, increasing from 61% in 2021 to 77% in 2025. Other countries like the U.S., France, and Canada are also charted for comparison.
public sentiment, social crisis, Germany, trend analysis, social issues
false
Market Analysis and Trends
Government & Public Sector
Mixed Chart
IPSOS
Add to my slides
Remove from favorites
The slide includes a stacked column chart displaying unlinked bus and rail rides annually, with distinct colors for each mode of transport and a trend line indicating changes.
Industry Overview
Transportation & Logistics
Presents data on declining ridership in public transportation, identifying trends and potential areas for operational improvements to enhance service efficiency.
public transportation, ridership decline, operational efficiency, data analysis
false
Industry Overview
Transportation & Logistics
Multiple Chart
Deutsche Bank
Add to my slides
Remove from favorites
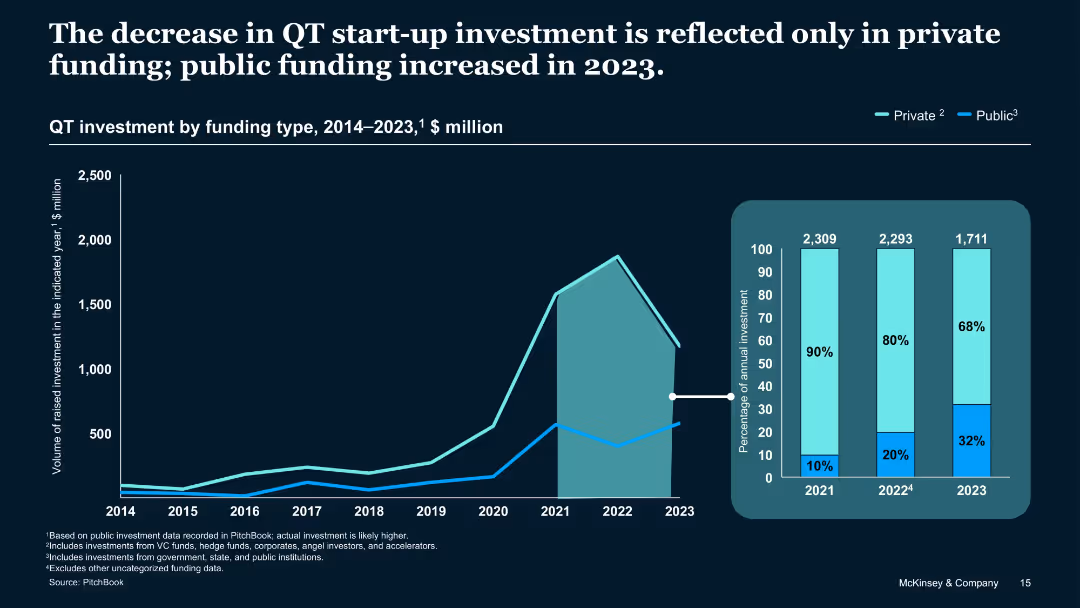
Area chart and stacked bar chart illustrating funding sources over time
Investment Analysis
Artificial Intelligence
Shows the 2023 decline in QT investment was primarily in private funding, while public investment increased. Public funding grew to 32% of total share. Annotations highlight recent shifts in the funding composition.
Public vs private, 2023 funding mix, investment breakdown, VC, trends
false
Investment Analysis
Artificial Intelligence
Single Chart
McKinsey
Add to my slides
Remove from favorites
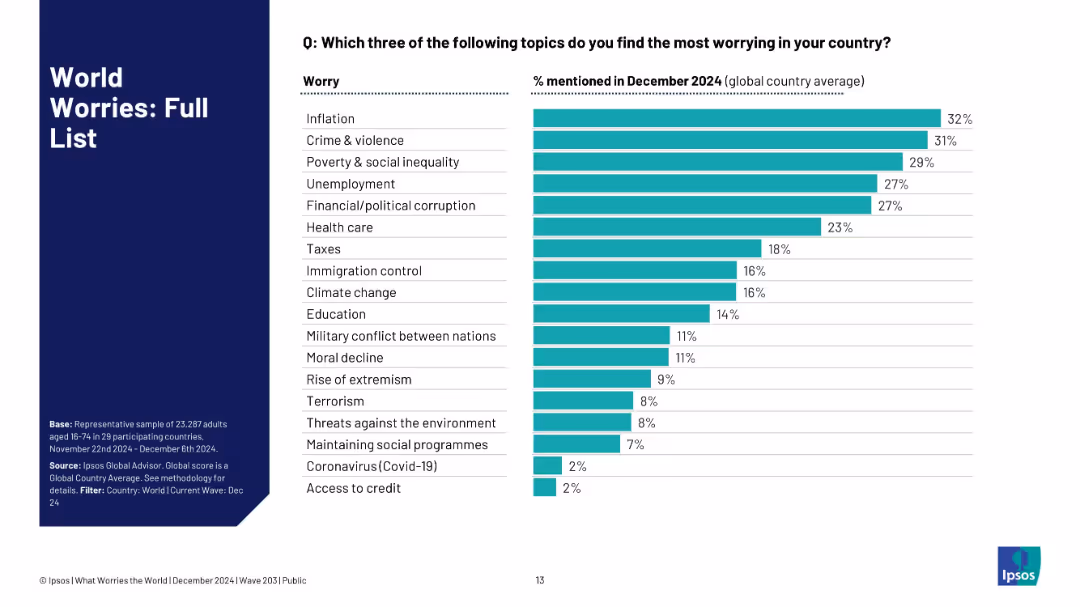
Ranked bar chart listing all mentioned worries by %; teal bars with grey background; left-aligned text.
Market Analysis and Trends
Government & Public Sector
This slide presents a full ranked list of the global public’s most pressing worries as of December 2024. Inflation, crime, and inequality top the list, with education, climate change, and corruption also noted as major concerns.
public worry, Ipsos, global issues, inflation, crime, climate, education, inequality, full list, ranking, priorities
false
Market Analysis and Trends
Government & Public Sector
Mixed Chart
IPSOS
Add to my slides
Remove from favorites
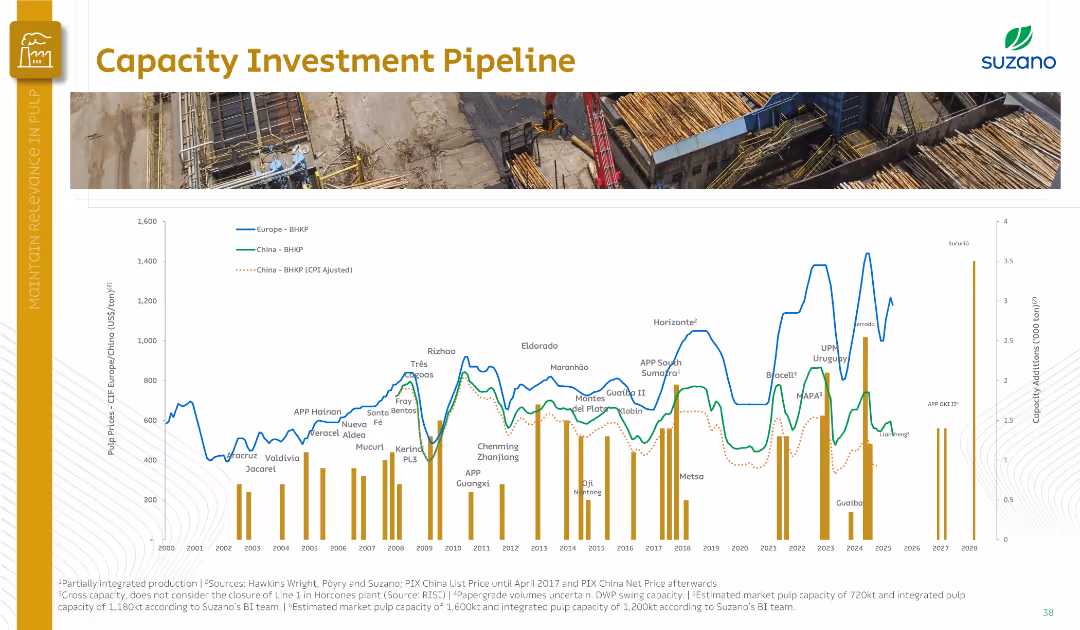
One large line graph with annotations showing plant names and capacity additions; vertical bars indicate capacity in tons/year.
Strategic Planning
Industrial & Manufacturing
The slide displays historical and projected pulp capacity additions and pulp prices in Europe and China. It illustrates key mill projects and investment trends, along with CPI-adjusted pricing and expected future capacity expansion globally.
pulp investment, capacity pipeline, Europe, China, mill projects, CPI
false
Strategic Planning
Industrial & Manufacturing
Single Chart
Goldman Sachs
Add to my slides
Remove from favorites
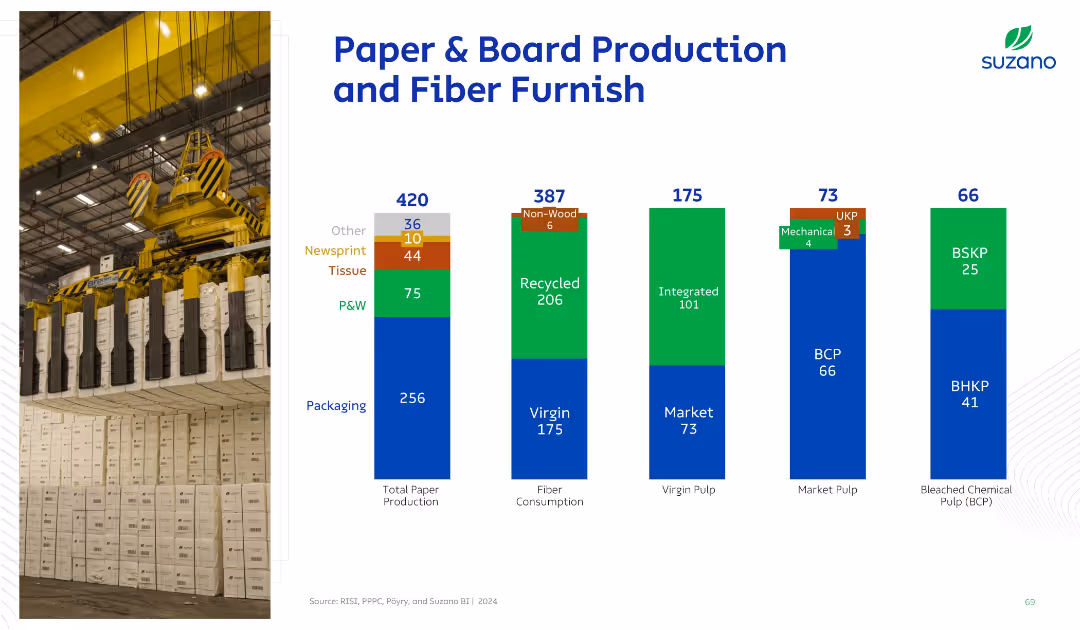
Side-by-side bar charts with color-coded segments, image on the left of industrial crane and paper stacks. Corporate blue and green branding with clear labeling.
Performance Metrics and KPIs
Industrial & Manufacturing
This slide presents segmented data on paper production, fiber consumption, and pulp types. It includes visual breakdowns by categories such as packaging, tissue, and virgin pulp, providing insight into the industry's resource allocation.
pulp, paper, packaging, fiber, tissue, virgin, recycled, production, market, integration
false
Performance Metrics and KPIs
Industrial & Manufacturing
Single Chart
Goldman Sachs
Add to my slides
Remove from favorites
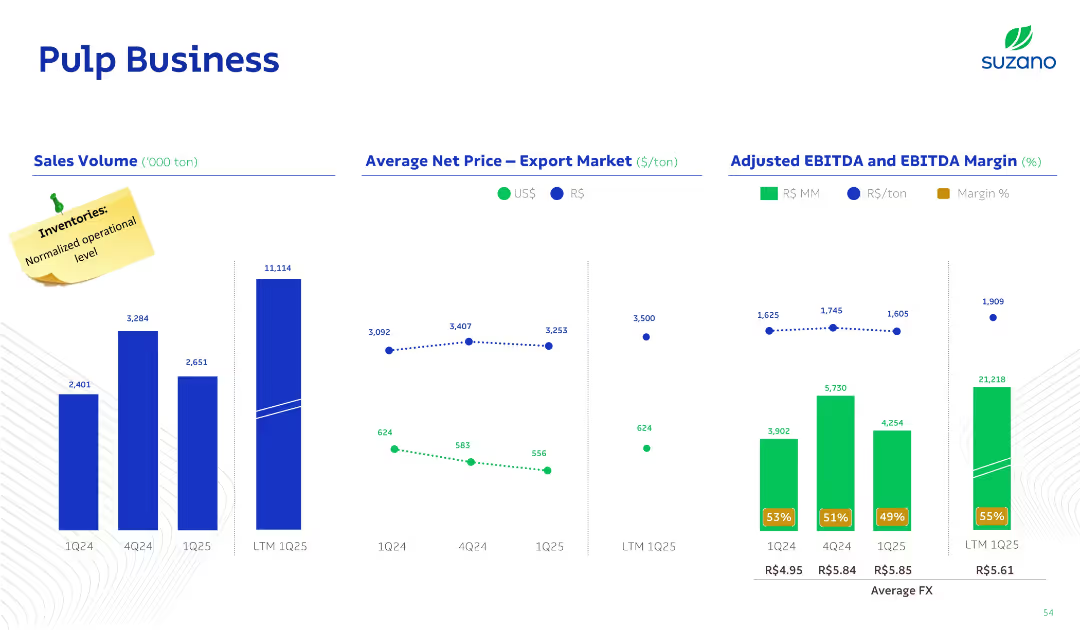
Three-column layout: sales volume (bar), export price trends (dotted lines), and EBITDA metrics (bar + line); design includes note about normalized inventory.
Performance Metrics and KPIs
Consumer Goods
This slide analyzes the pulp business segment, tracking sales volume, export pricing in R$/US$, and EBITDA margins. It includes comparisons over quarters and LTM, showing improvements in efficiency and return metrics.
Pulp, Sales Volume, EBITDA, Pricing, Export
false
Performance Metrics and KPIs
Consumer Goods
Multiple Chart
Goldman Sachs
Add to my slides
Remove from favorites
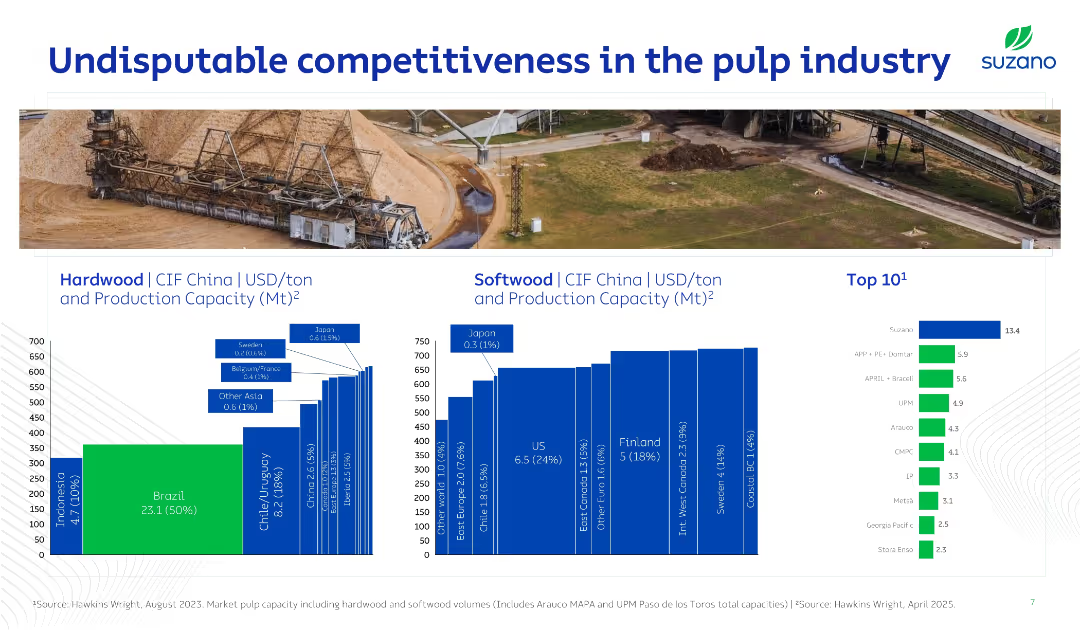
Slide with a mix of infographic and bar charts showing production capacities and costs by region for hardwood and softwood, along with top global producers. Uses rich visual context with a background image of pulp processing.
Competitive Landscape
Industrial & Manufacturing
Highlights Brazil’s cost leadership and large share in global pulp production. Shows regional cost benchmarks and Suzano’s dominant position (13.4 Mt). A visual and data-driven case for Suzano’s global competitiveness.
pulp, Suzano, cost leadership, hardwood, softwood, CIF China, global
false
Competitive Landscape
Industrial & Manufacturing
Multiple Chart
Goldman Sachs
Add to my slides
Remove from favorites
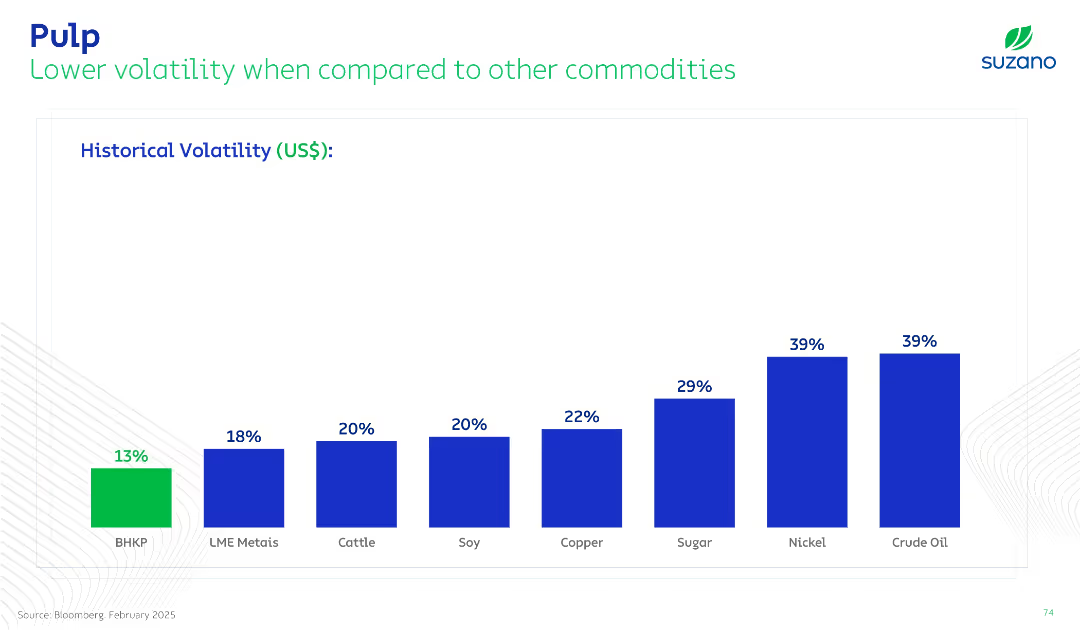
Simple vertical bar chart showing historical price volatility. Green for pulp (BHKP), blue for others (metals, oil, etc.). Minimalist design.
Investment Analysis
Industrial & Manufacturing
This slide compares the price volatility of BHKP (Bleached Hardwood Kraft Pulp) to various other commodities. It emphasizes that pulp has historically lower volatility, positioning it as a relatively stable investment.
pulp, volatility, commodities, BHKP, investment, stability, pricing, benchmark
false
Investment Analysis
Industrial & Manufacturing
Single Chart
Goldman Sachs
Add to my slides
Remove from favorites
This slide features a series of column charts comparing the duration of purchase delays in various countries (US, UK, Germany, France, Italy, China, Japan). Each chart is segmented by months.
Market Analysis and Trends
Transportation & Logistics
This slide analyzes the stabilization of purchase delays in various international markets, highlighting trends and changes in consumer behavior over several months.
purchase delays, market analysis, column chart, international, consumer trends
false
Market Analysis and Trends
Transportation & Logistics
Multiple Chart
McKinsey
Add to my slides
Remove from favorites
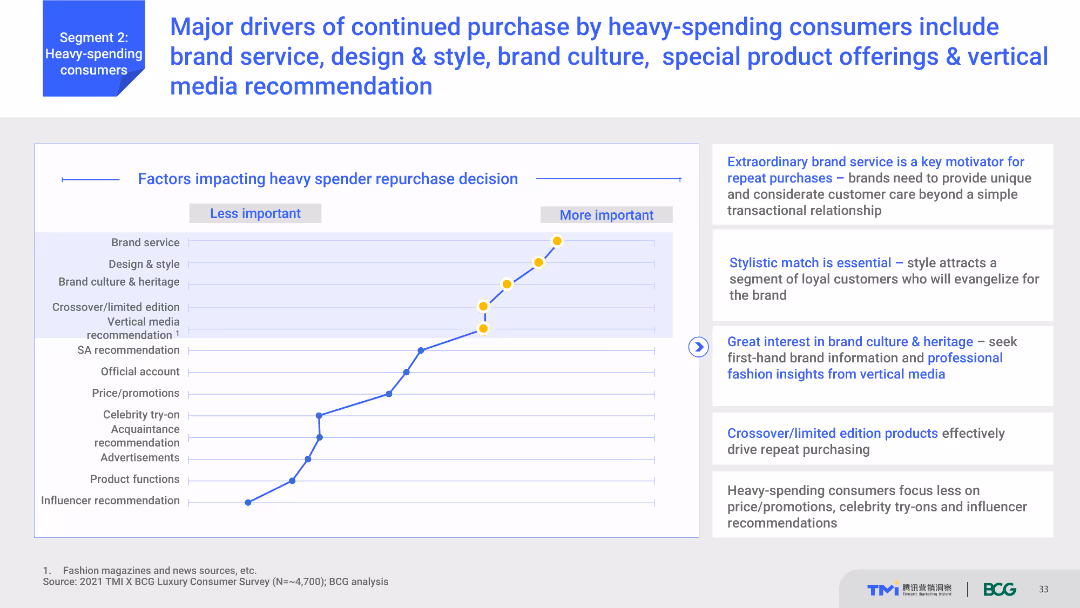
Line graph showing factors influencing heavy spender repurchase decisions, from least to most important. Includes supporting text that explains each factor's significance.
Market Analysis and Trends
Consumer Goods
Analyzes the key factors that drive repeat purchases among heavy-spending consumers, such as brand service, design & style, and special product offerings. Emphasizes the importance of vertical media recommendations in influencing consumer behavior.
Purchase drivers, brand service, design & style, brand culture, consumer retention
false
Market Analysis and Trends
Consumer Goods
Mixed Chart
BCG
Add to my slides
Remove from favorites
Featuring column charts and bar charts, the slide displays the likelihood of purchasing crypto assets within the next 12 months, comparing data from 2023 and 2022, and showing demographics of responses.
Market Analysis and Trends
Financial Services
The slide analyzes the purchase intent of Canadians regarding crypto assets over the next year, with a focus on how likelihood has changed from 2022 to 2023, including demographic insights.
purchase intent, crypto assets, next 12 months, demographics, comparison
false
Market Analysis and Trends
Financial Services
Mixed Chart
IPSOS
Add to my slides
Remove from favorites
Simplified journey map with percentages, showing the online preference at each stage of the purchase journey.
Customer and Market Segmentation
Retail & E-commerce
Breakdown of the consumer purchase journey, focusing on the online preference in the decision-making process.
purchase journey, consumer behavior, online preference, retail
false
Customer and Market Segmentation
Retail & E-commerce
Multiple Chart
Bain
Add to my slides
Remove from favorites
Map with highlighted regions and percentages indicating the likelihood to purchase a home in various areas such as York, Peel, Halton, Durham, and Toronto.
Market Analysis and Trends
Real Estate & Construction
The slide shows regional data on the likelihood of purchasing a home, with percentages and changes from previous data points, highlighting the most and least likely areas.
purchase likelihood, regional data, home buying, York, Peel, Halton, Durham, Toronto
false
Market Analysis and Trends
Real Estate & Construction
Graphic
IPSOS
Add to my slides
Remove from favorites
Composed of column charts, this slide presents the reasons for purchase delays in different regions (US, Europe, Asia), segmented into categories such as health and economics.
Market Analysis and Trends
Transportation & Logistics
Provides insight into the shifting reasons for vehicle purchase delays across different regions, focusing on health and economic factors.
purchase reasons, column chart, health, economics, regional analysis
false
Market Analysis and Trends
Transportation & Logistics
Multiple Chart
McKinsey
Add to my slides
Remove from favorites
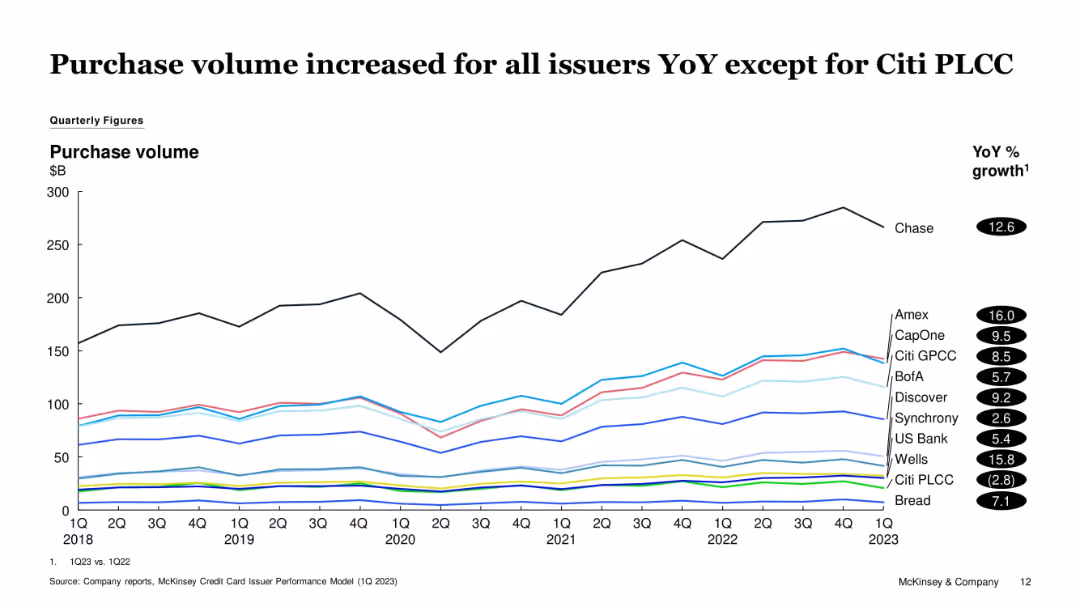
Line graph showing quarterly purchase volumes from 2018 to 1Q23. Different colored lines represent various issuers. YoY % growth is listed on the right.
Financial Performance
Financial Services
The slide tracks changes in credit card purchase volume over time, noting that all issuers except Citi PLCC experienced YoY growth. Chase and Amex show significant upward trends, while Citi PLCC declines slightly.
Purchase Volume, Credit Cards, Issuers, Amex, Citi PLCC, Chase, Trends
false
Financial Performance
Financial Services
Single Chart
McKinsey
Add to my slides
Remove from favorites
This slide includes a horizontal bar chart showing preferred channels for purchasing new cars, alongside a column chart comparing preferences across different generations.
Market Analysis and Trends
Transportation & Logistics
It analyzes consumer preferences for purchasing new cars, emphasizing the importance of dealerships and showrooms, and compares generational differences in buying preferences.
purchasing channels, car buyers, generational differences, dealerships, showrooms
false
Market Analysis and Trends
Transportation & Logistics
Multiple Chart
EY
Add to my slides
Remove from favorites
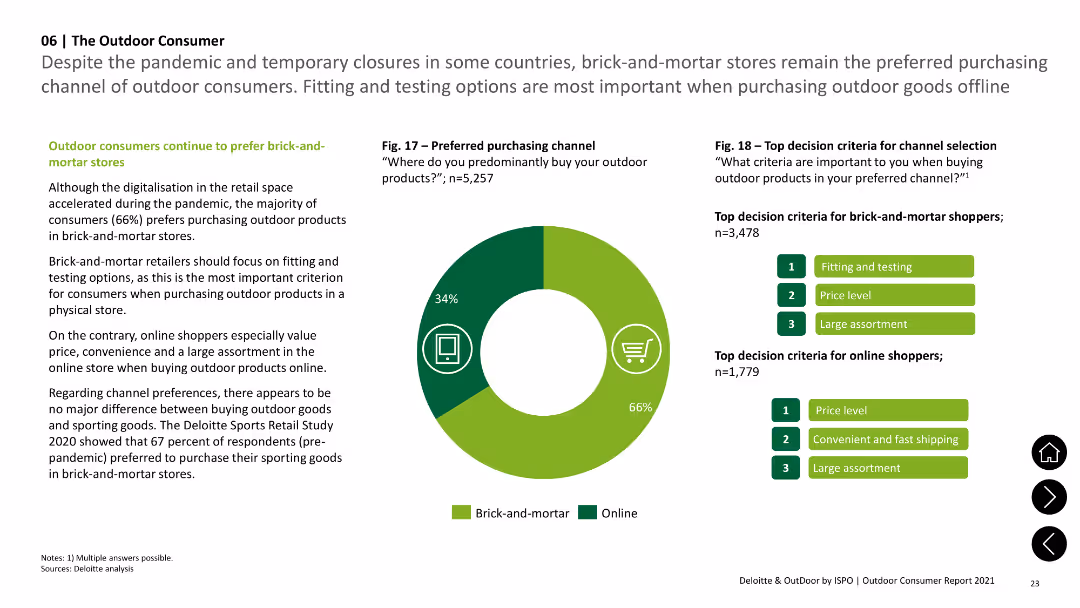
Pie chart and column chart showing preferred purchasing channels (brick-and-mortar vs online) and top decision criteria.
Market Analysis and Trends
Consumer Goods
Describes preferred channels for purchasing outdoor products and key decision criteria, highlighting a preference for brick-and-mortar stores.
Purchasing, Channels, Criteria, Consumer, Preferences
false
Market Analysis and Trends
Consumer Goods
Mixed Chart
Deloitte
Add to my slides
Remove from favorites
Features scatter plots and other visual representations to show various applications of the Purchasing Chessboard® in different contexts.
Market Analysis and Trends
Professional Services
Demonstrates diverse applications of the Purchasing Chessboard® in managing procurement stakeholders and category profiles.
Purchasing Chessboard, applications, procurement, stakeholders, category profiles, scatter plots, visual representation
false
Market Analysis and Trends
Professional Services
Uncategorized
Kearney
Add to my slides
Remove from favorites
Contains matrix-style charts showing the usage of Purchasing Chessboard® levers among leaders and typical companies.
Market Analysis and Trends
Professional Services
Compares the systematic use of Purchasing Chessboard® levers between leading companies and typical firms, highlighting differences.
Purchasing Chessboard, levers, market analysis, trends, procurement, leaders, companies, comparison, matrix charts
false
Market Analysis and Trends
Professional Services
Multiple Chart
Kearney
Add to my slides
Remove from favorites
A detailed step-by-step diagram explaining the 7-step strategic sourcing process, with annotations for each step.
Strategic Planning
Professional Services
Illustrates how the Purchasing Chessboard® is applied in strategic sourcing projects, providing a structured process overview.
Purchasing Chessboard, strategic sourcing, process, steps, procurement, planning, structured process, annotations
false
Strategic Planning
Professional Services
Linear Flow
Kearney
Add to my slides
Remove from favorites
Weighted average score table showing the influence of different hospital departments on purchasing decisions.
Market Analysis and Trends
Healthcare & Pharmaceuticals
This slide shows the influence levels of hospital departments on purchasing decisions in various APAC markets.
purchasing decisions, hospital, influence, APAC, MedTech
false
Market Analysis and Trends
Healthcare & Pharmaceuticals
Table
LEK
Add to my slides
Remove from favorites
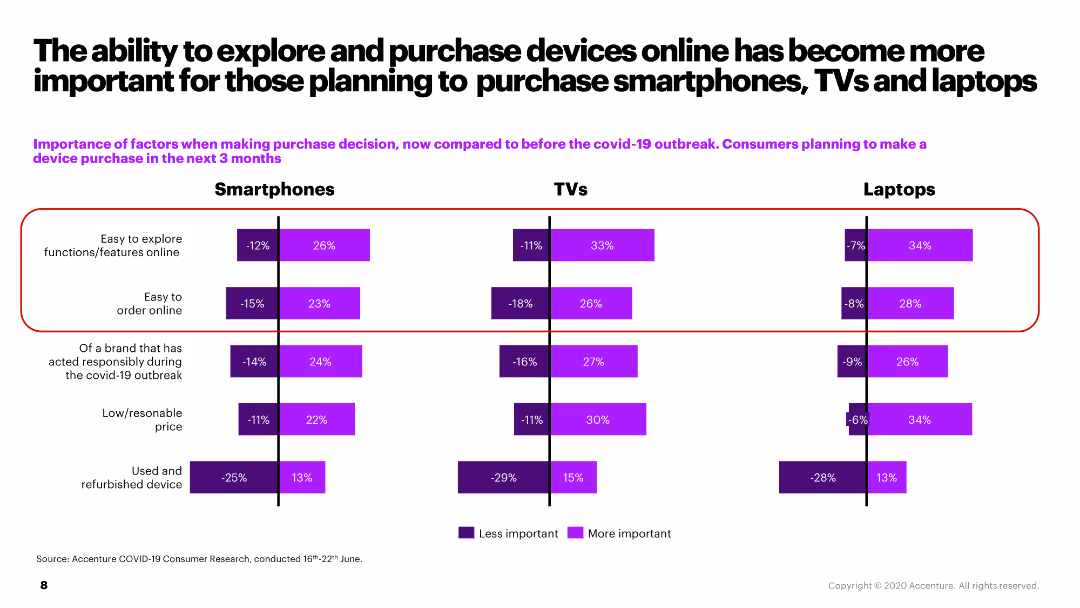
The slide contains comparative bar charts indicating the importance of various factors in purchasing decisions for smartphones, TVs, and laptops before and after COVID-19.
Market Analysis and Trends
Retail & E-commerce
The slide evaluates the changing importance of factors such as price, brand, and ease of online exploration in purchasing decisions for electronics post-COVID-19.
purchasing decisions, online shopping, COVID-19, consumer electronics, market factors
false
Market Analysis and Trends
Retail & E-commerce
Multiple Chart
Accenture
Add to my slides
Remove from favorites
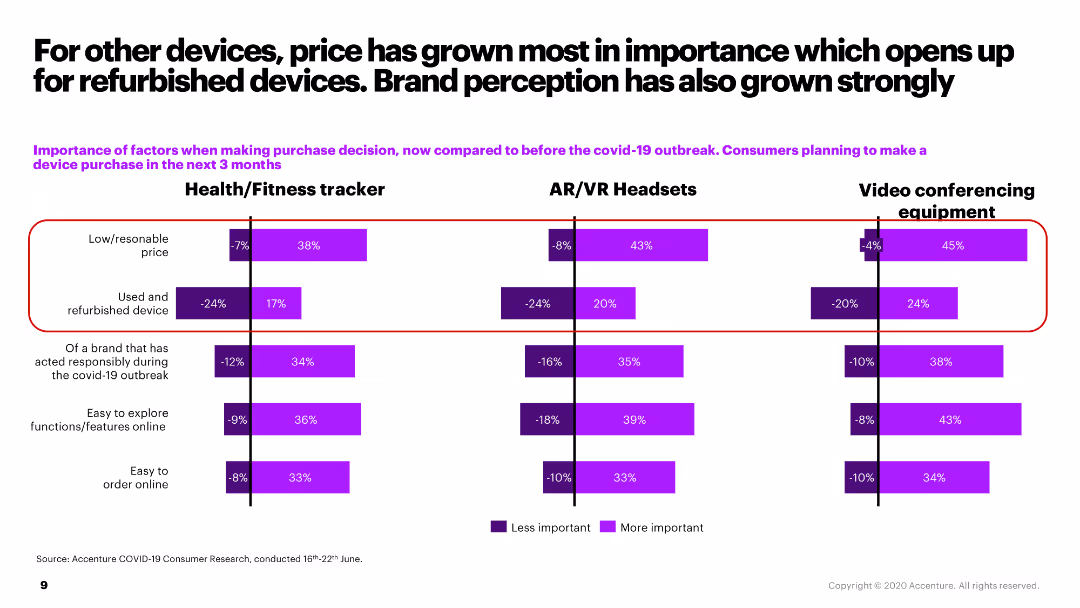
The slide includes bar charts comparing the importance of various factors in purchasing health/fitness trackers, AR/VR headsets, and video conferencing equipment pre- and post-COVID-19.
Market Analysis and Trends
Retail & E-commerce
The slide discusses the increased importance of price and brand perception in purchasing decisions for various electronic devices, focusing on the impact of COVID-19.
purchasing decisions, price, brand perception, COVID-19, electronics
false
Market Analysis and Trends
Retail & E-commerce
Multiple Chart
Accenture
Add to my slides
Remove from favorites
The slide uses a balanced layout with icons, images, and text to explain the process. On the left, there are two icons (a clipboard and a database) with text. In the middle, an image of an iPad displaying a chessboard. On the right, icons for recommendations and expert insights.
Operational Efficiency
Professional Services
The slide describes how Kearney's Digitized Purchasing Chessboard leverages category intelligence from databases and questionnaires to provide strategic recommendations and implementation guidance, aiming for improved purchasing decisions.
purchasing, digitization, Kearney, strategic, insights
false
Operational Efficiency
Professional Services
Header Horizontal
Kearney
Add to my slides
Remove from favorites
This slide includes a bar chart showing the percentage of respondents standardizing the purchase of various medical supplies and equipment across regions.
Operational Efficiency
Healthcare & Pharmaceuticals
This slide highlights the trend of hospitals standardizing purchasing practices for medical consumables and equipment, with a regional comparison of priorities.
purchasing standardization, medical supplies, diagnostic equipment, hospital priorities, regional comparison
false
Operational Efficiency
Healthcare & Pharmaceuticals
Single Chart
LEK
Add to my slides
Remove from favorites
Features column charts comparing purchasing behavior across different demographics.
Market Analysis and Trends
Retail & E-commerce
Explores purchasing trends for special edition luxury products, highlighting the strong market response in younger demographics and in China.
Purchasing trends, luxury products, special editions, demographics, younger consumers, China, consumer behavior
false
Market Analysis and Trends
Retail & E-commerce
Multiple Chart
BCG
Add to my slides
Remove from favorites
This slide includes multiple column charts comparing valuation multiples pre- and post-spin, and P/E multiple differentials of S&P 500 reporting segments. It uses color coding and arrows for emphasis.
Strategic Planning
Financial Services
The slide discusses the benefits of creating pure play entities for shareholders, showing how these strategies impact valuation multiples and market transparency.
pure play, valuation multiples, strategy
false
Strategic Planning
Financial Services
Multiple Chart
JP Morgan
Add to my slides
Remove from favorites
The slide features a pie chart and text describing the impact of purpose-driven campaigns in France, showing significant sales boosts. The layout is moderately detailed.
Market Analysis and Trends
Professional Services
This slide presents the success of purpose-driven campaigns in France, highlighting that 30% of these campaigns significantly boosted short-term sales, supported by case studies and statistics.
purpose-driven campaigns, France, sales boost, marketing, case studies
false
Market Analysis and Trends
Professional Services
Mixed Chart
Nielsen
Add to my slides
Remove from favorites
Previous
Next
You don't have any favorites yet.
Please wait loading your favorites slides...
Create a FREE account to continue browsing
Receive Instant Access to 1,000+ slides from companies like McKinsey, Google, and Goldman Sachs
First Name
Last Name
Email
Password
I agree to all
Terms & Privacy Policy
Thank you! Your submission has been received!
Oops! Something went wrong while submitting the form.
Have an account?
Sign in
Upgrade to PRO to Save slides
Advanced Search and Filters
Access to 15,000+ slides
Access to Category Pages
Save/Bookmark Slides
PowerPoint Template Library
Pick a Plan
MONTHLY
$12/month
Billed every month, Cancel anytime.
YEARLY
$9/year
Billed $108 annually, Cancel anytime.
Checkout for $12/month
Checkout for $108/yr
Secured by Stripe | AES-256 bit encryption


![How concerned are you...about climate change in [COUNTRY]](https://cdn.prod.website-files.com/654e70fb59937215cac87b19/6899c23dd3264f77333d4ac6_pdR1_8Vcqziq7pVBxC8DohIbbNS24TX5IukIgqLM9zk.avif)