My Account
My Slides
Search by Category
Pricing
Templates
View All Templates
Download Template Slides
✦ AI Search
Feedback
Login
Logout
Get Started
Browse all Slides
Browse all Slides
Create a FREE Account
Instant access to 1,000+ real slides from top companies like McKinsey, BCG, Goldman Sachs, Google and many more!
First Name
Last Name
Email
Password
I agree to all
Terms & Privacy Policy
Thank you! Your submission has been received!
Oops! Something went wrong while submitting the form.
Have an account?
Sign in
Saved Slides
Total No. of slides saved
0
↻ Refresh
✖ Clear all
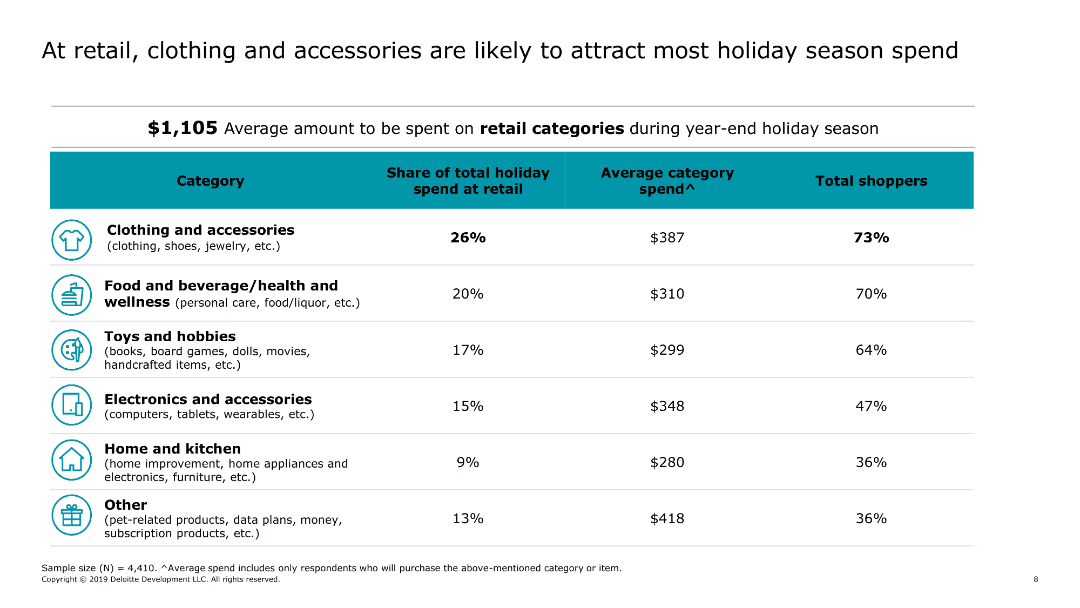
Displays a table with spending categories and a bar chart indicating the average spend and shopper percentages.
Market Analysis and Trends
Retail & E-commerce
Provides a breakdown of retail spending categories during the holiday season, with a focus on clothing and accessories, and the average amount spent in each category.
retail, holiday, spending, clothing, accessories, categories, average
false
Market Analysis and Trends
Retail & E-commerce
Table
Deloitte
Add to my slides
Remove from favorites
The slide features text and charts depicting discretionary spending trends and a model for cracking the retail market in India.
Market Analysis and Trends
Retail & E-commerce
This slide explores the retail market in India, focusing on discretionary spending trends and strategic models for market entry and growth.
Retail, India, Discretionary Spending, Market Analysis, Trends, Model, Strategy, Growth, Investment, Consumer
false
Market Analysis and Trends
Retail & E-commerce
Mixed Chart
Morgan Stanley
Add to my slides
Remove from favorites
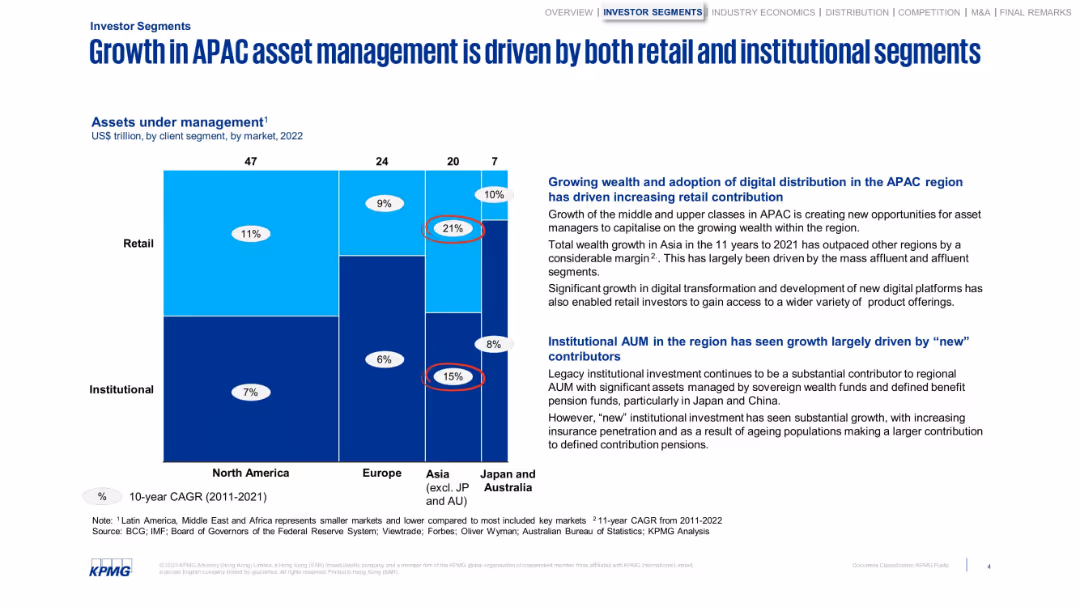
Grid visualization by region and client segment, supported by side analysis text.
Customer and Market Segmentation
Financial Services
Visualizes how APAC asset management benefits from both institutional and retail contributions. Points out rising digital access and growing affluence as retail drivers, with institutional strength from sovereign and pension funds.
retail, institutional, asset management, APAC, digital, pensions
false
Customer and Market Segmentation
Financial Services
Mixed Chart
KPMG
Add to my slides
Remove from favorites
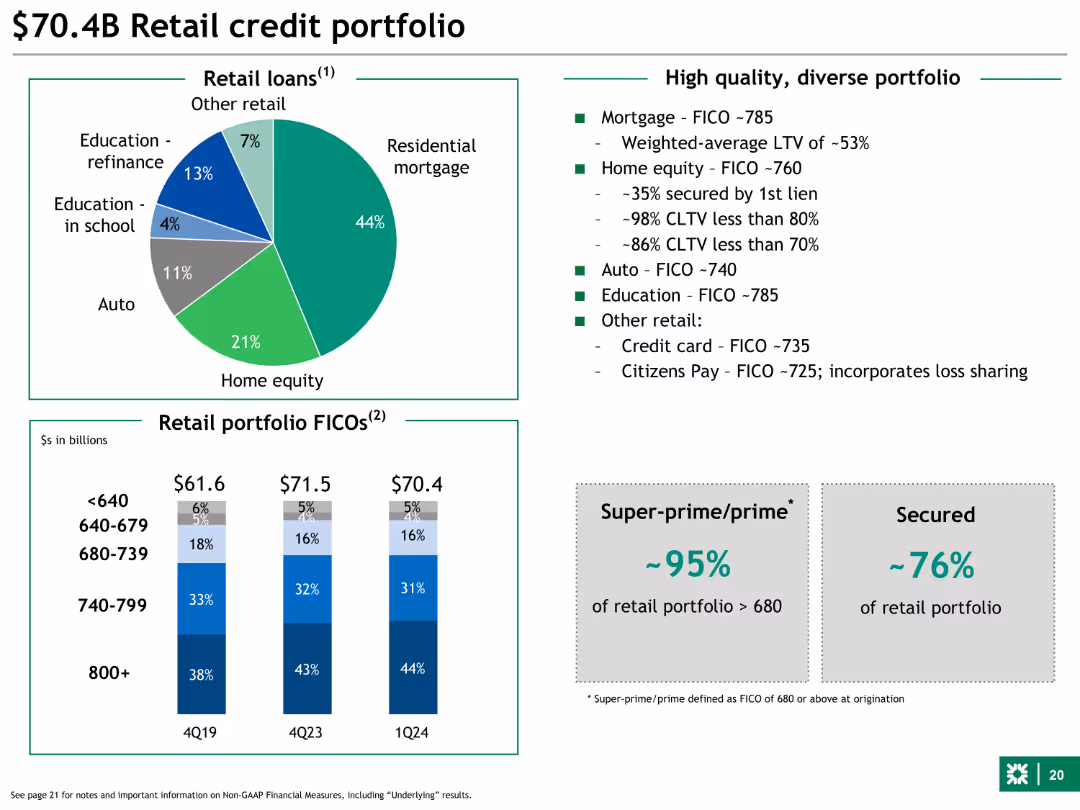
This slide features a pie chart and a column chart. The pie chart breaks down the retail loans by category, and the column chart shows the distribution of retail portfolio FICO scores across different time periods. The slide is moderately dense with detailed textual information.
Financial Performance
Financial Services
The slide provides a detailed breakdown of the retail credit portfolio, highlighting the composition of retail loans and FICO score distributions. It emphasizes the high-quality, diverse nature of the portfolio and mentions specific FICO scores for different loan categories.
Retail loans, FICO scores, mortgage, home equity, auto
false
Financial Performance
Financial Services
Multiple Chart
Barclays
Add to my slides
Remove from favorites
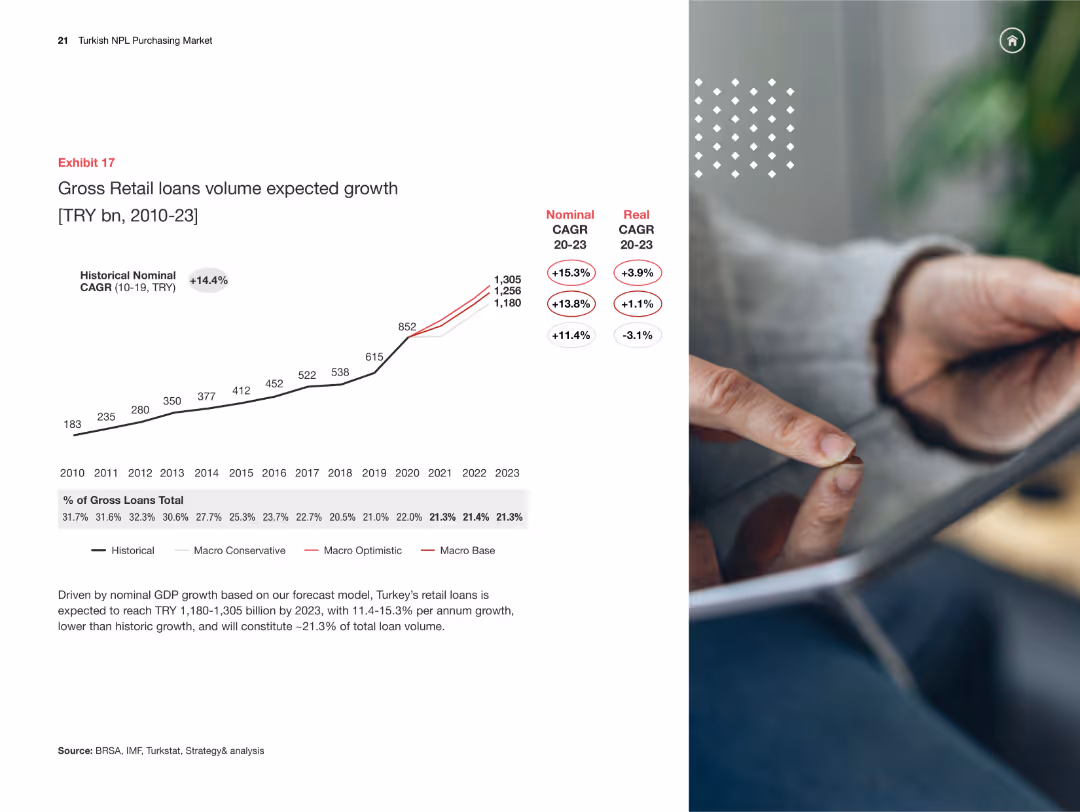
Line chart predicting gross retail loans volume growth from 2010-2023, with various growth scenarios.
Market Analysis and Trends
Financial Services
The slide projects the growth of retail loan volumes in Turkey from 2010-2023, analyzing different growth rates and economic conditions.
retail loans, growth forecast, macroeconomic analysis, financial trends, Turkey
false
Market Analysis and Trends
Financial Services
Mixed Chart
PwC/Strategy&
Add to my slides
Remove from favorites
Contains diagrams and pie chart describing changes in retail strategies for the luxury market from 2019 to 2025F.
Strategic Planning
Retail & E-commerce
Discusses the need for luxury retailers to adapt to new consumer behaviors by rethinking store roles and customer experiences.
retail, luxury, transformation, 2025, strategy
false
Strategic Planning
Retail & E-commerce
Multiple Chart
Bain
Add to my slides
Remove from favorites
Column chart and pie chart, clean design with green and blue accents.
Customer and Market Segmentation
Retail & E-commerce
Discusses the optimism among retail executives for revenue growth and challenges in 2022.
retail, market trends, revenue growth, executive outlook
false
Customer and Market Segmentation
Retail & E-commerce
Multiple Chart
Deloitte
Add to my slides
Remove from favorites
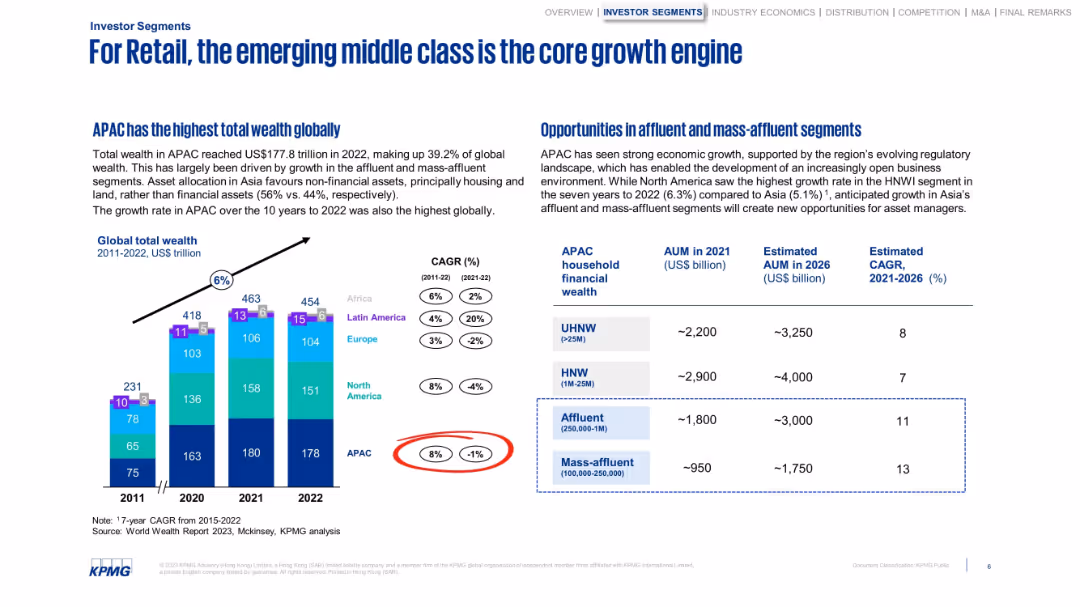
Combination of stacked bar chart and table on household wealth. Balanced layout with growth stats.
Market Analysis and Trends
Financial Services
Discusses APAC's dominance in global wealth and emphasizes the growing affluent and mass-affluent retail segments. It projects AUM growth and highlights favorable demographic and regulatory trends for asset managers.
retail, mass affluent, HNW, AUM, APAC, growth engine
false
Market Analysis and Trends
Financial Services
Mixed Chart
KPMG
Add to my slides
Remove from favorites
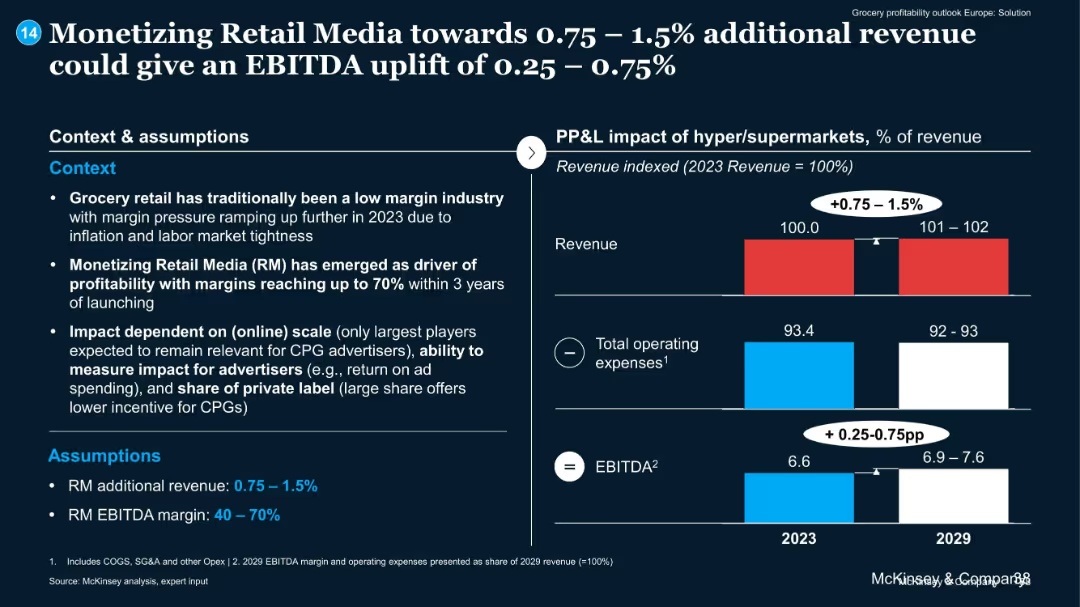
Split layout; left side with bulleted context & assumptions; right side features bar chart comparing 2023 vs 2029 metrics
Strategic Planning
Retail & E-commerce
The slide explains how monetizing retail media (RM) can yield an EBITDA uplift of 0.25–0.75%, driven by additional revenue (0.75–1.5%) and high margins. It highlights dependency on online scale, advertiser impact measurement, and private label share.
Retail Media, EBITDA, Monetization, CPG, Private Label, Profitability
false
Strategic Planning
Retail & E-commerce
Mixed Chart
McKinsey
Add to my slides
Remove from favorites
Complex layout with flow charts and diagrams similar to slide 6091.
Market Analysis and Trends
Retail & E-commerce
Reiterates the methodology for retail sales calculations, combining various sources of revenue to assess total market sales.
retail, methodology, sales, market analysis, charts
false
Market Analysis and Trends
Retail & E-commerce
Mixed Chart
Bain
Add to my slides
Remove from favorites
The slide presents a complex layout with multiple flow charts and column chart.
Market Analysis and Trends
Retail & E-commerce
This slide illustrates the methodology for calculating sales in the retail industry, incorporating retail, wholesale, and licenses into total sales figures.
retail, methodology, sales, wholesale, licenses, diagrams
false
Market Analysis and Trends
Retail & E-commerce
Mixed Chart
Bain
Add to my slides
Remove from favorites
This slide contains three overlaid line charts comparing projected recovery trajectories for various retail sectors in New York. It uses different colors for each line, with annotations explaining key points.
Strategic Planning
Retail & E-commerce
This slide predicts the retail recovery in New York post-lockdown, focusing on essential and non-essential retailers. It provides insights into the expected timeline for recovery and the ongoing impact of social distancing measures on physical retail spaces.
Retail, New York, Recovery, Projections, COVID-19
false
Strategic Planning
Retail & E-commerce
Mixed Chart
BCG
Add to my slides
Remove from favorites
Column chart projecting net retail NPL inflow volume from 2010-2023, under different economic scenarios.
Market Analysis and Trends
Financial Services
This slide forecasts net retail NPL inflow volumes in Turkey from 2010-2023, considering multiple growth scenarios.
retail NPL, growth forecast, economic scenarios, financial trends, Turkey
false
Market Analysis and Trends
Financial Services
Mixed Chart
PwC/Strategy&
Add to my slides
Remove from favorites
The slide contains a column chart illustrating retail NPL sales volumes from 2010 to 2023. Different colors represent optimistic, base, and conservative growth projections.
Market Analysis and Trends
Financial Services
This slide provides projections for retail NPL sales volumes in Turkey from 2010 to 2023, with different scenarios reflecting optimistic, base, and conservative growth rates.
retail NPL, growth, Turkey, projections, scenarios
false
Market Analysis and Trends
Financial Services
Mixed Chart
PwC/Strategy&
Add to my slides
Remove from favorites
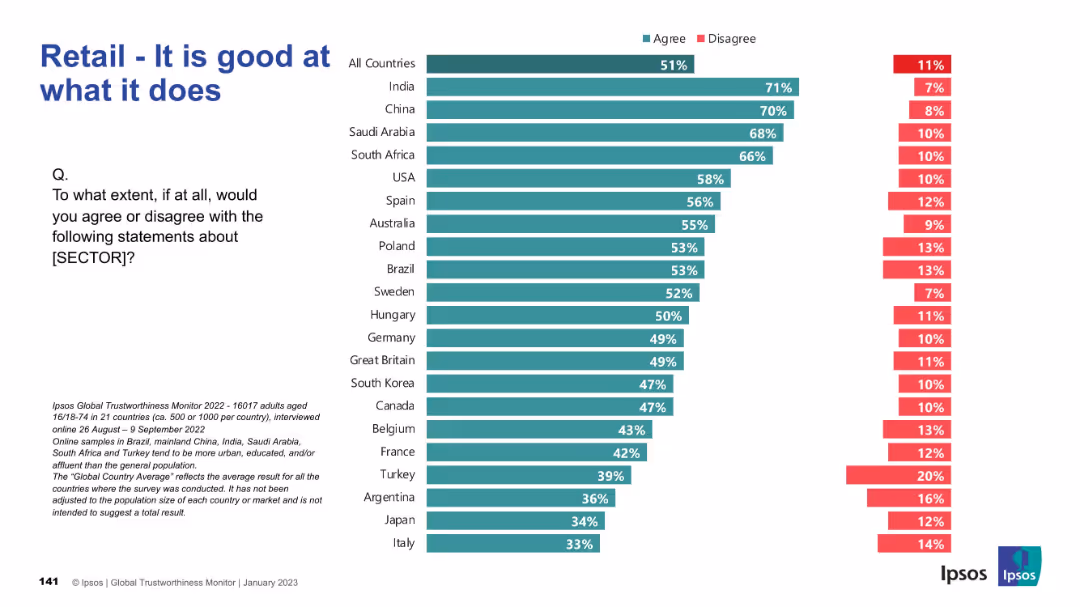
Horizontal bar chart on the competence of the retail sector as perceived by consumers in different countries.
Market Analysis and Trends
Retail & E-commerce
This slide displays international public perception on the competency and effectiveness of the retail sector, based on survey results from 21 countries.
retail, performance, competence, Ipsos, consumer view, global survey, public opinion, efficiency, trust
false
Market Analysis and Trends
Retail & E-commerce
Mixed Chart
IPSOS
Add to my slides
Remove from favorites
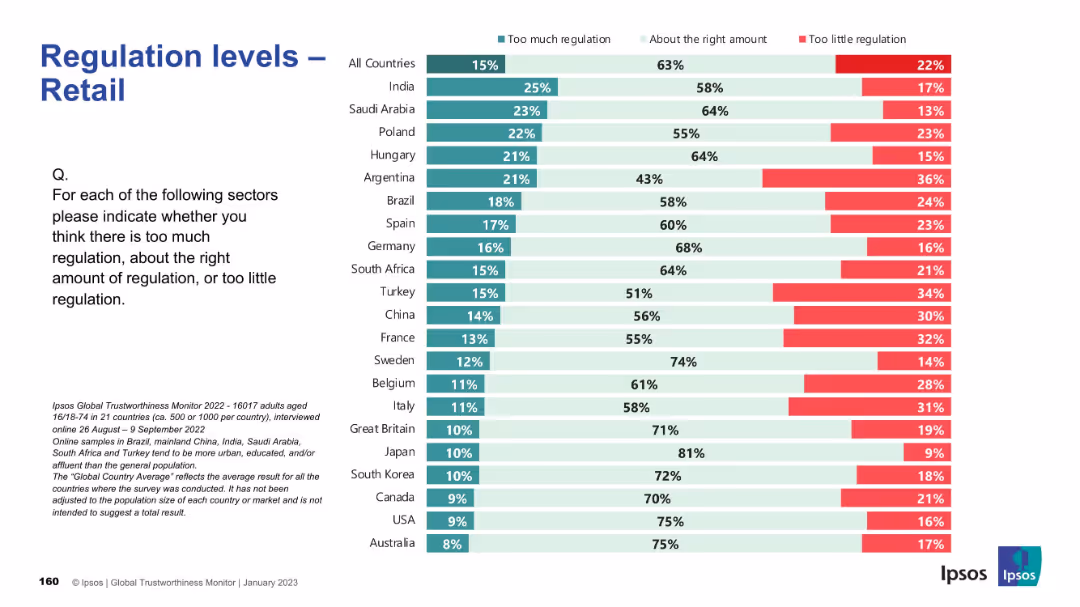
Horizontal bar chart with percentage breakdowns; question text on the left; countries sorted by regulation view.
Regulatory and Compliance
Retail & E-commerce
The retail sector is largely seen as having appropriate levels of regulation globally. However, Argentina, Turkey, and France show above-average concern for too little regulation, while countries like Japan and Great Britain are more confident about current regulations.
retail, regulation, e-commerce, governance, Ipsos survey, policy compliance, international views, oversight, consumer goods
false
Regulatory and Compliance
Retail & E-commerce
Mixed Chart
IPSOS
Add to my slides
Remove from favorites
Diagram outlining the methodology for calculating retail equivalent value of sales, integrating retail, wholesale, and licenses.
Operational Efficiency
Retail & E-commerce
Explains the comprehensive approach to estimating retail sales for business analysis, including both bottom-up and top-down estimates to ensure accuracy.
Retail, Sales Analysis, Methodology
false
Operational Efficiency
Retail & E-commerce
Mixed Chart
Bain
Add to my slides
Remove from favorites
Features detailed table by sector (like apparel, food) showing sales changes in multiple countries.
Strategic Planning
Retail & E-commerce
Provides a deep dive into how retail subsectors are recovering across different regions, focusing on year-over-year sales data.
retail, sales, comparison, recovery
false
Strategic Planning
Retail & E-commerce
Table
BCG
Add to my slides
Remove from favorites
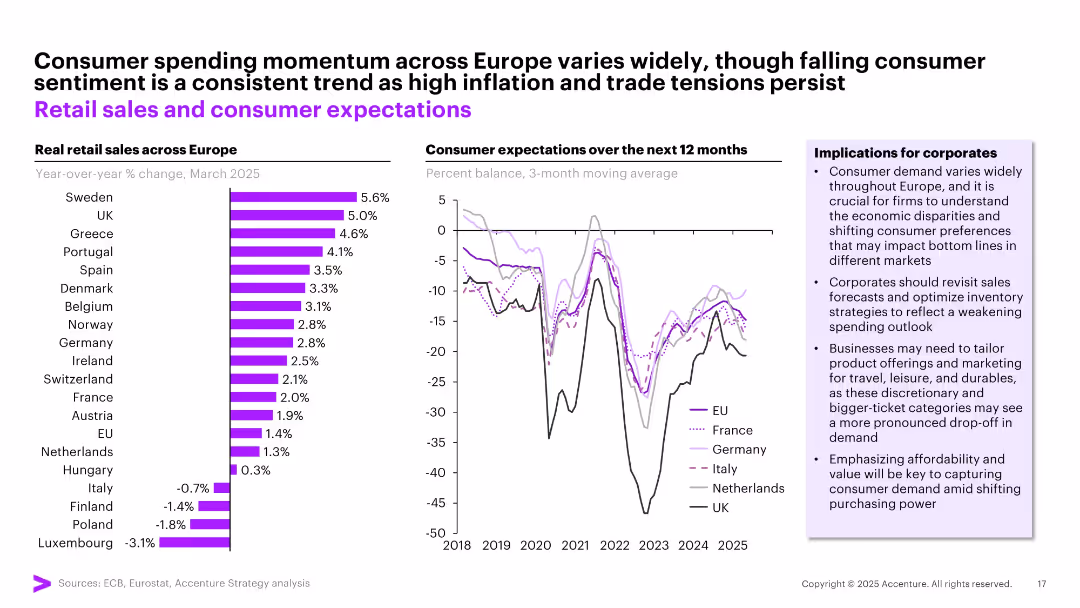
Split panel layout with a bar chart (left) for retail sales growth by country and a line chart (right) for consumer expectations; side box outlines business implications.
Market Analysis and Trends
Retail & E-commerce
This slide contrasts consumer spending momentum and sentiment across European countries. While retail sales vary widely (Sweden, UK lead; Italy, Poland lag), sentiment is generally declining. Corporates are advised to revisit sales strategies and tailor offerings to local economic conditions.
retail sales, consumer sentiment, Europe, spending trends, inflation, economic disparity
false
Market Analysis and Trends
Retail & E-commerce
Multiple Chart
Accenture
Add to my slides
Remove from favorites
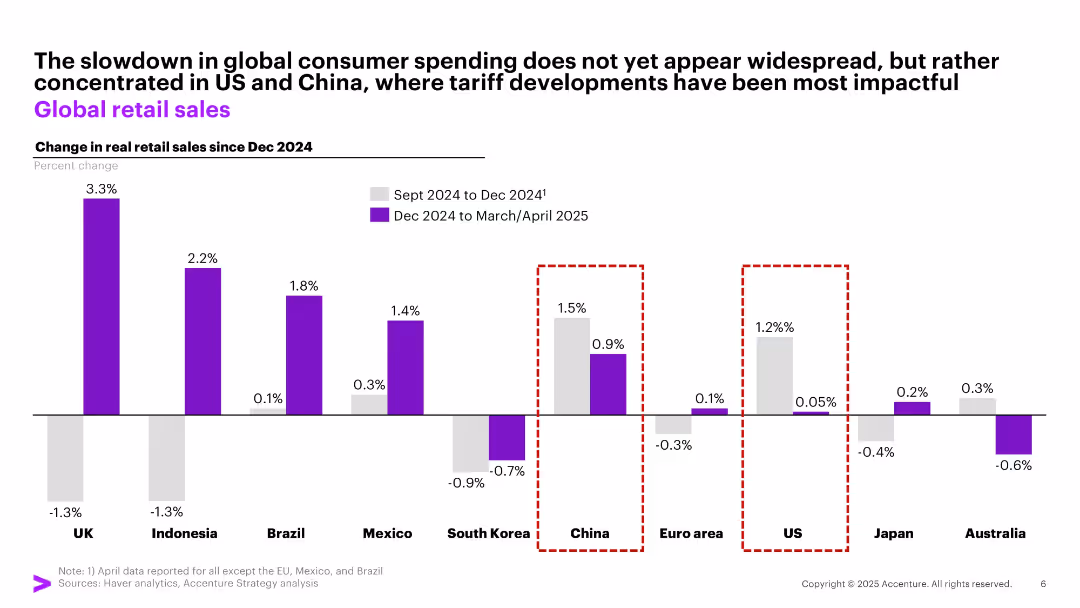
Vertical bar chart comparing retail sales growth between two time periods (Sept–Dec 2024 vs. Dec–Mar/Apr 2025) by country.
Market Analysis and Trends
Retail & E-commerce
Shows that retail slowdown is not global but focused in the US and China. UK and Brazil show positive growth. Tariff implications are visually highlighted to explain discrepancies in performance between countries.
retail sales, consumer spending, tariffs, global economy, trends
false
Market Analysis and Trends
Retail & E-commerce
Single Chart
Accenture
Add to my slides
Remove from favorites
This slide displays a grid of colored boxes representing the growth of retail goods sales excluding auto and fuel across multiple countries (China, Japan, US, UK, Italy, Sweden). Each box corresponds to a month from January to July, color-coded based on the percentage change in sales compared to the previous year. The slide is visually organized to allow quick scanning of data across different months and countries, providing a snapshot of the retail sector's performance during the pandemic.
Market Analysis and Trends
Retail & E-commerce
The slide provides a visual summary of how retail sectors in various countries are recovering from the impacts of COVID-19, highlighting fluctuations in consumer spending and economic recovery. It is particularly useful for retailers and e-commerce platforms to analyze market conditions and consumer behavior trends, assisting in inventory and marketing strategies. This overview supports strategic decisions by showing which markets are rebounding and which remain subdued, enabling better resource allocation and promotional planning.
retail sales, COVID-19, economic recovery, consumer behavior, market analysis, e-commerce, strategic planning
false
Market Analysis and Trends
Retail & E-commerce
Table
BCG
Add to my slides
Remove from favorites
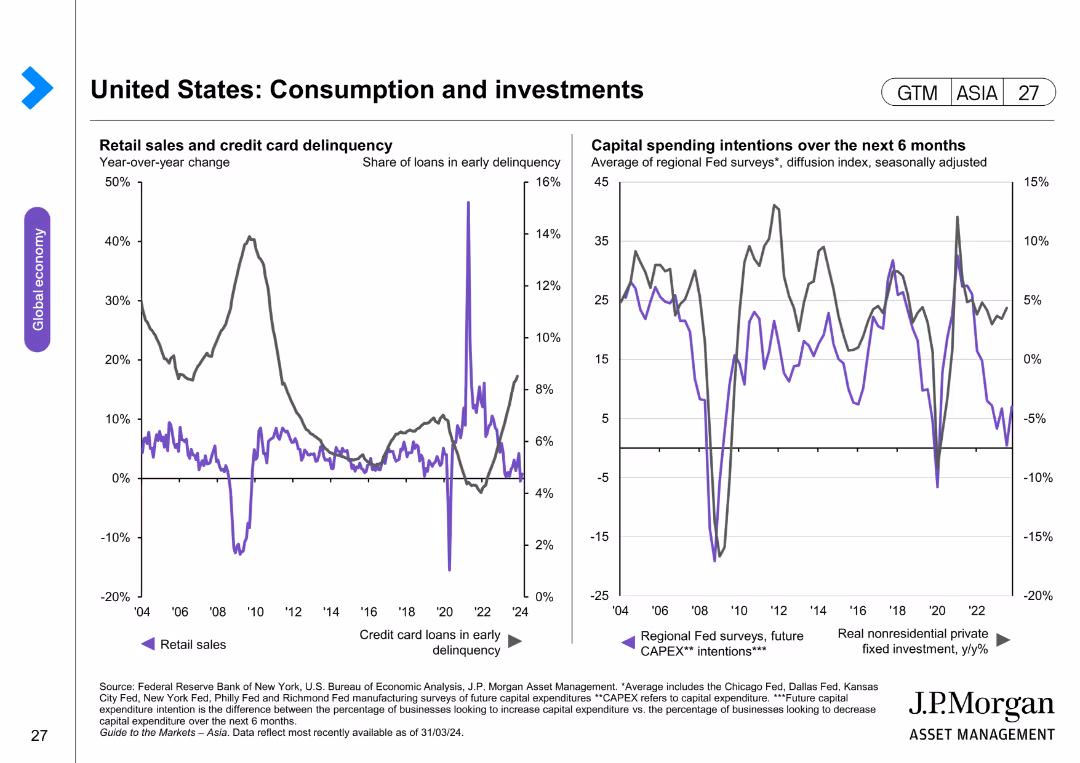
The slide features two line charts: one showing retail sales and credit card delinquency, and another showing capital spending intentions. The layout is moderately complex.
Market Analysis and Trends
Financial Services
This slide evaluates trends in retail sales, credit card delinquencies, and capital spending intentions over time, highlighting significant changes and patterns.
retail sales, credit card delinquency, capital spending, economic trends, consumer behavior
false
Market Analysis and Trends
Financial Services
Multiple Chart
JP Morgan
Add to my slides
Remove from favorites
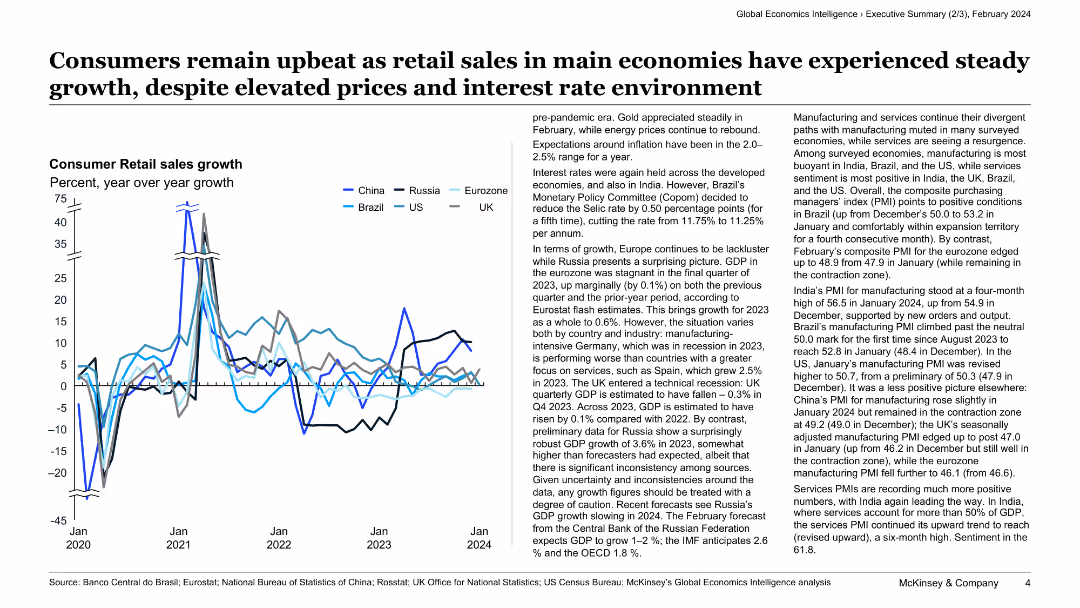
The slide features a line chart showing retail sales growth across different countries, alongside a text summary of economic conditions.
Market Analysis and Trends
Consumer Goods
This slide highlights the steady growth in retail sales in major economies, despite elevated prices and interest rates, illustrated with a line chart showing year-over-year growth data.
retail sales, growth, economies, consumer goods, market analysis, trends, interest rates, prices, economic conditions, overview
false
Market Analysis and Trends
Consumer Goods
Mixed Chart
McKinsey
Add to my slides
Remove from favorites
The slide includes multiple bar graphs broken down by retail categories (food & beverage, personal care, apparel, home appliances) showing year-over-year sales changes for China. Each graph is color-coded and labeled with monthly data from February to July, providing a detailed look at specific segments within the retail market. The layout allows for easy comparison across categories, highlighting trends and shifts in consumer purchasing behavior during the pandemic.
Market Analysis and Trends
Retail & E-commerce
This detailed slide analyzes China's retail sales by category, offering insights into consumer preferences and shifts in spending during COVID-19. It is beneficial for market analysts and retail managers to identify which categories are experiencing growth or decline, aiding in targeted marketing and inventory management. The breakdown by month and category enables precise strategic planning and forecasting, essential for optimizing operations and maximizing sales in a volatile market environment.
retail sales, market analysis, COVID-19, China, consumer behavior, strategic planning, category analysis
false
Market Analysis and Trends
Retail & E-commerce
Table
BCG
Add to my slides
Remove from favorites
Features a flowchart diagram explaining consolidated sales calculation with side texts detailing the methodology, visual elements include grey column chart and red arrows for direction.
Market Analysis and Trends
Professional Services
This slide explains the methodology used for calculating player sales at retail value through various components like retail, wholesale, and licenses. Useful in understanding market analysis and sales reporting.
retail sales, methodology, market analysis, consolidation, retail value, sales, wholesale, licenses
false
Market Analysis and Trends
Professional Services
Mixed Chart
Bain
Add to my slides
Remove from favorites
Comparative charts illustrating retail sales changes across various categories and countries, color-coded by percentage change.
Market Analysis and Trends
Retail & E-commerce
Discusses recovery in retail sectors across different regions, highlighting differences in consumer spending patterns post-pandemic.
retail sales, recovery trends, consumer spending, market analysis, COVID-19 impact
false
Market Analysis and Trends
Retail & E-commerce
Table
BCG
Add to my slides
Remove from favorites
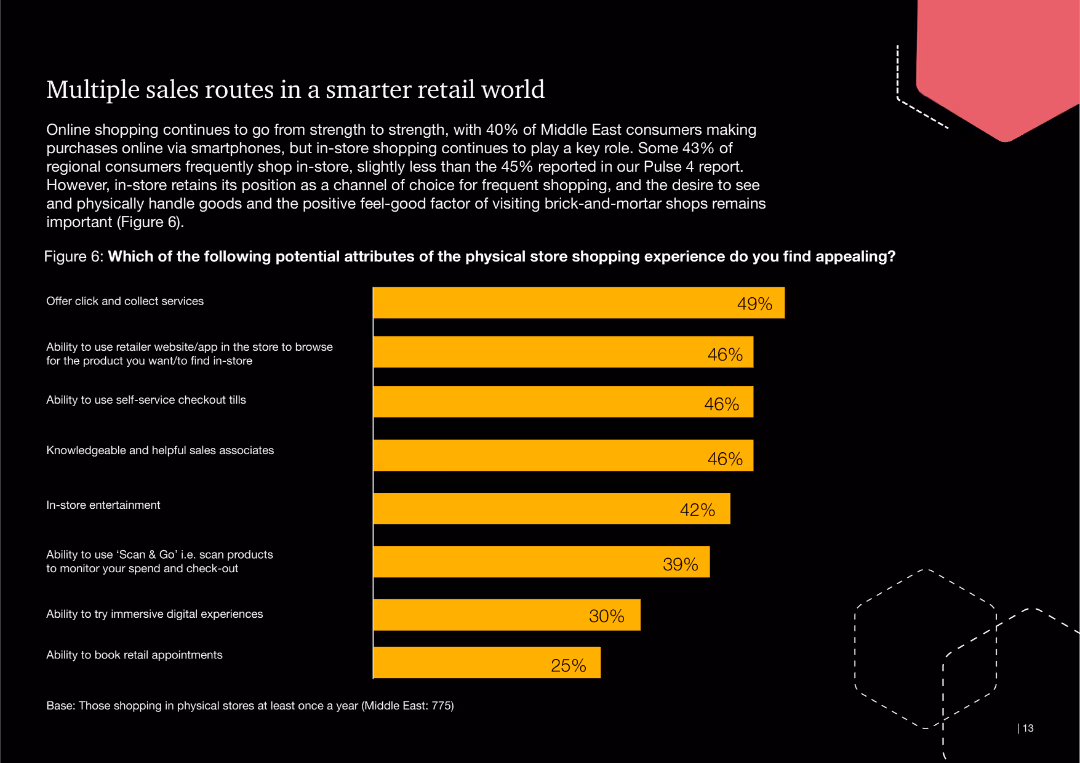
This slide includes a bar chart listing potential attributes of the physical store shopping experience that consumers find appealing, such as click-and-collect services and self-service checkouts.
Technology and Digital Transformation
Retail & E-commerce
The slide discusses the importance of various physical store features that appeal to consumers, emphasizing the role of digital tools and services in enhancing the retail experience.
retail, sales routes, physical store, consumer, click-and-collect, self-service
false
Technology and Digital Transformation
Retail & E-commerce
Single Chart
PwC/Strategy&
Add to my slides
Remove from favorites
Multiple line graphs track retail goods sales, excluding auto and fuel, across various countries.
Strategic Planning
Retail & E-commerce
Discusses the shift in retail sales during the pandemic, comparing growth or decline across months and countries, offering insights into consumer behavior changes.
retail sales, trends, pandemic, analysis
false
Strategic Planning
Retail & E-commerce
Table
BCG
Add to my slides
Remove from favorites
Uses dual-line graphs to contrast online and offline retail trends. The layout is clean, with markers for the lockdown period.
Market Analysis and Trends
Retail & E-commerce
Evaluates the shift in retail sales channels due to COVID-19, emphasizing the growth of online retail and decline in offline sales.
retail shift, online sales, offline sales, COVID-19 impact
true
Market Analysis and Trends
Retail & E-commerce
Single Chart
BCG
Add to my slides
Remove from favorites
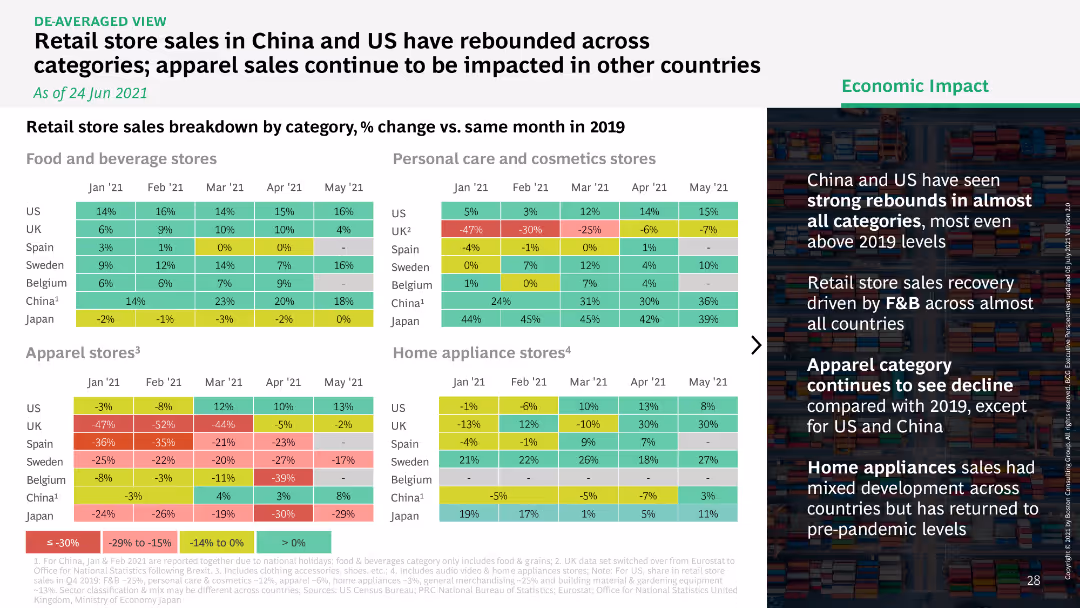
Heatmap comparing retail store sales by category in multiple countries, showing percentage change versus 2019.
Market Analysis and Trends
Retail & E-commerce
Highlights the rebound in retail store sales across categories in China and the US, while apparel sales in other countries continue to struggle.
retail store, sales rebound, categories, China
false
Market Analysis and Trends
Retail & E-commerce
Table
BCG
Add to my slides
Remove from favorites
A line chart comparing sectors such as CGS, Auto/IE, LS/Pharma/Biotech, Retail, and Travel/Hospitality in terms of leadership behaviors related to I&D.
Strategic Planning
Retail & E-commerce
Analyzes retail sector's performance in managing talent pipelines and recognizing I&D efforts compared to other sectors.
retail, talent pipelines, I&D, sector comparison, leadership behavior, line chart, performance analysis
false
Strategic Planning
Retail & E-commerce
Mixed Chart
Accenture
Add to my slides
Remove from favorites
Features a multi-line chart showing percentages of talent retention strategies across industries. Icons represent different strategies at the top. Each line represents a sector with clear color coding.
Strategic Planning
Retail & E-commerce
Focuses on how retail industry's talent retention strategies align with other sectors, including CGS, Auto/IE, LS/Pharma/Biotech, and Travel/Hospitality, in foundational, programmatic, strategic, and integrated categories.
Retail, Talent Retention, Consistency, Industries, Strategies, Foundational, Programmatic, Strategic, Integrated
false
Strategic Planning
Retail & E-commerce
Mixed Chart
Accenture
Add to my slides
Remove from favorites
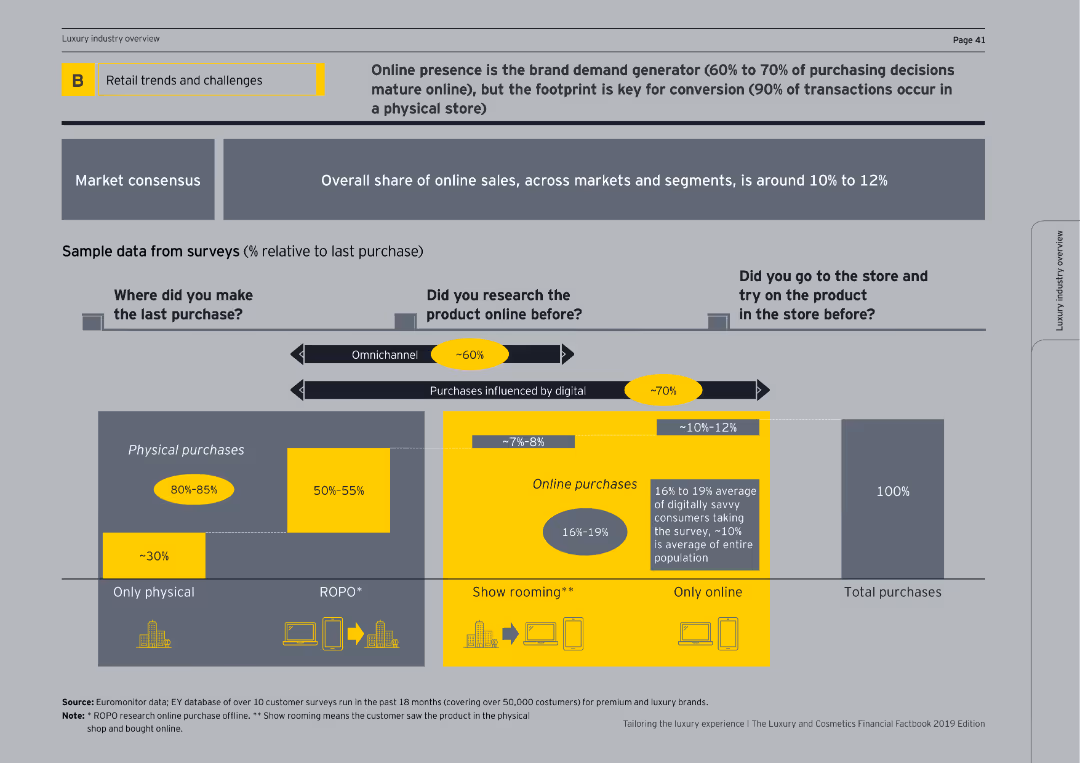
This slide includes multiple bar charts showing market consensus and online vs. physical purchase behaviors, segmented by various purchase scenarios.
Market Analysis and Trends
Retail & E-commerce
Examines the trends and challenges in retail, focusing on the impact of online presence and physical store experiences on purchasing decisions.
retail trends, challenges, online presence, physical purchases, market consensus, bar charts, omnichannel, show rooming, e-commerce, consumer behavior
false
Market Analysis and Trends
Retail & E-commerce
Single Chart
EY
Add to my slides
Remove from favorites
Uses line charts and column charts to show trends in fashion and accessories store traffic and the net openings of luxury retail stores from 2012 to 2018.
Strategic Planning
Retail & E-commerce
Analyzes the declining trend in physical store traffic and the consequent reduction in luxury retail store openings, predicting a reshaping of the role of physical stores in the luxury market.
Retail Trends, Store Traffic, Luxury Market, Store Openings
false
Strategic Planning
Retail & E-commerce
Multiple Chart
Bain
Add to my slides
Remove from favorites
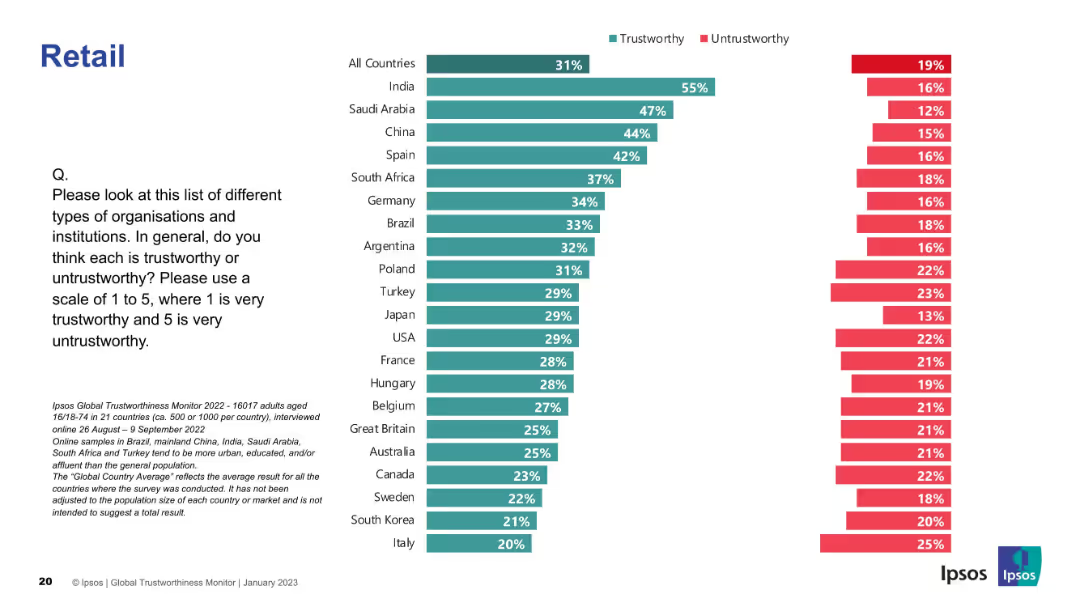
Bar graph layout; trust levels across countries in retail sector; uses standard green/red coding.
Market Analysis and Trends
Retail & E-commerce
The slide analyzes public trust in the retail sector globally. India, Saudi Arabia, and China rank highest for trust; Italy and South Korea are lower.
retail, trust, perception, global survey, Ipsos, countries, ranking, consumer opinion, trustworthy, untrustworthy
false
Market Analysis and Trends
Retail & E-commerce
Mixed Chart
IPSOS
Add to my slides
Remove from favorites
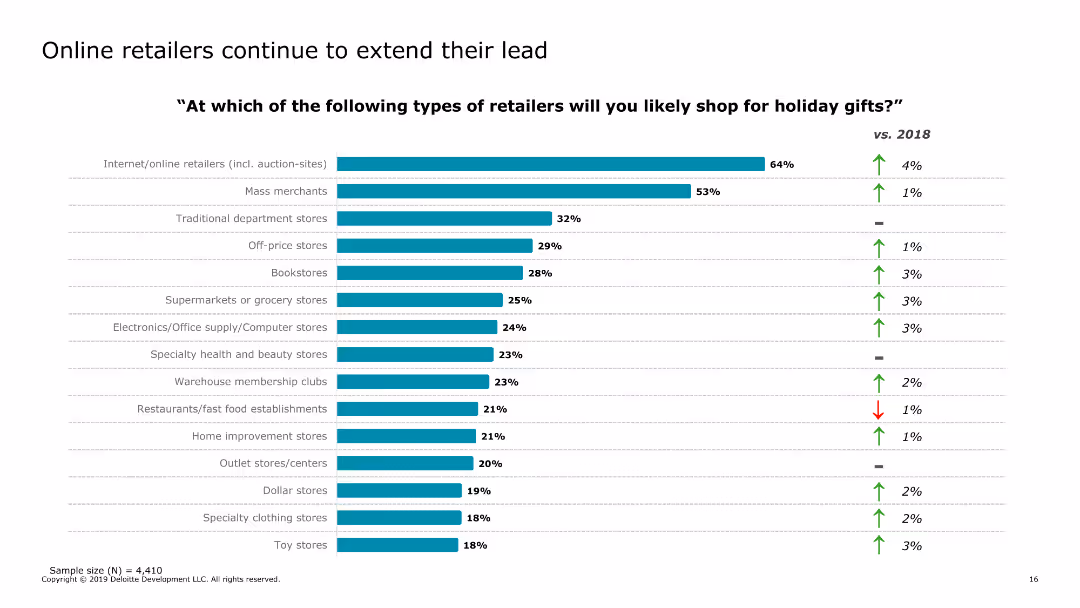
The slide features a bar chart listing the types of retailers where consumers are likely to shop for holiday gifts, with a comparison to the previous year.
Market Analysis and Trends
Retail & E-commerce
The slide identifies the preferred retail formats for holiday shopping, showing the popularity of online and mass merchant retailers.
retail types, holiday shopping, consumer preferences, e-commerce, retail trends, 2019, shopping habits, comparison, online retailers
false
Market Analysis and Trends
Retail & E-commerce
Single Chart
Deloitte
Add to my slides
Remove from favorites
The slide includes three column charts comparing Tyson's sales volume and growth in the retail perimeter to total grocery sales. The visual design uses deep blue and gray to distinguish between Tyson and total grocery, effectively drawing attention to Tyson's advantageous positioning.
Market Analysis and Trends
Agriculture & Food Production
Discusses Tyson’s competitive advantage in retail sales, particularly in perimeter categories of grocery stores. It highlights Tyson's performance and growth in these areas, providing insights for stakeholders interested in retail strategies and market positioning.
Retail, Tyson, Grocery, Sales, Market Analysis, Growth
false
Market Analysis and Trends
Agriculture & Food Production
Multiple Chart
Barclays
Add to my slides
Remove from favorites
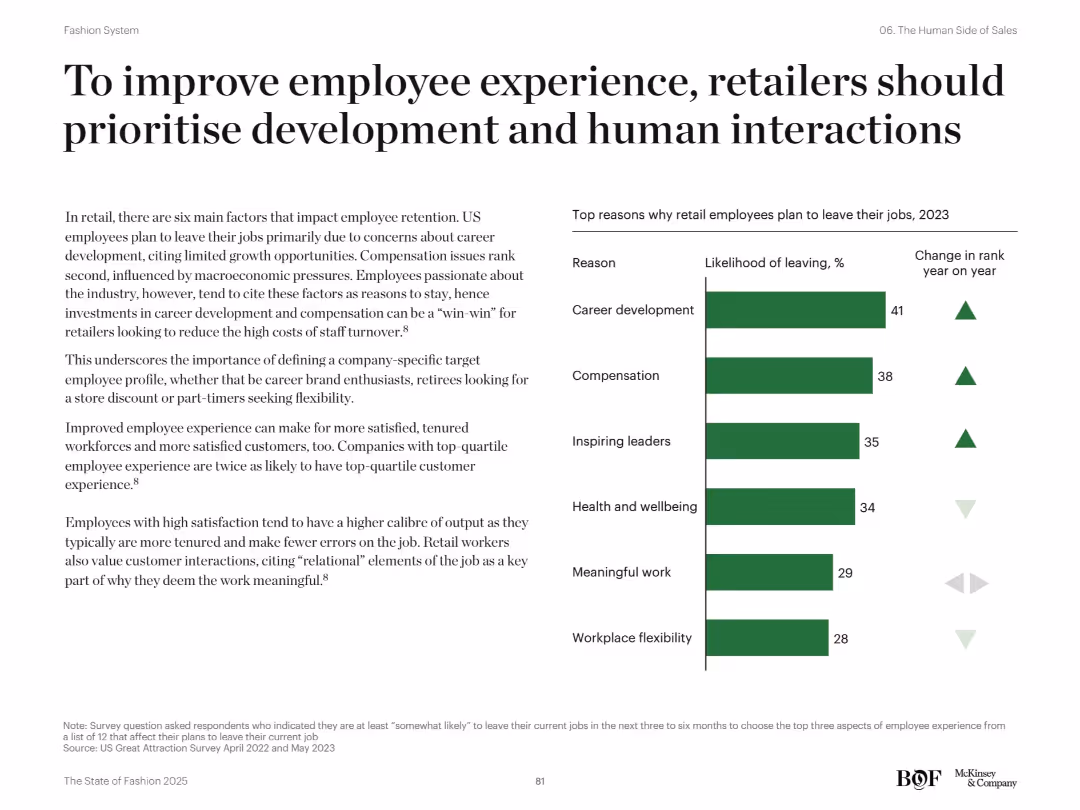
Left-aligned explanatory text with right bar chart ranking reasons retail employees leave jobs. Green bars with % and arrow indicators show year-over-year changes.
Human Resources and Talent Management
Retail & E-commerce
Discusses drivers of employee attrition in retail, including lack of career development, compensation, and inspiring leadership. Advocates for investing in employee experience to boost customer experience and retention.
retail workforce, employee retention, career development, compensation, satisfaction
false
Human Resources and Talent Management
Retail & E-commerce
Mixed Chart
McKinsey
Add to my slides
Remove from favorites
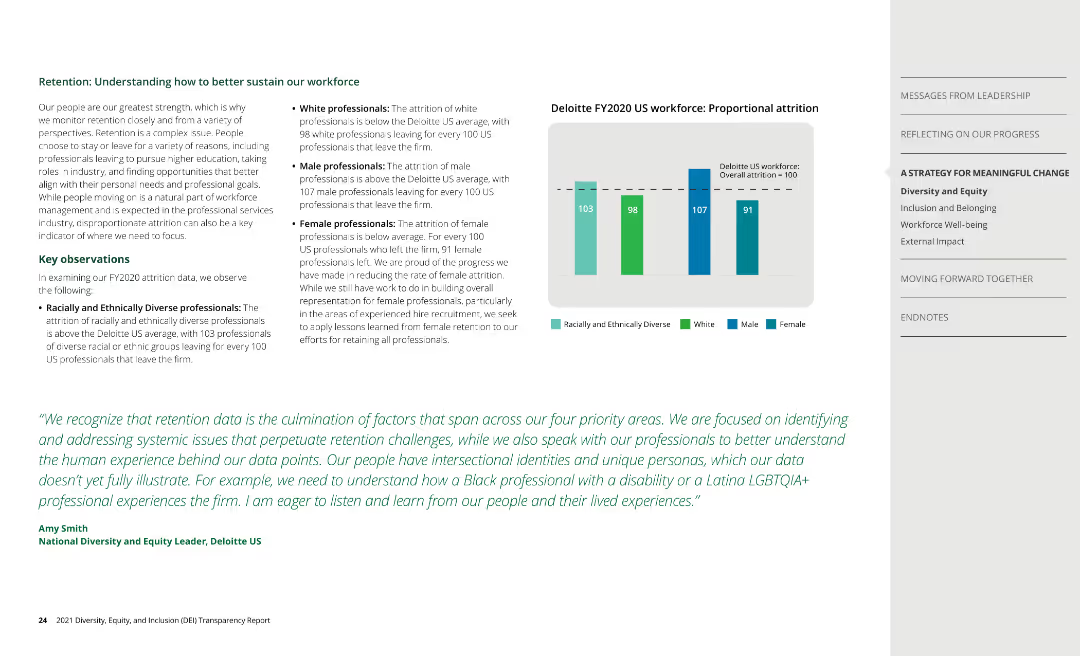
Bar chart shows proportional attrition data by race, ethnicity, and gender, with key observations on retention.
Human Resources and Talent Management
Professional Services
Discusses retention rates, identifying challenges and strategies for sustaining a diverse workforce.
retention, attrition, workforce, Deloitte
false
Human Resources and Talent Management
Professional Services
Mixed Chart
Deloitte
Add to my slides
Remove from favorites
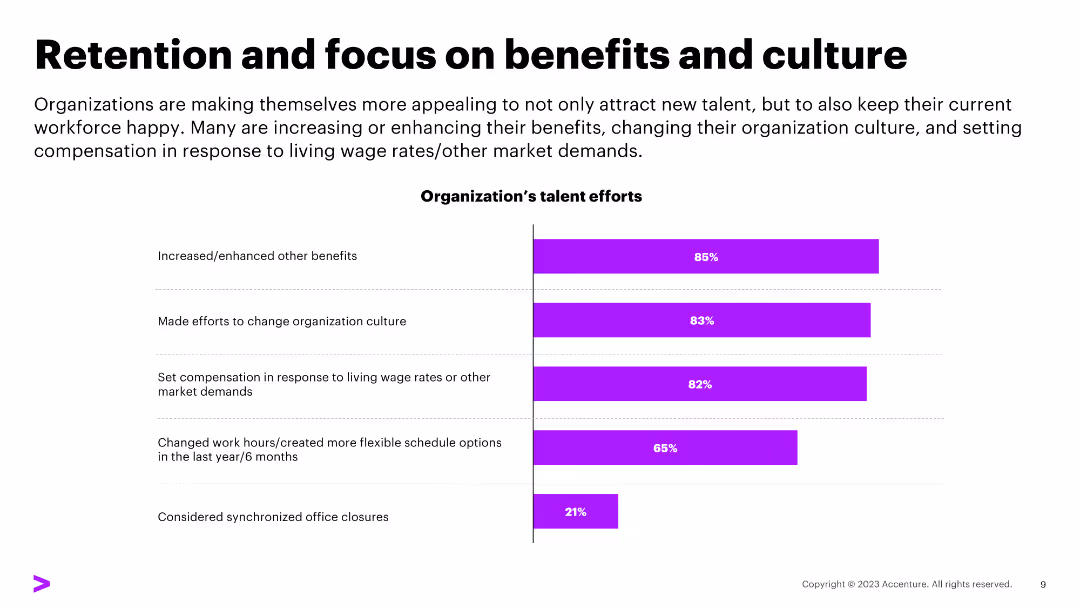
The slide contains a column chart with percentages indicating organizational efforts on benefits and culture. The design is moderately dense with text and visual elements.
Human Resources and Talent Management
Professional Services
Highlights organizational efforts to improve employee retention by enhancing benefits and organizational culture.
retention, benefits, culture, compensation, flexible schedule, office closures
false
Human Resources and Talent Management
Professional Services
Single Chart
Accenture
Add to my slides
Remove from favorites
The slide presents three strategies using icons and short text blocks: "Find out what workers want", "Build great managers", and "Invest in making work better". Each section is separated by vertical lines and uses simple icons to visually represent the strategy, like speech bubbles, a manager, and technology tools.
Human Resources and Talent Management
Professional Services
This slide provides strategies for companies to retain and engage deskless workers by understanding their needs, building managerial skills, and improving workplace technology and flexibility. Ideal for HR strategy sessions focusing on enhancing worker satisfaction and retention in industries with high deskless worker populations.
retention, strategy, deskless workers, management, workplace improvement, HR policies
false
Human Resources and Talent Management
Professional Services
Pillar
BCG
Add to my slides
Remove from favorites
The slide is divided into four sections, each with an icon and text describing different strategies regarding talent resignation, from understanding drivers to handling exits.
Human Resources and Talent Management
Professional Services
The slide outlines a comprehensive strategy for managing talent resignation, emphasizing a preventative approach and the importance of a retention strategy for high-performing individuals. It is likely used in HR training or strategy meetings.
Retention Strategy, Talent Resignation, HR Management, Prevention
false
Human Resources and Talent Management
Professional Services
Header Horizontal
Kearney
Add to my slides
Remove from favorites
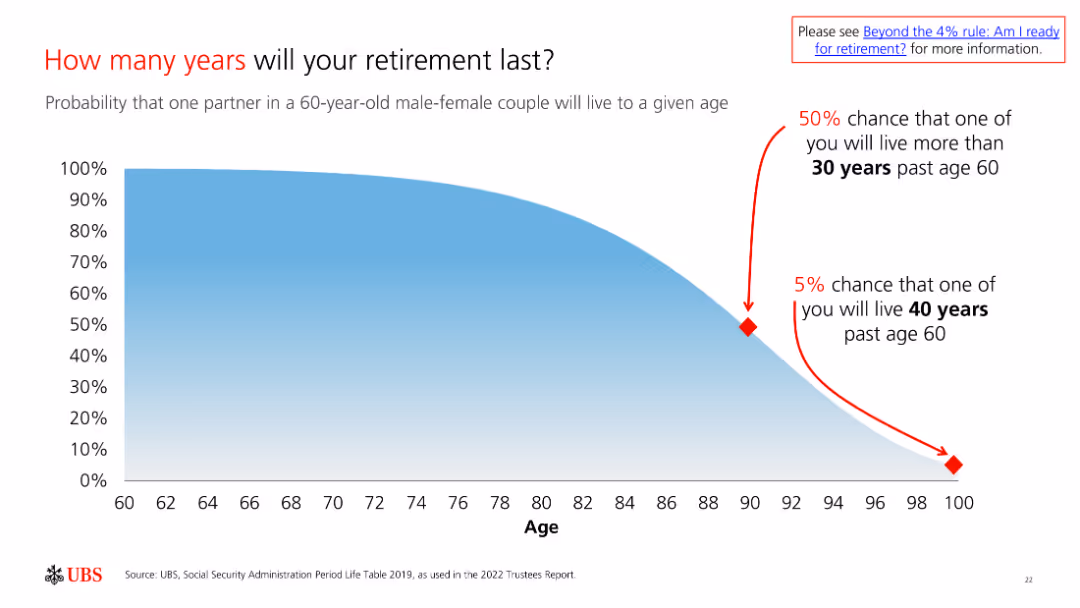
The slide includes a probability chart showing the likelihood of a 60-year-old couple living to different ages, illustrating longevity risk in retirement.
Market Analysis and Trends
Financial Services
The slide assesses the longevity risk in retirement, emphasizing the importance of planning for an extended retirement period to ensure financial security.
Retirement, Longevity, Risk, Probability, Planning
false
Market Analysis and Trends
Financial Services
Single Chart
UBS
Add to my slides
Remove from favorites
This slide features a column chart comparing current and prospective retirement ages across various countries, with color coding for easier differentiation between the data. The layout is clear with readable fonts and distinct colors for each country.
Market Analysis and Trends
Government & Public Sector
The slide analyzes retirement age trends to suggest necessary policy adaptations in light of changing demographics.
retirement, policy, demographics, OECD, trends
false
Market Analysis and Trends
Government & Public Sector
Mixed Chart
Roland Berger
Add to my slides
Remove from favorites
Pie chart depicting the proportion of respondents saving for retirement before COVID-19 and those who continued during the pandemic. Text at the top provides context.
Market Analysis and Trends
Financial Services
This slide outlines the savings behavior of Canadian investors for retirement before and during the COVID-19 pandemic. It shows the percentage of those who continued saving and highlights demographic variations in savings habits.
Retirement, Savings, COVID-19, Canadian, Pandemic
false
Market Analysis and Trends
Financial Services
Multiple Chart
IPSOS
Add to my slides
Remove from favorites
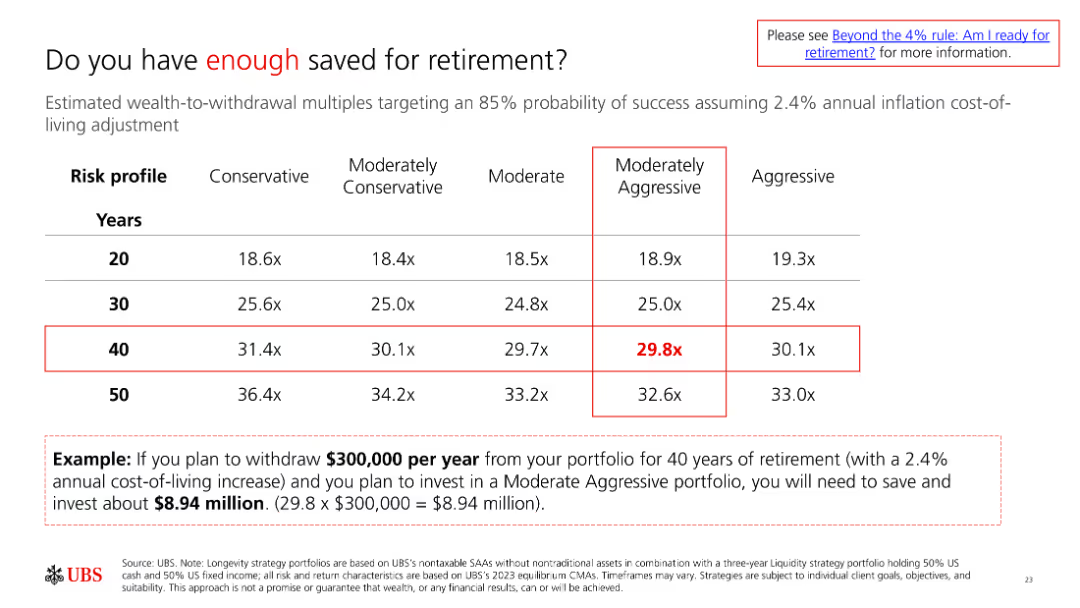
A slide featuring a table comparing different risk profiles (Conservative to Aggressive) across various time horizons (20 to 50 years). An example calculation at the bottom clarifies the concept.
Financial Performance
Financial Services
The slide assesses whether individuals have saved enough for retirement based on their risk profile and time horizon, providing a detailed example to aid understanding.
retirement savings, risk profiles, financial planning, retirement adequacy, savings goal
false
Financial Performance
Financial Services
Table
UBS
Add to my slides
Remove from favorites
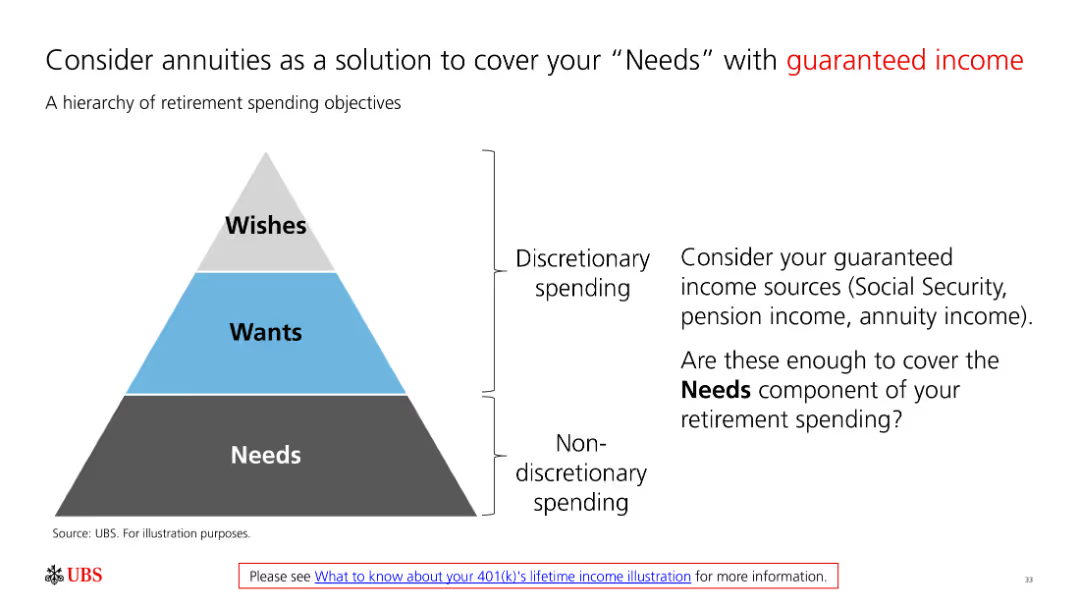
A slide with a pyramid diagram illustrating retirement spending objectives categorized as Needs, Wants, and Wishes. Text explains the importance of guaranteed income for covering needs.
Financial Performance
Financial Services
The slide outlines retirement spending priorities using a pyramid diagram, emphasizing the importance of covering essential needs with guaranteed income sources like Social Security and annuities.
retirement spending, financial priorities, guaranteed income, needs hierarchy, financial planning
false
Financial Performance
Financial Services
Framework
UBS
Add to my slides
Remove from favorites
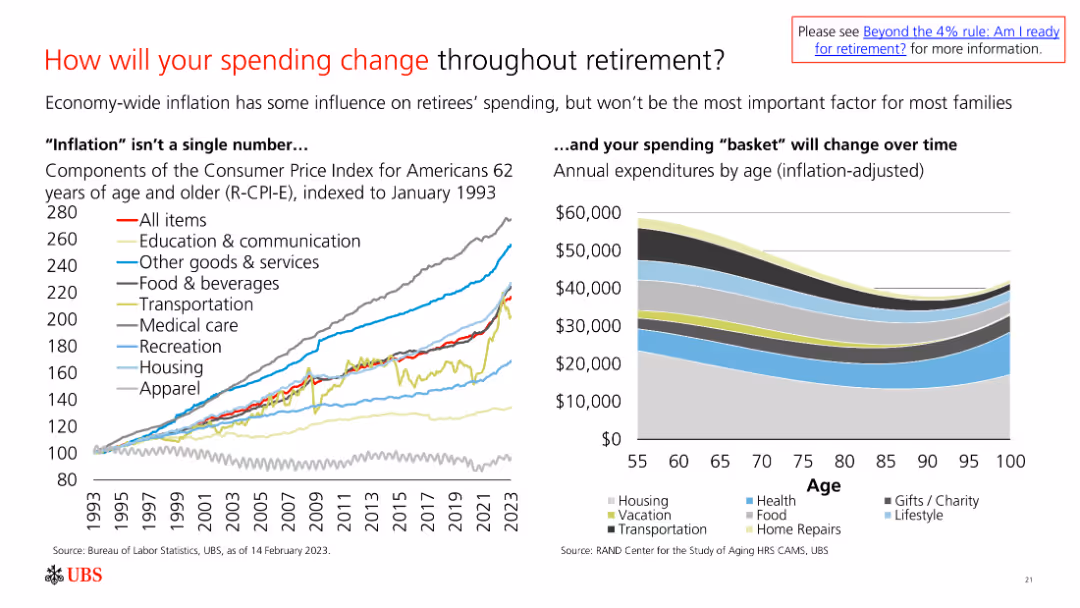
The slide features a line chart showing the Consumer Price Index for different expense categories over time and a bar chart of annual expenditures by age.
Market Analysis and Trends
Financial Services
The slide analyzes spending changes in retirement, influenced by inflation and shifts in expenditure categories, to guide financial planning for retirees.
Retirement, Spending, Inflation, Expenses, Financial Planning
false
Market Analysis and Trends
Financial Services
Multiple Chart
UBS
Add to my slides
Remove from favorites
Column chart showing steps towards achieving a 15% return on CET1 capital, with annotations for different strategic initiatives.
Financial Performance
Financial Services
Details the strategic initiatives for improving return on CET1 capital, including cost base right-sizing and balance sheet optimization.
return, CET1, capital, cost, optimization
false
Financial Performance
Financial Services
Mixed Chart
UBS
Add to my slides
Remove from favorites
Features column charts and icons showing the ROE impact from capital and market segments, with a focus on change over time.
Financial Performance
Financial Services
Illustrates the impact of capital on ROE in market business, emphasizing strong returns despite increased capital, with a focus on sub-product ROEs and revenue growth.
Return on Equity, Capital Impact, Revenue Growth, Risk Management
false
Financial Performance
Financial Services
Multiple Chart
JP Morgan
Add to my slides
Remove from favorites
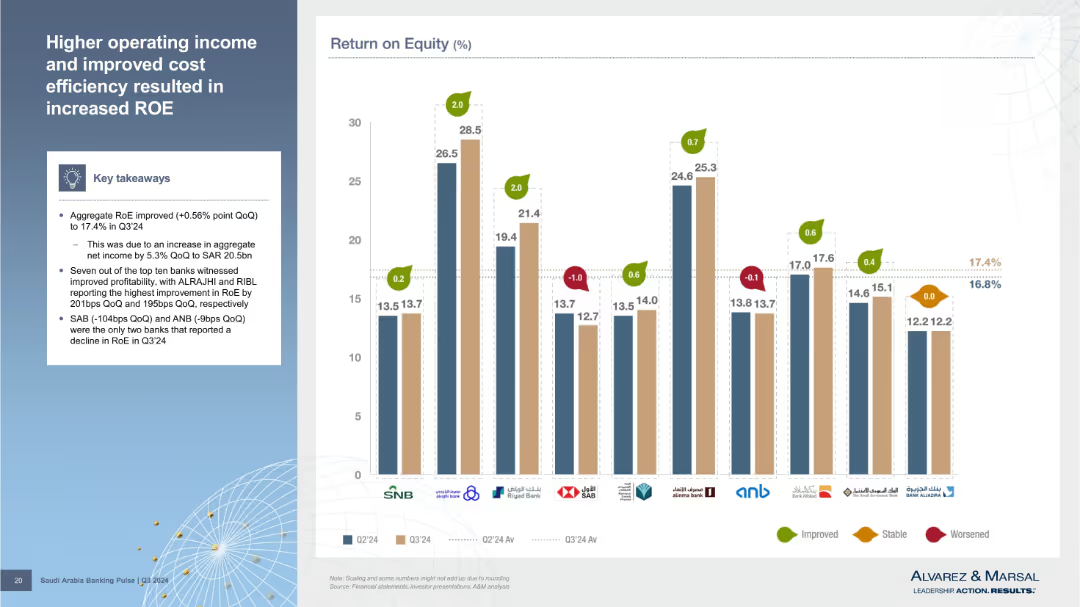
Bar chart comparing Return on Equity (RoE) across banks for Q2 and Q3’24, including change annotations. Left-side summary box offers context.
Financial Performance
Financial Services
RoE improved to 17.4% QoQ due to higher net income. ALRAJHI and RIBL led gains, while SAB and ANB declined. Slide compares Q2 and Q3’24 to show where profitability improved or worsened. Visual indicators make changes across banks easy to interpret.
return on equity, profitability, ALRAJHI, RIBL, SAB, ANB, Q3 2024
false
Financial Performance
Financial Services
Mixed Chart
Alvarez & Marsal
Add to my slides
Remove from favorites
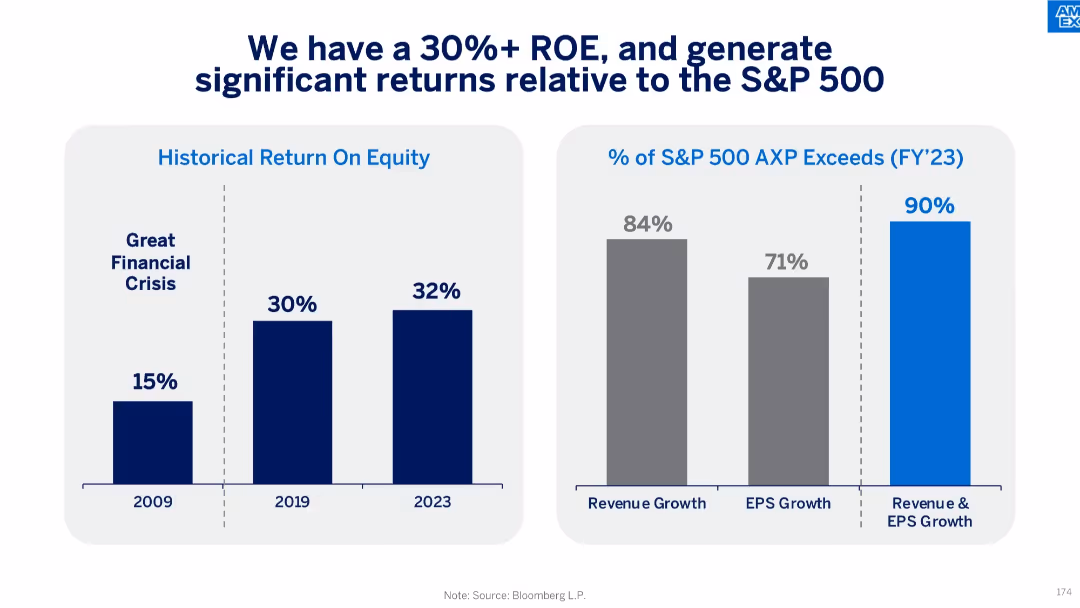
Two bar charts: ROE over time (2009–2023) and percent of S&P 500 companies exceeded in revenue/EPS growth
Financial Performance
Financial Services
The slide emphasizes American Express’s strong return on equity (32% in 2023), consistently exceeding most of the S&P 500 in both revenue and earnings growth. This performance signals robust value creation.
return on equity, S&P 500, revenue growth, EPS growth, shareholder returns, performance comparison
false
Financial Performance
Financial Services
Multiple Chart
McKinsey
Add to my slides
Remove from favorites
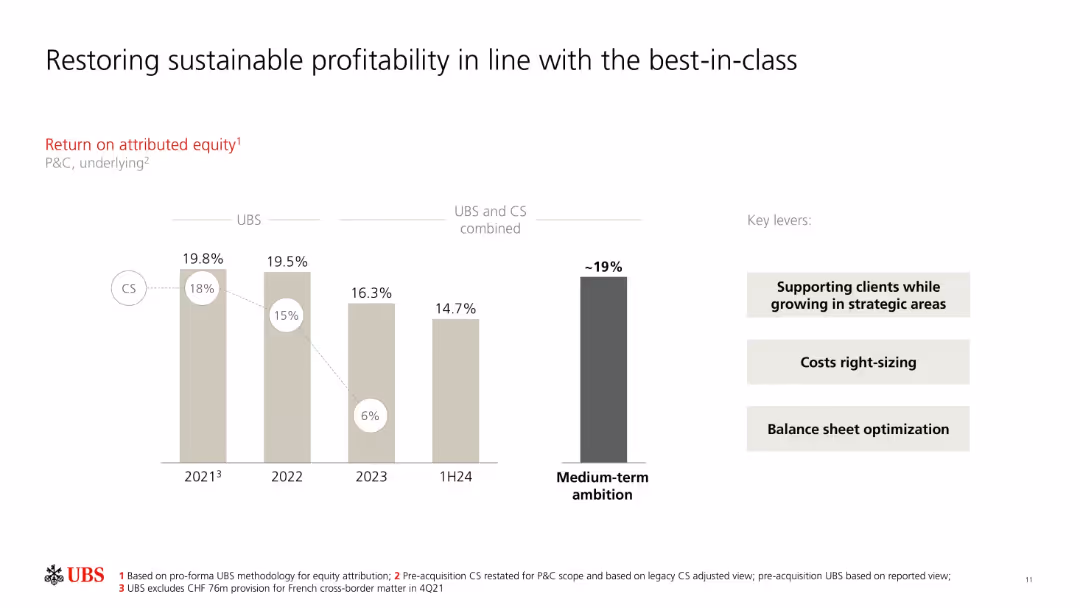
Vertical bar chart with profit margins from 2021–1H24 and UBS’s future goal; side boxes for levers.
Financial Performance
Financial Services
The slide traces UBS and CS's return on attributed equity over time, culminating in a 14.7% combined performance for 1H24, with a medium-term target of ~19%. It highlights key levers including strategic growth, cost management, and balance sheet optimization.
return on equity, UBS, CS, profitability, targets, performance, strategy, optimization, medium-term goal
false
Financial Performance
Financial Services
Single Chart
UBS
Add to my slides
Remove from favorites
The slide features a column chart with measures like returns charges, account blocks, and monetary incentives that would deter consumers from making returns.
Risk Assessment and Management
Retail & E-commerce
Details measures that could reduce the frequency of online returns, based on survey responses, including financial and policy-based deterrents like returns charges and account blocks.
Returns charges, Account block, Monetary incentive, Survey measures, Deterrents
false
Risk Assessment and Management
Retail & E-commerce
Mixed Chart
Roland Berger
Add to my slides
Remove from favorites
The slide includes text and a pie chart showing the impact of returns charges on online shopping behavior, such as increased caution in purchasing and cessation of buying from certain brands.
Risk Assessment and Management
Retail & E-commerce
Examines the effects of returns charges on consumer behavior, highlighting how financial penalties influence shopping habits and the decision to purchase from specific brands.
Returns charges, Online shopping, Consumer behavior, Financial penalties, Brands
false
Risk Assessment and Management
Retail & E-commerce
Mixed Chart
Roland Berger
Add to my slides
Remove from favorites
Features bar and line charts comparing 60/40 portfolio returns and stock-bond correlations over time.
Investment Analysis
Financial Services
Explores the annual return decomposition of a 60/40 portfolio and the rolling 12-month correlation between S&P 500 and U.S. 10-year Treasuries.
returns, correlation, stock, bond, portfolio
false
Investment Analysis
Financial Services
Multiple Chart
JP Morgan
Add to my slides
Remove from favorites
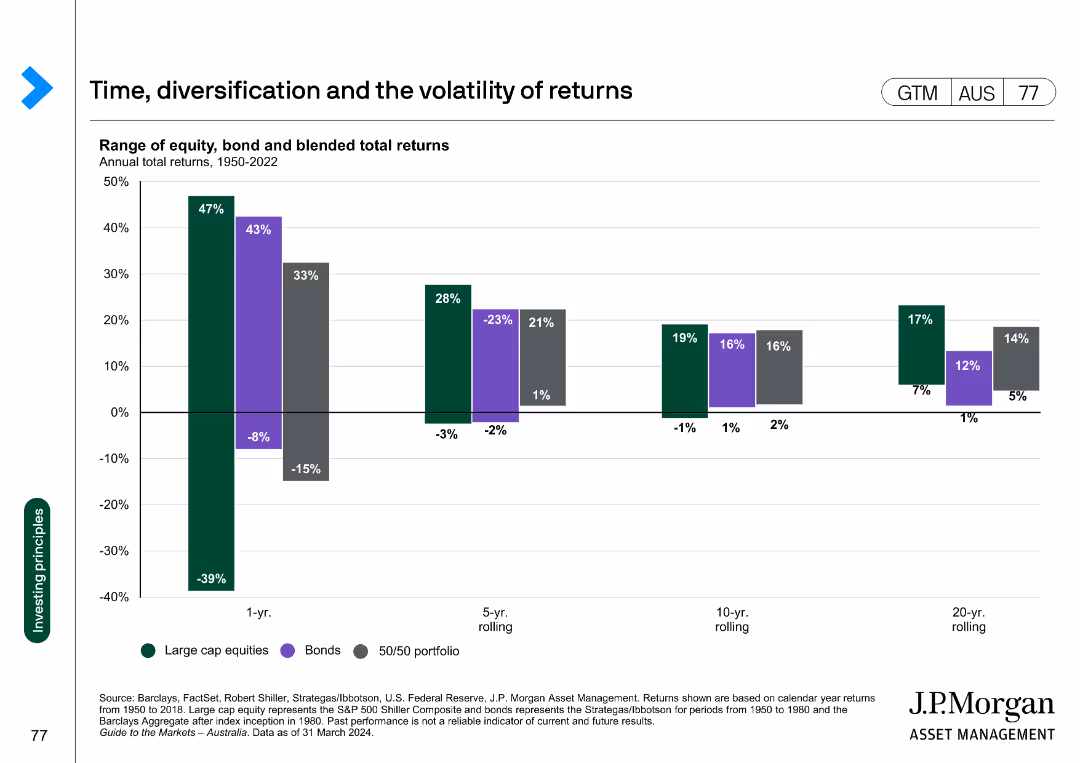
A column chart showing the range of equity, bond, and blended total returns over different time periods (1-year, 5-year, 10-year, 20-year). Each type of return is represented by different colors.
Market Analysis and Trends
Financial Services
The slide compares the performance of large-cap equities, bonds, and a 50/50 portfolio over various rolling periods from 1950 to 2022.
returns, diversification, volatility, equity, bonds
false
Market Analysis and Trends
Financial Services
Single Chart
JP Morgan
Add to my slides
Remove from favorites
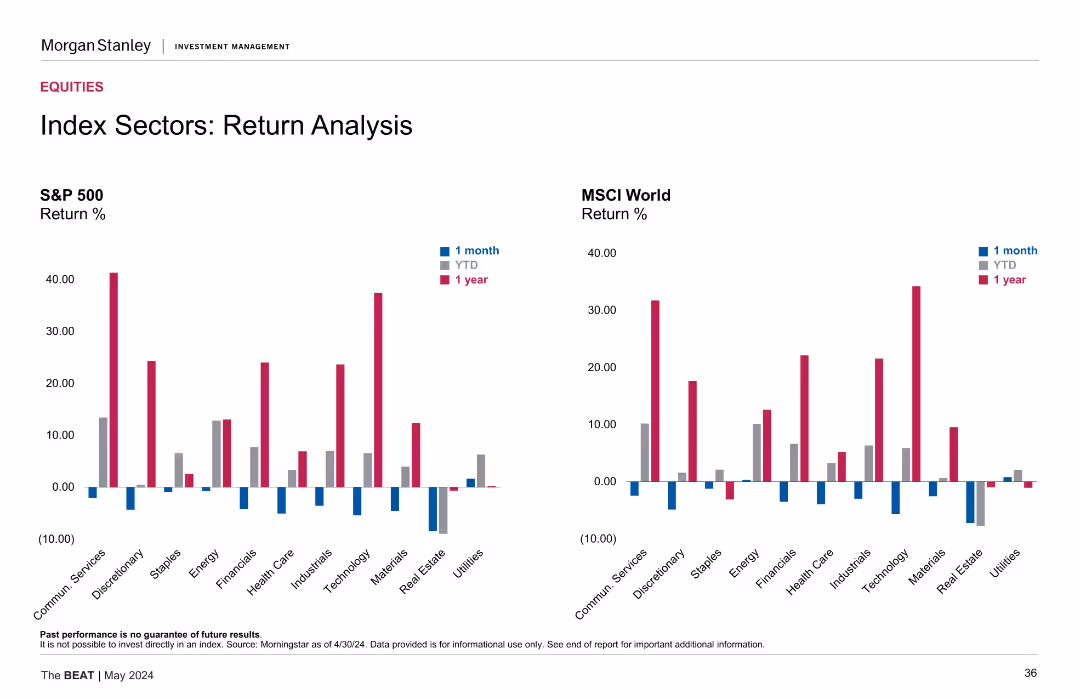
Two sets of bar charts comparing return percentages for the S&P 500 and MSCI World Index sectors over one month, YTD, and one year periods.
Financial Performance
Financial Services
The slide compares return analysis for sectors within the S&P 500 and MSCI World Index, showcasing performance over different time periods for comprehensive financial insights.
return, sectors, analysis, S&P 500, MSCI
false
Financial Performance
Financial Services
Multiple Chart
Morgan Stanley
Add to my slides
Remove from favorites
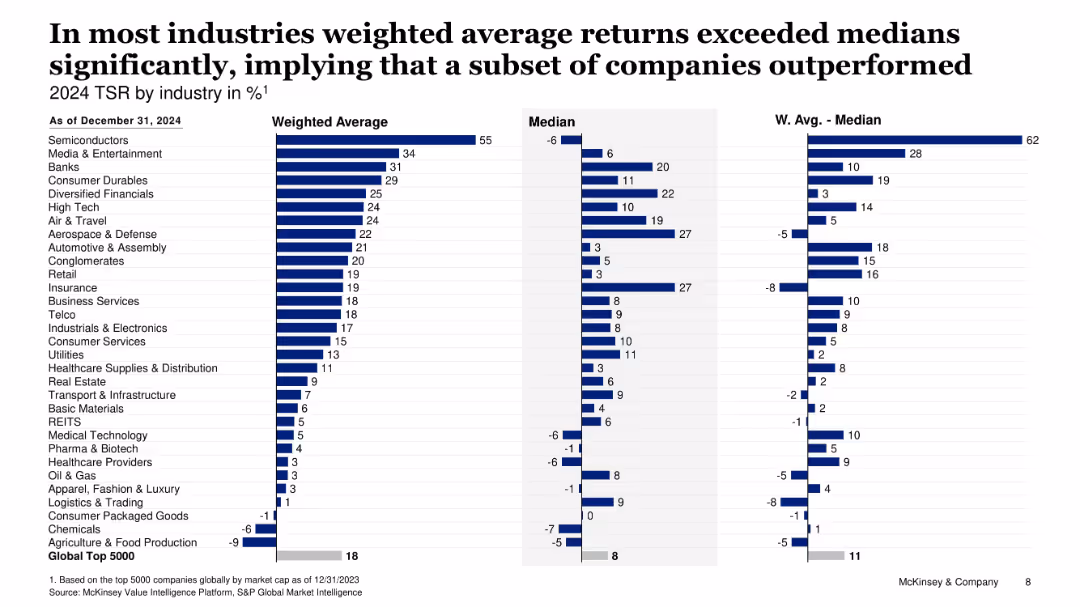
Three-column chart comparing weighted average, median, and delta TSR by industry
Investment Analysis
Financial Services
Illustrates that in many sectors, weighted average TSRs are much higher than medians, indicating a few outperformers skew overall performance data.
return skew, median vs average, industry outliers, market performance, investment
false
Investment Analysis
Financial Services
Single Chart
McKinsey
Add to my slides
Remove from favorites
Side-by-side bar charts for total return history and calendar-year performance. Below is a grid of quarterly returns. Color-coded for clarity.
Financial Performance
Financial Services
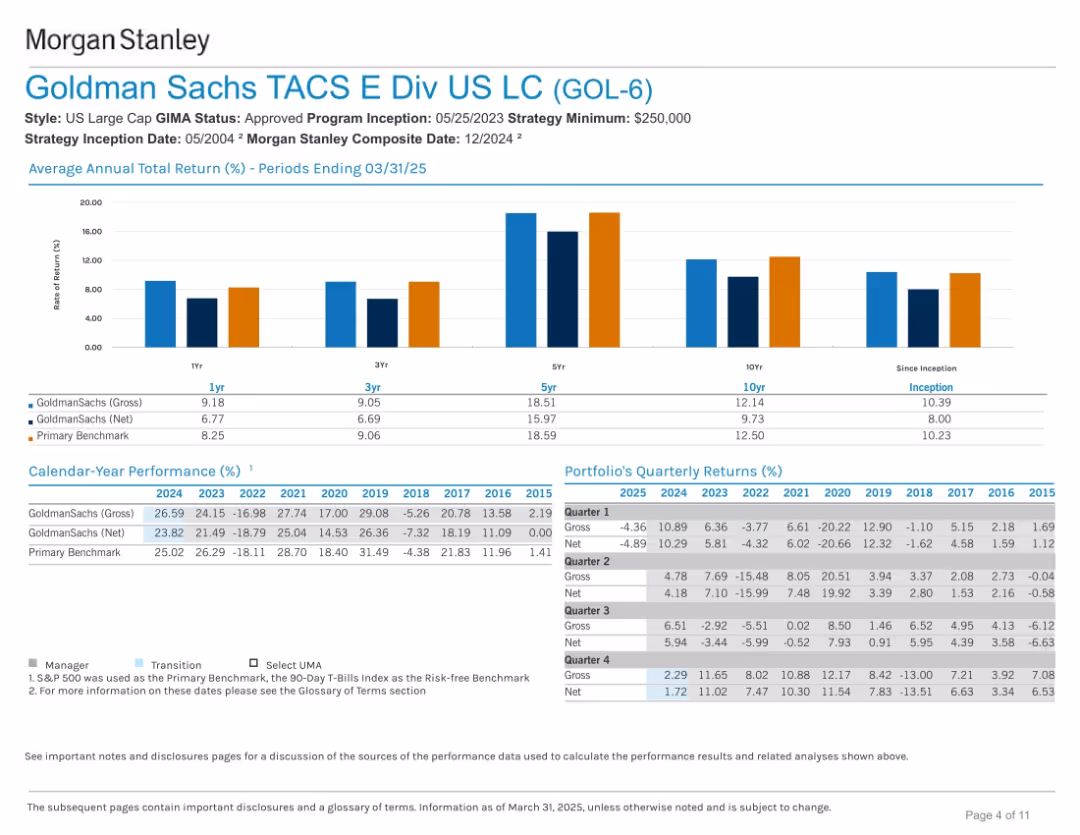
The slide provides historical performance data across multiple timeframes (1Y, 3Y, 5Y, etc.) and calendar years. It includes returns net and gross of fees, benchmarking against a primary index, and shows resilience over time.
returns, performance, Goldman Sachs, benchmark, total return, portfolio history, calendar year, growth
false
Financial Performance
Financial Services
Mixed Chart
Goldman Sachs
Add to my slides
Remove from favorites
The slide shows a process flow diagram with icons representing various stages of returns handling in the fashion industry, including sorting, refunding, and recycling.
Operational Efficiency
Retail & E-commerce
This slide explains the flow of returns within the fashion ecosystem, highlighting the key stages and actions involved in managing returns efficiently and sustainably.
Returns, Recycling, Sorting, Process flow, Fashion industry
false
Operational Efficiency
Retail & E-commerce
Diagram
Roland Berger
Add to my slides
Remove from favorites
Combination of bar chart showing ROTCE by scenario and a side panel listing economic risks and uncertainties. Uses color-coded scenarios and a line to indicate the target return.
Strategic Planning
Financial Services
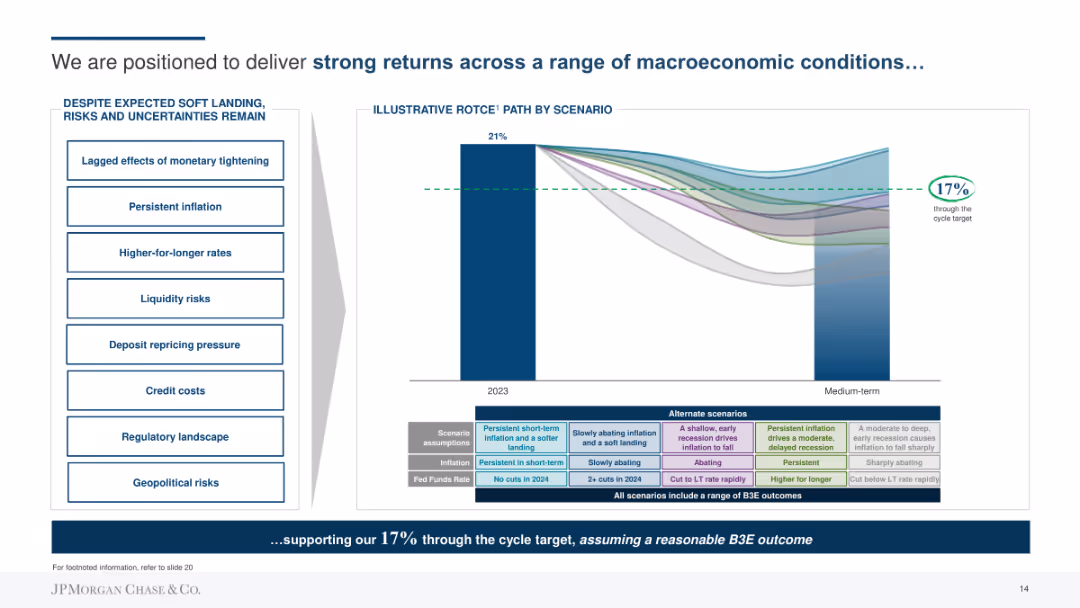
Outlines JP Morgan's strategy to deliver strong returns through different economic scenarios, emphasizing risk management and strategic planning. Shows ROTCE projections and lists potential risks like inflation and credit costs.
Returns, Strategy, Planning, ROTCE, Risks, Economic, Financial
false
Strategic Planning
Financial Services
Mixed Chart
JP Morgan
Add to my slides
Remove from favorites
Slide with bullet points and checkboxes detailing strategies for businesses to consider in anticipation of returning to normal operations.
Strategic Planning
Professional Services
Provides a checklist for businesses on considerations and actions for transitioning back to normal operations after a crisis.
Return strategy, business preparedness, employee protection, customer reassurance
false
Strategic Planning
Professional Services
Vertical Flow
McKinsey
Add to my slides
Remove from favorites
This slide has a horizontal bar chart and a column chart showing respondents' beliefs about the time it will take to return to normal and financial impact by COVID-19.
Market Analysis and Trends
Consumer Goods
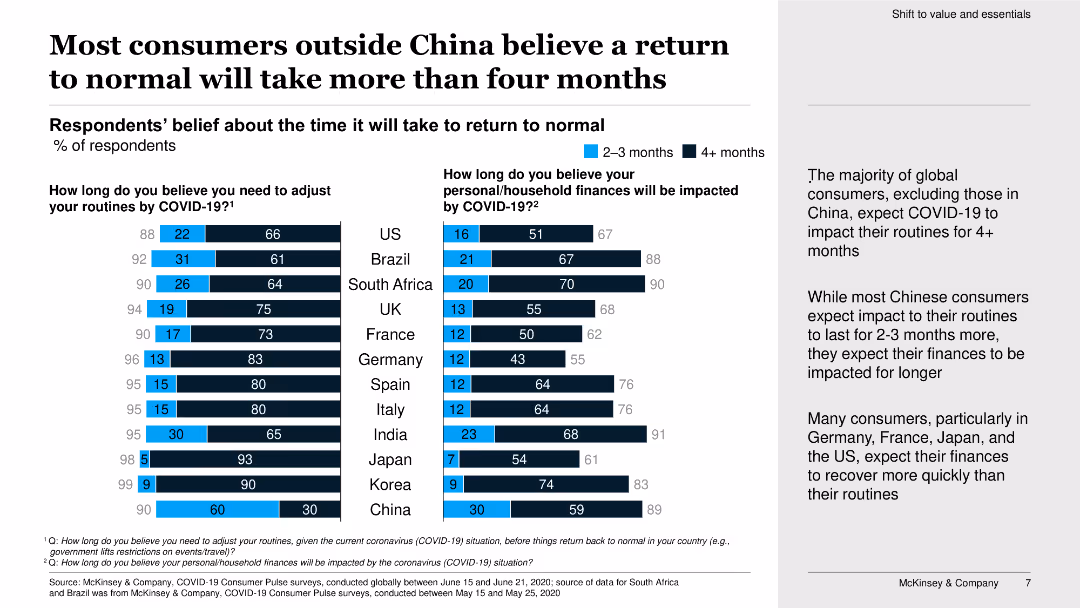
The slide details global consumer expectations on the duration of adjustments due to COVID-19, with emphasis on differences between China and other countries.
return to normal, consumers, COVID-19, financial impact, survey, global, bar chart, column chart, expectations, adjustment
false
Market Analysis and Trends
Consumer Goods
Multiple Chart
McKinsey
Add to my slides
Remove from favorites
The slide features a column chart illustrating leadership's targets for employees returning to the office post-pandemic. An image on the left shows an outdoor urban setting with people walking. The chart uses shades of orange and red.
Human Resources and Talent Management
Financial Services
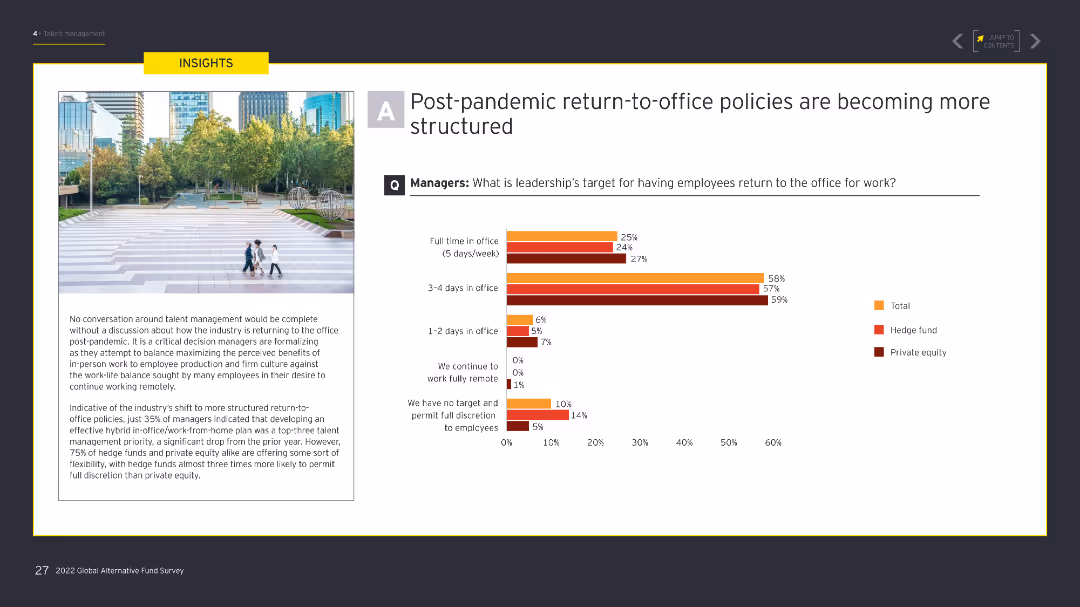
The slide outlines how leadership is targeting different levels of in-office presence post-pandemic, with a significant focus on structured return-to-office policies to balance remote work and office work.
Return-to-office, post-pandemic, remote work, office policies, leadership targets
false
Human Resources and Talent Management
Financial Services
Mixed Chart
EY
Add to my slides
Remove from favorites
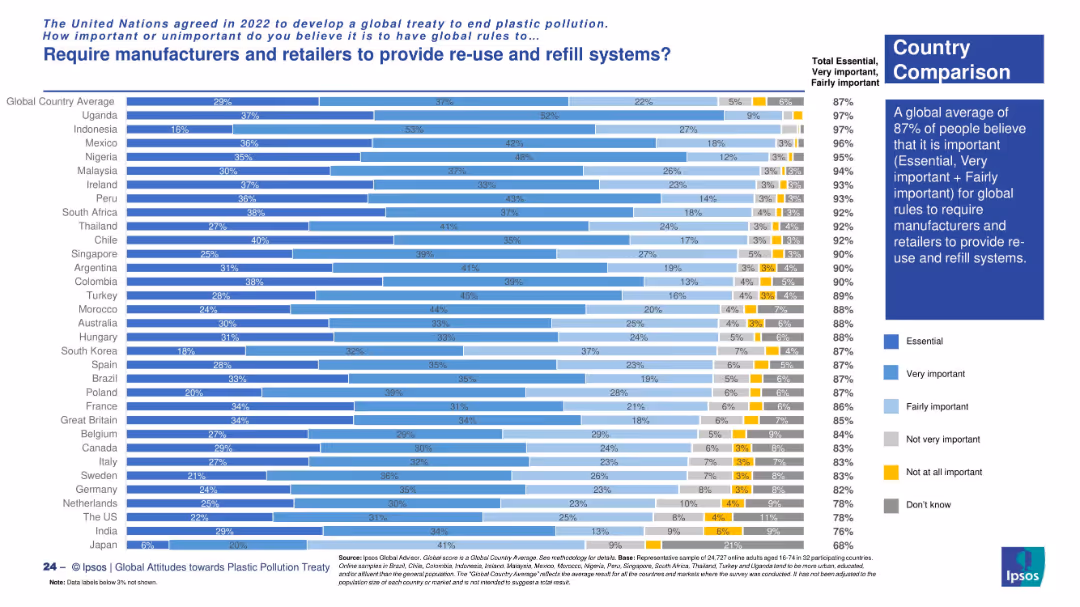
Vertical bar chart showing country-wise opinion. Colored segments represent importance levels. Insight box provides overall summary.
Product and Service Analysis
Environmental Services & Sustainability
This chart indicates 87% global support for rules requiring manufacturers and retailers to offer reuse and refill systems. High support is especially notable in Uganda, Indonesia, and Mexico.
reuse systems, refill policy, consumer goods, sustainability, environmental responsibility, global rules
false
Product and Service Analysis
Environmental Services & Sustainability
Mixed Chart
IPSOS
Add to my slides
Remove from favorites
The slide includes bar charts showing the relationship between revenue and cash through journal entries, with a color key categorizing various sources of revenue.
Financial Performance
Financial Services
This slide examines the relationship between revenue accounts and cash, highlighting debit postings from credit card sources and identifying immaterial amounts for further investigation.
revenue accounts, cash relationship, credit card, journal entries, financial analysis
false
Financial Performance
Financial Services
Mixed Chart
EY
Add to my slides
Remove from favorites
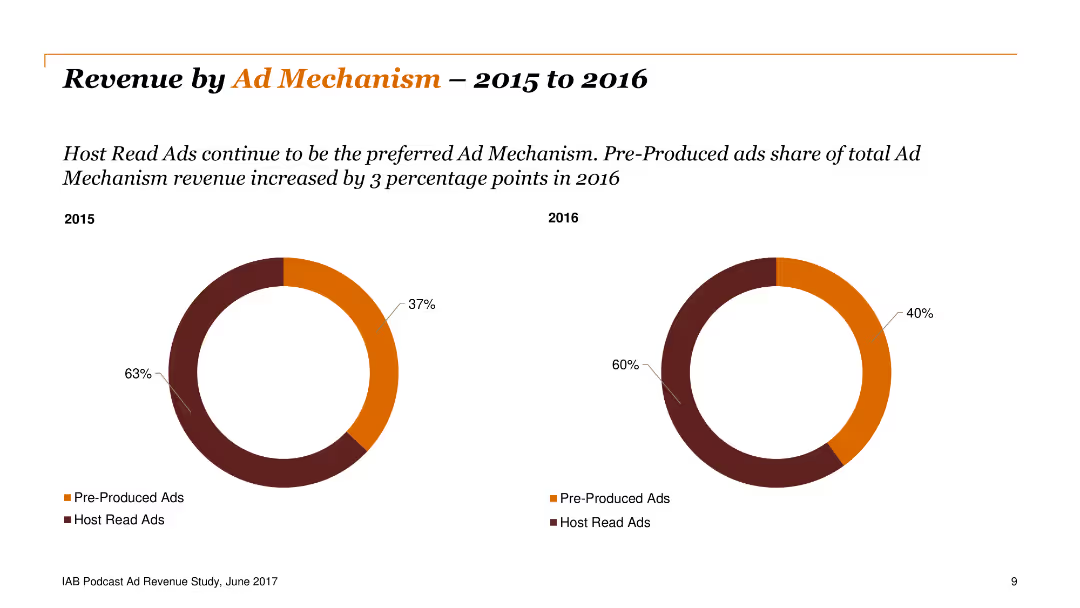
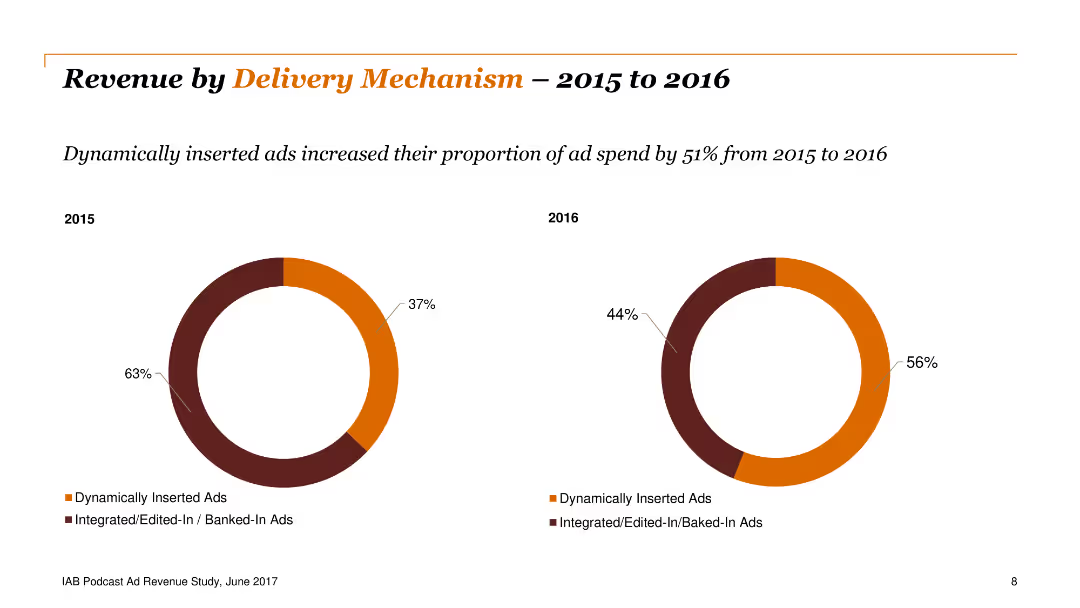
Two doughnut charts showing the distribution of revenue by ad mechanism, indicating a preference shift from host-read ads to pre-produced ads between 2015 and 2016.
Financial Performance
Media & Entertainment
This slide shows the change in ad revenue distribution by mechanism, noting a shift towards pre-produced ads. Important for understanding changes in advertising preferences.
revenue, ad, mechanism, host, pre-produced
false
Financial Performance
Media & Entertainment
Multiple Chart
PwC/Strategy&
Add to my slides
Remove from favorites
Slide features diagrams and charts detailing revenue segmentation, and circular arrows showing business model components.
Financial Performance
Financial Services
Breakdown of revenue streams and business model for a financial institution, essential for financial analysis and business strategy discussions.
Revenue analysis, business model, financial services, segmentation, assets
false
Financial Performance
Financial Services
Multiple Chart
JP Morgan
Add to my slides
Remove from favorites
The slide features multiple bar charts comparing revenue impacts over two periods. Charts are color-coded and accompanied by insights and economic sector data.
Market Analysis and Trends
Professional Services
The slide analyzes revenue generated by business apps, highlighting variations across different sectors and revenue ranges, useful for assessing market impact and strategic planning.
revenue, apps, business impact, B2B, B2C, market analysis
false
Market Analysis and Trends
Professional Services
Mixed Chart
Deloitte
Add to my slides
Remove from favorites
The slide includes column chart and text sections, detailing net revenues and performance metrics across different banking divisions. The layout is dense with data and text annotations.
Financial Performance
Financial Services
The slide presents a comprehensive overview of the bank’s performance across different divisions, including net revenue changes and operational achievements, suitable for analyzing the bank's financial health and sectoral performance.
revenue, banking, financial, performance, net, divisional, investment, corporate, management, data
false
Financial Performance
Financial Services
Mixed Chart
Deutsche Bank
Add to my slides
Remove from favorites
The slide features a column chart showing potential annual increase in main banks' revenue per customer across nine countries, indicating additional banking and non-FS revenue. The layout includes a key takeaway box and explanatory text.
Market Analysis and Trends
Financial Services
The slide analyzes the potential revenue increase for banks through product and channel integration. It highlights a 20% uplift in revenue per customer, with country-specific details.
revenue, banking, integration, multiplier effect, financial services, customer advocacy, market analysis
false
Market Analysis and Trends
Financial Services
Mixed Chart
Accenture
Add to my slides
Remove from favorites
A dark-themed slide with a multi-layered column chart depicting various components of banking and markets revenues in billions, across multiple years.
Financial Performance
Financial Services
Displaying a breakdown of revenues for Global Banking & Markets, this slide highlights underwriting, FICC intermediation, and other revenue components.
revenue, banking, markets, underwriting, FICC
false
Financial Performance
Financial Services
Single Chart
Goldman Sachs
Add to my slides
Remove from favorites
Slide includes column chart showing revenue distribution over years and textual information organized in bullet points on the right side.
Financial Performance
Financial Services
This slide presents the evolution of revenue streams from 2020 to 2023, highlighting the financial growth in various banking sectors such as Investment, Corporate, and Private Banking. It emphasizes strategic investments and innovations that have propelled client engagement and financial growth.
Revenue, Banking, Strategic Growth, Client Engagement, Financial Trends
false
Financial Performance
Financial Services
Mixed Chart
Deutsche Bank
Add to my slides
Remove from favorites
Two sets of vertical column charts comparing the 2016 and 2018 revenue benchmark with divisions CIB and non-CIB highlighted, alongside a title and footnotes at the bottom.
Financial Performance
Financial Services
Used to display growth and market leadership in treasury services, it compares the firm's revenue against competitors over two years, indicating progress and competitive position.
Revenue Benchmark, CIB, Market Leader, Growth, Financial Performance
false
Financial Performance
Financial Services
Multiple Chart
JP Morgan
Add to my slides
Remove from favorites
A series of stacked column charts and labeled circles denote data points, complemented by explanatory text on the side.
Financial Performance
Financial Services
This slide analyzes the composition of 2023 revenues, indicating a shift towards more durable revenue sources. Utilized for financial analysis or strategic planning discussions.
Revenue Breakdown, Financial Analysis, Growth
false
Financial Performance
Financial Services
Mixed Chart
Goldman Sachs
Add to my slides
Remove from favorites
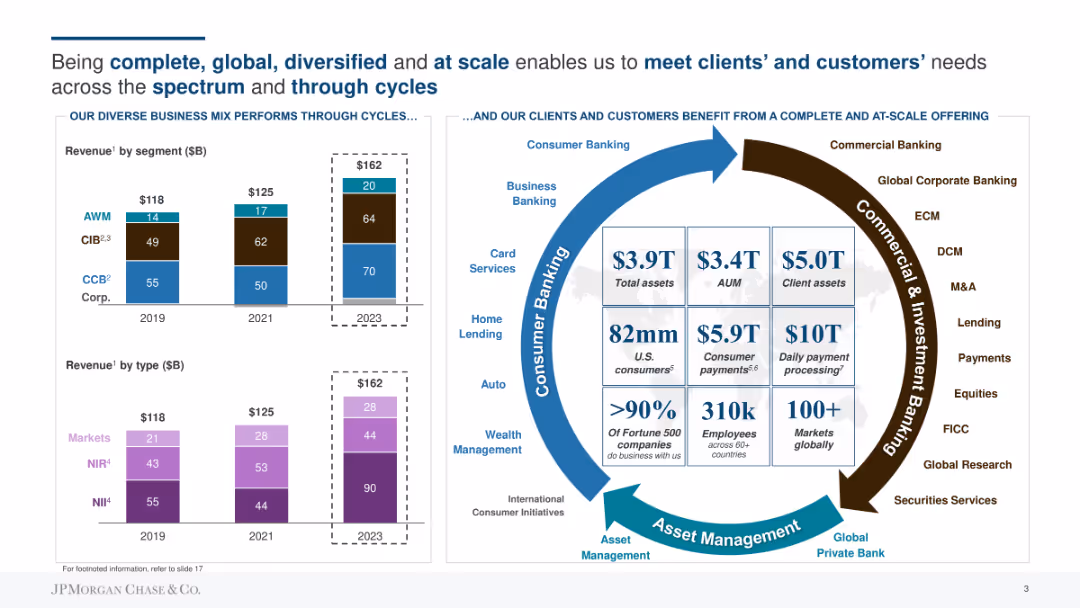
Column charts showing revenue by segment and type, with a circular diagram illustrating diverse business mix benefits.
Market Analysis and Trends
Financial Services
Presents the company's revenue performance by segment and type, emphasizing the diverse business mix and its benefits across cycles.
revenue, business mix, performance, segments, cycles, benefits
false
Market Analysis and Trends
Financial Services
Multiple Chart
JP Morgan
Add to my slides
Remove from favorites
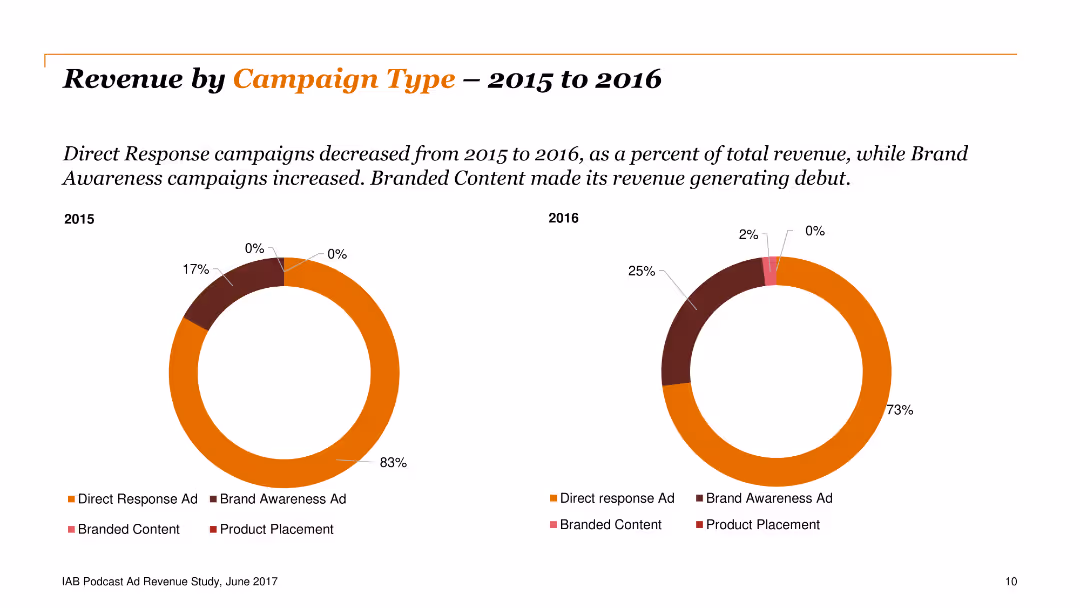
Two doughnut charts comparing campaign types from 2015 to 2016, showing a decline in direct response ads and a rise in brand awareness ads, with branded content emerging.
Financial Performance
Media & Entertainment
The slide analyzes revenue distribution by campaign type, indicating a decrease in direct response ads and an increase in brand awareness and branded content ads. Useful for marketing strategies.
revenue, campaign, type, direct response, brand
false
Financial Performance
Media & Entertainment
Multiple Chart
PwC/Strategy&
Add to my slides
Remove from favorites
The slide includes several column charts comparing revenue, net income, capital, ROE, and overhead ratio from 2011 to 2021 across various banking sectors. It also features demographic data and global presence details.
Financial Performance
Financial Services
This slide showcases JP Morgan's growth in financial metrics like revenue, net income, and capital, alongside ROE and overhead ratios over ten years. It illustrates the expansion and market dominance of the CIB franchise globally, highlighting their extensive reach and efficiency in serving top global businesses.
revenue, capital, global, ROE, banking
false
Financial Performance
Financial Services
Multiple Chart
JP Morgan
Add to my slides
Remove from favorites
Slide includes multiple column charts and bullet points comparing various financial metrics like revenue CAGR, CIR development, RoTE development, and CET1 ratio across different quarters.
Performance Metrics and KPIs
Financial Services
This slide presents key performance indicators for a bank, highlighting trends in revenue, costs, returns on equity, and capital ratios, essential for financial analysis and strategic planning.
Revenue, CIR, RoTE, CET1, financial analysis
false
Performance Metrics and KPIs
Financial Services
Multiple Chart
Deutsche Bank
Add to my slides
Remove from favorites
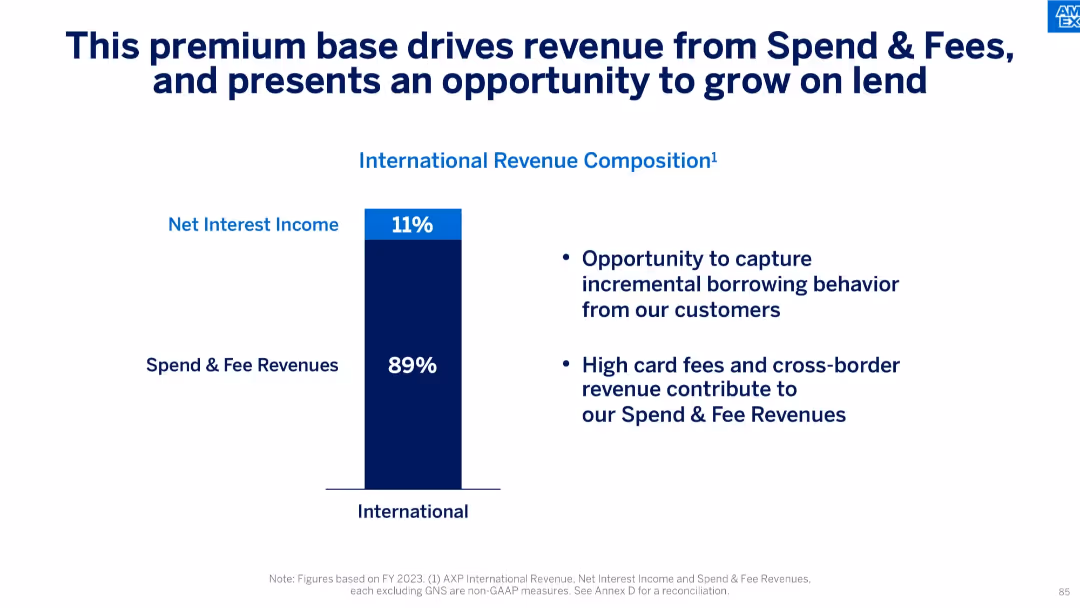
Bar chart with two categories; text emphasizes future lending opportunity and current revenue composition.
Financial Performance
Financial Services
The slide shows that 89% of international revenue comes from spend and fee revenues, with only 11% from net interest income. It highlights an opportunity to expand into lending, building on a strong base of premium, fee-paying customers.
revenue composition, net interest income, spend revenue, fee revenue, lending opportunity, premium base, financial breakdown
false
Financial Performance
Financial Services
Mixed Chart
McKinsey
Add to my slides
Remove from favorites
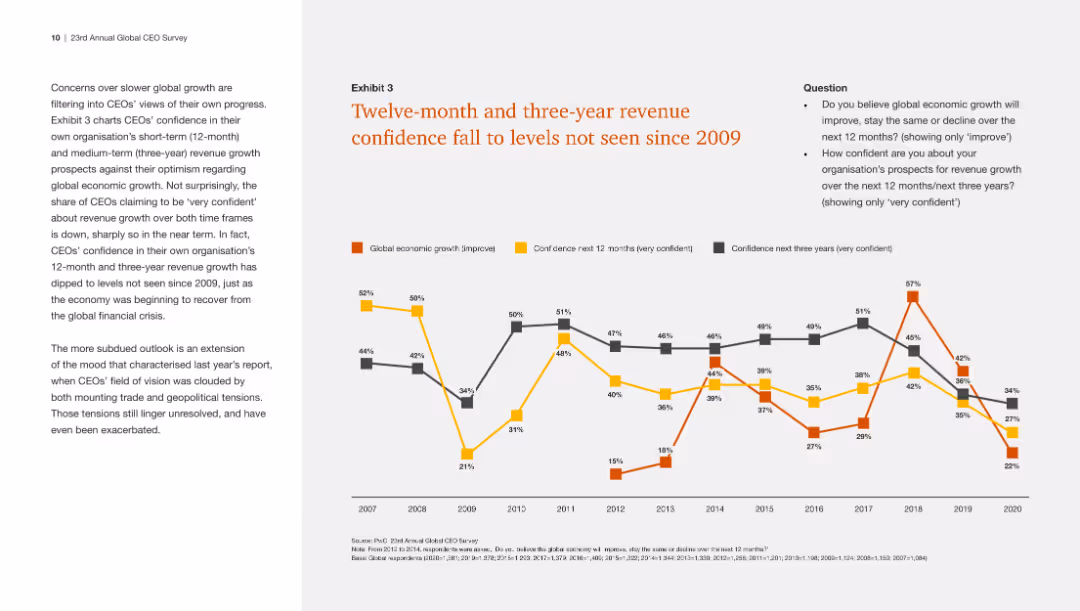
The slide contains a line chart comparing global economic growth confidence with CEOs' confidence in their own revenue growth over the next 12 and 36 months from 2007 to 2020.
Market Analysis and Trends
Financial Services
This slide shows a significant decline in CEOs' confidence in revenue growth, aligning with low confidence in global economic growth, not seen since the global financial crisis.
Revenue confidence, economic growth, CEO outlook, long-term trends
false
Market Analysis and Trends
Financial Services
Mixed Chart
PwC/Strategy&
Add to my slides
Remove from favorites
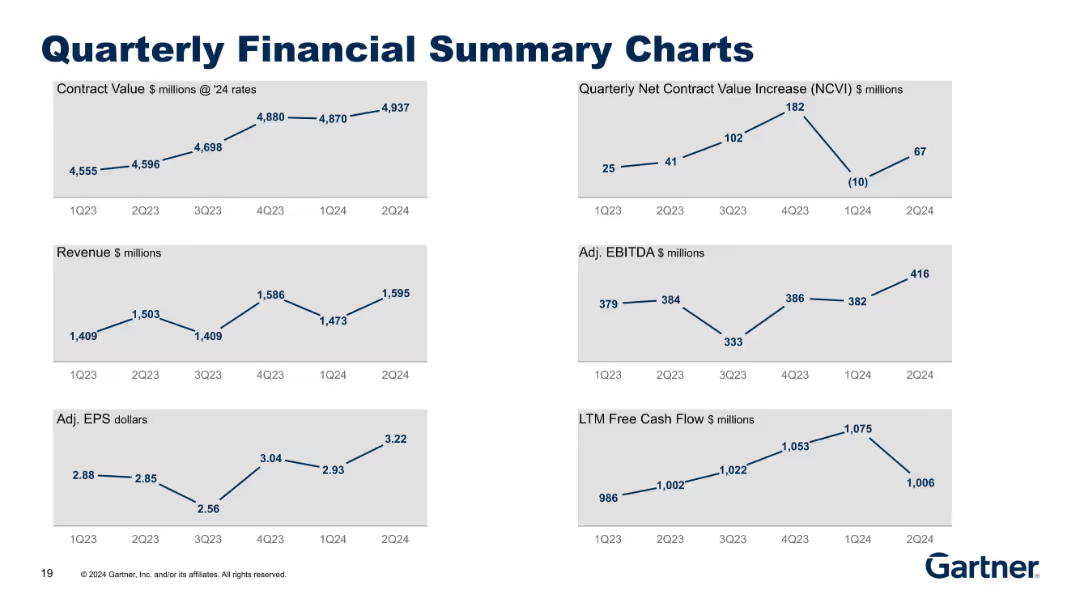
Six compact line charts arranged in a 2x3 grid layout, each with minimal text and numerical data points. Blue lines on light gray backgrounds, simple styling.
Financial Performance
Technology & Software
This slide summarizes key financial metrics across six quarters, including Contract Value, NCVI, Revenue, Adj. EBITDA, EPS, and Free Cash Flow. It highlights both growth trends and fluctuations in core financial KPIs, giving a quick visual overview of financial performance.
revenue, contract value, EBITDA, EPS, cash flow, quarterly, trend, KPIs
false
Financial Performance
Technology & Software
Multiple Chart
Gartner
Add to my slides
Remove from favorites
Two line charts at the top showing Revenue and Contribution Margin trends; below them is a data table.
Financial Performance
Professional Services
This slide presents quarterly revenue and contribution margin data for the Conferences Segment, with clear upward trends through 2022 followed by a slight dip in 1Q23. It includes destination conference numbers and attendees. A note clarifies that 1Q22 was virtual and 1Q23 was in-person.
revenue, contribution margin, growth, attendees, conferences, financials
false
Financial Performance
Professional Services
Multiple Chart
Gartner
Add to my slides
Remove from favorites
Features an image of a student with headphones using a laptop on the left and two content columns on the right with icons. The slide is clear and uses a split-layout design.
Operational Efficiency
Financial Services
Details strategies to maximize revenue and manage costs within core business operations, suitable for financial and operational strategy discussions.
Revenue, Cost Management, Market Share, Operational Strategy
false
Operational Efficiency
Financial Services
Header Horizontal
Morgan Stanley
Add to my slides
Remove from favorites
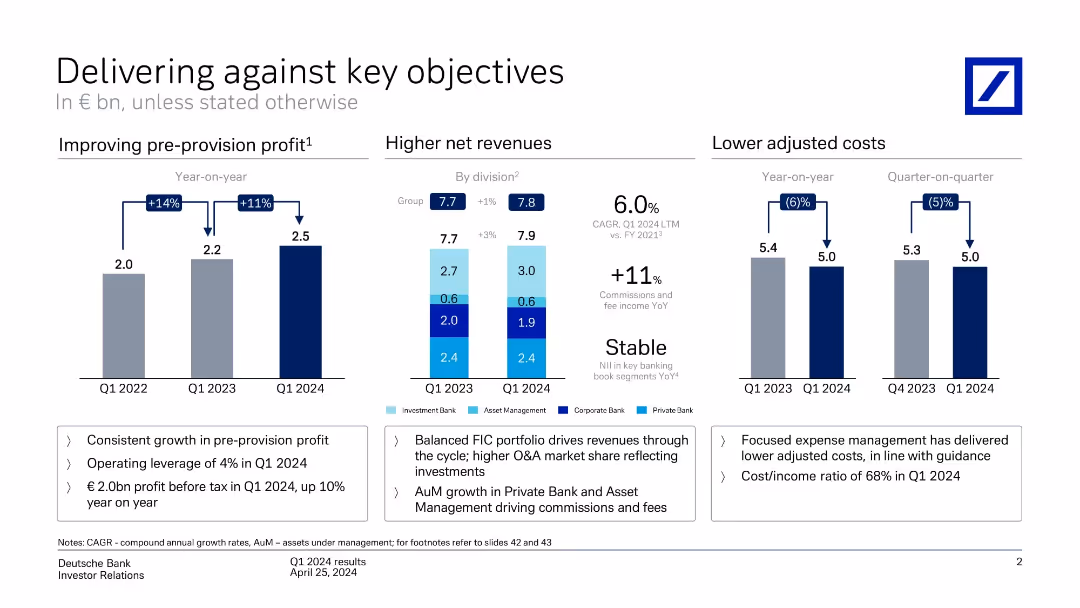
Three-part layout: bar charts for pre-provision profit, net revenue by division, and adjusted costs. Color-coded by segment with highlights below.
Performance Metrics and KPIs
Financial Services
Shows year-on-year improvement in pre-provision profit (+11%), stable revenue (+1%), and decreased costs (-6%). Emphasizes operating leverage, cost/income ratio, and revenue growth from balanced business model.
revenue, costs, profit, KPIs, business units, growth
false
Performance Metrics and KPIs
Financial Services
Multiple Chart
Deutsche Bank
Add to my slides
Remove from favorites
Multiple tables and a column chart showing divisional revenues and key financial metrics such as net interest margin and CET1 ratio. Lists key highlights in bullet points.
Financial Performance
Financial Services
Overview of financial highlights for Q1 2023, focusing on revenue growth, cost management, and risk, providing a snapshot of the bank's financial health.
Revenue, costs, provisions, financial health
false
Financial Performance
Financial Services
Mixed Chart
Deutsche Bank
Add to my slides
Remove from favorites
Two doughnut charts comparing dynamically inserted ads versus integrated ads between 2015 and 2016, showing an increase in dynamic ads from 37% to 56%.
Financial Performance
Media & Entertainment
The slide compares revenue by delivery mechanism, highlighting the increase in dynamically inserted ads from 2015 to 2016. Useful for analyzing shifts in advertising strategies.
revenue, delivery, mechanism, ads, dynamic
false
Financial Performance
Media & Entertainment
Multiple Chart
PwC/Strategy&
Add to my slides
Remove from favorites
Two pie charts comparing firmwide revenue by region and segment, additional infographics for headcount diversity. Blue and white color scheme with a structured layout.
Strategic Planning
Financial Services
Explores the international revenue distribution by region and segment and highlights diversity in workforce composition, emphasizing the company's global market reach.
Revenue distribution, diversity, global market, segmentation
false
Strategic Planning
Financial Services
Mixed Chart
Goldman Sachs
Add to my slides
Remove from favorites
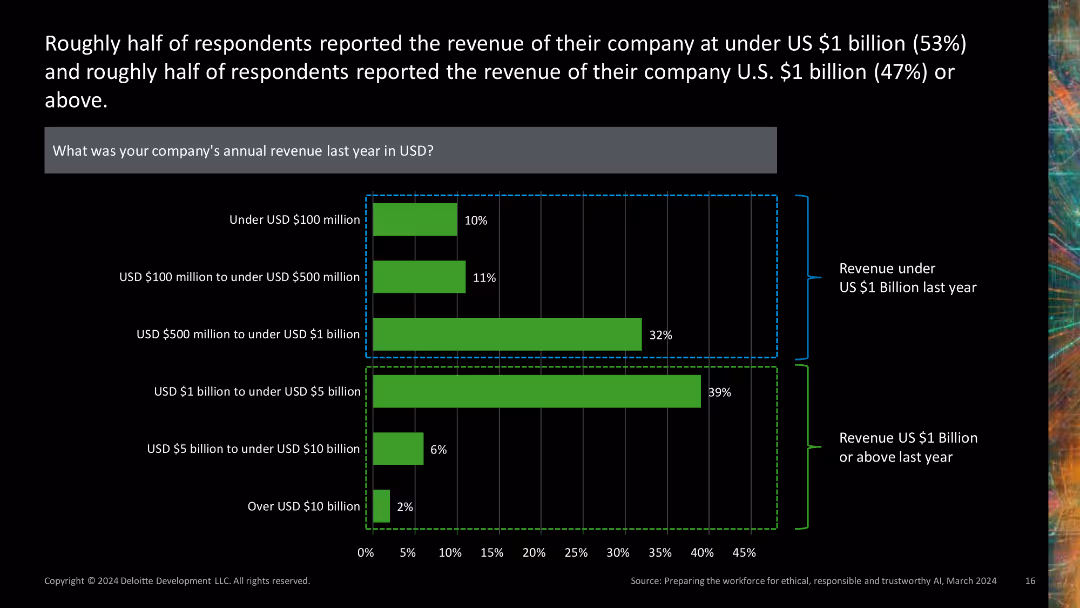
This slide presents a combination of a horizontal bar chart and stacked bar chart, depicting company revenue distributions. The green and black color scheme is used, with revenue ranges clearly labeled.
Financial Performance
Financial Services
It provides insights into the revenue distribution of companies, showing that about half reported revenues under $1 billion, while the other half reported revenues of $1 billion or more.
revenue, distribution, financial, chart, company
false
Financial Performance
Financial Services
Single Chart
Deloitte
Add to my slides
Remove from favorites
The slide is divided into segments showing the revenue increase over five years attributed to banking, markets, and flow activities with a final tally in 2018 using a column chart.
Financial Performance
Financial Services
It analyzes JPMorgan’s revenue segments, displaying a diversified strategy in banking and markets that collectively contribute to the year-end financial growth.
revenue diversification, banking, markets, financial growth, strategy, performance evaluation
false
Financial Performance
Financial Services
Single Chart
JP Morgan
Add to my slides
Remove from favorites
Features multiple pie charts depicting the company's revenue breakdown by business segment, property type, and geographic region. The design is clean, with the use of blue tones and percentage labels on each pie chart sector.
Market Analysis and Trends
Real Estate & Construction
The slide breaks down the company's revenue sources, highlighting diversification across business activities, property types, and geographic regions. It's used to demonstrate market positioning and growth strategy in real estate and investment services.
revenue diversification, business segments, growth strategy
false
Market Analysis and Trends
Real Estate & Construction
Multiple Chart
Goldman Sachs
Add to my slides
Remove from favorites
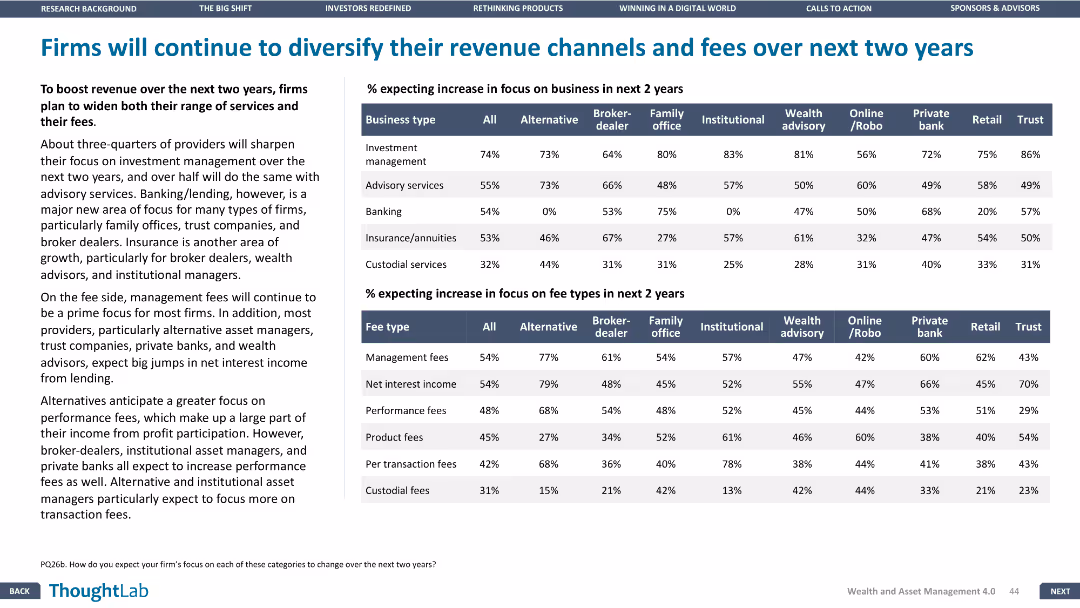
This slide features two tables and a column chart. The layout is dense and information-heavy, showing multiple data points about expected increases in business focus and fee types over the next two years.
Strategic Planning
Financial Services
The slide projects how firms plan to diversify their revenue channels and fees in the next two years, with data on the expected increase in focus on various business types and fee types.
Revenue diversification, fee types, future planning, business focus, projections
false
Strategic Planning
Financial Services
Header Vertical
Deloitte
Add to my slides
Remove from favorites
The slide features a pie chart depicting 2020 revenue by region, alongside bulleted text summarizing key points about global diversification and operational scope. The chart is color-coded and includes percentages for each region.
Market Analysis and Trends
Industrial & Manufacturing
This slide details the global revenue diversification for TI Fluid Systems in 2020, highlighting no single geography dominates their market, supporting global stability and reducing market-specific risks.
revenue, diversification, global, pie chart, 2020
false
Market Analysis and Trends
Industrial & Manufacturing
Mixed Chart
Deutsche Bank
Add to my slides
Remove from favorites
A stacked column chart and pie chart slide with a segmented breakdown of revenue by region and business lines. Blue and brown hues denote different business areas.
Market Analysis and Trends
Financial Services
Showcases a financial firm’s revenue diversification and scale of operations, reflecting robust business performance across regions and services.
revenue, diversification, global, scale, financial, operations, performance, analysis
false
Market Analysis and Trends
Financial Services
Mixed Chart
JP Morgan
Add to my slides
Remove from favorites
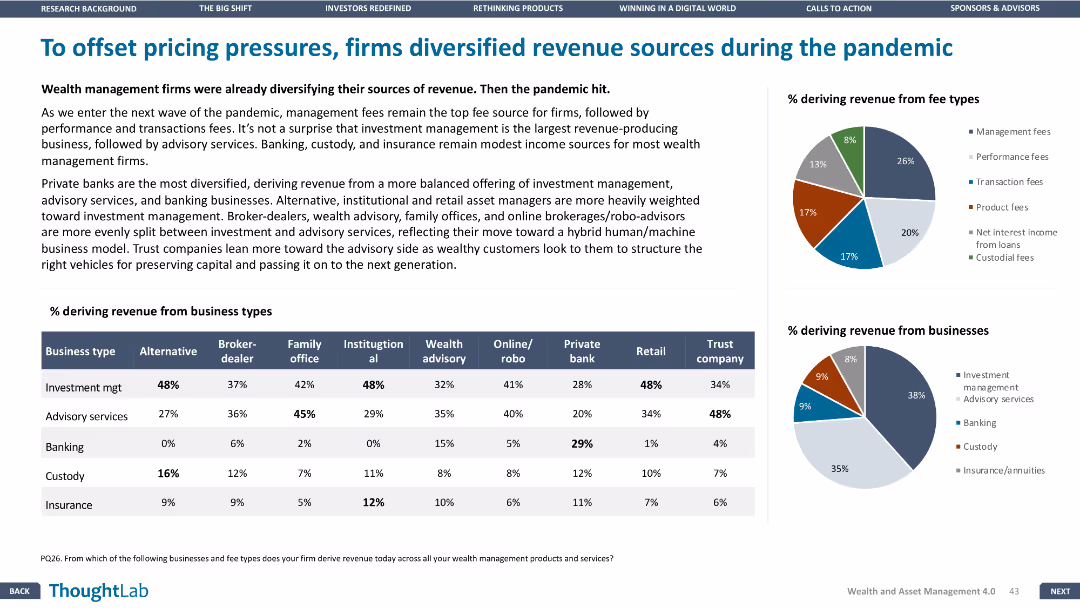
This slide has a column chart, pie charts, and a table. The layout is dense with multiple visual elements and minimal white space.
Strategic Planning
Financial Services
The slide discusses how wealth management firms diversified their revenue sources during the pandemic, with data showing the percentage of revenue from different business types and fee types.
Revenue, diversification, pandemic, wealth management, business types, fee types
false
Strategic Planning
Financial Services
Multiple Chart
Deloitte
Add to my slides
Remove from favorites
Multiple graphs including a column chart for net revenue performance, and line charts for spreads, unemployment, and household debt.
Financial Performance
Financial Services
This slide showcases SP’s revenue diversification and stable performance through various economic cycles, highlighting key financial metrics.
Revenue diversification, performance, economic cycles, financial metrics, net revenue
false
Financial Performance
Financial Services
Multiple Chart
Credit Suisse
Add to my slides
Remove from favorites
The slide features column charts and a pie chart to show sector revenue diversification across various sectors including Pharma, Public Sector, GAFA, and CPG.
Market Analysis and Trends
Financial Services
The slide presents a revenue growth analysis of different sectors, highlighting CAGR from 2019-2022 and the share of revenue by sector in 2022.
Revenue diversification, sector analysis, column chart, pie chart, CAGR
false
Market Analysis and Trends
Financial Services
Multiple Chart
IPSOS
Add to my slides
Remove from favorites
Contains two pie charts contrasting current and future revenue composition, with an arrow indicating the strategic direction. The charts are supported by a clean, minimalist design.
Financial Performance
Financial Services
Highlights strategies to improve revenue durability and return on equity, indicating a planned shift in segment revenue composition, and emphasizing the growth of management and incentive fees.
Revenue, Durability, Returns, Management Fees
false
Financial Performance
Financial Services
Diagram
Goldman Sachs
Add to my slides
Remove from favorites
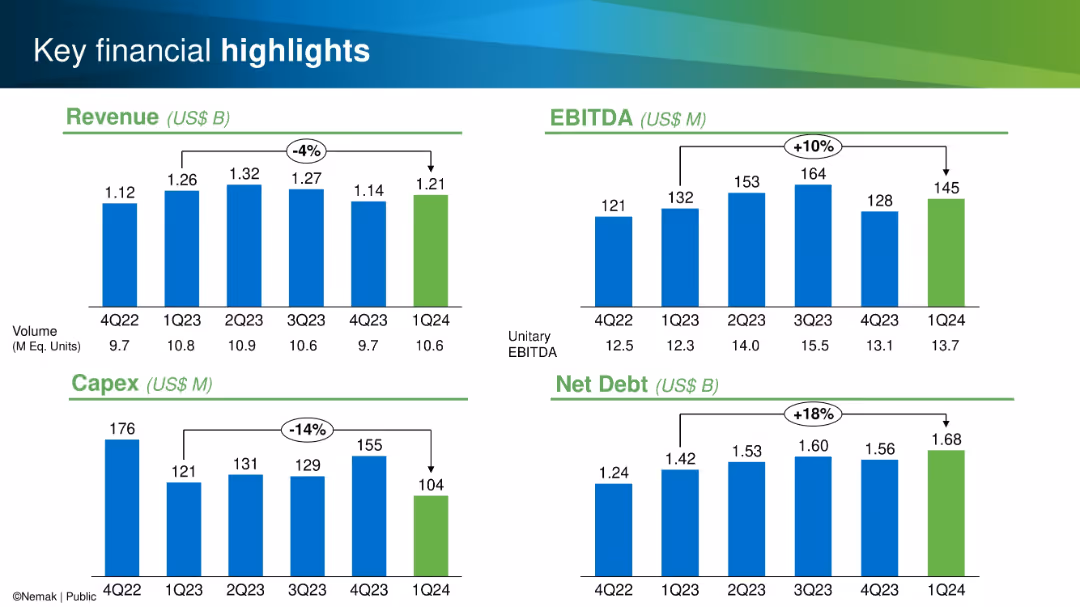
Four quadrant bar chart layout; metrics for Revenue, EBITDA, Capex, and Net Debt shown with color-coded bars
Financial Performance
Industrial & Manufacturing
This slide highlights quarterly performance metrics: revenue, EBITDA, capex, and net debt from Q4 2022 to Q1 2024. Trends and percentage changes are clearly marked to emphasize performance fluctuations and financial trajectory.
Revenue, EBITDA, Capex, Net Debt, Financials, Quarterly, Performance, Manufacturing, Metrics, Trends
false
Financial Performance
Industrial & Manufacturing
Single Chart
Barclays
Add to my slides
Remove from favorites
Previous
Next
You don't have any favorites yet.
Please wait loading your favorites slides...
Create a FREE account to continue browsing
Receive Instant Access to 1,000+ slides from companies like McKinsey, Google, and Goldman Sachs
First Name
Last Name
Email
Password
I agree to all
Terms & Privacy Policy
Thank you! Your submission has been received!
Oops! Something went wrong while submitting the form.
Have an account?
Sign in
Upgrade to PRO to Save slides
Advanced Search and Filters
Access to 15,000+ slides
Access to Category Pages
Save/Bookmark Slides
PowerPoint Template Library
Pick a Plan
MONTHLY
$12/month
Billed every month, Cancel anytime.
YEARLY
$9/year
Billed $108 annually, Cancel anytime.
Checkout for $12/month
Checkout for $108/yr
Secured by Stripe | AES-256 bit encryption


![Exhibit 20 Net Retail NPL Inflow Volume Expected Growth [TRY bn, 2010-23]](https://cdn.prod.website-files.com/654e70fb59937215cac87b19/6877e20cd3e003a12e252c5d_-1BPcc4XA2drmU3q8q8uD2TVUEsWp3M0fkQk0SH2ock.avif)
![Exhibit 23 Retail NPL Sales Volume Expected Growth [TRY bn, 2010-23]](https://cdn.prod.website-files.com/654e70fb59937215cac87b19/6877e2161751f53f0c622983_BBai_k5b7CnS4pR6UgLlakGIJy5wz9d3QWqKrQsthSg.avif)