My Account
My Slides
Search by Category
Pricing
Templates
View All Templates
Download Template Slides
✦ AI Search
Feedback
Login
Logout
Get Started
Browse all Slides
Browse all Slides
Create a FREE Account
Instant access to 1,000+ real slides from top companies like McKinsey, BCG, Goldman Sachs, Google and many more!
First Name
Last Name
Email
Password
I agree to all
Terms & Privacy Policy
Thank you! Your submission has been received!
Oops! Something went wrong while submitting the form.
Have an account?
Sign in
Saved Slides
Total No. of slides saved
0
↻ Refresh
✖ Clear all
Text heavy with definitions of financial strength and resilience dimensions in bullet points paired with a column chart.
Operational Efficiency
Professional Services
Describes the construction of a resilience index using company metrics across multiple dimensions like financial health and sustainability.
Resilience index, financial health, sustainability, metrics, operational efficiency
false
Operational Efficiency
Professional Services
Mixed Chart
Accenture
Add to my slides
Remove from favorites
Showcases column charts comparing the capabilities of industry leaders against their peers, with a focus on resilience, optimism, and performance metrics during uncertainties.
Investment Analysis
Financial Services
Highlights how companies with strong resilience capabilities tend to outperform their industry peers in terms of total shareholder returns and operational effectiveness, particularly in times of macroeconomic challenges.
resilience, industry comparison, shareholder returns, macroeconomic challenges
false
Investment Analysis
Financial Services
Multiple Chart
BCG
Add to my slides
Remove from favorites
This slide features column charts comparing resilience levels across different industries such as Utilities, Consumer Products, etc., marked with lines indicating quartiles.
Market Analysis and Trends
Financial Services
The slide presents Bain Resilience Index benchmarks for various industries, illustrating the variance in resilience among Nordic non-financial companies.
Resilience, Nordic companies, Industry comparison, Benchmarking, Utilities, Consumer Products, Technology, Healthcare
false
Market Analysis and Trends
Financial Services
Single Chart
Bain
Add to my slides
Remove from favorites
The slide is composed of a central text section flanked by two horizontal sections with icons and brief text. The upper section has three groups of three icons, each depicting macro-environment, market forces, and competitive landscape factors. The lower section has three columns listing strategic actions underlined by colored segments saying 'GLOBAL', 'COMPLETE', 'DIVERSIFIED'.
Strategic Planning
Financial Services
This slide outlines a strategic approach focusing on maintaining discipline, optimizing the current model, and transforming for the future, with the aim of maintaining leadership in a competitive landscape through efficient financial management and technology investment. The slide is likely used for executive presentations or investor briefings.
resilience, optimization, leadership, strategy, financial management
false
Strategic Planning
Financial Services
Linear Flow
JP Morgan
Add to my slides
Remove from favorites
A combination of hexagonal, column and scatter plot charts measuring performance dimensions across industries, showing how companies with high resilience outperform peers.
Performance Metrics and KPIs
Professional Services
Focuses on the performance metrics of companies exhibiting strong resilience and how it correlates with long-term profitable growth.
resilience, performance metrics, industries, profitable growth, outperform, bar charts, long-term, performance dimensions
false
Performance Metrics and KPIs
Professional Services
Multiple Chart
Accenture
Add to my slides
Remove from favorites
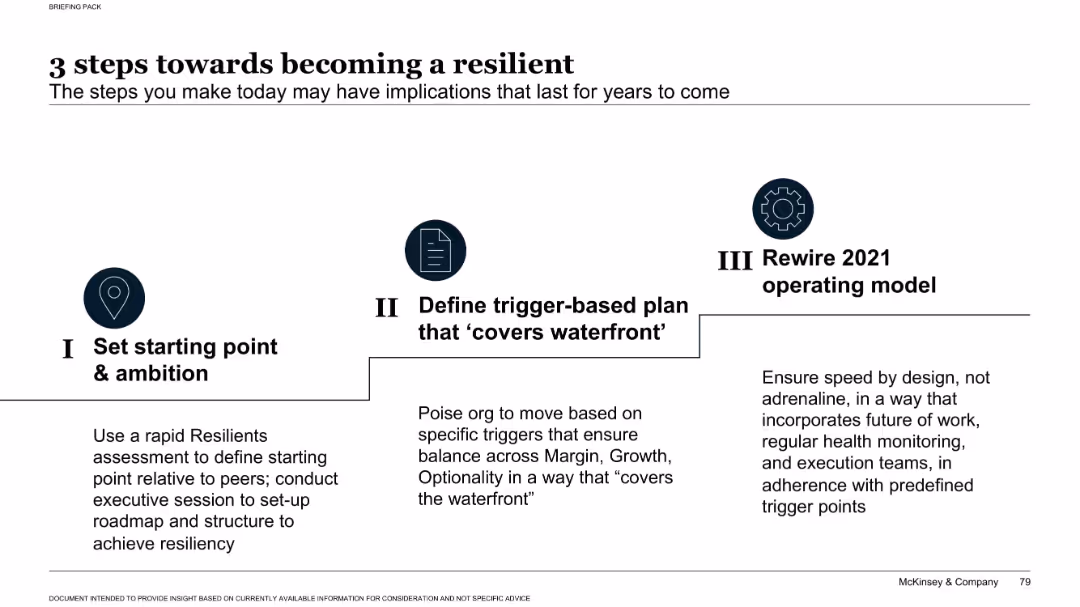
Horizontal 3-step layout with icons and minimal text under each step. Clean and professional visual structure.
Strategic Planning
Professional Services
The slide outlines three key steps for building resilience in organizations: setting a starting point and ambition, creating a trigger-based plan, and rewiring the operating model. It emphasizes proactive preparation for future disruptions.
resilience, planning, operating model, strategy, triggers, transformation, execution, ambition, McKinsey, roadmap
false
Strategic Planning
Professional Services
Linear Flow
McKinsey
Add to my slides
Remove from favorites
The slide has a dark background with column charts showing data on platform adopters' resilience
Strategic Planning
Financial Services
It discusses how platform adopters are more resilient than non-platform companies with relevant data
Resilience, Platform Strategy, Finance, Technology, Supply Chain
false
Strategic Planning
Financial Services
Multiple Chart
Accenture
Add to my slides
Remove from favorites
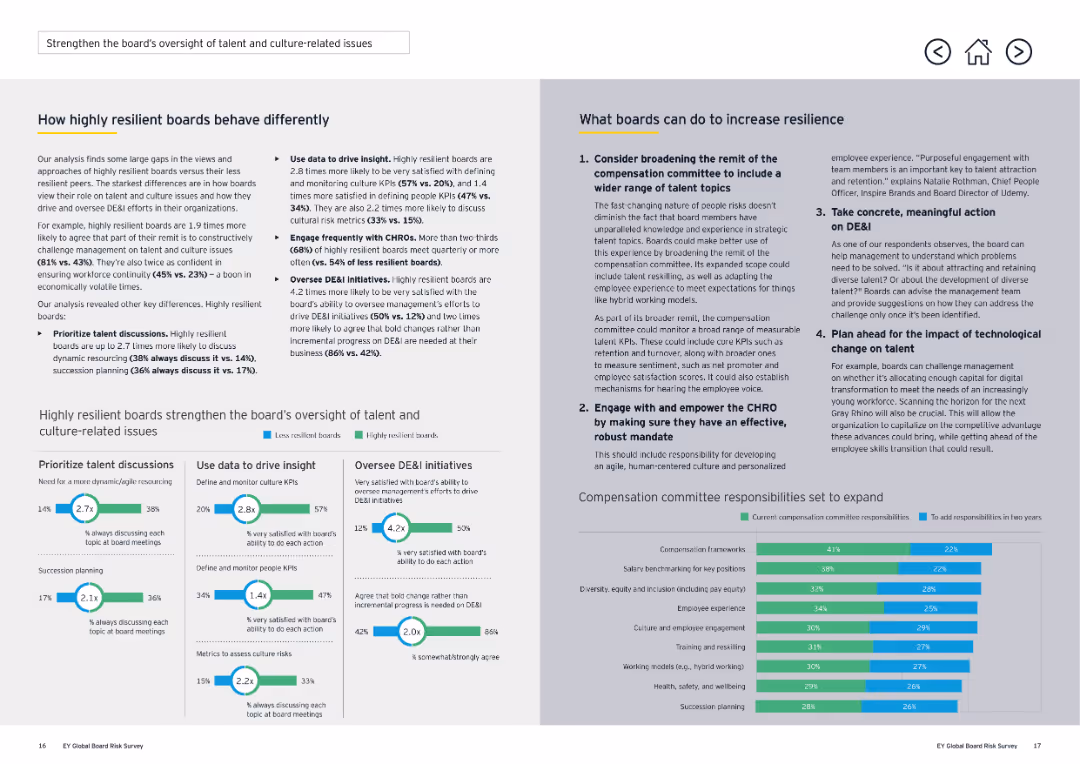
The slide features a two-column layout with text and a column chart. The left side explains resilient board behaviors, and the right side suggests actions to increase resilience.
Risk Assessment and Management
Financial Services
The slide discusses how highly resilient boards behave differently in managing sociopolitical issues and provides steps boards can take to enhance resilience.
resilience, sociopolitical, boards, governance, material issues
false
Risk Assessment and Management
Financial Services
Multiple Chart
EY
Add to my slides
Remove from favorites
Features a bold title, a line graph comparing 'Resilients' and 'Non-Resilients', and bulleted text explaining the key takeaways.
Strategic Planning
Professional Services
Highlights the importance of speed and discipline for companies during economic downturns, as evidenced by performance metrics.
Resilience, speed, discipline, economic downturn, performance metrics
false
Strategic Planning
Professional Services
Mixed Chart
McKinsey
Add to my slides
Remove from favorites
Lists key strategic points enhancing business resilience, alongside financial structures and risk mitigation approaches.
Strategic Planning
Transportation & Logistics
Summarizes Faurecia's strategic responses to market challenges, detailing flexibility and risk management.
resilience, strategy, risk management, business model, market conditions, flexibility
false
Strategic Planning
Transportation & Logistics
Boxed
Deutsche Bank
Add to my slides
Remove from favorites
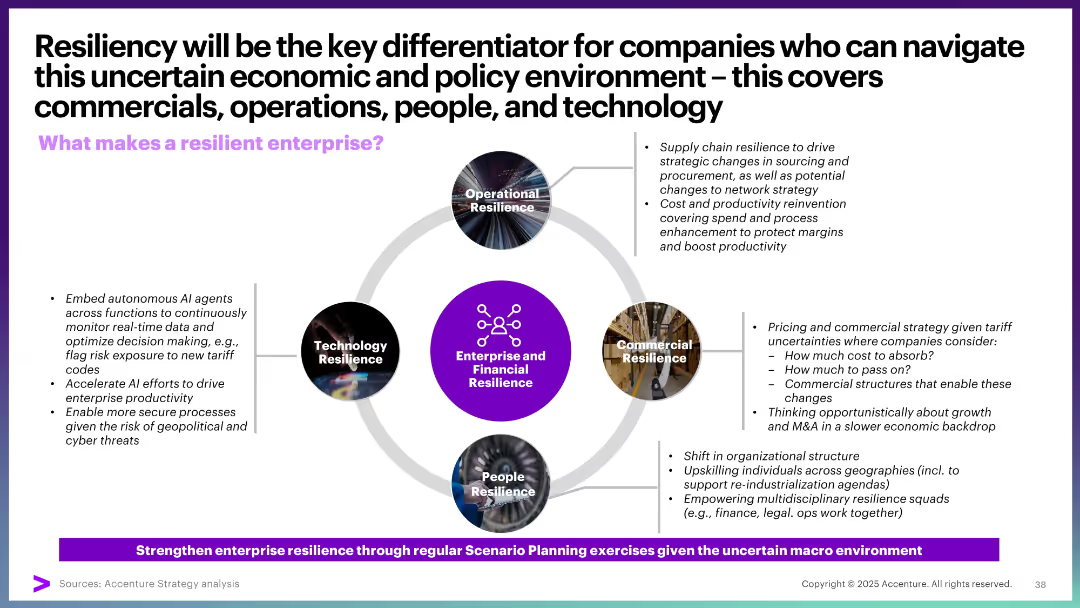
Circular diagram in center with five labeled segments, each with supporting text explanations
Strategic Planning
Professional Services
The slide emphasizes enterprise and financial resilience across five pillars: Operational, Commercial, People, and Technology. It lists key strategic moves in each area to navigate uncertainty, such as supply chain shifts, AI deployment, pricing strategies, and organizational transformation.
resilience, supply chain, pricing, AI, commercial, operations, strategy, uncertainty
false
Strategic Planning
Professional Services
Framework
Accenture
Add to my slides
Remove from favorites
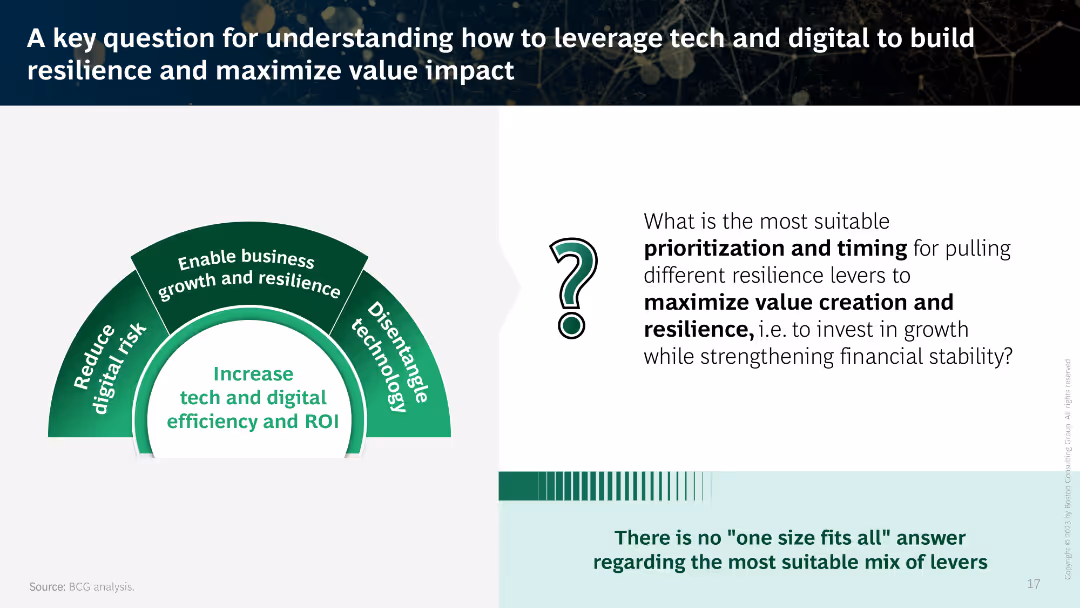
This slide features a combination of graphical elements and text. It includes a semi-circular diagram highlighting four key areas for leveraging tech and digital.
Strategic Planning
Technology & Software
The slide poses a question on prioritization and timing for resilience levers to maximize value creation and resilience while strengthening financial stability.
resilience, tech, digital, value creation, prioritization
false
Strategic Planning
Technology & Software
Framework
BCG
Add to my slides
Remove from favorites
The slide has a pie chart and column charts about organizational capability to manage global supply chain contingencies.
Operational Efficiency
Technology & Software
This slide discusses how organizations manage third-party resilience, focusing on supply chain contingencies and their capabilities.
resilience, third-party, supply chain, capability, survey
false
Operational Efficiency
Technology & Software
Multiple Chart
Deloitte
Add to my slides
Remove from favorites
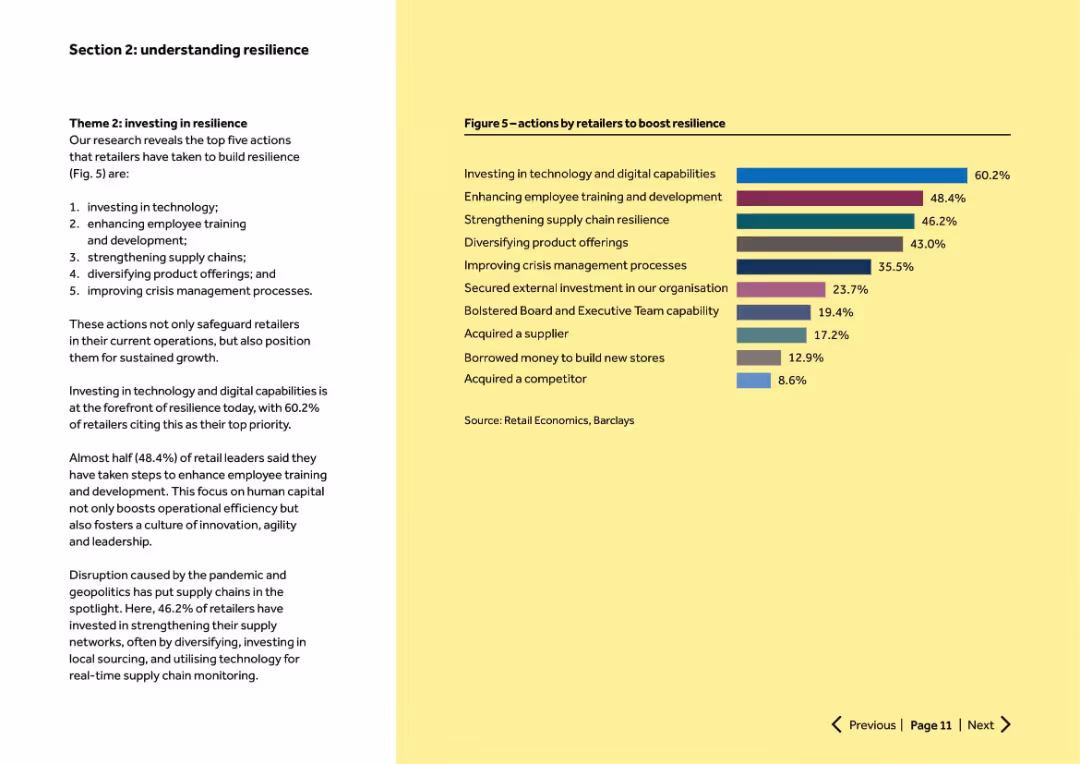
Left column text outlines top 5 resilience actions. Right side has a horizontal bar chart showing % adoption of actions.
Human Resources and Talent Management
Retail & E-commerce
Highlights top retailer resilience strategies: investing in technology, employee training, supply chain strengthening, product diversification, and crisis management. Shows relative importance of each initiative via survey percentages.
resilience, training, tech investment, crisis management, supply chain
false
Human Resources and Talent Management
Retail & E-commerce
Mixed Chart
Barclays
Add to my slides
Remove from favorites
This slide is content-heavy, featuring a three-column text layout. The left column provides a large title and a brief introduction. The central and right columns are filled with detailed text explaining business assurance and emergency preparedness plans. Each column has a sub-header and bulleted lists. The design is straightforward, with minimal graphics and a color palette of white, blue, and green.
Risk Assessment and Management
Professional Services
The slide outlines the company’s strategies for maintaining resilience through business assurance and emergency preparedness programs. It addresses planning, risk mitigation, and stakeholder coordination. The slide is intended for internal company use, detailing procedural approaches and readiness for various disruption scenarios. It's suitable for employee orientations or internal strategy meetings.
resilience, workforce, business assurance, emergency preparedness, business continuity, stakeholder coordination
false
Risk Assessment and Management
Professional Services
Text Only
Booz Allen Hamilton
Add to my slides
Remove from favorites
This slide showcases a close-up image of a wet umbrella, with annotations highlighting potential business challenges like Earnings miss, Liquidity crunch, etc.
Strategic Planning
Professional Services
Focuses on defining strategic goals for business resilience, enumerating critical challenges that businesses might face under stress.
Resiliency, Business challenges, Strategic planning, Liquidity, Bankruptcy
false
Strategic Planning
Professional Services
Linear Flow
Bain
Add to my slides
Remove from favorites
Contains columns outlining various resiliency capabilities in dynamic product development, autonomous production, and agile organization, using circular icons and connecting arrows.
Operational Efficiency
Industrial & Manufacturing
Analyzes different resiliency capabilities needed in engineering, supply, production, and operations, emphasizing investment priorities in dynamic and sustainable product development, among others.
resiliency, dynamic development, autonomous production, agile organization, investment priorities, engineering, supply chain, Accenture Research
false
Operational Efficiency
Industrial & Manufacturing
Header Vertical
Accenture
Add to my slides
Remove from favorites
Features a maturity score chart across industries like aerospace, high-tech, and automotive, showing levels of resiliency maturity using a horizontal bar graph with a scoring scale.
Risk Assessment and Management
Industrial & Manufacturing
Provides a comparative analysis of resiliency maturity scores by industry, showing variations and benchmarks, and stressing the need for advanced capabilities in handling disruptions.
resiliency, industry analysis, maturity scores, benchmarking, capability advancement, disruption handling, Accenture Research
false
Risk Assessment and Management
Industrial & Manufacturing
Mixed Chart
Accenture
Add to my slides
Remove from favorites
This slide includes a bar graph displaying missed growth opportunities due to lack of resiliency across various industries like high-tech, utilities, and automotive. The graph uses shades of purple to distinguish between industries.
Risk Assessment and Management
Industrial & Manufacturing
Highlights the revenue loss across different industries due to insufficient resiliency and the importance of investing in capabilities that counteract disruptions in engineering, supply, and production.
resiliency, industry comparison, revenue loss, growth opportunities, engineering, supply chain, disruption management, Accenture Research
false
Risk Assessment and Management
Industrial & Manufacturing
Mixed Chart
Accenture
Add to my slides
Remove from favorites
Contains multiple pie charts illustrating investment in resiliency factors like relocation, automation, and digitization. The slide is visually balanced with text and data sections.
Strategic Planning
Industrial & Manufacturing
This slide details various investment areas for companies looking to improve resilience over the next three years. It focuses on significant increases in spending for automation, digitization, and resourcing, along with the perceived benefits and challenges of these investments.
resiliency, investment, automation, digitization, strategic planning
false
Strategic Planning
Industrial & Manufacturing
Multiple Chart
Accenture
Add to my slides
Remove from favorites
The slide mixes text and small graphs to discuss how resilient boards use different strategies to manage risk and improve decision-making.
Risk Assessment and Management
Professional Services
The slide emphasizes the strategic actions highly resilient boards take to manage risk, such as reviewing governance structures, engaging with trends, and embedding risk in performance reviews.
resilient boards, risk management, decision-making, professional services, governance, strategies, performance reviews
false
Risk Assessment and Management
Professional Services
Multiple Chart
EY
Add to my slides
Remove from favorites
The slide includes detailed text and small graphs to explain how highly resilient boards behave differently and the steps to increase resilience.
Risk Assessment and Management
Professional Services
The slide outlines how resilient boards are proactive in risk management, use data-driven decision-making, and embed risk strategies within business operations, offering actionable steps for improvement.
resilient boards, risk management, professional services, resilience, decision-making, data-driven, improvement steps
false
Risk Assessment and Management
Professional Services
Mixed Chart
EY
Add to my slides
Remove from favorites
This slide uses a mix of text and pie charts to illustrate the characteristics of highly resilient boards, their behaviors, and differentiating factors.
Strategic Planning
Professional Services
The slide identifies key traits of highly resilient boards, focusing on their ability to handle emerging risks, align strategy with risk management, and sustain business operations.
resilient boards, strategic planning, risk management, professional services, behaviors, pie charts, resilience
false
Strategic Planning
Professional Services
Multiple Chart
EY
Add to my slides
Remove from favorites
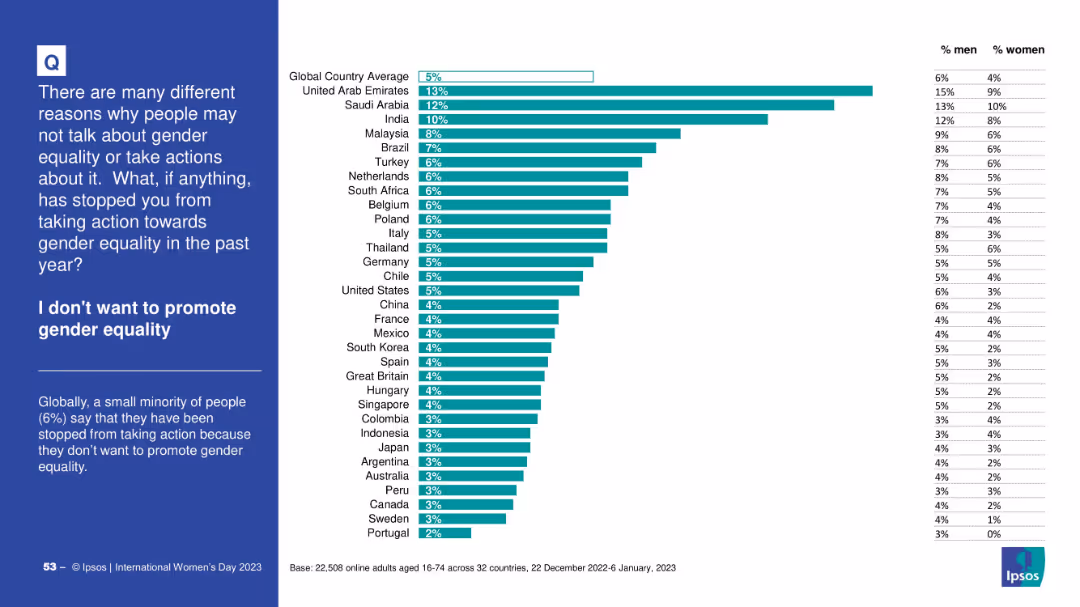
Consistent bar chart format showing reluctance to promote gender equality; left side has title and summary; gender breakdown on the right.
Strategic Planning
Government & Public Sector
This slide presents the proportion of respondents who deliberately chose not to promote gender equality. The global average is 5%, with UAE and Saudi Arabia higher. Gender differences are subtle but present.
resistance, opposition, gender equality, promotion, Ipsos, country variation
false
Strategic Planning
Government & Public Sector
Mixed Chart
IPSOS
Add to my slides
Remove from favorites
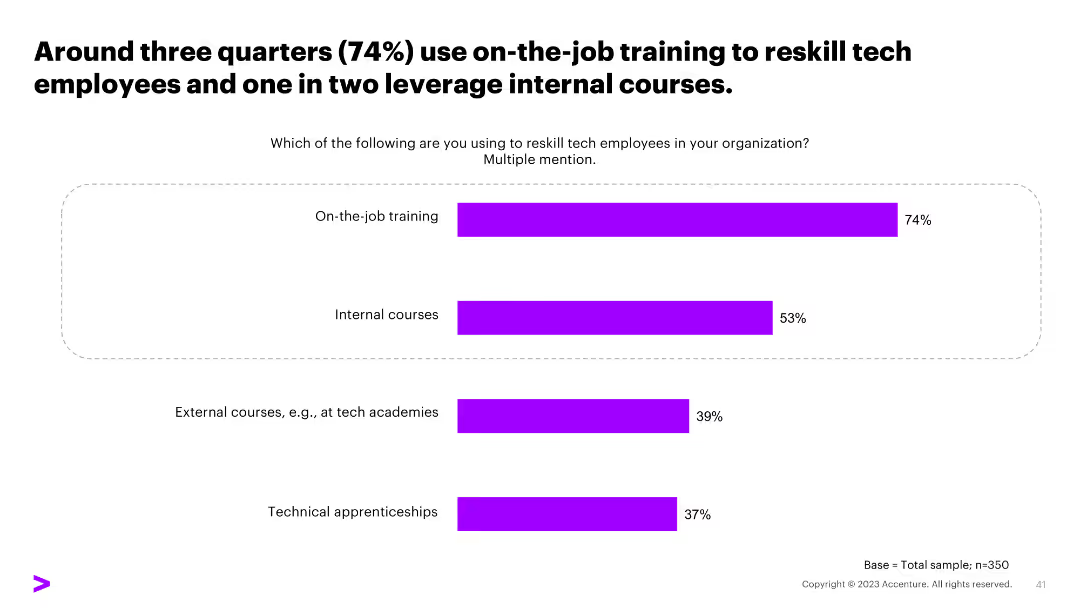
A horizontal bar chart on this slide illustrates the methods used to reskill employees, such as on-the-job training, internal courses, external courses, and technical apprenticeships.
Human Resources and Talent Management
Professional Services
The slide outlines the various methods organizations use to reskill their employees, with on-the-job training and internal courses being the most commonly used methods.
reskilling methods, training, internal courses, external courses, apprenticeships
false
Human Resources and Talent Management
Professional Services
Single Chart
Accenture
Add to my slides
Remove from favorites
Includes a bar chart comparing current and future human-machine working hours, and a pie chart showing reskilling needs of employees.
Operational Efficiency
Financial Services
Highlights the need for reskilling employees in the insurance industry due to shifts in labor between humans and machines, emphasizing digitization and automation impacts.
Reskilling needs, Human-machine working hours, Insurance industry, Digitization, Automation
false
Operational Efficiency
Financial Services
Multiple Chart
EY
Add to my slides
Remove from favorites
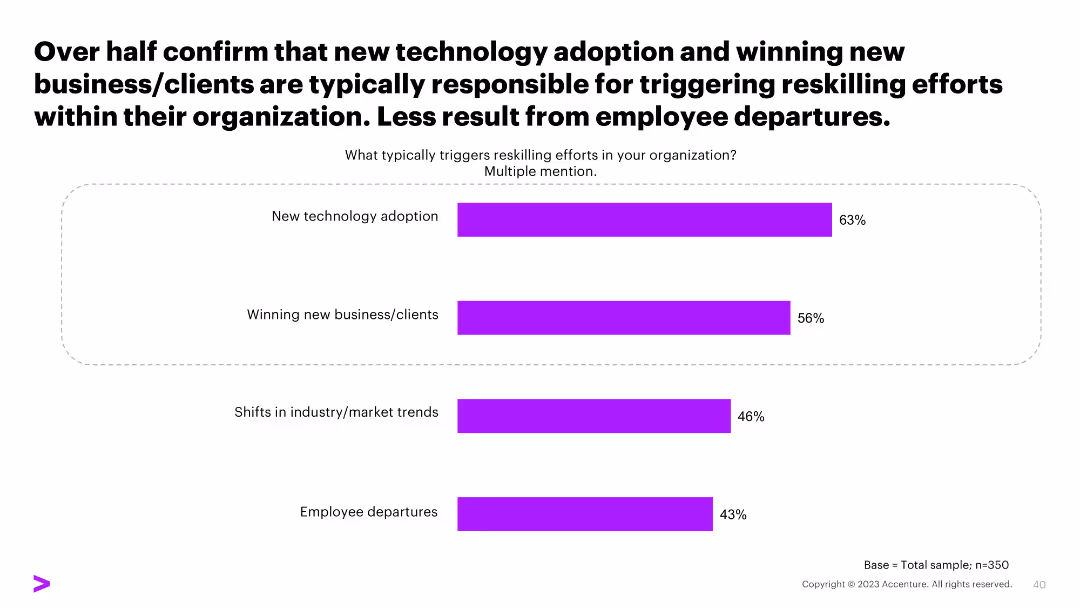
This slide includes a horizontal bar chart showing factors that trigger reskilling efforts within organizations, such as new technology adoption, winning new clients, market trends, and employee departures.
Human Resources and Talent Management
Professional Services
The slide details the primary factors that prompt reskilling efforts in organizations, with new technology adoption and winning new clients being the top triggers.
reskilling, technology adoption, market trends, clients, employee departures
false
Human Resources and Talent Management
Professional Services
Single Chart
Accenture
Add to my slides
Remove from favorites
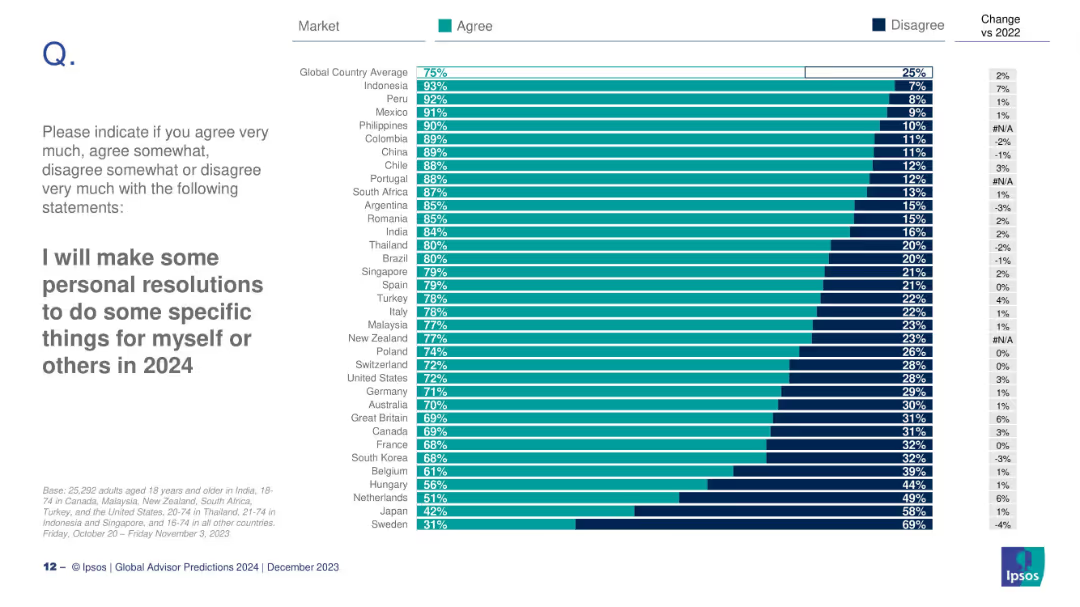
Bar chart ranking countries by agreement with the resolution statement; includes global average and change vs 2022.
Human Resources and Talent Management
Professional Services
This slide ranks countries by intent to make personal resolutions in 2024. Indonesia (93%) and Peru (92%) lead, while Sweden (31%) and Japan (42%) are lowest.
resolutions, 2024, personal goals, cross-country, Ipsos, intentions, habits
false
Human Resources and Talent Management
Professional Services
Mixed Chart
IPSOS
Add to my slides
Remove from favorites
The slide has a clear, structured format with two main sections, each containing checkmark lists. The design uses a simple blue and white color scheme.
Operational Efficiency
Financial Services
This slide details strategic measures for resource management across different risk areas, with a focus on people strategy and liquidity. It is typically used for corporate strategy presentations.
resource management, risk dimensions, strategy, liquidity, capital, people management, Goldman Sachs, COVID-19, private equity, investment
false
Operational Efficiency
Financial Services
Table
Goldman Sachs
Add to my slides
Remove from favorites
Slide with icons representing different support mechanisms alongside a green color scheme, and text blocks outlining the mismatches in resources for college decision-making.
Human Resources and Talent Management
Education & Training
Discusses the mismatch between the resources available and those desired by students for making informed decisions about college, with a focus on first-generation students.
resources, college, decision-making, first-gen, support
false
Human Resources and Talent Management
Education & Training
Pillar
BCG
Add to my slides
Remove from favorites
List of additional resources and readings related to advanced connectivity, providing further knowledge exploration.
Technology and Digital Transformation
Professional Services
Provides a curated list of resources for deeper understanding of connectivity trends and their implications.
Resources, Connectivity, 5G, IoT, Digital Transformation, Knowledge Center
false
Technology and Digital Transformation
Professional Services
Uncategorized
McKinsey
Add to my slides
Remove from favorites
A content slide featuring text on the left and a column chart on the right. The chart shows expected changes in FTE risk management professionals over the next five years.
Human Resources and Talent Management
Financial Services
The slide discusses the projected increase in risk management resources in banks' first and second lines of defense, highlighting expected headcount changes.
resources, FTE, risk management, first line, second line
false
Human Resources and Talent Management
Financial Services
Multiple Chart
EY
Add to my slides
Remove from favorites
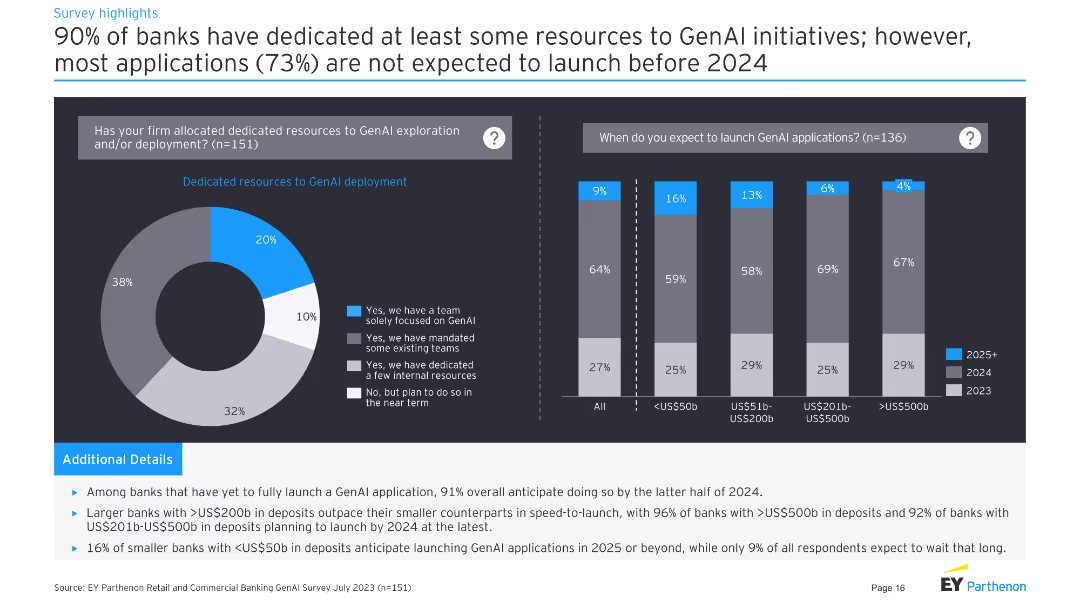
Left: pie chart on resource dedication to GenAI. Right: column chart on expected launch timelines for GenAI applications.
Strategic Planning
Financial Services
Shows that 90% of banks have dedicated resources to GenAI, with most applications not expected to launch before 2024.
resources, GenAI, deployment, launch, timeline
false
Strategic Planning
Financial Services
Multiple Chart
EY
Add to my slides
Remove from favorites
The slide contains two column charts displaying operating expenses and risk-weighted assets over different periods. It uses a minimalistic design with blue and white colors and clear annotations.
Operational Efficiency
Financial Services
The slide explains the efficient utilization of resources with a focus on cost management and RWA efficiency. It shows changes in operating expenses and risk-weighted assets, emphasizing disciplined expense management.
Resource Utilization, Cost Efficiency, RWA, Operating Expenses, Capital Management
false
Operational Efficiency
Financial Services
Multiple Chart
Credit Suisse
Add to my slides
Remove from favorites
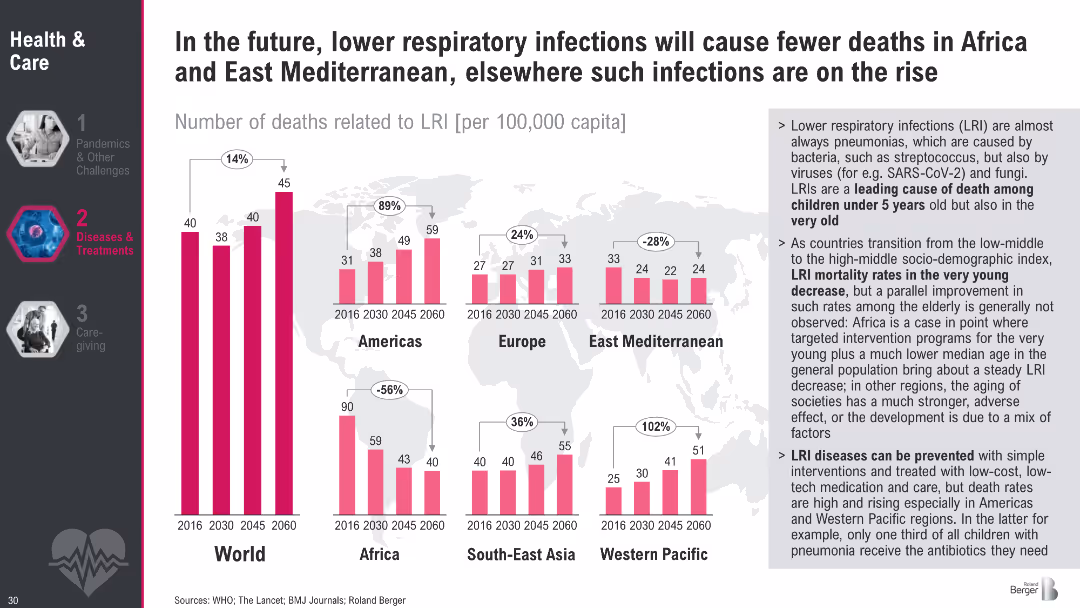
Bar charts with death rates from lower respiratory infections by region (2016–2060); sidebar with insights
Market Analysis and Trends
Healthcare & Pharmaceuticals
This slide highlights divergent trends in deaths from lower respiratory infections. While Africa and East Mediterranean are projected to see decreases, other regions—especially Western Pacific—will experience rising mortality.
respiratory infections, LRI, pneumonia, global trends, infectious diseases, WHO, mortality rate, projections
false
Market Analysis and Trends
Healthcare & Pharmaceuticals
Multiple Chart
Roland Berger
Add to my slides
Remove from favorites
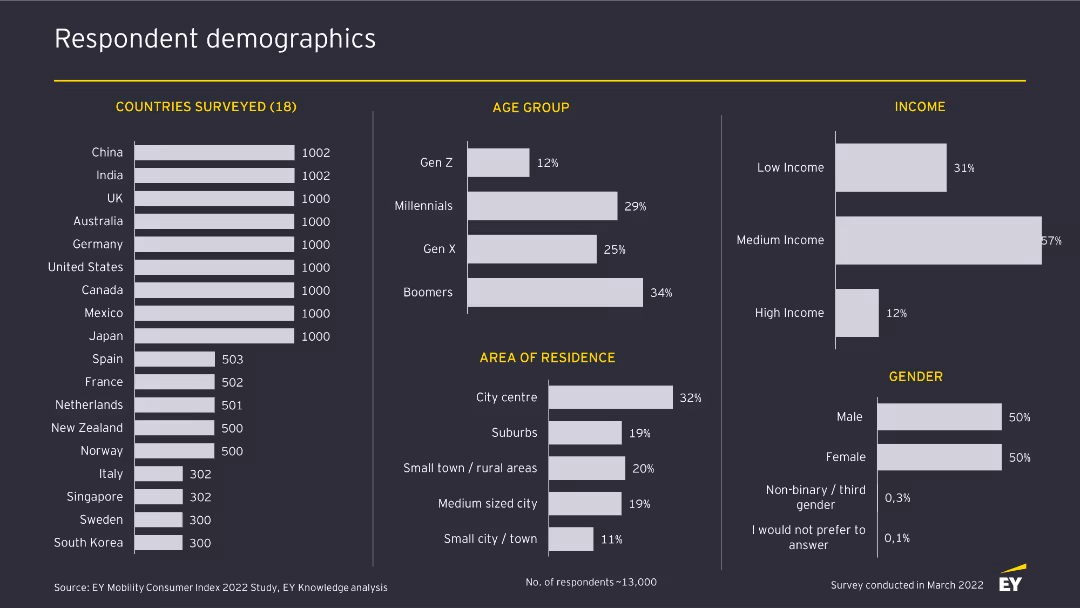
This slide presents various bar and column charts depicting the demographics of survey respondents, including country, age group, area of residence, income, and gender.
Market Analysis and Trends
Transportation & Logistics
The slide provides a detailed demographic breakdown of respondents, showing their distribution across 18 countries, different age groups, income levels, residential areas, and gender.
Respondent demographics, survey data, market research, automotive industry, consumer insights
false
Market Analysis and Trends
Transportation & Logistics
Multiple Chart
EY
Add to my slides
Remove from favorites
Two column charts on the left showing 2022 ad spend distribution, and two pie charts on the right showing company type and job position distributions.
Customer and Market Segmentation
Professional Services
Provides an overview of the respondent profile in terms of 2022 ad spend, company type, and job positions, with data presented in column and pie charts.
respondent profile, ad spend, company type, job position, market segmentation
false
Customer and Market Segmentation
Professional Services
Multiple Chart
IPSOS
Add to my slides
Remove from favorites
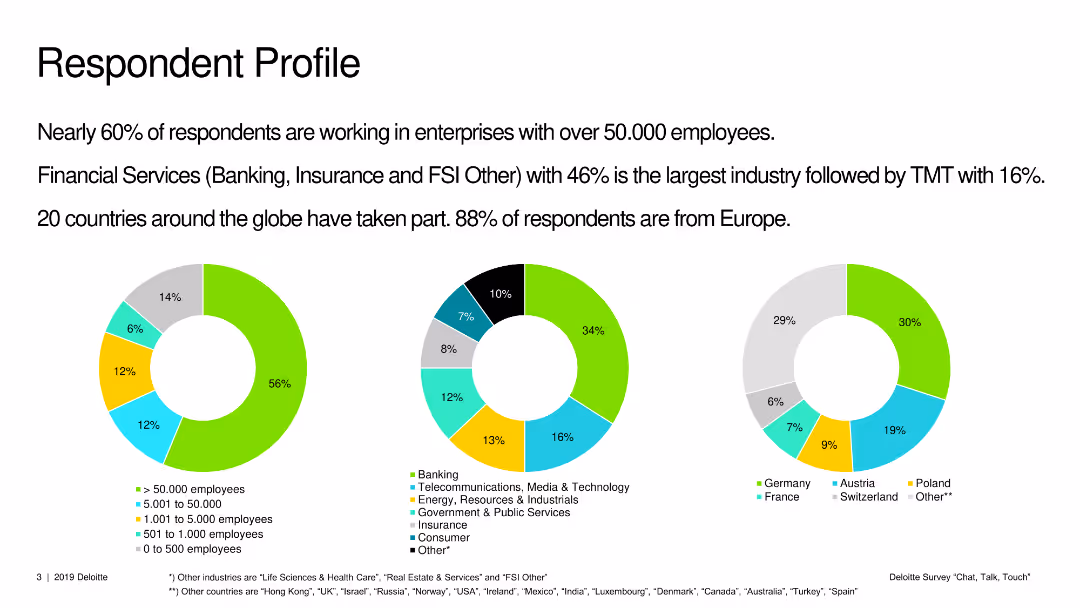
Three pie charts showing the profile of survey respondents by company size, industry, and geographic location.
Market Analysis and Trends
Professional Services
The slide outlines the demographic breakdown of survey respondents, detailing their company sizes, industries, and regions.
respondent profile, company size, industry, geography, survey, demographics
false
Market Analysis and Trends
Professional Services
Multiple Chart
Deloitte
Add to my slides
Remove from favorites
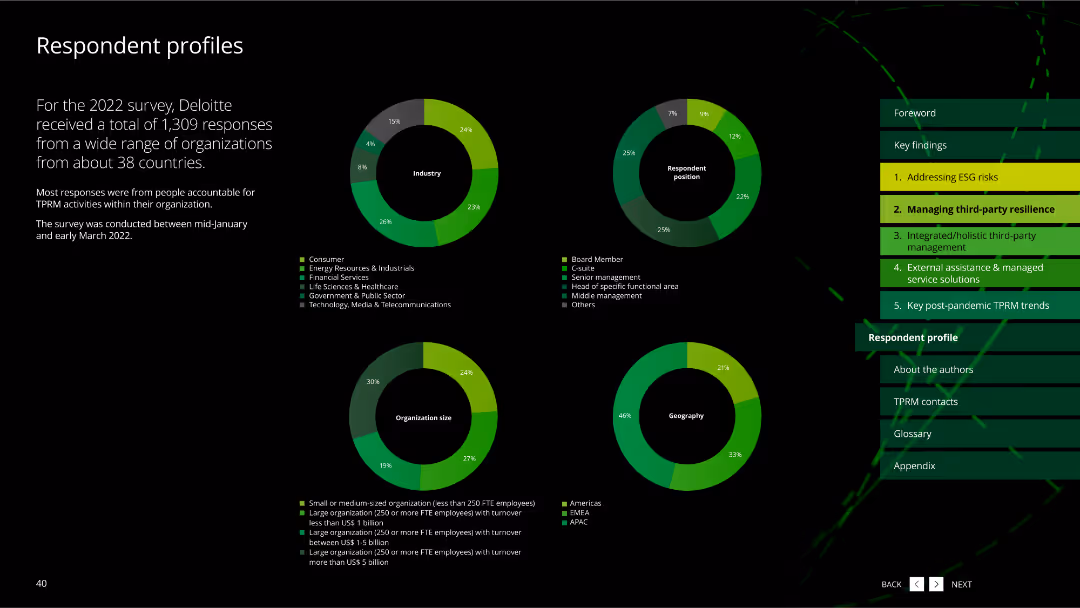
This slide includes multiple pie charts showing the distribution of survey respondents by industry, position, organization size, and geography.
Market Analysis and Trends
Professional Services
It provides an overview of the profiles of respondents who participated in the 2022 TPRM survey, detailing their industry, position, organization size, and geographical distribution.
respondent profiles, survey data, pie charts, industry, position, organization size, geography, professional services
false
Market Analysis and Trends
Professional Services
Multiple Chart
Deloitte
Add to my slides
Remove from favorites
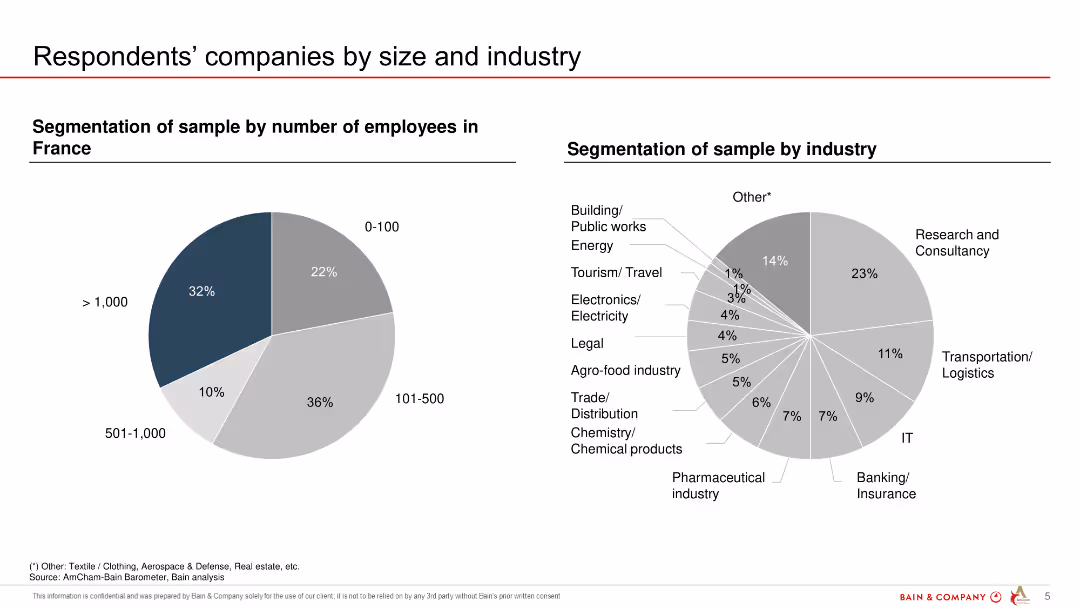
Two pie charts showing the segmentation of respondents' companies by number of employees and industry in France.
Market Analysis and Trends
Professional Services
The slide presents the breakdown of survey respondents' companies by size and industry, providing insights into the sample's composition.
respondents, company size, industry segmentation, France, market analysis, survey demographics
false
Market Analysis and Trends
Professional Services
Multiple Chart
Bain
Add to my slides
Remove from favorites
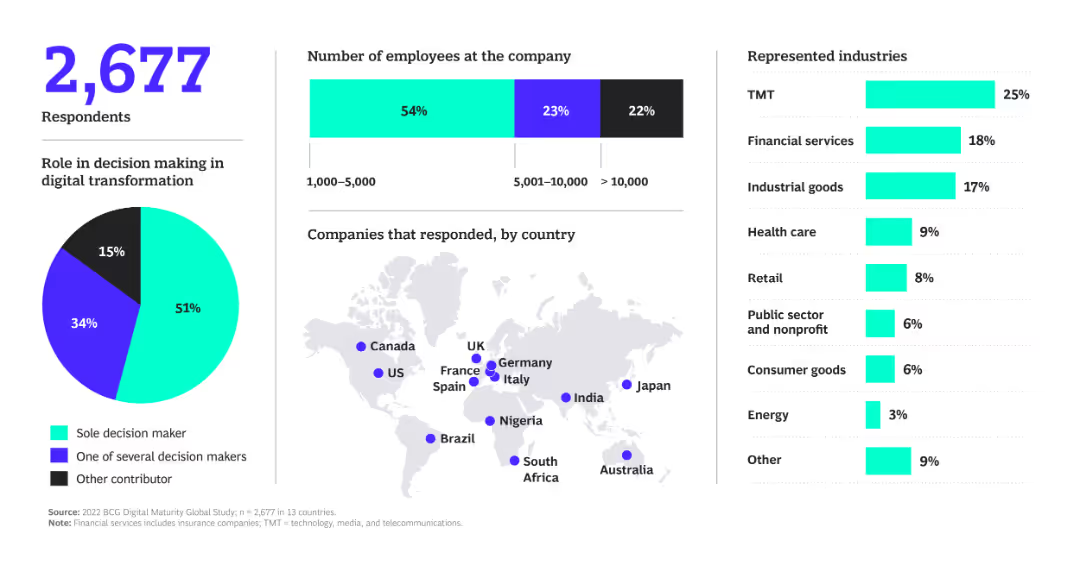
The slide features various visual elements, including a pie chart, bar chart, and map to show respondents' roles, company sizes, and countries.
Technology and Digital Transformation
Professional Services
The slide provides data on the number of respondents, their roles in decision-making, and the countries they represent.
respondents, decision making, company size, countries, digital transformation
false
Technology and Digital Transformation
Professional Services
Multiple Chart
BCG
Add to my slides
Remove from favorites
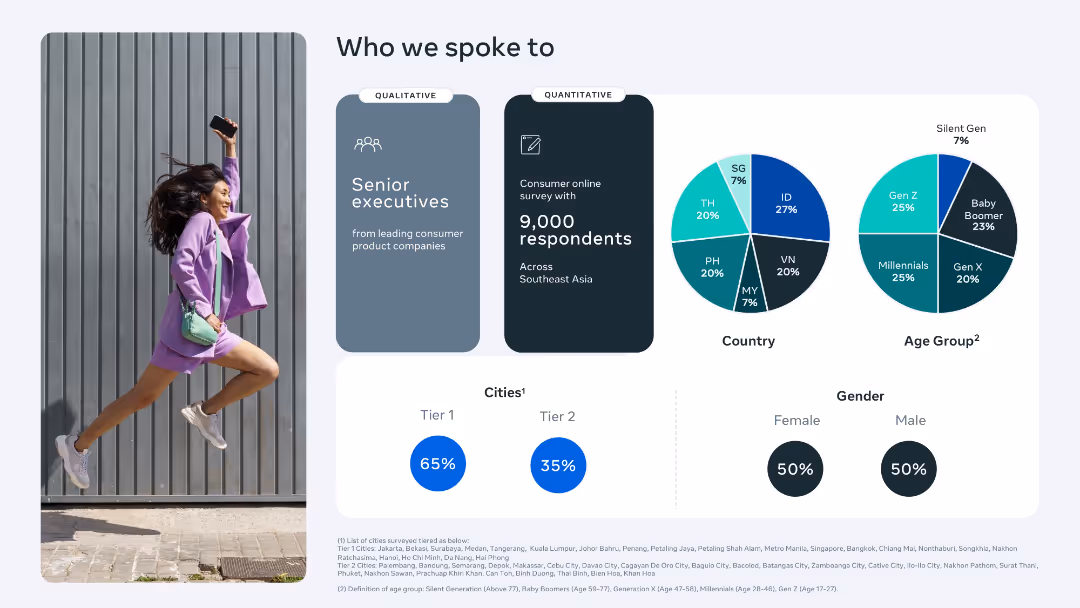
Split layout with photo on left and pie charts on right; includes demographic breakdowns and survey sample info.
Customer and Market Segmentation
Consumer Goods
The slide provides an overview of the demographic and geographic breakdown of survey participants, including 9,000 respondents across Southeast Asia. It highlights age group, country, gender, and city tier distributions.
respondents, demographics, survey, Southeast Asia, age groups, gender, city tiers, market segmentation, consumer insights, country representation
false
Customer and Market Segmentation
Consumer Goods
Mixed Chart
Bain
Add to my slides
Remove from favorites
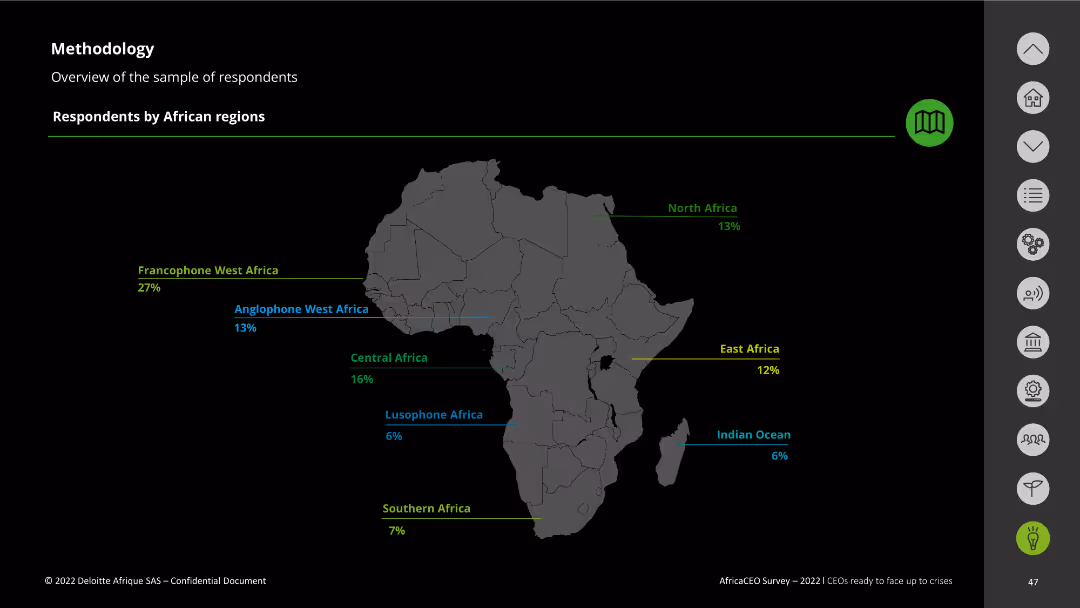
The slide features a map of Africa with regions highlighted and text describing respondents' distribution by African regions.
Strategic Planning
Professional Services
It gives a breakdown of survey respondents by African regions, providing context for the demographic distribution of the data collected.
respondents distribution, African regions, survey demographics, Africa CEO Survey
false
Strategic Planning
Professional Services
Graphic
Deloitte
Add to my slides
Remove from favorites
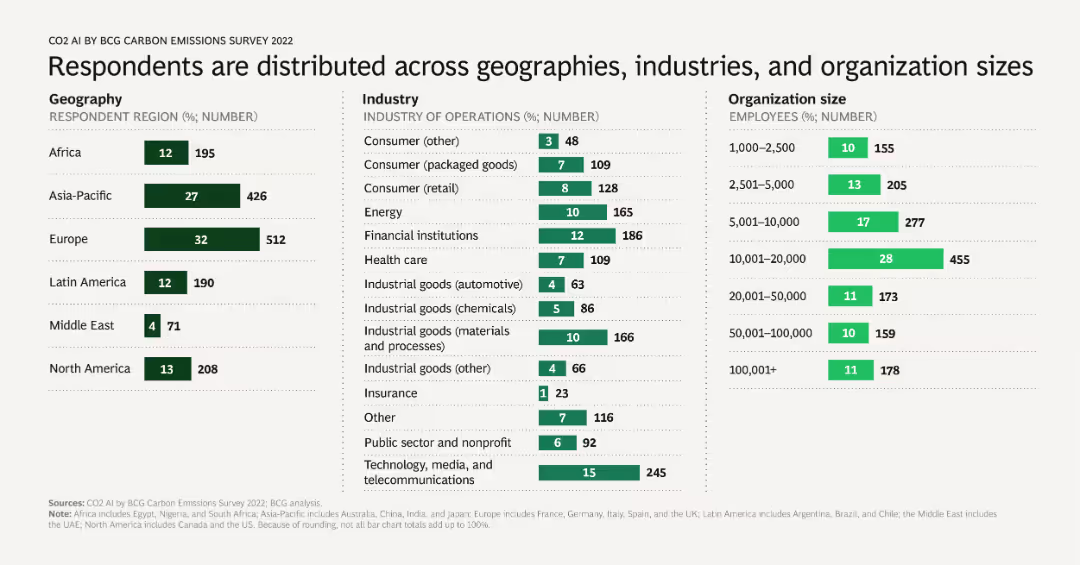
The slide includes a table that distributes respondents by geography, industry, and organization size.
Market Analysis and Trends
Professional Services
This slide provides a distribution of survey respondents across different geographies, industries, and organization sizes, offering a comprehensive view of the survey's coverage.
Respondents, distribution, geography, industry, organization size
false
Market Analysis and Trends
Professional Services
Multiple Chart
BCG
Add to my slides
Remove from favorites
The slide features four illustrated avatars with descriptions below each one. The layout is clean, with ample white space and consistent design elements.
Market Analysis and Trends
Education & Training
Describes four key respondent groupings based on attitudes to work, family life, money, society, and other factors, providing insights into their characteristics.
Respondents, Groupings, Attitudes, Work, Family Life, Money, Society, Well-being, Success, Fame
false
Market Analysis and Trends
Education & Training
Pillar
Deloitte
Add to my slides
Remove from favorites
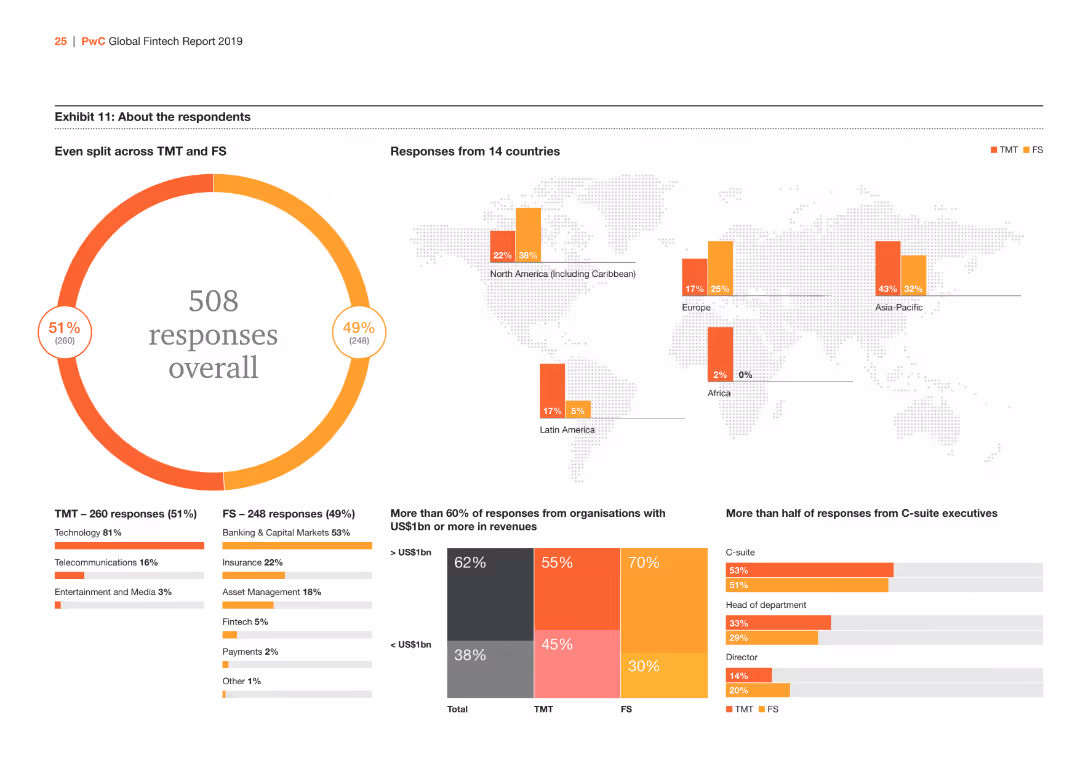
The slide uses a combination of pie charts and column charts to show the demographics and sectors of survey respondents. It includes a map to depict the geographical distribution of respondents.
Market Analysis and Trends
Financial Services
It provides an overview of the respondents' demographics in the survey, including the split between TMT and FS, geographical distribution, industry sectors, and company size.
Respondents, Survey, Demographics, TMT, FS, Map
false
Market Analysis and Trends
Financial Services
Multiple Chart
PwC/Strategy&
Add to my slides
Remove from favorites
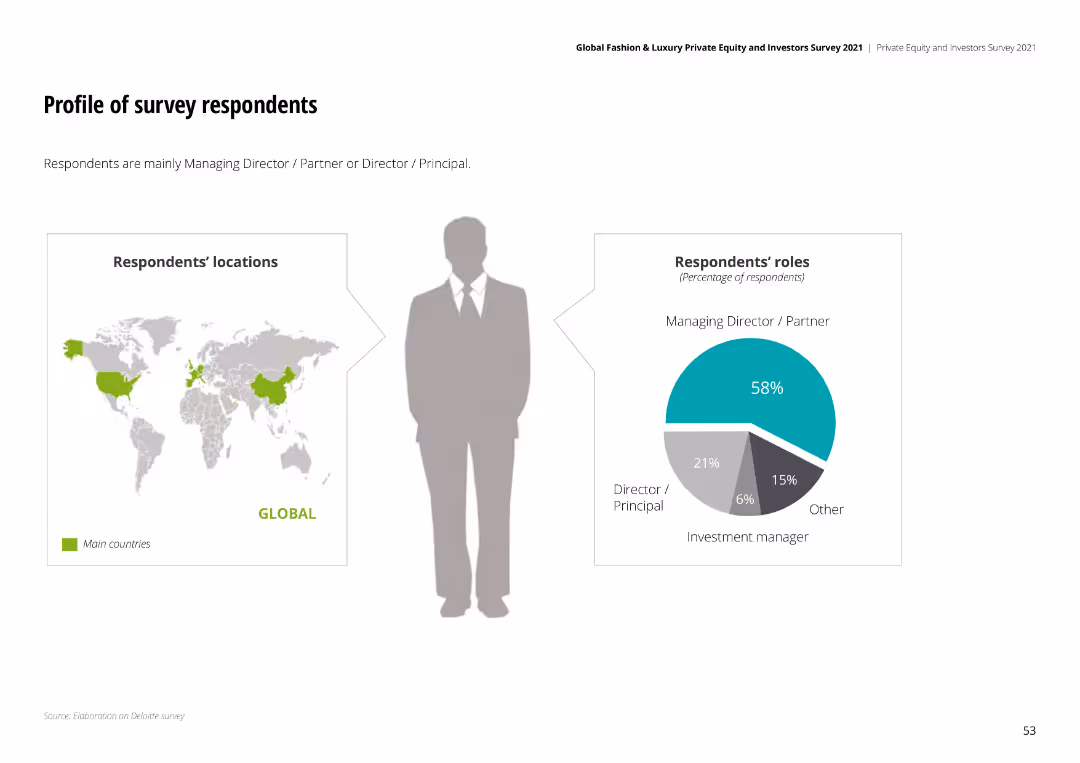
The slide features diagrams showing the locations and roles of survey respondents, with a global map highlighting key regions.
Market Analysis and Trends
Professional Services
This slide profiles the respondents of the survey, detailing their locations and roles, and highlighting the global distribution of respondents.
respondents, survey, profile, global, roles
false
Market Analysis and Trends
Professional Services
Multiple Chart
Deloitte
Add to my slides
Remove from favorites
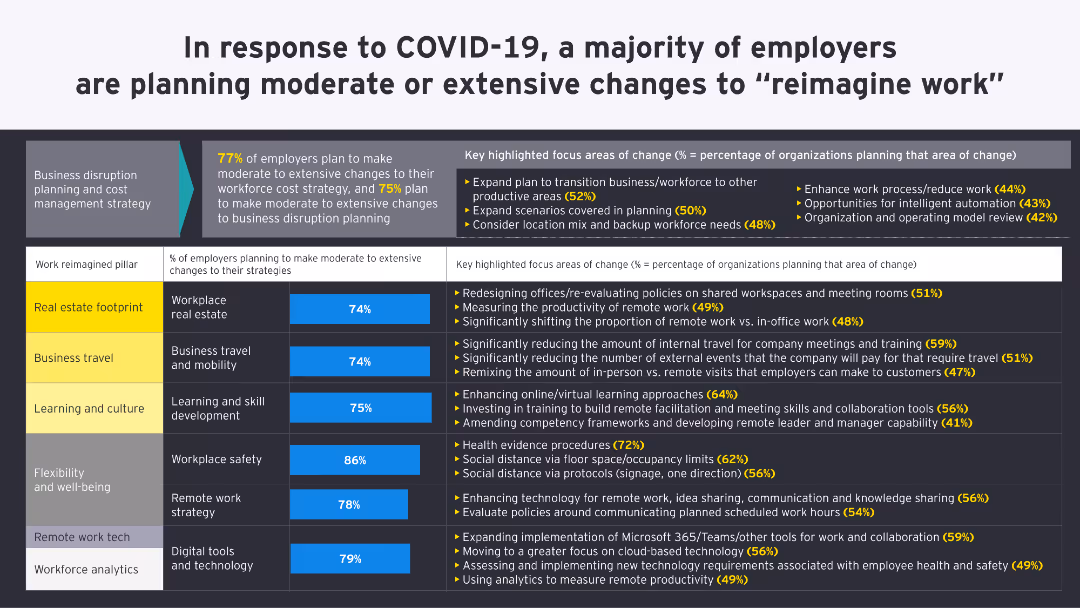
The slide contains a detailed table and bullet points illustrating the percentage of employers planning changes to various strategies post-COVID-19, with key highlighted focus areas for each strategy.
Strategic Planning
Professional Services
The slide outlines the extent of changes employers are planning post-COVID-19 across different strategies like real estate, travel, learning, and flexibility, highlighting specific areas of focus and percentage planning.
response, COVID-19, employers, planning, strategies
false
Strategic Planning
Professional Services
Mixed Chart
EY
Add to my slides
Remove from favorites
Includes multiple response curves on a graph illustrating the relationship between media spend and sales across different channels, with key inflection points marked.
Strategic Planning
Media & Entertainment
Discusses how response curves can guide marketers in understanding the ROI of different levels of media spend, highlighting strategic decision-making points.
response curves, media spend, sales, marketing ROI, strategic planning
false
Strategic Planning
Media & Entertainment
Single Chart
Accenture
Add to my slides
Remove from favorites
The slide features text and icons describing types of responses and underlying demand drivers, with specific focus on weather events, emergency accidents, and pandemic response.
Market Analysis and Trends
Environmental Services & Sustainability
It explains the short-term demand increase in response and restoration services due to COVID-19, predicting normalization post-pandemic.
Response, restoration, pandemic, emergency, demand, short-term, long-term, services, events, accidents
false
Market Analysis and Trends
Environmental Services & Sustainability
Table
LEK
Add to my slides
Remove from favorites
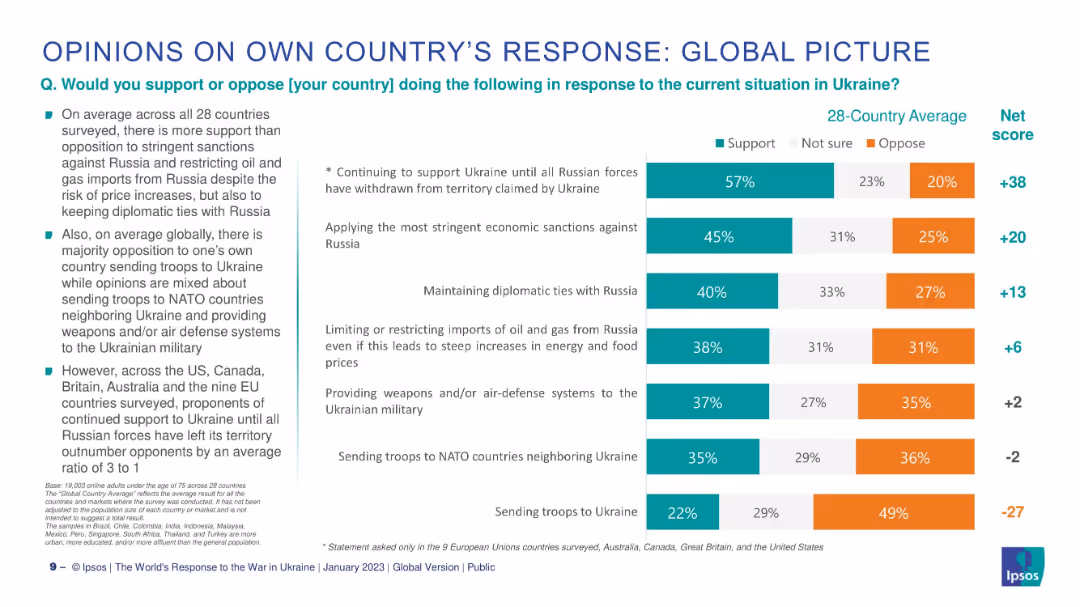
Horizontal bar chart with segmented bars (support/unsure/oppose), accompanied by key highlights in bullets.
Strategic Planning
Government & Public Sector
This slide explores global opinion on how citizens want their own governments to respond to the Ukraine conflict. It breaks down support, opposition, and uncertainty on actions like military aid, economic sanctions, and diplomatic relations.
response, sanctions, military, aid, opinion, support, oppose, Ipsos, Ukraine
false
Strategic Planning
Government & Public Sector
Mixed Chart
IPSOS
Add to my slides
Remove from favorites
The slide contains a bar chart showing the percentage of responses from different sectors like Manufacturing and Financial Services, represented by red bars of varying lengths.
Market Analysis and Trends
Financial Services
This slide analyzes survey responses from various sectors, showing which industries are most active in providing feedback, useful in assessing engagement across sectors.
responses, survey, sectors, manufacturing, finance, engagement, feedback
false
Market Analysis and Trends
Financial Services
Single Chart
PwC/Strategy&
Add to my slides
Remove from favorites
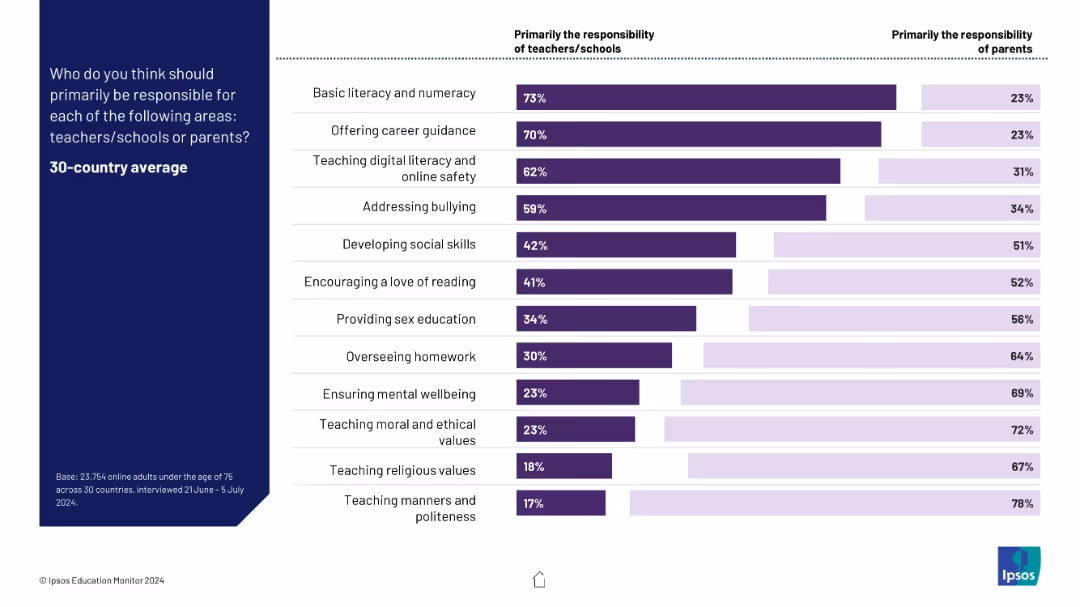
Horizontal bar chart comparing teacher/school vs parent responsibility for 13 educational tasks
Organizational Structure and Change
Education & Training
This slide outlines public opinion on who should be responsible for various educational roles. Basic literacy, digital safety, and career guidance are seen as school roles, while values, manners, and wellbeing are viewed as parental.
responsibilities, teachers, parents, education, digital literacy, ethics, homework
false
Organizational Structure and Change
Education & Training
Mixed Chart
IPSOS
Add to my slides
Remove from favorites
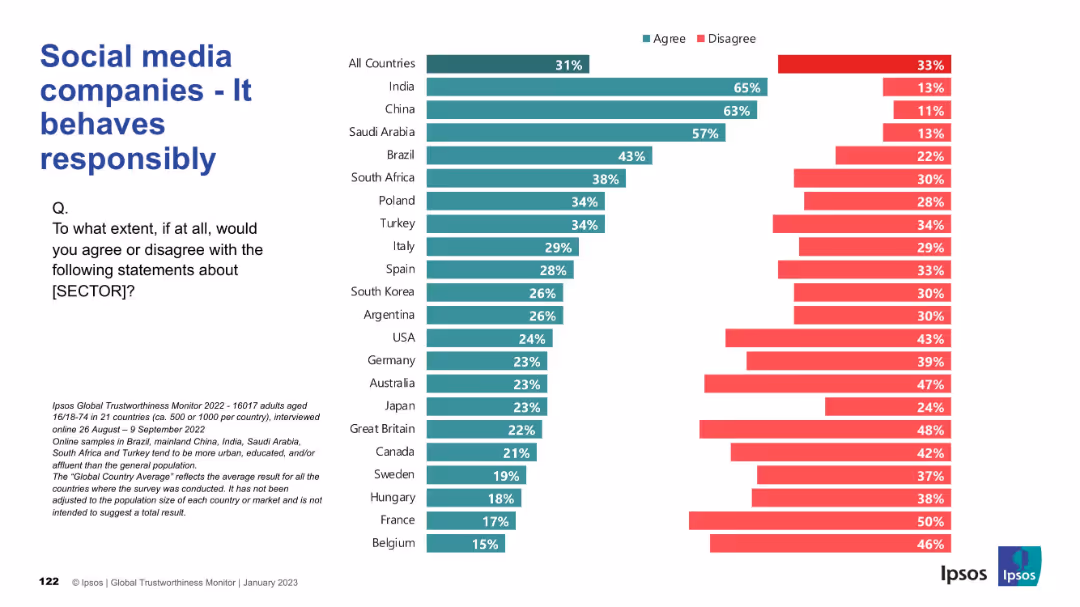
Similar bar chart format with horizontal agree/disagree percentages for each country; green for agree, red for disagree; text and branding elements consistent with previous slide.
Market Analysis and Trends
Technology & Software
This slide examines global opinions on whether social media companies act responsibly. It highlights strong positive sentiment in India, China, and Saudi Arabia, while countries like France, Belgium, and Australia show high disagreement, suggesting a trust deficit in these markets.
responsibility, behavior, global perception, ethics, trust, agree, disagree, Ipsos, countries
false
Market Analysis and Trends
Technology & Software
Mixed Chart
IPSOS
Add to my slides
Remove from favorites
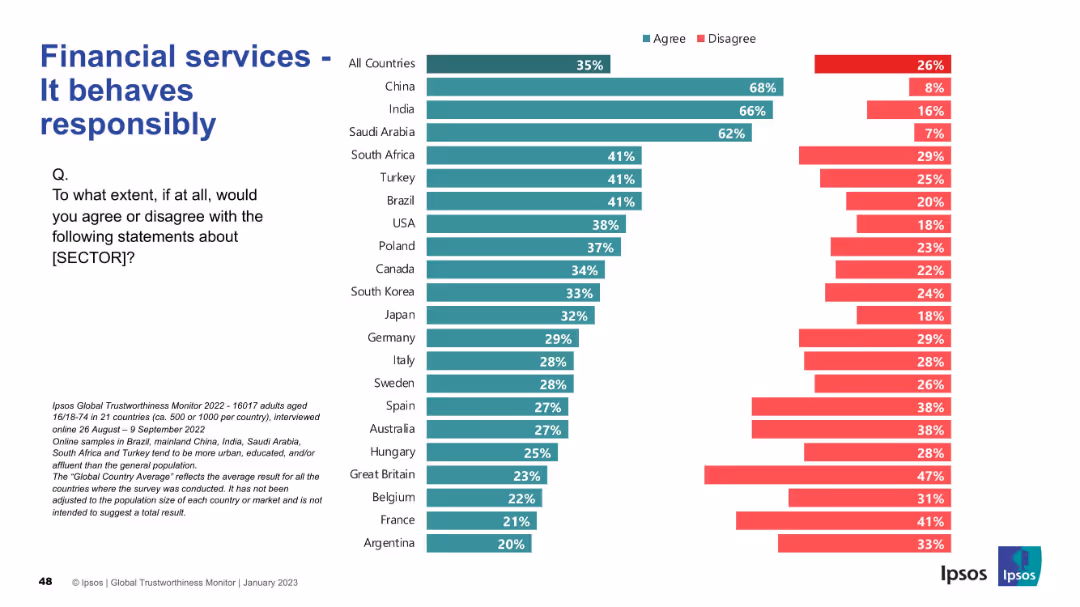
Consistent design with previous: bar chart by country, "Agree" vs. "Disagree"; title in blue
Regulatory and Compliance
Financial Services
This slide reflects global views on the responsibility of financial services. China, India, and Saudi Arabia rank highest in agreement (62–68%), whereas European countries show moderate to low confidence.
responsibility, compliance, trust, Ipsos, financial services, international, agreement, perception
false
Regulatory and Compliance
Financial Services
Mixed Chart
IPSOS
Add to my slides
Remove from favorites
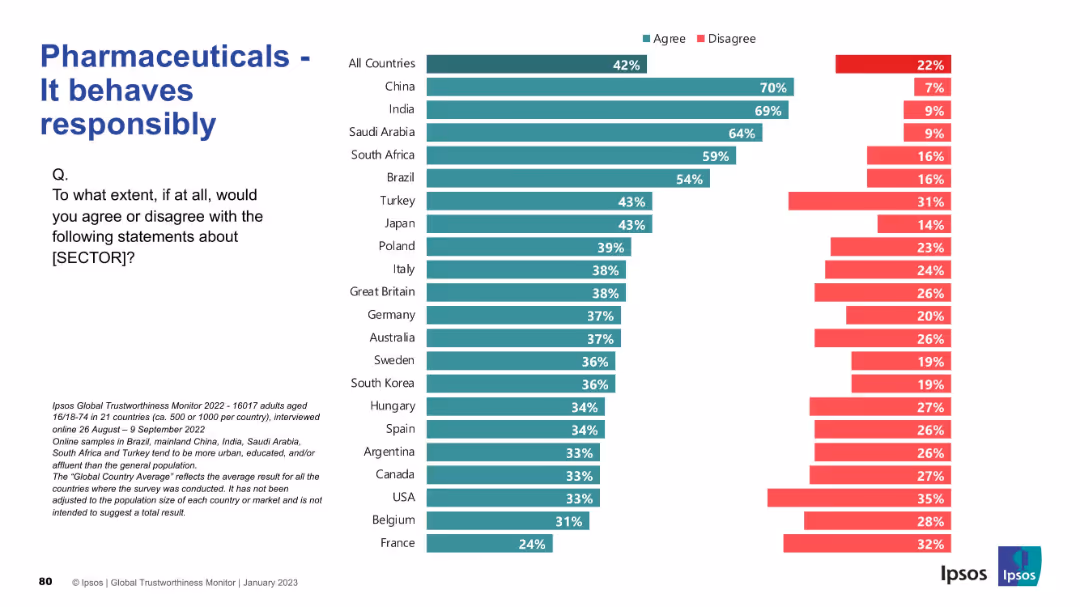
Country-wise bar chart using teal for "agree" and red for "disagree"; consistent style with prior slides.
Market Analysis and Trends
Healthcare & Pharmaceuticals
This slide reflects how responsibly people believe the pharmaceutical sector behaves. China and India again lead in positive sentiment, while Western countries like France, Belgium, and the USA show high levels of skepticism.
responsibility, ethics, behavior, trustworthiness, global survey, pharma, public perception, Ipsos, healthcare industry
false
Market Analysis and Trends
Healthcare & Pharmaceuticals
Mixed Chart
IPSOS
Add to my slides
Remove from favorites
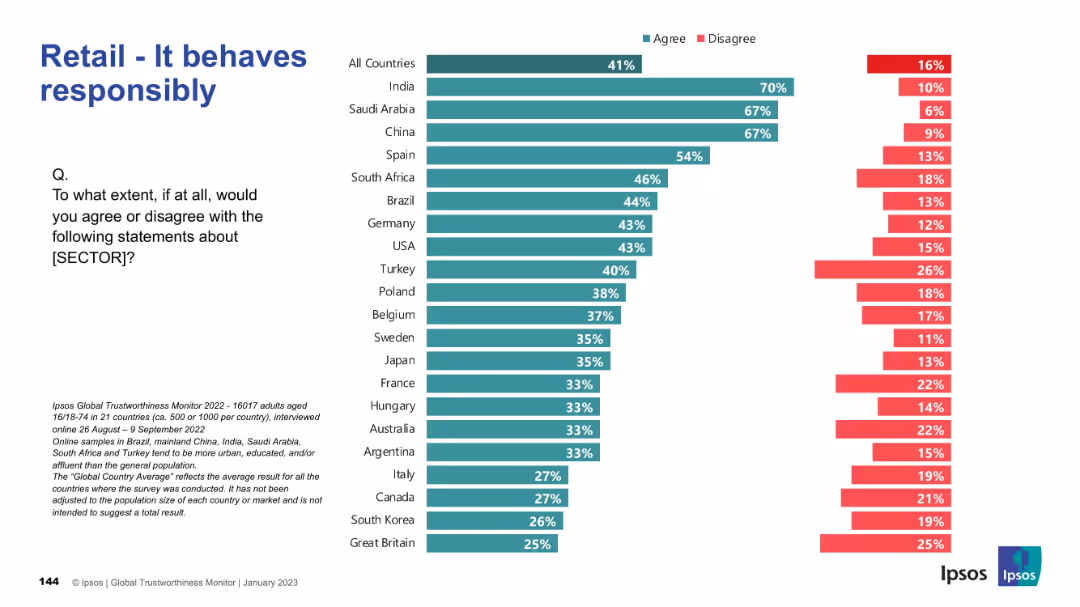
Horizontal bar chart with green/red bars per country; structured by agreement level.
Market Analysis and Trends
Retail & E-commerce
Highlights public opinion on whether the retail sector behaves responsibly. India, Saudi Arabia, and China again top the agreement rankings, while many countries show mixed views.
responsibility, ethics, retail, global, Ipsos, survey, public perception, countries
false
Market Analysis and Trends
Retail & E-commerce
Mixed Chart
IPSOS
Add to my slides
Remove from favorites
Features a red gradient chart showing four waves of adoption of responsible initiatives by luxury brands, overlaid with key strategic concepts.
Strategic Planning
Consumer Goods
Analyzes the adoption of social responsibility by luxury brands across four progressive waves, suggesting a trend towards deeper integration into core business strategies.
responsibility, luxury brands, business strategy, CSR, adoption waves
false
Strategic Planning
Consumer Goods
Linear Flow
Bain
Add to my slides
Remove from favorites
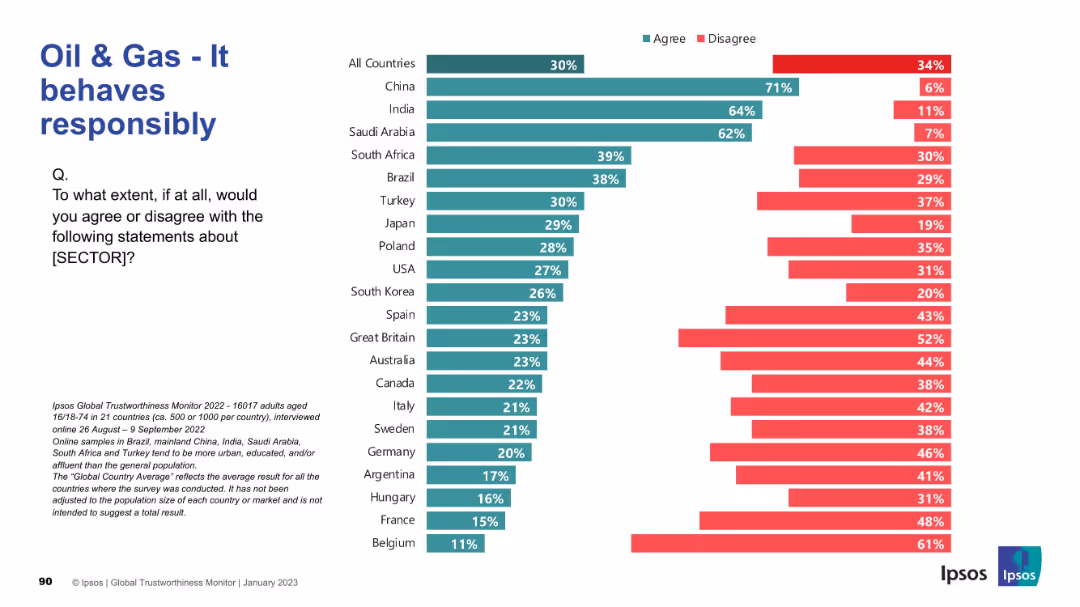
Horizontal bar graph; “agree” and “disagree” percentages visualized for each country. Clean visual with left-aligned question and Ipsos footer.
Market Analysis and Trends
Energy & Utilities
Respondents were asked whether they believe the oil & gas sector behaves responsibly. High agreement in China, India, and Saudi Arabia contrasts with skepticism in Western countries such as Belgium, France, and Germany.
Responsibility, Oil & Gas, Global Opinion, Ipsos, Ethics, Country Survey, Trust, Corporate Behavior, Accountability, Energy Industry
false
Market Analysis and Trends
Energy & Utilities
Mixed Chart
IPSOS
Add to my slides
Remove from favorites
This slide features a bar chart with horizontal bars showing the percentage of Millennials and Gen Z who agree with various statements about the pandemic's impact on their sense of responsibility. It includes text analysis on the left side.
Market Analysis and Trends
Environmental Services & Sustainability
The slide discusses how the pandemic has increased Millennials' and Gen Z's empathy and eagerness to positively impact their communities. The bar chart visualizes the survey responses, showing high levels of agreement on increased individual responsibility and community-focused actions post-pandemic.
Responsibility, Pandemic, Community, Empathy, Survey
false
Market Analysis and Trends
Environmental Services & Sustainability
Mixed Chart
Deloitte
Add to my slides
Remove from favorites
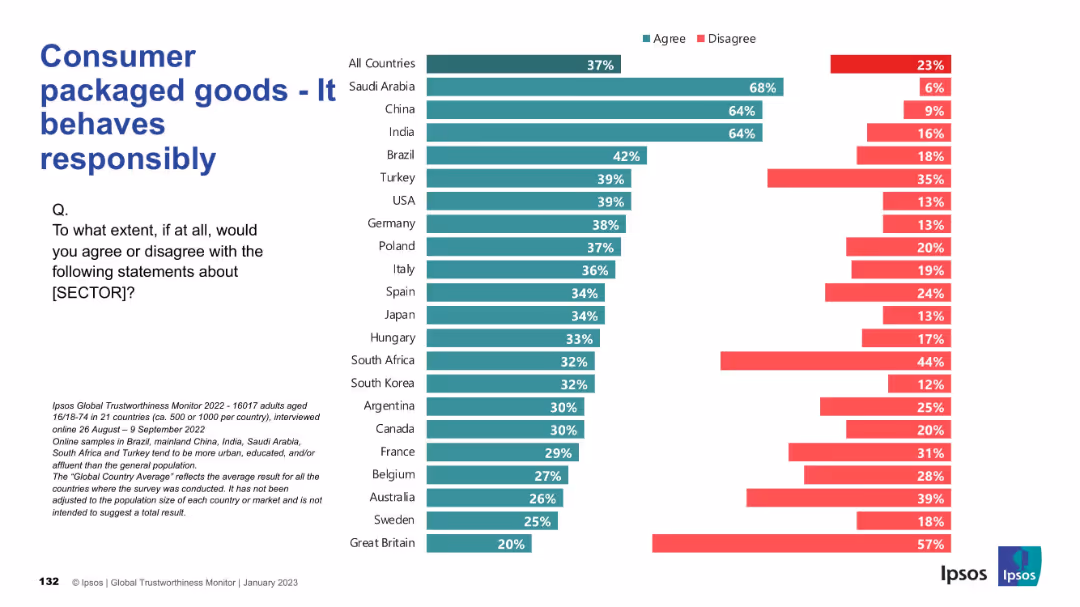
Horizontal bar chart with green (agree) and red (disagree) bars for multiple countries. Title and survey question on left, bars on the right.
Market Analysis and Trends
Consumer Goods
This slide shows survey results on public perception of the Consumer Packaged Goods (CPG) sector’s responsibility across 21 countries, highlighting agreement and disagreement rates.
responsibility, perception, trust, consumer goods, Ipsos, survey, international, behavior, public opinion, global comparison
false
Market Analysis and Trends
Consumer Goods
Mixed Chart
IPSOS
Add to my slides
Remove from favorites
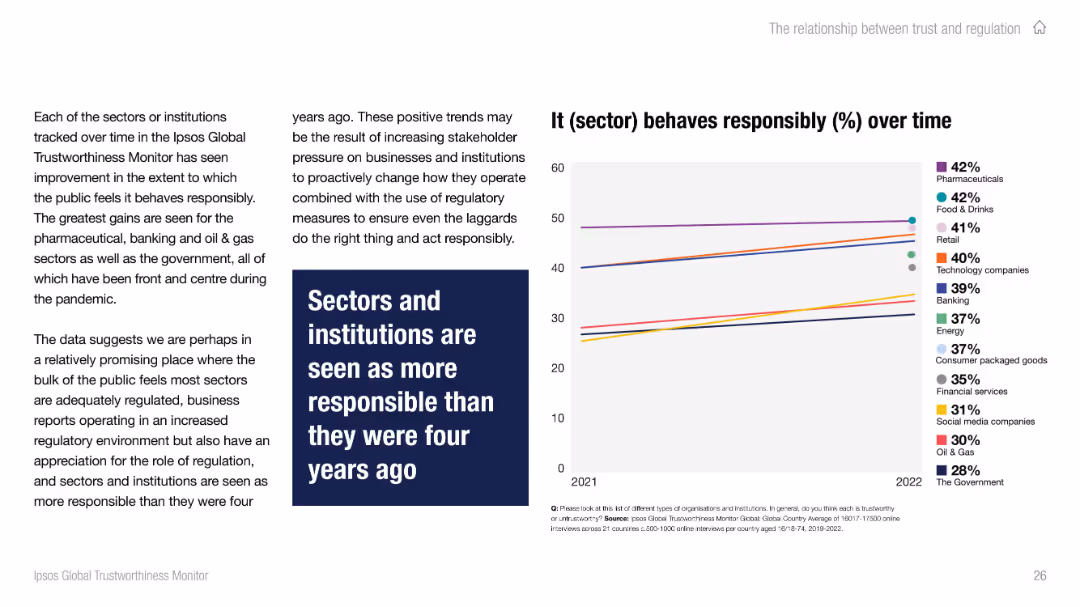
Two-column layout; left contains text with a bold quote, right has a line chart showing responsibility perception of sectors from 2021 to 2022. Color-coded sector lines.
Performance Metrics and KPIs
Government & Public Sector
Shows public perception of various sectors' responsible behavior over time, indicating positive trends across most, especially pharmaceuticals and food & drinks. Suggests regulatory influence and stakeholder pressure are improving sector conduct.
responsibility, sectors, trends, public perception, regulation, Ipsos, improvement
false
Performance Metrics and KPIs
Government & Public Sector
Mixed Chart
IPSOS
Add to my slides
Remove from favorites
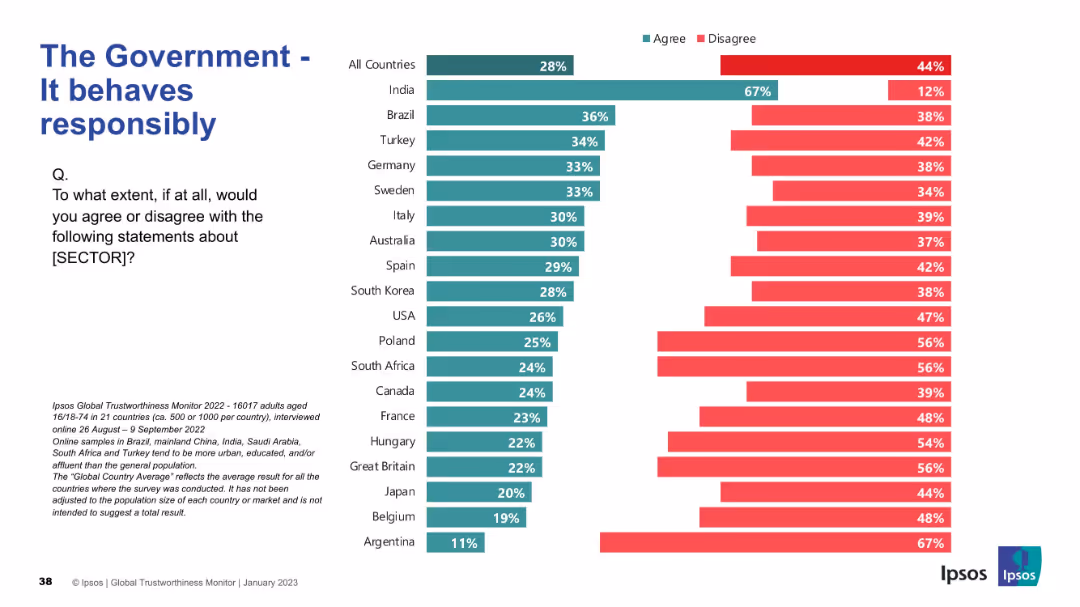
Same bar layout as previous slides; agree/disagree rating per country
Strategic Planning
Government & Public Sector
This slide presents opinions on whether governments act responsibly. India shows the highest agreement, but in most countries, disagreement exceeds agreement.
responsibility, trust, behavior, governance, Ipsos, ethics, survey results, international comparison
false
Strategic Planning
Government & Public Sector
Mixed Chart
IPSOS
Add to my slides
Remove from favorites
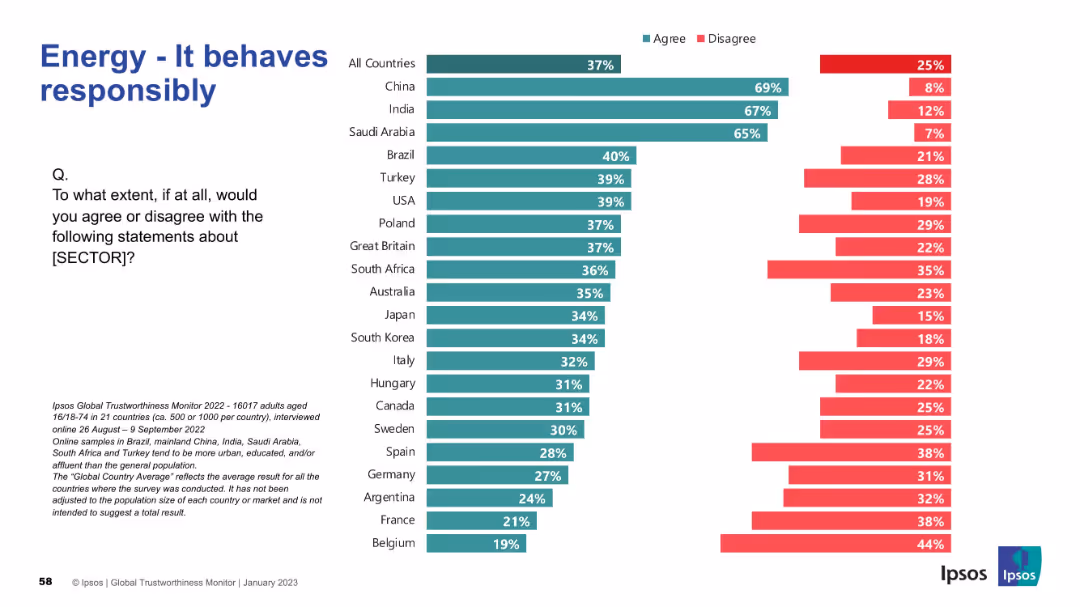
Bar chart with country-wise comparison; clean layout; use of green and red bars
Market Analysis and Trends
Energy & Utilities
This slide captures perceptions of the energy sector's responsibility in its behavior. Top rankings go to China, India, and Saudi Arabia, suggesting high confidence in these regions. Belgium, France, and Argentina show the least trust.
responsibility, trust, behavior, perception, energy, Ipsos, international survey, ethical conduct, reputation
false
Market Analysis and Trends
Energy & Utilities
Mixed Chart
IPSOS
Add to my slides
Remove from favorites
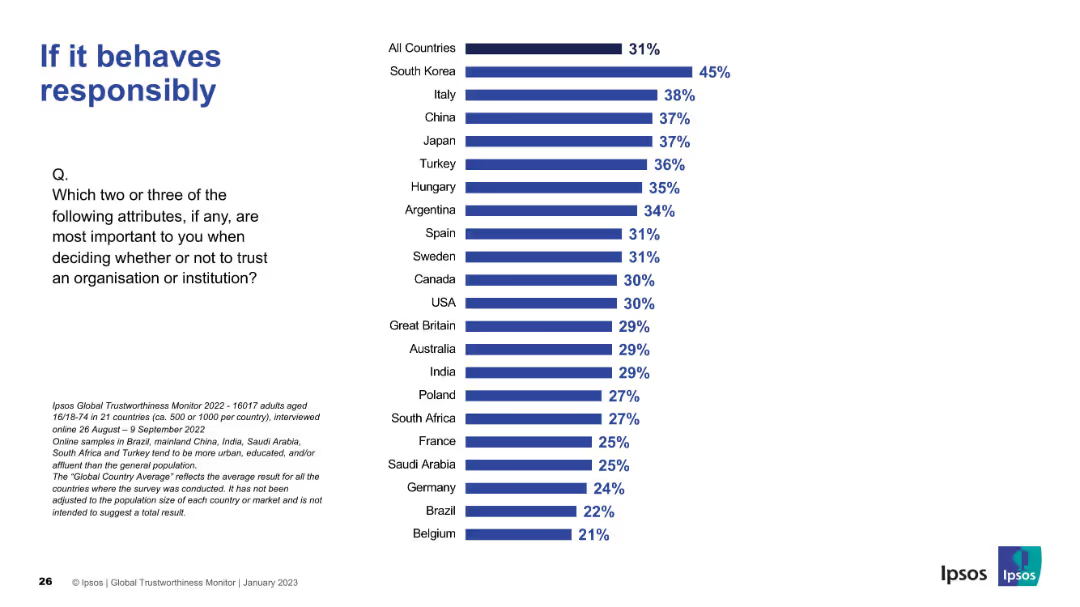
Bar chart shows high importance placed on responsibility. South Korea leads at 45%. Maintains consistent slide format.
Market Analysis and Trends
Professional Services
Highlights responsibility as a major trust factor globally. South Korea and Italy prioritize this more than others, suggesting regional ethical expectations.
responsibility, trust factor, global survey, Ipsos data, ethical behavior, international rankings
false
Market Analysis and Trends
Professional Services
Mixed Chart
IPSOS
Add to my slides
Remove from favorites
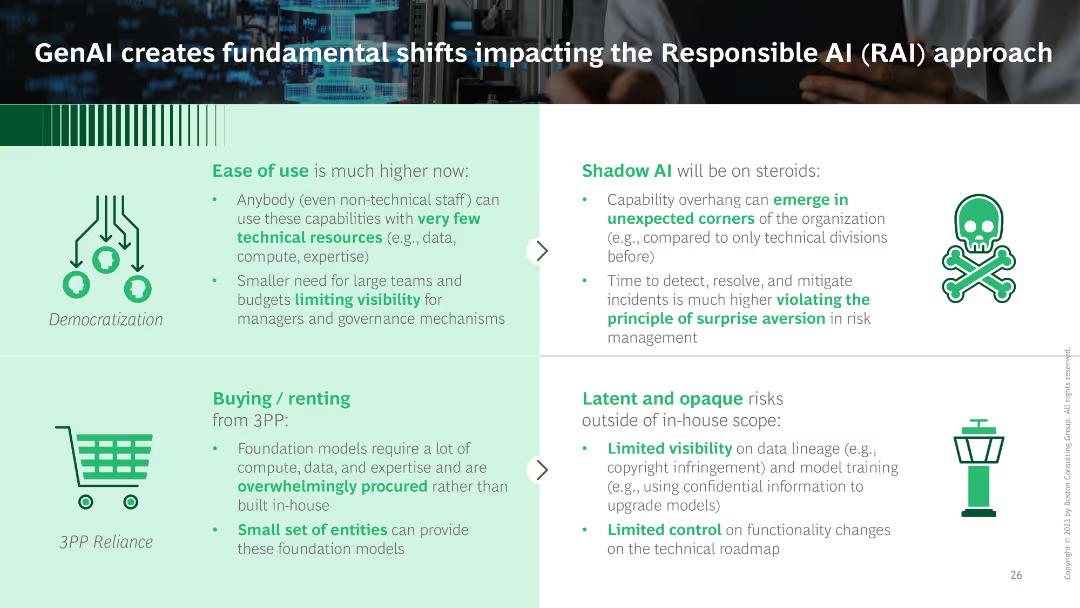
Two-column layout detailing ease of use, buying/renting from third parties on the left, and shadow AI and latent risks on the right. Icons highlight key points.
Risk Assessment and Management
Technology & Software
Discusses how generative AI affects responsible AI practices, highlighting ease of use, third-party dependencies, shadow AI risks, and latent risks.
responsible AI, GenAI, risk management, ease of use, third-party dependencies
false
Risk Assessment and Management
Technology & Software
Header Vertical
BCG
Add to my slides
Remove from favorites
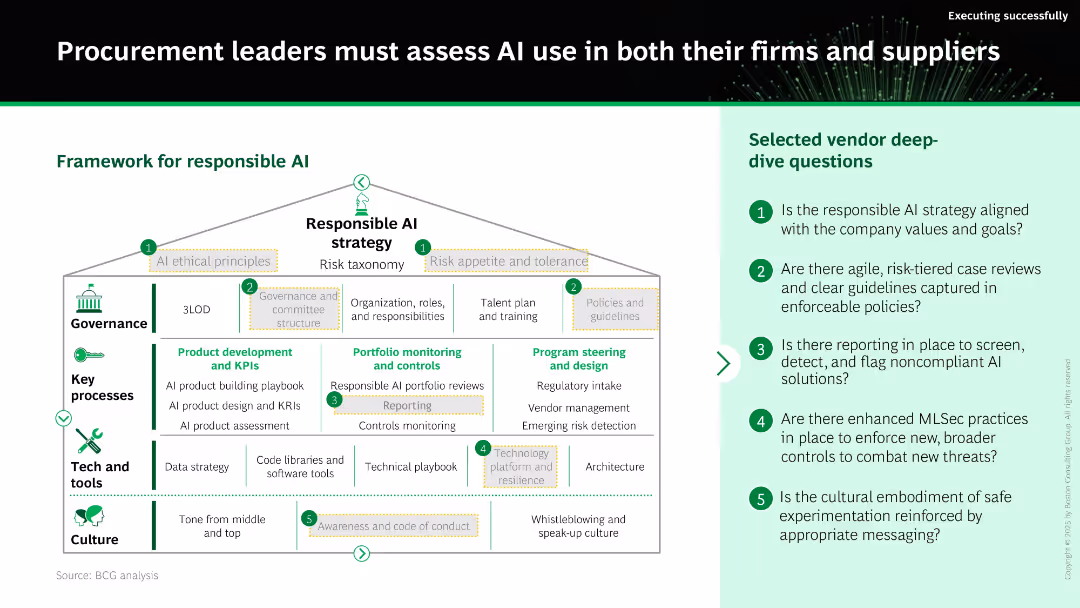
Organizational diagram showing “Responsible AI strategy” structure with layers: governance, key processes, tech/tools, and culture. Sidebar lists 5 vendor assessment questions.
Regulatory and Compliance
Technology & Software
This slide introduces a framework for implementing responsible AI strategies in procurement. It details governance structures, product development standards, monitoring controls, and cultural guidelines, and provides a checklist of questions for evaluating suppliers’ AI ethics and compliance.
responsible AI, governance, compliance, vendor assessment, KPIs, controls, AI ethics
false
Regulatory and Compliance
Technology & Software
Boxed
BCG
Add to my slides
Remove from favorites
Visual framework of a “house” representing a responsible AI strategy; includes labeled sections (Governance, Key Processes, Tech & Tools, Culture). A list of 5 vendor assessment questions is on the right.
Regulatory and Compliance
Artificial Intelligence
This slide presents a framework for implementing responsible AI in procurement. It emphasizes governance, product KPIs, compliance, and cultural support. A right-side checklist poses questions for vendor AI evaluation regarding ethics, policies, reporting, and cultural alignment.
responsible AI, governance, procurement, compliance, KPIs, vendor assessment, risk management
false
Regulatory and Compliance
Artificial Intelligence
Boxed
BCG
Add to my slides
Remove from favorites
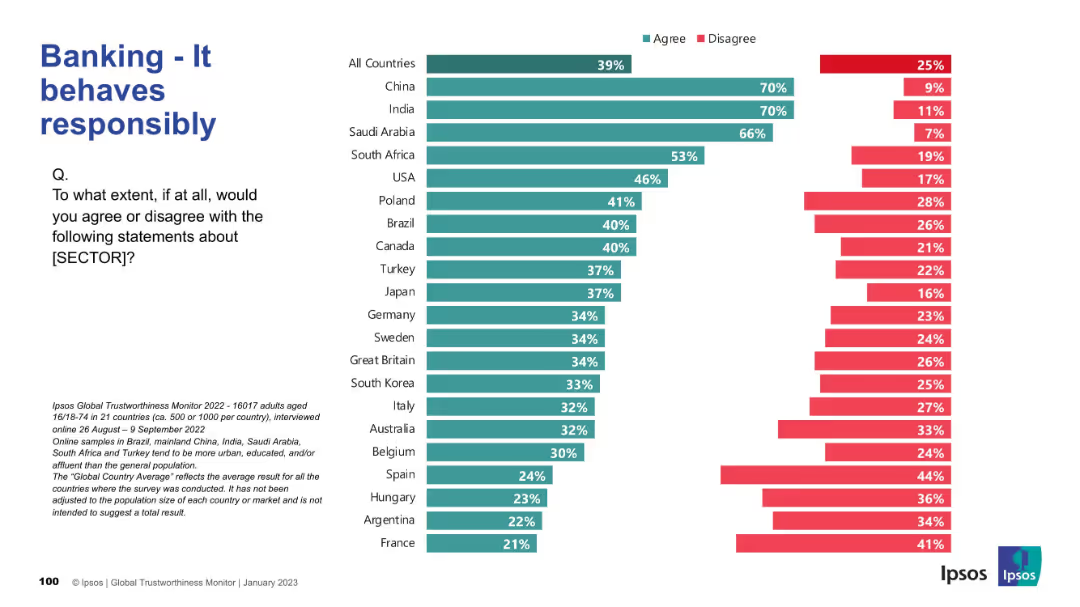
Similar bar chart format to previous; ranked by agreement on banking sector’s responsible behavior. Title and layout consistent with Slide 19251.
Risk Assessment and Management
Financial Services
Shows public perceptions across countries on whether the banking sector behaves responsibly. China and India top agreement levels, while European countries trend lower. Provides insight into sectoral trust variations.
responsible banking, ethics, trust, country data, Ipsos, public opinion, finance
false
Risk Assessment and Management
Financial Services
Mixed Chart
IPSOS
Add to my slides
Remove from favorites
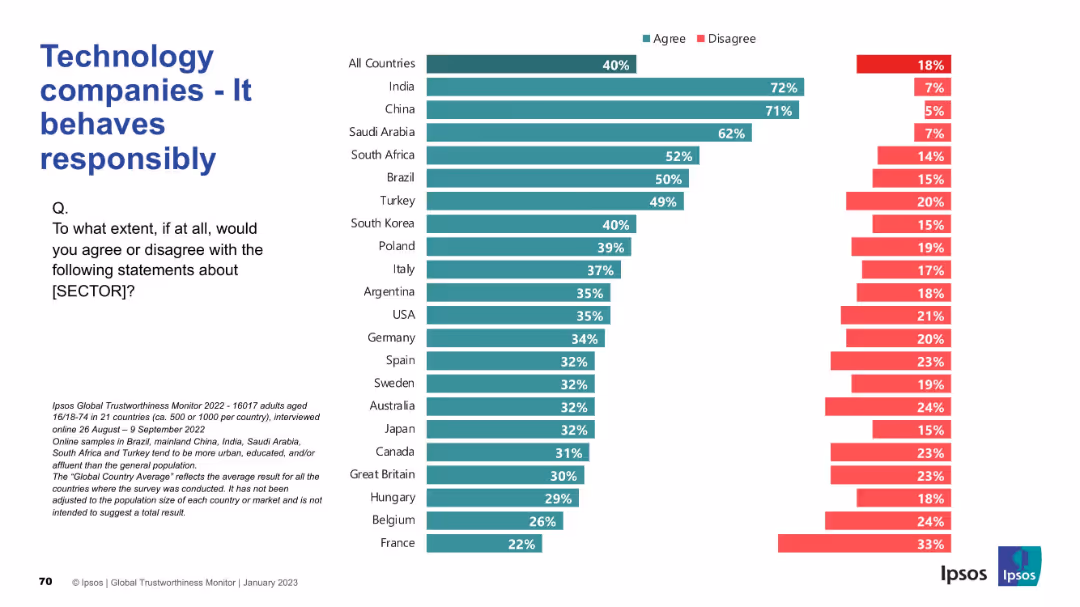
Left column contains the title and question, with a right-aligned bar chart for country responses.
Risk Assessment and Management
Technology & Software
The slide analyzes how populations in different countries perceive technology companies in terms of responsible behavior, based on survey agreement levels.
responsible behavior, tech sector, Ipsos, survey results, global trust, ethics, corporate responsibility, public sentiment, accountability
false
Risk Assessment and Management
Technology & Software
Mixed Chart
IPSOS
Add to my slides
Remove from favorites
A column chart showing global agreement on purchasing products from responsible brands, with countries listed on the x-axis and agreement percentages on the y-axis.
Market Analysis and Trends
Consumer Goods
This slide discusses consumer preferences for responsible brands, highlighting global willingness to pay more for such products, with varying agreement across countries.
responsible brands, consumer preferences, global agreement, purchasing, column chart, countries
false
Market Analysis and Trends
Consumer Goods
Multiple Chart
IPSOS
Add to my slides
Remove from favorites
Features a multi-color column chart representing different challenges faced by companies in responsible production. Colors differentiate the importance ranks of each challenge.
Performance Metrics and KPIs
Agriculture & Food Production
Evaluates the top challenges in responsible production faced by companies, highlighting areas like cost pressure, ecological footprint, and the need for sustainable packaging.
responsible production, cost pressure, ecological footprint, sustainable packaging, challenge ranking
false
Performance Metrics and KPIs
Agriculture & Food Production
Mixed Chart
Deloitte
Add to my slides
Remove from favorites
The slide is divided into two columns, each with text and images, including trend assessments.
Operational Efficiency
Consumer Goods
Discusses responsible sourcing and the circular economy, emphasizing social and environmental considerations in supply chains.
Responsible Sourcing, Circular Economy, Supply Chain, Environmental Considerations, Ethical Procurement, Sustainability
false
Operational Efficiency
Consumer Goods
Mixed Chart
Deloitte
Add to my slides
Remove from favorites
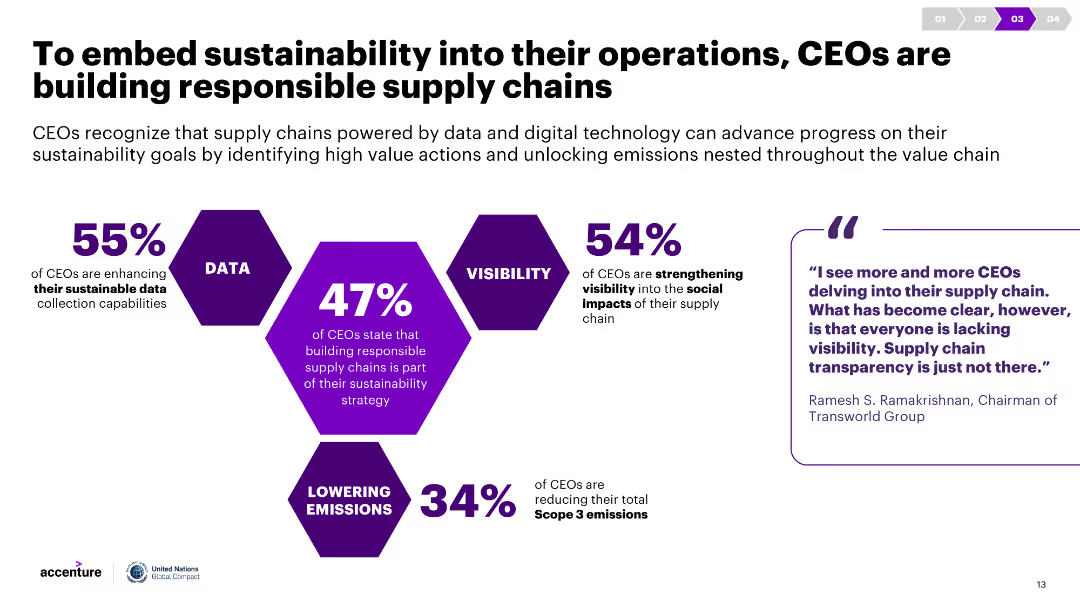
Infographics show percentages of CEOs taking various actions to build responsible supply chains. Commentary includes quotes and detailed descriptions of these actions.
Strategic Planning
Environmental Services & Sustainability
The slide highlights the steps CEOs are taking to incorporate sustainability into supply chains, such as enhancing data collection, visibility, and reducing emissions.
Responsible supply chains, sustainability, CEO actions, data collection, emissions reduction
false
Strategic Planning
Environmental Services & Sustainability
Diagram
Accenture
Add to my slides
Remove from favorites
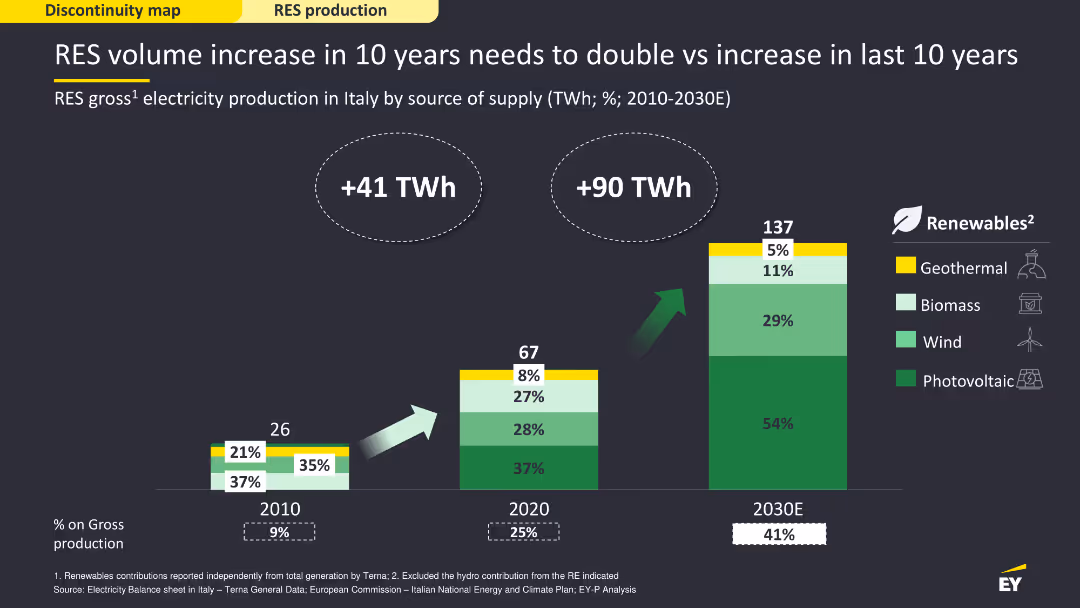
This slide features a column chart showing RES gross electricity production in Italy from 2010 to 2030E. It uses different shades of green to represent various sources of renewable energy (geothermal, biomass, wind, photovoltaic). The layout is visually engaging and provides clear data comparisons over time.
Strategic Planning
Energy & Utilities
The slide highlights the need to double the volume increase of renewable energy sources (RES) in the next 10 years compared to the previous decade. It shows the production by different sources and projects the future increase required to meet energy targets, emphasizing the importance of accelerating renewable energy growth.
RES, renewable energy, Italy, electricity, future
false
Strategic Planning
Energy & Utilities
Single Chart
EY
Add to my slides
Remove from favorites
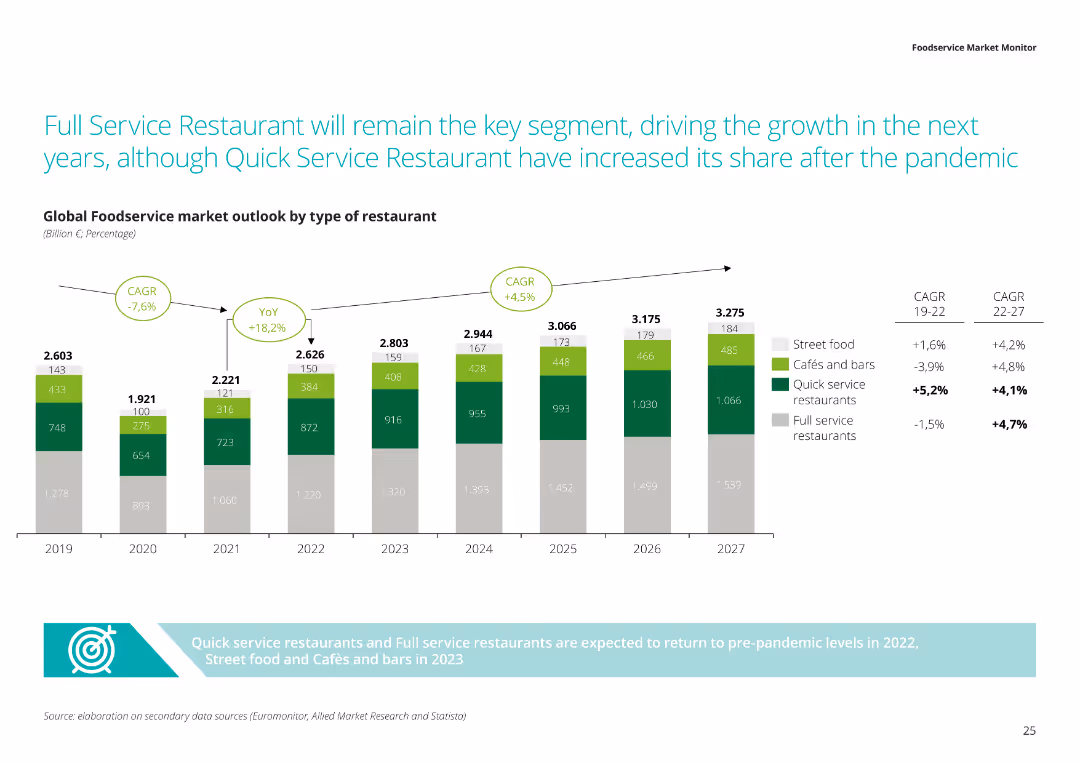
This slide contains a column chart illustrating the global foodservice market outlook by type of restaurant, including CAGR and YoY growth rates from 2019 to 2027.
Market Analysis and Trends
Hospitality & Tourism
It forecasts full-service restaurants leading growth in foodservice, despite quick service restaurants gaining share post-pandemic, with market sizes and growth rates by type.
Restaurant, Growth, Foodservice, Market Outlook, CAGR
false
Market Analysis and Trends
Hospitality & Tourism
Mixed Chart
Deloitte
Add to my slides
Remove from favorites
The slide presents a comprehensive view with a large column chart tracking historical and projected revenue in the restaurant industry. It includes bullet points with concise descriptions and graphical icons that visually represent the data points discussed.
Market Analysis and Trends
Consumer Goods
Provides an overview of the restaurant industry's performance during COVID-19 and anticipates future trends based on consumer behavior changes and market recovery post-pandemic. It discusses the impact of dining restrictions and the expected resurgence in demand as these are lifted.
restaurant industry, market trends, COVID-19, consumer behavior, recovery forecast, revenue analysis, dining trends
false
Market Analysis and Trends
Consumer Goods
Mixed Chart
BCG
Add to my slides
Remove from favorites
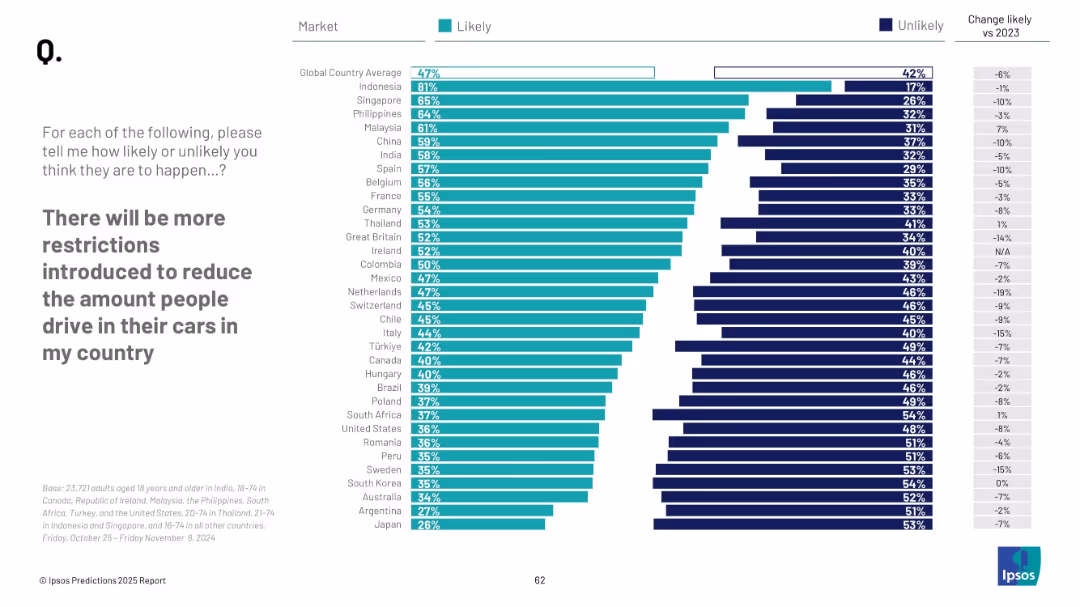
Bar chart with countries listed on the Y-axis; Likely (green) and Unlikely (blue) horizontal bars; change vs. 2023 shown on right. Clean, minimalist layout with sans-serif font.
Market Analysis and Trends
Environmental Services & Sustainability
The slide compares public perceptions across countries on the likelihood of more car-use restrictions being introduced. Indonesia leads with the highest belief in restrictions, while Japan and Argentina show the lowest. The slide tracks shifts from 2023 to 2024.
restrictions, car usage, sustainability, global comparison, public opinion, climate, 2025 forecast, transport policy, Ipsos, perception shift
false
Market Analysis and Trends
Environmental Services & Sustainability
Mixed Chart
IPSOS
Add to my slides
Remove from favorites
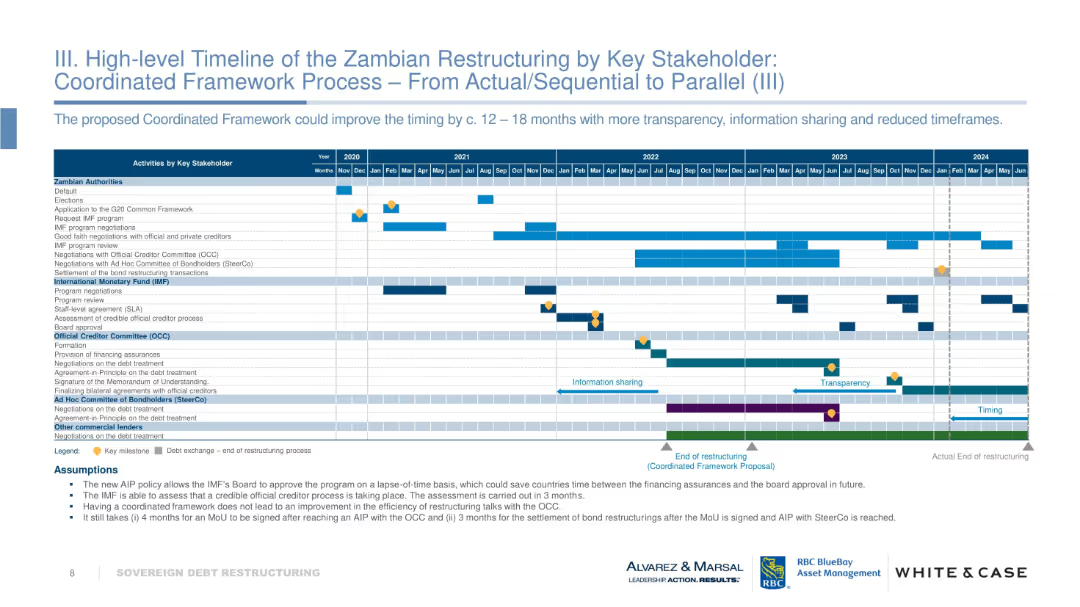
Gantt chart similar to Slide 16579, but showing a more efficient "Coordinated Framework" scenario with transparency, parallel steps, and shorter timelines. Assumptions listed at bottom.
Regulatory and Compliance
Government & Public Sector
Suggests an improved framework for Zambia’s debt restructuring to save time. Proposes more parallel processing, better information sharing, and reduced waiting periods. Aims to finish the process 12–18 months earlier than under the current sequential approach.
restructuring, coordination, transparency, Zambia, IMF, OCC, sovereign debt, reform
false
Regulatory and Compliance
Government & Public Sector
Table
Alvarez & Marsal
Add to my slides
Remove from favorites
A structured diagram categorizes the bank's divisions into five focused areas with additional descriptive text.
Organizational Structure and Change
Financial Services
This slide outlines the bank’s divisional reorganization into five focused areas, aimed at streamlining operations and enhancing efficiency.
restructuring, divisions, organizational, business model, efficiency
false
Organizational Structure and Change
Financial Services
Diagram
Barclays
Add to my slides
Remove from favorites
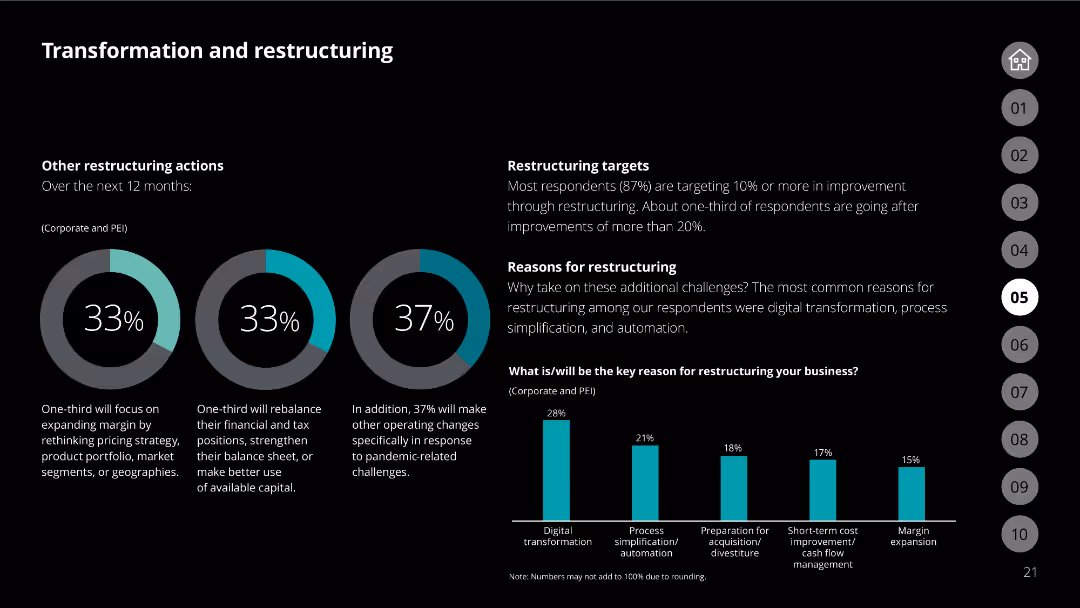
Slide with column charts and percentage figures, detailing restructuring actions, targets, and reasons. Includes a column chart showing key reasons for restructuring.
Mergers and Acquisitions
Financial Services
This slide discusses restructuring actions, targets, and reasons among companies, focusing on areas like margin expansion and digital transformation.
restructuring, targets, actions, reasons, charts, financial, transformation, strategy
false
Mergers and Acquisitions
Financial Services
Multiple Chart
Deloitte
Add to my slides
Remove from favorites
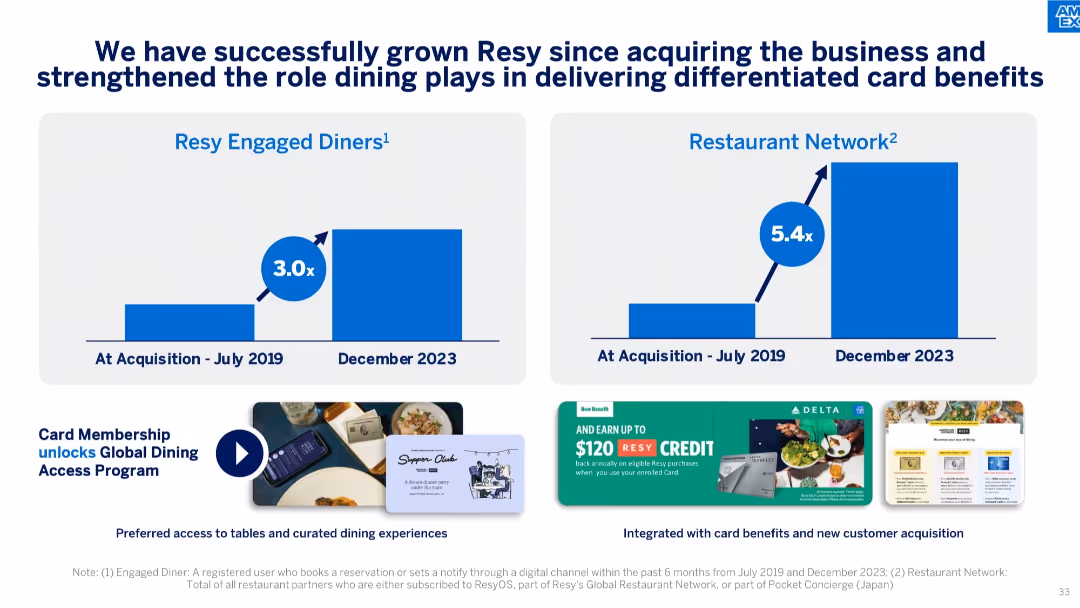
Split bar charts showing growth in diners and restaurant network, with branded visuals at the bottom.
Product and Service Analysis
Financial Services
Describes growth of Resy platform post-acquisition and its integration into cardholder benefits, showing multiplier effects on diner engagement and restaurant network expansion.
Resy, dining benefits, restaurant network, cardholder experience, acquisition impact, loyalty programs
false
Product and Service Analysis
Financial Services
Mixed Chart
McKinsey
Add to my slides
Remove from favorites
Features column charts and a timeline, highlighting trends in consumer expectations within the retail sector, particularly focusing on personalized experiences.
Market Analysis and Trends
Retail & E-commerce
Focuses on the evolving retail landscape, driven by AI and personalized pricing strategies, appealing mainly to Gen X.
retail, AI, personalization, consumer expectations, Gen X
false
Market Analysis and Trends
Retail & E-commerce
Multiple Chart
Bain
Add to my slides
Remove from favorites
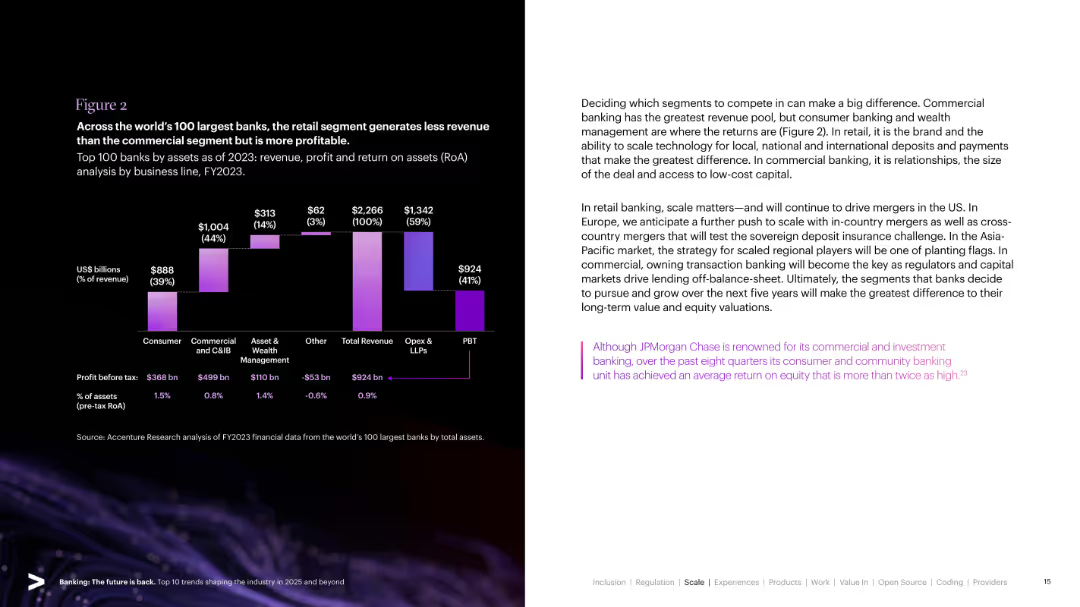
Bar chart with segmented categories for banking revenues and profits. Dark background with violet and white accents. Text on right explains implications of commercial vs. consumer banking segments.
Strategic Planning
Financial Services
Highlights revenue and profit split across banking segments for top global banks, showing that although commercial banking earns more revenue, retail banking is more profitable. Discusses strategic implications for segment focus.
Retail Banking, Commercial Banking, Profitability, RoA, Strategy, Segment Revenue, Bank Operations, Global Banks
false
Strategic Planning
Financial Services
Mixed Chart
Accenture
Add to my slides
Remove from favorites
Contains a U.S. map highlighting Southeast MSAs, pie charts reflecting branch network mix, and bar graphs detailing growth metrics. The slide's color scheme is primarily blue with yellow and green accents.
Market Analysis and Trends
Financial Services
Emphasizes the bank's significant retail growth, especially in the Southeast MSAs, with a detailed analysis of market share and strategic branch positioning.
retail banking, growth, Southeast MSAs, deposits, loans, market analysis, expansion
false
Market Analysis and Trends
Financial Services
Multiple Chart
Goldman Sachs
Add to my slides
Remove from favorites
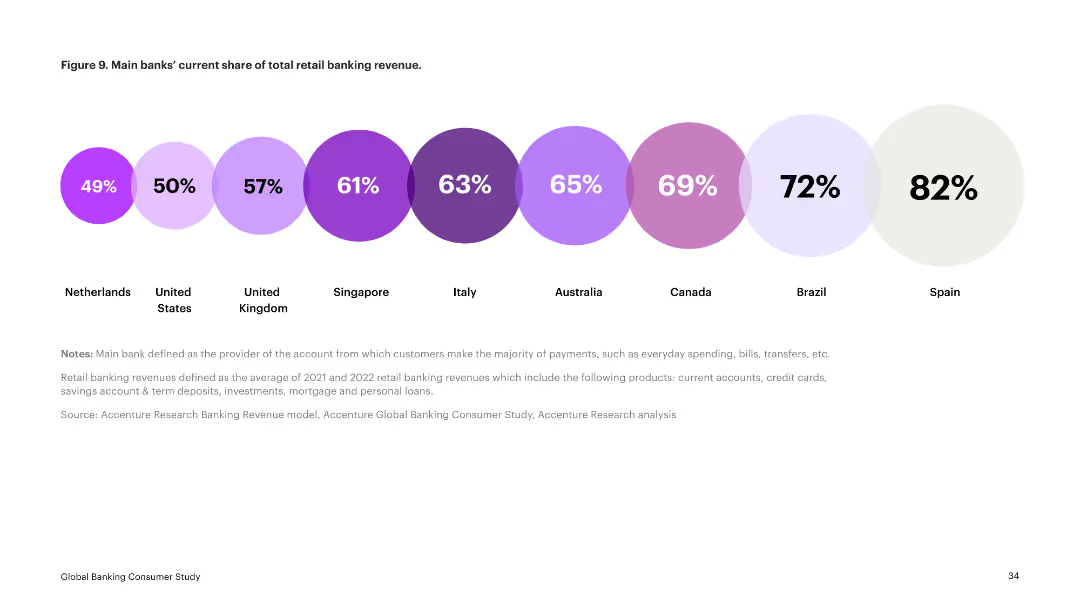
The slide presents a series of circular charts indicating the current share of total retail banking revenue for main banks in various countries. Each country is represented by a different colored circle.
Financial Performance
Financial Services
This slide displays the current market share of retail banking revenue by main banks in several countries, showing significant variation. It serves as a comparative analysis of market penetration.
retail banking, revenue share, market comparison, financial services, main banks
false
Financial Performance
Financial Services
Single Chart
Accenture
Add to my slides
Remove from favorites
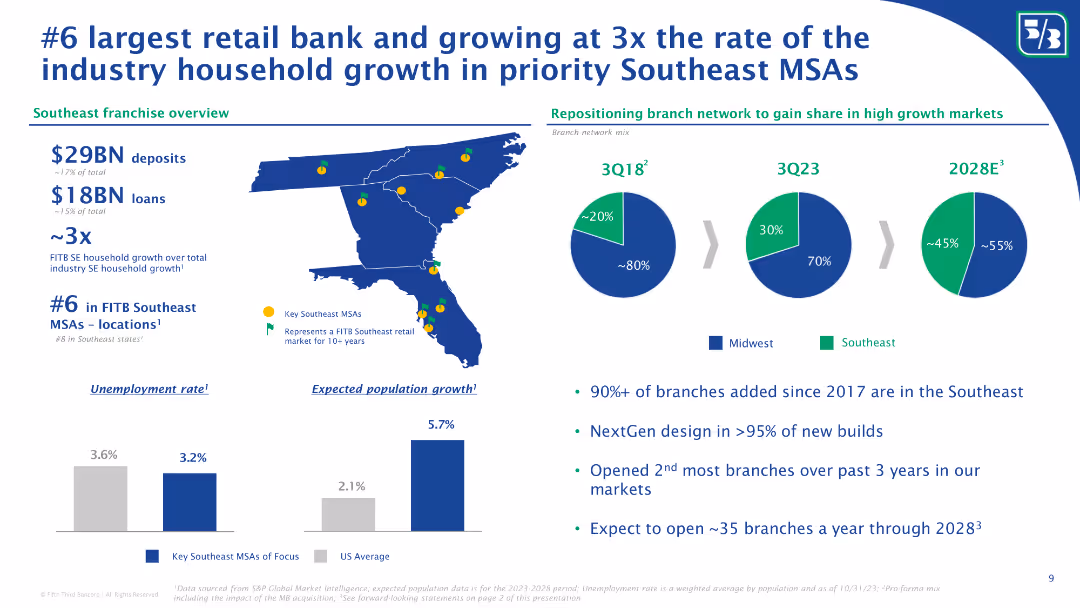
The slide features a map of Southeast MSAs, pie charts showing branch network mix changes, and bullet points on expected population growth and unemployment rates.
Market Analysis and Trends
Financial Services
The slide provides an overview of Fifth Third Bank’s retail banking growth in the Southeast MSAs, highlighting their significant expansion rate compared to the industry. It includes demographic data on unemployment rates and population growth, emphasizing their strategic branch network adjustments for market dominance.
Retail bank, Southeast MSAs, branch network, population growth, unemployment rate, market dominance, retail banking, expansion, Fifth Third Bank, industry growth
false
Market Analysis and Trends
Financial Services
Multiple Chart
Goldman Sachs
Add to my slides
Remove from favorites
The slide uses a matrix layout with color-coded cells indicating performance in various retail categories.
Market Analysis and Trends
Retail & E-commerce
Provides a detailed breakdown of retail sales by category, showing the different recovery rates post-COVID-19.
retail categories, sales breakdown, COVID-19 recovery
false
Market Analysis and Trends
Retail & E-commerce
Table
BCG
Add to my slides
Remove from favorites
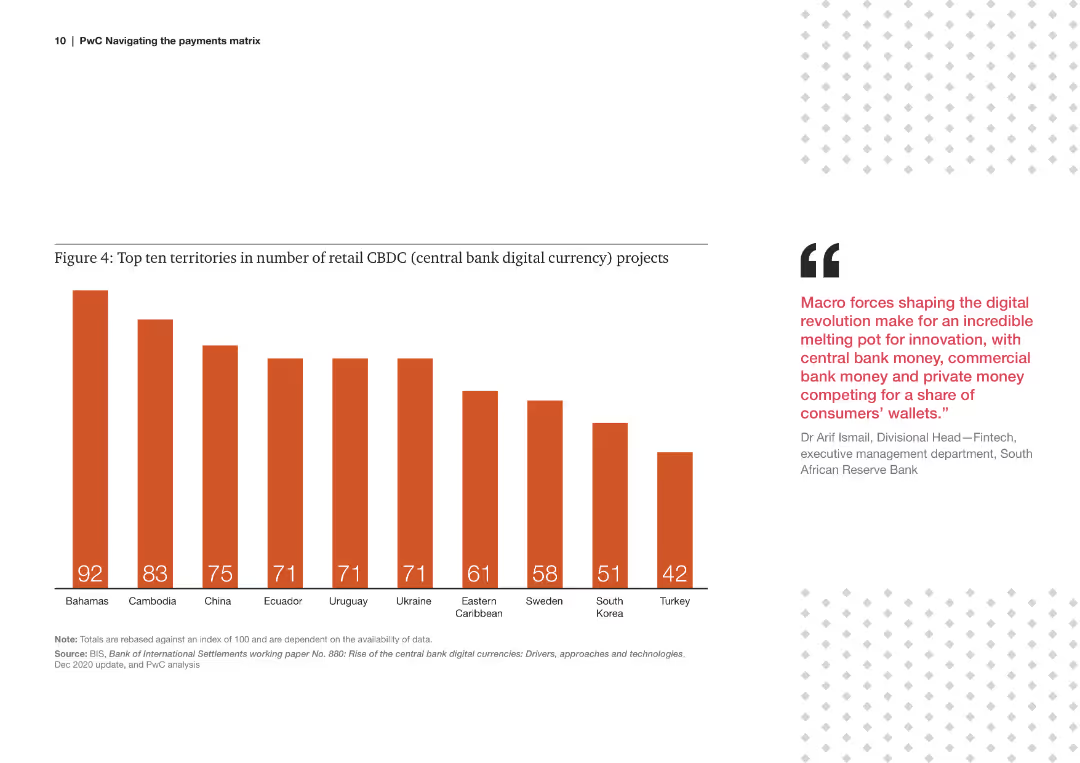
Bar chart displaying the number of retail central bank digital currency (CBDC) projects in various countries.
Technology and Digital Transformation
Financial Services
The slide highlights the leading countries in retail CBDC projects, indicating the adoption and experimentation of digital currencies.
retail, CBDC, projects, countries, digital currency, adoption, leading, territories, 2020
false
Technology and Digital Transformation
Financial Services
Mixed Chart
PwC/Strategy&
Add to my slides
Remove from favorites
Contains multiple circular flow diagrams with icons and text. In the center, there are four main categories connected by arrows showing a continuous cycle. The layout is clean with moderate visual complexity.
Market Analysis and Trends
Retail & E-commerce
Discusses the future of retail, focusing on empowered consumers, disruptive technologies, and societal impacts. Explains the transformation of business models and the increase in value for society.
Retail, Consumer Empowerment, Disruptive Technologies, Business Models, Societal Impact
false
Market Analysis and Trends
Retail & E-commerce
Framework
Accenture
Add to my slides
Remove from favorites
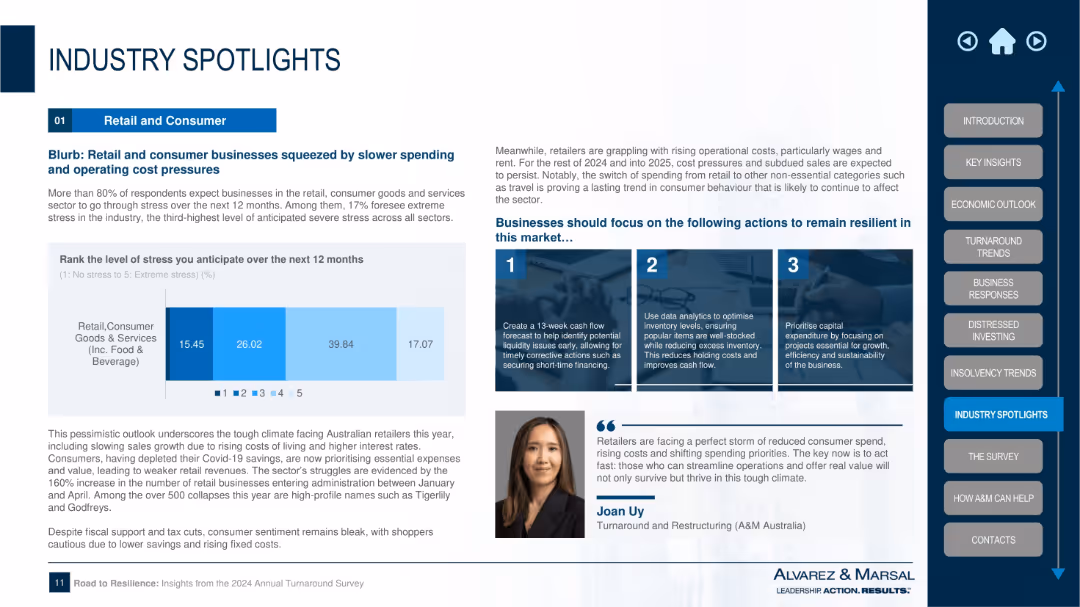
Split layout; stress bar chart on left, text and action points on right, with image and expert quote at bottom
Market Analysis and Trends
Retail & E-commerce
Focuses on the Retail and Consumer sector, highlighting extreme stress expected by over 80% of respondents. Cites operating cost pressures, declining savings, and subdued sales. Offers three recommendations for resilience: cash flow forecasting, data analytics for inventory, and capital efficiency.
retail, consumer goods, stress forecast, cash flow, inventory optimization, capital planning, sales decline, inflation, industry outlook
false
Market Analysis and Trends
Retail & E-commerce
Mixed Chart
Alvarez & Marsal
Add to my slides
Remove from favorites
This slide features multiple line charts displaying year-on-year changes in credit card sales across various retail sectors. The layout includes two main sections for short-term impacts and recovery paths, with annotations and a clear color-coded legend.
Market Analysis and Trends
Retail & E-commerce
This slide analyzes the short-term impact of the COVID-19 pandemic on different retail sectors and predicts their recovery paths. It highlights the contrast between essential and non-essential retailers, using data-driven insights to project future industry trends.
Retail, COVID-19, Recovery, Online Sales, Impact Analysis
false
Market Analysis and Trends
Retail & E-commerce
Multiple Chart
BCG
Add to my slides
Remove from favorites
Includes a multi-line chart with different colors representing each sector, comparing foundational, programmatic, strategic, and integrated talent attraction strategies. Icons depict recruitment approaches.
Strategic Planning
Retail & E-commerce
Explores retail's lag in partnering with diverse organizations and the scope of its recruiting strategies compared to sectors like CGS, Auto/IE, LS/Pharma/Biotech, and Travel/Hospitality.
Retail, Diverse Organizations, Recruiting, Comparison, Sectors, Strategies, Talent Attraction, Foundational, Programmatic
false
Strategic Planning
Retail & E-commerce
Mixed Chart
Accenture
Add to my slides
Remove from favorites
Slide contains a large, colorful multi-line chart comparing foundational, programmatic, strategic, and integrated & sustainable D&I targets across industries. Icons and a strategic intent note are placed at the top. Line colors are distinct for each sector.
Strategic Planning
Retail & E-commerce
This slide analyzes how the retail sector compares with others like CGS, Auto/IE, LS/Pharma/Biotech, and Travel/Hospitality in establishing Diversity and Inclusion targets across four categories: Foundational, Programmatic, Strategic, and Integrated & Sustainable.
Retail, Diversity, Inclusion, Comparison, Sector, Targets, Performance, Strategic, Programmatic, Integrated
false
Strategic Planning
Retail & E-commerce
Mixed Chart
Accenture
Add to my slides
Remove from favorites
Three sections, each with an image and a color-coded title. Images depict sunset, wind turbines, and water waves.
Industry Overview
Financial Services
Sections discuss retail investing, energy transition, and Web 3's impact on markets and efficiency in capital markets.
Retail, Energy, Web 3, Investing, Transition, Crypto, Efficiency, Capital Markets
false
Industry Overview
Financial Services
Pillar
Bain
Add to my slides
Remove from favorites
Slide presents a multi-bar horizontal chart showing planned investments in workforce-related strategies like DEI and employee retention among retailers.
Human Resources and Talent Management
Retail & E-commerce
Reveals investment trends among retailers focusing on diversity, equity, inclusion, and employee retention to prepare for future challenges.
retailers, DEI, employee retention, workforce, future-ready, investment, diversity, planning
false
Human Resources and Talent Management
Retail & E-commerce
Single Chart
Deloitte
Add to my slides
Remove from favorites
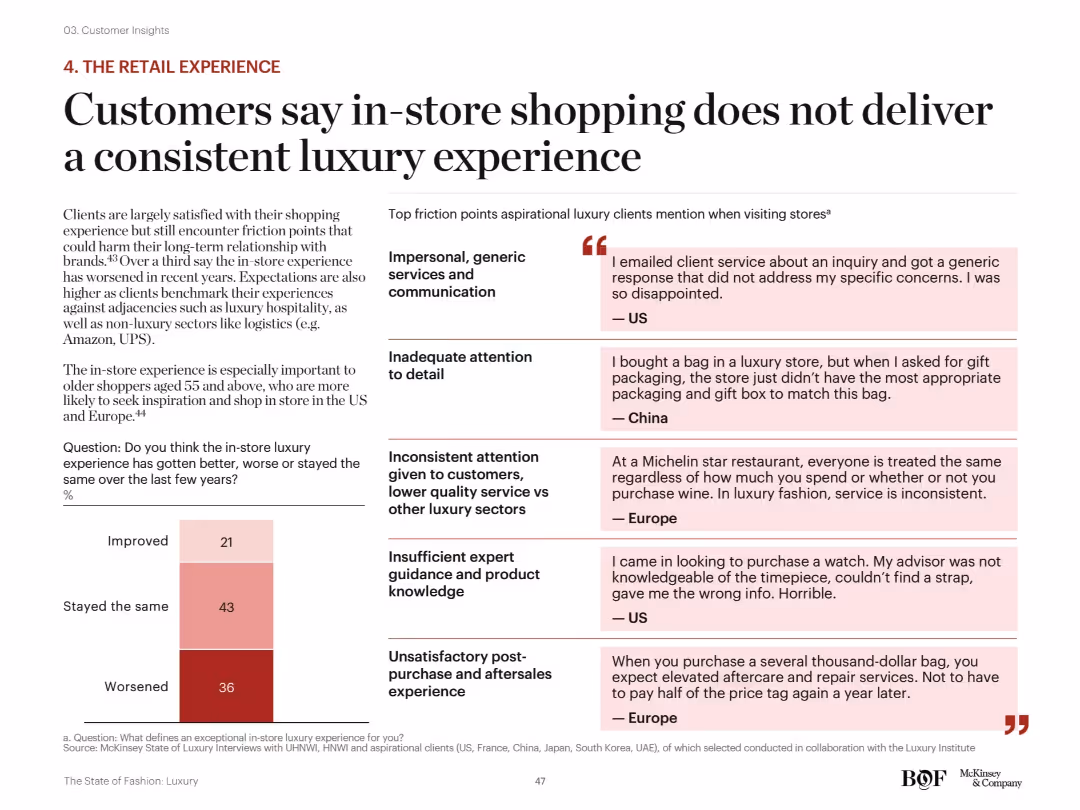
Split into two sections: survey result bar chart (left) and qualitative feedback (right) with quotes from global clients. Thematic use of red and beige tones to highlight pain points.
Customer and Market Segmentation
Consumer Goods
The slide shows that 36% of luxury clients think in-store experiences have worsened, citing friction points such as lack of personalization, poor service, and insufficient staff expertise. Real customer quotes highlight regional frustrations and service gaps.
retail experience, store service, customer dissatisfaction, friction points, in-store luxury, client expectations
false
Customer and Market Segmentation
Consumer Goods
Mixed Chart
McKinsey
Add to my slides
Remove from favorites
Contains a complex comparative chart tracking percentage changes in visits and stay duration against a restriction stringency index.
Market Analysis and Trends
Retail & E-commerce
Analyzes the impact of lifting restrictions on retail footfall across various markets, highlighting how consumer behavior has changed in comparison to pre-event levels.
Retail footfall, Market analysis, Restriction stringency, Consumer behavior, Comparative chart, Visits duration, Global impact, Grocery & Pharmacy
false
Market Analysis and Trends
Retail & E-commerce
Mixed Chart
Accenture
Add to my slides
Remove from favorites
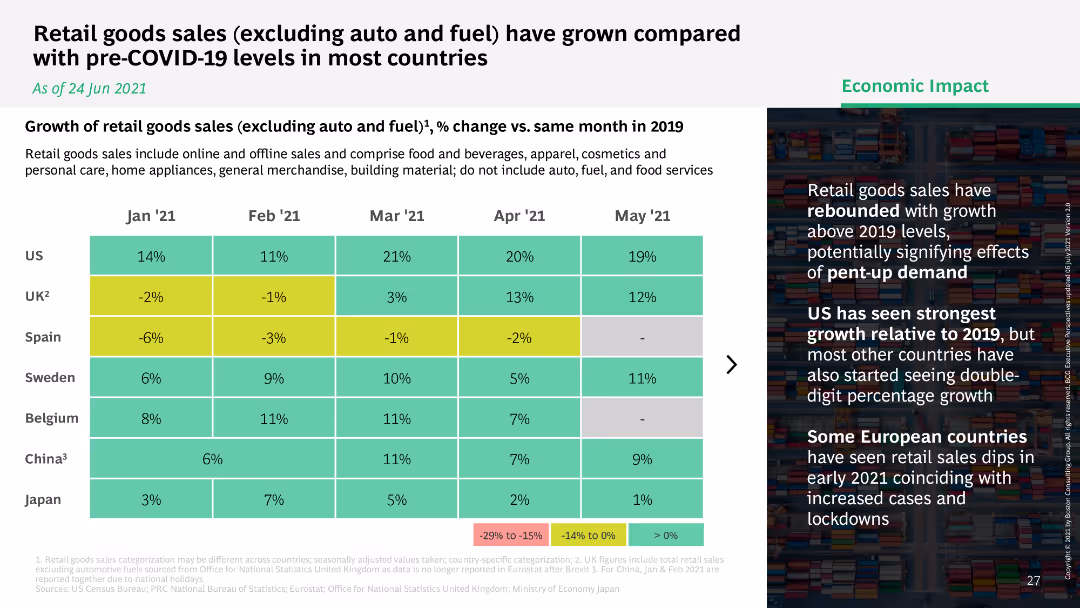
A data-rich slide with color-coded percentage changes for different months and regions. It has a legend for easy interpretation.
Market Analysis and Trends
Retail & E-commerce
Discusses the year-on-year change in retail goods sales, highlighting recovery trends in different countries post-COVID-19.
retail goods sales, COVID-19 recovery, YOY change, market data
false
Market Analysis and Trends
Retail & E-commerce
Table
BCG
Add to my slides
Remove from favorites
Heatmap comparing the growth of retail goods sales excluding auto and fuel across multiple countries, showing percentage change versus 2019.
Market Analysis and Trends
Retail & E-commerce
Analyzes the growth of retail goods sales (excluding auto and fuel) across various countries, comparing current sales to pre-COVID-19 levels.
retail goods, sales growth, comparison, countries
false
Market Analysis and Trends
Retail & E-commerce
Table
BCG
Add to my slides
Remove from favorites
Previous
Next
You don't have any favorites yet.
Please wait loading your favorites slides...
Create a FREE account to continue browsing
Receive Instant Access to 1,000+ slides from companies like McKinsey, Google, and Goldman Sachs
First Name
Last Name
Email
Password
I agree to all
Terms & Privacy Policy
Thank you! Your submission has been received!
Oops! Something went wrong while submitting the form.
Have an account?
Sign in
Upgrade to PRO to Save slides
Advanced Search and Filters
Access to 15,000+ slides
Access to Category Pages
Save/Bookmark Slides
PowerPoint Template Library
Pick a Plan
MONTHLY
$12/month
Billed every month, Cancel anytime.
YEARLY
$9/year
Billed $108 annually, Cancel anytime.
Checkout for $12/month
Checkout for $108/yr
Secured by Stripe | AES-256 bit encryption