My Account
My Slides
Search by Category
Pricing
Templates
View All Templates
Download Template Slides
✦ AI Search
Feedback
Login
Logout
Get Started
Browse all Slides
Browse all Slides
Create a FREE Account
Instant access to 1,000+ real slides from top companies like McKinsey, BCG, Goldman Sachs, Google and many more!
First Name
Last Name
Email
Password
I agree to all
Terms & Privacy Policy
Thank you! Your submission has been received!
Oops! Something went wrong while submitting the form.
Have an account?
Sign in
Saved Slides
Total No. of slides saved
0
↻ Refresh
✖ Clear all
Shows dense data in tables to compare the company's risk performance metrics with industry peers, along with key portfolio indicators over time.
Risk Assessment and Management
Financial Services
Details the company’s prudent risk management approach while achieving business growth, showcasing industry comparisons and portfolio risk indicators.
Risk Management, Industry Comparison, Portfolio Indicators, Business Growth
false
Risk Assessment and Management
Financial Services
Table
JP Morgan
Add to my slides
Remove from favorites
Multiple boxes and arrows illustrating liquidity coverage ratio, net stable funding ratio, regulatory minimums, stress testing, governance, and contingency planning.
Risk Assessment and Management
Financial Services
Explains UBS's risk management framework, including regulatory requirements, liquidity and funding strategies, and stress testing.
Risk Management, Liquidity, Funding, UBS, Governance
false
Risk Assessment and Management
Financial Services
Framework
UBS
Add to my slides
Remove from favorites
Shows trends in loan loss rates and risk management strategies over time.
Risk Assessment and Management
Financial Services
Evaluates risk management practices and their effectiveness in growth strategies.
risk management, loan loss, growth strategies, trends
false
Risk Assessment and Management
Financial Services
Single Chart
Barclays
Add to my slides
Remove from favorites
The slide features a two-tiered column chart showing average loans by client segment over three years, with text sections highlighting strategies.
Risk Assessment and Management
Financial Services
It analyzes loan performance segmented by client type, showcasing risk management and business growth strategies in financial services.
Risk Management, Loan Performance, Client Segments, Business Growth, Strategy, Financial Services
false
Risk Assessment and Management
Financial Services
Mixed Chart
JP Morgan
Add to my slides
Remove from favorites
The slide utilizes a mix of icons, text, and a three-part list to describe Macquarie's risk management approach. It has a clear and straightforward design, with good use of whitespace and a structured layout. The slide uses a color scheme consistent with the Macquarie brand.
Risk Assessment and Management
Financial Services
It outlines the core principles and model of risk management at Macquarie, emphasizing business accountability and stability. This slide is intended to communicate Macquarie’s established risk culture and its alignment with industry-standard 'three lines of defence' risk management to stakeholders.
risk management, Macquarie, business accountability, stability, principles, three lines of defence, operational risk, corporate governance
false
Risk Assessment and Management
Financial Services
Header Horizontal
Morgan Stanley
Add to my slides
Remove from favorites
The slide presents a rocket diagram indicating stages of risk management maturity in Mauritius, using percentages and a visual metaphor of a rocket's trajectory.
Risk Assessment and Management
Financial Services
Displays the progression of risk management practices in Mauritius, showing most companies at the basic governance stage. Useful for discussions on improving risk management frameworks within organizations.
risk management, Mauritius, governance, stages
false
Risk Assessment and Management
Financial Services
Linear Flow
PwC/Strategy&
Add to my slides
Remove from favorites
The slide includes a purple and white theme with two bar charts and text blocks. The charts display probabilities of low-risk exposure across different categories with comparisons between average and optimized companies.
Risk Assessment and Management
Technology & Software
Analyzes the risk mitigation potential of adopting best network practices, showing increased low-risk probabilities when such practices are integrated, aimed at business leaders and strategists for risk management and decision making.
risk management, network practices, business strategy, data analysis, probabilities
false
Risk Assessment and Management
Technology & Software
Multiple Chart
Accenture
Add to my slides
Remove from favorites
Detailed text layout discussing the ways risk professionals can improve organizational resilience by focusing on new technologies, creating future leaders, maximizing agility, and spreading risk awareness.
Risk Assessment and Management
Financial Services
Offers strategies for risk management improvement by adopting new technologies and enhancing agility within the financial sector. Targets risk professionals seeking to modernize and adapt.
risk management, new technologies, agility, financial sector, resilience
false
Risk Assessment and Management
Financial Services
Linear Flow
Accenture
Add to my slides
Remove from favorites
Contains three line graphs depicting the NPL ratio, coverage ratio, and cost of risk over three years, complemented by text boxes explaining the risk framework and management goal.
Risk Assessment and Management
Financial Services
Highlights BBVA's risk management metrics and strategies, providing a snapshot of financial health and risk preparedness. Used for discussions on risk mitigation and financial prudence.
Risk Management, NPL Ratio, Coverage Ratio, Cost of Risk, Financial Health, Prudence, Strategy
false
Risk Assessment and Management
Financial Services
Mixed Chart
Morgan Stanley
Add to my slides
Remove from favorites
The slide has two columns: the left side describes actions taken by CROs to enhance risk management, and the right side lists specific enhancements made.
Operational Efficiency
Financial Services
This slide details actions taken by companies to enhance risk management practices in response to market events in 2023, such as increased risk management involvement.
risk management, operational efficiency, enhancements, market events, actions
false
Operational Efficiency
Financial Services
Multiple Chart
EY
Add to my slides
Remove from favorites
The slide has a two-column layout with a title and text explaining the importance of holistic risk management practices and a column chart listing actions taken to enhance these practices.
Operational Efficiency
Financial Services
The slide emphasizes the importance of comprehensive risk management practices, including capital planning and contingency measures, to strengthen operational resilience.
risk management, operational resilience, holistic practices, capital planning, contingency measures
false
Operational Efficiency
Financial Services
Multiple Chart
EY
Add to my slides
Remove from favorites
Slide features two pie charts showing percentages of organizational readiness. Includes a table meeting setting with diverse participants.
Risk Assessment and Management
Professional Services
Discusses the gap in organizational readiness to handle human risk factors with statistics on awareness and preparedness of executives.
risk management, organizational readiness, pie chart, human risk, corporate strategy
false
Risk Assessment and Management
Professional Services
Multiple Chart
Deloitte
Add to my slides
Remove from favorites
Slide features a circular flow diagram in the center, surrounded by various text boxes with check marks, all against a white and blue background.
Risk Assessment and Management
Financial Services
This slide highlights the company's approach to risk management oversight, detailing the processes, structures, and culture in place to mitigate risks. It's used to assure stakeholders of the robust risk management strategies employed by the company.
risk management, oversight, processes, strategy
false
Risk Assessment and Management
Financial Services
Linear Flow
Goldman Sachs
Add to my slides
Remove from favorites
The slide features two sections: one with a timeline comparing risk monitoring capabilities from 2007 to today, and the other with a line and dashed line graph depicting portfolio net charge-offs from 2016 to 2018. There are checkmarks and trend analyses.
Risk Assessment and Management
Financial Services
This slide illustrates the enhancement of risk monitoring over time and its positive effect on portfolio performance, specifically targeting financial experts or stakeholders interested in risk management strategies and their impact on financial growth.
risk management, portfolio, NCOs, growth, trend analysis, 2007, today, financial stability
false
Risk Assessment and Management
Financial Services
Mixed Chart
JP Morgan
Add to my slides
Remove from favorites
The slide has a circular, flow-like diagram in the center with a professional blue and white color scheme. The diagram surrounds the company logo, and to the right, there are bullet points outlining types of risks.
Risk Assessment and Management
Financial Services
Focuses on the company’s approach to risk management, outlining key components like culture, process, and oversight, and enumerates evolving risk profiles such as reputational and cybersecurity risks.
risk management, process, culture, oversight, reputational, cybersecurity, geopolitical
false
Risk Assessment and Management
Financial Services
Framework
Goldman Sachs
Add to my slides
Remove from favorites
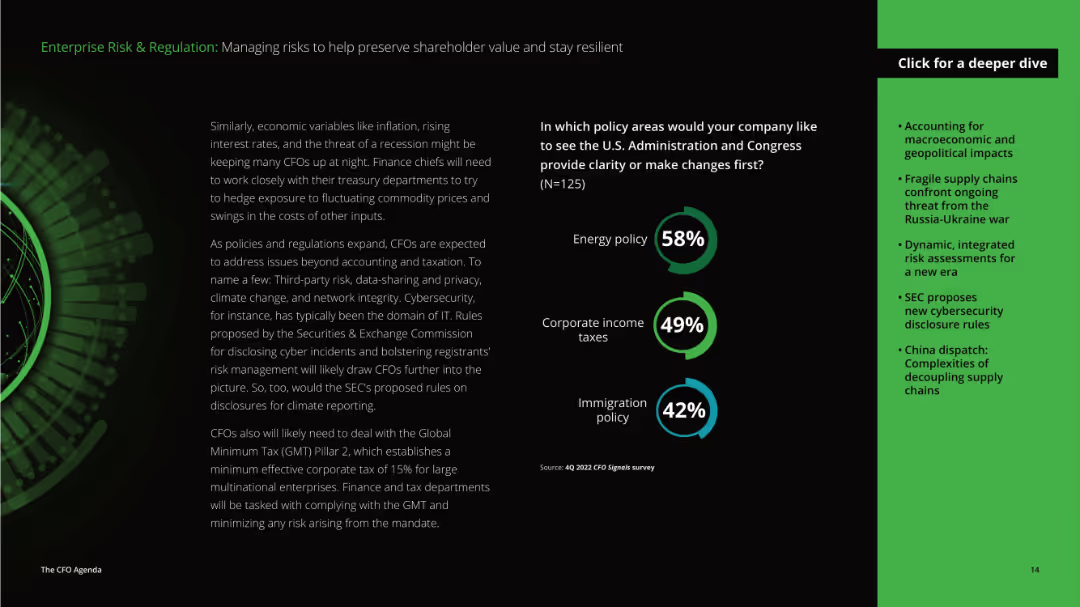
The slide has detailed text on the left discussing economic variables and policies affecting CFOs, and a column chart on the right showing policy areas needing clarity or changes.
Risk Assessment and Management
Professional Services
This slide focuses on managing risks and regulatory challenges, emphasizing the importance of clarity in energy policy, corporate income taxes, and immigration policy for CFOs to preserve shareholder value and resilience.
risk management, regulation, economic variables, policies, energy policy, corporate taxes, immigration policy, CFO, shareholder value, resilience
false
Risk Assessment and Management
Professional Services
Mixed Chart
Deloitte
Add to my slides
Remove from favorites
Features a complex set of bullet points and a column charts to depict financial risk metrics and regulatory requirements.
Risk Assessment and Management
Financial Services
Details on the bank's capacity to absorb losses, essential for risk management strategies and regulatory compliance.
risk management, regulatory compliance, financial safety, TLAC, MREL
false
Risk Assessment and Management
Financial Services
Multiple Chart
Deutsche Bank
Add to my slides
Remove from favorites
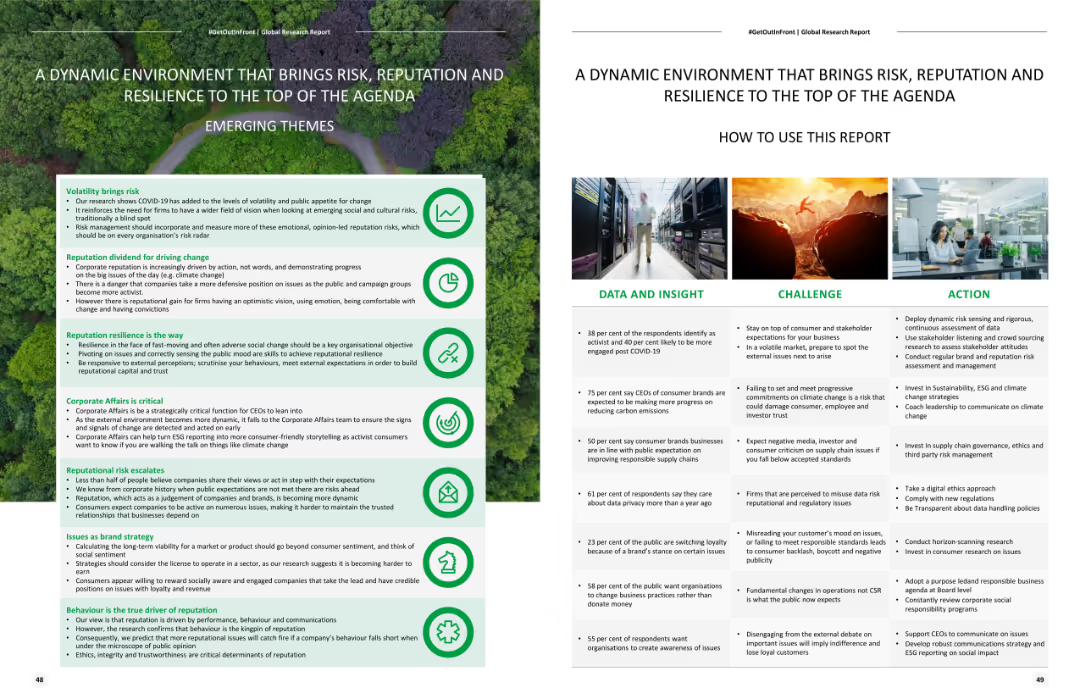
Includes a list of emerging themes and a structured layout with bullet points detailing data insights, challenges, and actions related to risk and reputation.
Strategic Planning
Professional Services
Discusses the importance of risk, reputation, and resilience in the current environment, providing insights and actions for managing these factors effectively.
Risk management, reputation, resilience, strategic planning, emerging themes
false
Strategic Planning
Professional Services
Header Horizontal
Deloitte
Add to my slides
Remove from favorites
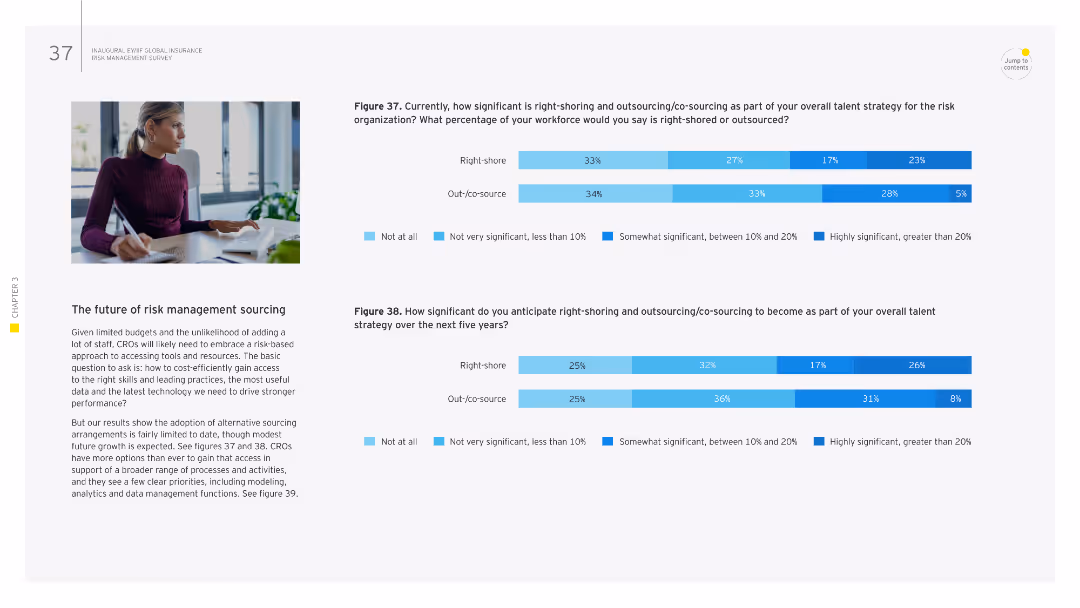
The slide includes a column chart that shows the types of risk management roles and functions anticipated to benefit from right-shoring or outsourcing strategies over the next five years.
Operational Efficiency
Financial Services
It discusses which risk management roles and functions, such as quantitative analytics and data management, are expected to be optimized through right-shoring or outsourcing. This slide helps in identifying key areas for operational efficiency improvements.
risk management, roles, functions, right-shoring, outsourcing, efficiency
false
Operational Efficiency
Financial Services
Mixed Chart
EY
Add to my slides
Remove from favorites
A slide with a dark blue theme containing two column charts showing the evolution of market and credit RWAs from 2015 to 2019, along with bullet points outlining the company's risk management culture, processes, and oversight.
Risk Assessment and Management
Financial Services
It communicates Goldman Sachs' approach to risk management, detailing changes in risk-weighted assets and the infrastructure supporting risk management processes, valuable for presentations on corporate risk policies or compliance training.
Risk management, RWAs, market, credit, Goldman Sachs
false
Risk Assessment and Management
Financial Services
Multiple Chart
Goldman Sachs
Add to my slides
Remove from favorites
The slide shows a group of professionals in a meeting with a bar chart comparing satisfaction with risk function progress in 2023 vs. 2021. The chart is labeled with various risk management areas like "Reducing cost," "Ensuring risk is factored," and "Re-engineering." A series of percentages indicate increased satisfaction across the board. The image conveys an office setting.
Risk Assessment and Management
Technology & Software
This slide analyzes the satisfaction levels across different areas of risk management from 2021 to 2023. It reveals an increase in satisfaction in all listed areas, indicating a positive trend in the effectiveness of risk management strategies. Such insights are crucial for understanding the impact of implemented risk management improvements and strategizing future enhancements in organizational risk approaches.
risk management, satisfaction, progress, 2023, 2021, column chart, professional setting, office, analysis
false
Risk Assessment and Management
Technology & Software
Mixed Chart
Accenture
Add to my slides
Remove from favorites
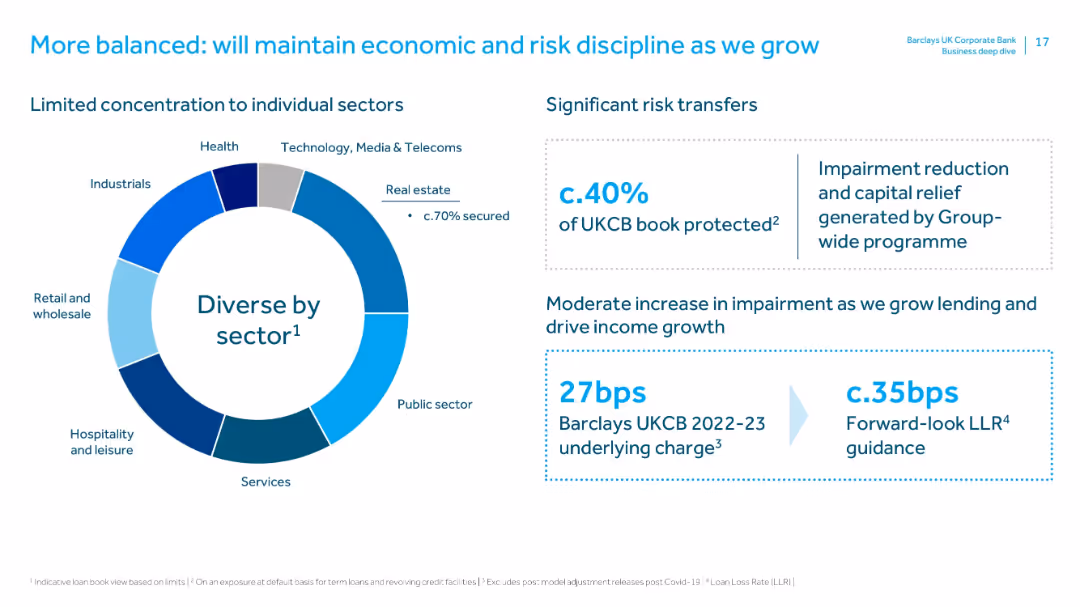
Circular chart showing sector diversity in the loan book, with text boxes on risk transfers and impairment metrics.
Risk Assessment and Management
Financial Services
Emphasizes risk diversification and mitigation. Nearly 40% of the loan book is protected, impairment charges are low, and the bank plans to maintain strong risk discipline as lending increases.
risk management, sector diversification, impairment, capital relief, loan book, risk transfers, discipline, LLR
false
Risk Assessment and Management
Financial Services
Mixed Chart
Barclays
Add to my slides
Remove from favorites
The slide contains a series of pie charts depicting the top skills required in risk management over the next three years, categorized by overall, G-SIB, and non-G-SIB responses.
Risk Assessment and Management
Financial Services
This slide identifies the top skills needed in the risk management function, such as data science, cybersecurity, and AI-based model risk management, crucial for future preparedness.
risk management, skills, pie charts, G-SIB, non-G-SIB
false
Risk Assessment and Management
Financial Services
Multiple Chart
EY
Add to my slides
Remove from favorites
This slide features a combination of text and column charts. It discusses the significance of right-shoring and outsourcing in risk management, supported by data showing current and future expectations.
Strategic Planning
Financial Services
It evaluates the role of right-shoring and outsourcing in risk management, presenting data on how these strategies are currently utilized and expected to evolve. The slide is useful for strategic planning in risk management sourcing.
risk management, sourcing, right-shoring, outsourcing, strategic planning
false
Strategic Planning
Financial Services
Multiple Chart
EY
Add to my slides
Remove from favorites
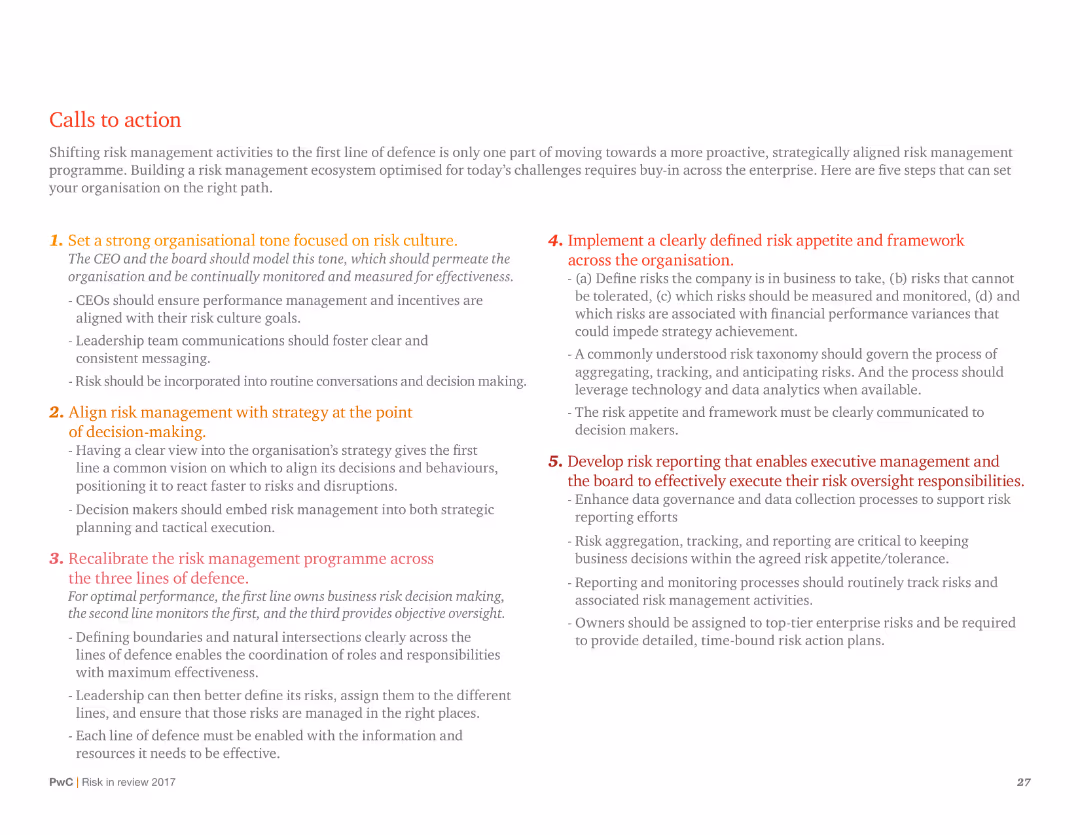
A text-heavy slide with numbered points outlining strategic actions for risk management, with a focus on organizational tone and risk culture.
Strategic Planning
Professional Services
Provides a detailed action plan for improving risk management, including setting organizational tone, aligning risk with strategy, and developing risk reporting.
Risk management, strategic planning, organizational tone, risk culture, action plan, reporting, alignment
false
Strategic Planning
Professional Services
Vertical Flow
PwC/Strategy&
Add to my slides
Remove from favorites
Combines text with a large image and statistics to discuss the integration of risk management with strategy and performance management.
Risk Assessment and Management
Professional Services
The slide advocates for integrating risk management into strategic planning to improve organizational resilience, highlighting top risks for 2023 and their potential impacts.
risk management, strategic planning, resilience, professional services, 2023 risks, integration, performance management
false
Risk Assessment and Management
Professional Services
Multiple Chart
EY
Add to my slides
Remove from favorites
Slide includes a pathway diagram outlining steps for leveraging risk management in organizational growth, with clear visual markers and directional flow.
Strategic Planning
Professional Services
Provides a strategic guide on integrating risk management into business growth plans, emphasizing realistic goals and leadership, applicable in strategic business planning workshops or seminars.
risk management, strategy, growth, leadership
false
Strategic Planning
Professional Services
Linear Flow
PwC/Strategy&
Add to my slides
Remove from favorites
Featuring icons representing five risk areas, the slide is laid out to facilitate easy comparison and risk assessment, using a blue and black theme.
Risk Assessment and Management
Professional Services
Focused on risk management, this slide outlines the primary areas of risk to consider during new technology implementation, from business to legal considerations. It's instrumental for leadership and management audiences in formulating a comprehensive risk assessment and mitigation strategy.
Risk Management, Technology, Business, Legal, Society, Operational, Compliance, Strategy
false
Risk Assessment and Management
Professional Services
Pillar
McKinsey
Add to my slides
Remove from favorites
Column charts illustrating investment categories over years and a graphical representation of risk management capabilities.
Risk Assessment and Management
Financial Services
This slide highlights advanced risk management capabilities and delivery approach, with strategic investments and technology platforms.
Risk management, technology platform, investment categories, strategic investments, delivery approach
false
Risk Assessment and Management
Financial Services
Multiple Chart
Credit Suisse
Add to my slides
Remove from favorites
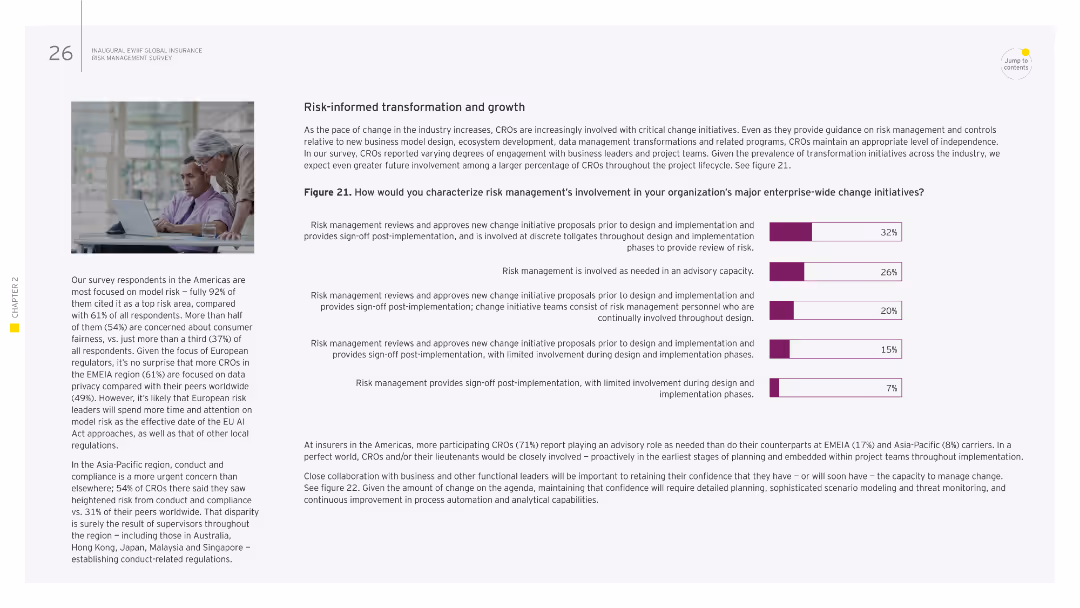
Image of two people working together. Column chart showing risk management involvement in major enterprise-wide change initiatives.
Strategic Planning
Financial Services
This slide examines the role of risk management in enterprise-wide change initiatives, detailing the different levels of involvement from advisory roles to active participation. It emphasizes the need for risk management to provide sign-off and oversight throughout the implementation phases of change initiatives.
risk management, transformation, change initiatives, enterprise-wide, oversight
false
Strategic Planning
Financial Services
Mixed Chart
EY
Add to my slides
Remove from favorites
Bar chart showing the percentages of late initiatives and value leakage during deployment for different transformation scenarios.
Risk Assessment and Management
Professional Services
Assesses risk management in transformations by analyzing initiative timeliness and value leakage.
risk, management, transformation, initiatives, analysis
false
Risk Assessment and Management
Professional Services
Single Chart
McKinsey
Add to my slides
Remove from favorites
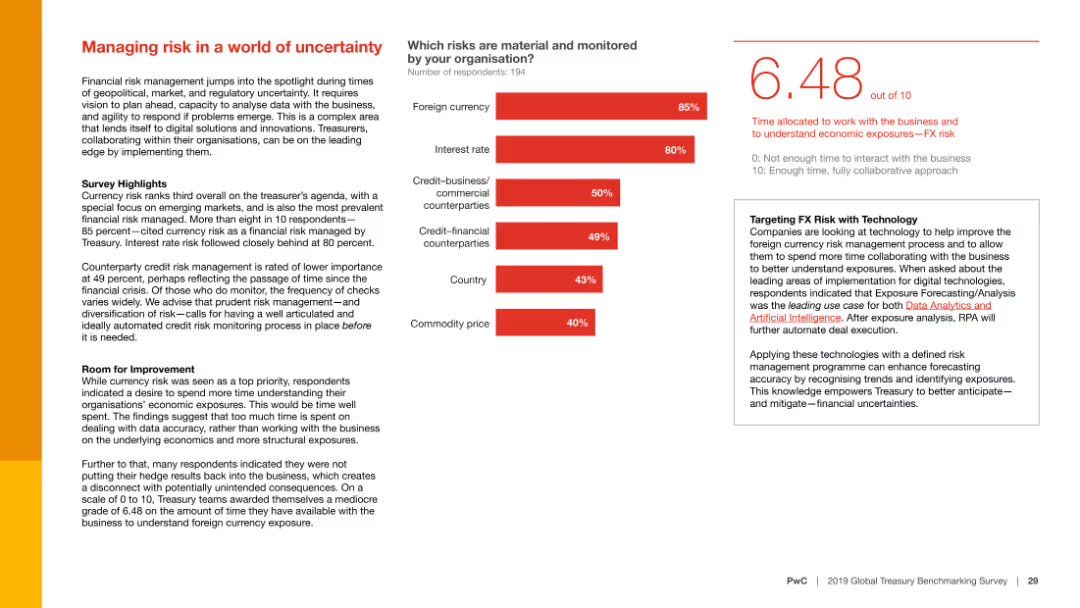
The slide features a column chart showing the material risks monitored by organizations and text discussing survey highlights, room for improvement, and targeting FX risk with technology.
Risk Assessment and Management
Financial Services
This slide focuses on the importance of managing financial risks, particularly currency risk, in uncertain times, and discusses the use of technology to improve foreign currency risk management.
Risk management, uncertainty, currency risk, financial services, survey highlights, room for improvement, technology, FX risk, financial risks, market trends
false
Risk Assessment and Management
Financial Services
Mixed Chart
PwC/Strategy&
Add to my slides
Remove from favorites
Slide with title and subtitle, utilizes a puzzle graphic as a metaphor for critical components of disciplined underwriting. Also, features two column charts showing approval rates and card NCO rates based on deposit relationships.
Risk Assessment and Management
Financial Services
This slide could be used to illustrate the advantages of deepened banking relationships in risk management. It uses underwriting as a case study to show how customer data from non-card relationships can inform better risk decisions, with graphical data supporting the claims.
Risk Management, Underwriting, Banking Relationships, Data Utilization, Customer Data, Deposit Relationships, Approval Rates, Financial Services, Card NCO Rates, Chase
false
Risk Assessment and Management
Financial Services
Mixed Chart
JP Morgan
Add to my slides
Remove from favorites
Incorporates line graphs to depict trading profit and loss along with value-at-risk (VaR) metrics, clearly showing trends and fluctuations over the fiscal year, with key points noted for significant changes or anomalies.
Risk Assessment and Management
Financial Services
Provides a quantitative measure of potential financial risk over a given period, showcasing the bank's risk management effectiveness in handling market volatilities.
risk management, VaR, trading, finance, metrics
false
Risk Assessment and Management
Financial Services
Single Chart
Deutsche Bank
Add to my slides
Remove from favorites
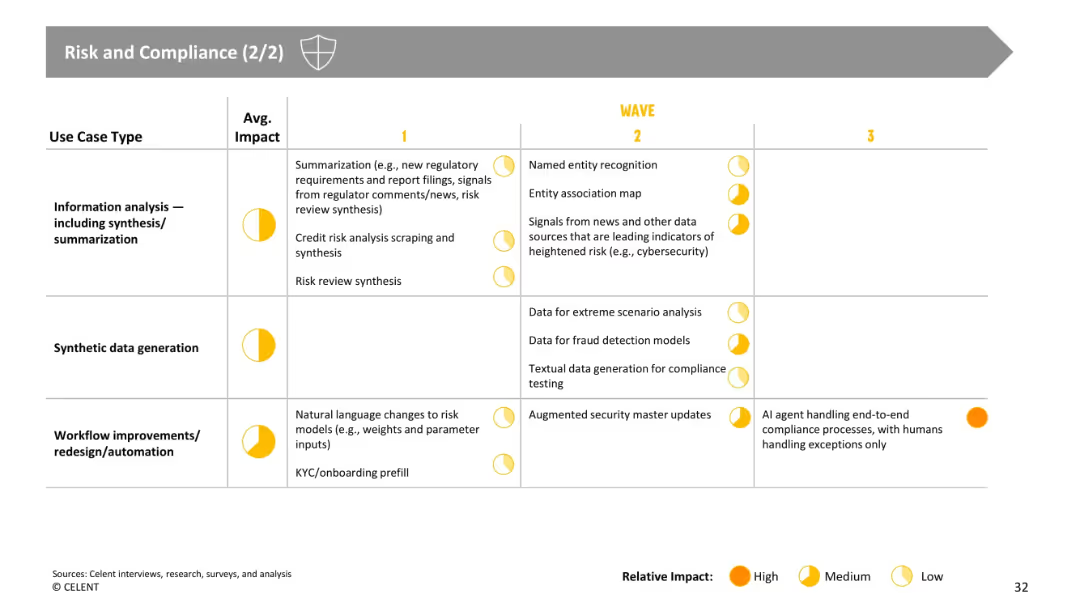
Follows same format; focuses on summarization, risk synthesis, synthetic data, and workflow redesign. High-impact use cases appear in Wave 3 (e.g., full compliance automation).
Risk Assessment and Management
Financial Services
Continues analysis of compliance-related use cases, particularly focused on risk evaluation, fraud modeling, and automated workflows. Points to long-term impact of AI agents handling complex compliance processes with minimal human intervention, highlighting innovation potential.
risk management, workflow, fraud, synthetic data, compliance automation, GenAI
false
Risk Assessment and Management
Financial Services
Single Chart
Oliver Wyman
Add to my slides
Remove from favorites
Identical in layout and content to slide 17723, with Exhibit 14 focused on risk mitigation importance measures via horizontal bar charts.
Risk Assessment and Management
Real Estate & Construction
Duplicate of slide 17723. Reinforces the importance of risk mitigation strategies such as estimating accuracy, modular execution, and remote work models. Emphasizes growing need for innovation in response to pandemic-related and geopolitical disruptions.
risk mitigation, estimating, modular construction, DFMA, supply chain, job travel, innovation, resilience
false
Risk Assessment and Management
Real Estate & Construction
Mixed Chart
KPMG
Add to my slides
Remove from favorites
Features a clean design with icons and brief descriptions of the five stages of JPMorgan's risk mitigation methodology, easy to follow and visually engaging.
Risk Assessment and Management
Financial Services
The slide explains JPMorgan Chase & Co.'s comprehensive approach to risk mitigation, ideal for presentations on risk management strategy.
risk mitigation, methodology, JPMorgan, prevention, detection, recovery
false
Risk Assessment and Management
Financial Services
Pillar
JP Morgan
Add to my slides
Remove from favorites
Left side shows a column chart with percentages, right side has a bar chart and text
Risk Assessment and Management
Financial Services
Strategies for mitigating risks with generative AI, focusing on data guidelines and human roles
risk mitigation, strategies, data guidelines, AI risks
false
Risk Assessment and Management
Financial Services
Multiple Chart
Gartner
Add to my slides
Remove from favorites
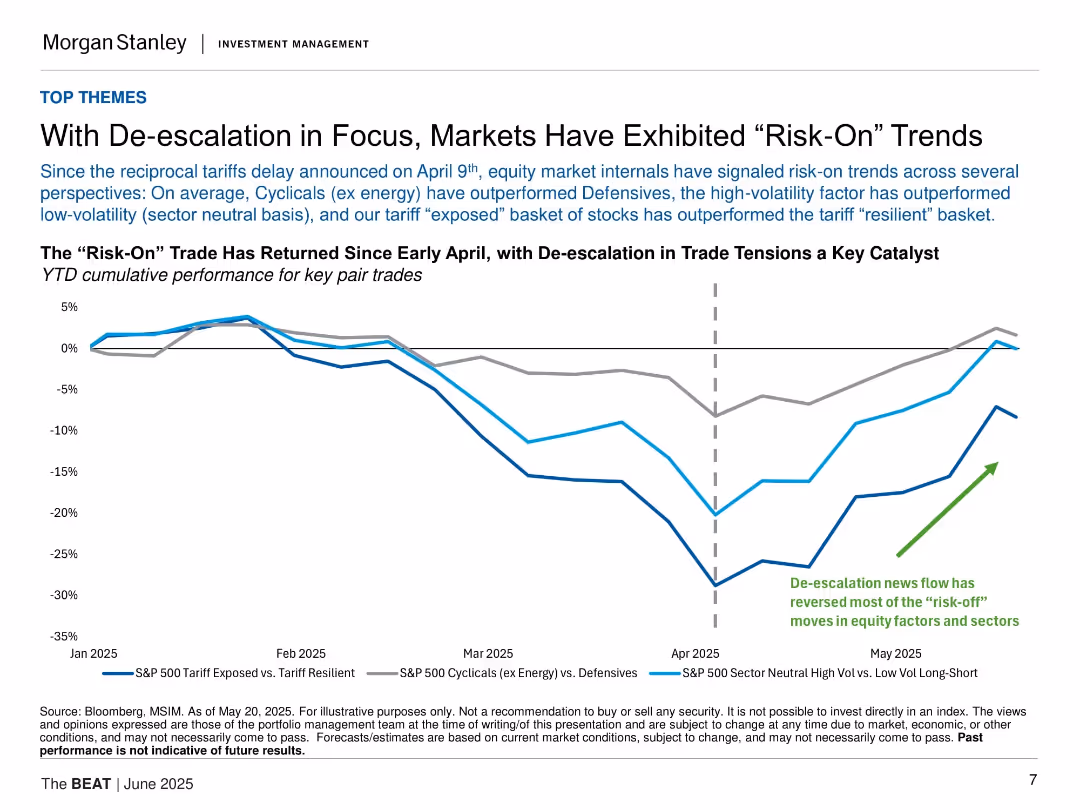
Line chart tracking three equity pair trade performances YTD; annotated with vertical line for April tariff delay; includes labeled color-coded lines.
Market Analysis and Trends
Financial Services
Shows return of “risk-on” market behavior following April tariff de-escalation. Cyclicals, high-volatility, and tariff-exposed equities outperformed their defensive or resilient counterparts. Suggests sentiment shift linked to improved trade outlook.
risk-on, equities, tariffs, market trends, volatility
false
Market Analysis and Trends
Financial Services
Single Chart
Morgan Stanley
Add to my slides
Remove from favorites
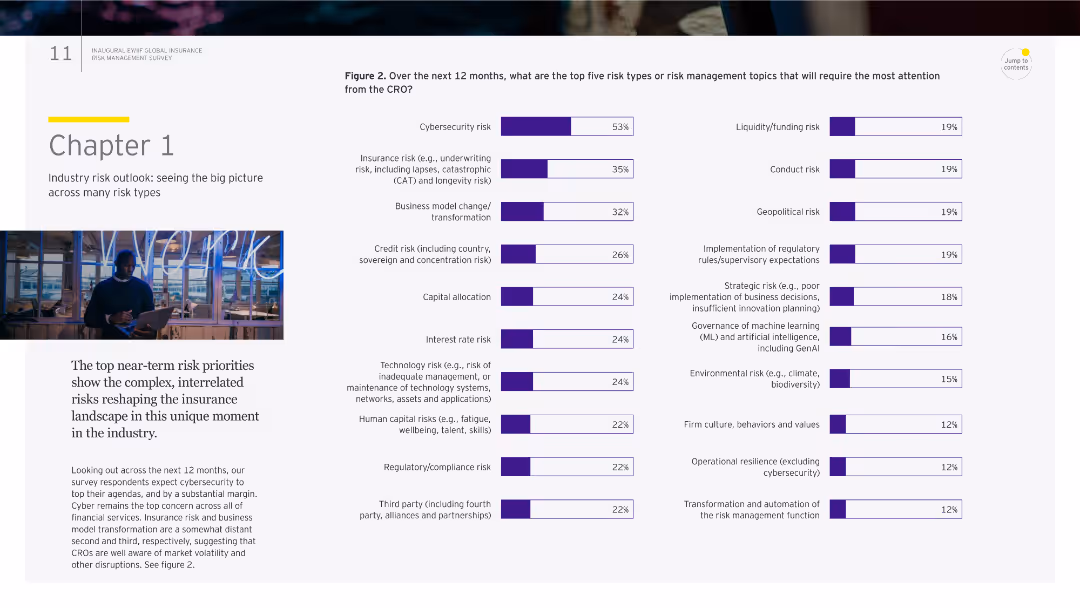
The slide has a column chart and a title "Chapter 1." The chart shows the top five risk types expected to require attention from the CRO.
Market Analysis and Trends
Financial Services
This slide presents the top risk priorities for the insurance industry over the next 12 months, focusing on cybersecurity, insurance risk, and business model changes.
risk outlook, cybersecurity, insurance, market trends, CRO
false
Market Analysis and Trends
Financial Services
Multiple Chart
EY
Add to my slides
Remove from favorites
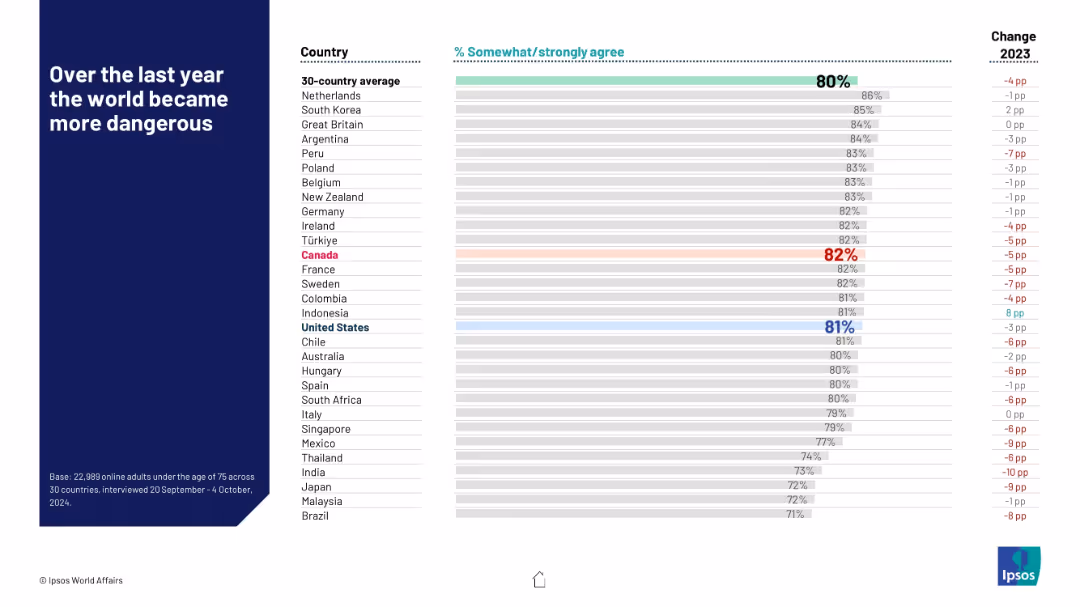
Horizontal bar chart ranking countries by agreement with the statement; red and blue highlights for key countries; change column on right.
Risk Assessment and Management
Government & Public Sector
This slide visualizes the percentage of people in each country who agree that the world became more dangerous in the past year. The global average is 80%, with notable concern in the Netherlands and South Korea. Changes from 2023 are also shown, highlighting shifts in perception.
risk perception, public sentiment, safety, geopolitical fear, country rankings, Ipsos, 2024, year-over-year change, world affairs, global danger
false
Risk Assessment and Management
Government & Public Sector
Mixed Chart
IPSOS
Add to my slides
Remove from favorites
Two comparative area charts show the risk premia components for South American Chemicals Company using Morgan Stanley’s SICR Analysis vs. traditional analysis methods.
Strategic Planning
Financial Services
The slide explains the decomposition of risk premia into US treasury, sovereign-induced corporate credit, and corporate spread over sovereign spread. Useful for strategic risk analysis.
risk premia, SICR, corporate credit, sovereign spread, analysis
false
Strategic Planning
Financial Services
Multiple Chart
Morgan Stanley
Add to my slides
Remove from favorites
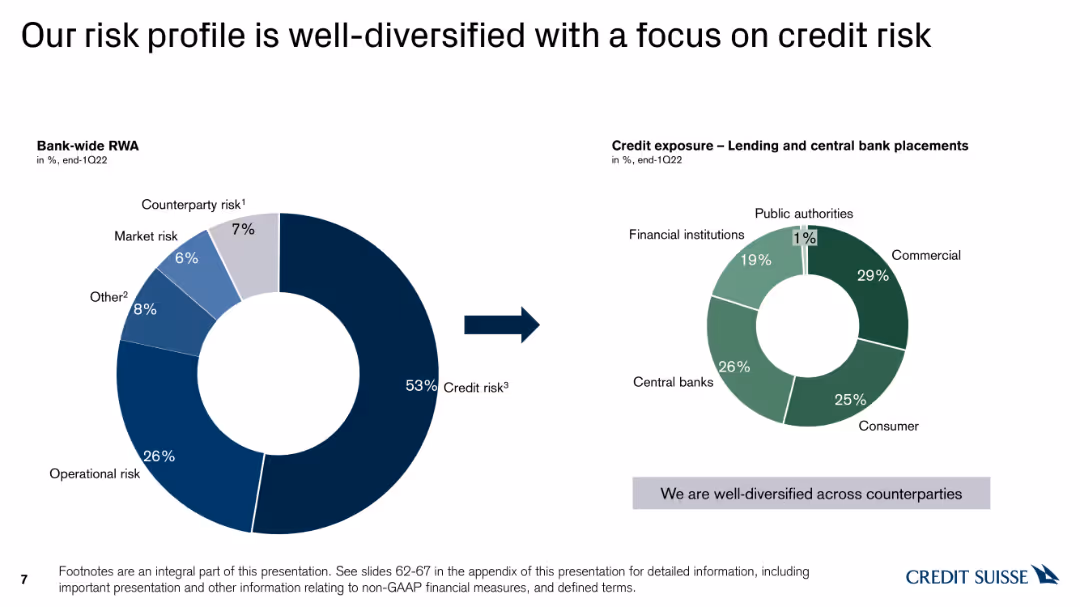
The slide contains a pie chart showing the distribution of bank-wide RWA by risk type and another pie chart detailing credit exposure by counterparty, with minimal text explanations.
Risk Assessment and Management
Financial Services
This slide provides an overview of the bank's risk profile, emphasizing the focus on credit risk, with visual data on risk-weighted assets and credit exposure across different counterparties.
risk profile, credit risk, RWA distribution, financial risk management, counterparty exposure
false
Risk Assessment and Management
Financial Services
Multiple Chart
Credit Suisse
Add to my slides
Remove from favorites
Two column charts comparing bank-wide market and credit risk RWA for 1Q21 and 1Q22. Text boxes outline recalibrated risk profiles and strategic areas of reinvestment.
Risk Assessment and Management
Financial Services
This slide shows the recalibration of the aggregate risk profile, including the reduction in risk-weighted assets (RWA) and leverage exposure, managed reductions, and strategic reinvestment in specific areas.
risk profile, recalibrated, strategic areas, RWA, leverage exposure
false
Risk Assessment and Management
Financial Services
Mixed Chart
Credit Suisse
Add to my slides
Remove from favorites
The slide features a central diagram connecting various factors that influence risk-taking behavior, such as fear, urgency, and blame, with icons and a muted color palette.
Risk Assessment and Management
Professional Services
Focuses on psychological and business factors driving risk behavior, useful for understanding employee and management attitudes towards risk. This can aid in developing risk management strategies and corporate training.
risk, psychology, behavior, management, training
false
Risk Assessment and Management
Professional Services
Diagram
PwC/Strategy&
Add to my slides
Remove from favorites
Three column charts showing reductions in credit portfolio exposure, Prime Services credit RWA, and WM Ship Financing credit exposure for 1Q21 vs. 1Q22.
Risk Assessment and Management
Financial Services
Highlights the focused reductions in higher risk areas, including credit portfolio de-risking, Prime Services reduction, and successful repositioning of Ship Finance, showing percentage decreases in risk exposure over time.
risk reduction, credit portfolio, Prime Services, Ship Financing, de-risking
false
Risk Assessment and Management
Financial Services
Multiple Chart
Credit Suisse
Add to my slides
Remove from favorites
The slide has two column charts showing risk-weighted asset progression and leverage exposure progression, with accompanying text detailing expected reductions by 2025.
Strategic Planning
Financial Services
This slide details the strategy and expected outcomes of winding down the non-core unit, highlighting reductions in risk-weighted assets and leverage exposure over a timeline.
risk reduction, strategic planning, asset progression, financial management, cost reduction
false
Strategic Planning
Financial Services
Multiple Chart
Credit Suisse
Add to my slides
Remove from favorites
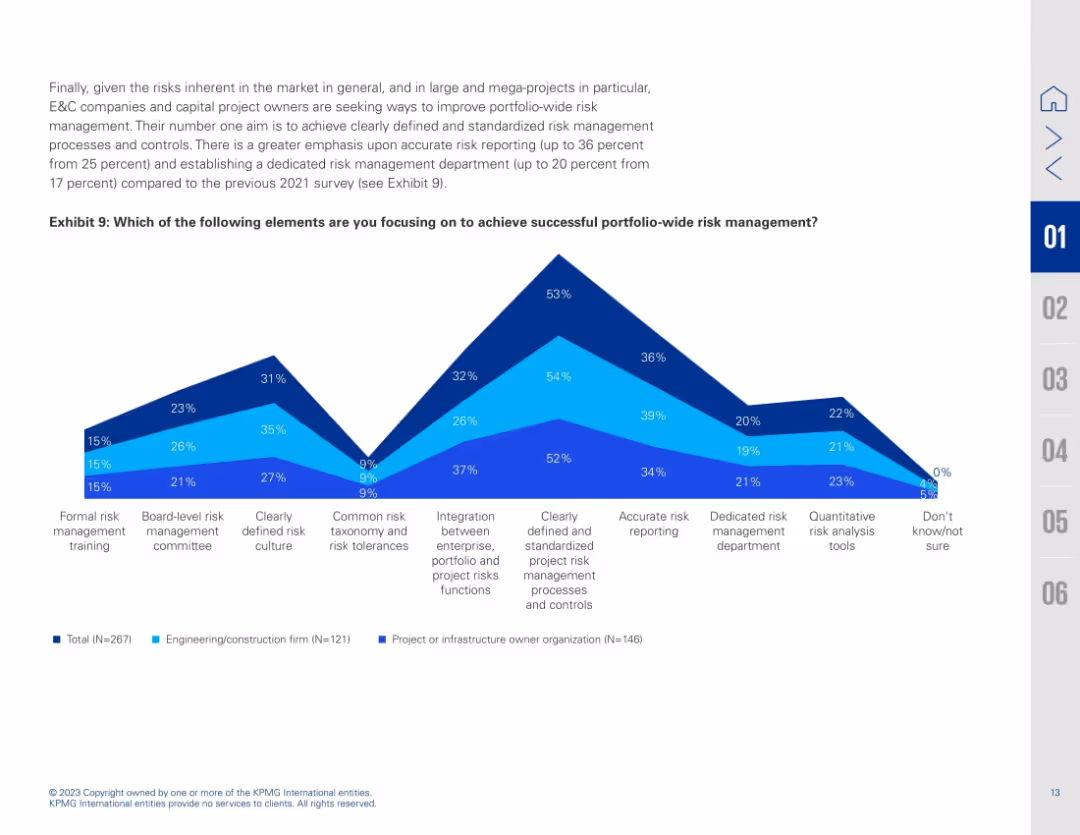
Wide line chart with percentage focus on various portfolio-wide risk management strategies. X-axis contains strategy elements; Y-axis shows percentage focus. Color-coded by organization type.
Risk Assessment and Management
Real Estate & Construction
This slide identifies areas of focus to achieve effective portfolio-wide risk management. The top strategy cited is having clearly defined and standardized processes (53%), followed by accurate risk reporting and integration across functions. The data reflects efforts to mature risk management frameworks in response to increasing project complexity and volatility.
risk reporting, standardization, portfolio management, integration, risk department, training, construction governance
false
Risk Assessment and Management
Real Estate & Construction
Mixed Chart
KPMG
Add to my slides
Remove from favorites
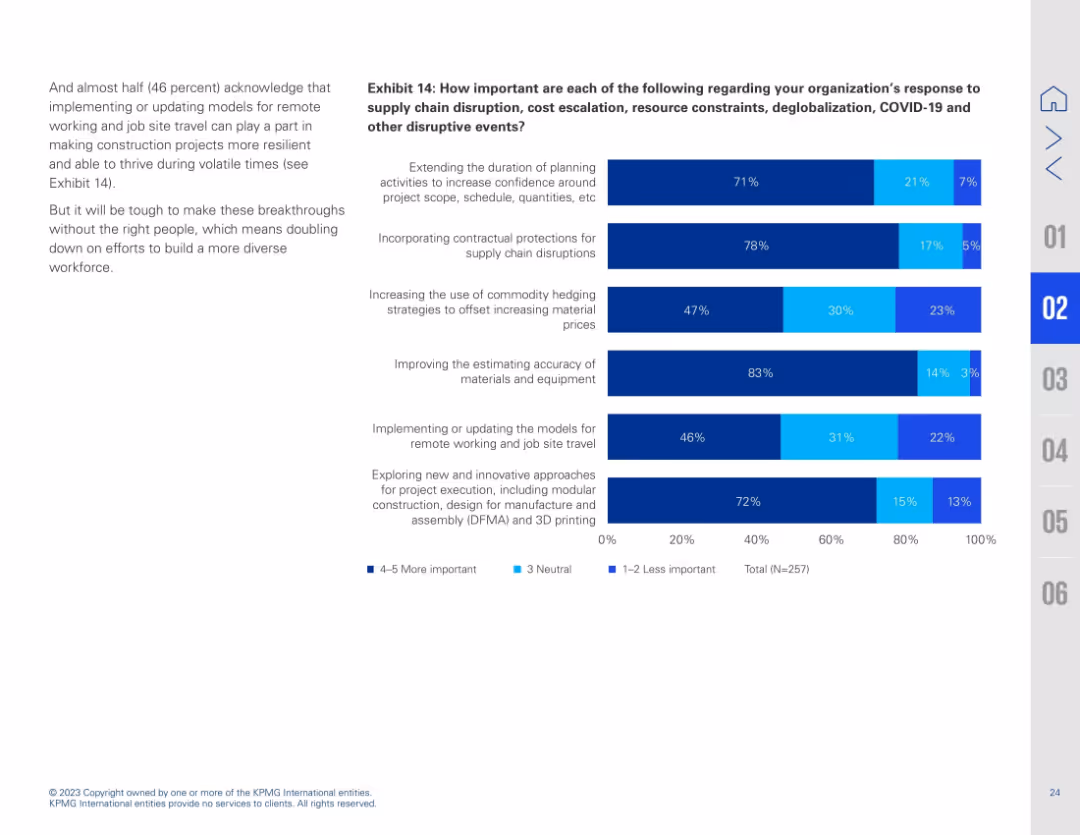
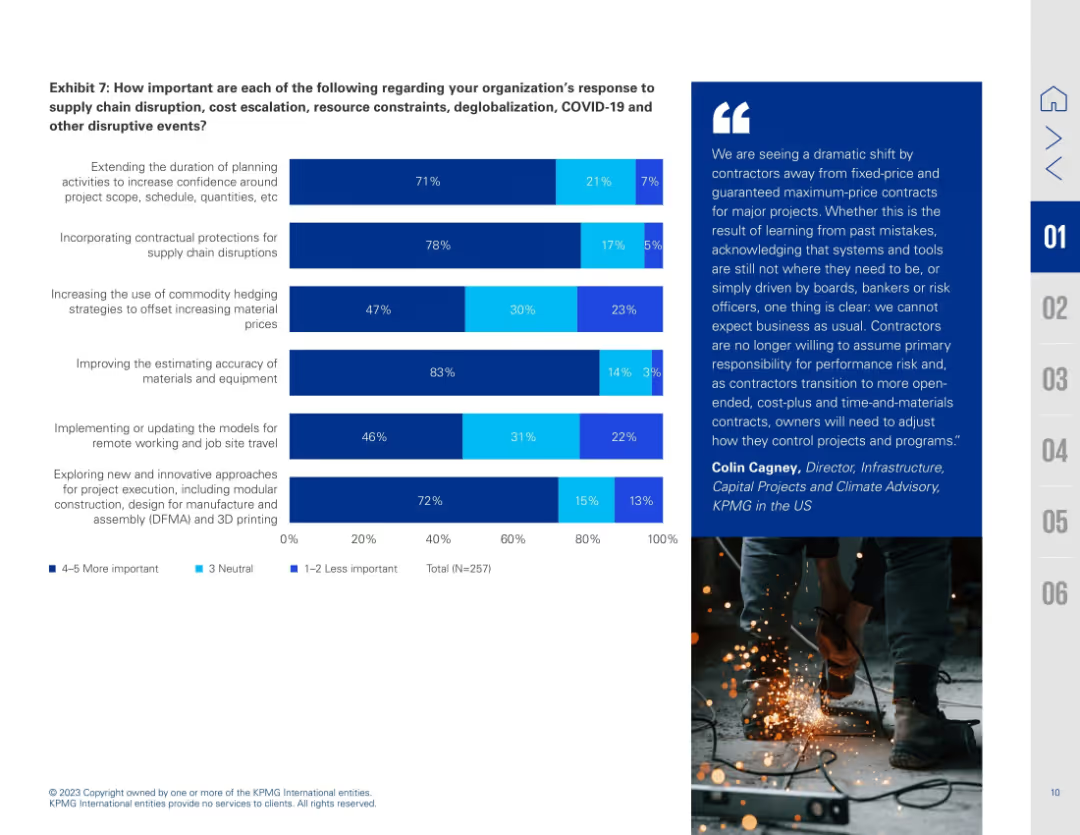
Single-column layout with six horizontal bar charts stacked vertically (Exhibit 7). Right side features a quote and photo of construction workers. Each bar indicates importance level of various risk-mitigation strategies.
Risk Assessment and Management
Real Estate & Construction
The slide explores strategies to respond to disruptions like supply chain issues and cost escalation. The highest priority is improving estimating accuracy (83%), followed by contractual protections and innovative execution methods. The accompanying quote emphasizes a shift away from fixed-price contracts as contractors aim to mitigate performance risk in volatile environments.
risk response, estimating accuracy, planning, innovation, DFMA, contract models, remote work, construction disruption, strategy
false
Risk Assessment and Management
Real Estate & Construction
Mixed Chart
KPMG
Add to my slides
Remove from favorites
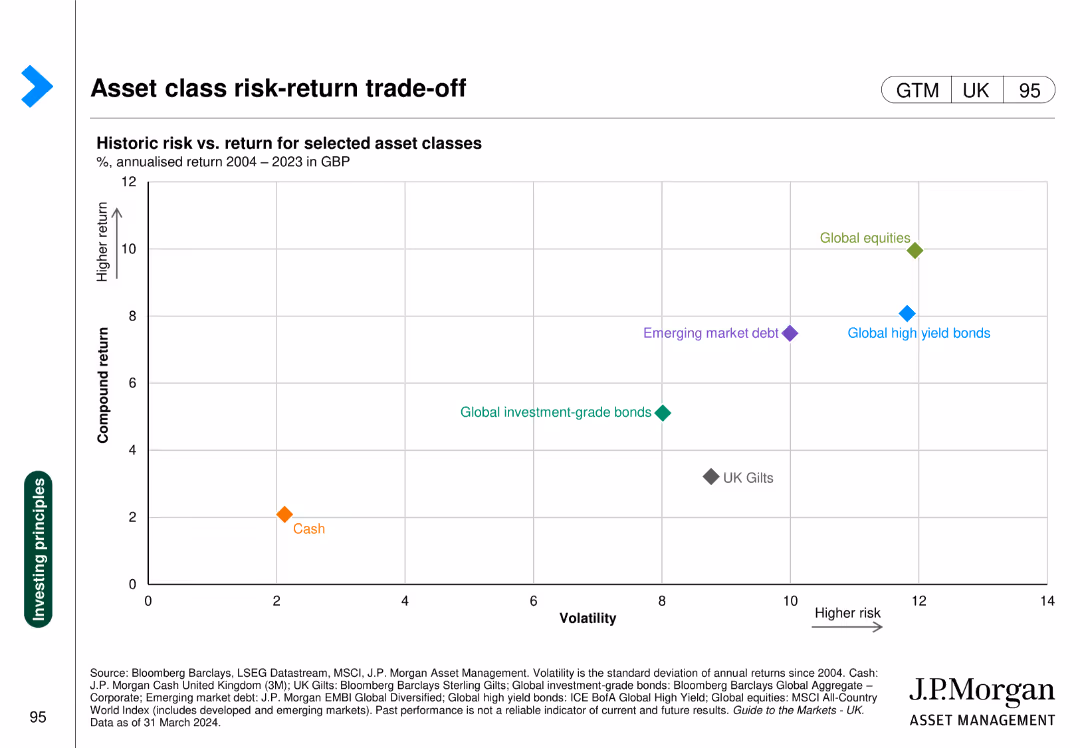
The slide displays a scatter plot showing the historic risk vs. return for selected asset classes, with axes labeled for compound return and volatility.
Risk Assessment and Management
Financial Services
This slide evaluates the risk-return trade-off for various asset classes from 2004-2023, aiding in understanding investment risk profiles.
risk, return, asset classes, volatility, investment
false
Risk Assessment and Management
Financial Services
Single Chart
JP Morgan
Add to my slides
Remove from favorites
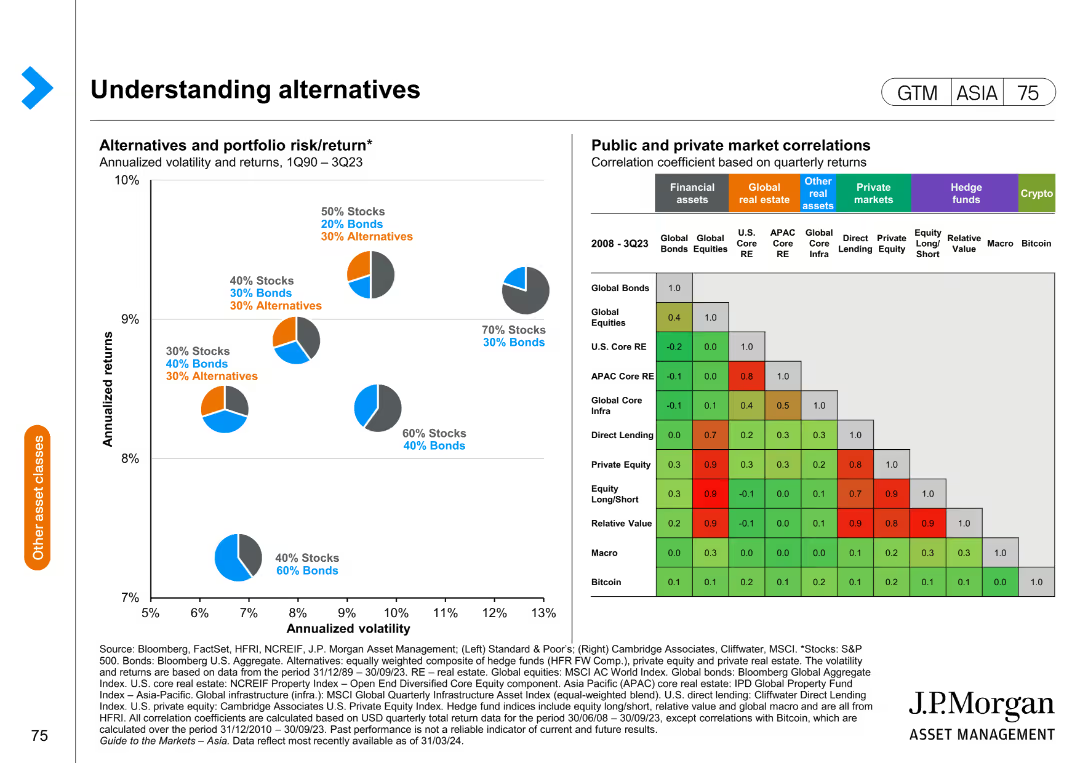
The slide consists of two charts: a scatter plot showing the risk/return profile of different portfolio compositions and a correlation matrix for various asset classes.
Market Analysis and Trends
Financial Services
This slide explains the risk and return dynamics of alternative investments and their correlation with traditional assets, aiding in portfolio diversification strategies.
risk return, portfolio, alternative investments, correlation, diversification
false
Market Analysis and Trends
Financial Services
Mixed Chart
JP Morgan
Add to my slides
Remove from favorites
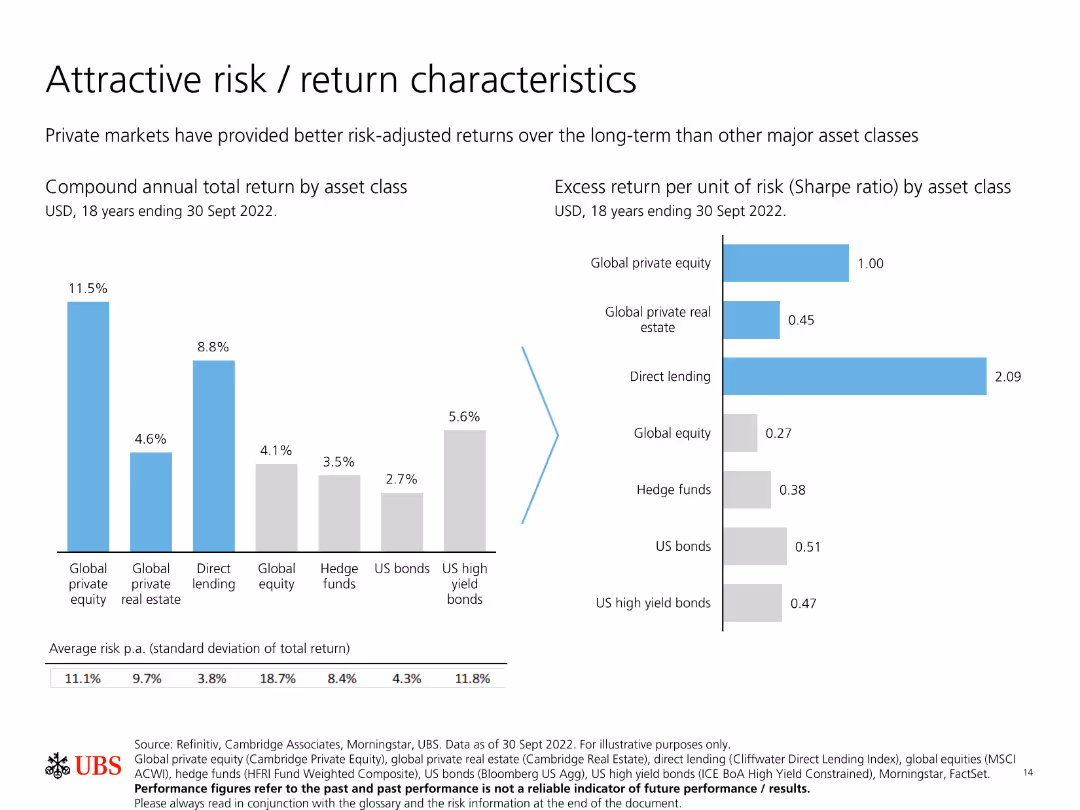
Features two bar charts: one showing compound annual total return by asset class, and another showing excess return per unit of risk (Sharpe ratio) by asset class.
Investment Analysis
Financial Services
Compares the risk and return characteristics of various asset classes, emphasizing how private markets provide better long-term risk-adjusted returns.
Risk, return, private markets, Sharpe ratio, asset classes
false
Investment Analysis
Financial Services
Multiple Chart
UBS
Add to my slides
Remove from favorites
A scatter plot shows the risk/return over 10 years for different market segments, paired with a table detailing the same, to articulate diversification benefits.
Investment Analysis
Financial Services
This slide assesses the risk-return profile of small cap stocks internationally versus emerging markets, underscoring diversification benefits in portfolio management.
risk-return profile, small cap, international markets, emerging markets, diversification, portfolio management, scatter plot
false
Investment Analysis
Financial Services
Single Chart
Morgan Stanley
Add to my slides
Remove from favorites
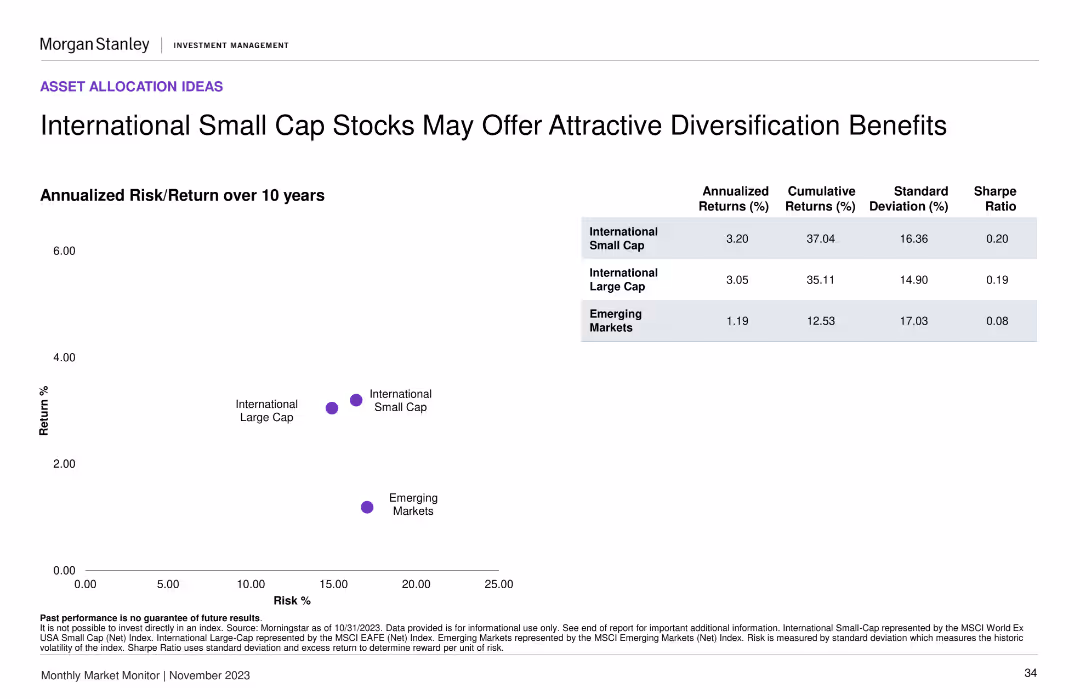
A scatter plot comparing annualized risk/return over 10 years for international small cap, large cap, and emerging markets. Includes a summary table with key statistics.
Investment Analysis
Financial Services
The slide compares the risk and return profiles of international small cap, large cap, and emerging market stocks, highlighting potential diversification benefits for investors.
risk/return, small cap stocks, diversification, emerging markets, investment
false
Investment Analysis
Financial Services
Mixed Chart
Morgan Stanley
Add to my slides
Remove from favorites
A bar chart outlines the top macro risk factors for investors, with changes from a previous survey period marked, highlighting interest rates, geopolitical risks, and inflation.
Risk Assessment and Management
Financial Services
Evaluates major macro risk factors considered by investors, with emphasis on how perceptions have shifted over recent periods. Useful for risk management and strategic investment planning.
risks, investors, macro factors, interest rates, inflation
false
Risk Assessment and Management
Financial Services
Single Chart
BCG
Add to my slides
Remove from favorites
This slide features a graph similar to slide 7, now populated with specific risk events categorized into "BAU," "Adverse," and "Severe." It includes examples like "Consumer Credit" and "Global Financial Crisis" to illustrate the spectrum of risk severity.
Risk Assessment and Management
Financial Services
Slide 8 delves into specific risk scenarios across the risk spectrum, including day-to-day operations and extreme financial crises. It's useful for financial analysts and managers to understand and prepare for different risk levels, discussing the impact of various market events and operational risks.
risk spectrum, financial crisis, BAU, adverse, Goldman Sachs
false
Risk Assessment and Management
Financial Services
Table
Goldman Sachs
Add to my slides
Remove from favorites
The slide presents a series of column charts showing different hypothetical scenarios for assessing risk tolerance among Canadians. The layout is moderately complex.
Risk Assessment and Management
Financial Services
This slide assesses the risk tolerance of Canadians by presenting various scenarios with different potential gains and losses. It aims to measure how willing people are to take risks for higher returns.
risk tolerance, scenarios, investment, assessment, Canadians
false
Risk Assessment and Management
Financial Services
Single Chart
IPSOS
Add to my slides
Remove from favorites
Slide displays two line charts tracking the Value-at-Risk for DB Group's trading and regulatory books. Annotations and quarterly averages are shown. Colors are primarily blue and white.
Risk Assessment and Management
Financial Services
Analysis of DB Group's trading and regulatory risk over quarterly periods, illustrating changes and risk management effectiveness.
Risk, trading, regulatory, finance, analysis, value-at-risk, quarterly, management, DB Group
false
Risk Assessment and Management
Financial Services
Multiple Chart
Deutsche Bank
Add to my slides
Remove from favorites
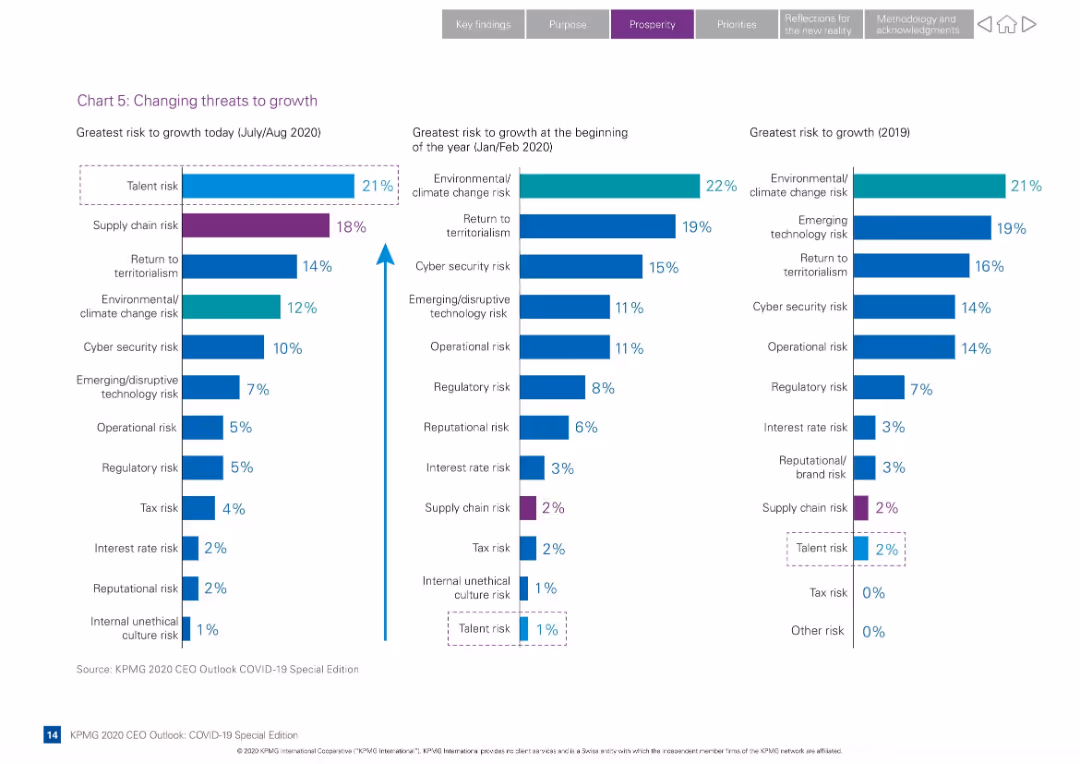
Three-panel bar chart comparing top risks from 2019, early 2020, and mid-2020
Risk Assessment and Management
Professional Services
Displays how CEOs' perception of growth risks shifted due to COVID-19. Talent risk rose to the top in mid-2020, replacing climate change and territorialism from earlier periods.
risk trends, talent risk, COVID-19, supply chain, cybersecurity, environmental risk, bar chart, KPMG Outlook
false
Risk Assessment and Management
Professional Services
Single Chart
KPMG
Add to my slides
Remove from favorites
Contains line graphs representing the value-at-risk and stressed value-at-risk metrics over multiple quarters, with comparative data.
Risk Assessment and Management
Financial Services
Analyzes the bank's financial risk metrics, specifically value-at-risk and stressed value-at-risk, to gauge risk management effectiveness over time.
risk, VaR, sVaR, banking, metrics, management, analysis, financial
false
Risk Assessment and Management
Financial Services
Multiple Chart
Deutsche Bank
Add to my slides
Remove from favorites
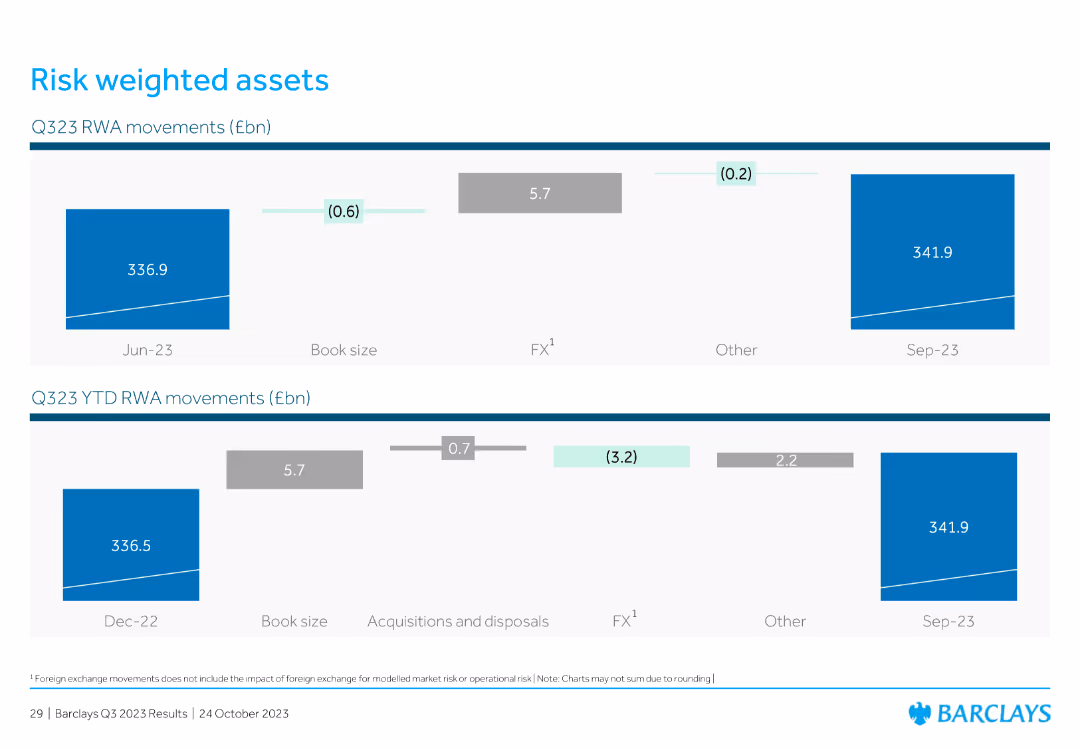
Features two horizontal bar charts showing Q323 RWA movements and year-to-date RWA movements. The slide is visually simple, with a clear emphasis on data trends.
Financial Performance
Financial Services
The slide presents data on risk-weighted assets (RWA) movements for Q323 and year-to-date, providing insights into financial risk management and asset quality.
risk-weighted assets, RWA, Q323, financial risk, asset quality, data trends, bar charts
false
Financial Performance
Financial Services
Multiple Chart
Barclays
Add to my slides
Remove from favorites
Three column charts showing decline in SP risk-weighted assets, value-at-risk, and trading inventory over time.
Risk Assessment and Management
Financial Services
The slide presents data on the decline in SP’s risk-weighted assets, value-at-risk, and trading inventory, indicating improved risk management.
Risk-weighted assets, value-at-risk, trading inventory, risk management, capital velocity
false
Risk Assessment and Management
Financial Services
Multiple Chart
Credit Suisse
Add to my slides
Remove from favorites
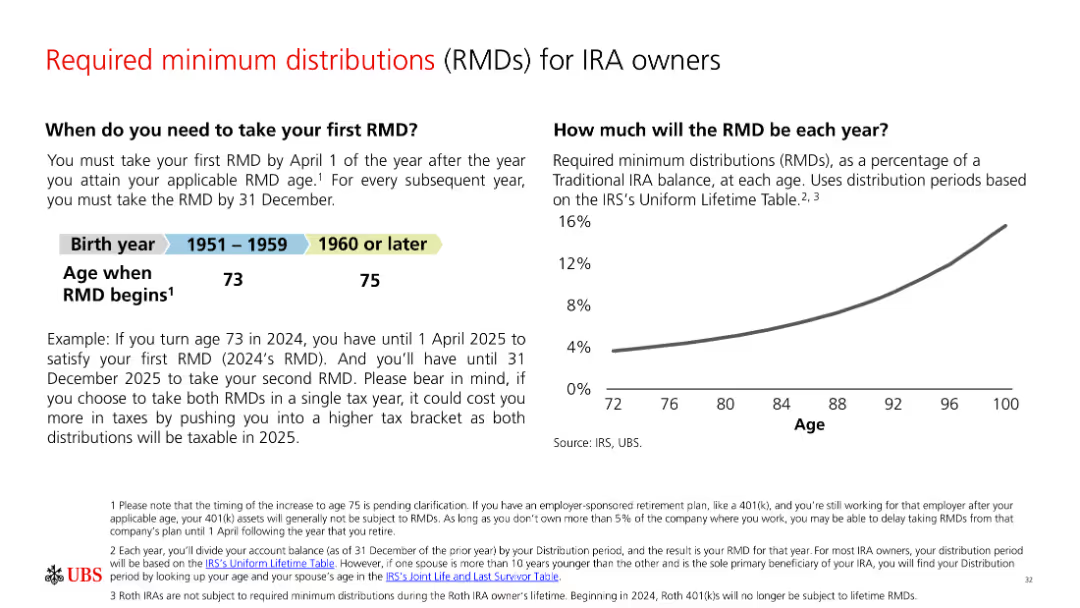
A slide with text and a line graph explaining required minimum distributions (RMDs) for IRA owners. It includes a table with RMD start ages and example calculations.
Regulatory and Compliance
Financial Services
The slide explains when IRA owners need to start taking required minimum distributions and how much these distributions will be, supported by a line graph and example calculations.
RMDs, IRA, retirement planning, distribution rules, financial strategy
false
Regulatory and Compliance
Financial Services
Mixed Chart
UBS
Add to my slides
Remove from favorites
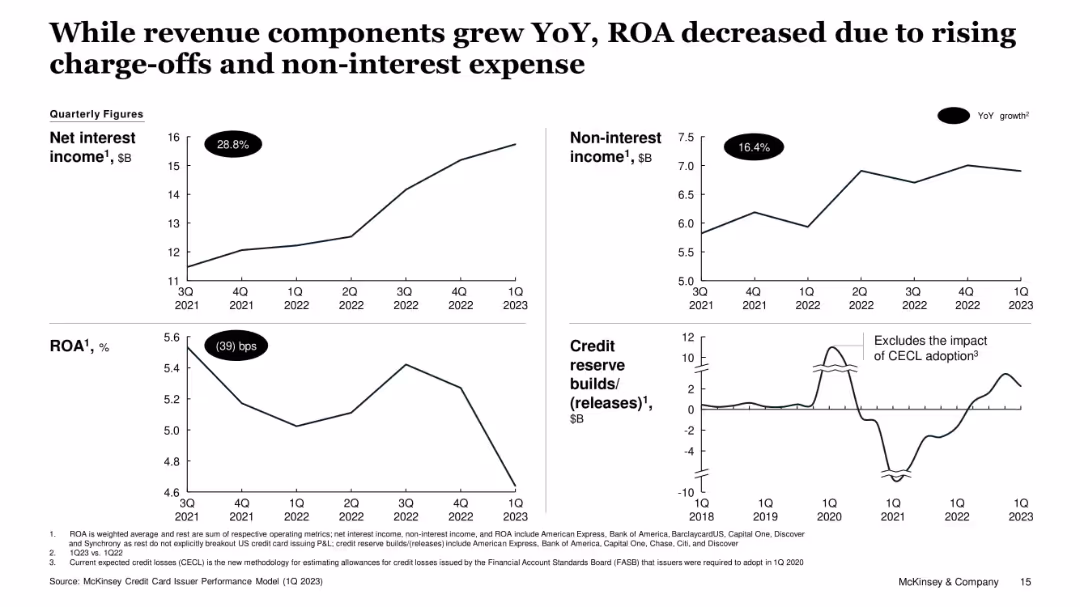
Four-panel layout with line graphs: net interest income, non-interest income, ROA, and credit reserve builds/releases. Includes YoY % or bps change in each panel.
Financial Performance
Financial Services
Despite increases in interest and non-interest income, ROA declined due to rising charge-offs and credit reserve adjustments. Visuals support that revenue growth was offset by risk-related impacts, particularly in 1Q23.
ROA, Credit Reserves, Net Interest, Non-Interest Income, Charge-offs, Financial Trends
false
Financial Performance
Financial Services
Single Chart
McKinsey
Add to my slides
Remove from favorites
The slide features a column chart comparing road freight costs to port across various regions, with contextual annotations on factors influencing costs.
Operational Efficiency
Transportation & Logistics
The slide provides a comparative analysis of road freight costs in Australia and international competitors, highlighting the efficiency and cost advantages of Australia's road freight network.
Road freight, Australia, cost comparison, transportation, logistics, modal share, efficiency, freight network, operational efficiency
false
Operational Efficiency
Transportation & Logistics
Mixed Chart
LEK
Add to my slides
Remove from favorites
The slide includes three sections comparing road transport, coastal shipping, and domestic port costs, with bullet points summarizing key findings for each.
Market Analysis and Trends
Transportation & Logistics
It compares the costs of road freight, coastal shipping, and port services in Australia, highlighting road freight as a supply chain priority.
Road freight, coastal shipping, port, costs, benchmarking, transport, supply chain, Australia, comparators
false
Market Analysis and Trends
Transportation & Logistics
Pillar
LEK
Add to my slides
Remove from favorites
This slide features a line chart comparing the cost of road freight per tonne-kilometre over various distances in Australia, the US, and France. Bullet points explain cost dynamics.
Market Analysis and Trends
Transportation & Logistics
It discusses the varying costs of road freight in Australia relative to the US and France, noting that Australia's costs are higher for short distances but become more competitive over longer distances.
road freight, cost, Australia, US, France, short haul, long haul
false
Market Analysis and Trends
Transportation & Logistics
Mixed Chart
LEK
Add to my slides
Remove from favorites
The slide shows a column chart comparing the cost of road freight in Australia, the US, and France, including factors like CO2 emissions, typical freight distances, and maximum HV capacity.
Market Analysis and Trends
Industrial & Manufacturing
It analyzes the higher cost of road freight in Australia compared to the US and France, citing various factors contributing to this disparity, including driver shortages and regulatory differences.
road freight, cost comparison, Australia, US, France, CO2 emissions
false
Market Analysis and Trends
Industrial & Manufacturing
Mixed Chart
LEK
Add to my slides
Remove from favorites
The slide presents a scatter plot and column chart showing the variation in Australian road freight costs with distance, with annotations highlighting key findings.
Market Analysis and Trends
Transportation & Logistics
The slide analyzes the variation in road freight costs across different distances and regions in Australia, noting that costs decrease with distance but are highest in South Australia and Victoria.
Road freight costs, Australia, distance, cost variation, transportation, logistics, scatter plot, market analysis, freight efficiency
false
Market Analysis and Trends
Transportation & Logistics
Multiple Chart
LEK
Add to my slides
Remove from favorites
The slide uses a timeline to show key phases from 2022 to 2025 onwards, with bullets detailing specific actions and goals for each phase.
Strategic Planning
Financial Services
Presents the strategic roadmap for transforming Credit Suisse, highlighting deleveraging, cost reduction, and growth initiatives to restore stakeholder trust.
roadmap, Credit Suisse, strategic planning, cost reduction, stakeholder trust
false
Strategic Planning
Financial Services
Linear Flow
Credit Suisse
Add to my slides
Remove from favorites
The slide displays a timeline roadmap with three phases: Immediate actions, 2023-24 transformation, and 2025 onwards goals.
Strategic Planning
Financial Services
The slide presents the execution roadmap for transforming and improving cost efficiency, leading to sustainable returns and core business growth by 2025.
roadmap, execution, transformation, goals, strategy
false
Strategic Planning
Financial Services
Linear Flow
Credit Suisse
Add to my slides
Remove from favorites
A roadmap slide detailing the pivot approach for growing, transforming, and scaling service businesses. The slide uses a horizontal timeline to map focus areas and activities across three phases: Grow the Core, Transform the Core, and Scale the New.
Strategic Planning
Professional Services
This slide outlines a strategic pivot roadmap for service businesses, mapping key focus areas and activities across different phases to achieve growth, transformation, and scaling.
roadmap, strategic planning, growth, transformation, scaling
false
Strategic Planning
Professional Services
Table
Accenture
Add to my slides
Remove from favorites
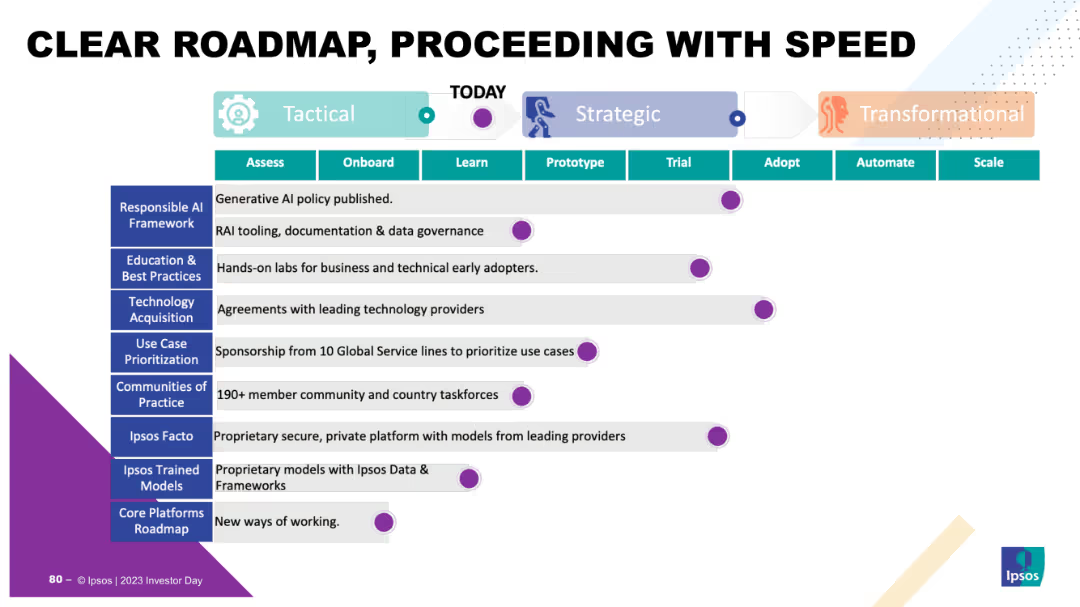
The slide displays a timeline divided into Tactical, Strategic, and Transformational phases, with milestones listed for each phase. It uses a horizontal timeline layout with colored segments and icons.
Strategic Planning
Technology & Software
The slide presents a clear roadmap for strategic initiatives, detailing phases from tactical to transformational steps, and highlights milestones such as AI policy, technology acquisition, and community practices.
Roadmap, strategy, tactical, strategic, transformational, milestones, AI, technology, acquisition, community
false
Strategic Planning
Technology & Software
Table
IPSOS
Add to my slides
Remove from favorites
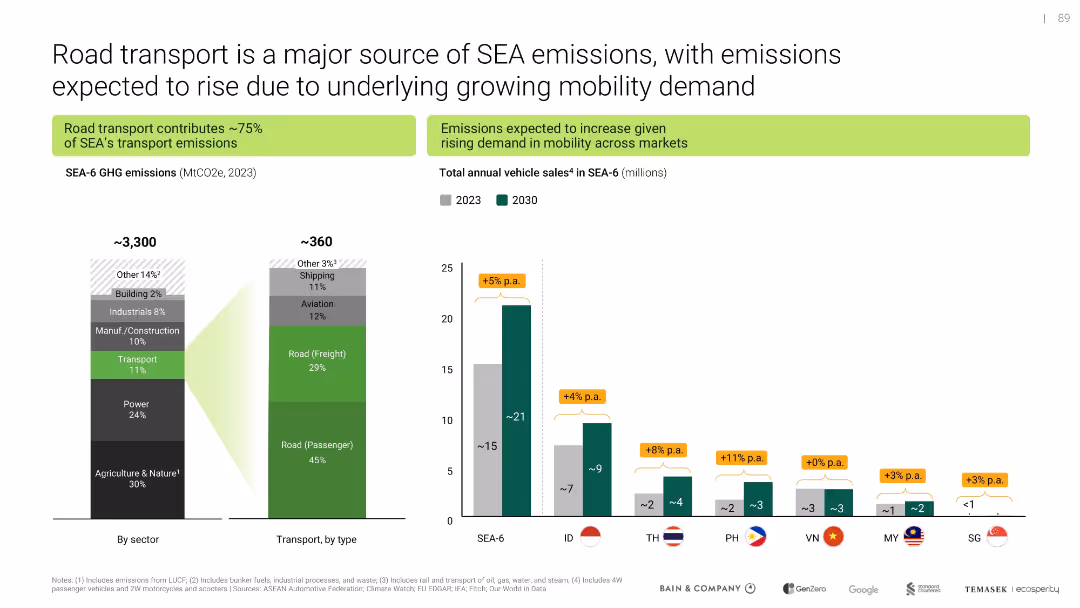
Uses bar graphs and segmented emissions charts; clean visual segmentation by region and vehicle type
Market Analysis and Trends
Transportation & Logistics
Demonstrates the contribution of road transport to SEA emissions, with projections of growing mobility demand and vehicle sales. Stresses need for cleaner transport solutions amid rising emissions.
road transport, emissions, vehicle sales, SEA-6, mobility demand, GHG
false
Market Analysis and Trends
Transportation & Logistics
Multiple Chart
Bain
Add to my slides
Remove from favorites
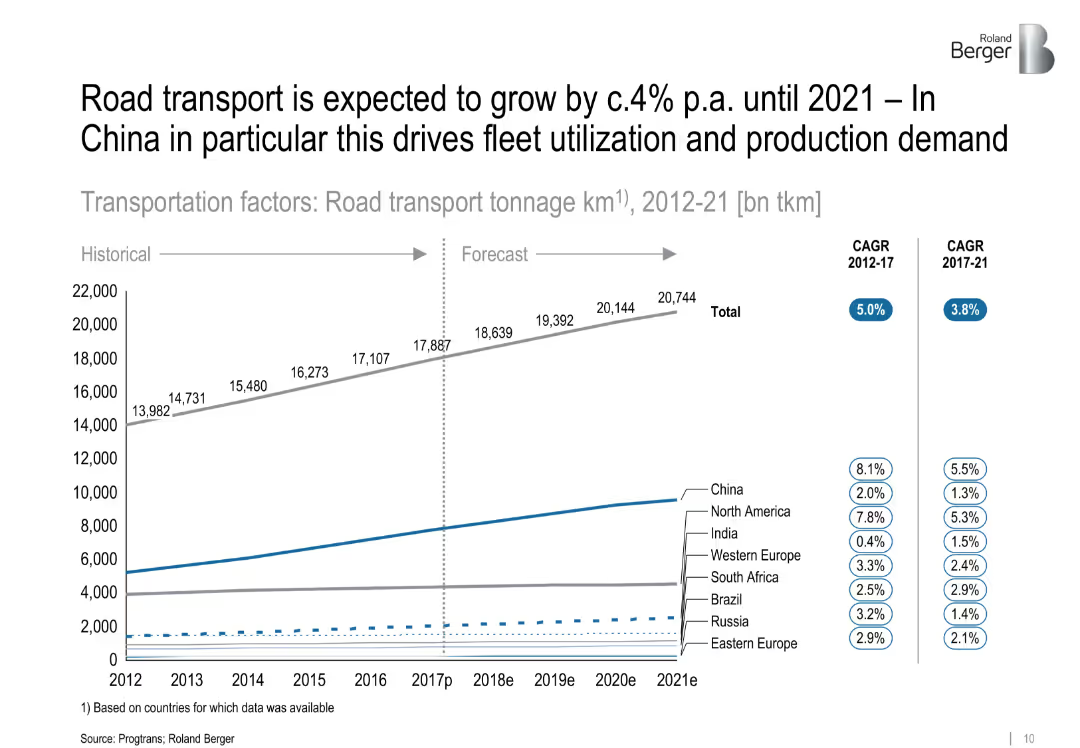
Line graph depicting road transport tonnage from 2012 to 2021 by region, with CAGR stats on the side. Clear separation between historical and forecast data.
Market Analysis and Trends
Transportation & Logistics
This slide analyzes road transport volume (in billion ton-km), indicating a steady global increase with China leading in growth. It links increased road transport to greater demand for fleets and vehicle production.
['road transport', 'fleet utilization', 'China', 'market growth', 'CAGR', 'logistics', 'forecast', 'tonnage']
false
Market Analysis and Trends
Transportation & Logistics
Single Chart
Roland Berger
Add to my slides
Remove from favorites
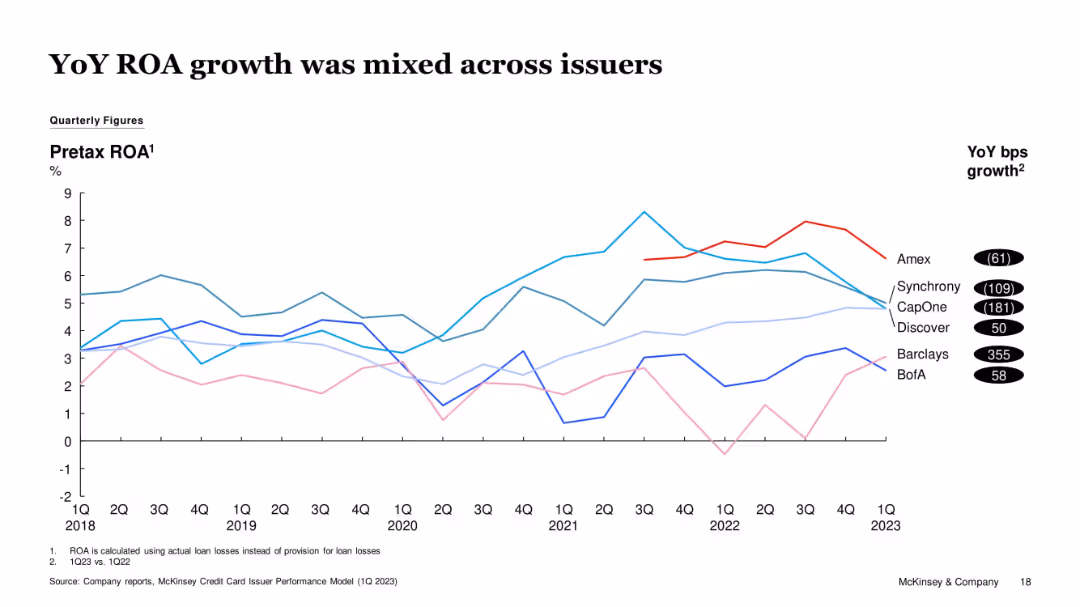
Line graph showing pretax ROA for several issuers over time. Barclays shows the strongest YoY gain, while CapOne, Synchrony, and Amex show declines.
Financial Performance
Financial Services
This slide analyzes changes in pre-tax ROA across major issuers. While some issuers like Barclays improved significantly, others like CapOne and Synchrony saw performance deterioration, indicating diverging profitability trends.
ROA, Issuer Profitability, CapOne, Barclays, Synchrony, Credit Card Industry
false
Financial Performance
Financial Services
Single Chart
McKinsey
Add to my slides
Remove from favorites
Contains a column chart tracking the growth of users on robo-advisory platforms with a future forecast, accompanied by explanatory text on the right side, and color-coded informational bullets.
Market Analysis and Trends
Financial Services
Focuses on the proliferation of digital investment platforms and the democratization of access to wealth management through robo-advisory services. It highlights the trend towards online engagement and the benefits of digital investment services across various user segments.
robo-advisory, digital investment, users growth, online platforms
false
Market Analysis and Trends
Financial Services
Mixed Chart
Bain
Add to my slides
Remove from favorites
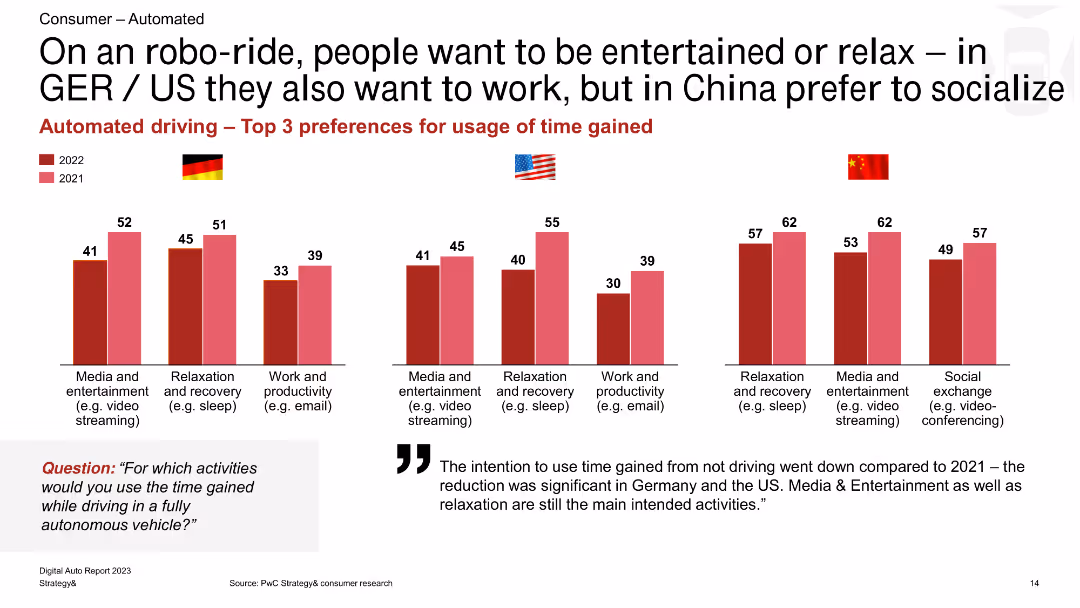
This slide includes a series of column charts showing the top three preferences for activities during autonomous rides in Germany, the US, and China for 2021 and 2022.
Market Analysis and Trends
Transportation & Logistics
The slide highlights differences in preferred activities during autonomous rides, with entertainment and relaxation favored in Germany and the US, and social exchange preferred in China.
robo-ride, preferences, entertainment, relaxation, work, socialization, Germany, US, China, autonomous vehicles
false
Market Analysis and Trends
Transportation & Logistics
Multiple Chart
PwC/Strategy&
Add to my slides
Remove from favorites
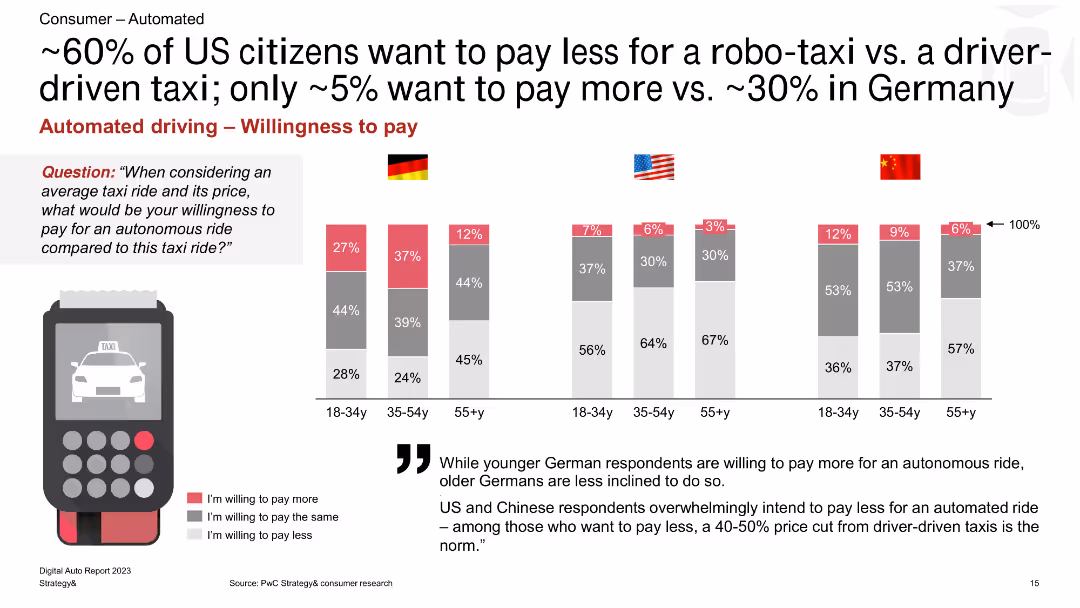
The slide shows a column chart depicting willingness to pay for autonomous vs. driver-driven taxis among different age groups in Germany, the US, and China, with percentage bars for each category.
Market Analysis and Trends
Transportation & Logistics
The slide compares the willingness to pay for autonomous taxis versus driver-driven taxis, revealing that a significant portion of US respondents prefer lower costs for autonomous rides compared to Germany.
robo-taxi, willingness to pay, driver-driven taxi, Germany, US, China, autonomous rides, pricing, consumer preferences
false
Market Analysis and Trends
Transportation & Logistics
Multiple Chart
PwC/Strategy&
Add to my slides
Remove from favorites
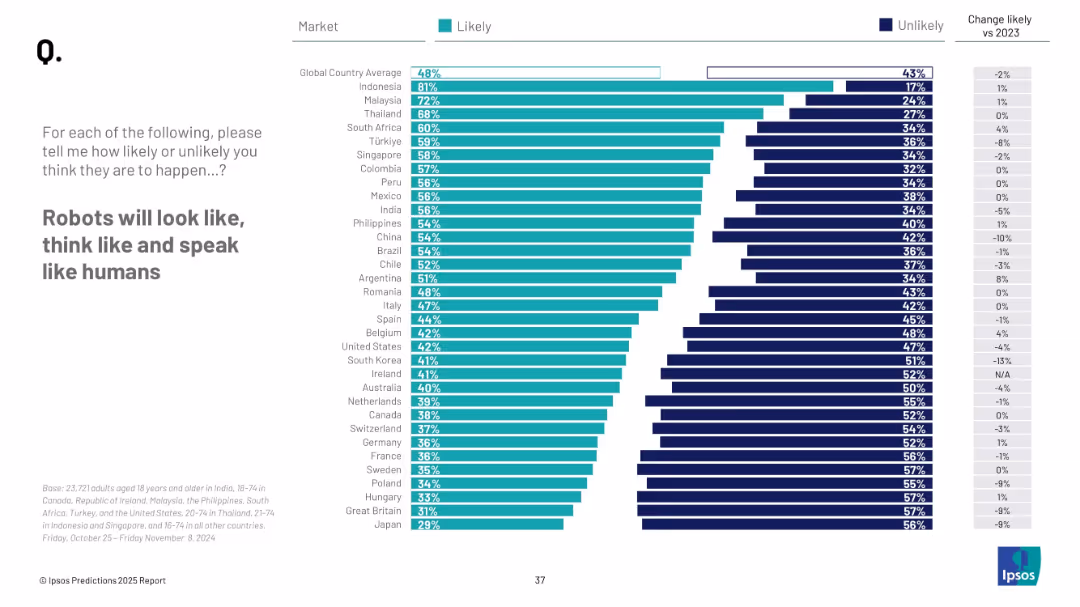
Horizontal bar chart with “likely” and “unlikely” sentiments by country. Standard format consistent with prior technology-related slides.
Strategic Planning
Artificial Intelligence
This chart captures public belief in the emergence of humanoid robots by 2025. Indonesia shows the highest level of belief, while Japan and Western countries are more skeptical. The chart reflects societal expectations about the evolution of robotics.
robotics, AI, humanoid robots, future tech, public perception
false
Strategic Planning
Artificial Intelligence
Mixed Chart
IPSOS
Add to my slides
Remove from favorites
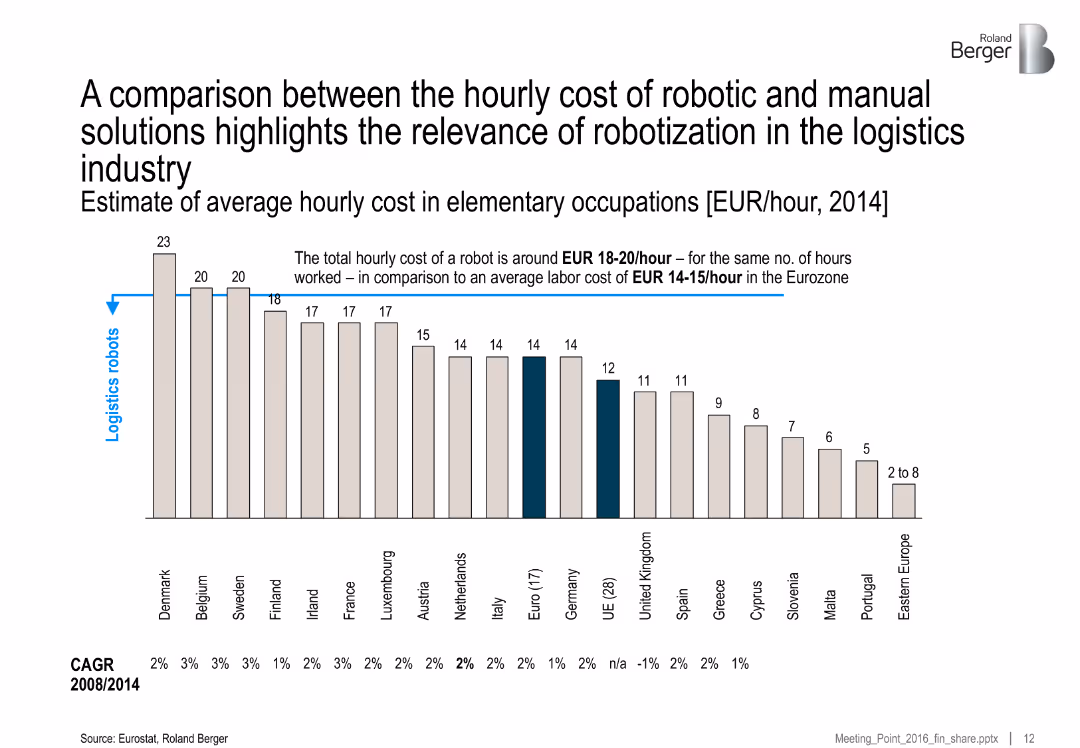
Bar chart comparing hourly costs across countries; robots vs. manual labor; countries ordered by cost; brief notes on average costs and CAGR
Operational Efficiency
Industrial & Manufacturing
This slide compares the cost of robotics vs. labor across Europe, showing that robots (EUR 18–20/hour) can compete with or outperform human labor in cost terms. Eastern and Southern Europe have the lowest manual labor costs.
robotics, labor cost, automation, logistics, cost comparison, Europe, manufacturing, efficiency
false
Operational Efficiency
Industrial & Manufacturing
Single Chart
Roland Berger
Add to my slides
Remove from favorites
The slide contains a picture of a robot in a store setting and text describing retail robotics. Below the text are trend assessment bars labeled "Watch" with impact on industry and time of mainstream adoption.
Technology and Digital Transformation
Retail & E-commerce
Explains the role of robotics in automating store operations, refilling shelves, and managing inventory, projecting that such technologies will be realized by 2040. It discusses the expected benefits and potential applications in improving retail and food service industries' workflows.
Robotics, Retail, Automation, AI, Technology
false
Technology and Digital Transformation
Retail & E-commerce
Mixed Chart
Deloitte
Add to my slides
Remove from favorites
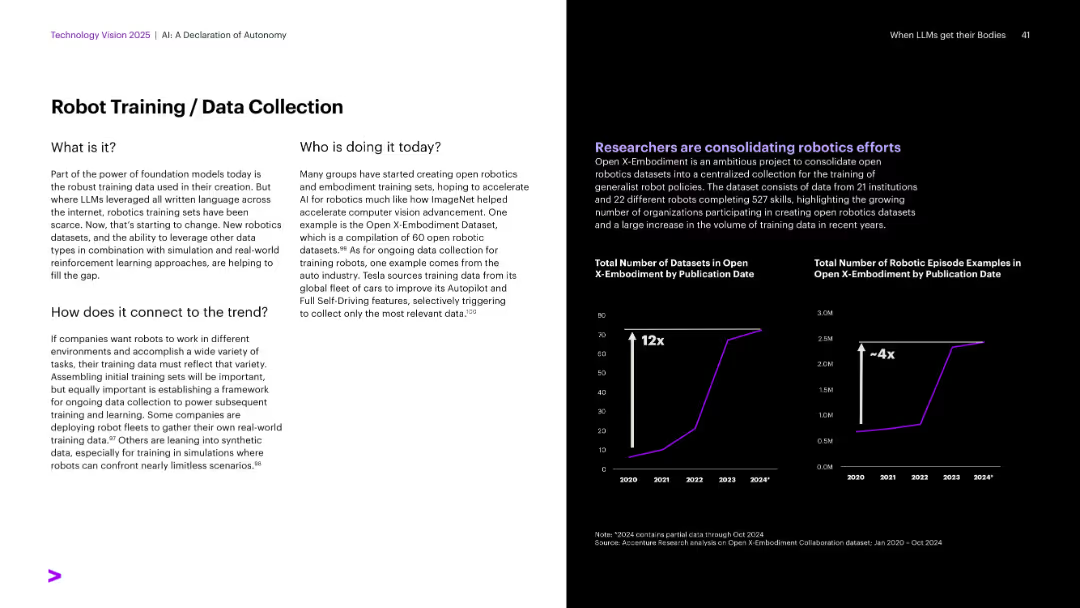
Layout similar to others: text left, black background right with dual line charts (datasets and examples growth).
Operational Efficiency
Artificial Intelligence
The slide discusses the importance of robust training datasets for foundation models in robotics. It features Open X-Embodiment, a dataset consolidating robotic data. Growth in dataset volume and episode examples is visualized, showing major recent scaling of data collection and robotics research efforts.
Robotics training, datasets, Open X-Embodiment, simulation, Tesla
false
Operational Efficiency
Artificial Intelligence
Multiple Chart
Accenture
Add to my slides
Remove from favorites
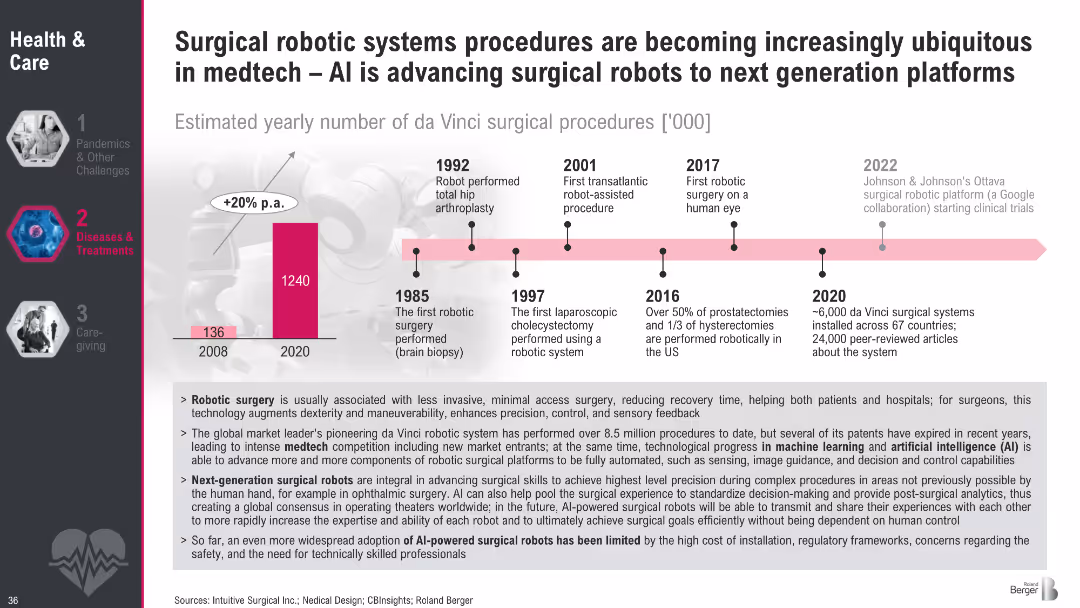
Timeline-based design with key milestones from 1985 to 2022 and a vertical bar chart comparing robotic surgeries in 2008 vs. 2020. Bottom section uses bullet points for explanations.
Technology and Digital Transformation
Healthcare & Pharmaceuticals
The slide details the evolution and impact of robotic surgery, particularly via the da Vinci system, and highlights how AI is transforming medtech. It emphasizes benefits such as precision, reduced recovery time, and ongoing innovation. Key milestones and usage stats underline the fast-growing adoption of surgical robotics.
robotic surgery, AI, medtech, da Vinci, medical devices, surgical robotics, healthcare technology, innovation timeline
false
Technology and Digital Transformation
Healthcare & Pharmaceuticals
Mixed Chart
Roland Berger
Add to my slides
Remove from favorites
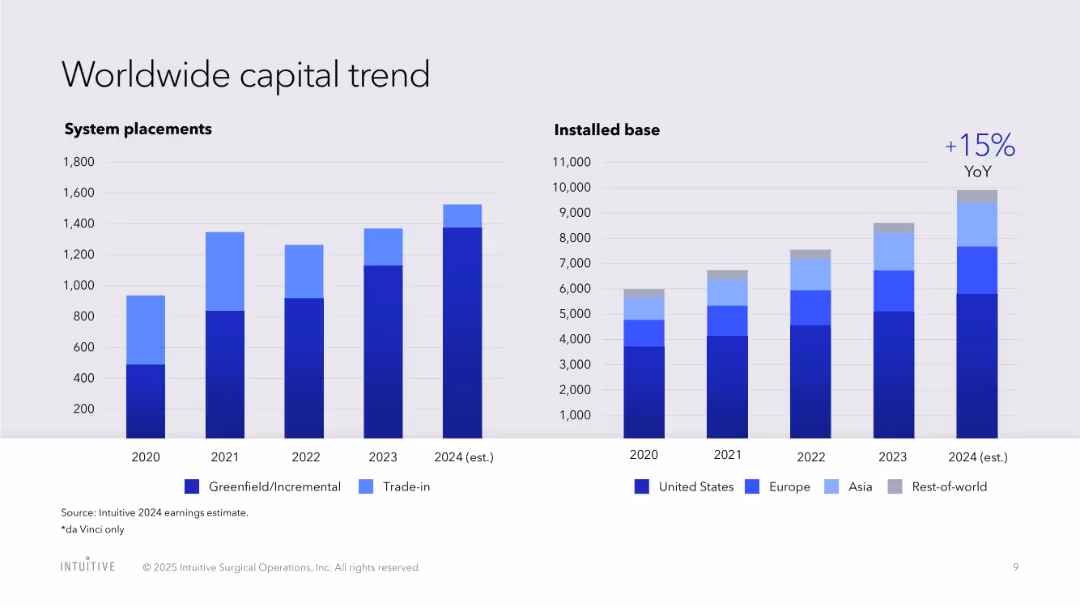
Two grouped bar charts: one for system placements (incremental vs. trade-in), one for installed base by region
Strategic Planning
Healthcare & Pharmaceuticals
Highlights global trends in robotic system placements and installed base by geography, with estimated figures for 2024 and YoY growth rate noted.
robotic surgery, placements, installed base, trade-in, capital expenditure, geographic trends, strategic growth
false
Strategic Planning
Healthcare & Pharmaceuticals
Multiple Chart
JP Morgan
Add to my slides
Remove from favorites
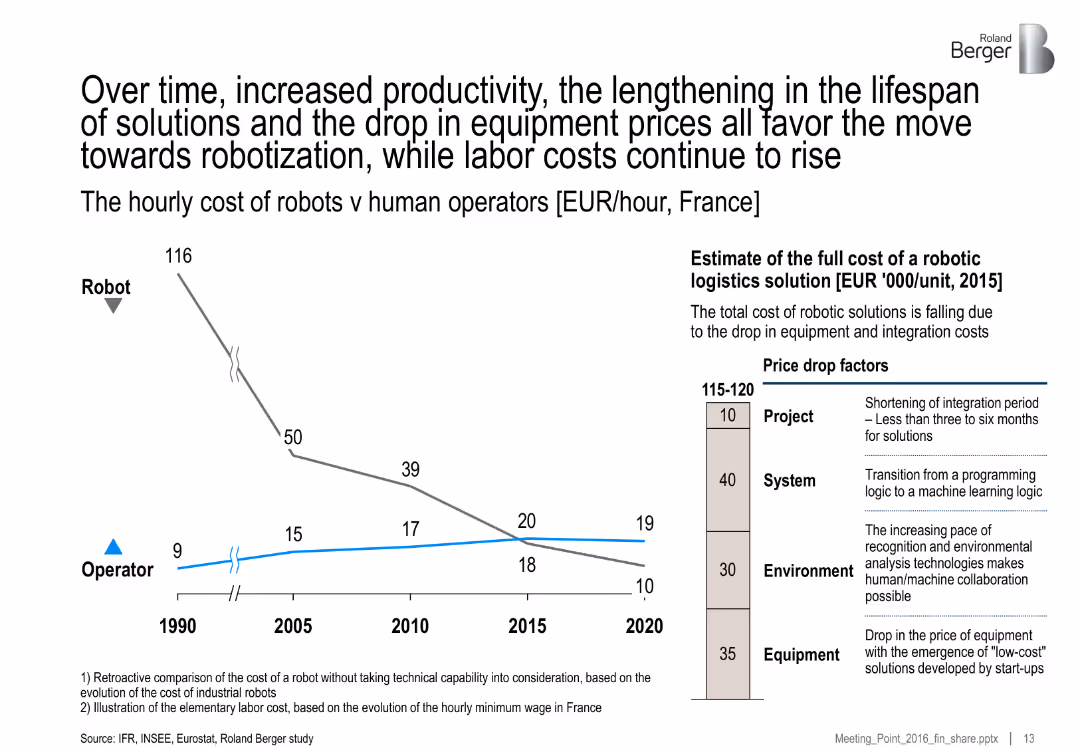
Dual-pane layout with left line graph comparing hourly costs over time and right-hand cost breakdown and contributing factors in a vertical bar. Clean, corporate design with icons and annotations.
Technology and Digital Transformation
Industrial & Manufacturing
The slide illustrates the declining hourly cost of robots compared to rising human labor costs in France from 1990 to 2020, making robotization increasingly economically favorable. It includes a breakdown of cost reduction factors in robotic logistics solutions, such as system improvements and equipment price drops.
robotization, labor cost, automation, logistics, France, industrial robots, system integration, machine learning, cost comparison
false
Technology and Digital Transformation
Industrial & Manufacturing
Multiple Chart
Roland Berger
Add to my slides
Remove from favorites
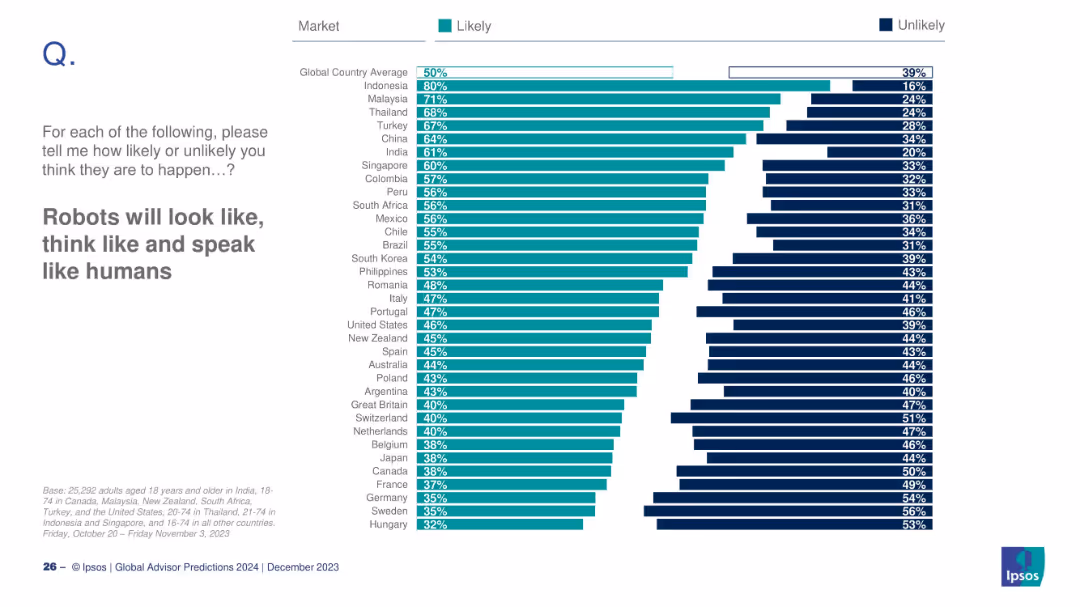
Bar chart ordered by belief in humanoid robots
Technology and Digital Transformation
Artificial Intelligence
The slide explores belief levels across countries about robots becoming more humanlike in appearance and behavior. It shows how this belief varies by market, with a global average and specific country ratings.
robots, AI, humanlike machines, belief, global sentiment
false
Technology and Digital Transformation
Artificial Intelligence
Mixed Chart
IPSOS
Add to my slides
Remove from favorites
Column chart showing the projected impact of robot deployment on GDP for China, US, EU, Japan, and South Korea under low, base, and high scenarios for 2030.
Technology and Digital Transformation
Technology & Software
The slide projects the economic impact of increased robot deployment on GDP for several regions under different scenarios. It discusses the potential gains from the "robot dividend" and how higher robot stock levels could lead to significant economic growth by 2030.
Robots, GDP, Economic Impact, 2030
false
Technology and Digital Transformation
Technology & Software
Mixed Chart
Roland Berger
Add to my slides
Remove from favorites
The slide features a vertical column chart illustrating the progress towards a 15% return on CET1 capital by 2026.
Financial Performance
Financial Services
This slide describes the target of achieving a 15% RoCET1, outlining steps and expected financial outcomes.
RoCET1, CET1 capital, financial targets, cost savings, capital returns
false
Financial Performance
Financial Services
Mixed Chart
UBS
Add to my slides
Remove from favorites
The slide features line charts and tables displaying RoCET1, cost/income ratio trends, and key financial figures. It uses a mix of graphical and textual data presentation.
Financial Performance
Financial Services
It reviews the company's performance in terms of RoCET1 and cost/income ratios, showing progress toward meeting full-year targets and key financial metrics.
RoCET1, cost/income ratio, financial performance, targets, metrics
false
Financial Performance
Financial Services
Multiple Chart
UBS
Add to my slides
Remove from favorites
The slide has a column chart with multiple stages indicated for different financial factors affecting RoCET1, alongside key levers for achieving the target.
Financial Performance
Financial Services
This slide outlines the steps and key financial levers required to achieve a 15% return on common equity tier 1 capital by 2026, detailing cost efficiencies and optimizations.
RoCET1, financial levers, cost efficiencies, optimization
false
Financial Performance
Financial Services
Mixed Chart
UBS
Add to my slides
Remove from favorites
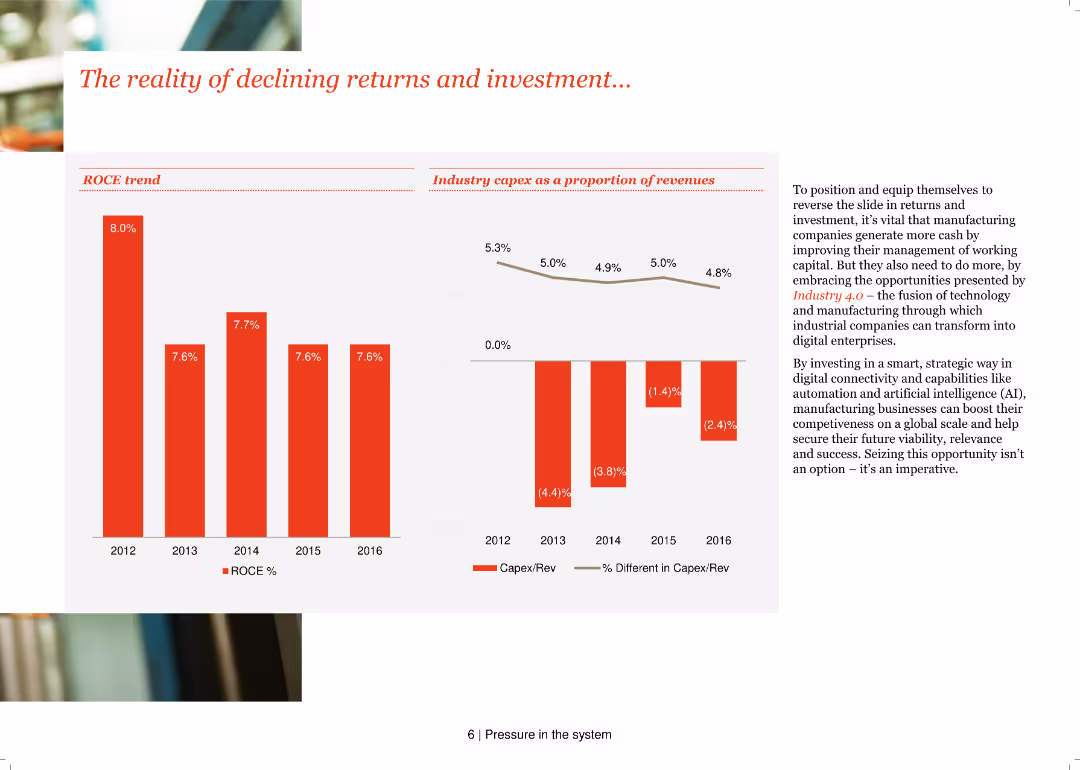
This slide features two column charts: one showing ROCE trends from 2012-2016 and another showing industry capex as a proportion of revenues. Text discusses the importance of managing working capital and investing in Industry 4.0.
Financial Performance
Industrial & Manufacturing
It addresses the decline in returns and investment in the manufacturing sector, emphasizing the need for better working capital management and investment in Industry 4.0 to improve competitiveness and future viability.
ROCE trends, capex, industry 4.0, manufacturing, investment, financial performance, column charts, working capital, returns
false
Financial Performance
Industrial & Manufacturing
Multiple Chart
PwC/Strategy&
Add to my slides
Remove from favorites
Slide with bar charts showing the expected and achieved Returns on Digital Investment (RODI) by automotive companies, compared to cross-industry performance.
Financial Performance
Transportation & Logistics
Discusses the financial returns on digital investments by automotive companies, highlighting how champions outperform contenders and cadets in achieving higher than expected RODI.
RODI, financial performance, automotive, investment returns, digital transformation
false
Financial Performance
Transportation & Logistics
Multiple Chart
Accenture
Add to my slides
Remove from favorites
Contains a column chart comparing GBM ROE percentages over time against peer averages, with dark background and dotted lines for comparison.
Financial Performance
Financial Services
This slide analyzes the return profile of Global Banking & Markets, comparing ROE against peers and noting key drivers of increased returns.
ROE, banking, performance, comparison, drivers
false
Financial Performance
Financial Services
Mixed Chart
Goldman Sachs
Add to my slides
Remove from favorites
Includes line and column charts tracking the ROE and capital across various business divisions from 2017 to 2021.
Financial Performance
Financial Services
This slide provides a comprehensive overview of JP Morgan's business performance over several years, focusing on returns above the firm-wide cost of capital. It shows improvements in ROE and capital allocations across their banking divisions, reflecting strategic financial management.
ROE, capital, business, performance
false
Financial Performance
Financial Services
Multiple Chart
JP Morgan
Add to my slides
Remove from favorites
The slide displays a column chart comparing adjusted ROE from 2019 to the outlook in 2021, with annotations for various business drivers. A dark blue and green color scheme is used to differentiate between historical data and outlook projections.
Financial Performance
Financial Services
This slide focuses on JPMorgan Chase's return on equity (ROE) outlook, showing an adjusted ROE comparison and the impact of different business factors. It is useful for financial analysts and investors to assess the company's financial performance and capital allocation strategies while considering market growth and potential risks.
ROE, Capital, Growth, Market Share, Investment, Expense, Valuation, Tax, Credit Costs, Outlook
false
Financial Performance
Financial Services
Single Chart
JP Morgan
Add to my slides
Remove from favorites
Contains a column chart showing the Return on Equity (ROE) in 2017 and 2018 with contributing factors like revenue, rates, and expenses indicated by arrows and percentages along the bars.
Financial Performance
Financial Services
This slide is meant for financial professionals, focusing on the factors contributing to the increase in Return on Equity (ROE) from 2017 to 2018, which is crucial for assessing company performance and making investment decisions.
ROE, financial analysis, 2017, 2018, revenue, rates, expenses, investment decision
false
Financial Performance
Financial Services
Single Chart
JP Morgan
Add to my slides
Remove from favorites
This slide features a medium-term target ROE walk for 2018 with blue column charts displaying the initial value and the end value, and floating bars representing the contributing factors. There's a legend and annotations for clarity. The layout is straightforward with a clear focus on the central graph.
Financial Performance
Financial Services
The slide presents Return on Equity (ROE) changes from 2018 actuals to medium-term targets, highlighting the impacts of net growth, higher capital, and other factors. The data suggests the company's financial strategy and projections, valuable in financial analysis or investor presentations.
ROE, financial analysis, projections, capital, growth, medium-term, actuals, impact, strategy
false
Financial Performance
Financial Services
Single Chart
JP Morgan
Add to my slides
Remove from favorites
This column chart has a blue color scheme with contrasting green and red markers indicating increases and decreases in ROE from 2018 to 2019. Two large vertical columns represent ROE percentages for each year, with smaller markers above and below the main columns represent contributing factors to the ROE change.
Financial Performance
Financial Services
The slide is titled "ROE decreased from 15.9% in 2018 to 14.0% in 2019, primarily driven by capital." It visualizes ROE change and contributing factors such as revenue, rates, expenses, and credit costs. Each factor's impact is quantified with percentages.
ROE, financial, capital, revenue, rates, expenses, credit cost, decrease, JPMorgan Chase & Co.
false
Financial Performance
Financial Services
Single Chart
JP Morgan
Add to my slides
Remove from favorites
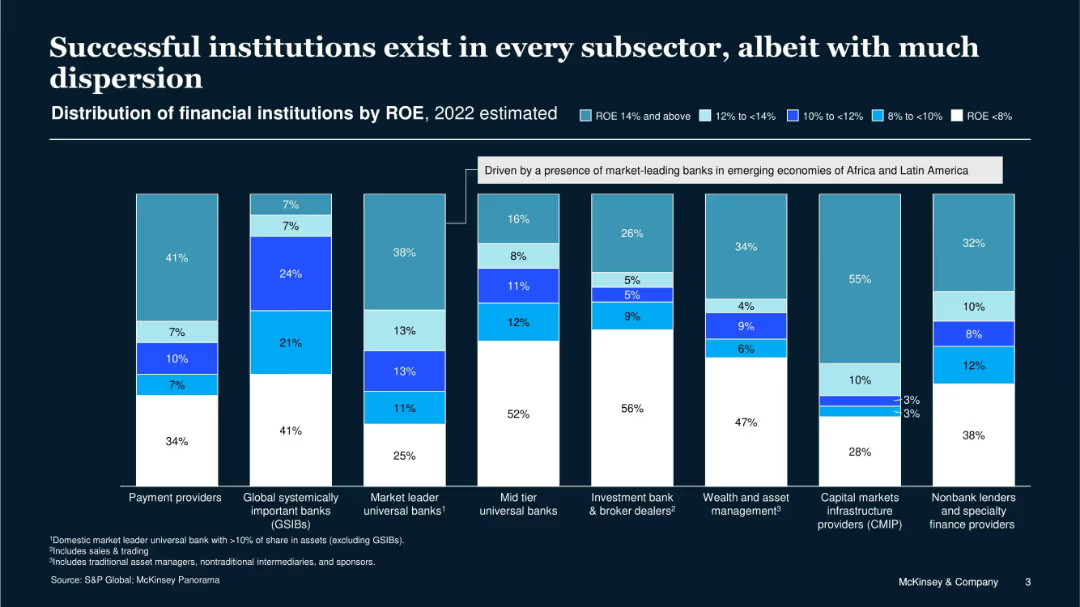
Vertical stacked bar charts showing ROE distribution across financial institution types in 2022; color-coded by ROE range.
Performance Metrics and KPIs
Financial Services
The slide shows ROE variation across financial subsectors, indicating that success is achievable in all categories despite wide dispersion. Certain segments like payment providers and nonbank lenders show high profitability, emphasizing the importance of strategic positioning.
ROE, financial institutions, profitability, dispersion, KPIs, subsectors, 2022, success
false
Performance Metrics and KPIs
Financial Services
Single Chart
McKinsey
Add to my slides
Remove from favorites
Previous
Next
You don't have any favorites yet.
Please wait loading your favorites slides...
Create a FREE account to continue browsing
Receive Instant Access to 1,000+ slides from companies like McKinsey, Google, and Goldman Sachs
First Name
Last Name
Email
Password
I agree to all
Terms & Privacy Policy
Thank you! Your submission has been received!
Oops! Something went wrong while submitting the form.
Have an account?
Sign in
Upgrade to PRO to Save slides
Advanced Search and Filters
Access to 15,000+ slides
Access to Category Pages
Save/Bookmark Slides
PowerPoint Template Library
Pick a Plan
MONTHLY
$12/month
Billed every month, Cancel anytime.
YEARLY
$9/year
Billed $108 annually, Cancel anytime.
Checkout for $12/month
Checkout for $108/yr
Secured by Stripe | AES-256 bit encryption