My Account
My Slides
Search by Category
Pricing
Templates
View All Templates
Download Template Slides
✦ AI Search
Feedback
Login
Logout
Get Started
Browse all Slides
Browse all Slides
Create a FREE Account
Instant access to 1,000+ real slides from top companies like McKinsey, BCG, Goldman Sachs, Google and many more!
First Name
Last Name
Email
Password
I agree to all
Terms & Privacy Policy
Thank you! Your submission has been received!
Oops! Something went wrong while submitting the form.
Have an account?
Sign in
Saved Slides
Total No. of slides saved
0
↻ Refresh
✖ Clear all
This slide features a column chart illustrating the development of ROE (Return on Equity) from 2019 to projected 2023E. The chart is complemented by bullet points summarizing factors affecting the ROE, such as operational efficiency, market activity, and policy rates. The design utilizes contrasting colors to differentiate between past performance and future estimates.
Financial Performance
Financial Services
Reviews the bank's financial performance focusing on ROE with historical data and future estimates. Highlights the influence of various business activities and market conditions on financial outcomes, projecting a positive trajectory in ROE due to operational and market strategies, as well as capital optimization initiatives in the banking sector.
ROE, financial performance, banking, market conditions, projections
false
Financial Performance
Financial Services
Mixed Chart
Deutsche Bank
Add to my slides
Remove from favorites
This slide displays a column chart illustrating changes in Return on Equity (ROE) from actual 2019 figures to medium-term targets, with annotations for each change.
Financial Performance
Financial Services
It is aimed at depicting the Return on Equity (ROE) walk from actual figures in 2019 to medium-term targets. The chart provides a visual representation of financial forecasting and performance objectives.
ROE, financial, targets, performance, equity, forecasting, medium-term
false
Financial Performance
Financial Services
Single Chart
JP Morgan
Add to my slides
Remove from favorites
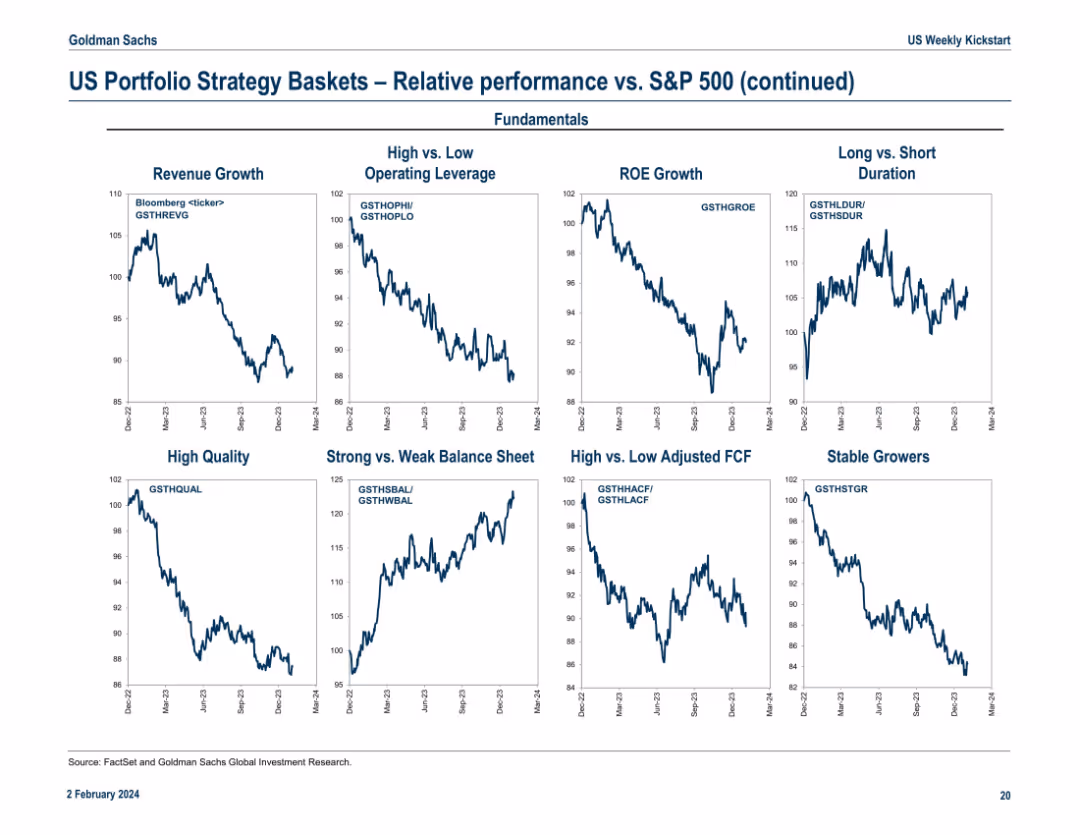
Continuation of the previous slide, featuring strategy baskets by fundamentals (e.g., ROE Growth, High Quality) and balance sheet quality. Layout mirrors Slide 17978 with 9 line charts labeled with Bloomberg tickers.
Investment Analysis
Financial Services
This slide adds depth by comparing strategy baskets on fundamentals such as ROE Growth, Balance Sheet Strength, and Operating Leverage. It helps identify which quality or growth factors outperform in current market conditions. For instance, baskets like Strong Balance Sheet show upward trends, suggesting investor preference for financially sound companies.
ROE growth, fundamentals, balance sheet, stable growers, operating leverage, FCF, S&P 500 comparison, quality investing
false
Investment Analysis
Financial Services
Multiple Chart
Goldman Sachs
Add to my slides
Remove from favorites
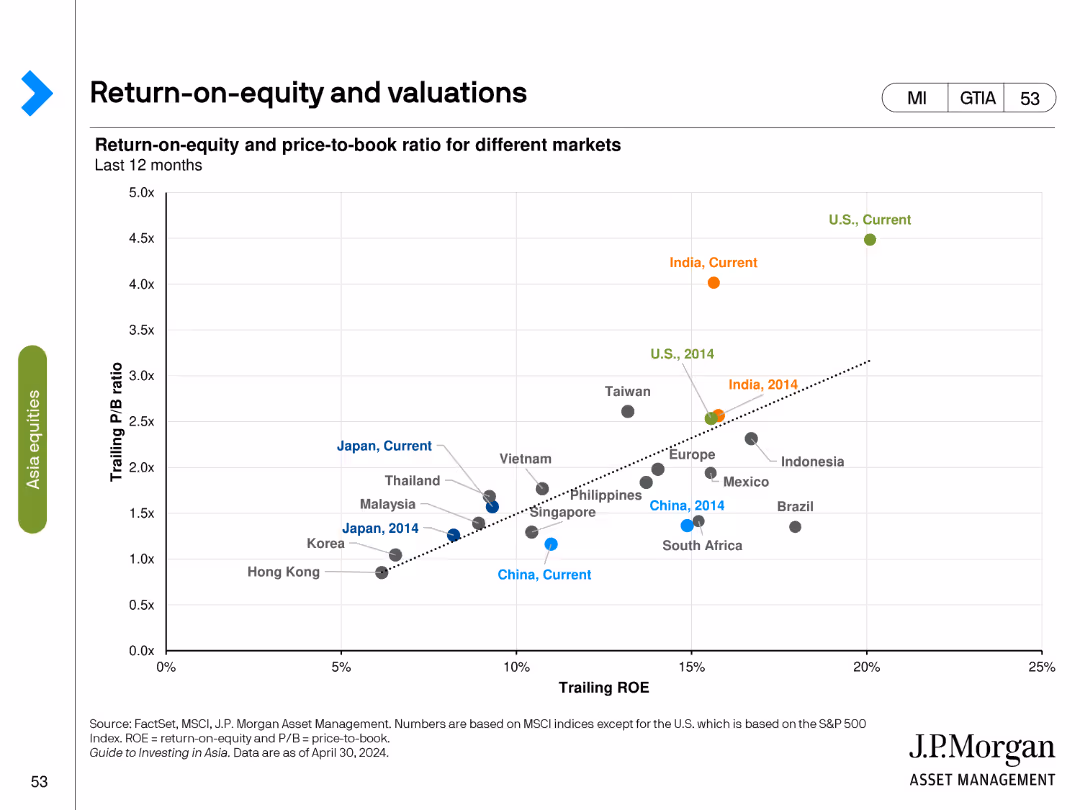
Scatter plot showing return-on-equity (ROE) and price-to-book (P/B) ratios for different markets over the last 12 months.
Investment Analysis
Financial Services
Examines ROE and P/B ratios to assess market valuations, comparing current data with historical benchmarks to evaluate market performance.
ROE, P/B ratio, scatter plot, market valuation, financial metrics, investment analysis, historical comparison, global markets
false
Investment Analysis
Financial Services
Single Chart
JP Morgan
Add to my slides
Remove from favorites
The slide presents a comparative bar/column chart, showing Goldman Sachs' ROE and book value per share growth against a leading peer, using a color contrast of blue and orange for differentiation. The layout is clean and emphasizes the data comparisons.
Market Analysis and Trends
Financial Services
This slide compares the return on equity and book value per share growth between Goldman Sachs and its competitors, showcasing a client-oriented strategy that led to record revenues. It is used to highlight competitive advantages and financial growth over time.
ROE, revenue, book value, growth, Goldman Sachs, comparison, market analysis
false
Market Analysis and Trends
Financial Services
Mixed Chart
Goldman Sachs
Add to my slides
Remove from favorites
This slide presents a cohesive visual narrative with three line charts depicting the revenue, pretax income, and client assets trends, complemented by key financial statistics like ROE, loans, and deposits.
Financial Performance
Financial Services
It details JPMorgan’s growth, focusing on revenue and ROE consistency over a five-year period, backed by a solid increase in client assets, underscoring a reliable financial trajectory.
ROE, revenue growth, client assets, financial consistency, pretax income, loans, deposits
false
Financial Performance
Financial Services
Multiple Chart
JP Morgan
Add to my slides
Remove from favorites
This slide uses a dark theme with three column charts displaying progress against targets from 2020 to 2022 for metrics like ROE, ROTE, and efficiency ratio. The charts are aligned in a row with descriptive annotations and percentage values. There's a contrasting color for the 2020 bar in each chart to highlight the impact of litigation.
Financial Performance
Financial Services
The slide provides a clear comparison of financial performance against past targets and current achievements, with a specific focus on ROE, ROTE, and efficiency ratio, relevant for stakeholders to assess the firm's financial health and operational efficiency.
ROE, ROTE, efficiency ratio, progress, targets
false
Financial Performance
Financial Services
Multiple Chart
Goldman Sachs
Add to my slides
Remove from favorites
A blue column chart shows the 2019 ROE, followed by incremental changes leading to future ROTE, with blocks indicating contributing factors.
Strategic Planning
Financial Services
This slide plots a strategy for increasing returns, breaking down the contributions of different efficiency and optimization initiatives to ROTE.
ROE, ROTE, returns, litigation, expense efficiencies, funding optimization, client initiatives, financial strategy
false
Strategic Planning
Financial Services
Single Chart
Goldman Sachs
Add to my slides
Remove from favorites
Features a dark backdrop with flow charts and boxes outlining ROE simulation for 2022, including past averages and target ranges, as well as selective levers that impact ROE.
Investment Analysis
Financial Services
This slide is used to simulate return on equity (ROE) for the year 2022, showing past performance and future targets, and discussing various financial levers.
ROE, Simulation, Management, Growth, Solutions, Efficiency, Financial, Investment
false
Investment Analysis
Financial Services
Mixed Chart
Goldman Sachs
Add to my slides
Remove from favorites
The slide contains a column chart showing a path to a ROE target with annotations, using a simple and effective design with a monochromatic color scheme for emphasis on growth levers.
Strategic Planning
Financial Services
The slide outlines strategic growth initiatives for achieving mid-teens return on equity (ROE) targets. It showcases the progression of initiatives in transaction banking, wealth management, consumer services, and alternatives, likely meant for discussing long-term financial growth and investment strategies.
ROE target, Growth initiatives, Transaction banking, Wealth management, Investment strategies
false
Strategic Planning
Financial Services
Single Chart
Goldman Sachs
Add to my slides
Remove from favorites
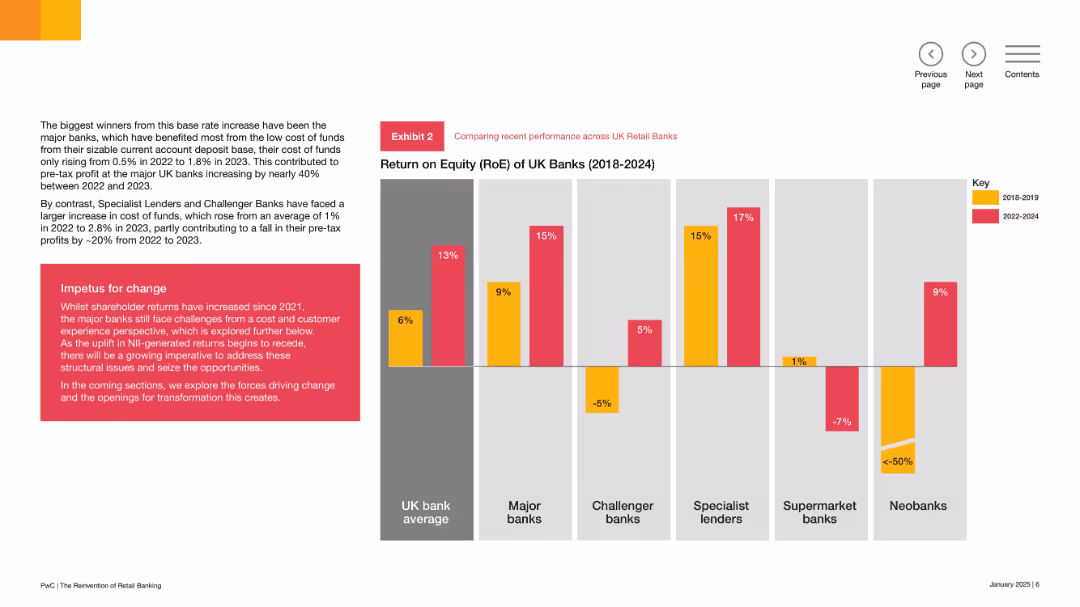
Vertical bar chart comparing RoE across bank types and periods; left panel has explanatory narrative; red-yellow color code indicates performance by time range.
Performance Metrics and KPIs
Financial Services
The slide compares RoE across various UK bank types, showing that major and specialist lenders improved returns since 2022, while challenger and supermarket banks faced declining profitability. It highlights structural differences in cost of funds and customer models.
RoE, UK banks, profitability, major banks, challenger banks, structural challenges, performance comparison, 2018–2024
false
Performance Metrics and KPIs
Financial Services
Mixed Chart
PwC/Strategy&
Add to my slides
Remove from favorites
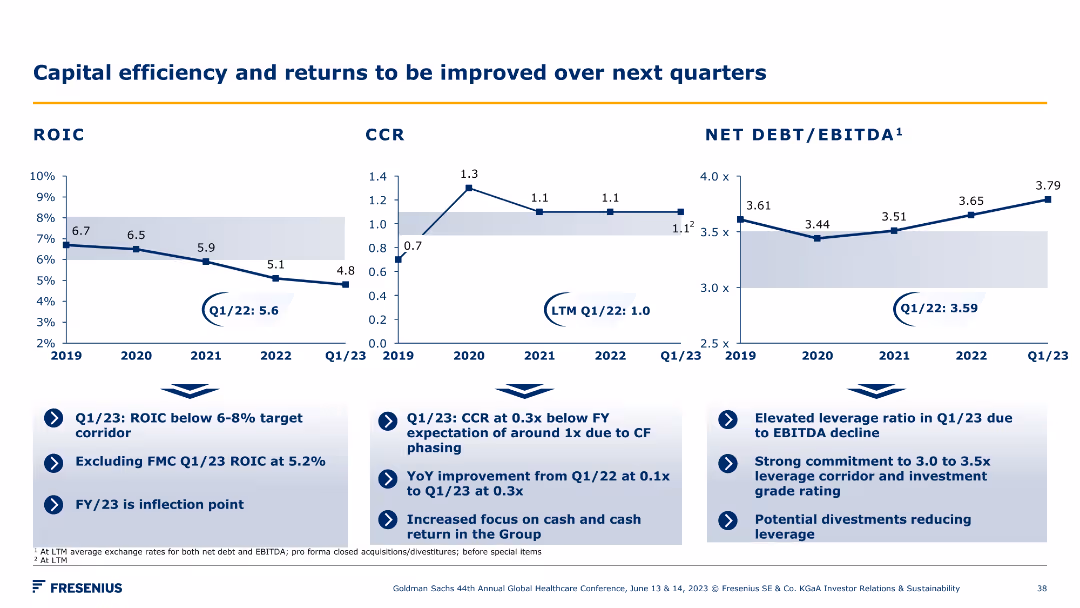
A series of line charts showing ROIC, CCR, and Net Debt/EBITDA trends over several years. Accompanied by bullet points summarizing key insights and improvement strategies.
Financial Performance
Financial Services
The slide presents trends in capital efficiency metrics like ROIC and CCR, and outlines strategies to improve returns and leverage over the next quarters.
ROIC, CCR, Net Debt, EBITDA, efficiency, returns
false
Financial Performance
Financial Services
Multiple Chart
Goldman Sachs
Add to my slides
Remove from favorites
Features a column chart with a blue bar highlighting the company's ROIC compared to peers, indicated by a dotted line for average.
Investment Analysis
Consumer Goods
Analyzes return on invested capital (ROIC) showcasing superior performance compared to peers, crucial for assessing investment potential.
ROIC, investment, peer comparison, performance, capital
false
Investment Analysis
Consumer Goods
Single Chart
Barclays
Add to my slides
Remove from favorites
The slide uses a column chart to display confidence in measuring ROI across different paid channels. The layout is moderately dense, with a mix of text and visual elements.
Market Analysis and Trends
Professional Services
This slide discusses the importance of holistic cross-platform measurement for ROI and highlights marketers' confidence levels in measuring ROI across various channels, with social media leading at 64%.
ROI, cross-platform, social media, confidence, measurement
false
Market Analysis and Trends
Professional Services
Mixed Chart
Nielsen
Add to my slides
Remove from favorites
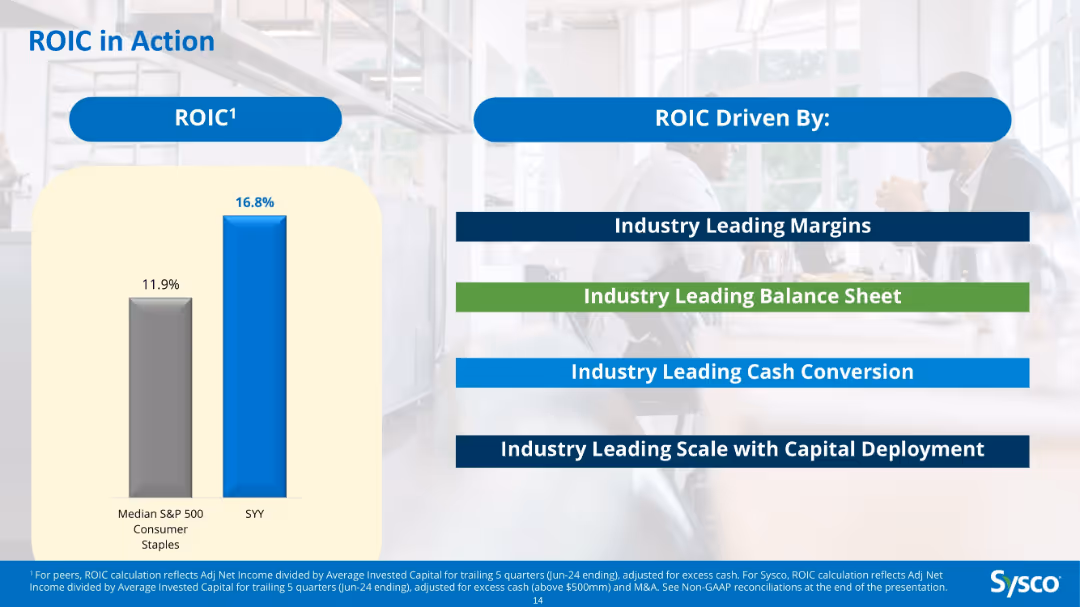
Bar chart comparing ROIC of Sysco vs S&P 500 median; text boxes listing drivers like margins, balance sheet, and capital deployment.
Investment Analysis
Consumer Goods
Demonstrates Sysco’s superior 16.8% ROIC compared to the 11.9% median for S&P 500 consumer staples. The slide attributes this to leadership in margins, balance sheet strength, cash conversion, and capital scale.
ROIC, Sysco, capital efficiency, investment, consumer staples, return metrics, comparison
false
Investment Analysis
Consumer Goods
Mixed Chart
Barclays
Add to my slides
Remove from favorites
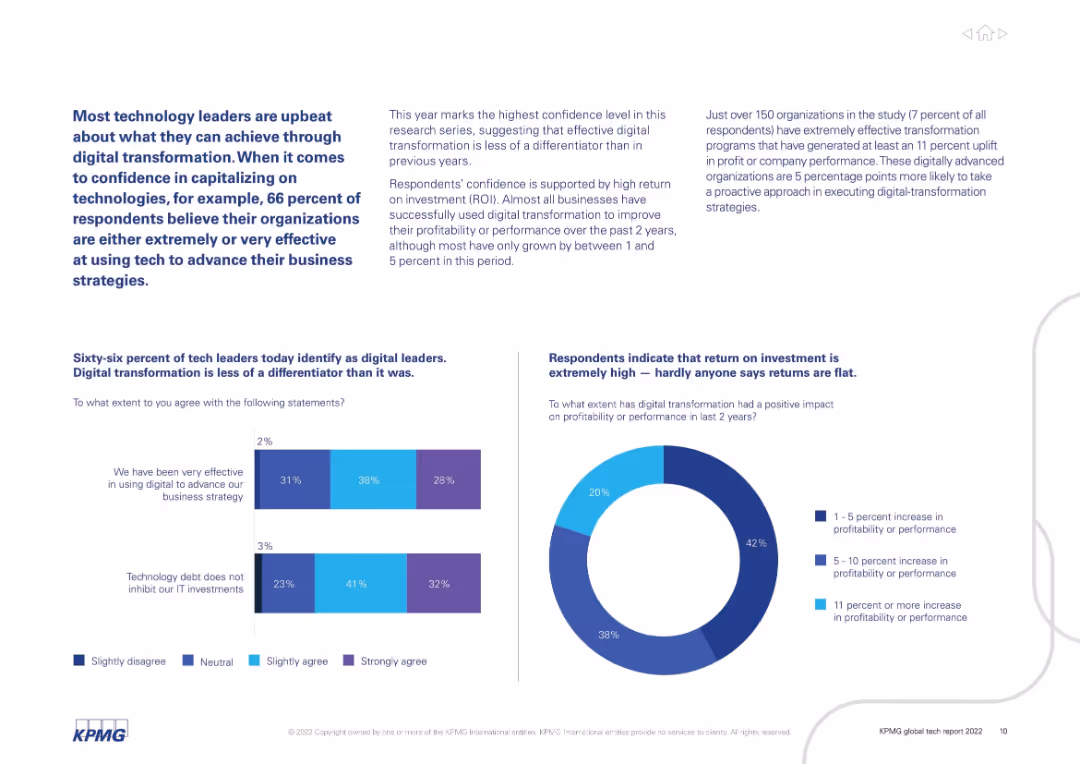
Mixed layout with text, bar, and pie charts summarizing survey responses about effectiveness, ROI, and differentiation from digital strategies.
Technology and Digital Transformation
Technology & Software
Survey results show high confidence in digital initiatives. 66% identify as digital leaders, and most report positive ROI. The narrative shows digital transformation has become standard practice, less of a differentiator than in the past.
ROI, digital leaders, confidence, technology strategy, survey results
false
Technology and Digital Transformation
Technology & Software
Multiple Chart
KPMG
Add to my slides
Remove from favorites
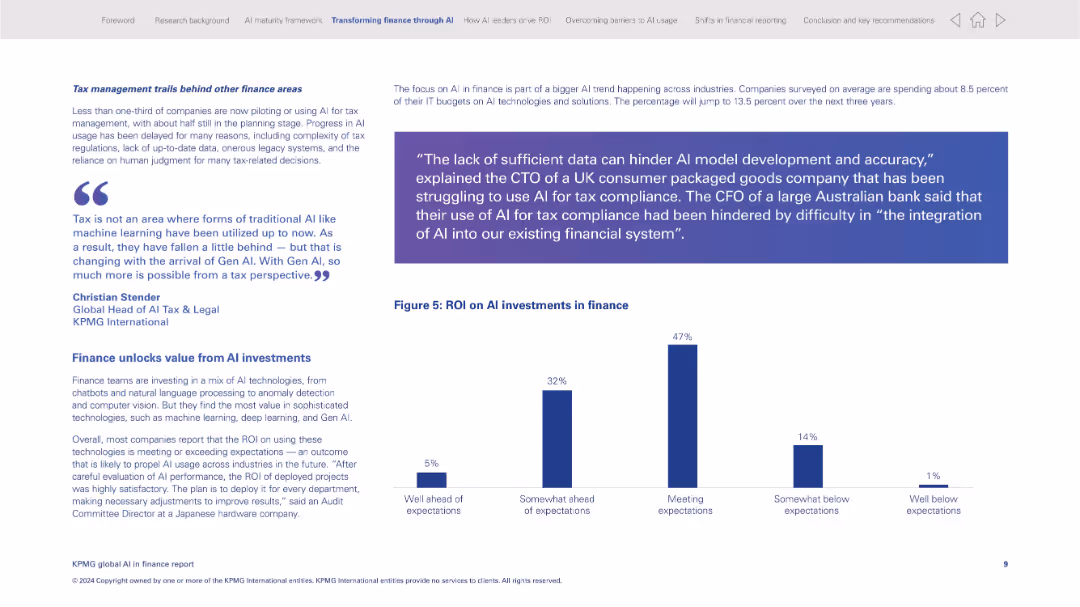
Balanced layout with left-aligned narrative text and a bar chart on ROI distribution by percentage
Investment Analysis
Financial Services
This slide discusses the ROI outcomes of AI investments in finance. It highlights the challenges in tax AI adoption and notes the average IT budget allocation to AI. A bar chart indicates most organizations are seeing satisfactory ROI, with nearly half reporting expectations met.
ROI, finance AI, investment outcomes, tax management, Gen AI, budget allocation, performance, financial technology
false
Investment Analysis
Financial Services
Mixed Chart
KPMG
Add to my slides
Remove from favorites
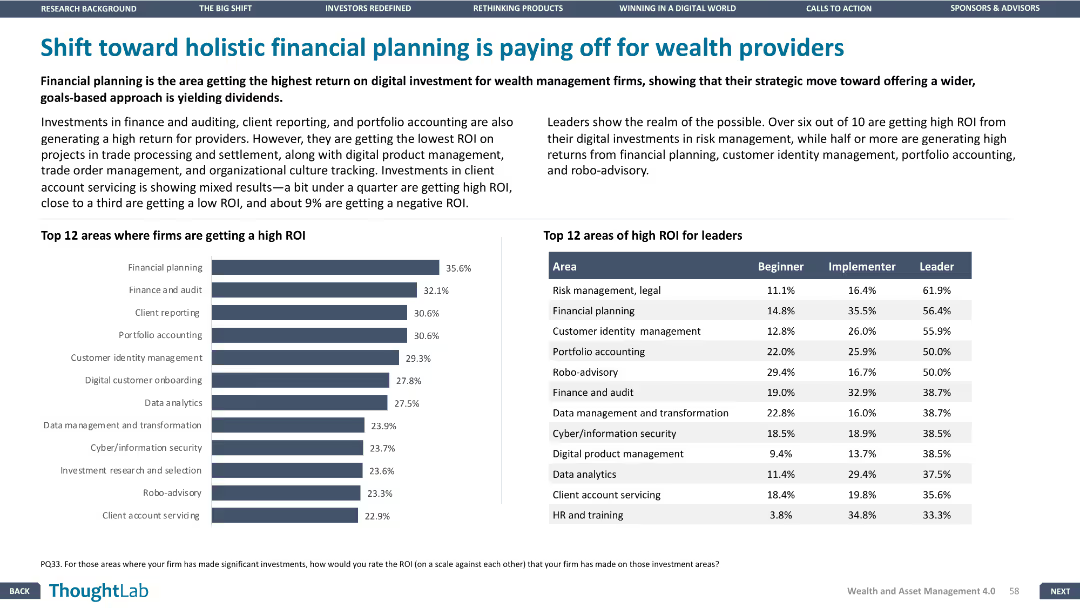
Column charts illustrating high ROI areas for firms and leaders by different categories.
Strategic Planning
Financial Services
Discusses the areas where wealth management firms are seeing high ROI from digital investments, focusing on financial planning.
ROI, financial, planning, digital, wealth
false
Strategic Planning
Financial Services
Mixed Chart
Deloitte
Add to my slides
Remove from favorites
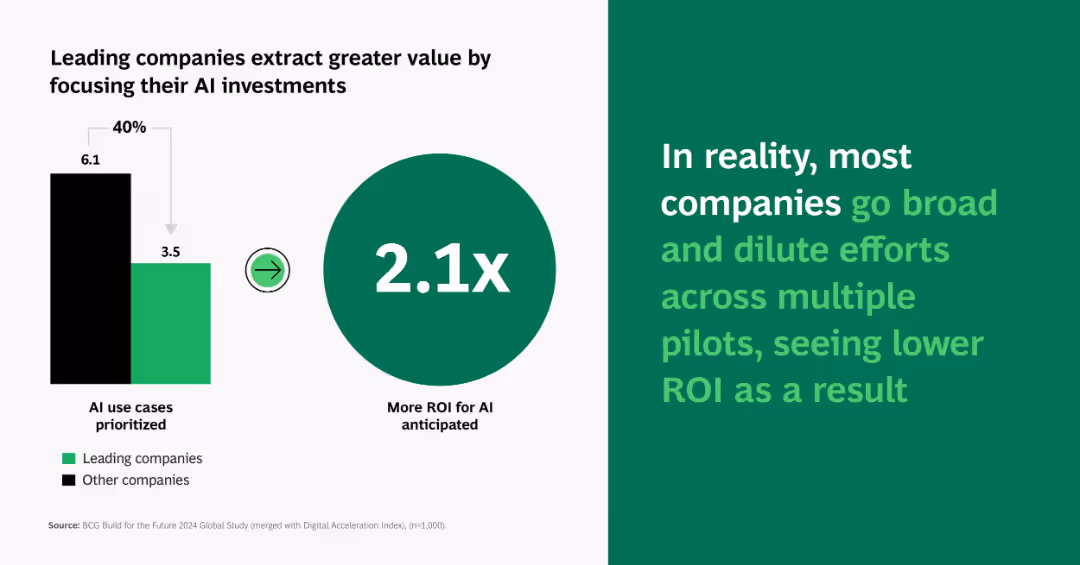
Split layout with bar chart and large ROI multiplier circle; contrasting background on right with key message in green/white.
Performance Metrics and KPIs
Artificial Intelligence
Demonstrates that firms focusing AI investments on fewer use cases achieve 2.1x more ROI than those spreading efforts thinly across many pilots.
ROI, focus, prioritization, bar chart, 2.1x, AI value, BCG, strategic investment, use cases
false
Performance Metrics and KPIs
Artificial Intelligence
Mixed Chart
BCG
Add to my slides
Remove from favorites
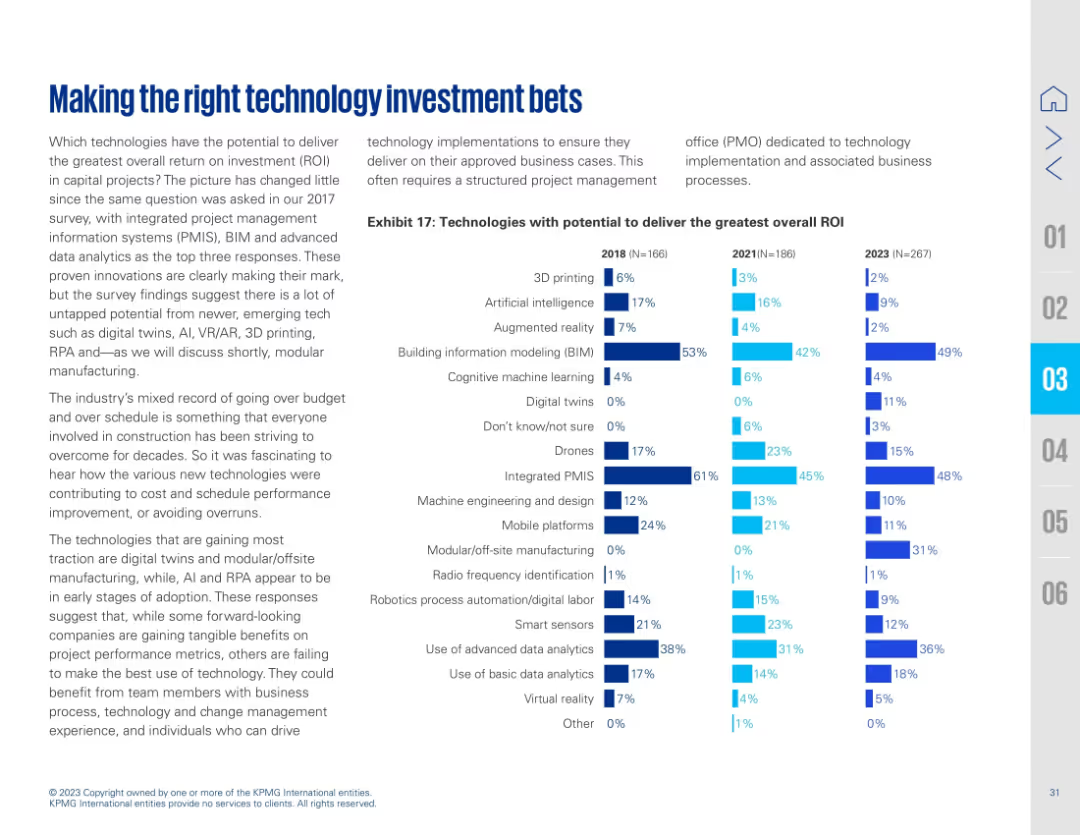
Full-width layout with a bar chart on the right showing ROI potential of technologies from 2018 to 2023. Left-aligned text describes changes in ROI perception. Technology types are listed vertically with horizontal comparison bars across years.
Investment Analysis
Real Estate & Construction
Tracks the technologies with the greatest perceived ROI in capital projects over three years. PMIS, BIM, and advanced data analytics consistently rank high, while AI and modular/offsite manufacturing show growing recognition.
ROI, technology investment, PMIS, BIM, analytics, AI, modular manufacturing, construction
false
Investment Analysis
Real Estate & Construction
Mixed Chart
KPMG
Add to my slides
Remove from favorites
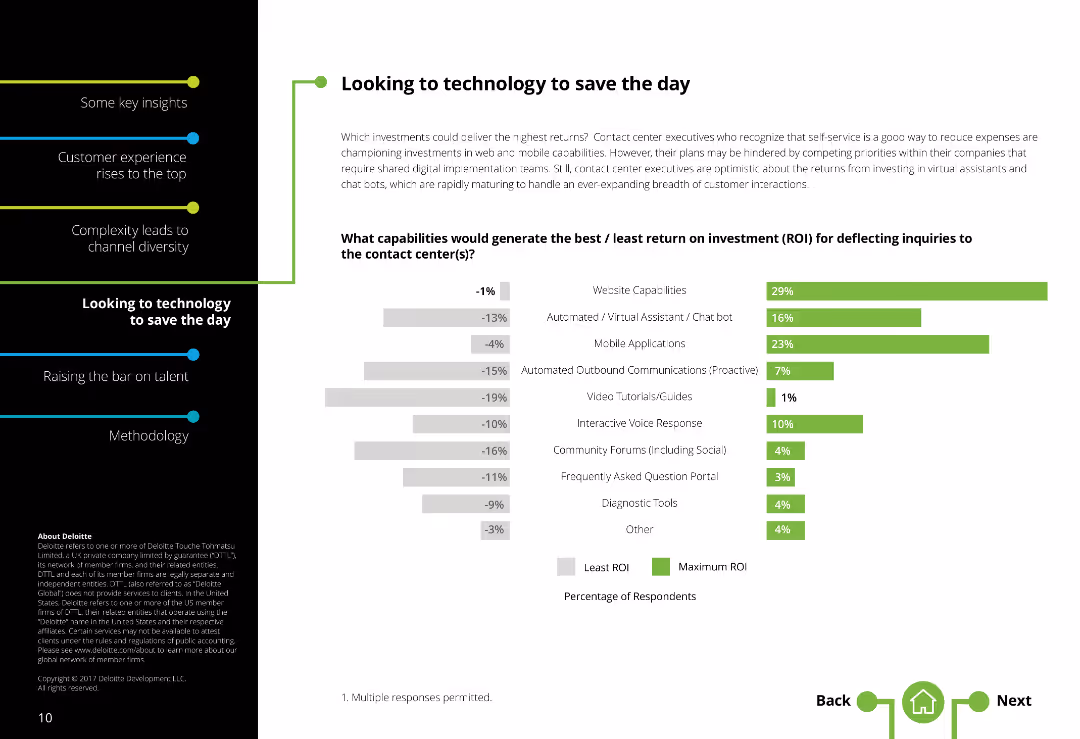
Two-column layout with text on the left and a bar chart depicting ROI on the right. There is a moderate amount of text.
Market Analysis and Trends
Technology & Software
Evaluates which technologies provide the best and least return on investment (ROI) for contact centers, highlighting mobile applications, chatbots, and web capabilities.
ROI, Technology investments, Contact centers, Web capabilities, Mobile applications, Chatbots, Cost reduction
false
Market Analysis and Trends
Technology & Software
Multiple Chart
Deloitte
Add to my slides
Remove from favorites
A complex diagram spans the slide, mapping roles across different growth stages, categorized into business, technology, and risk, with a clear progression pathway illustrated.
Human Resources and Talent Management
Technology & Software
It depicts a role architecture to provide a comprehensive view of career progression within an organization, for HR planning and organizational development workshops.
role architecture, career mapping, growth stages, HR planning, organizational development, employee progression, job families
false
Human Resources and Talent Management
Technology & Software
Diagram
Kearney
Add to my slides
Remove from favorites
Includes multiple bar charts on managers' perceptions of their future roles.
Organizational Structure and Change
Professional Services
Evaluates how managers foresee the impact of changes on their roles within companies.
role change, managerial perceptions, future outlook, industry comparison, management
false
Organizational Structure and Change
Professional Services
Mixed Chart
BCG
Add to my slides
Remove from favorites
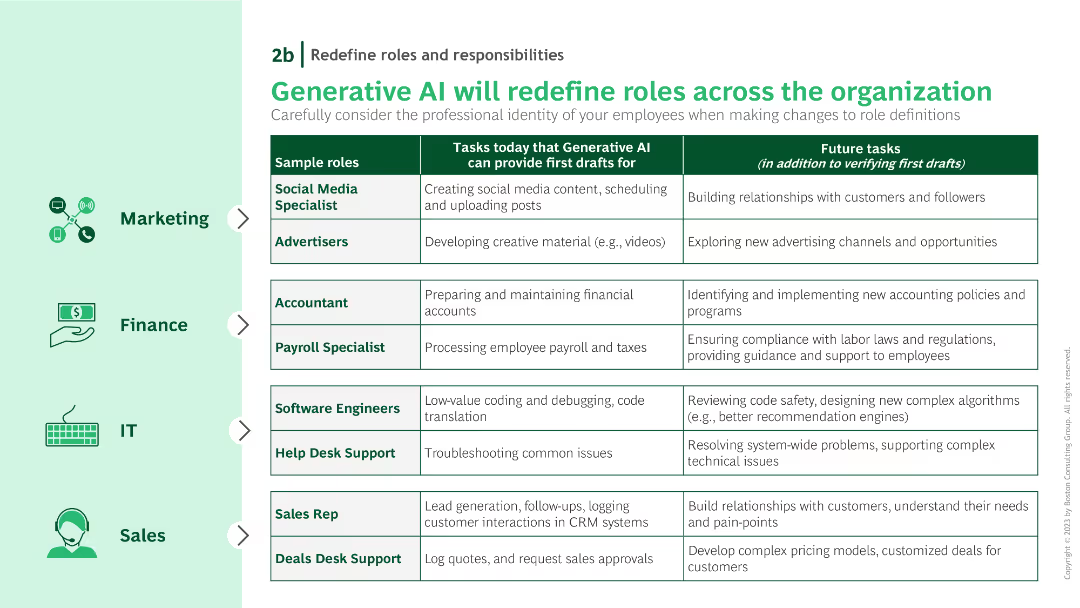
A table with three columns detailing current tasks, future tasks, and sample roles. Icons on the left side denote various industries like marketing, finance, IT, and sales.
Human Resources and Talent Management
Technology & Software
Details how generative AI will change roles across different departments, specifying tasks that AI will handle versus those requiring human oversight.
role changes, AI, future tasks, current tasks, departmental roles
false
Human Resources and Talent Management
Technology & Software
Table
BCG
Add to my slides
Remove from favorites
With moderate visual complexity, the slide uses two pie charts to present perceptions of gender role modeling in international assignments. The design is clean and professional, employing a red and grey color scheme to draw attention to the gender comparison data.
Human Resources and Talent Management
Professional Services
Discussing the shortage of female role models with international assignment experience, the slide highlights this gap's impact on wider talent and global mobility programs. It urges organizations to showcase positive experiences of successful female assignees to drive awareness and inspire women.
Role models, Gender gap, Leadership development, Talent retention
false
Human Resources and Talent Management
Professional Services
Multiple Chart
PwC/Strategy&
Add to my slides
Remove from favorites
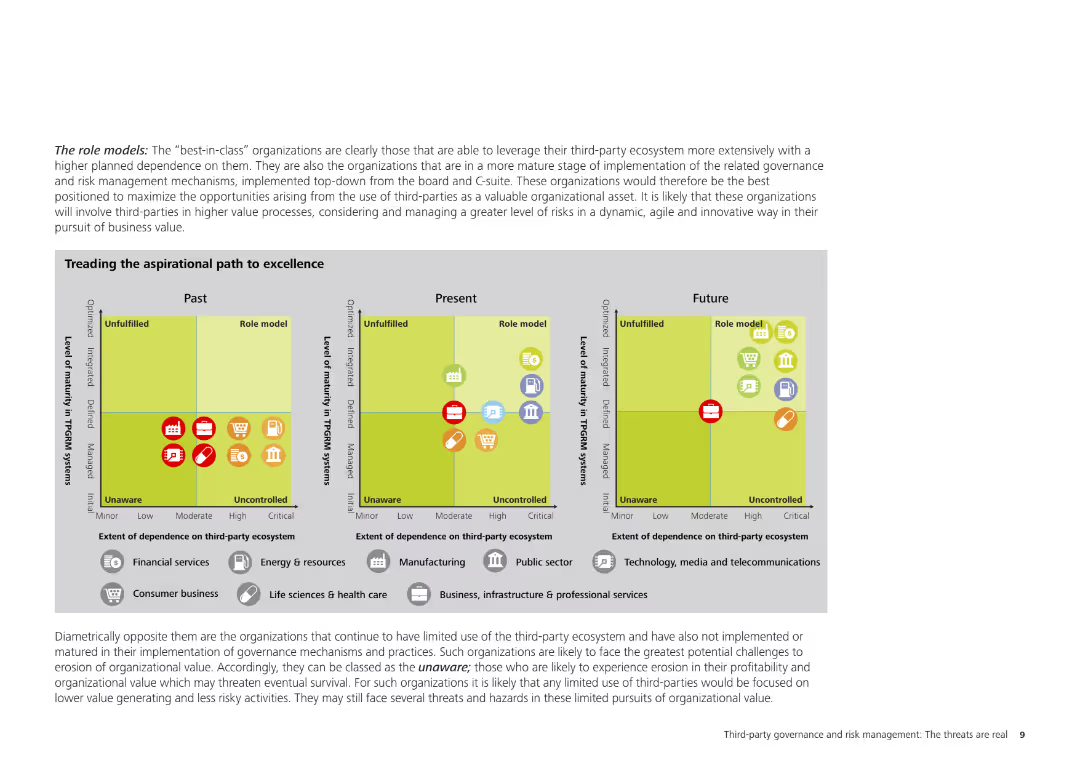
The slide contains a detailed text description and charts illustrating the role models in third-party risk management, highlighting organizations that effectively leverage their third-party ecosystems.
Strategic Planning
Professional Services
This slide identifies organizations that serve as role models in third-party risk management, emphasizing their effective use of third-party ecosystems and mature governance processes. It includes visual grids and charts to support these findings.
role models, third-party risk, governance, risk management, professional services, organizational strategy, best practices
false
Strategic Planning
Professional Services
Diagram
Deloitte
Add to my slides
Remove from favorites
Slide includes multiple arrowed lines linking two tables of roles titled "Today" and "Tomorrow." Colored dots represent status of roles (retained, new, different) in the mortgage sector.
Financial Performance
Financial Services
Illustrates the future alignment of roles in the mortgage business with the implementation of AI, showing transitions and potential new roles.
roles, AI, mortgage, alignment, future, employment, transition, management, sales, operations
false
Financial Performance
Financial Services
Table
Accenture
Add to my slides
Remove from favorites
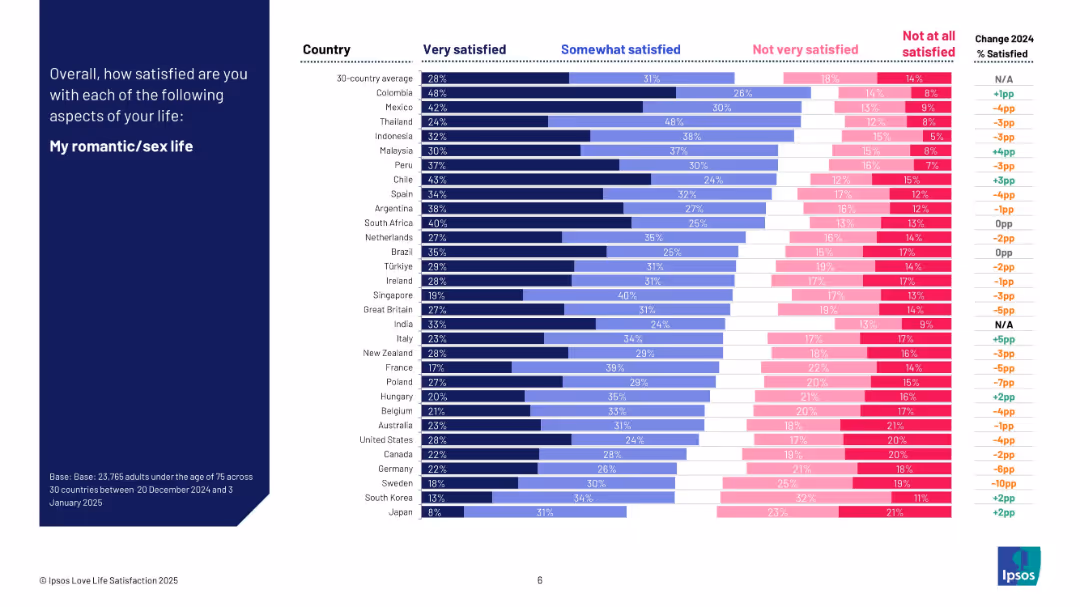
Similar design to 19467; focuses on satisfaction with romantic/sex life across countries with satisfaction changes over time.
Human Resources and Talent Management
Professional Services
This slide presents satisfaction levels with respondents' romantic and sex lives, segmented by country and level of satisfaction. Colombia, Mexico, and Thailand lead in satisfaction, while Japan and South Korea report the lowest levels. Includes 2024 to 2025 change data.
romantic life, sex life, satisfaction, love life, cross-cultural comparison, survey, emotional well-being, Ipsos
false
Human Resources and Talent Management
Professional Services
Mixed Chart
IPSOS
Add to my slides
Remove from favorites
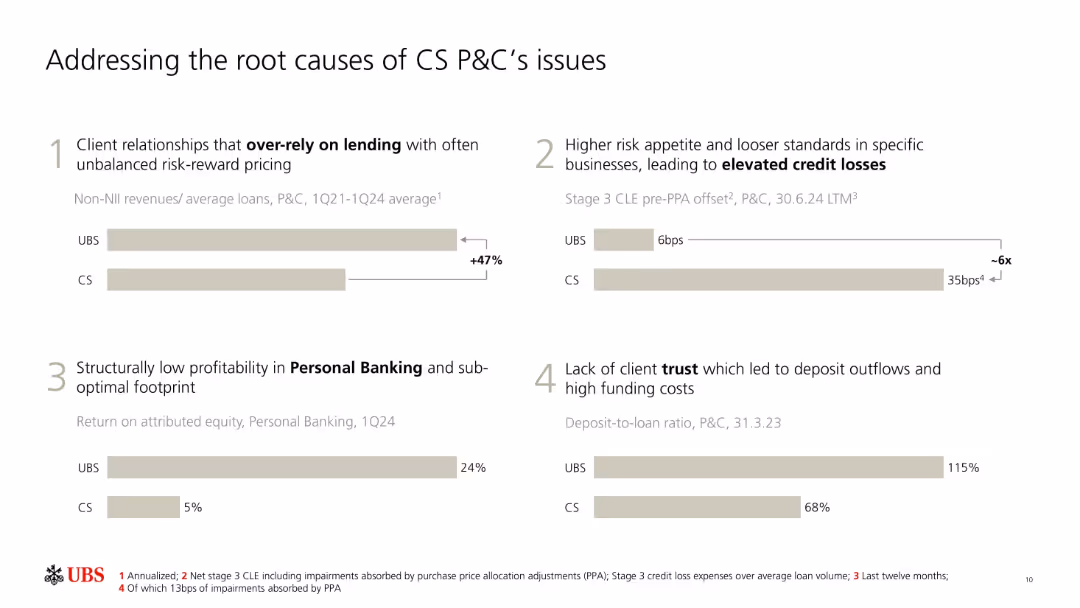
Four-point layout with bar graphs comparing UBS vs. CS metrics.
Risk Assessment and Management
Financial Services
The slide identifies four core issues with Credit Suisse's P&C business, including lending overreliance, elevated credit losses, poor profitability in personal banking, and trust deficits. It quantifies each issue using performance metrics for UBS and CS.
root causes, CS, UBS, lending risk, credit loss, personal banking, trust, profitability, P&C
false
Risk Assessment and Management
Financial Services
Single Chart
UBS
Add to my slides
Remove from favorites
Column charts analyzing various purchasing pathways, with a focus on ROPO
Market Analysis and Trends
Retail & E-commerce
Analyzes the Research Online, Purchase Offline trend among luxury buyers
ROPO, Luxury, Purchase Behavior, Online, Offline
false
Market Analysis and Trends
Retail & E-commerce
Mixed Chart
BCG
Add to my slides
Remove from favorites
This slide showcases a column chart and a graph overlaid with multiple scenario projections. The chart on the left outlines potential risks, while the right-hand side graph illustrates ROTCE projections across different recessionary scenarios, with color-coded lines representing varying intensities of economic conditions.
Risk Assessment and Management
Financial Services
Slide 18 positions JPMorgan Chase & Co. as capable of delivering strong returns on tangible equity (ROTCE) under various recessionary conditions, underlining robust risk management and strategic resilience.
ROTCE, Risk Management, Recession Scenarios, Projections, Return on Equity, Economic Conditions, Strategic Resilience
false
Risk Assessment and Management
Financial Services
Mixed Chart
JP Morgan
Add to my slides
Remove from favorites
The slide balances text with a set of illustrative icons. It is organized into four sections, each with headers and bullet points.
Financial Performance
Financial Services
The slide highlights the target for Return on Tangible Common Equity (ROTCE), and how various strategies contribute to achieving this financial goal.
ROTCE, target, financial goals, strategy, common equity, icons, JPMorgan
false
Financial Performance
Financial Services
Table
JP Morgan
Add to my slides
Remove from favorites
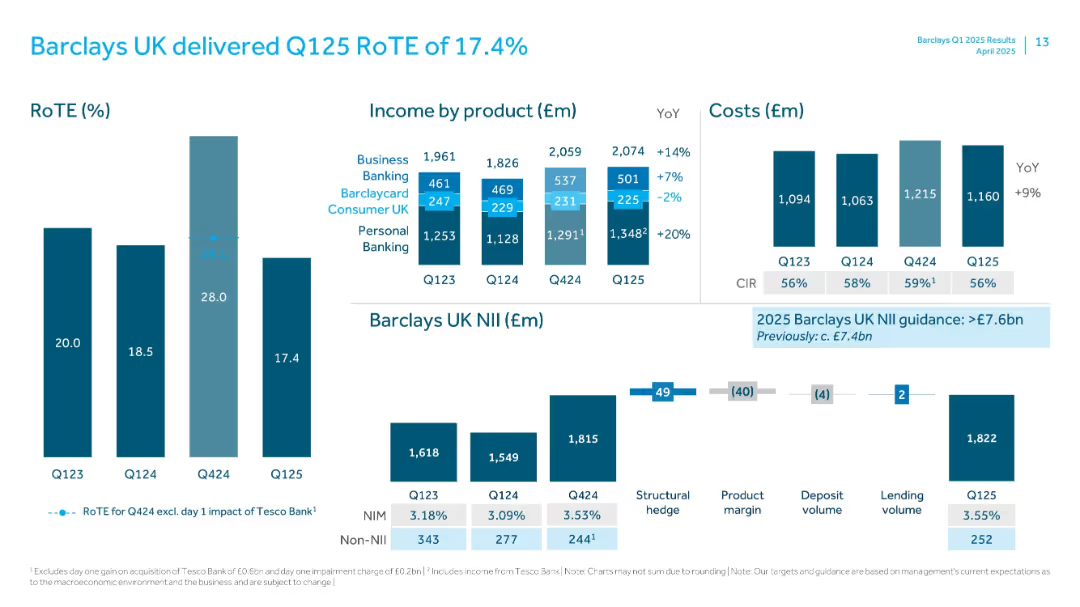
Multi-chart slide with bar graphs and side labels showing RoTE, income by product, cost trends, and NII.
Financial Performance
Financial Services
Highlights Q125 financial performance for Barclays UK, including RoTE of 17.4%, income breakdown by banking segments, cost analysis, and net interest income trends. It shows performance improvements across most metrics with year-over-year comparisons.
RoTE, Barclays UK, NII, Income, Costs, Q125, Financials, CIR, Personal Banking, Business Banking
false
Financial Performance
Financial Services
Multiple Chart
Barclays
Add to my slides
Remove from favorites
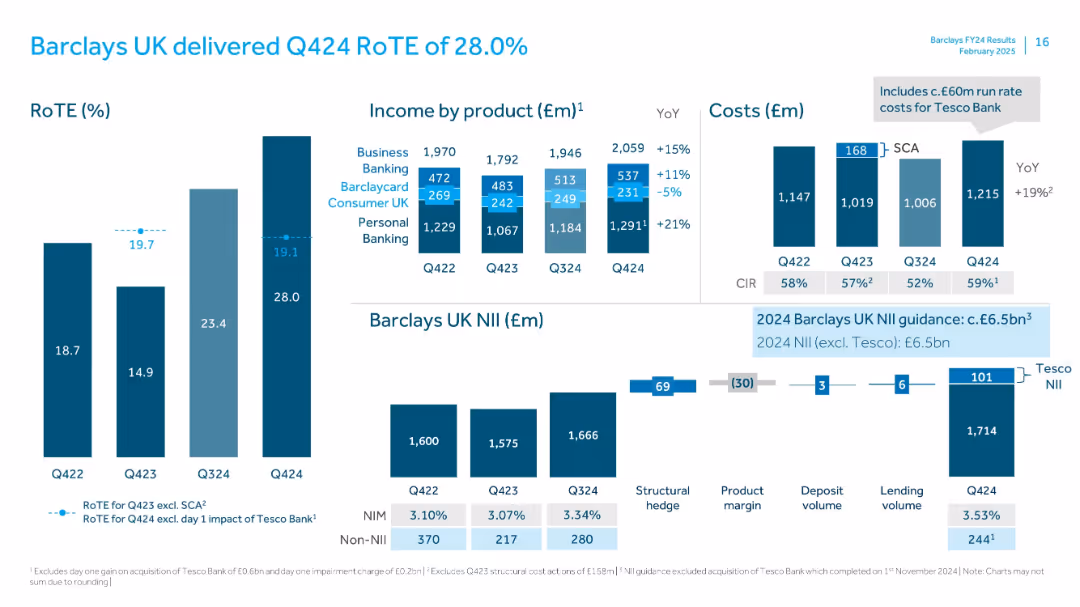
Left: vertical RoTE bar chart; Center: stacked bars for income by product; Right: cost bars; bottom: NII breakdown waterfall
Financial Performance
Financial Services
Reports Barclays UK’s return on tangible equity for Q424, dissecting revenue by product and costs, with insights into Tesco Bank's financial integration. Structural hedge and product margin effects on NII are also highlighted.
RoTE, Barclays UK, NII, Tesco, income breakdown, cost analysis, structural hedge, Q424
false
Financial Performance
Financial Services
Multiple Chart
Barclays
Add to my slides
Remove from favorites
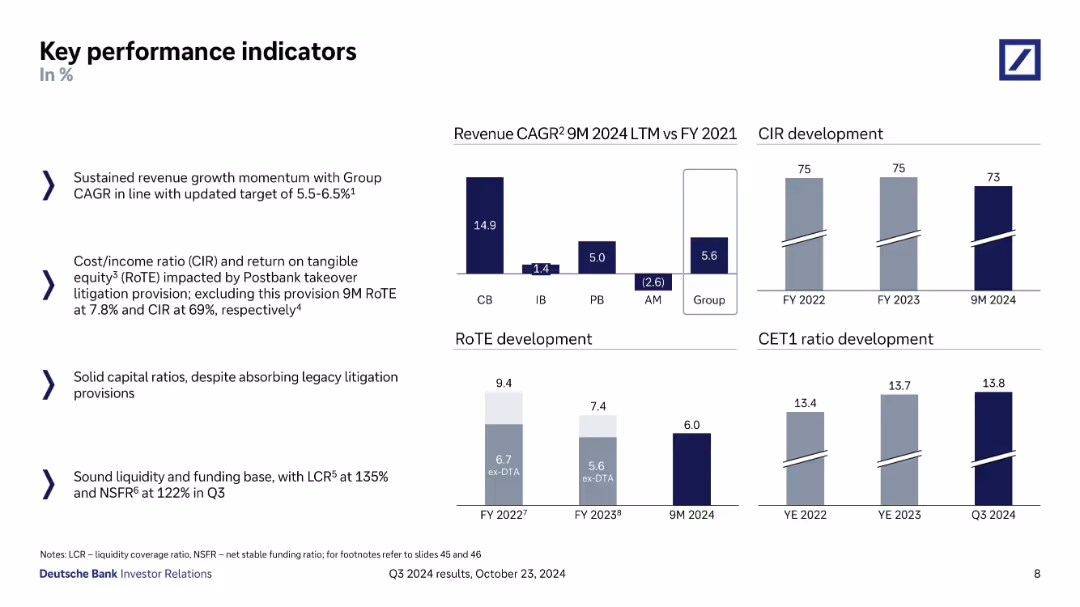
Multi-column layout; left side has bullet points; right side includes bar and column charts for KPIs.
Performance Metrics and KPIs
Financial Services
Presents Deutsche Bank’s performance indicators such as revenue CAGR, CIR, RoTE, CET1 ratio, and liquidity/funding ratios. Visuals show development over time with context about litigation provisions and capital strength.
RoTE, CET1 ratio, CIR, revenue CAGR, liquidity, litigation provision
false
Performance Metrics and KPIs
Financial Services
Multiple Chart
Deutsche Bank
Add to my slides
Remove from favorites
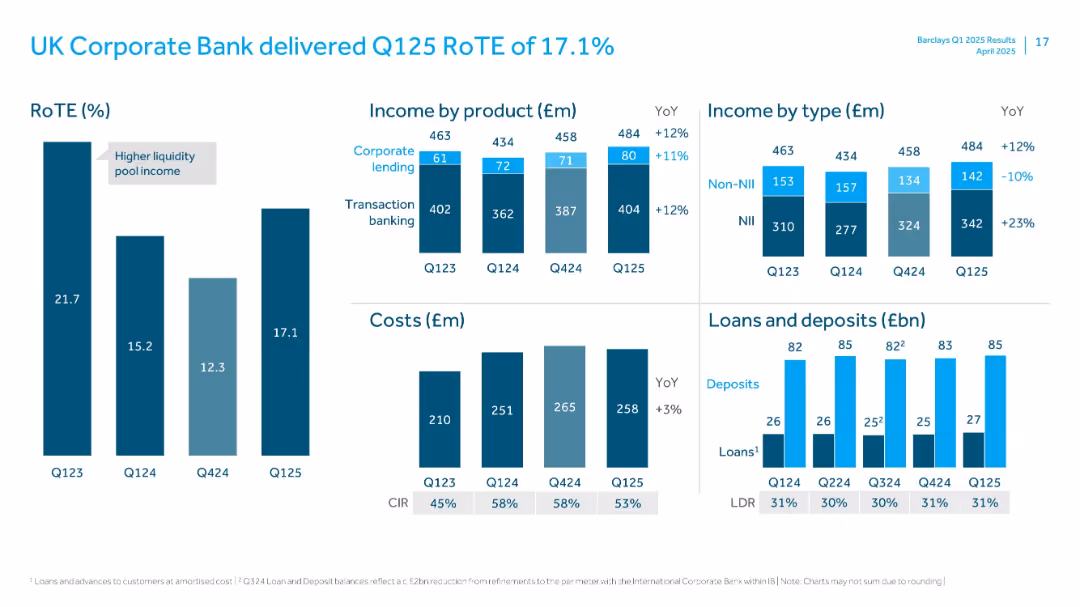
Grids of bar charts showing RoTE, income breakdown, cost structure, and loan/deposit values with LDR.
Financial Performance
Financial Services
Reviews performance of UK Corporate Bank, with RoTE of 17.1%. Includes income by product and type, cost evolution, and loans/deposits metrics. Notes YoY growth in income and marginal increase in cost base.
RoTE, Corporate Bank, Transaction Banking, Lending, Income, LDR, Deposits, NII, Q125
false
Financial Performance
Financial Services
Multiple Chart
Barclays
Add to my slides
Remove from favorites
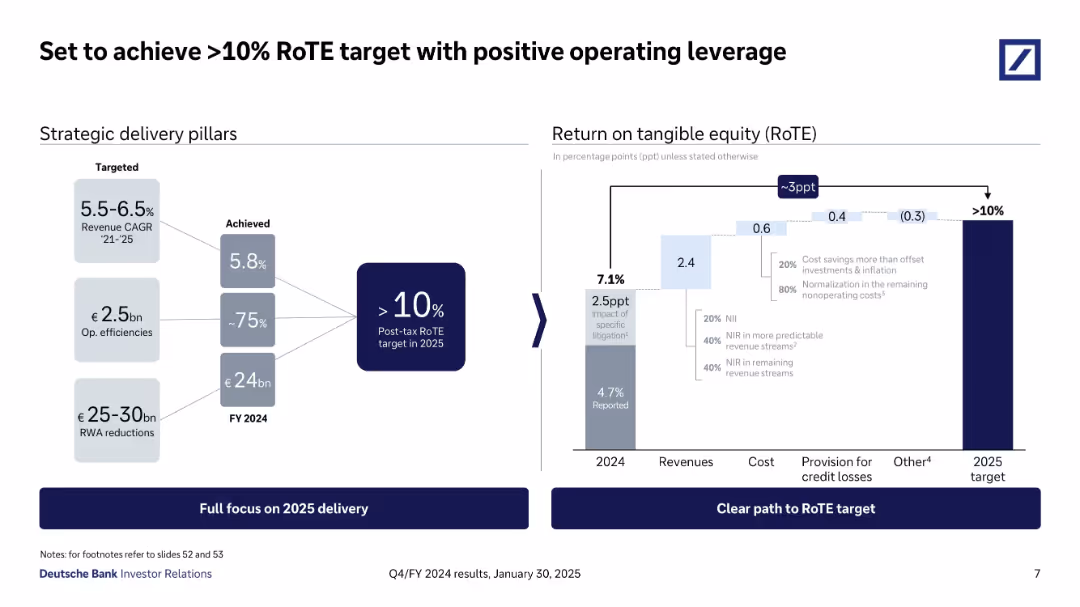
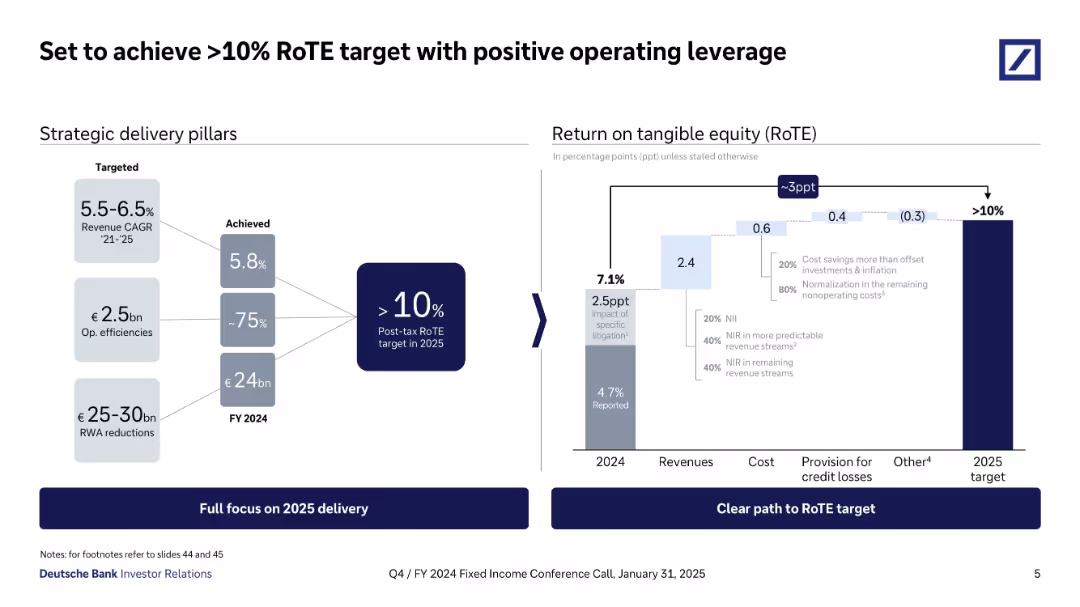
Left panel lists strategic delivery metrics; right chart visualizes bridge to >10% RoTE target by 2025, showing contributions from revenues, costs, and provisions.
Financial Performance
Financial Services
Shows Deutsche Bank’s strategic path to exceed 10% Return on Tangible Equity by 2025. Key drivers include 5.8% revenue CAGR, €2.5bn in cost efficiencies, and ~€24bn RWA reductions. Breakdown of RoTE improvement elements is provided.
RoTE, Deutsche Bank, return on equity, strategy, revenue, costs, FY25 target
false
Financial Performance
Financial Services
Mixed Chart
Deutsche Bank
Add to my slides
Remove from favorites
Featuring a series of column charts, the slide depicts the return on tangible equity over the years and distribution amounts.
Financial Performance
Financial Services
Highlights the growth in return on tangible equity over recent years and the increased capital distributions to shareholders.
RoTE, distributions, growth, equity, shareholders
false
Financial Performance
Financial Services
Multiple Chart
Barclays
Add to my slides
Remove from favorites
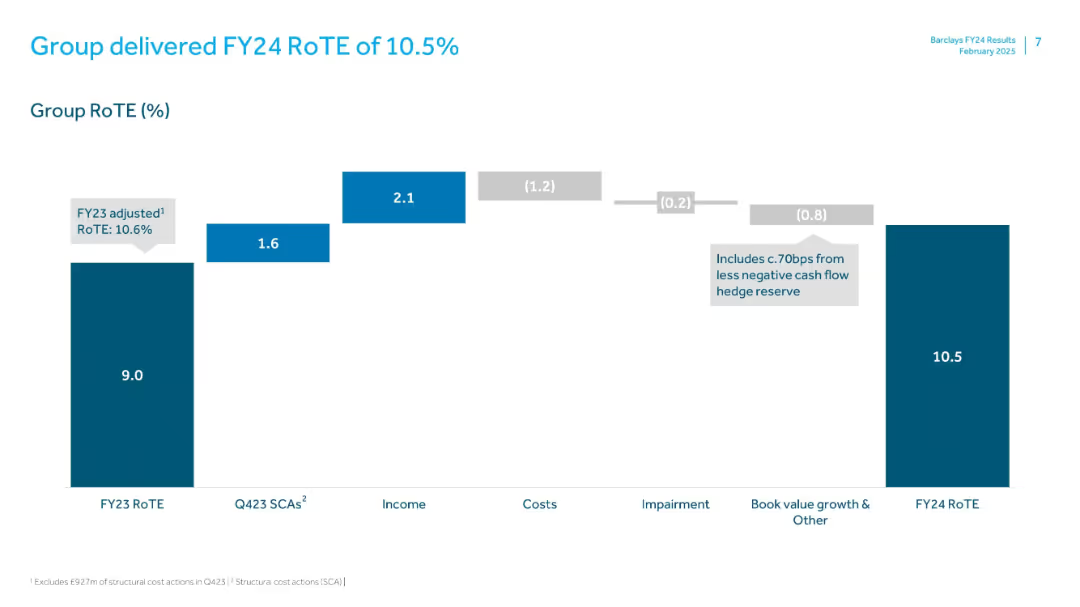
Waterfall chart illustrating components of return on tangible equity. Minimalist layout with teal and gray tones.
Financial Performance
Financial Services
Displays Barclays’ FY24 Return on Tangible Equity (RoTE), explaining the change from FY23’s 9.0% to FY24’s 10.5% through breakdowns of SCAs, income, costs, impairments, and other adjustments.
RoTE, FY24, Barclays, Return, Income, Costs, Performance, Hedge, Equity
false
Financial Performance
Financial Services
Single Chart
Barclays
Add to my slides
Remove from favorites
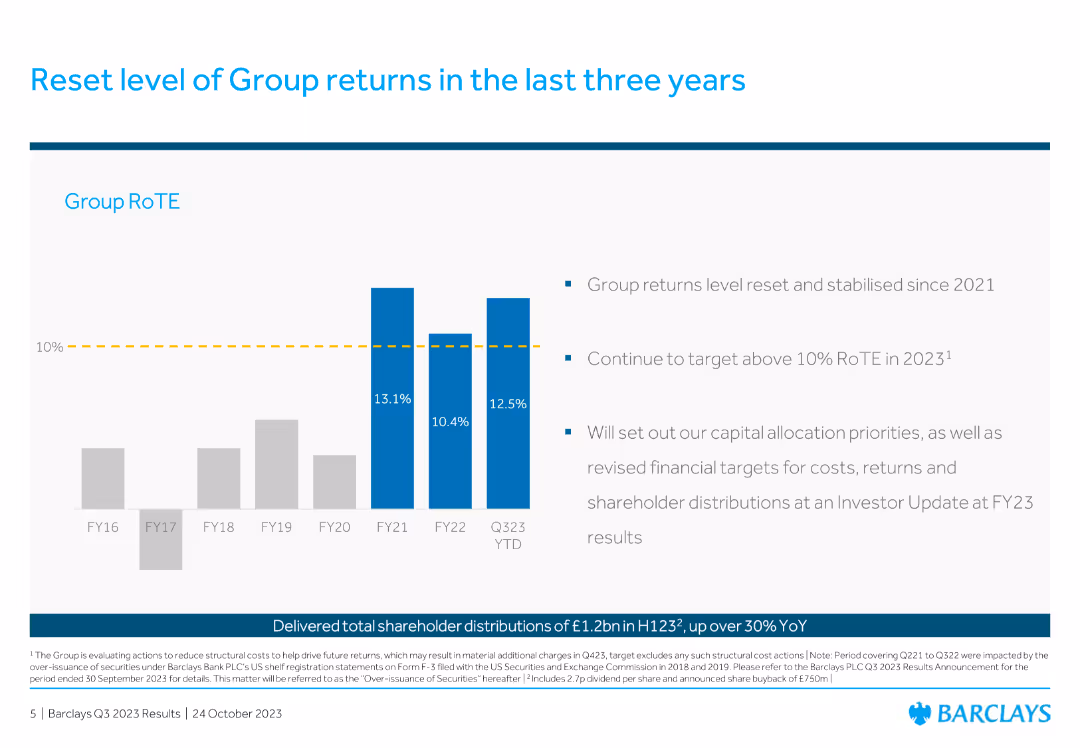
The slide features a column chart showing the Group RoTE over the past years with a future target marked and bullet points outlining the strategic focus.
Financial Performance
Financial Services
This slide discusses the historical and target Return on Tangible Equity (RoTE) for the Group, highlighting past performance and future strategic goals to stabilize and improve financial returns.
RoTE, group returns, financial performance, strategy
false
Financial Performance
Financial Services
Mixed Chart
Barclays
Add to my slides
Remove from favorites
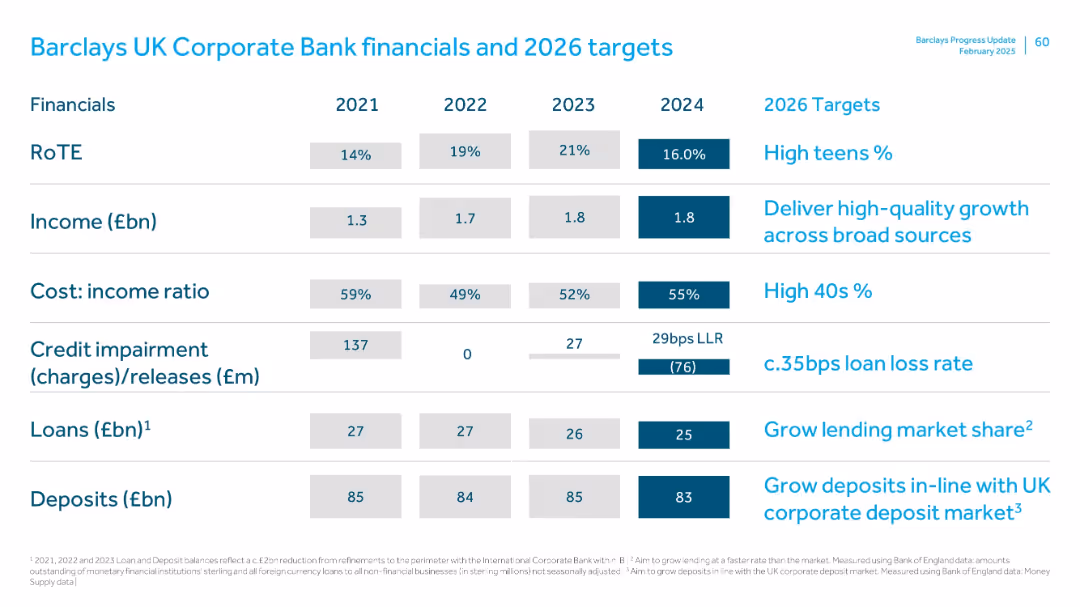
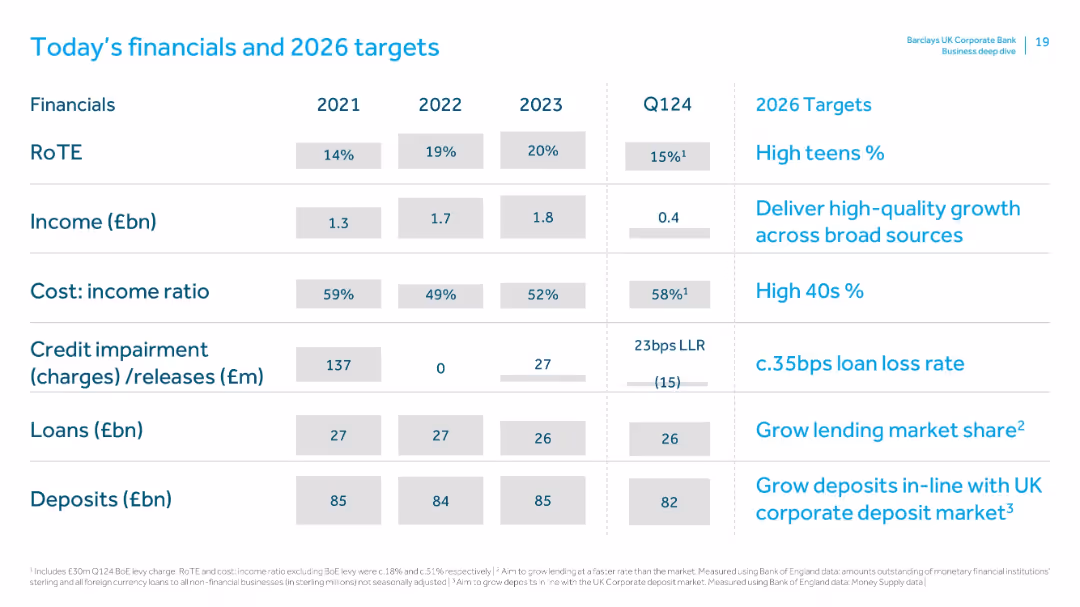
Tabular format with financial metrics (2021–2024), right column listing 2026 targets; clean white background with blue highlights
Financial Performance
Financial Services
The slide presents Barclays UK Corporate Bank’s financial performance from 2021 to 2024 and sets targets for 2026. Metrics include RoTE, income, cost-income ratio, credit impairments, loans, and deposits. It emphasizes goals like high teen RoTE, reduced cost-income ratio, and market-aligned growth.
RoTE, income, cost-income, loan growth, credit impairment, targets, UK Corporate Bank
false
Financial Performance
Financial Services
Single Chart
Barclays
Add to my slides
Remove from favorites
Tabular layout with financial metrics from 2021 to Q1 2024 and target metrics for 2026. Clean layout, white background, blue highlight accents.
Financial Performance
Financial Services
Presents Barclays UK Corporate Bank's key financial figures including RoTE, income, cost-income ratio, impairments, loans, and deposits from 2021–Q1 2024 alongside 2026 performance targets, aiming for sustained growth and efficiency.
RoTE, income, cost-income ratio, targets, Barclays, Q1 2024, loans, deposits, impairments, 2026 goals
false
Financial Performance
Financial Services
Single Chart
Barclays
Add to my slides
Remove from favorites
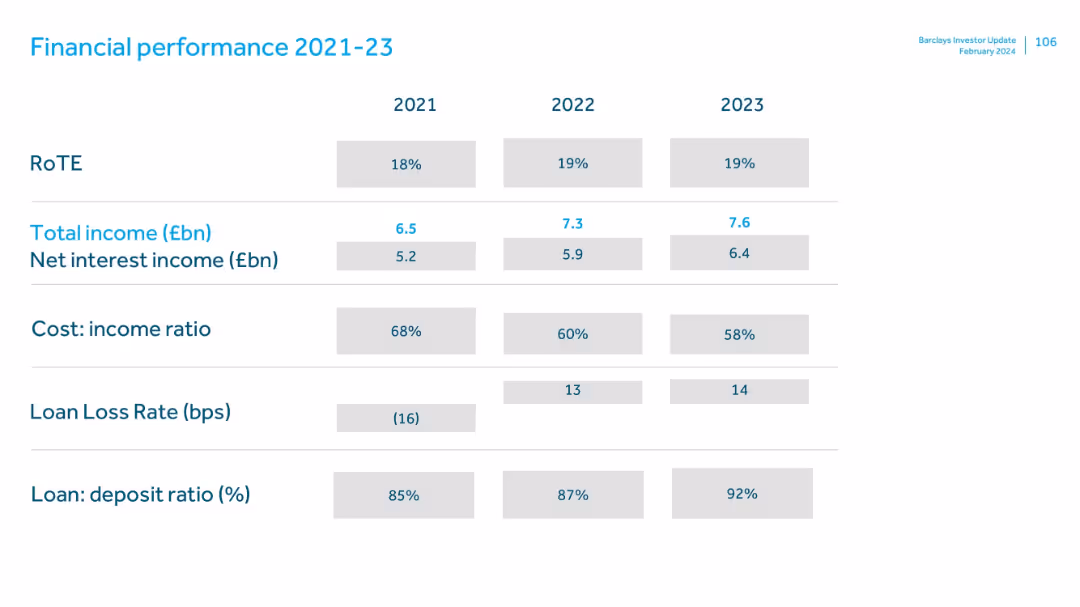
This slide uses column charts to depict Barclays' financial performance from 2021 to 2023, with metrics like RoTE, Income, and Loan Loss Rate. It's visually structured with a clear progression from left to right, using a simple and professional color palette of grey and blue tones.
Financial Performance
Financial Services
This slide presents a detailed financial overview of Barclays from 2021 to 2023, showing key performance metrics such as RoTE, net receivables, and income growth. It provides insights into the financial health and operational efficiency of the bank over the years.
RoTE, income, net receivables, financial performance, metrics
false
Financial Performance
Financial Services
Multiple Chart
Barclays
Add to my slides
Remove from favorites
Contains column charts comparing statutory RoTE across different bank divisions over several years.
Financial Performance
Financial Services
Demonstrates how different bank divisions contribute to overall growth and performance, emphasizing improvements and future targets.
RoTE, performance, divisions, growth, targets
false
Financial Performance
Financial Services
Multiple Chart
Barclays
Add to my slides
Remove from favorites
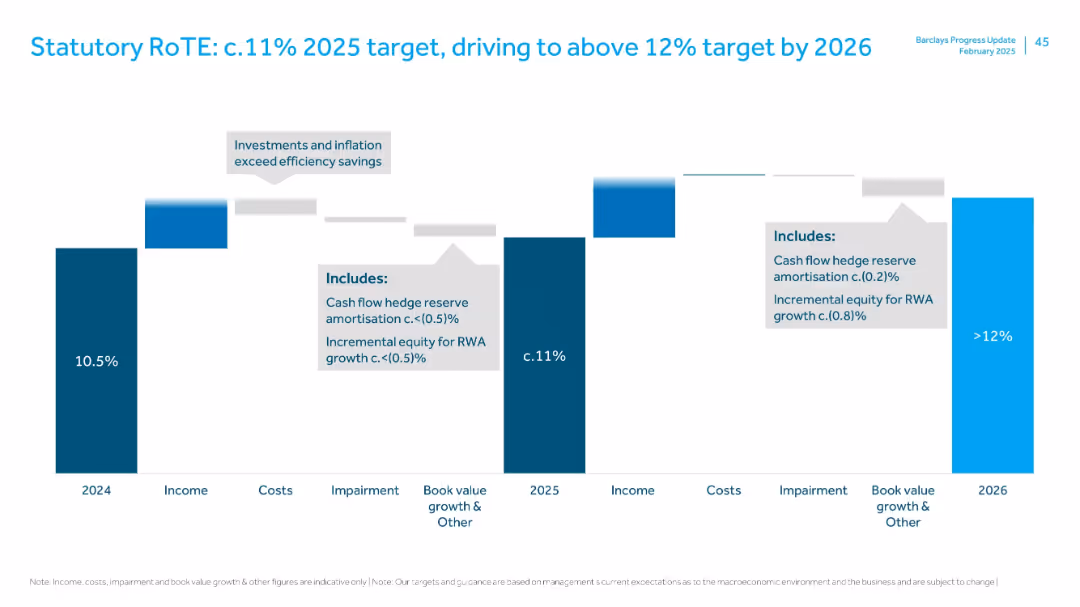
Waterfall chart showing RoTE progression from 2024 (10.5%) to 2026 (>12%), with breakdowns by income, cost, impairment, equity growth.
Financial Performance
Financial Services
Illustrates how Barclays plans to achieve and exceed RoTE targets through income gains and efficiency, despite inflation and investments. Highlights key adjustments (e.g., cash flow hedge reserve, RWA equity).
RoTE, profitability, return on equity, financial targets, cost impact
false
Financial Performance
Financial Services
Single Chart
Barclays
Add to my slides
Remove from favorites
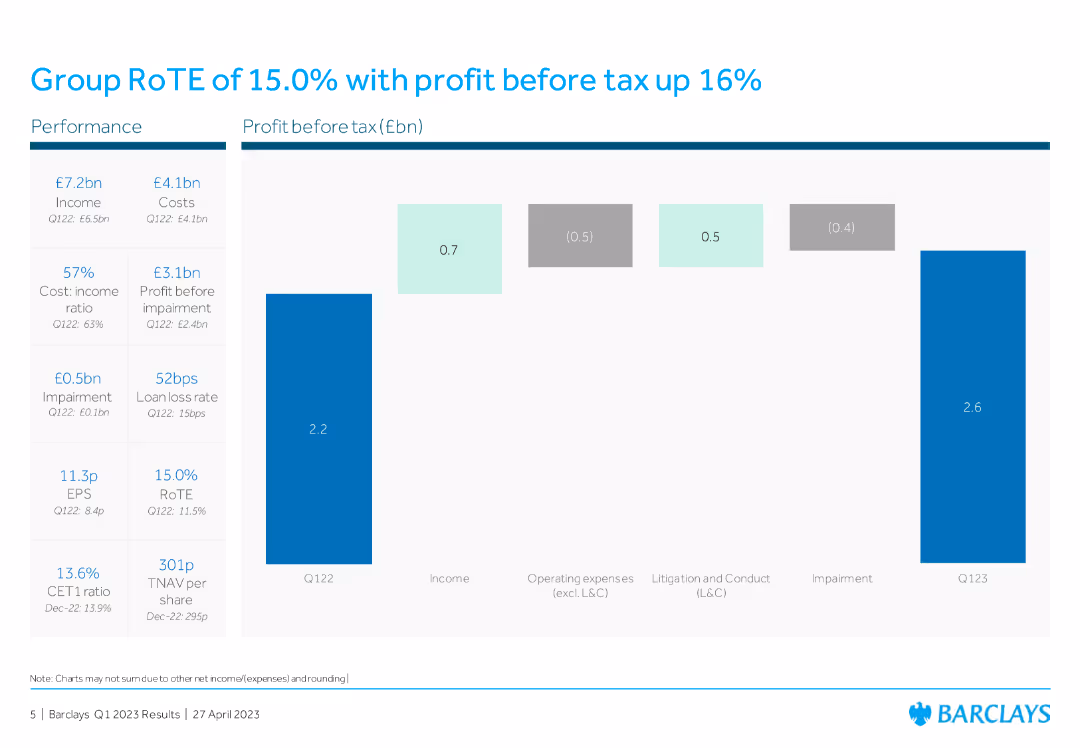
This slide includes a column chart showing profit before tax and other financial metrics like income, operating expenses, litigation, conduct costs, and impairment for Q122 and Q123, highlighting changes and growth rates.
Financial Performance
Financial Services
The slide displays financial performance metrics for Barclays Group, showing a 15% RoTE and profit before tax increase, with detailed breakdowns of income, expenses, and impairments for Q122 and Q123.
RoTE, profit before tax, financial metrics, income, expenses
false
Financial Performance
Financial Services
Mixed Chart
Barclays
Add to my slides
Remove from favorites
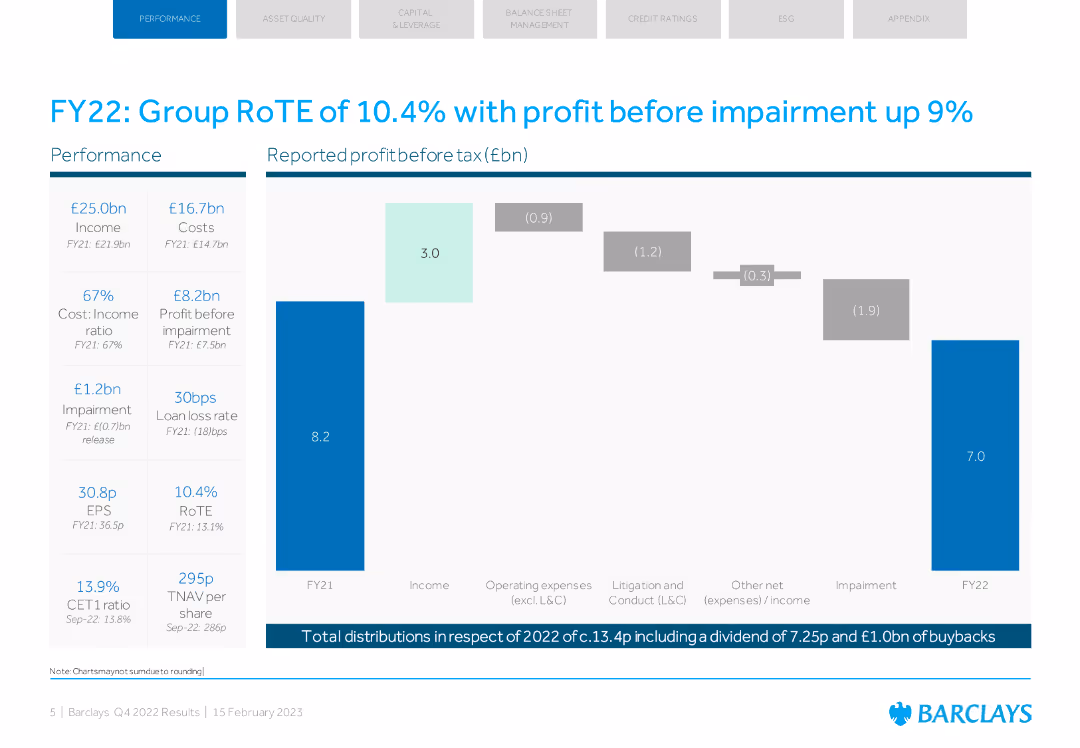
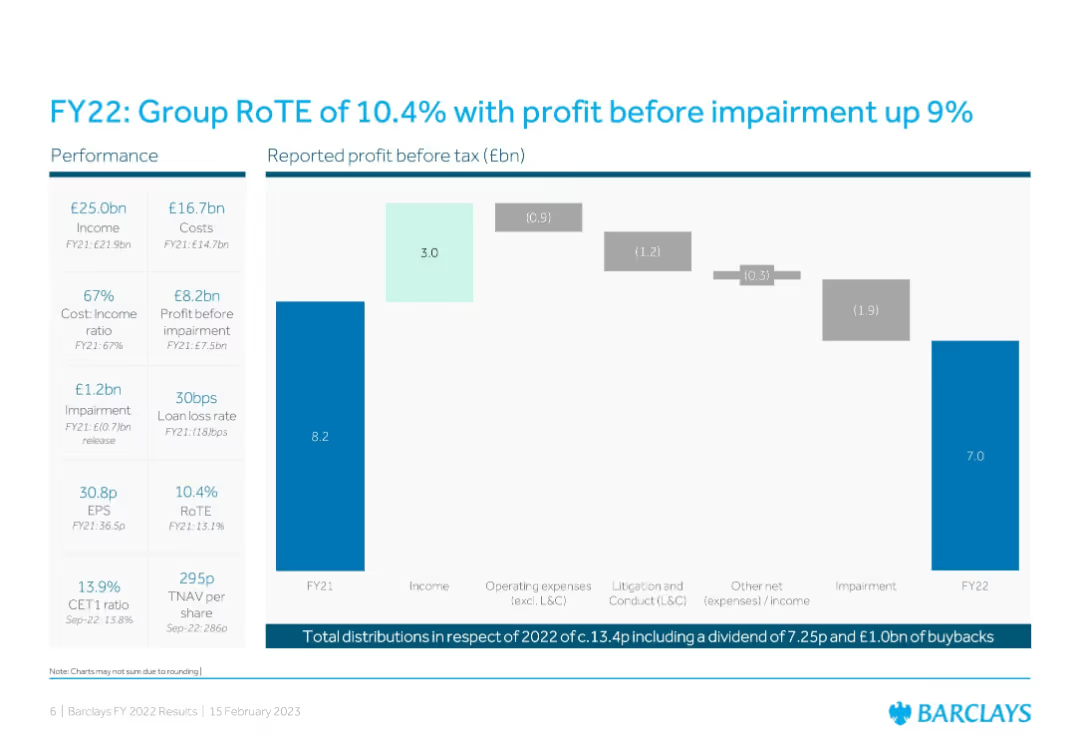
The slide features a column chart showing profit before tax, with key financial metrics listed alongside. The design is straightforward with blue tones.
Financial Performance
Financial Services
The slide provides an overview of Barclays' FY22 financial performance, highlighting a 10.4% RoTE and a 9% increase in profit before impairment.
RoTE, profit, financial performance, Barclays, FY22
false
Financial Performance
Financial Services
Mixed Chart
Barclays
Add to my slides
Remove from favorites
Bar chart + waterfall chart showing profit flow; left column of key performance metrics
Financial Performance
Financial Services
Summarizes Barclays’ FY22 performance with key metrics like income, costs, impairment, and RoTE. A waterfall chart outlines profit drivers and detractors from FY21 to FY22, providing transparency in financial movements.
RoTE, Profit, FY22, Barclays, Impairment, Earnings, EPS, Cost Ratio, Loan Loss
false
Financial Performance
Financial Services
Single Chart
Barclays
Add to my slides
Remove from favorites
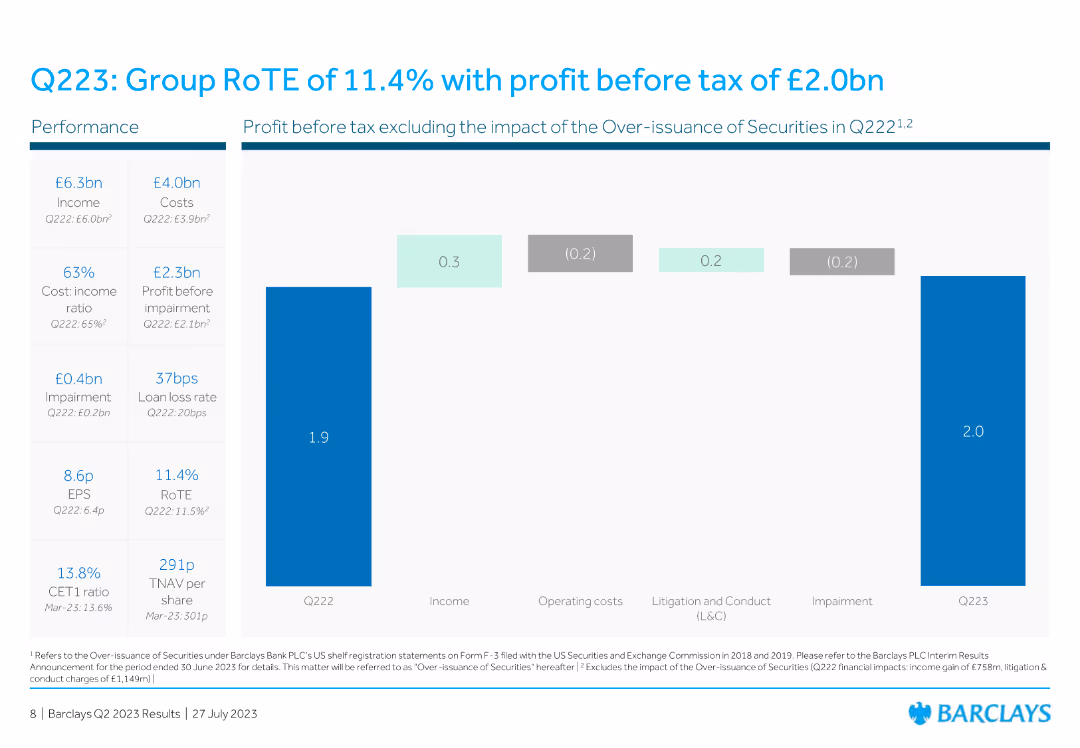
This slide has a column chart detailing profit before tax, including elements like income, costs, and impairment impacts over time.
Financial Performance
Financial Services
The slide highlights the Group RoTE and profit before tax, excluding specific impacts, and provides performance metrics for Q223.
RoTE, profit, tax, performance, financial, metrics, column chart, vertical bar, Q223, income
false
Financial Performance
Financial Services
Mixed Chart
Barclays
Add to my slides
Remove from favorites
The slide includes a complex column chart displaying the impact of various factors on statutory return on tangible equity (RoTE) projections from 2023 to 2026.
Financial Performance
Financial Services
This detailed slide projects the statutory RoTE increasing to above 12% by 2026, breaking down the contributions by income, costs, impairments, and other factors. It provides a comprehensive financial outlook, essential for stakeholders interested in the fiscal strategies and health of the organization.
RoTE, Projections, Financial Strategy, Growth
false
Financial Performance
Financial Services
Single Chart
Barclays
Add to my slides
Remove from favorites
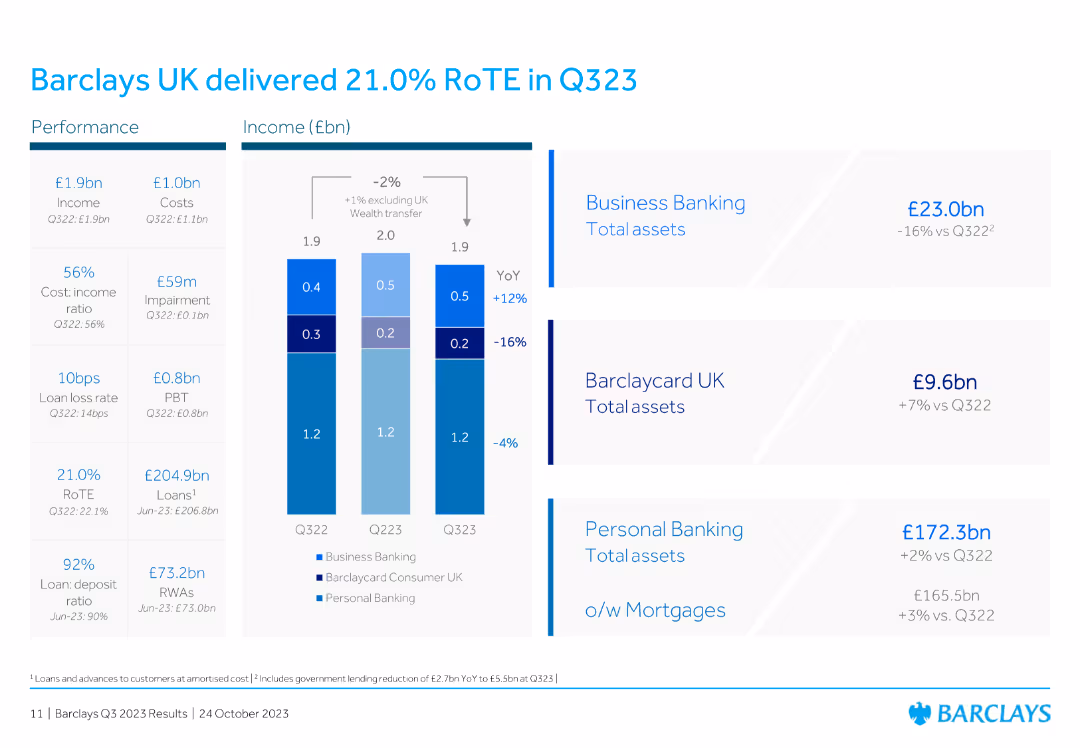
The slide features a column chart showing income (£bn) and financial performance metrics for Barclays UK from Q322 to Q323. It includes performance indicators for business banking, Barclaycard UK, and personal banking.
Financial Performance
Financial Services
The slide highlights Barclays UK's financial performance for Q323, reporting a RoTE of 21.0%. It includes metrics for income, costs, impairment, and performance indicators for business banking, Barclaycard UK, and personal banking.
RoTE, Q323, Barclays UK, performance, metrics
false
Financial Performance
Financial Services
Mixed Chart
Barclays
Add to my slides
Remove from favorites
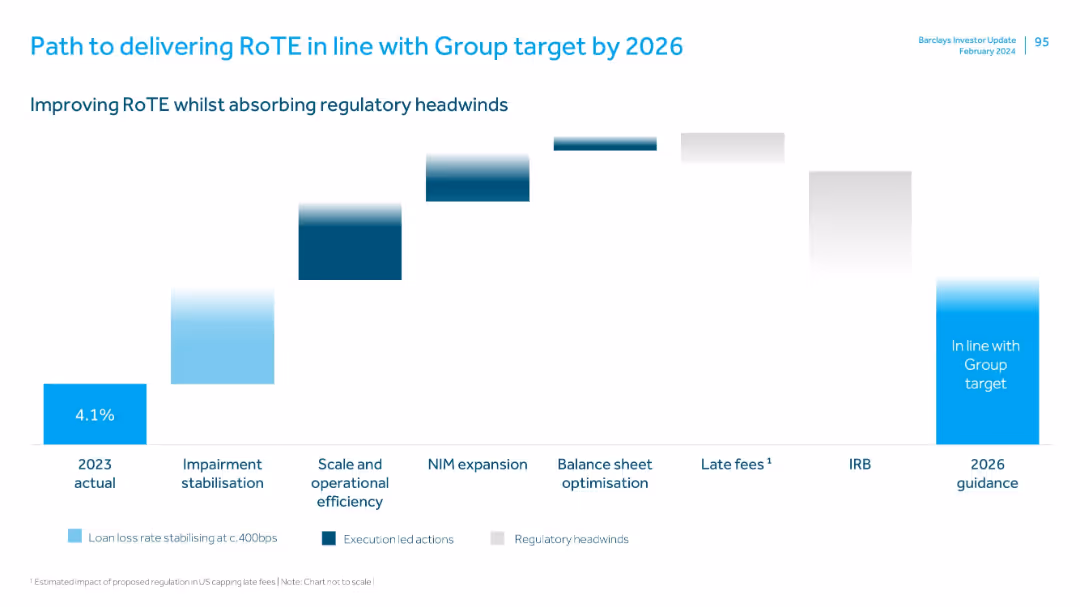
Waterfall chart format with stages marked below, each bar showing incremental impact; uses colors to differentiate action types.
Strategic Planning
Financial Services
Outlines Barclays’ roadmap for improving RoTE to meet Group targets by 2026. Includes execution strategies like impairment stabilization, operational efficiency, NIM expansion, and offsetting regulatory headwinds such as IRB changes and capped late fees.
RoTE, regulatory impact, operational efficiency, NIM, impairment, late fees, IRB, roadmap
false
Strategic Planning
Financial Services
Single Chart
Barclays
Add to my slides
Remove from favorites
Two-part layout: strategic goals on the left, and a stacked bar chart for RoTE breakdown on the right. Uses arrows and gradients to show contributions of cost, provision, and revenue to RoTE.
Performance Metrics and KPIs
Financial Services
Deutsche Bank outlines its strategy to achieve >10% Return on Tangible Equity by 2025 through revenue growth, operational efficiencies, and risk-weighted asset reductions. The slide details how these elements cumulatively impact RoTE, with specific gains and offsets labeled clearly in the bar chart.
RoTE, return on equity, operating leverage, strategy, efficiencies, KPIs, 2025 target
false
Performance Metrics and KPIs
Financial Services
Mixed Chart
Deutsche Bank
Add to my slides
Remove from favorites
This slide features a series of column charts and pathway graphics detailing the strategy to align RoTE with the group target by 2026. The colors used are shades of blue and grey, signifying different aspects like 'loan loss rate stabilization' and 'late fees'. The design is clear with each section distinctly marked for focus.
Strategic Planning
Financial Services
Outlines Barclays' strategic actions towards achieving a RoTE in line with the group target by 2026, highlighting areas such as scale and operational efficiency, and balance sheet optimization.
RoTE, strategic plan, operational efficiency, balance sheet, 2026
false
Strategic Planning
Financial Services
Single Chart
Barclays
Add to my slides
Remove from favorites
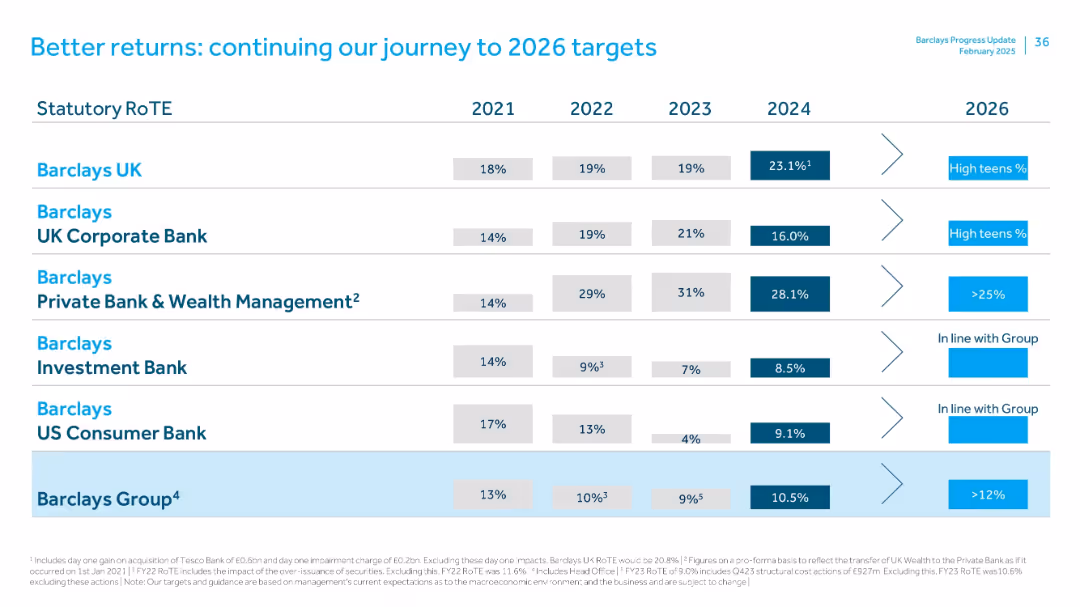
Table comparing RoTE by Barclays divisions from 2021–2024 with 2026 targets. Uses horizontal alignment with industry-specific goals and strategy callouts.
Strategic Planning
Financial Services
Lays out RoTE performance and 2026 targets across Barclays’ divisions. Barclays UK shows strong 2024 gains (23.1%), while Investment Bank and US Consumer Bank show modest improvements. Group target RoTE is >12% by 2026.
RoTE, targets, strategy, Barclays UK, investment bank, 2026 outlook
false
Strategic Planning
Financial Services
Single Chart
Barclays
Add to my slides
Remove from favorites
Grid layout with grey and blue text boxes; metrics shown in columns by year for 2021–2023.
Financial Performance
Financial Services
Displays Barclays UK's key financial metrics over three years, including RoTE, income, cost ratios, loan loss rate, and deposit ratios. It shows steady income growth and operational efficiency improvements.
RoTE, total income, cost ratio, loan loss, deposits, trends, Barclays
false
Financial Performance
Financial Services
Single Chart
Barclays
Add to my slides
Remove from favorites
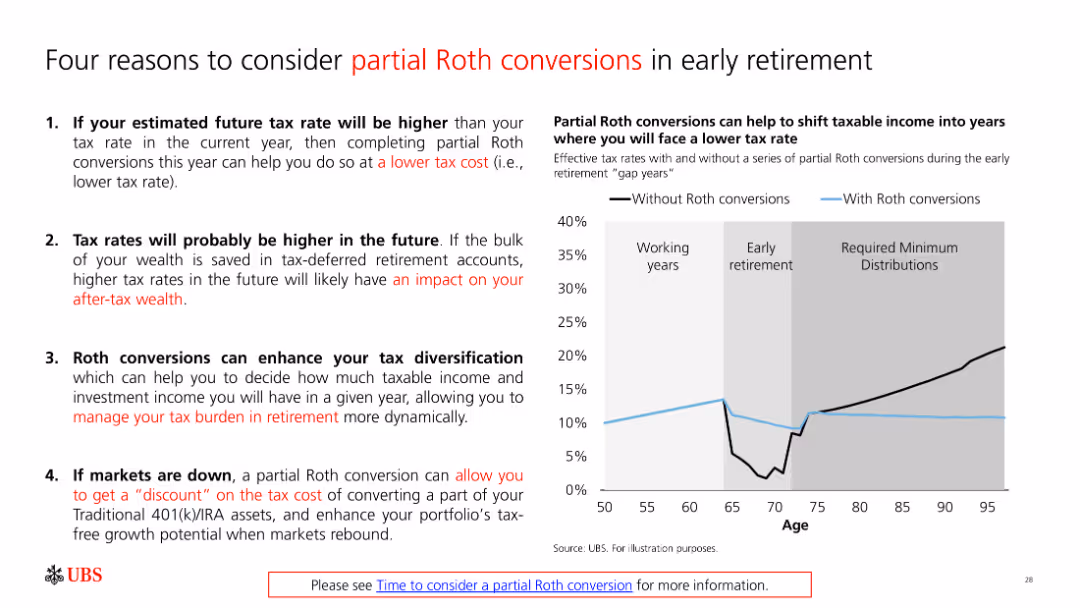
A slide with bullet points and a graph explaining reasons to consider partial Roth conversions in early retirement. The graph compares tax rates with and without conversions.
Financial Performance
Financial Services
The slide discusses the benefits of partial Roth conversions for tax management in retirement, supported by a graph illustrating the impact on tax rates.
Roth conversion, tax planning, retirement strategy, financial management, tax diversification
false
Financial Performance
Financial Services
Mixed Chart
UBS
Add to my slides
Remove from favorites
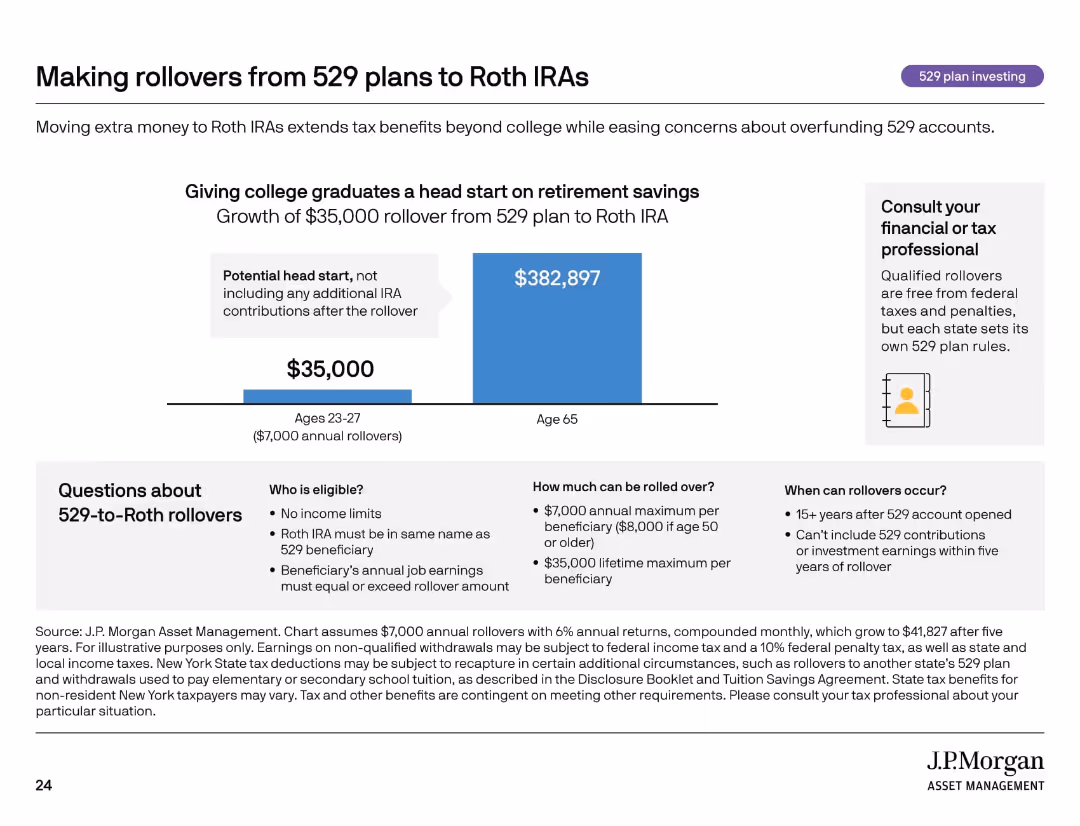
Bar chart showing long-term IRA growth; callout and Q&A section about rules and eligibility.
Investment Analysis
Financial Services
The slide explains how rolling over unused 529 plan funds into Roth IRAs can provide long-term retirement benefits. It includes rules about timing, eligibility, and contribution limits, and illustrates how a $35,000 rollover can grow significantly. Encourages consultation with tax professionals.
Roth IRA, 529 rollover, retirement, tax benefits, investment growth
false
Investment Analysis
Financial Services
Mixed Chart
JP Morgan
Add to my slides
Remove from favorites
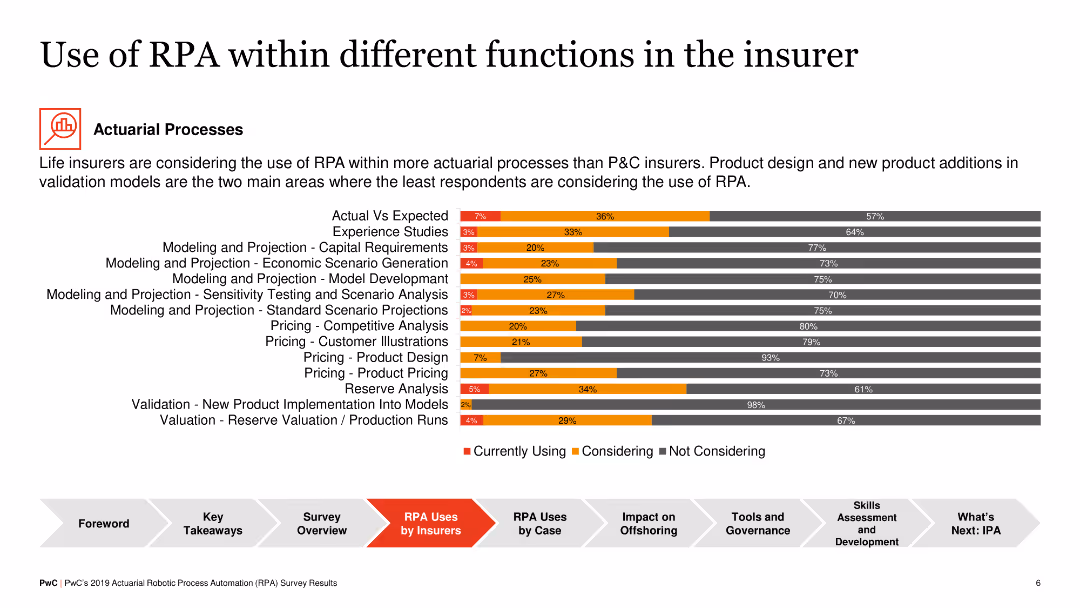
This slide includes a bar chart showing the use of RPA within different actuarial processes in insurers, including experience studies, capital requirements, economic scenario generation, and various pricing models.
Technology and Digital Transformation
Financial Services
The slide provides detailed insight into how life insurers are integrating RPA into actuarial processes, with specific focus on areas like product design and model validation, and the level of adoption across these functions.
RPA, actuarial, insurers, bar chart, adoption
false
Technology and Digital Transformation
Financial Services
Single Chart
PwC/Strategy&
Add to my slides
Remove from favorites
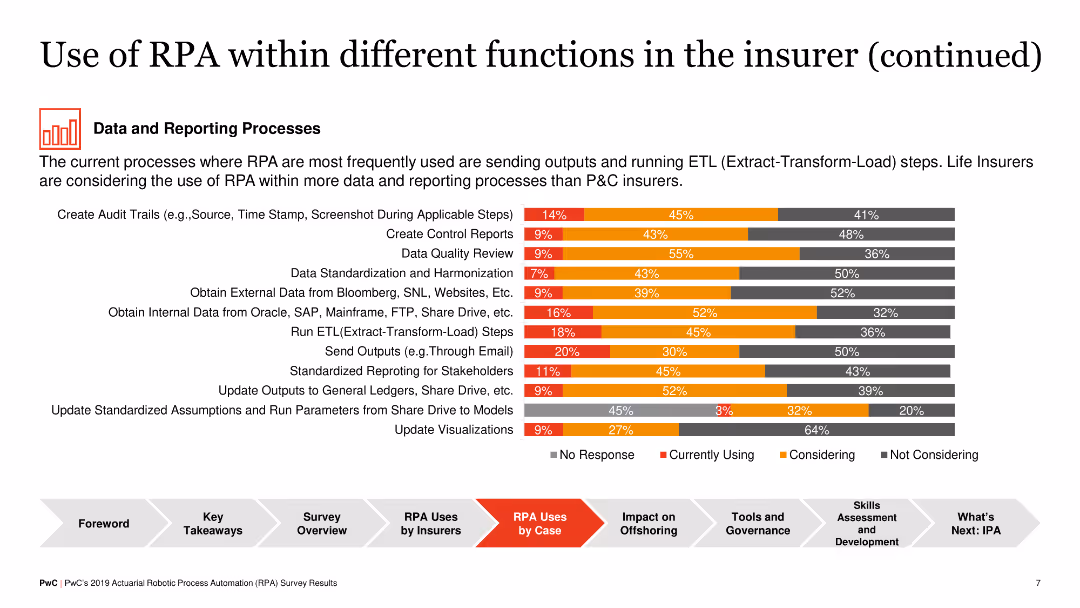
A detailed horizontal bar chart showing various processes within Data and Reporting, highlighting levels of RPA adoption (No Response, Currently Using, Considering, Not Considering).
Operational Efficiency
Financial Services
The slide showcases RPA usage in data and reporting processes within insurance, identifying which steps are most automated. Life insurers use RPA for ETL processes more than P&C insurers, highlighting areas like audit trails, data harmonization, and visual updates.
RPA, Data Reporting, Insurance, ETL, Automation
false
Operational Efficiency
Financial Services
Single Chart
PwC/Strategy&
Add to my slides
Remove from favorites
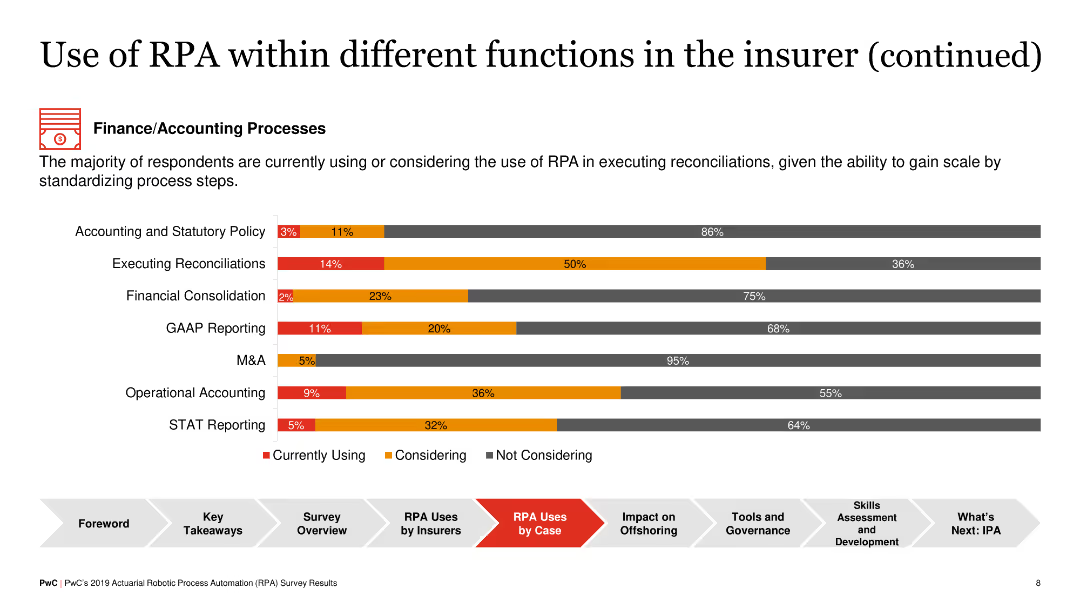
Another horizontal bar chart presenting RPA adoption in finance/accounting processes such as reconciliations, GAAP reporting, and STAT reporting, with levels indicated by colors.
Operational Efficiency
Financial Services
The slide outlines RPA usage in finance and accounting within insurance, showing that tasks like reconciliations and GAAP reporting are increasingly automated, providing efficiencies and standardization benefits.
RPA, Finance, Accounting, Insurance, Reconciliation
false
Operational Efficiency
Financial Services
Single Chart
PwC/Strategy&
Add to my slides
Remove from favorites
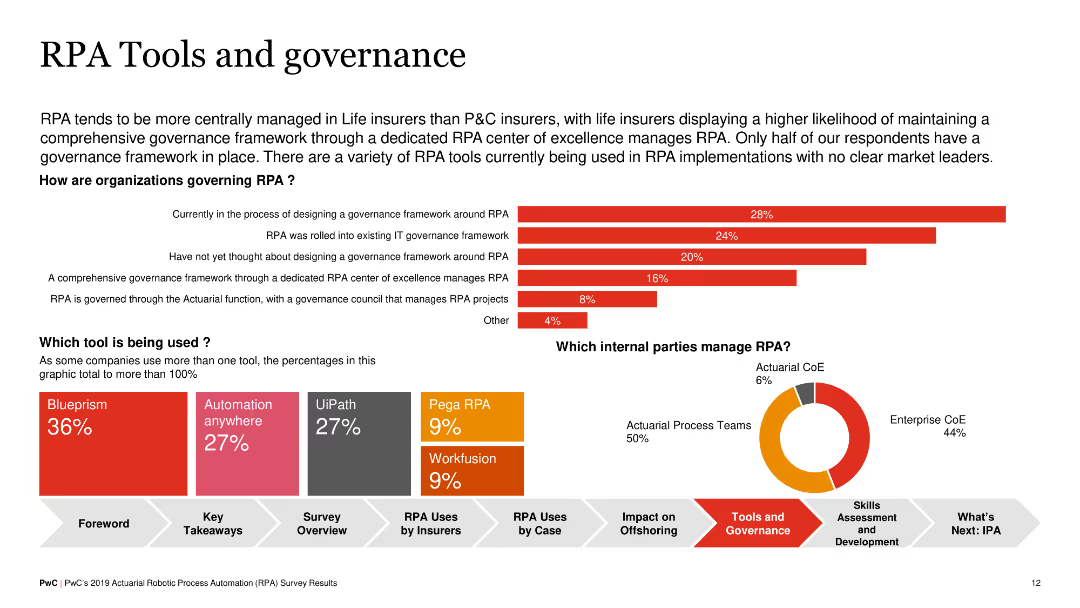
Combination of horizontal bar chart showing how organizations govern RPA and a pie chart of tools used (e.g., Blueprism, UiPath). Also includes a text box detailing the comprehensive governance frameworks in life insurers.
Operational Efficiency
Financial Services
This slide details the governance of RPA implementations in insurance, noting that life insurers often have dedicated RPA centers of excellence, and highlights popular RPA tools and their adoption rates among organizations.
RPA, Governance, Tools, Insurance, Blueprism
false
Operational Efficiency
Financial Services
Multiple Chart
PwC/Strategy&
Add to my slides
Remove from favorites
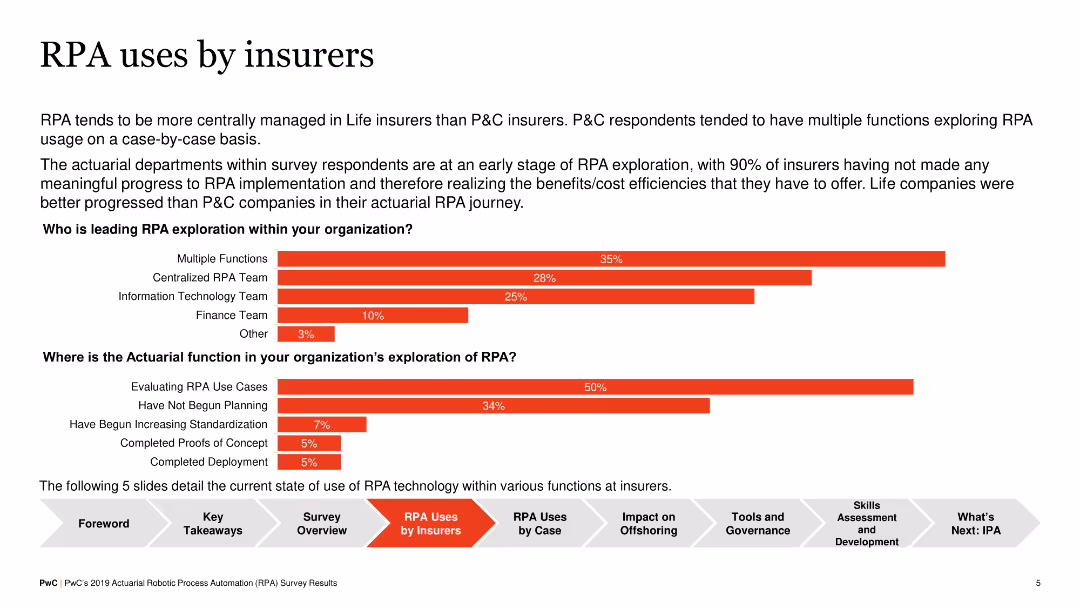
The slide contains a bar chart detailing RPA uses in insurers, showing the roles of various departments such as multiple functions, centralized RPA team, IT, finance, and other in RPA exploration.
Technology and Digital Transformation
Financial Services
The slide describes the current state of RPA adoption in the insurance industry, highlighting that life insurers manage RPA centrally and have made more progress in implementation compared to P&C insurers.
RPA, insurers, bar chart, exploration, adoption
false
Technology and Digital Transformation
Financial Services
Multiple Chart
PwC/Strategy&
Add to my slides
Remove from favorites
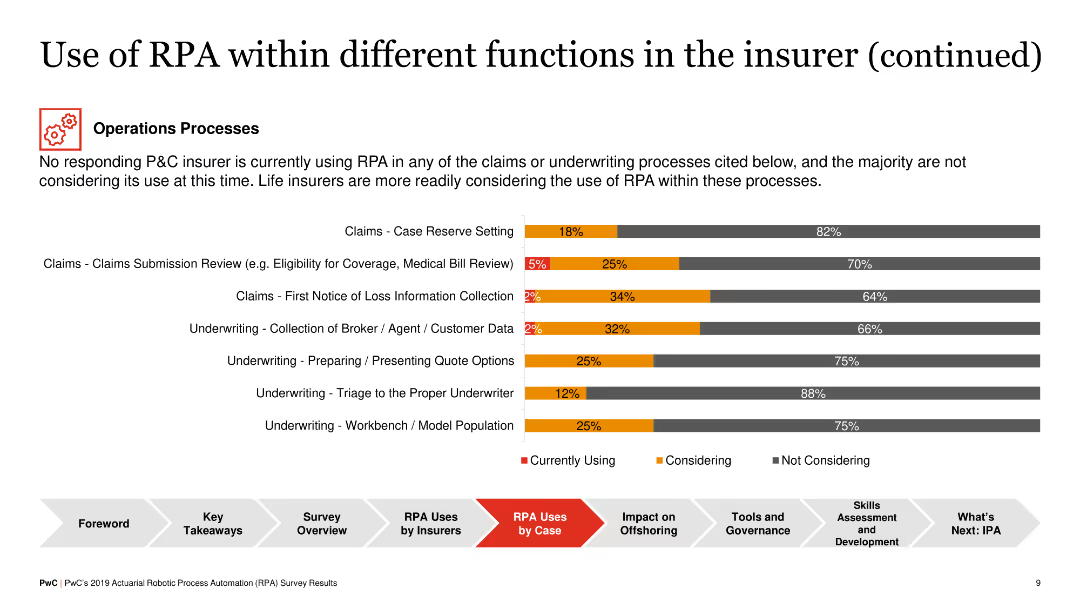
Horizontal bar chart illustrating RPA adoption in operations processes such as claims processing and underwriting, showing different levels of adoption across functions.
Operational Efficiency
Financial Services
This slide highlights the RPA adoption in operational processes within insurance, particularly in claims and underwriting, with life insurers showing more readiness to adopt RPA compared to P&C insurers.
RPA, Operations, Insurance, Claims, Underwriting
false
Operational Efficiency
Financial Services
Single Chart
PwC/Strategy&
Add to my slides
Remove from favorites
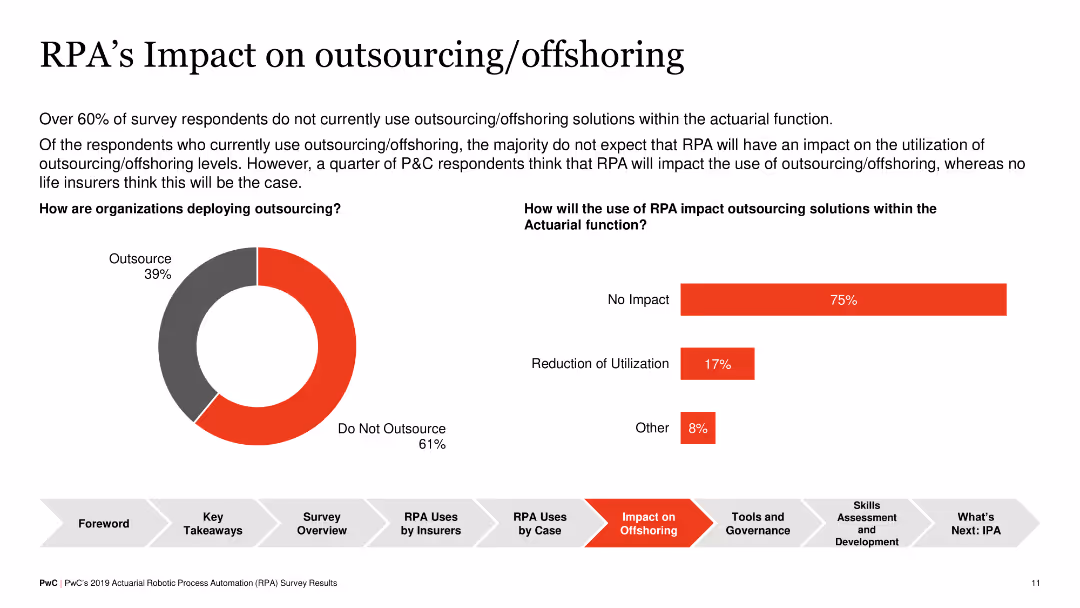
Combination of a pie chart showing the percentage of organizations outsourcing versus not outsourcing, and a horizontal bar chart indicating RPA's impact on outsourcing within actuarial functions (No Impact, Reduction, Other).
Operational Efficiency
Financial Services
The slide examines how RPA affects outsourcing and offshoring in actuarial functions, showing a significant percentage of organizations do not outsource, and those who do don't expect RPA to change their outsourcing levels significantly.
RPA, Outsourcing, Offshoring, Actuarial, Impact
false
Operational Efficiency
Financial Services
Multiple Chart
PwC/Strategy&
Add to my slides
Remove from favorites
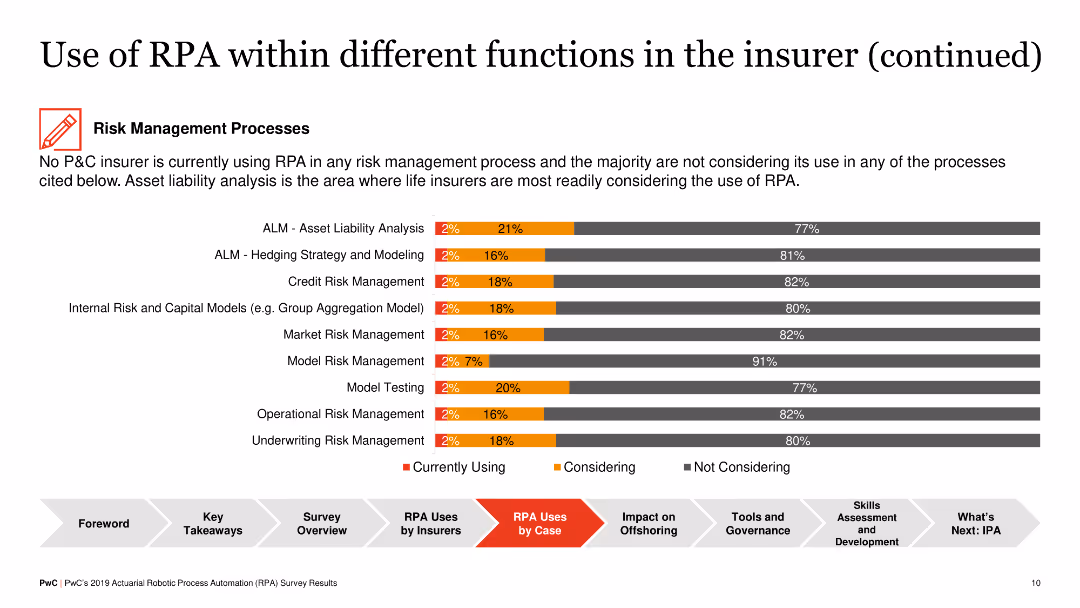
Horizontal bar chart depicting RPA usage in risk management processes including asset liability analysis, hedging strategy, and credit risk management.
Risk Assessment and Management
Financial Services
The slide presents the current and potential use of RPA in risk management for insurers, with a focus on life insurers who consider RPA for asset liability and hedging strategies, indicating potential efficiencies and strategic benefits.
RPA, Risk Management, Insurance, Asset Liability
false
Risk Assessment and Management
Financial Services
Single Chart
PwC/Strategy&
Add to my slides
Remove from favorites
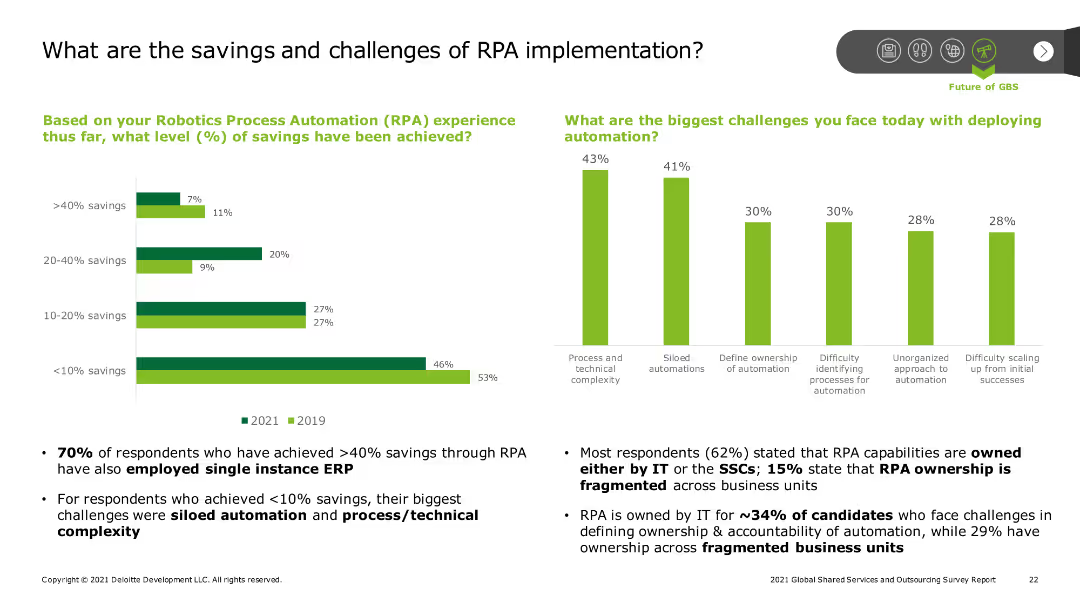
The slide presents a bar chart comparing savings levels from RPA in 2019 and 2021, alongside a column chart showing the biggest challenges in deploying automation, such as process complexity and siloed automations. Text provides further insights.
Technology and Digital Transformation
Professional Services
The slide discusses the savings achieved and challenges faced with RPA implementation, highlighting the varying levels of savings and common challenges such as technical complexity and ownership issues.
RPA, savings, challenges, automation, technical complexity
false
Technology and Digital Transformation
Professional Services
Multiple Chart
Deloitte
Add to my slides
Remove from favorites
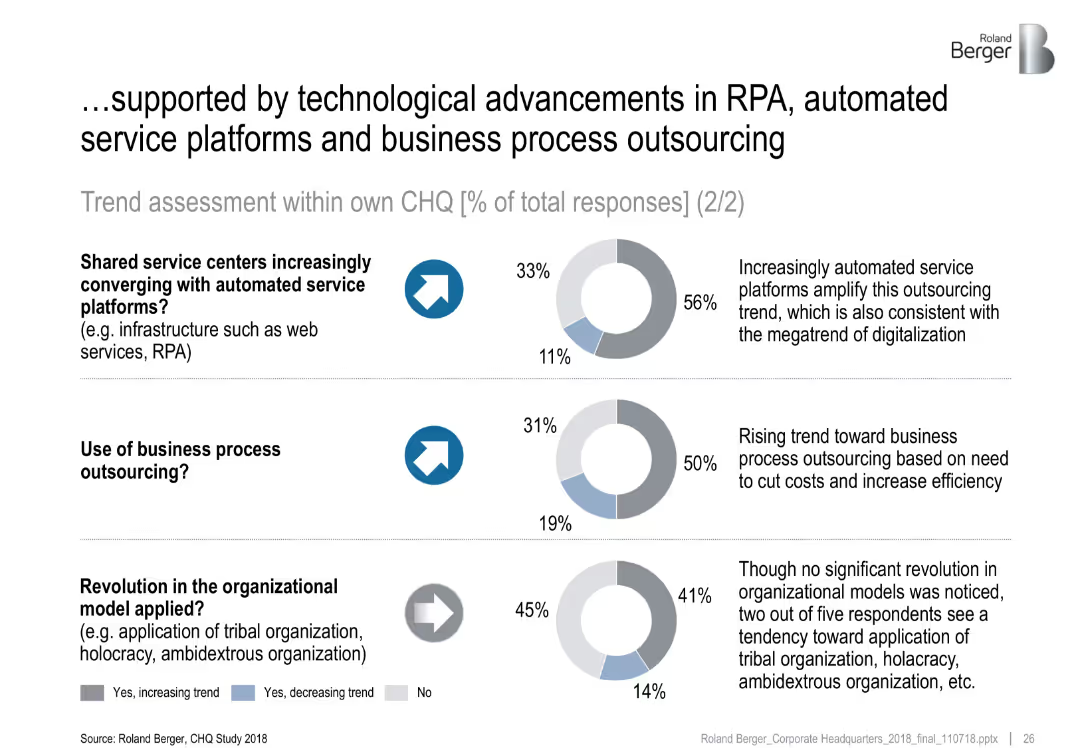
Three horizontal sections, each with donut charts showing trend data. Icons and arrows indicate direction of trend. Right-side annotations provide interpretation of each trend.
Technology and Digital Transformation
Professional Services
This slide presents data from a CHQ study highlighting how technological advancements—especially in RPA and automated platforms—are driving convergence in shared services, increasing outsourcing, and influencing organizational models. Most respondents observe growing trends in shared services and BPO.
RPA, shared services, business process outsourcing, automation, digitalization, CHQ, trend analysis, organizational models
false
Technology and Digital Transformation
Professional Services
Multiple Chart
Roland Berger
Add to my slides
Remove from favorites
Includes bar charts and a pie chart detailing the adoption of robotic process automation (RPA) within shared services. The layout integrates text and charts smoothly.
Technology and Digital Transformation
Technology & Software
Examines the adoption rates and anticipated benefits of robotic process automation in shared services, highlighting potential savings and operational impacts. This slide is key for discussions on technological advancements in service delivery.
RPA, shared services, technology adoption, operational efficiency, cost savings
false
Technology and Digital Transformation
Technology & Software
Multiple Chart
Deloitte
Add to my slides
Remove from favorites
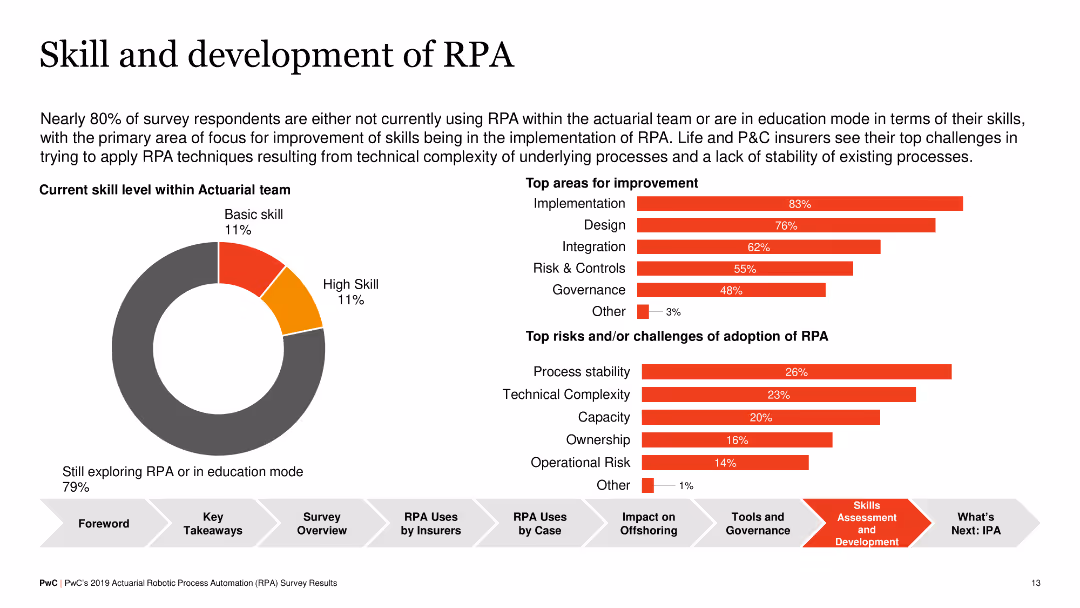
Pie chart showing skill levels within actuarial teams, and horizontal bar charts indicating top areas for improvement and challenges in RPA adoption (e.g., implementation, design, process stability).
Human Resources and Talent Management
Financial Services
The slide discusses the current skill levels in RPA among actuarial teams and identifies key areas for improvement, such as implementation and design, as well as challenges like process stability and technical complexity, aiming to enhance RPA adoption.
RPA, Skills Development, Insurance, Challenges
false
Human Resources and Talent Management
Financial Services
Multiple Chart
PwC/Strategy&
Add to my slides
Remove from favorites
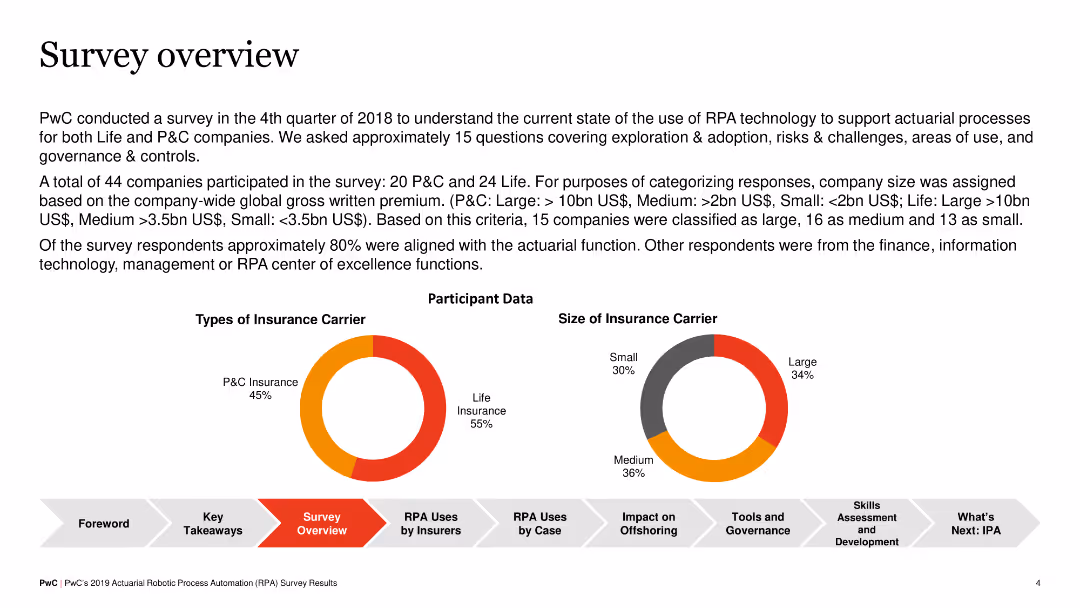
The slide summarizes the survey conducted by PwC on RPA adoption in insurance companies, including participant data on types of insurance carriers and the size of insurance carriers. It features pie charts and key data points.
Market Analysis and Trends
Financial Services
The slide provides an overview of a survey on RPA adoption, detailing the types and sizes of participating insurance carriers. It indicates that a majority of participants were from the actuarial function, with a split between P&C and life insurers.
RPA, survey, insurance, pie chart, overview
false
Market Analysis and Trends
Financial Services
Multiple Chart
PwC/Strategy&
Add to my slides
Remove from favorites
Horizontal segmented bar chart on right with varying levels of agreement by country; includes historical comparison columns.
Strategic Planning
Government & Public Sector
This slide measures agreement with the notion that rule-breaking leadership may be necessary for reform. At 49% globally, it's a polarizing concept with wide variation—Thailand and India show high agreement while countries like Germany show low support. The data implies a divide in how reform and leadership style are viewed globally.
rule-breaking, leadership, reform, governance, authoritarianism, Ipsos, public opinion
false
Strategic Planning
Government & Public Sector
Mixed Chart
IPSOS
Add to my slides
Remove from favorites
The slide includes two vertical column charts comparing credit and market risk RWA, and the rundown based on natural run-off profiles.
Risk Assessment and Management
Financial Services
This slide outlines the strategy for reducing non-core and legacy assets, focusing on risk-weighted assets (RWA).
rundown, non-core assets, legacy assets, RWA, credit risk
false
Risk Assessment and Management
Financial Services
Multiple Chart
UBS
Add to my slides
Remove from favorites
Column chart showing the planned rundown of risk-weighted assets over several years with a target for significant reduction.
Strategic Planning
Financial Services
Illustrates the reduction in risk-weighted assets excluding operational risk, outlining the approach for cost reduction and capital release.
rundown, risk-weighted, assets, cost, capital
false
Strategic Planning
Financial Services
Mixed Chart
UBS
Add to my slides
Remove from favorites
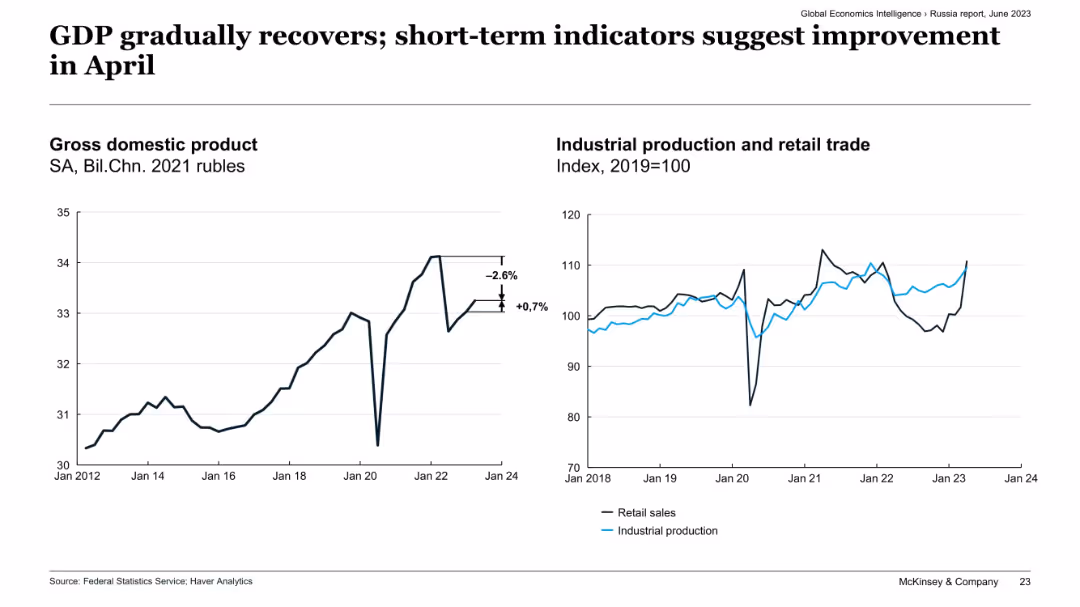
Side-by-side charts: GDP trend (left) and indexed industrial production vs. retail trade (right), Russia.
Market Analysis and Trends
Government & Public Sector
The slide shows a slight recovery in Russia's GDP and industrial output, following prior contractions. Retail sales and industrial production indicators show signs of improvement as of April, suggesting short-term economic stabilization despite previous volatility.
Russia economy, GDP recovery, industrial production, retail trade, short-term indicators, April improvement, economic stabilization
false
Market Analysis and Trends
Government & Public Sector
Multiple Chart
McKinsey
Add to my slides
Remove from favorites
The slide has two graphs side by side. On the left, a line graph depicts the GDP with a time axis from 2012 to Q1 2023, with annotations for specific points. On the right, a dual line graph shows industrial production and retail trade indices from 2018 to June 2023.
Market Analysis and Trends
Financial Services
This slide presents economic data for Russia, showing GDP trends and industrial production over time, suggesting insights into economic recovery and market conditions.
Russia, GDP, Economic Recovery, Industrial Production, Retail Trade, Market Analysis, Q1 2023, Data Trends
false
Market Analysis and Trends
Financial Services
Multiple Chart
McKinsey
Add to my slides
Remove from favorites
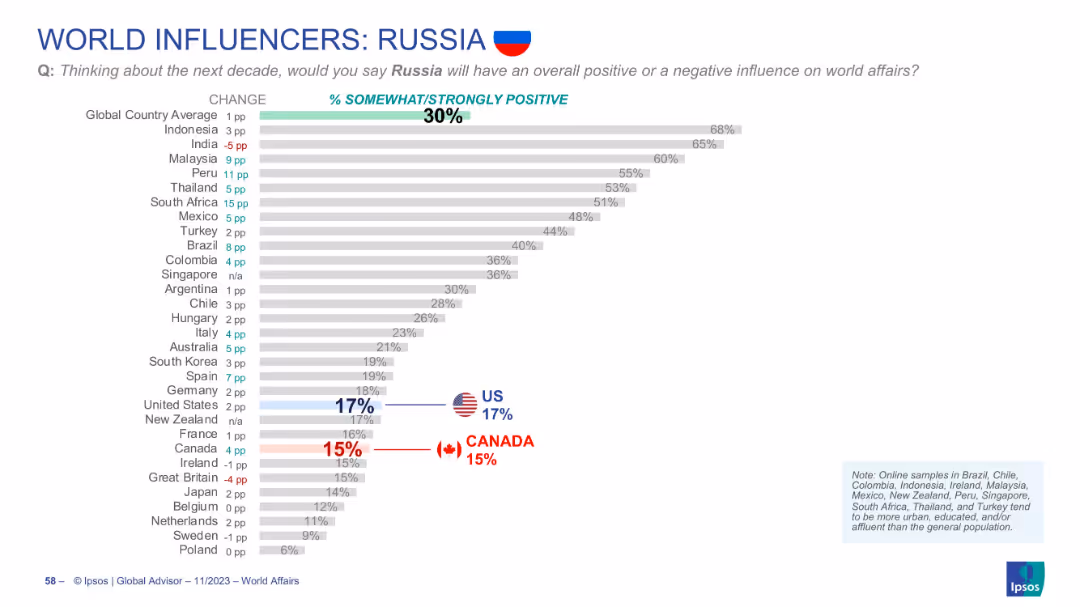
Ranked horizontal bar chart with positivity percentages for Russia, showing global and national differences; visual emphasis on US and Canada.
Market Analysis and Trends
Government & Public Sector
Global opinion on Russia's influence is low, averaging 30% positive. Indonesia shows the highest positivity (68%), while the US and Canada are below average, at 17% and 15% respectively.
Russia, global perception, soft power, country rankings, opinion poll, Ipsos, influence rating
false
Market Analysis and Trends
Government & Public Sector
Single Chart
IPSOS
Add to my slides
Remove from favorites
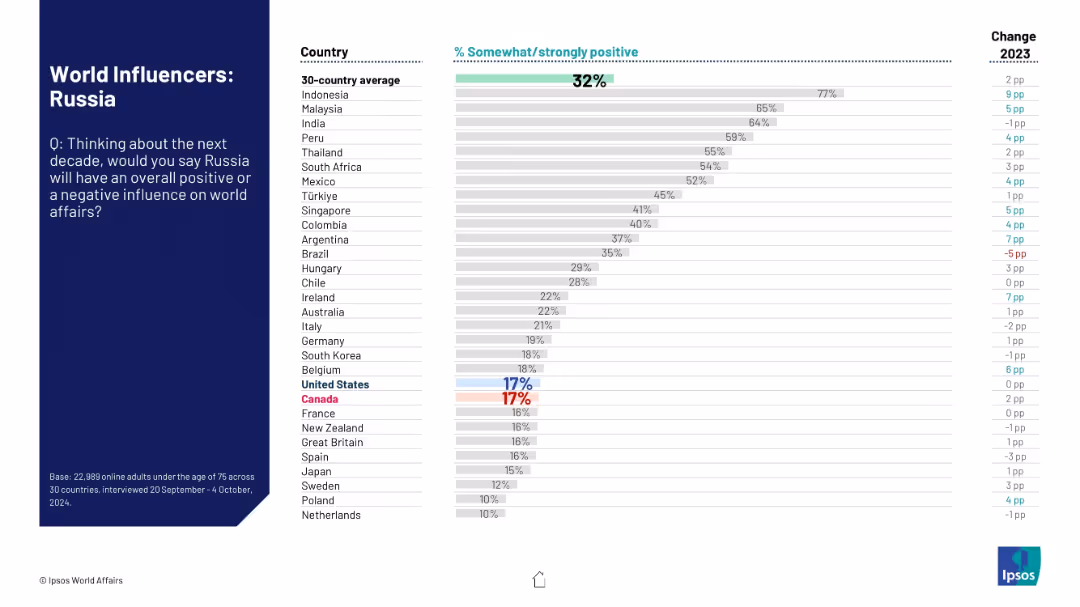
Standard design with bar chart on right and introductory context on left side.
Market Analysis and Trends
Government & Public Sector
This slide shows that Russia has the lowest perceived positive influence on global affairs among surveyed countries. Despite small upticks in some nations, overall global opinion remains highly negative.
Russia, global sentiment, geopolitical perception, Ipsos, international opinion, public influence, country ratings, trend change, 2024
false
Market Analysis and Trends
Government & Public Sector
Mixed Chart
IPSOS
Add to my slides
Remove from favorites
A column chart showing net Russian risk exposure for 4Q21 and 1Q22, with a 56% reduction. Text outlines the risk and compliance-led risk reduction actions, including trade finance limits and collateralized exposure.
Risk Assessment and Management
Financial Services
Describes the response to the Russia/Ukraine crisis, showing a significant reduction in Russian risk exposure and outlining the risk reduction actions taken by the risk and compliance teams, including cross-division support and daily focus meetings.
Russia, Ukraine, risk reduction, compliance, exposure, trade finance
false
Risk Assessment and Management
Financial Services
Mixed Chart
Credit Suisse
Add to my slides
Remove from favorites
Features a column chart depicting the deployment of risk-weighted assets (RWA) across various divisions within the bank from 2023 to 2026.
Financial Performance
Financial Services
This slide shows the strategic allocation of approximately £30 billion in risk-weighted assets across different banking divisions to bolster market presence and share, particularly focusing on competitive pricing and enhanced decision-making. Essential for understanding strategic financial allocation.
RWA, Allocation, Banking, Market Share, Strategy
false
Financial Performance
Financial Services
Mixed Chart
Barclays
Add to my slides
Remove from favorites
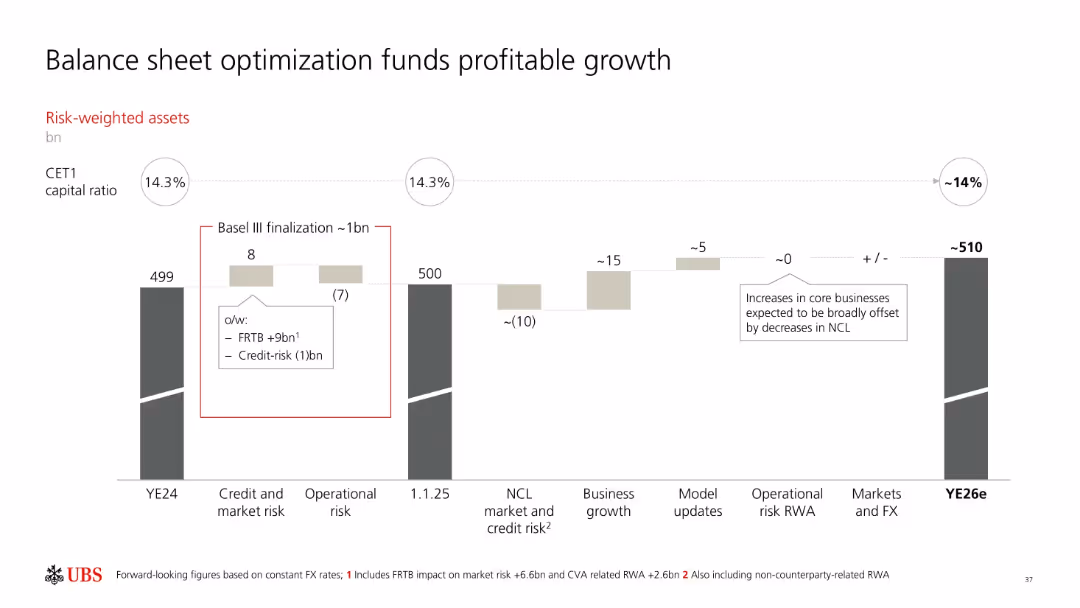
Waterfall bar chart; neutral background; horizontal timeline from YE24 to YE26e with labeled blocks.
Strategic Planning
Financial Services
The slide outlines the expected evolution of risk-weighted assets (RWA) from year-end 2024 to estimated year-end 2026, maintaining capital ratio targets. It includes Basel III impacts, credit/market risk, operational risk, and expected business growth adjustments.
RWA, Basel III, CET1, capital ratio, FX, market risk, operational risk, UBS, balance sheet, risk management
false
Strategic Planning
Financial Services
Single Chart
UBS
Add to my slides
Remove from favorites
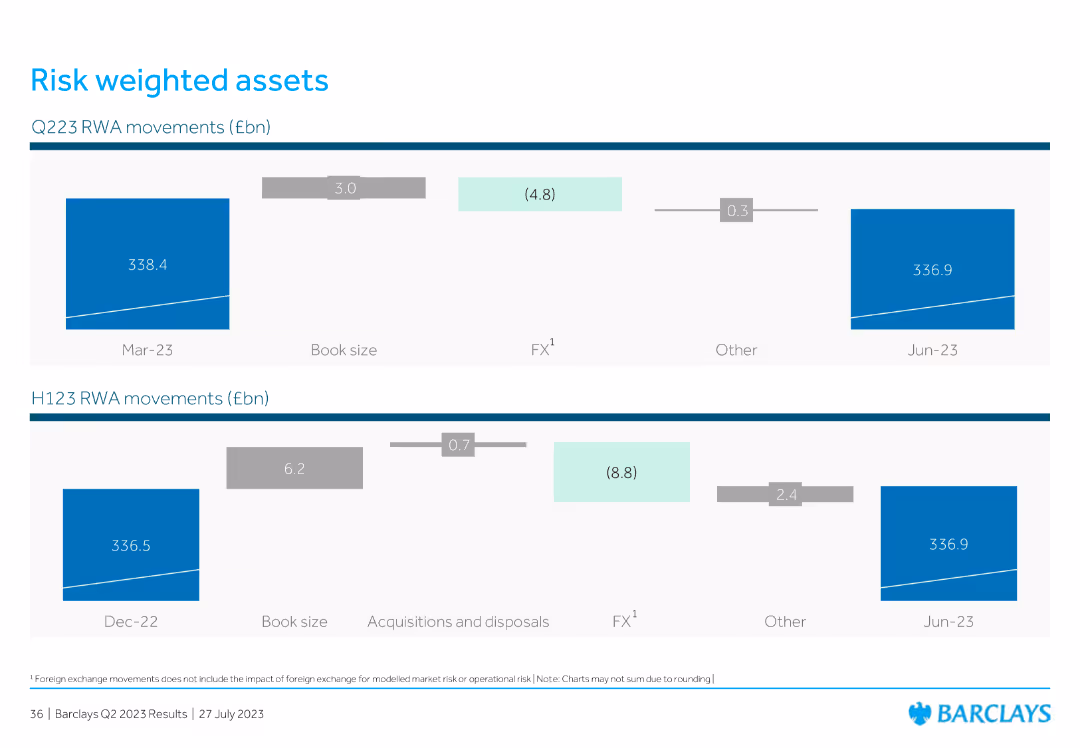
This slide features two column charts illustrating Q223 and H123 RWA (Risk Weighted Assets) movements in billion euros, showing changes in book size, FX impact, acquisitions, and other factors between periods.
Risk Assessment and Management
Financial Services
The slide highlights movements in Risk Weighted Assets for Q223 and H123, showing the factors contributing to changes in asset values such as book size, foreign exchange, and acquisitions.
RWA, book size, FX impact, acquisitions, risk management
false
Risk Assessment and Management
Financial Services
Multiple Chart
Barclays
Add to my slides
Remove from favorites
The slide includes two column charts showing RWA and leverage exposure in USD bn from 3Q15 to 3Q17, with a focus on different asset types.
Financial Performance
Financial Services
It illustrates the capital release to the Group by reducing RWA and leverage exposure, with a 70% reduction in RWA excluding operational risk.
RWA, leverage exposure, capital release, asset types, financial performance
false
Financial Performance
Financial Services
Multiple Chart
Credit Suisse
Add to my slides
Remove from favorites
The slide features two column charts showing RWA and leverage exposure in USD bn. It uses colors to differentiate risk types and asset categories.
Financial Performance
Financial Services
This slide shows the reduction of RWA and leverage exposure across the SRU portfolio from 4Q15 to 3Q16, highlighting operational and market risks.
RWA, leverage exposure, financial performance, risk types, asset categories
false
Financial Performance
Financial Services
Multiple Chart
Credit Suisse
Add to my slides
Remove from favorites
The slide has column charts showing RWA and leverage exposure outlook in USD bn from 4Q15 to 2019 targets, with color coding for risk types.
Strategic Planning
Financial Services
The slide forecasts the reduction of RWA and leverage exposure by approximately 80% by end-2019, detailing credit and market risk components.
RWA, leverage exposure, outlook, risk reduction, strategic planning
false
Strategic Planning
Financial Services
Multiple Chart
Credit Suisse
Add to my slides
Remove from favorites
The slide shows column charts depicting RWA and leverage exposure targets in USD bn from 3Q15 to 2018, with color-coded targets and actuals.
Strategic Planning
Financial Services
It confirms the reduction targets for RWA and leverage exposure by approximately 80% by end-2018, comparing original targets with actual figures.
RWA, leverage exposure, target reduction, strategic planning, financial targets
false
Strategic Planning
Financial Services
Multiple Chart
Credit Suisse
Add to my slides
Remove from favorites
The slide includes two column charts showing the reduction in RWA and leverage exposure over time, with detailed text explaining the transactions and strategies that led to these reductions.
Financial Performance
Financial Services
Presents data on the reduction of risk-weighted assets (RWA) and leverage exposure in the financial sector. The column charts illustrate the decline over specific quarters, while the text explains the transactions and strategies that contributed to this progress, highlighting the impact of these measures on financial stability.
RWA, Leverage, Financial Stability, Reduction, Strategies
false
Financial Performance
Financial Services
Multiple Chart
Credit Suisse
Add to my slides
Remove from favorites
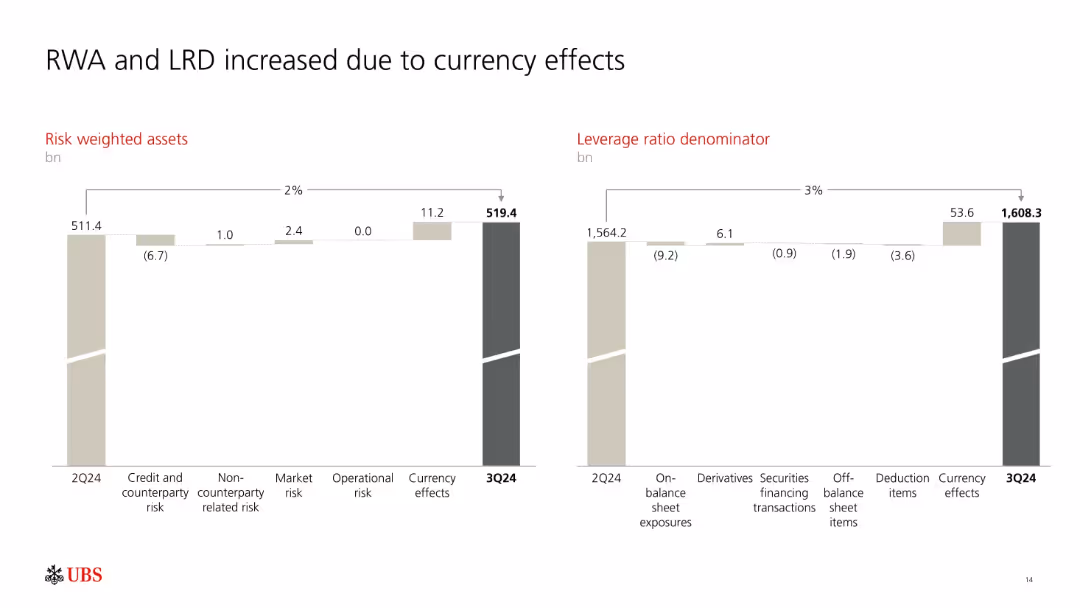
Two side-by-side waterfall charts illustrating changes in RWA and LRD from 2Q24 to 3Q24.
Risk Assessment and Management
Financial Services
Shows how UBS's Risk Weighted Assets (RWA) and Leverage Ratio Denominator (LRD) rose mainly due to currency effects. Breakdowns include operational and market risks, as well as changes in off-balance sheet and deduction items.
RWA, LRD, currency effects, risk metrics, UBS, leverage ratio
false
Risk Assessment and Management
Financial Services
Multiple Chart
UBS
Add to my slides
Remove from favorites
The slide features a column chart illustrating the decrease in RWA from 2023 to 2026, with annotations on key factors like Basel III finalization and balance sheet optimization.
Risk Assessment and Management
Financial Services
This slide presents the forecasted reduction in risk-weighted assets (RWA) due to optimization and non-core and legacy (NCL) unwind, detailing the impact of Basel III finalization.
RWA, optimization, Basel III, NCL, 2026
false
Risk Assessment and Management
Financial Services
Mixed Chart
UBS
Add to my slides
Remove from favorites
Slide with a column chart showing RWA outlook to 2026, including annotations on NCL reduction, model updates, and Basel III finalization.
Risk Assessment and Management
Financial Services
The slide projects a decrease in RWA by approximately 35 billion due to optimization and NCL unwind, with detailed breakdowns and timelines.
RWA outlook, NCL reduction, Basel III, model updates, UBS risk management
false
Risk Assessment and Management
Financial Services
Mixed Chart
UBS
Add to my slides
Remove from favorites
Slide includes line graphs and column charts illustrating RWA productivity trends and projections in Global Markets and Investment Banking sectors.
Operational Efficiency
Financial Services
Focuses on the strategic plan to enhance RWA productivity in investment banking, underlining past performance and future targets.
RWA, productivity, strategy, investment banking, projections
false
Operational Efficiency
Financial Services
Multiple Chart
Barclays
Add to my slides
Remove from favorites
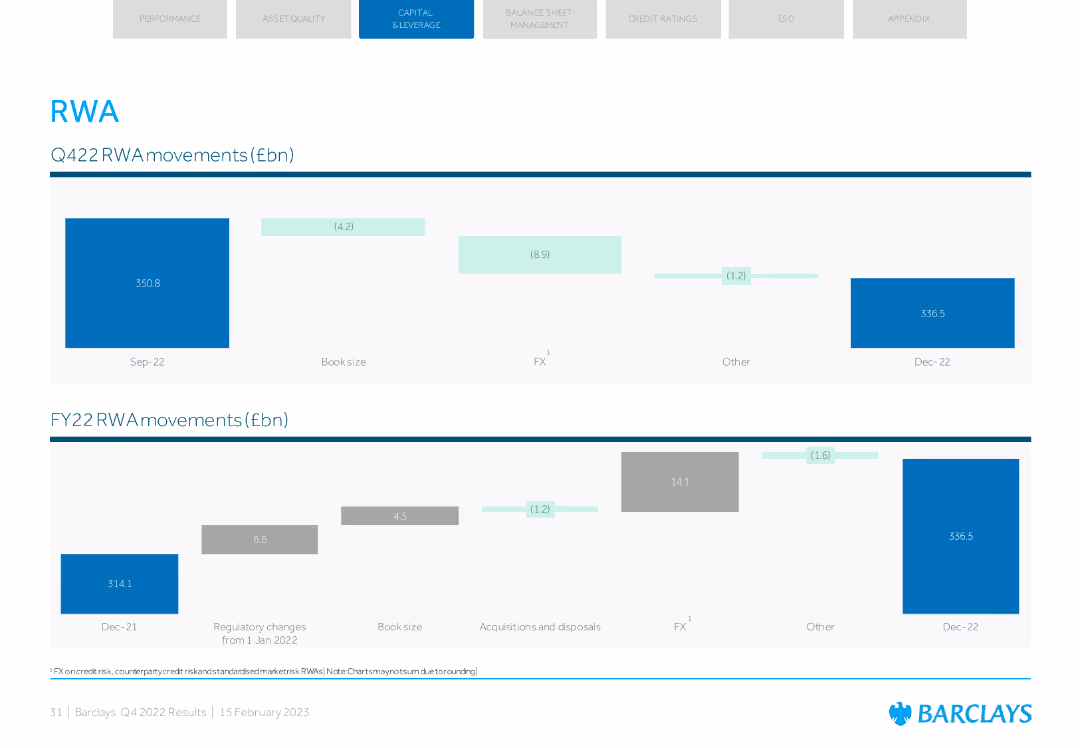
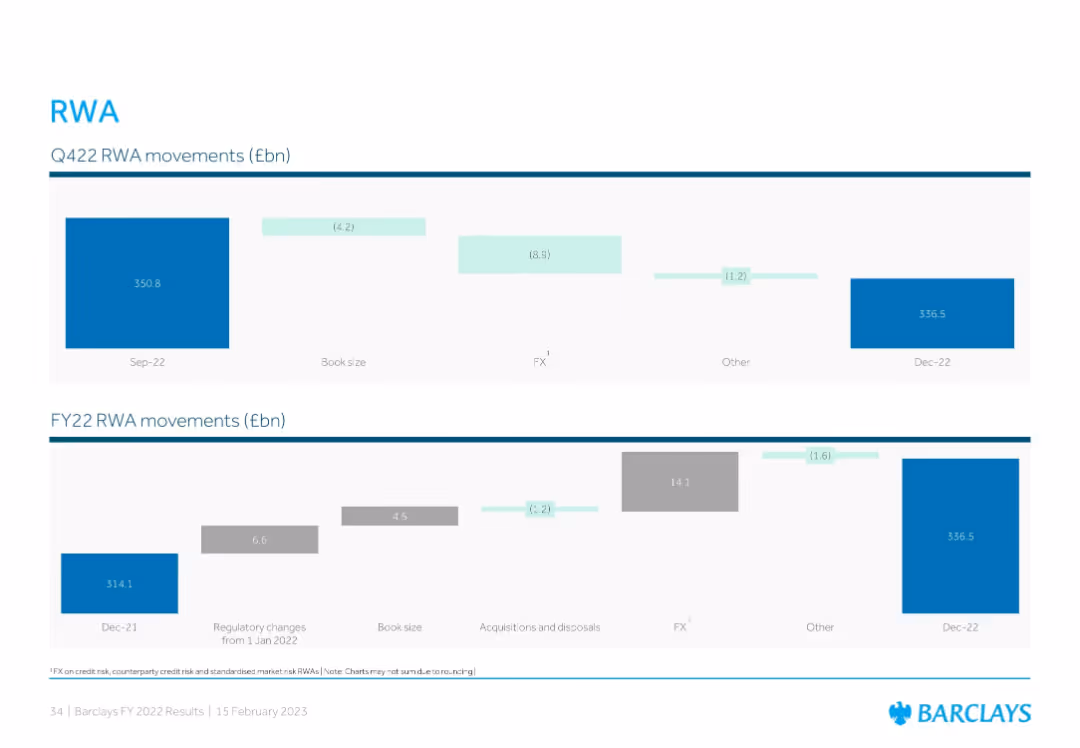
Two column charts showing RWA movements in Q4 2022 and FY 2022 with various contributing factors such as book size and FX.
Financial Performance
Financial Services
Presents the RWA movements for Q4 and FY 2022, including factors like book size, FX, and others. Useful for analyzing risk-weighted asset changes over the period.
RWA, Q4 2022, FY 2022, column chart, FX
false
Financial Performance
Financial Services
Multiple Chart
Barclays
Add to my slides
Remove from favorites
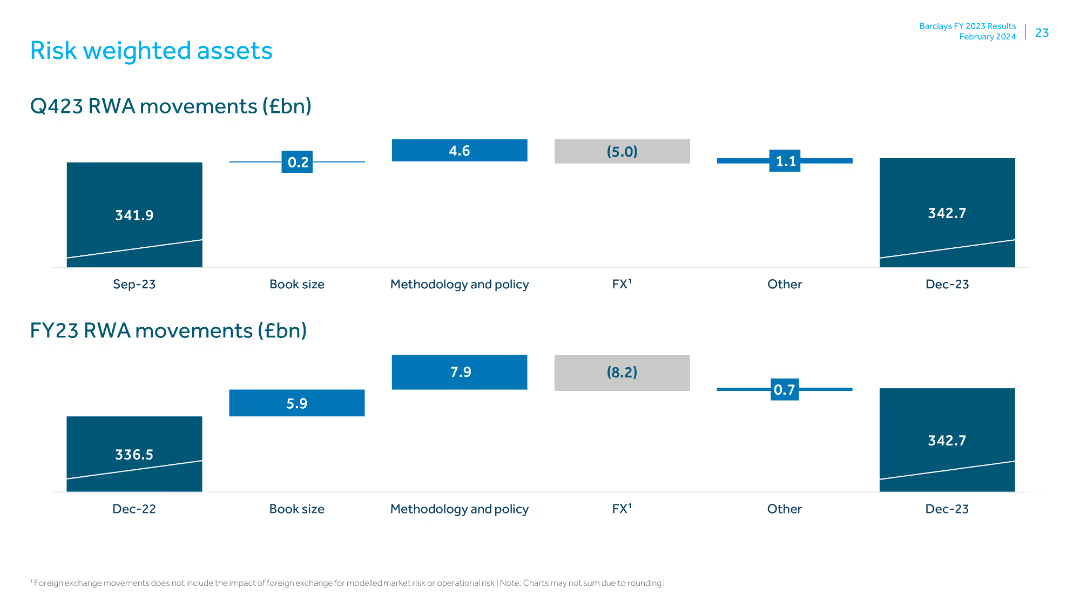
Includes column charts showing Q423 and FY23 RWA movements with detailed breakdowns for book size, methodology, policy, FX, and other factors.
Risk Assessment and Management
Financial Services
Analyzes risk-weighted asset movements for Q423 and FY23, detailing changes due to book size, policy, and other financial elements.
RWA, Q423, FY23, risk assessment, book size, methodology, policy changes, FX impact, financial movements, data presentation
false
Risk Assessment and Management
Financial Services
Multiple Chart
Barclays
Add to my slides
Remove from favorites
The slide contains blocks of text, timeline insights, and bar charts related to regulatory impacts on RWAs, particularly concerning Basel 3.1 adjustments.
Regulatory and Compliance
Financial Services
Discusses updated regulatory guidelines affecting RWA calculations, with specific future projections and impacts on the bank's financial strategies.
RWA, regulatory, Basel 3.1, projections, guidelines
false
Regulatory and Compliance
Financial Services
Mixed Chart
Barclays
Add to my slides
Remove from favorites
Two waterfall charts: one showing quarterly RWA movements for Q4'22 and another showing full-year RWA movement for FY22, with color-coded segments and value annotations.
Corporate Finance and Valuation
Financial Services
The slide analyzes Barclays’ risk-weighted asset (RWA) changes for Q4 2022 and FY22. It details how book size, FX, and other factors impacted RWA from September to December 2022 and over the full fiscal year. The bank ended 2022 with RWAs at £336.5bn.
RWA, risk exposure, FX impact, Barclays, capital ratio
false
Corporate Finance and Valuation
Financial Services
Multiple Chart
Barclays
Add to my slides
Remove from favorites
Two column charts presenting RWA movements for different time frames.
Risk Assessment and Management
Financial Services
Provides a breakdown of risk-weighted assets movements and contributing factors.
RWA, risk management, financial metrics, assets, policy changes
false
Risk Assessment and Management
Financial Services
Multiple Chart
Barclays
Add to my slides
Remove from favorites
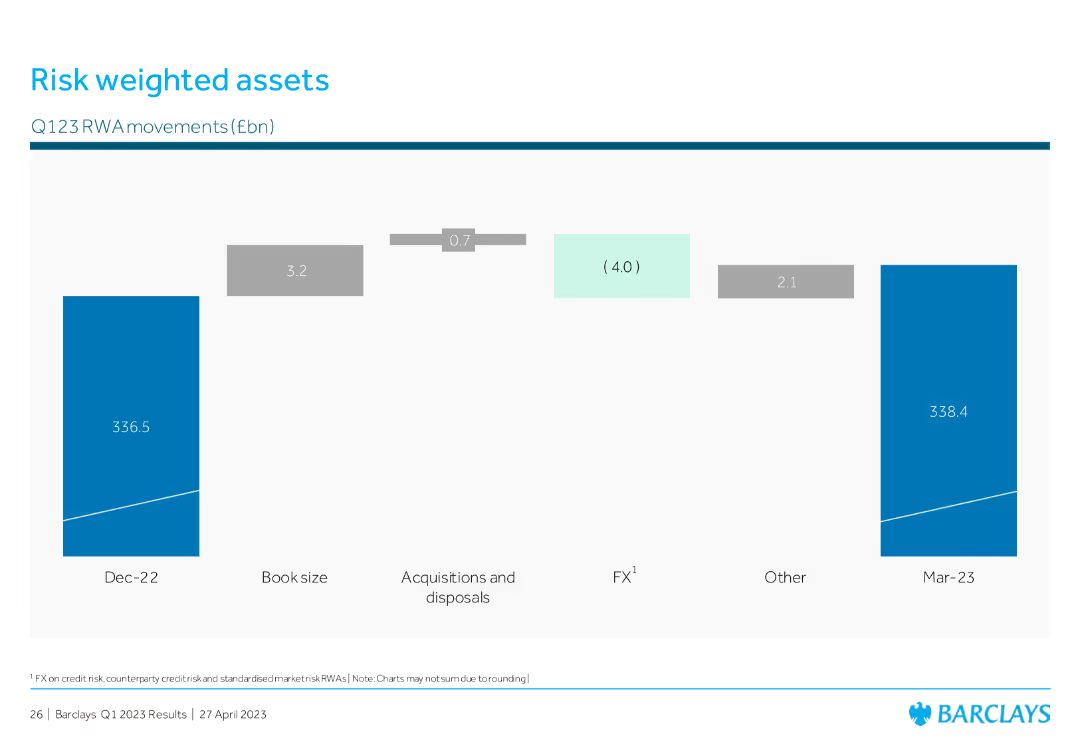
The slide features a column chart detailing Q123 RWA movements in billion euros from December 2022 to March 2023. Each section of the chart is labeled with specific changes due to various factors like book size and FX.
Risk Assessment and Management
Financial Services
This slide explains the changes in risk-weighted assets over the first quarter of 2023, highlighting factors like acquisitions, disposals, and other elements that influence the RWA.
RWA, risk management, financial metrics, Q123, FX
false
Risk Assessment and Management
Financial Services
Single Chart
Barclays
Add to my slides
Remove from favorites
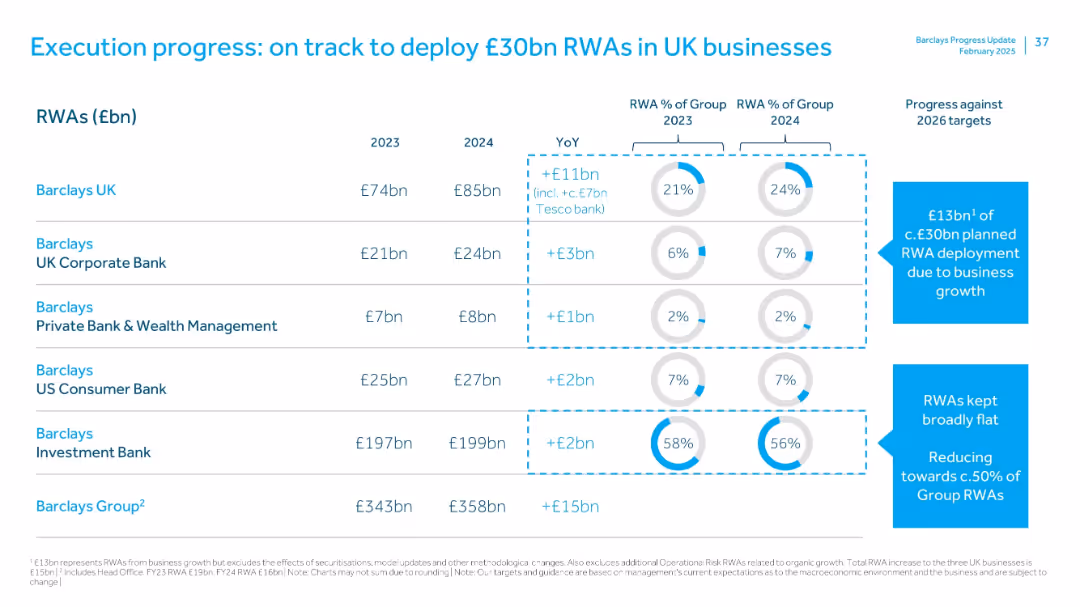
Data table listing RWA growth by Barclays business lines from 2023 to 2024, with accompanying YoY changes, group % shares, and visual callouts of key drivers.
Operational Efficiency
Financial Services
This slide shows progress in planned RWA deployment, with £13bn attributed to business growth. Barclays UK led growth with an £11bn increase. Visual cues show alignment with the 2026 strategy and aim to reduce Investment Bank’s RWA share.
RWAs, business growth, Tesco Bank, UK business, operational progress
false
Operational Efficiency
Financial Services
Mixed Chart
Barclays
Add to my slides
Remove from favorites
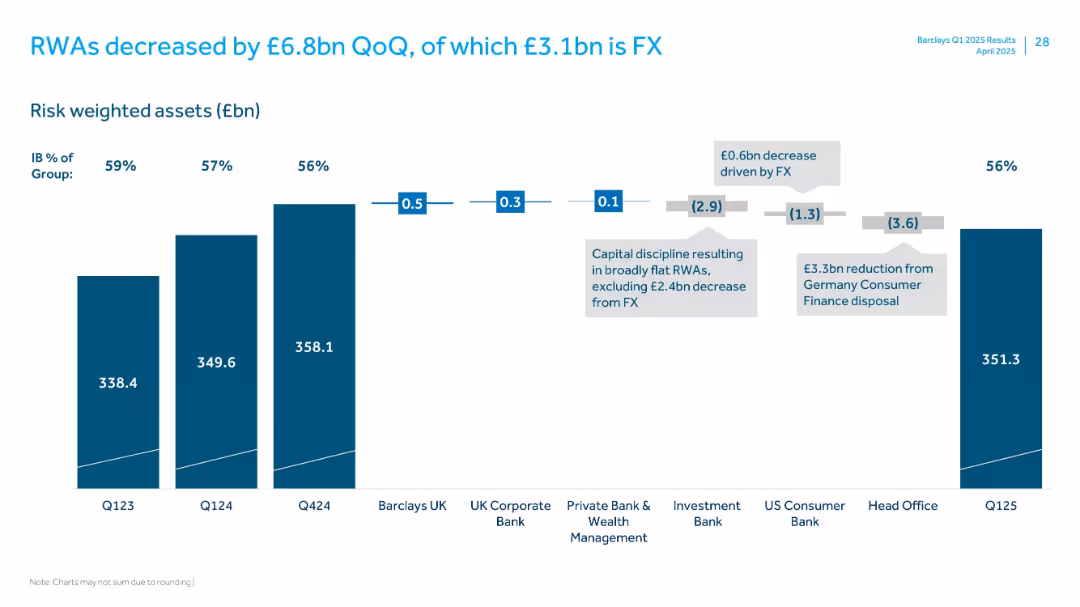
Vertical stacked bar chart with segments showing change in RWAs across divisions and FX effects
Performance Metrics and KPIs
Financial Services
Shows a £6.8bn quarter-over-quarter decrease in risk-weighted assets (RWAs), with detailed breakdowns by business units and impact from FX and the German consumer finance disposal.
RWAs, FX impact, Germany disposal, business units, Q125
false
Performance Metrics and KPIs
Financial Services
Single Chart
Barclays
Add to my slides
Remove from favorites
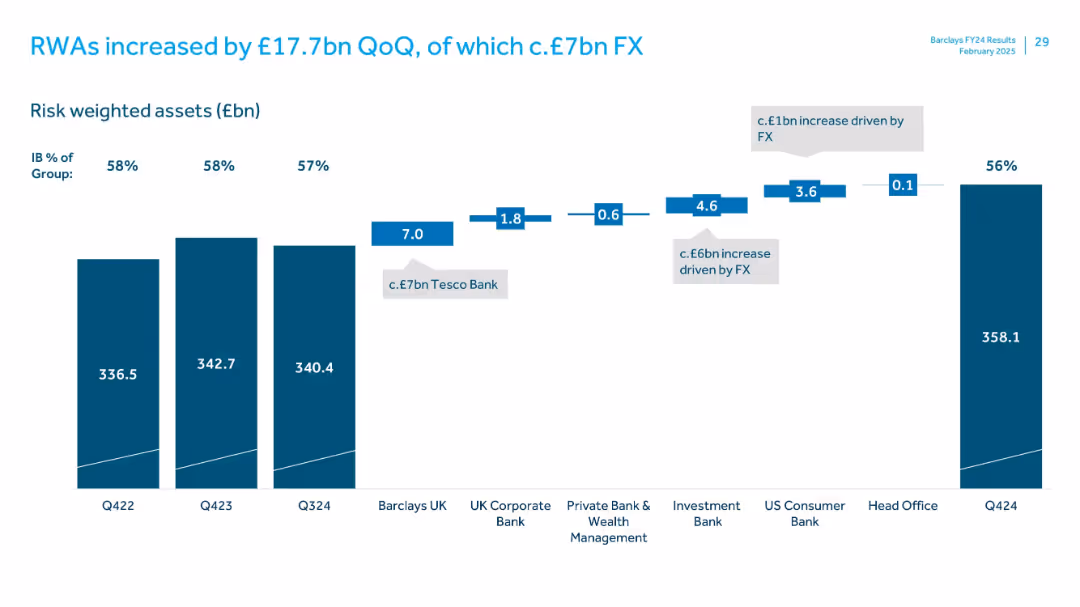
Bar chart timeline with stepwise RWA increases by business unit. Percent share of group noted above bars. Uses labeled boxes and FX callouts for visual clarity.
Risk Assessment and Management
Financial Services
Shows Q4 2024 increase in RWAs to £358.1bn, driven by Tesco Bank acquisition (£7bn) and FX impact (£6bn). Each segment of the business is shown with individual contribution. Investment Bank's share of RWAs declined slightly to 56%.
RWAs, risk weighted assets, FX, Tesco Bank, investment bank, Q4 2024
false
Risk Assessment and Management
Financial Services
Single Chart
Barclays
Add to my slides
Remove from favorites
Previous
Next
You don't have any favorites yet.
Please wait loading your favorites slides...
Create a FREE account to continue browsing
Receive Instant Access to 1,000+ slides from companies like McKinsey, Google, and Goldman Sachs
First Name
Last Name
Email
Password
I agree to all
Terms & Privacy Policy
Thank you! Your submission has been received!
Oops! Something went wrong while submitting the form.
Have an account?
Sign in
Upgrade to PRO to Save slides
Advanced Search and Filters
Access to 15,000+ slides
Access to Category Pages
Save/Bookmark Slides
PowerPoint Template Library
Pick a Plan
MONTHLY
$12/month
Billed every month, Cancel anytime.
YEARLY
$9/year
Billed $108 annually, Cancel anytime.
Checkout for $12/month
Checkout for $108/yr
Secured by Stripe | AES-256 bit encryption


![To fix [Country], we need a strong leader willing to break the rules](https://cdn.prod.website-files.com/654e70fb59937215cac87b19/6899bd4617bfc679827cbe95_Gz734YNy4LWd8fPpTh0S1zTZmn4d87OgCc0eZa-zm50.avif)