My Account
My Slides
Search by Category
Pricing
Templates
View All Templates
Download Template Slides
✦ AI Search
Feedback
Login
Logout
Get Started
Browse all Slides
Browse all Slides
Create a FREE Account
Instant access to 1,000+ real slides from top companies like McKinsey, BCG, Goldman Sachs, Google and many more!
First Name
Last Name
Email
Password
I agree to all
Terms & Privacy Policy
Thank you! Your submission has been received!
Oops! Something went wrong while submitting the form.
Have an account?
Sign in
Saved Slides
Total No. of slides saved
0
↻ Refresh
✖ Clear all
Circular flowchart divided into segments like Contract Authoring, Performance Management, and Financial Management, with SirionLabs at the center. Uses a color gradient to differentiate the areas of application.
Technology and Digital Transformation
Technology & Software
Outlines SirionLabs' comprehensive approach to managing complex contracts through integrated solutions in various management areas, emphasizing the synergy between technology and contract lifecycle management.
SirionLabs, Solution, Contract, Management, Technology
false
Technology and Digital Transformation
Technology & Software
Framework
Kearney
Add to my slides
Remove from favorites
Scatter plot showing the spread of SIS scores by total paid amount with annotations.
Market Analysis and Trends
Government & Public Sector
Analyzes the correlation between SIS scores and the total paid amount, highlighting inconsistencies in funding based on assessed needs for NH's DD population.
SIS scores, total paid amount, funding analysis, support intensity scale, DD population, correlation, annualized costs, NH's DD population
false
Market Analysis and Trends
Government & Public Sector
Mixed Chart
Alvarez & Marsal
Add to my slides
Remove from favorites
Features texts and percentages in a borderless table comparing global and Ukrainian responses to skill-based management initiatives. The slide uses contrasting colors to distinguish between geographical responses and effectively presents comparative data.
Technology and Digital Transformation
Technology & Software
Analyzes the adoption of skill-based management practices globally and in Ukraine, emphasizing the transition in job structure and the barriers to implementing these changes.
skill-based management, global trends, Ukraine, job structure, organizational change
false
Technology and Digital Transformation
Technology & Software
Table
Deloitte
Add to my slides
Remove from favorites
Combines text with icons representing different learning strategies, alongside percentage data and top industry reporting.
Strategic Planning
Professional Services
Outlines methods for developing marketing skills, emphasizing in-house training and partnerships, key for strategic HR and capacity building.
skill development, in-house training, partnerships, industry focus, talent management
false
Strategic Planning
Professional Services
Table
Deloitte
Add to my slides
Remove from favorites
Features bar charts detailing managers' commitments to skill enhancement.
Human Resources and Talent Management
Professional Services
Assesses the extent to which managers engage in activities to develop necessary skills.
skill development, training, managerial commitment, professional growth, skill gaps
false
Human Resources and Talent Management
Professional Services
Mixed Chart
BCG
Add to my slides
Remove from favorites
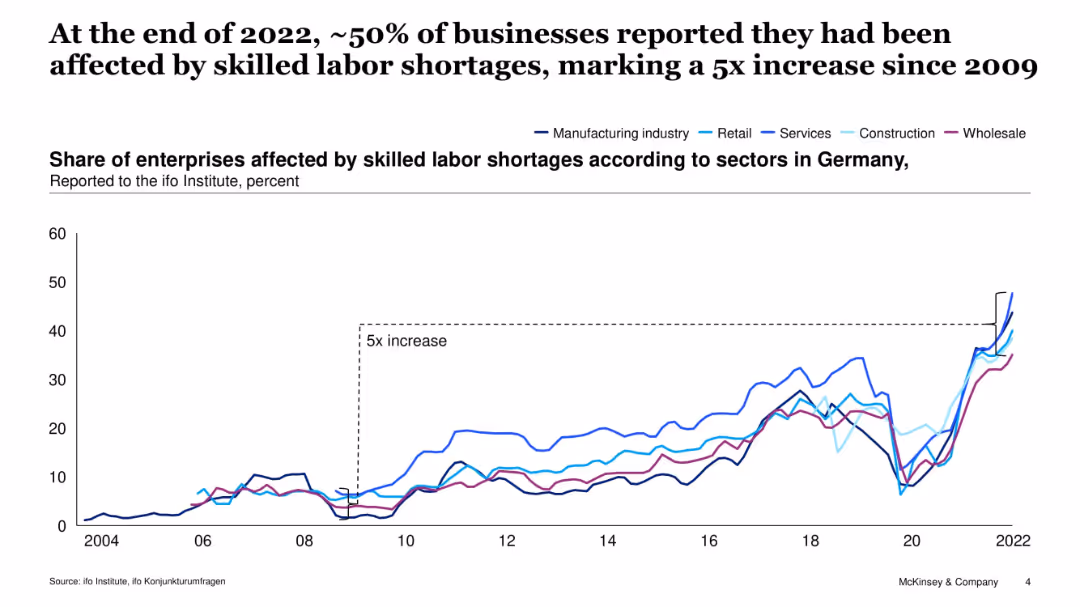
Multi-line chart with labeled sectors showing rise in skilled labor shortages in Germany across sectors from 2004–2022. Blue/purple line colors, dashed annotation for “5x increase.”
Human Resources and Talent Management
Government & Public Sector
This slide visualizes the sharp rise in skilled labor shortages across various industries in Germany, with nearly 50% of enterprises reporting shortages by 2022—a fivefold increase since 2009. It highlights systemic challenges in labor availability.
skilled labor, Germany, workforce shortages, sector comparison, labor trend, manufacturing, retail, services, construction, ifo Institute
false
Human Resources and Talent Management
Government & Public Sector
Single Chart
McKinsey
Add to my slides
Remove from favorites
A column chart and a table showing global distribution of skilled workforce and top countries by skilled workforce.
Human Resources and Talent Management
Education & Training
Highlights global distribution and forecast of skilled workers, focusing on growth in Asia Pacific, Africa, and Latin America.
Skilled workforce, global distribution, Asia Pacific, Africa, Latin America, workforce forecast
false
Human Resources and Talent Management
Education & Training
Mixed Chart
Accenture
Add to my slides
Remove from favorites
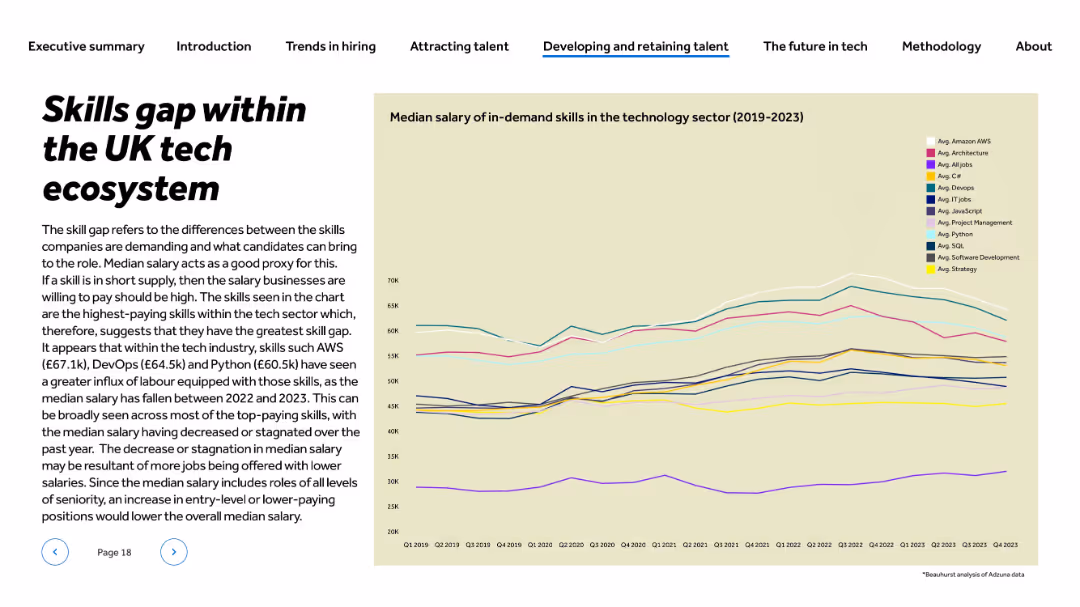
Title and text left-aligned; multi-line chart on right showing median salary trends for tech skills (2019–2023)
Human Resources and Talent Management
Technology & Software
This slide assesses the skill gap in tech via median salary trends. It identifies AWS, DevOps, and Python as high-paying roles, indicating strong demand. From 2022 to 2023, many top-paying skills saw declining or stagnant salaries, implying more job offerings at lower wages or increased availability of these skills in the workforce.
skill gap, tech salaries, AWS, DevOps, Python, salary trends, hiring pressure, UK tech, talent supply
false
Human Resources and Talent Management
Technology & Software
Mixed Chart
Barclays
Add to my slides
Remove from favorites
Bar chart displaying the top 10 skills for Automotive-OES champions, including digital production and program management, AI/ML training, and agile expertise.
Strategic Planning
Transportation & Logistics
Highlights critical skills necessary for scaling digital projects within the Automotive-OES sector, emphasizing digital and technical proficiencies.
skills, automotive, digital, management, AI, ML, training, agile, production, technical
false
Strategic Planning
Transportation & Logistics
Single Chart
Accenture
Add to my slides
Remove from favorites
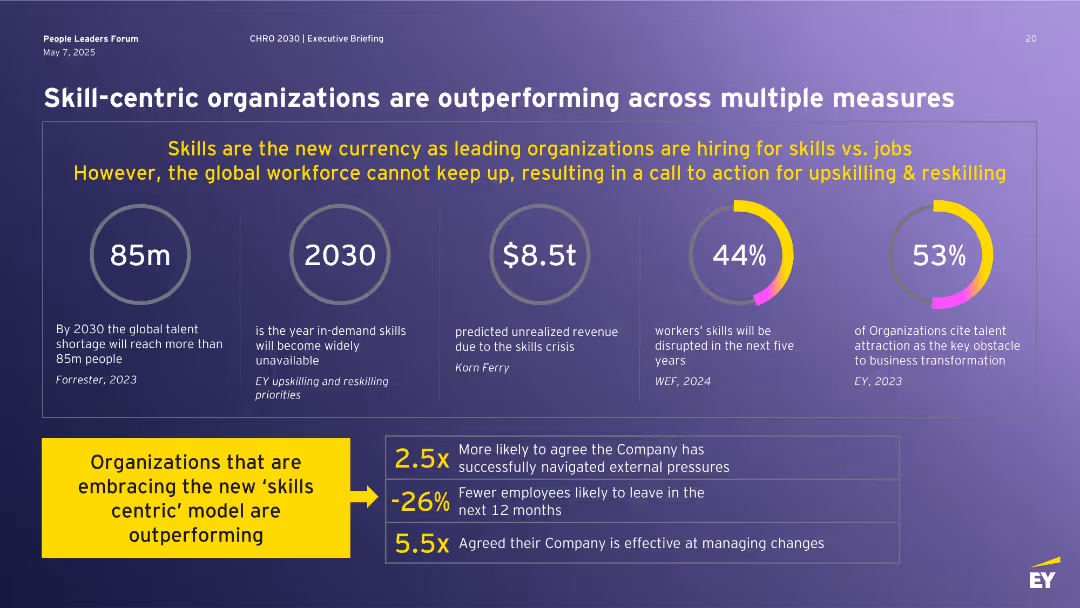
Top half includes infographics and statistics; bottom has callout on “skills centric” performance outcomes.
Human Resources and Talent Management
Professional Services
Advocates for a shift toward skill-centric hiring and development models. Highlights global skill shortage predictions, economic implications, and shows that companies prioritizing skills are outperforming peers in resilience, retention, and adaptability. Reinforces the urgency for reskilling and adapting to a changing workforce landscape.
skills-based hiring, workforce trends, reskilling, productivity, HR strategy, 2030
false
Human Resources and Talent Management
Professional Services
Mixed Chart
EY
Add to my slides
Remove from favorites
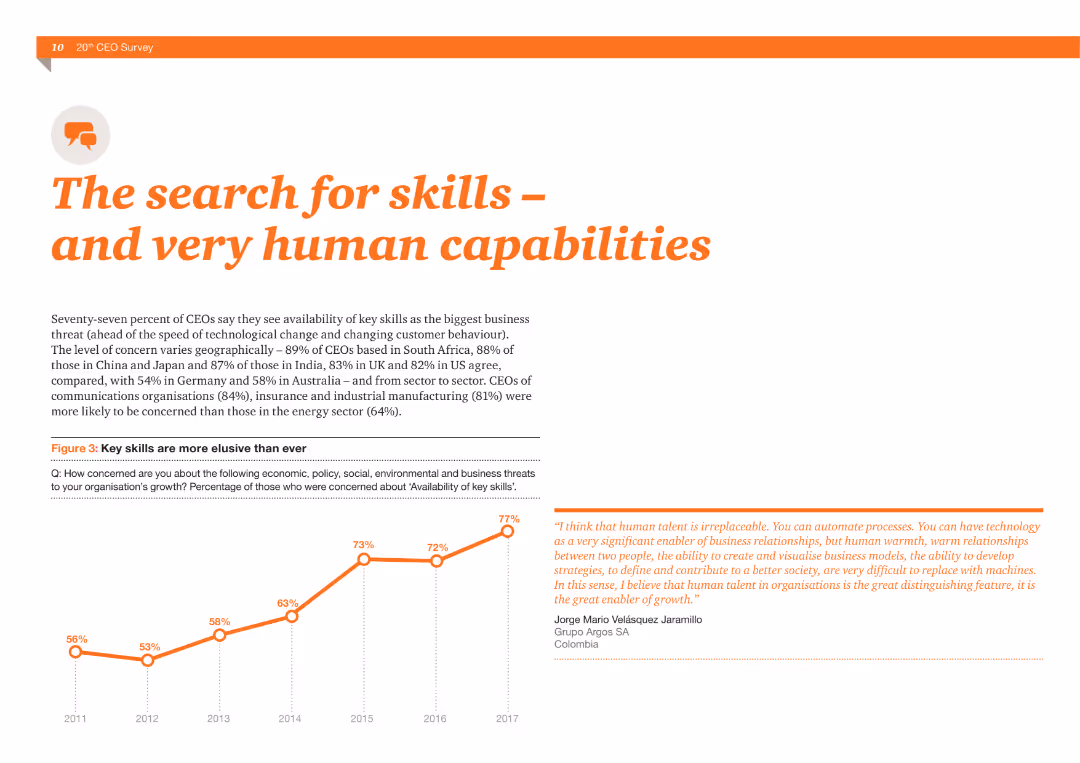
A column chart showing the percentage of CEOs concerned about the availability of key skills from 2011 to 2017, with a high of 77% in 2017. Includes a quote about the value of human talent.
Human Resources and Talent Management
Professional Services
The slide highlights CEOs' concerns about skill availability, emphasizing the importance of human capabilities in business growth, supported by survey data and quotes.
Skills, CEOs, Talent, Human capabilities, Business growth, Availability, Survey, Concern, Importance, Development
false
Human Resources and Talent Management
Professional Services
Mixed Chart
PwC/Strategy&
Add to my slides
Remove from favorites
The slide is split into two main sections. On the left, there is a bold title "STEP THREE: EMPOWER VULNERABLE LEARNERS" followed by a paragraph of text explaining the importance of making education and lifelong learning systems accessible. On the right, there is a bar chart titled "FIGURE 9: THE IMPACT OF INTELLIGENT TECHNOLOGIES ON WORKERS, BY SKILL LEVEL".
Technology and Digital Transformation
Technology & Software
The slide is designed to emphasize the third step in solving the skills gap crisis by empowering vulnerable learners. It discusses the accessibility of education to all, identifying workers at risk from technological disruption. The chart contrasts the percentage of time workers of different skill levels spend in roles subject to augmentation and automation.
skills crisis, empowerment, education, lifelong learning, technological disruption, automation, augmentation, vulnerable workers, skill gap, workforce training
false
Technology and Digital Transformation
Technology & Software
Multiple Chart
Accenture
Add to my slides
Remove from favorites
A bar chart highlighting the potential economic impact of a skills crisis, with key points summarized in text. The color scheme is purple and teal against a white background.
Risk Assessment and Management
Education & Training
The slide quantifies the potential economic loss to G20 countries due to a skills crisis and stresses the need for investment in education and technology.
Skills Crisis, G20, Economic Impact, Education Investment, Technology, GDP Growth, Risk Management, Labor Market, Forecast
false
Risk Assessment and Management
Education & Training
Single Chart
Accenture
Add to my slides
Remove from favorites
The slide shows a bar chart assessing leaders' confidence in identifying future skills needed, accompanied by actions for skill development and strategic planning.
Market Analysis and Trends
Professional Services
Focuses on the pressing need for strategic skill development and planning in organizations to cope with future challenges. It outlines actions like targeted hiring and upskilling, aimed at enhancing workforce capabilities in line with anticipated industry demands.
skills development, strategic planning, future readiness, leadership, workforce training
false
Market Analysis and Trends
Professional Services
Mixed Chart
PwC/Strategy&
Add to my slides
Remove from favorites
Includes matrix charts and text blocks on talent management strategies, emphasizing identification and sourcing of critical skills. Visual elements are clear with green and gray highlights.
Human Resources and Talent Management
Education & Training
Discusses re-skilling and up-skilling strategies in line with business changes, focusing on digital and leadership skills essential for the future, and various sourcing strategies including tech-enabled recruiting.
Skills development, Talent management, Digital transformation, Recruitment
false
Human Resources and Talent Management
Education & Training
Framework
BCG
Add to my slides
Remove from favorites
The slide features a column chart that lists and ranks the most important skill sets needed in the risk management function over the next five years, such as cybersecurity and business knowledge.
Human Resources and Talent Management
Financial Services
It identifies and ranks the critical skill sets required in risk management, emphasizing areas like cybersecurity, AI-based model risk management, and business knowledge. This information is useful for talent acquisition and training programs in risk management.
skill sets, risk management, cybersecurity, business knowledge, AI
false
Human Resources and Talent Management
Financial Services
Mixed Chart
EY
Add to my slides
Remove from favorites
Features a graph titled "Figure 7", a sidebar with additional text and headers, and a purple footer. The graph shows changes in skill importance over time.
Technology and Digital Transformation
Technology & Software
Highlights the evolving importance of various skills for science and engineering roles, implying a trend towards increasing value in creativity and social skills.
Skills Evolution, Science and Engineering, Data Analysis, Creativity, Social Skills
false
Technology and Digital Transformation
Technology & Software
Single Chart
Accenture
Add to my slides
Remove from favorites
This vibrant slide includes a header, an icon of Singapore, and a detailed description of the SkillsFuture Singapore program. The left side has a bold title and a text box with a background highlight, while the right side details specific initiatives like TechSkills Accelerator and SkillsFuture Series, each with their own icon and bullet points.
Strategic Planning
Education & Training
The slide presents Singapore’s SkillsFuture program as a case study. It highlights the country's efforts to promote lifelong learning and upskilling, providing citizens with funding to pursue courses. It details sub-initiatives aimed at enhancing ICT job training and placement, reskilling, and upskilling in technology, indicating the strategic approach to national skill development.
SkillsFuture, Lifelong Learning, Upskilling, Singapore, TechSkills Accelerator, ICT, National Strategy, Funding, Skills Development, Workforce Training
false
Strategic Planning
Education & Training
Header Horizontal
Kearney
Add to my slides
Remove from favorites
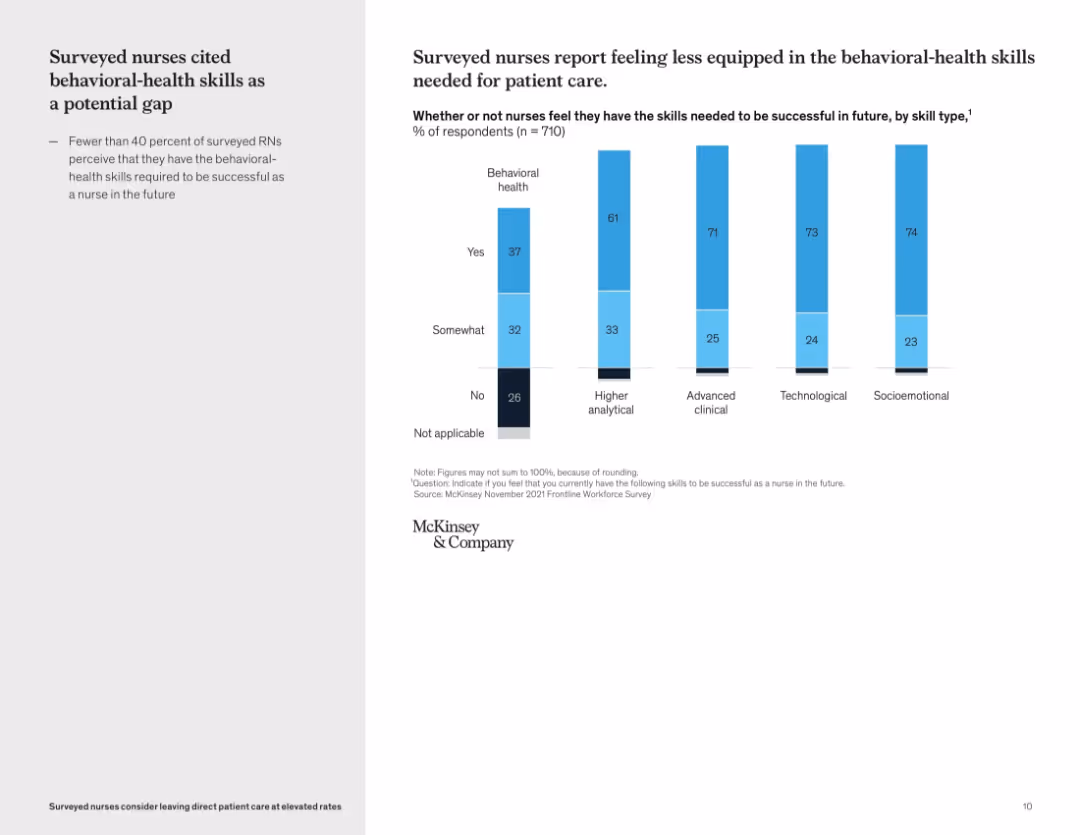
Vertical bar graph showing self-perceived skill gaps by skill type; left-side text summary
Organizational Structure and Change
Healthcare & Pharmaceuticals
This slide reveals that many nurses feel underprepared in behavioral-health skills compared to other domains like technological or clinical capabilities. Only 37% of nurses feel confident in their behavioral health skills, pointing to a critical development area for future readiness.
skills gap, behavioral health, workforce training, nursing education, competency assessment, professional development
false
Organizational Structure and Change
Healthcare & Pharmaceuticals
Mixed Chart
McKinsey
Add to my slides
Remove from favorites
Packed with pie charts and bar charts detailing skill supply issues and their impact on empowerment.
Human Resources and Talent Management
Professional Services
Focuses on the impact of skill shortages on employee empowerment, important for HR planning and educational program development.
Skills Gap, Employee Empowerment, HR Planning, Educational Programs, Workforce Development
false
Human Resources and Talent Management
Professional Services
Multiple Chart
PwC/Strategy&
Add to my slides
Remove from favorites
A column chart with percentages representing the impact of skill availability on organizational growth, accompanied by a significant quote on talent management.
Human Resources and Talent Management
Financial Services
This slide discusses the impact of skill gaps on innovation and costs, pertinent in HR presentations and discussions about talent management and organizational growth challenges.
Skills Gap, Innovation, Talent Management, Organizational Growth, HR, Costs, Impact
false
Human Resources and Talent Management
Financial Services
Mixed Chart
PwC/Strategy&
Add to my slides
Remove from favorites
Slide with a black background and a bold red header showcasing a column chart comparing skills gap closure strategies by region, complemented by a quote section in red.
Market Analysis and Trends
Financial Services
Analyzes strategies for closing skills gaps, with a focus on North America's approach via education. Insightful for discussions on global workforce development trends.
Skills gap, North America, CEO, education, retraining, pipeline, workforce, strategy, global comparison, survey
false
Market Analysis and Trends
Financial Services
Mixed Chart
PwC/Strategy&
Add to my slides
Remove from favorites
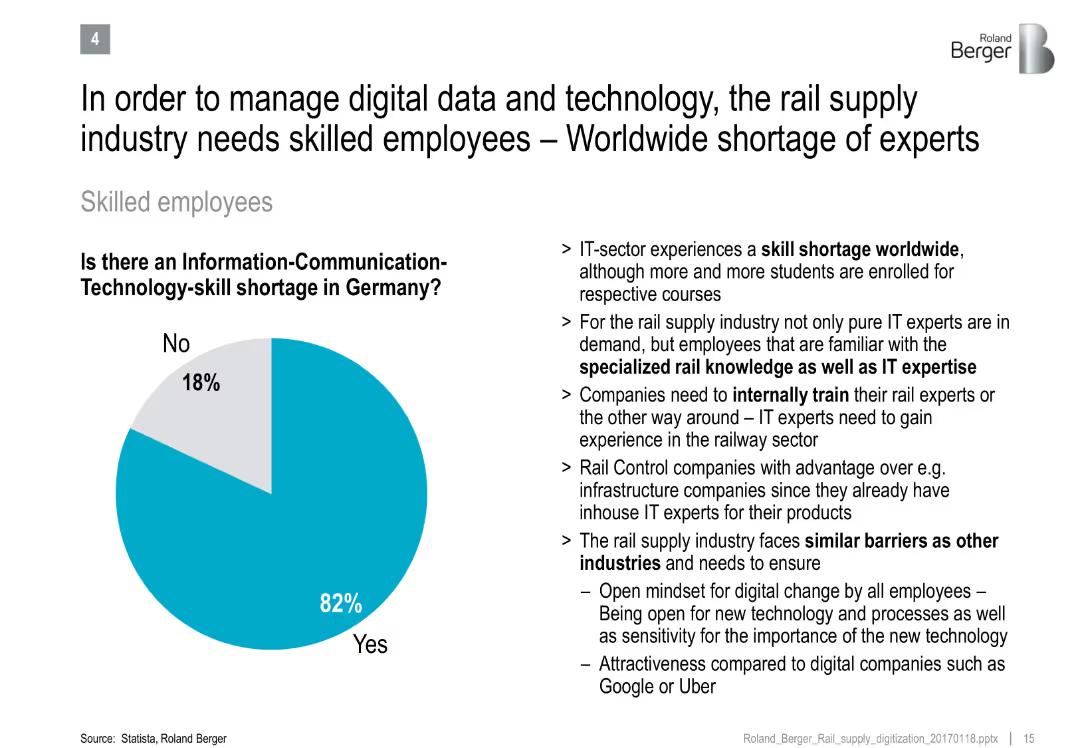
Pie chart on ICT-skill shortage and bullet points discussing talent challenges in rail and IT sectors
Human Resources and Talent Management
Transportation & Logistics
Emphasizes the critical shortage of ICT-skilled workers in Germany's rail industry, citing the need for specialized training and sector-specific expertise.
skill shortage, ICT, workforce development, rail supply, digital transformation, employee training
false
Human Resources and Talent Management
Transportation & Logistics
Mixed Chart
Roland Berger
Add to my slides
Remove from favorites
Features a diagram "FIGURE 6" depicting the importance of new skill sets across roles and two large text blocks discussing the relevance of these skills.
Market Analysis and Trends
Technology & Software
Analyzes the rising importance of complex reasoning, creativity, and socio-emotional intelligence in the workplace, arguing that such skills are acquired through practice and experience.
Skills, Importance, Analysis, Creativity, Market
false
Market Analysis and Trends
Technology & Software
Table
Accenture
Add to my slides
Remove from favorites
A multi-colored ranking chart lists ASEAN countries across several skill categories, providing a clear comparison.
Strategic Planning
Technology & Software
Analyzes ASEAN countries' positions in global skill rankings, highlighting areas of strength and needed improvement.
skills, ranking, ASEAN, talent availability, training, education, index
false
Strategic Planning
Technology & Software
Table
Kearney
Add to my slides
Remove from favorites
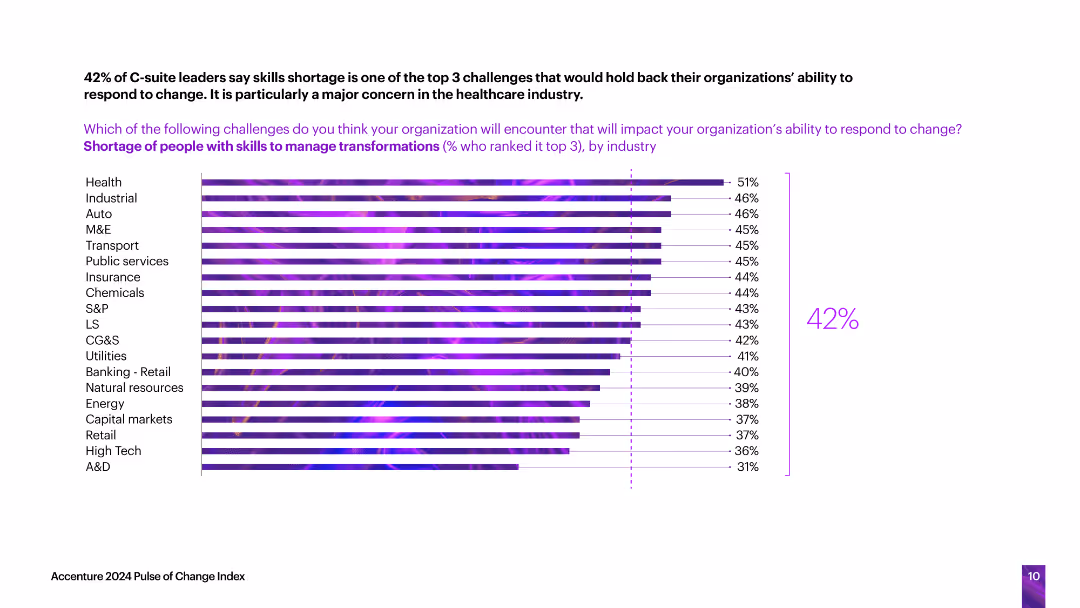
The slide features a horizontal bar chart listing the percentage of leaders who view skills shortage as a top challenge, broken down by industry.
Human Resources and Talent Management
Professional Services
The slide identifies skills shortages as a significant challenge for organizations in responding to change, with the healthcare industry being particularly concerned about this issue.
skills shortage, organizational response, challenge, industry breakdown, healthcare
false
Human Resources and Talent Management
Professional Services
Single Chart
Accenture
Add to my slides
Remove from favorites
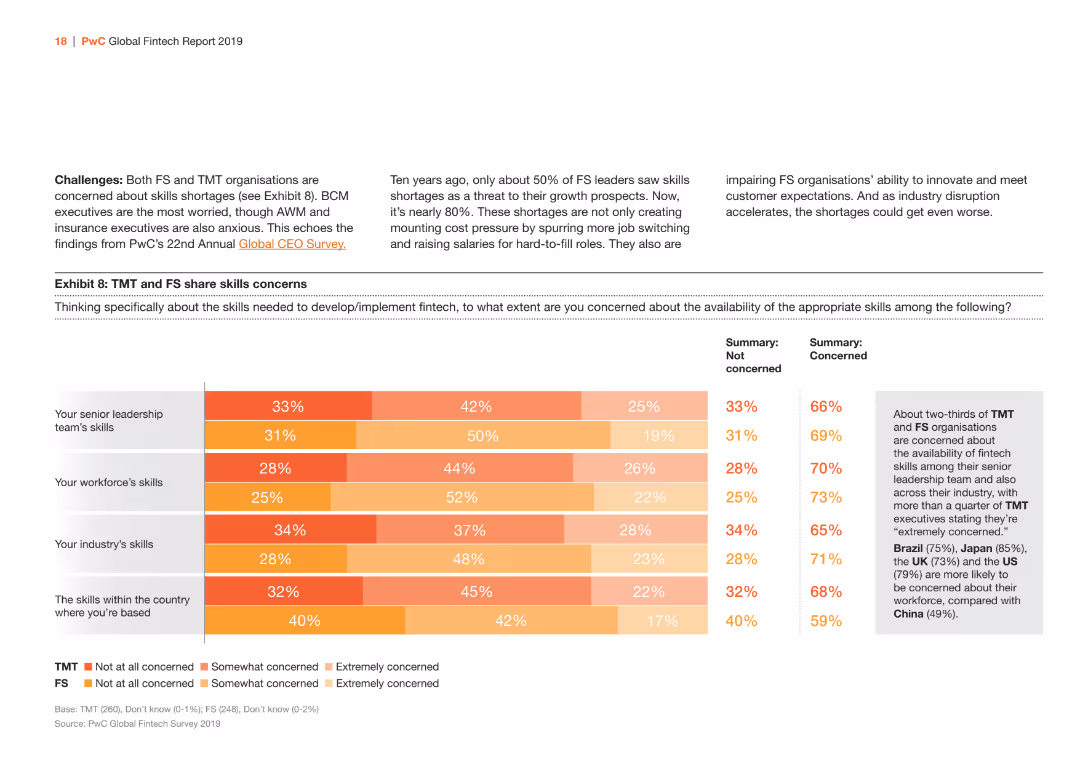
The slide features a horizontal bar chart (bar chart) showing the concerns about skills shortages among TMT and FS organizations. It uses different shades of orange and yellow to differentiate data.
Risk Assessment and Management
Financial Services
The slide discusses the skill shortages in TMT and FS organizations, highlighting concerns among senior leadership and workforce skills. It presents data on the extent of concern across various skill categories.
Skills, Shortages, TMT, FS, Leadership, Workforce
false
Risk Assessment and Management
Financial Services
Mixed Chart
PwC/Strategy&
Add to my slides
Remove from favorites
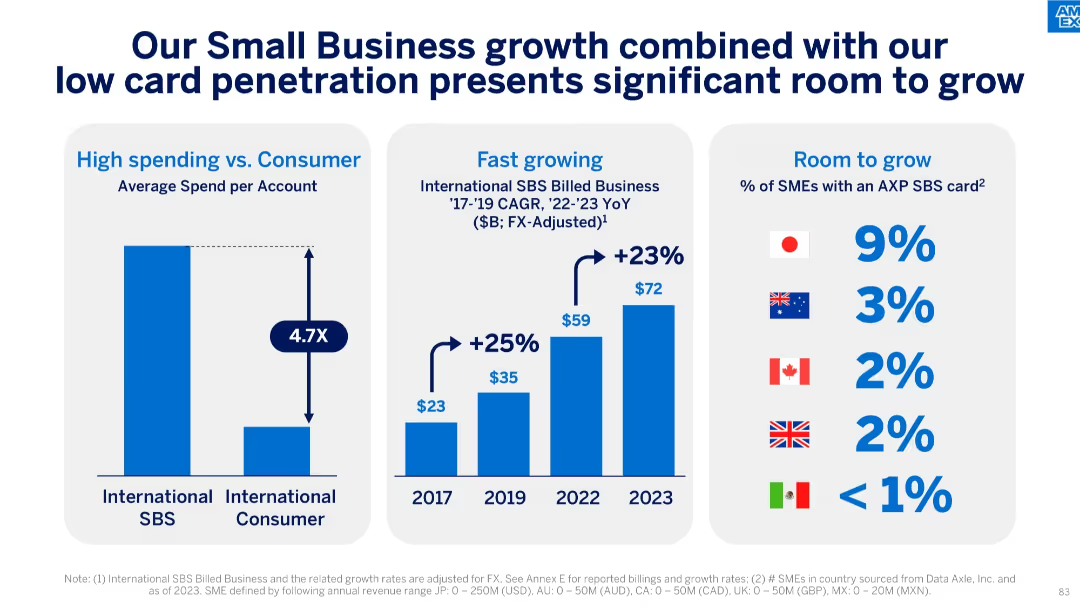
Three-panel design showing high spending, strong CAGR, and SME market penetration stats.
Sales and Business Development
Financial Services
The slide details high average spend among small businesses versus consumers, rapid growth in SBS billed business, and low card penetration across major markets. This indicates a large opportunity to grow SBS engagement.
small business, card penetration, SME, international SBS, billed business, spend per account, growth potential, market opportunity
false
Sales and Business Development
Financial Services
Multiple Chart
McKinsey
Add to my slides
Remove from favorites
The slide features a blue color scheme with four separate line graphs. Each graph is annotated with specific data points and accompanied by a brief text explanation below.
Market Analysis and Trends
Financial Services
This slide presents the health of the small business ecosystem through various data points such as business formations, cash buffers, business optimism index, and delinquency rates. It's designed to assess small business trends and economic resilience.
Small business, Ecosystem, Economic health, Cash buffers, Optimism, Delinquency rates, Formation, Resilience, Data, Trend analysis
false
Market Analysis and Trends
Financial Services
Multiple Chart
JP Morgan
Add to my slides
Remove from favorites
Features a prominent blue graph illustrating the distribution of cash buffer days for small businesses, set against a white and light gray background.
Financial Performance
Government & Public Sector
This slide visually presents data on cash reserves in small businesses, indicating a generally low margin for error against financial shocks.
small businesses, cash reserves, financial analysis, cash buffer, economic shock
false
Financial Performance
Government & Public Sector
Single Chart
McKinsey
Add to my slides
Remove from favorites
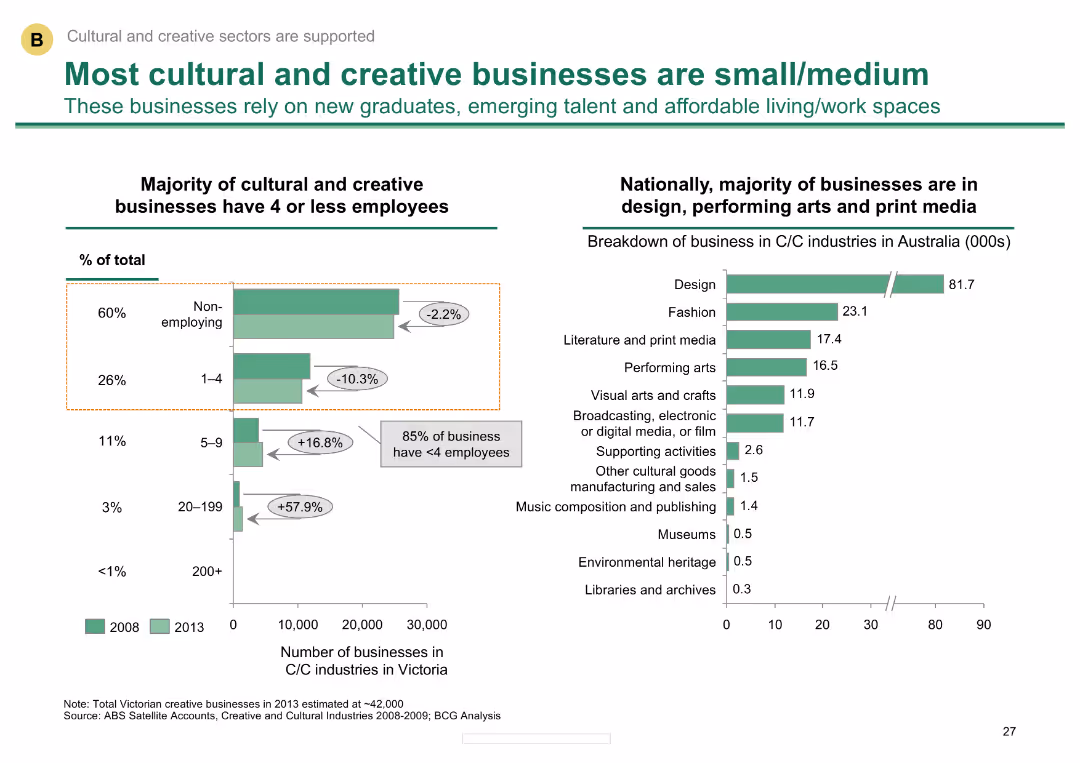
Column charts showing distribution of businesses by employee size and sector distribution in Australia
Market Analysis and Trends
Media & Entertainment
Highlights that most cultural and creative businesses in Australia are small or medium-sized, relying on new graduates and emerging talent.
Small businesses, cultural sector, employee size, sector distribution, Australia
false
Market Analysis and Trends
Media & Entertainment
Multiple Chart
BCG
Add to my slides
Remove from favorites
Lists modular offerings with a column chart showing market penetration.
Market Analysis and Trends
Financial Services
Highlights comprehensive digital solutions for small businesses, focusing on modular and personalized offerings.
small businesses, digital solutions, market penetration, modular offerings, efficiency
false
Market Analysis and Trends
Financial Services
Mixed Chart
UBS
Add to my slides
Remove from favorites
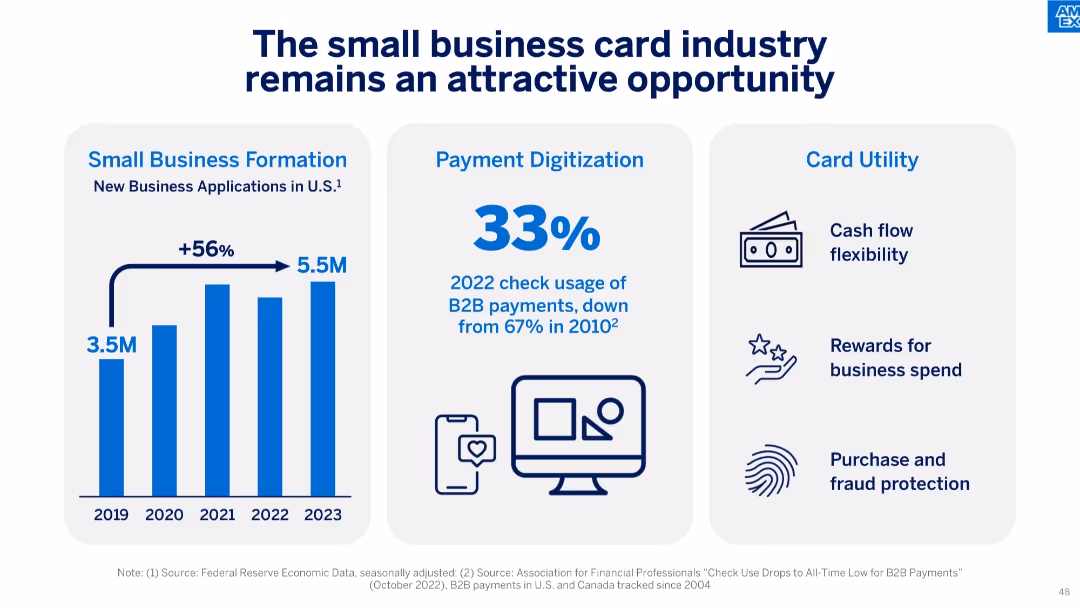
Three-part layout with vertical bar chart on small business formation, a bold percentage on check usage decline, and icons listing card utility benefits.
Market Analysis and Trends
Financial Services
The slide argues the continued attractiveness of the small business card industry, supported by strong new business formation, declining use of checks in B2B payments, and high utility from card features like rewards and fraud protection.
small business, formation, B2B payments, card utility, check decline, rewards, cash flow, digitization, fintech
false
Market Analysis and Trends
Financial Services
Mixed Chart
McKinsey
Add to my slides
Remove from favorites
This slide contains two pie charts detailing company sizes by employee count and industry distribution in France.
Industry Overview
Professional Services
Provides an overview of the business landscape in France by company size and industry, useful for market segmentation and economic analysis.
Small Business, Medium Business, Large Business, Distribution, IT, Banking, Tourism
false
Industry Overview
Professional Services
Multiple Chart
Bain
Add to my slides
Remove from favorites
Utilizes a combination of pie chart and line graph to display the spending on small businesses by Millennials and Gen Z. The design is streamlined, with a focus on clarity and ease of understanding the trends.
Market Analysis and Trends
Retail & E-commerce
Analyzes the significant contributions of Gen Z and Millennials to small business spending, emphasizing the importance of these demographics to local economies. Useful for economic analysis and strategic business planning.
Small Business, Spending Trends, Millennials, Gen Z
false
Market Analysis and Trends
Retail & E-commerce
Multiple Chart
Accenture
Add to my slides
Remove from favorites
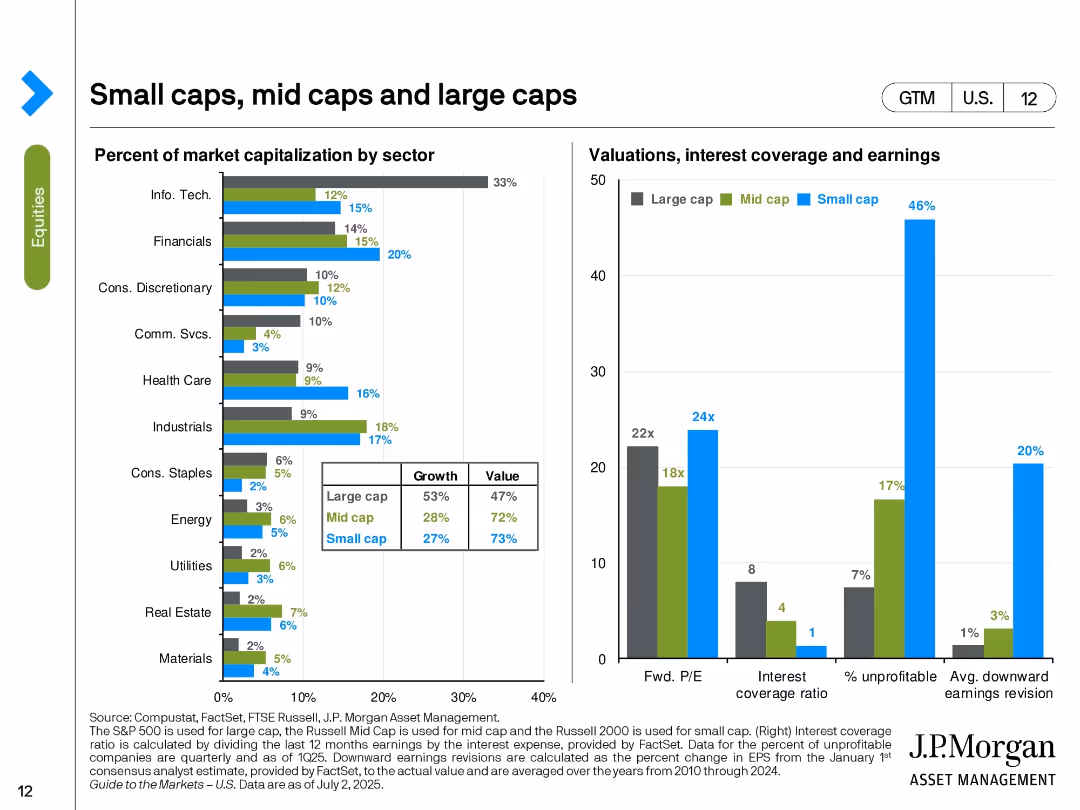
Bar charts comparing market sector exposure by cap size (left) and valuation/financial metrics (right) for small, mid, and large caps.
Customer and Market Segmentation
Financial Services
This slide compares small, mid, and large cap stocks across multiple dimensions including sector weightings, valuation (Fwd. P/E), interest coverage, unprofitability, and earnings revisions. Small caps show higher risk (46% unprofitable) but are more heavily weighted in certain sectors like Industrials.
small cap, mid cap, large cap, market cap, valuation, sector allocation, interest coverage, earnings revision, equity segmentation
false
Customer and Market Segmentation
Financial Services
Multiple Chart
JP Morgan
Add to my slides
Remove from favorites
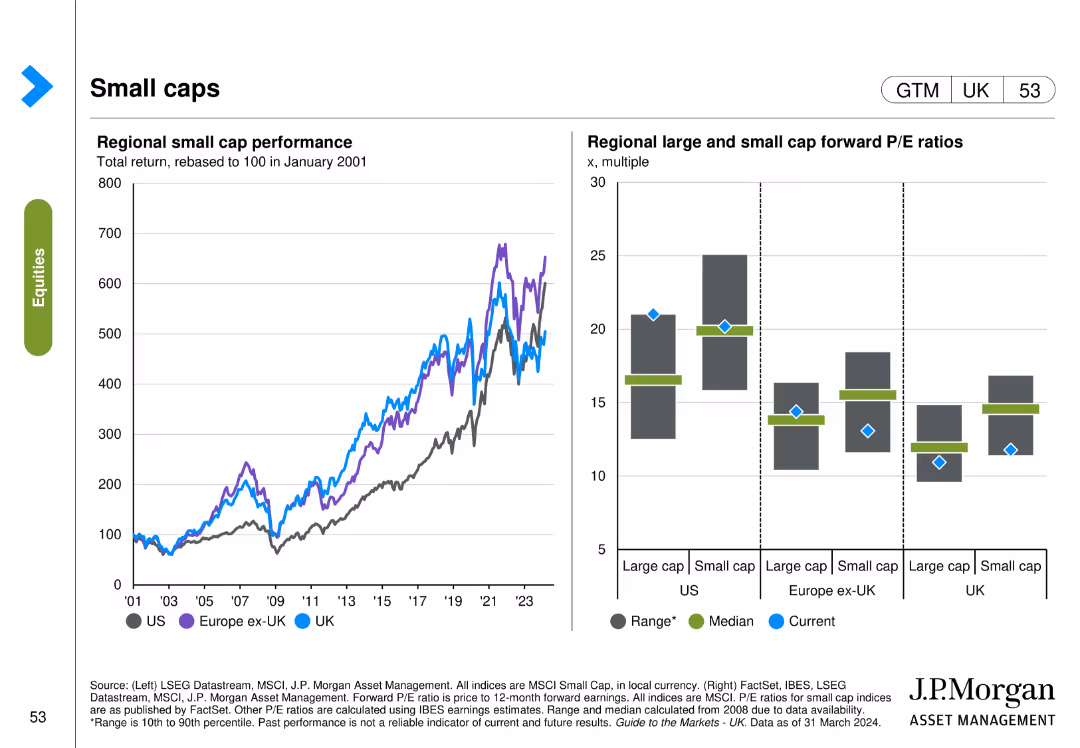
The slide features two visual elements: a line chart on the left showing regional small cap performance and a column chart on the right comparing forward P/E ratios of large and small caps across regions.
Investment Analysis
Financial Services
The slide evaluates small cap stocks by comparing their performance across regions and examining their forward P/E ratios relative to large cap stocks.
small caps, large caps, performance, P/E ratios, regional comparison, investment analysis
false
Investment Analysis
Financial Services
Multiple Chart
JP Morgan
Add to my slides
Remove from favorites
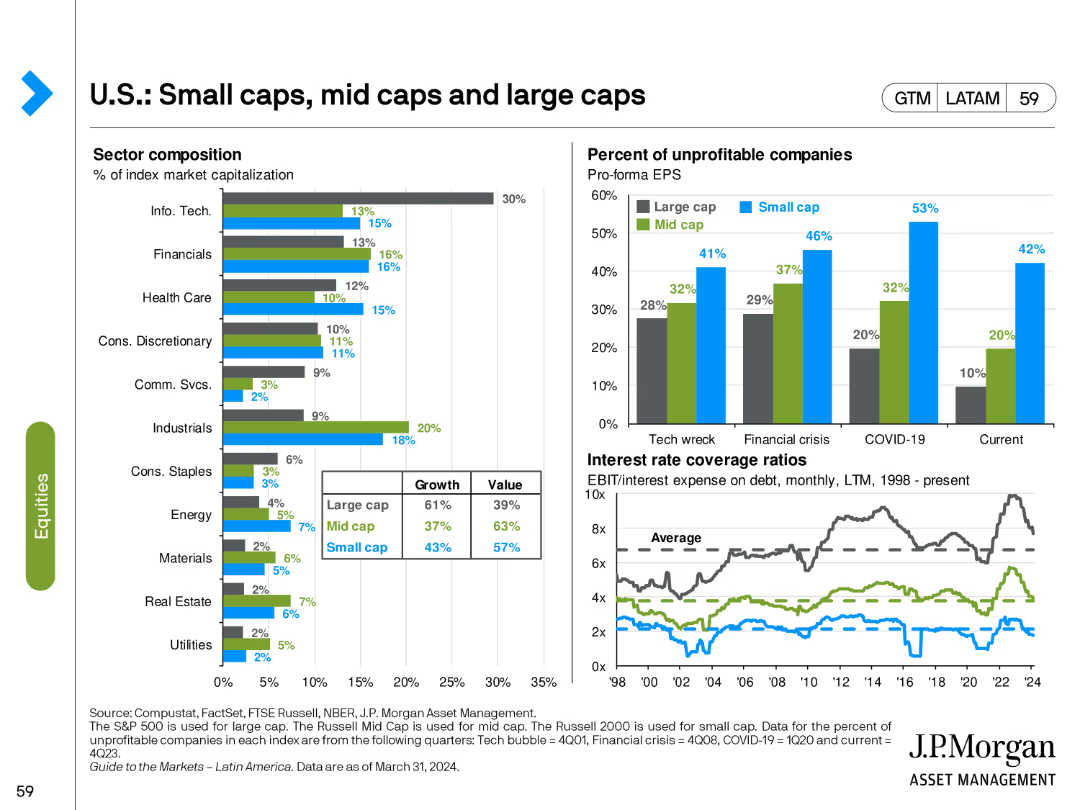
The slide features two bar charts and two line charts. The bar charts show sector composition and percentage of unprofitable companies. The line charts depict interest rate coverage ratios.
Market Analysis and Trends
Financial Services
This slide analyzes the composition and performance of small, mid, and large-cap stocks, focusing on sector distribution and financial metrics like profitability and interest coverage.
small caps, mid caps, large caps, sector composition, interest coverage
false
Market Analysis and Trends
Financial Services
Multiple Chart
JP Morgan
Add to my slides
Remove from favorites
Scatter plot and table comparing return, risk, and ratios of international stock categories.
Investment Analysis
Financial Services
Compares small cap and emerging market stocks, useful for assessing risk and diversification.
Small Cap Stocks, Emerging Markets, Risk Assessment, Diversification, Returns, Data Table, Scatter Plot, Morgan Stanley, Market Monitor
false
Investment Analysis
Financial Services
Single Chart
Morgan Stanley
Add to my slides
Remove from favorites
Shows bar charts and line charts depicting sector composition, unprofitable companies in the Russell 2000, and debt maturity profiles.
Market Analysis and Trends
Financial Services
It examines the vulnerability of small-cap stocks to higher interest rates despite their attractive valuations.
small-cap stocks, interest rates, sector composition, Russell 2000, debt maturity
false
Market Analysis and Trends
Financial Services
Multiple Chart
JP Morgan
Add to my slides
Remove from favorites
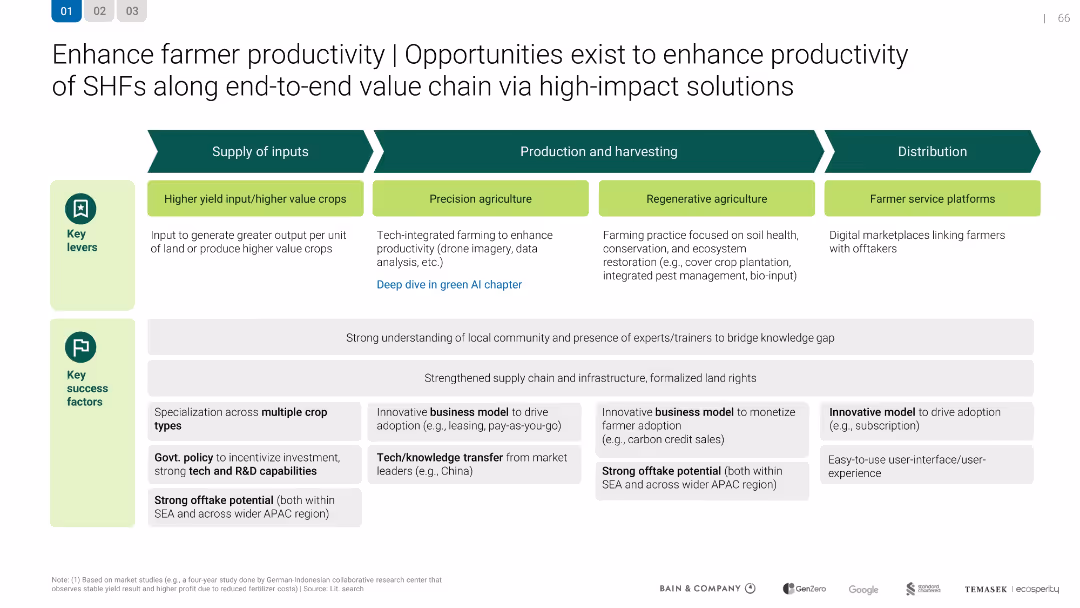
Flow diagram from input to distribution; supporting success factors and key levers in text blocks below
Human Resources and Talent Management
Agriculture & Food Production
Outlines methods to improve smallholder farmer (SHF) productivity across the value chain, including precision agriculture, regenerative practices, and farmer service platforms, with success factors like policy support and offtake potential.
smallholder farming, productivity, agriculture, precision farming, SEA, value chain, inputs
false
Human Resources and Talent Management
Agriculture & Food Production
Table
Bain
Add to my slides
Remove from favorites
Lists advantages of smart contracts such as security and cost savings, presented through a combination of icons and bullet points which simplify complex information into easily digestible segments.
Technology and Digital Transformation
Technology & Software
Details the benefits of using smart contracts in blockchain technology, emphasizing aspects like speed, accuracy, and cost efficiency. Useful for discussions on improving business processes through technology.
smart contracts, advantages, security, efficiency, cost savings
false
Technology and Digital Transformation
Technology & Software
Boxed
McKinsey
Add to my slides
Remove from favorites
Diagrams and descriptive text explain the concept of smart contracts, showing examples of how they operate in transactions and loan processes, with visual aids like flowcharts and character illustrations.
Technology and Digital Transformation
Technology & Software
Outlines the functionality of smart contracts in blockchain, detailing their role in automating transactions and enforcing agreements digitally. Ideal for illustrating innovative contract management solutions in technology applications.
smart contracts, blockchain, automation, digital agreements, transactions
false
Technology and Digital Transformation
Technology & Software
Boxed
McKinsey
Add to my slides
Remove from favorites
The slide contains pie charts showing the development in self-confidence, presentation skills, and business networking skills among program participants.
Strategic Planning
Education & Training
The slide outlines the Smart Futures program, emphasizing the development of employability skills and business mentoring for young people.
Smart Futures, employability, skills development, mentoring
false
Strategic Planning
Education & Training
Multiple Chart
EY
Add to my slides
Remove from favorites
Contains a bar chart comparing ownership rates of various smart entertainment and smart home devices over two years.
Market Analysis and Trends
Telecommunications
Analyzes consumer engagement with smart home and entertainment devices, showing growth and preferences over time.
smart home, smart entertainment, device adoption, consumer trends, technology growth
false
Market Analysis and Trends
Telecommunications
Single Chart
Deloitte
Add to my slides
Remove from favorites
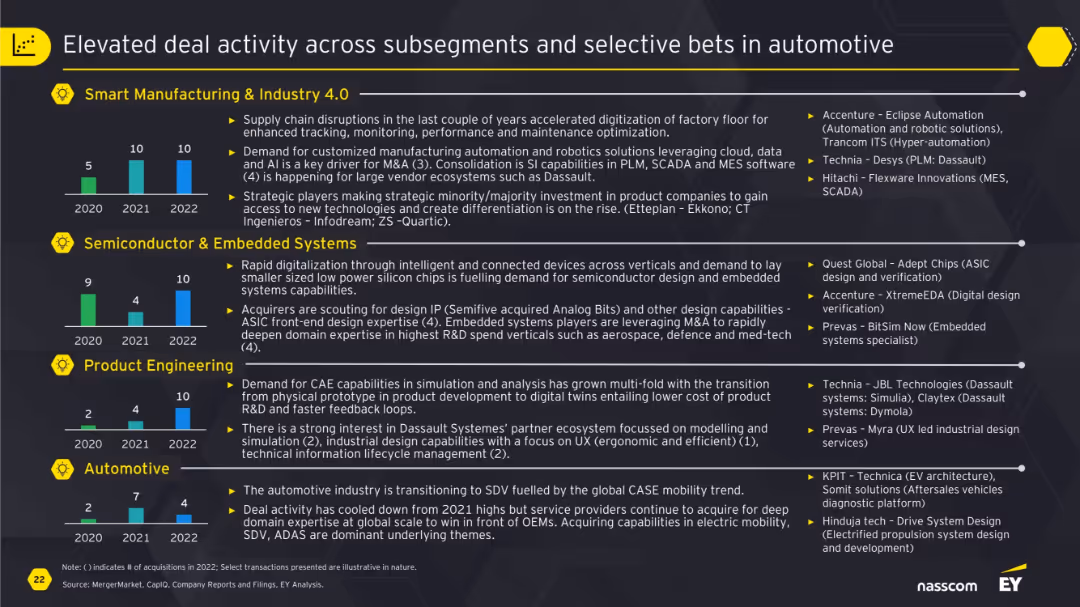
Grid layout with horizontal bar graphs per subsegment (Smart Manufacturing, Semiconductor, etc.), accompanied by descriptions and company examples.
Market Analysis and Trends
Industrial & Manufacturing
The slide outlines elevated M&A activity in Smart Manufacturing, Semiconductors, Product Engineering, and Automotive. Key drivers include supply chain disruption, AI integration, electric mobility, and deep design IP needs. Selected companies and technologies are highlighted to illustrate active acquisition themes.
smart manufacturing, semiconductors, embedded systems, automotive, deal activity, M&A
false
Market Analysis and Trends
Industrial & Manufacturing
Mixed Chart
EY
Add to my slides
Remove from favorites
Features a stacked bar chart detailing the age of the smartphone user base over several years.
Market Analysis and Trends
Telecommunications
Reviews trends in smartphone durability and the increasing lifespan of smartphones due to less frequent upgrades.
smartphone durability, upgrade frequency, device lifespan, consumer behavior, technology trends
false
Market Analysis and Trends
Telecommunications
Mixed Chart
Deloitte
Add to my slides
Remove from favorites
Includes a bar chart showing consumer preferences for smartphone features, focusing on battery life and camera quality.
Product and Service Analysis
Telecommunications
Highlights consumer preferences for certain smartphone features like battery life and camera, while noting lower interest in eco-friendly specifications.
smartphone features, consumer preferences, battery life, camera quality, sustainability
false
Product and Service Analysis
Telecommunications
Mixed Chart
Deloitte
Add to my slides
Remove from favorites
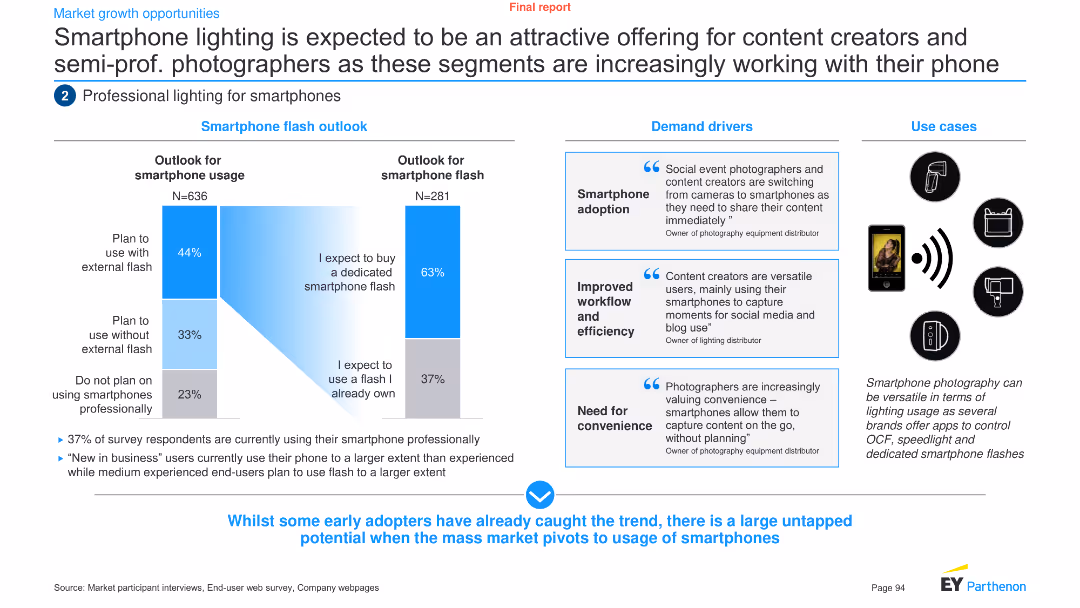
The slide uses a combination of column charts and text boxes to analyze the outlook and demand drivers for smartphone lighting among content creators and semi-professional photographers.
Product and Service Analysis
Technology & Software
It discusses the potential of smartphone lighting for content creators and semi-professional photographers, highlighting demand drivers and use cases.
Smartphone lighting, content creators, semi-professional, demand drivers, outlook, technology, analysis, trends, product, service
false
Product and Service Analysis
Technology & Software
Multiple Chart
EY
Add to my slides
Remove from favorites
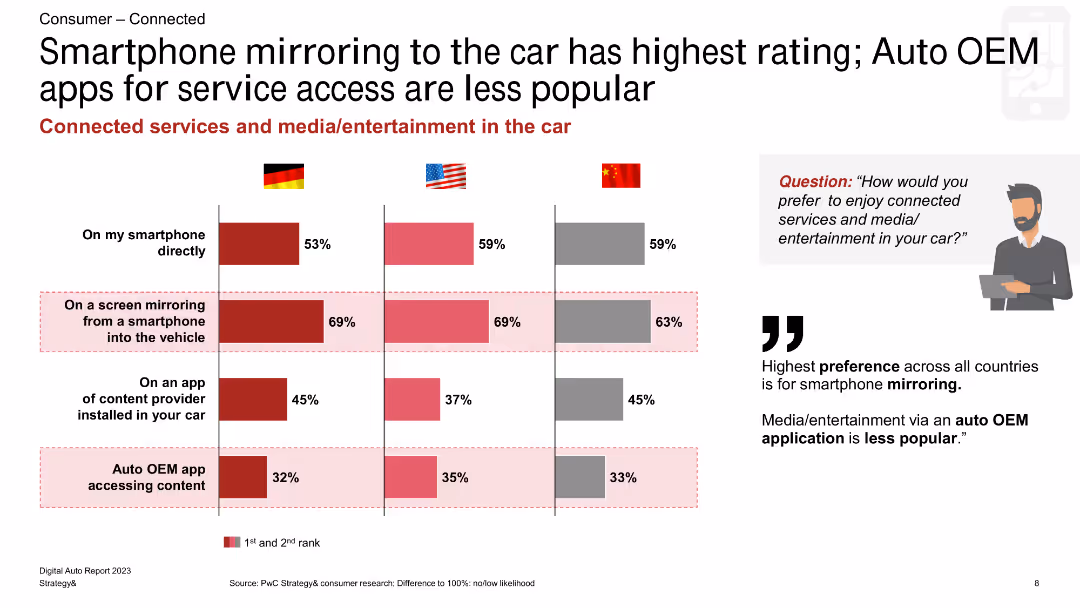
The slide shows a comparative bar chart indicating preferences for different ways to access connected services and media in cars among consumers in Germany, the US, and China.
Product and Service Analysis
Consumer Goods
This slide presents data on consumer preferences for accessing connected services and media in cars, highlighting a strong preference for smartphone mirroring over other methods in Germany, the US, and China.
smartphone mirroring, connected services, consumer preferences, Germany, US, China, bar chart
false
Product and Service Analysis
Consumer Goods
Multiple Chart
PwC/Strategy&
Add to my slides
Remove from favorites
Contains graphical data on smartphone prices and data tariffs, employing color contrasts and icons for a clear representation.
Market Analysis and Trends
Retail & E-commerce
This slide presents the driving forces behind the growth in digital consumption, including price drops and tariff reductions. Crucial for market strategy planning.
Smartphone Prices, Data Tariffs, Market Forces, India, Digital Growth, Technology Trends, Price Analysis, Economic Factors
false
Market Analysis and Trends
Retail & E-commerce
Multiple Chart
BCG
Add to my slides
Remove from favorites
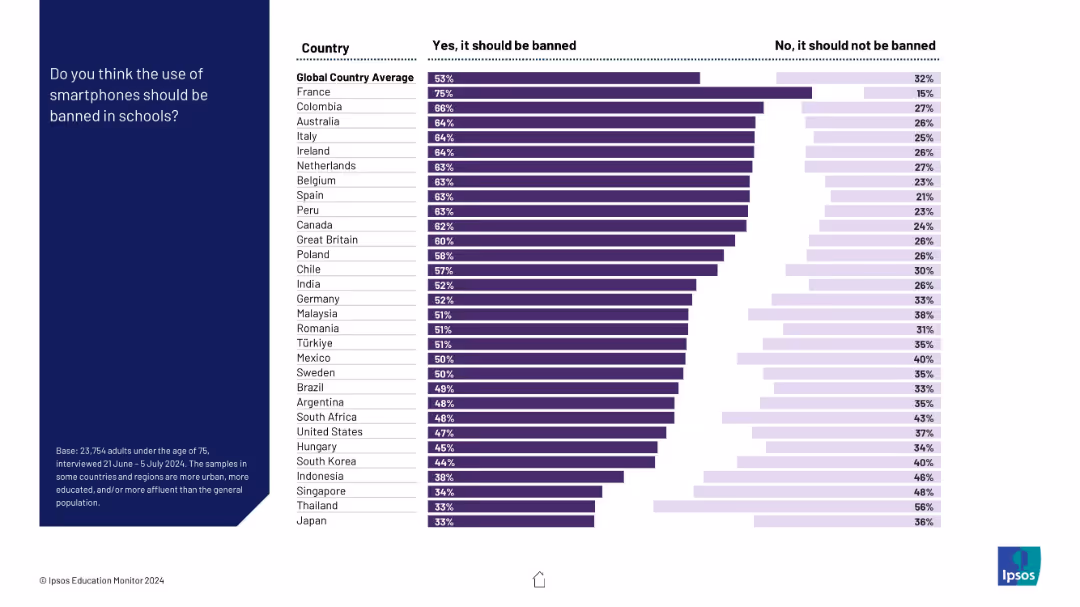
Vertical bar chart by country comparing support for banning smartphones; includes “yes” and “no” segments
Regulatory and Compliance
Education & Training
This slide ranks countries on whether they support banning smartphones in schools. France and Colombia show highest support, while Singapore, Thailand, and Japan show the lowest.
smartphones, bans, school policy, country comparison, regulation, survey
false
Regulatory and Compliance
Education & Training
Mixed Chart
IPSOS
Add to my slides
Remove from favorites
Displays multiple line charts tracking the growth in preference for smartphones over other devices for various online activities from 2018 to 2023.
Technology and Digital Transformation
Technology & Software
Details the increasing dependence on smartphones for various online activities, illustrating growth trends over five years.
smartphones, digital trends, device preference, online activities, consumer behavior
false
Technology and Digital Transformation
Technology & Software
Mixed Chart
Deloitte
Add to my slides
Remove from favorites
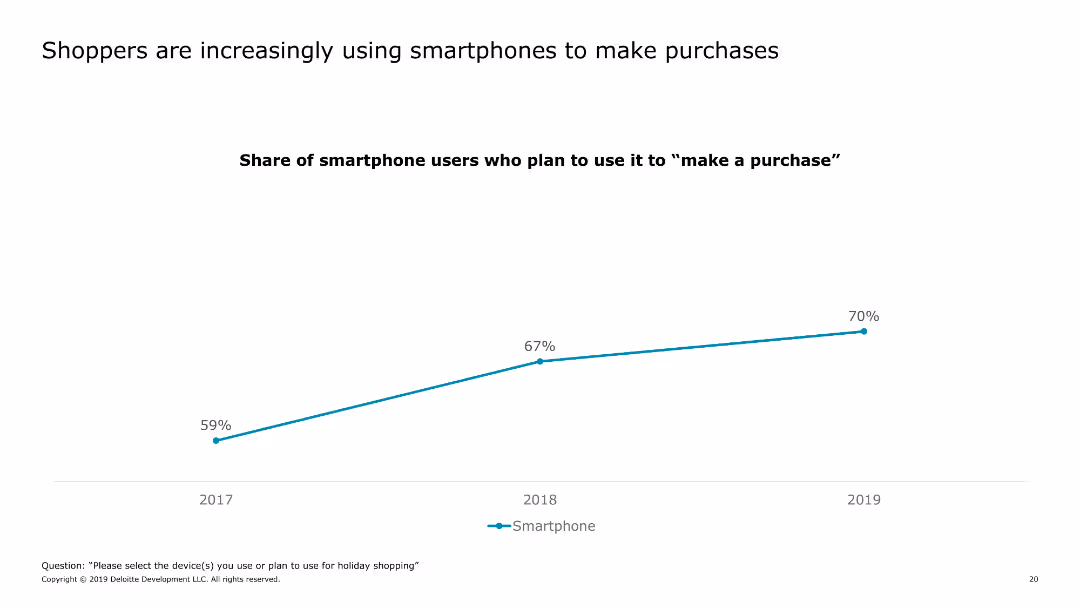
The slide shows a line chart tracking the increase in smartphone usage for making purchases during the holiday season from 2017 to 2019.
Market Analysis and Trends
Retail & E-commerce
The slide highlights the growing trend of consumers using smartphones to make purchases during the holiday shopping period.
smartphone usage, holiday shopping, consumer behavior, retail, e-commerce, trends, 2019, mobile shopping, purchase behavior
false
Market Analysis and Trends
Retail & E-commerce
Single Chart
Deloitte
Add to my slides
Remove from favorites
Contains a bar chart and connected icons illustrating potential additional uses for smartphones, such as digital identification.
Market Analysis and Trends
Telecommunications
Explores potential new uses for smartphones beyond traditional functionalities, like using them as digital IDs.
smartphone utility, digital ID, technology adoption, consumer behavior, future trends
false
Market Analysis and Trends
Telecommunications
Mixed Chart
Deloitte
Add to my slides
Remove from favorites
Bar chart showing the number of industrial robots per 100 employees in manufacturing for various countries in 2019. Column charts detailing the turnover of service robots by application for 2019 and 2023.
Technology and Digital Transformation
Technology & Software
This slide highlights the growth and deployment of smart robotics, focusing on the leading role of Asian countries. It presents data on the number of industrial robots and projects the turnover for service robots in various applications, emphasizing the expanding role of robotics in different sectors.
Smart Robotics, Industrial Robots, Deployment
false
Technology and Digital Transformation
Technology & Software
Multiple Chart
Roland Berger
Add to my slides
Remove from favorites
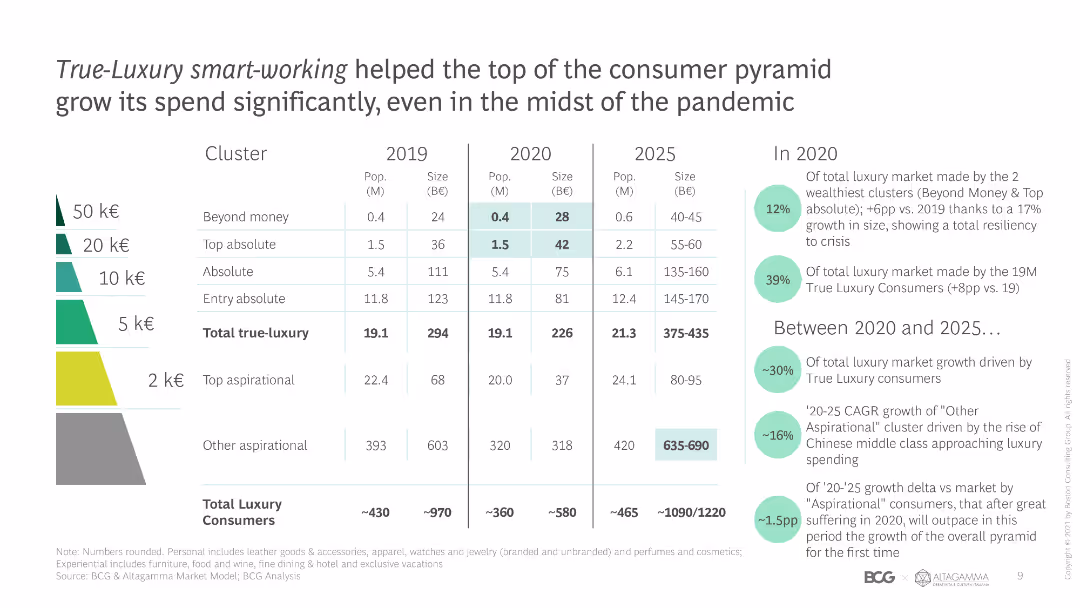
The slide presents a table showing various consumer clusters by population, size, and market impact, with color-coded segments for different spending levels.
Financial Performance
Retail & E-commerce
The slide details the impact of smart-working on true-luxury consumers, showing market growth and resilience among the top consumer segments during the pandemic.
Smart-working, luxury consumers, market growth, consumer segments, pandemic impact, spending levels, financial performance, market resilience, consumer clusters
false
Financial Performance
Retail & E-commerce
Table
BCG
Add to my slides
Remove from favorites
This slide includes comparative lists and block diagrams detailing the benefits of onsite and remote work, as well as levers for successful smart work like office space usage and policies. It features a green and gray color scheme and includes a pie chart for visual data representation.
Operational Efficiency
Professional Services
Discusses benefits of onsite versus remote work including cost savings, safety, productivity, and effectiveness with examples from an insurance company. Explores strategies to make smart work effective using various levers like technology infrastructure.
Smart work, Remote work, Onsite benefits, Productivity, Cost savings
false
Operational Efficiency
Professional Services
Header Vertical
BCG
Add to my slides
Remove from favorites
This slide contains pie charts and column charts with accompanying text. There's a circular diagram showing percentages, all within a blue color scheme and clean layout.
Market Analysis and Trends
Financial Services
Showcases the distribution of Chase's small and medium-sized business clients by annual sales size and industry, with growth highlights. It serves to display the bank's role in helping businesses start, run, and grow, indicating market leadership and customer support.
SMB, Chase, Business growth, Market distribution, Sales size, Industry, Client support, Market leadership, Business services
false
Market Analysis and Trends
Financial Services
Multiple Chart
JP Morgan
Add to my slides
Remove from favorites
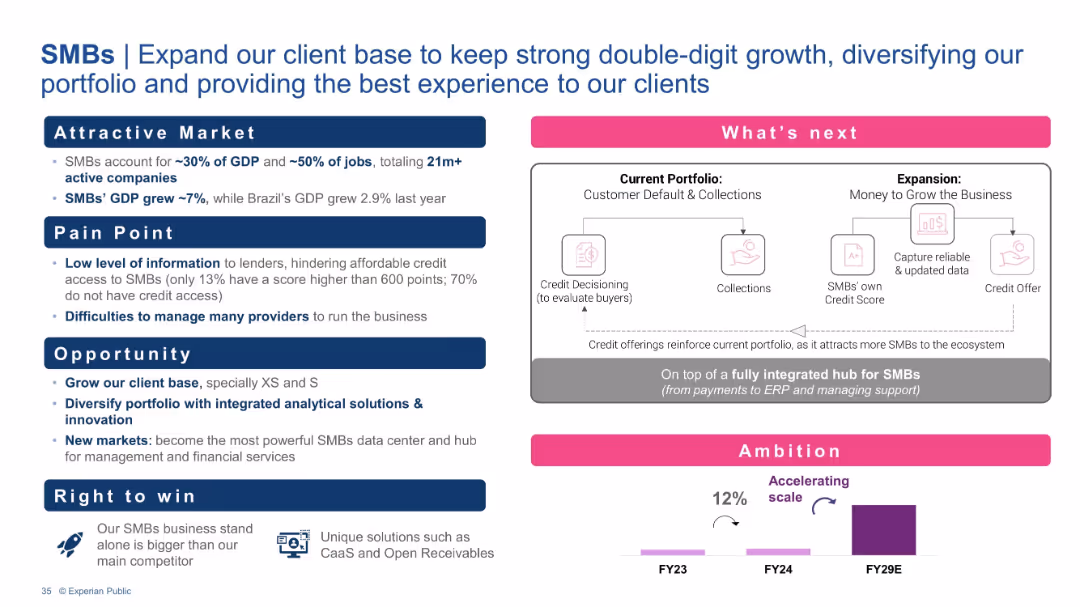
Pain-point/opportunity structure with market stats, a process diagram of Experian’s integrated hub, and an ambition chart.
Customer and Market Segmentation
Financial Services
This slide emphasizes the significance of SMBs in the economy and their challenges in accessing credit. Experian’s solution is a comprehensive data and financial hub, enabling expanded credit access and business growth, aiming for strong double-digit growth and market leadership.
SMBs, Credit access, Financial hub, Integrated solutions, GDP contribution, Data platform
false
Customer and Market Segmentation
Financial Services
Mixed Chart
Barclays
Add to my slides
Remove from favorites
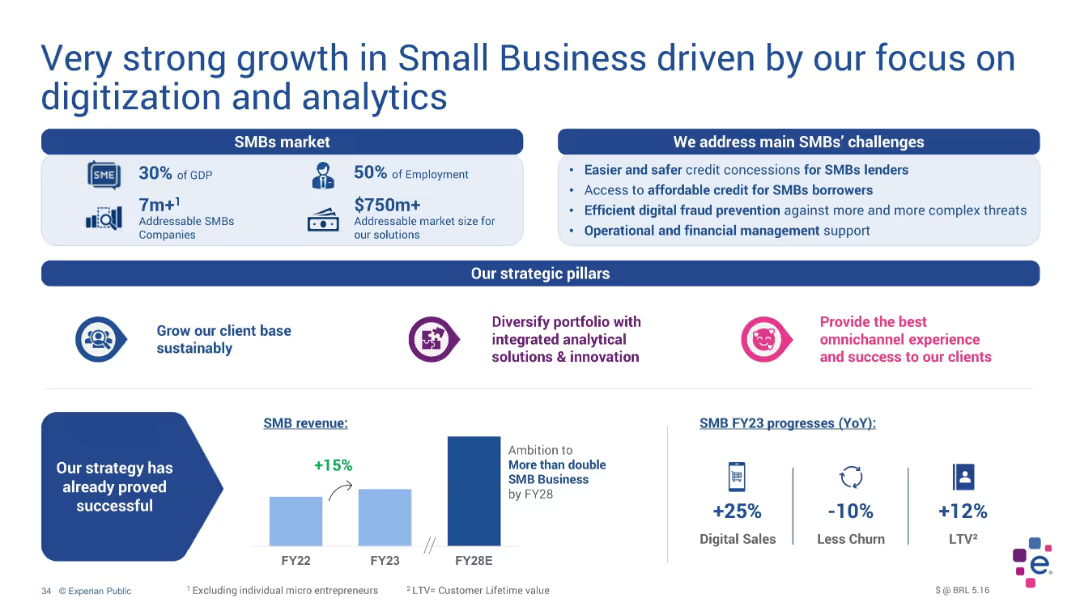
Three-section layout with stats, challenges, and strategic pillars; includes small bar chart and icons
Strategic Planning
Technology & Software
The slide outlines Experian's success in targeting SMBs, highlighting a 15% YoY revenue increase and ambitions to double by FY28. It presents key strategic pillars and FY23 progress metrics like churn reduction, digital sales growth, and LTV gains.
SMBs, digital sales, LTV, churn, strategy, growth, FY23, Experian
false
Strategic Planning
Technology & Software
Mixed Chart
Barclays
Add to my slides
Remove from favorites
Features a column chart displaying SME and corporate NPL sales volumes from 2010 to 2023. Different colors depict various projected growth rates under different scenarios.
Market Analysis and Trends
Financial Services
This slide projects SME and corporate NPL sales volumes in Turkey from 2010 to 2023, presenting different scenarios including optimistic, base, and conservative growth projections.
SME, corporate, NPL, growth, Turkey, projections
false
Market Analysis and Trends
Financial Services
Mixed Chart
PwC/Strategy&
Add to my slides
Remove from favorites
Multiple bar charts showing SME GVA vs. debt ratios for different countries and SME types, with callout boxes emphasizing NL's low new debt levels.
Financial Performance
Financial Services
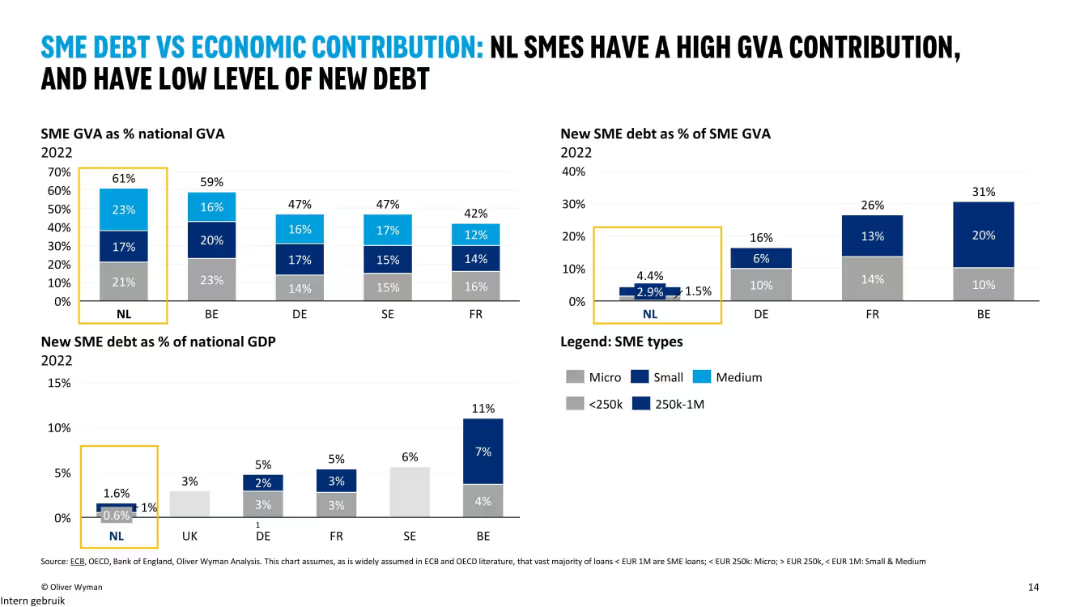
The slide illustrates that SMEs in the Netherlands contribute significantly to the economy (61% of GVA) while taking on relatively little new debt. It contrasts this with higher debt levels in countries like Belgium and France.
SME debt, GVA, economic contribution, NL, GDP, micro, small, medium
false
Financial Performance
Financial Services
Multiple Chart
Oliver Wyman
Add to my slides
Remove from favorites
Comparative country-level table with metrics spanning SME performance, orientation, bank loans, and non-bank financing; flags and performance colored heatmap; right-side summary of support models.
Market Analysis and Trends
Financial Services
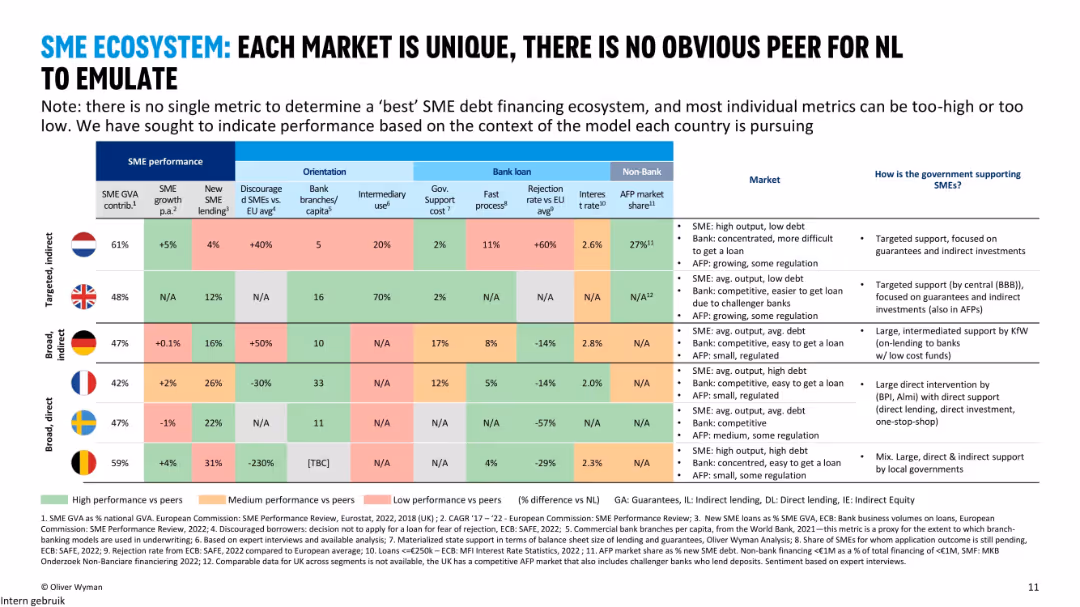
The slide compares SME financing ecosystems across six European countries using multiple indicators such as SME growth, lending, government support, and bank rejection rates. It highlights that there is no clear benchmark for the Netherlands to emulate due to varying models.
SME, GVA, bank lending, market comparison, government support, NL, UK, BE
false
Market Analysis and Trends
Financial Services
Mixed Chart
Oliver Wyman
Add to my slides
Remove from favorites
Bar and line charts showing SME GVA from 2008–2022, segment breakdowns, and growth rate comparisons by country; bullet points summarize insights.
Performance Metrics and KPIs
Financial Services
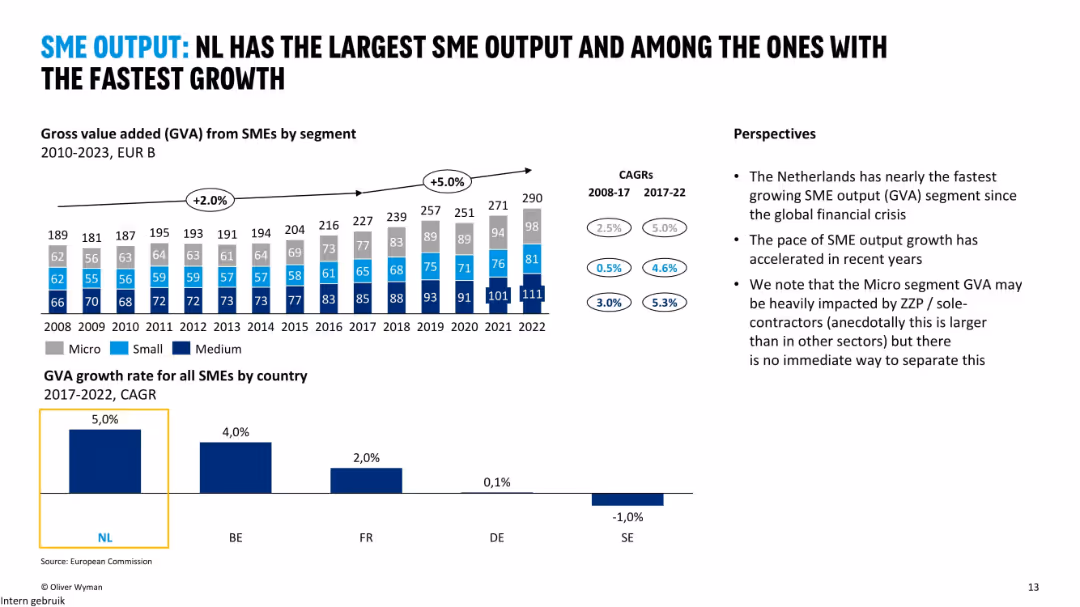
The slide emphasizes the Netherlands' high and accelerating SME output growth, especially in the Micro segment. It compares GVA by SME size and country, showing NL’s top performance in CAGR from 2017–2022.
SME GVA, NL, growth, micro segment, performance, CAGR, EU
false
Performance Metrics and KPIs
Financial Services
Multiple Chart
Oliver Wyman
Add to my slides
Remove from favorites
Four bar chart panels comparing 2018–2022 SME lending volumes and GDP share for Micro and Small & Medium loans, plus bullet perspectives.
Investment Analysis
Financial Services
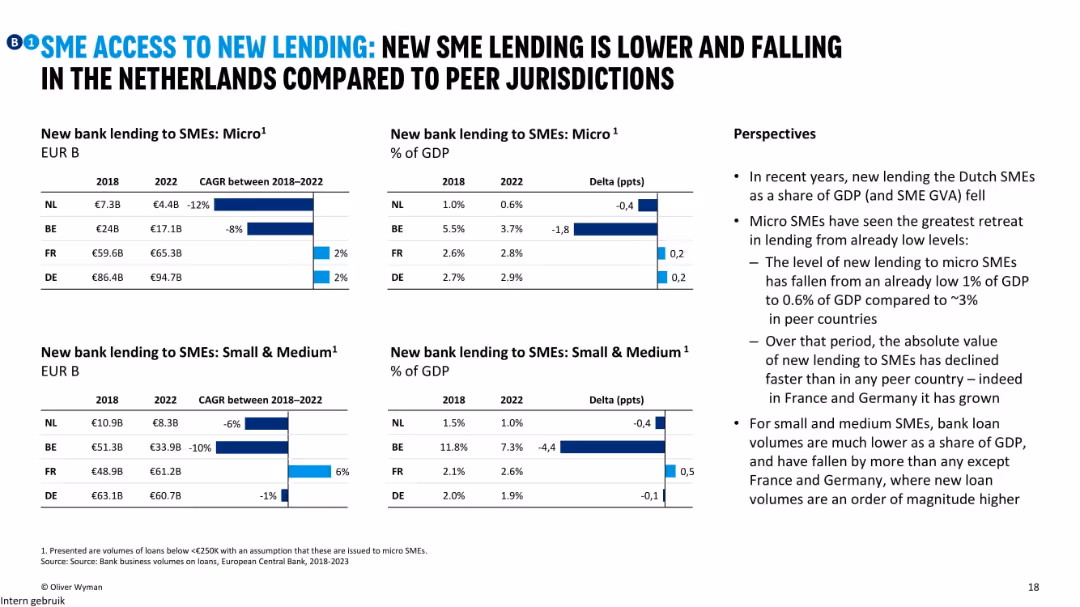
The slide shows a declining trend in new SME lending in the Netherlands, especially for micro enterprises. Lending volumes and GDP share dropped more than in other countries, indicating shrinking access to bank finance for SMEs in NL.
SME lending, micro, small & medium, GDP share, NL, volume decline
false
Investment Analysis
Financial Services
Multiple Chart
Oliver Wyman
Add to my slides
Remove from favorites
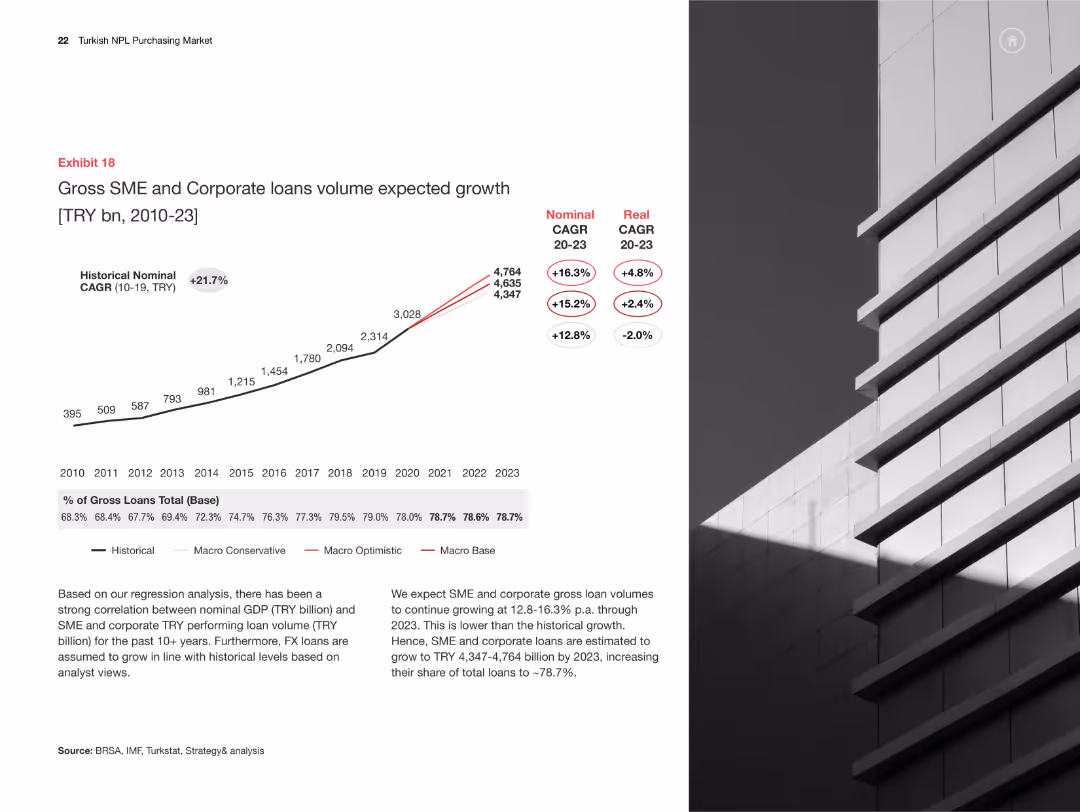
Line chart showing expected growth in SME and corporate loans volume from 2010-2023, with different growth scenarios.
Market Analysis and Trends
Financial Services
This slide forecasts SME and corporate loan volume growth in Turkey from 2010-2023, exploring various growth scenarios and economic impacts.
SME loans, corporate loans, growth forecast, economic analysis, financial projections, Turkey
false
Market Analysis and Trends
Financial Services
Mixed Chart
PwC/Strategy&
Add to my slides
Remove from favorites
Column chart predicting net SME and corporate NPL inflow volume from 2010-2023, with different growth scenarios.
Market Analysis and Trends
Financial Services
The slide forecasts net SME and corporate NPL inflow volumes in Turkey from 2010-2023, analyzing various economic impacts and scenarios.
SME NPL, corporate NPL, growth forecast, economic analysis, financial projections, Turkey
false
Market Analysis and Trends
Financial Services
Mixed Chart
PwC/Strategy&
Add to my slides
Remove from favorites
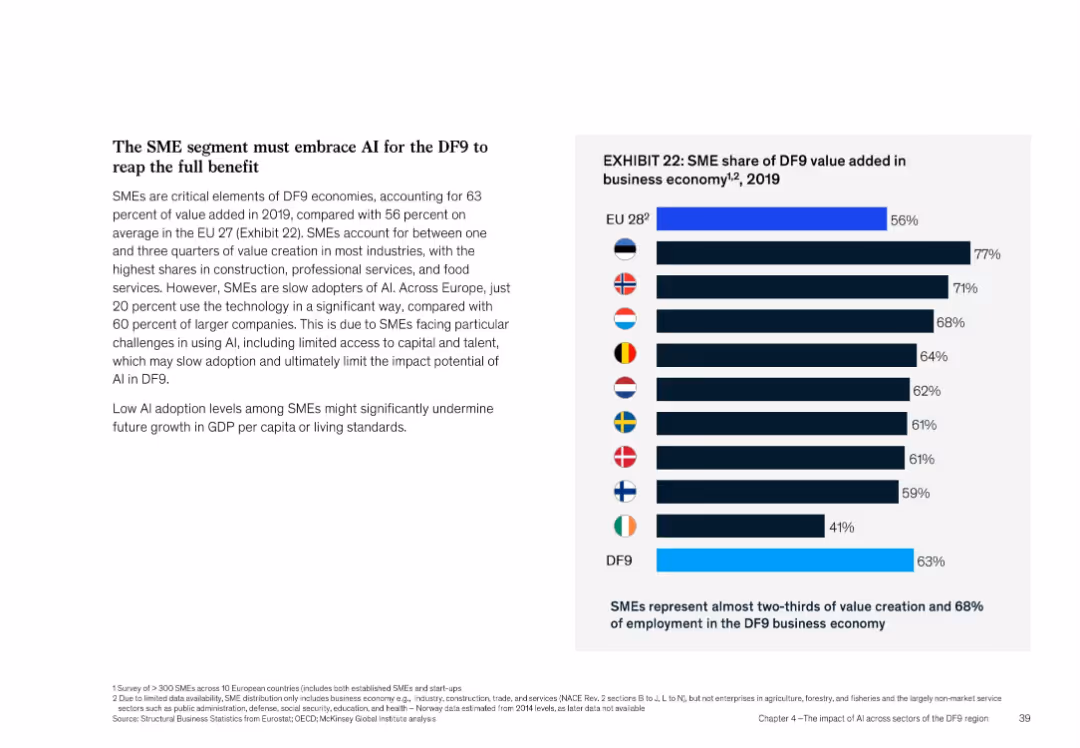
Bar chart comparing SME contribution in DF9 with EU countries, supported by narrative text on left
Organizational Structure and Change
Artificial Intelligence
Describes the role of SMEs in DF9 economies, highlighting their large contribution to value creation (63%) and employment (68%). Notes that SME AI adoption is low (~20%), which could hinder growth. Bar chart ranks SME contributions across EU nations.
SMEs, AI adoption, DF9, EU comparison, value creation, employment
false
Organizational Structure and Change
Artificial Intelligence
Mixed Chart
McKinsey
Add to my slides
Remove from favorites
A circular diagram slide depicting various digital solutions for end-to-end SME services with corresponding icons for each service category.
Technology and Digital Transformation
Financial Services
The slide showcases the ecosystem of digital solutions for SME services, suggesting a holistic approach to SME management. It's useful for understanding how digital services are becoming integrated to serve the end-to-end needs of small and medium enterprises.
SME Services, Digital Solutions, Ecosystem, Integration, Management
false
Technology and Digital Transformation
Financial Services
Diagram
Kearney
Add to my slides
Remove from favorites
Features logos of various start-ups in the SME services market, categorized by service type, against a cityscape background.
Competitive Landscape
Financial Services
The slide provides a snapshot of the start-up environment in the SME services sector, highlighting the market entry of specialized service providers. It's valuable for discussing the evolving competitive landscape and potential investment opportunities within the SME services space.
SME Services, Start-ups, Market Landscape, Service Providers, Investment Opportunities
false
Competitive Landscape
Financial Services
Header Vertical
Kearney
Add to my slides
Remove from favorites
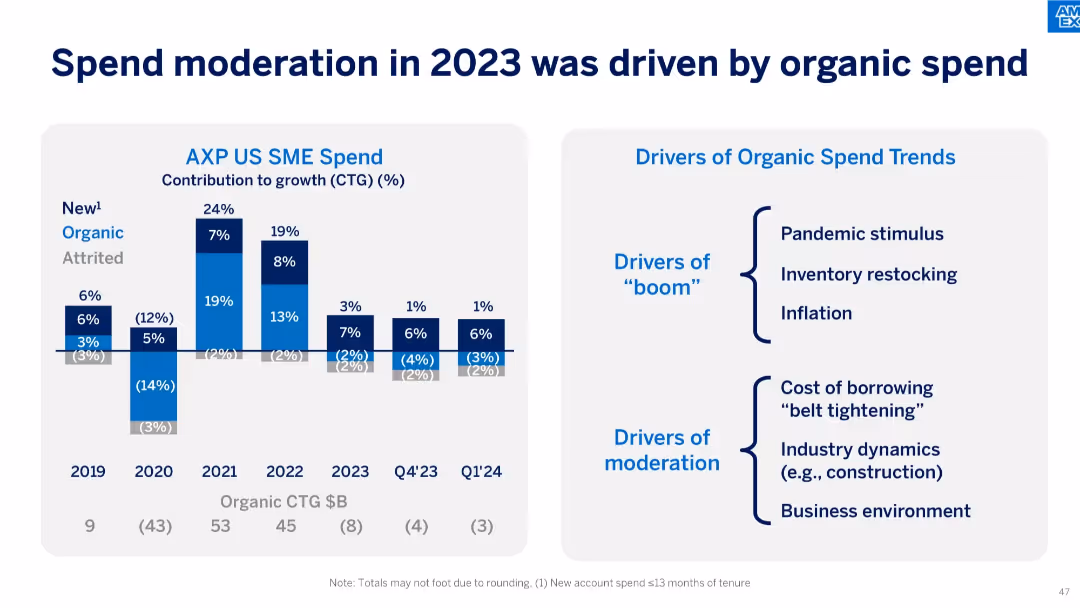
Left side features stacked bar charts showing different spend contributors (New, Organic, Attrited) from 2019 to Q1'24; right side lists "Drivers of Organic Spend Trends" divided into boom and moderation factors.
Operational Efficiency
Financial Services
The slide analyzes drivers of spend patterns in 2023, indicating moderation largely came from organic spend. Factors like cost of borrowing and business conditions contrast earlier drivers like stimulus and inflation.
SME, spend drivers, organic spend, moderation, stimulus, inflation, borrowing cost, CTG, pandemic recovery
false
Operational Efficiency
Financial Services
Mixed Chart
McKinsey
Add to my slides
Remove from favorites
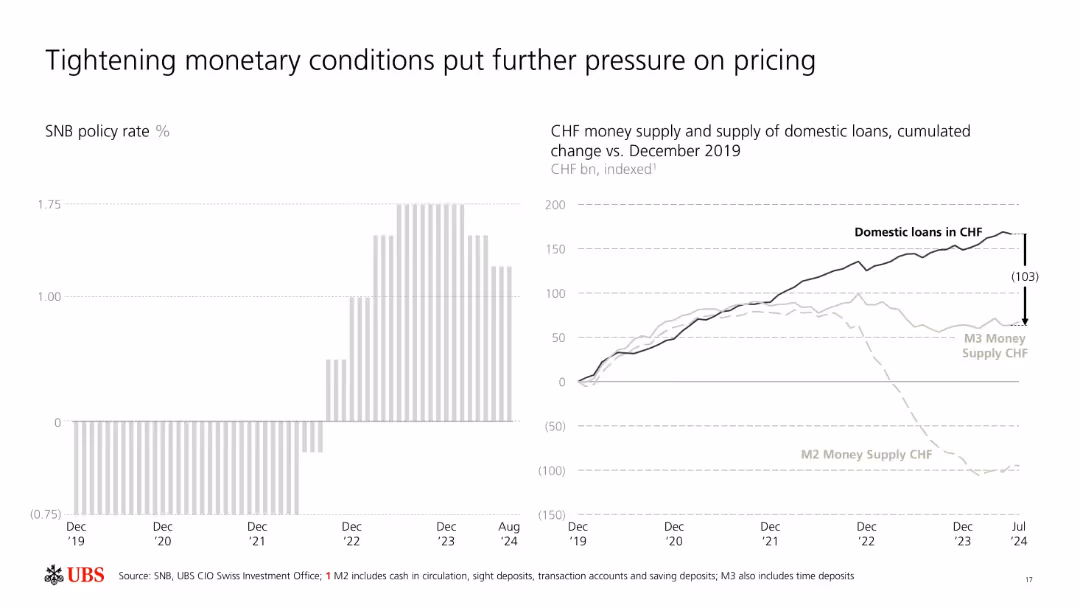
Dual-chart layout: bar chart of SNB policy rates and line graph of CHF loan/money supply trends.
Market Analysis and Trends
Financial Services
This slide shows the tightening of monetary policy by the SNB and its effects on domestic loan supply and CHF money supply (M2/M3). The decline in monetary aggregates vs. stable loan demand reflects increasing pricing pressure and tighter credit environments.
SNB, interest rates, CHF, loan supply, money supply, monetary tightening, M2, M3, pricing pressure, macroeconomic
false
Market Analysis and Trends
Financial Services
Multiple Chart
UBS
Add to my slides
Remove from favorites
The slide features a diagram of the Snowy 2.0 hydro scheme, with various reservoirs and flow directions indicated, accompanied by text explanations.
Strategic Planning
Energy & Utilities
Outlines the operational assumptions for the Snowy 2.0 project, including inflows, outflows, and storage capacities, highlighting key sensitivities in the model.
Snowy 2.0, hydro scheme, assumptions, inflows, outflows, storage, sensitivity, operational
false
Strategic Planning
Energy & Utilities
Diagram
EY
Add to my slides
Remove from favorites
This slide includes two line charts comparing Snowy 2.0 operation in Base Case and Option 3C across multiple scenarios, showing various capacity factors.
Market Analysis and Trends
Energy & Utilities
Analyzes the operational outcomes for Snowy 2.0 under different scenarios, comparing early and late increases in operations based on coal retirement assumptions.
Snowy 2.0, operation, Base Case, Option 3C, scenarios, capacity factors, coal retirement, comparison
false
Market Analysis and Trends
Energy & Utilities
Multiple Chart
EY
Add to my slides
Remove from favorites
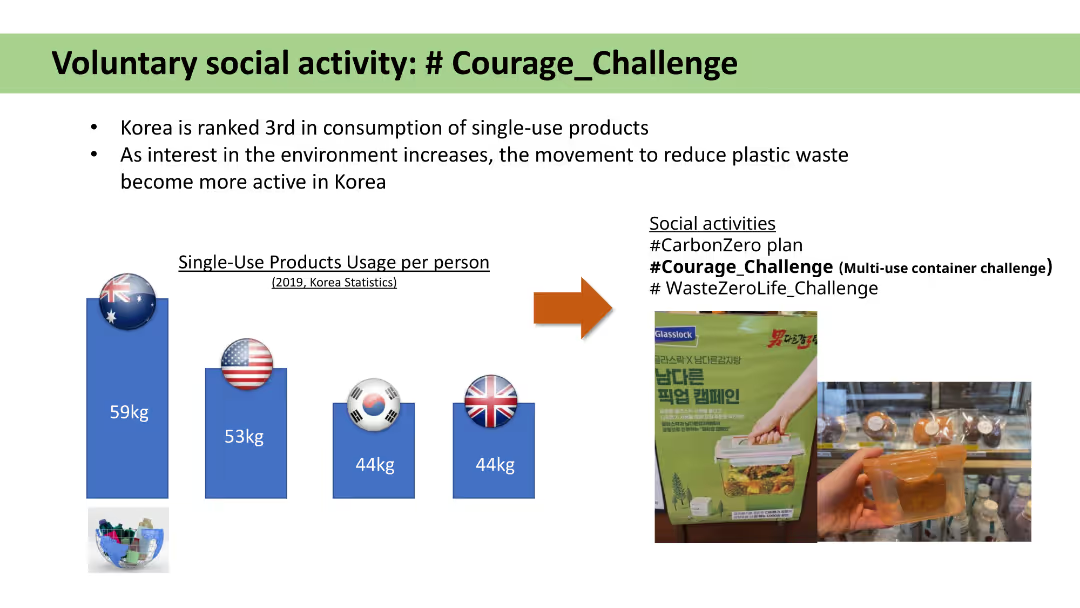
Combination of text, icons, and images showcasing social activities and single-use product statistics.
Strategic Planning
Environmental Services & Sustainability
Discusses Korea's ranking in single-use products and social initiatives to reduce plastic waste.
social activity, single-use, products, waste, Korea
false
Strategic Planning
Environmental Services & Sustainability
Mixed Chart
IPSOS
Add to my slides
Remove from favorites
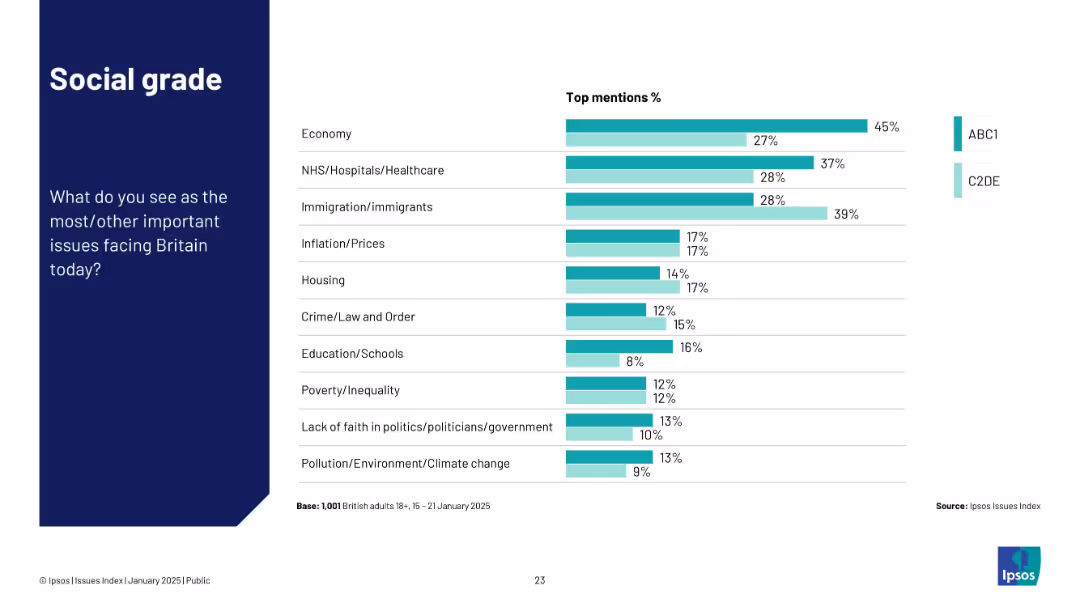
Horizontal bar chart segmented by social grade (ABC1 vs C2DE) on various societal issues.
Customer and Market Segmentation
Government & Public Sector
This slide explores differences in public issue priorities based on social class. Higher social grades (ABC1) rate the economy as most important, while lower grades (C2DE) are more concerned with housing, immigration, and healthcare.
social class, economy, housing, Ipsos, segmentation, concerns
false
Customer and Market Segmentation
Government & Public Sector
Mixed Chart
IPSOS
Add to my slides
Remove from favorites
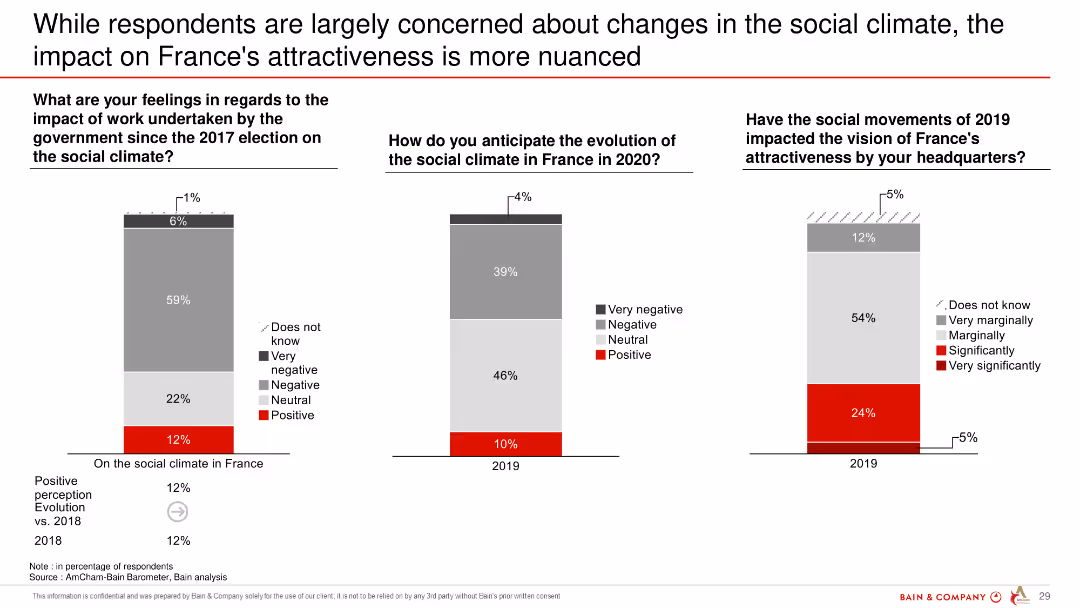
This slide presents three column charts showing respondents' views on the social climate in France and its impact on the country's attractiveness, including future expectations and the effect of social movements.
Market Analysis and Trends
Government & Public Sector
The slide indicates that while social climate concerns are significant, they have a nuanced impact on France's attractiveness, with varied expectations for future changes.
social climate, France, attractiveness, future expectations, social movements, survey
false
Market Analysis and Trends
Government & Public Sector
Multiple Chart
Bain
Add to my slides
Remove from favorites
The slide features a series of column charts comparing drivers and deterrents of France's attractiveness for foreign employees, focusing on social climate, taxation, and housing as key deterrents.
Market Analysis and Trends
Healthcare & Pharmaceuticals
Discusses factors influencing France's attractiveness to foreign employees, with a strong focus on social climate, taxation, and housing issues. The slide also explores the positive impact of healthcare access.
social climate, taxation, healthcare, France, attractiveness
false
Market Analysis and Trends
Healthcare & Pharmaceuticals
Single Chart
Bain
Add to my slides
Remove from favorites
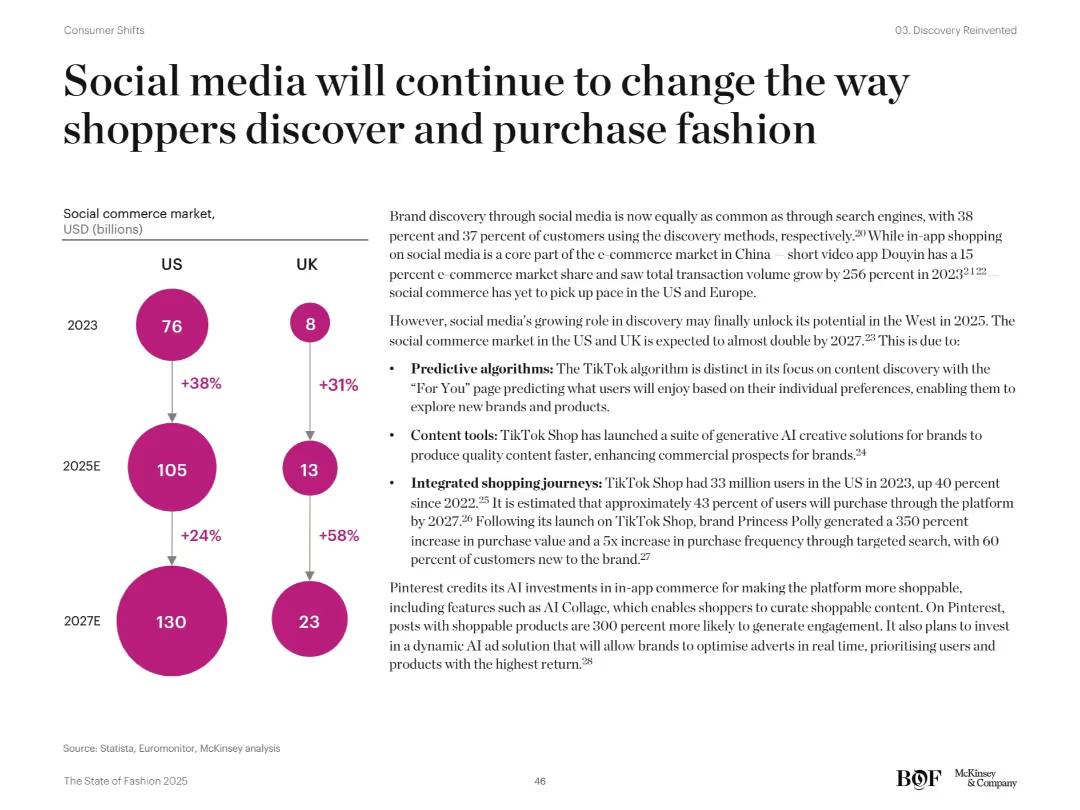
Split-page layout with left infographic (bubble chart) showing projected social commerce market growth in US/UK and right text explanation. Bright magenta circles and clean layout.
Customer and Market Segmentation
Retail & E-commerce
Projects strong growth in the US/UK social commerce market by 2027. Emphasizes TikTok’s role with predictive algorithms, content tools, and integrated shopping. Pinterest and other platforms’ strategies for engaging consumers are discussed.
social commerce, TikTok, Pinterest, predictive algorithms, e-commerce, market growth
false
Customer and Market Segmentation
Retail & E-commerce
Mixed Chart
McKinsey
Add to my slides
Remove from favorites
Features a flowchart and percentage breakdowns displaying the effects of broadband on social and community connections. The slide uses color coding to separate positive from negative impacts and includes a summary statistic block on the right.
Market Analysis and Trends
Telecommunications
Discusses the influence of broadband on enhancing social and community connections, including both positive and negative aspects.
Social, Community, Internet, Broadband, Connections, Positive, Negative, Impact, Telecommunications
false
Market Analysis and Trends
Telecommunications
Multiple Chart
Accenture
Add to my slides
Remove from favorites
The slide includes a left panel with a detailed text discussion and a right panel with three circular graphs illustrating the gap between importance and action taken in social and workplace networks.
Human Resources and Talent Management
Professional Services
The slide discusses the importance of social connections in the workplace and the disparity between their recognized importance and the actions taken to foster them, supported by survey data.
Social connections, workplace networks, employee engagement, survey data, action gap
false
Human Resources and Talent Management
Professional Services
Multiple Chart
PwC/Strategy&
Add to my slides
Remove from favorites
The slide includes a donut chart showing the frequency of social contact among the public. Net more than once a week and net less than once a week statistics are highlighted in text boxes.
Market Analysis and Trends
Healthcare & Pharmaceuticals
This slide highlights the frequency of social contact among the public, showing the percentage of people socialising more than once a week versus less than once a week, based on survey data.
social contact, frequency, survey, public opinion, interaction, donut chart, healthcare, trends, socializing
false
Market Analysis and Trends
Healthcare & Pharmaceuticals
Mixed Chart
IPSOS
Add to my slides
Remove from favorites
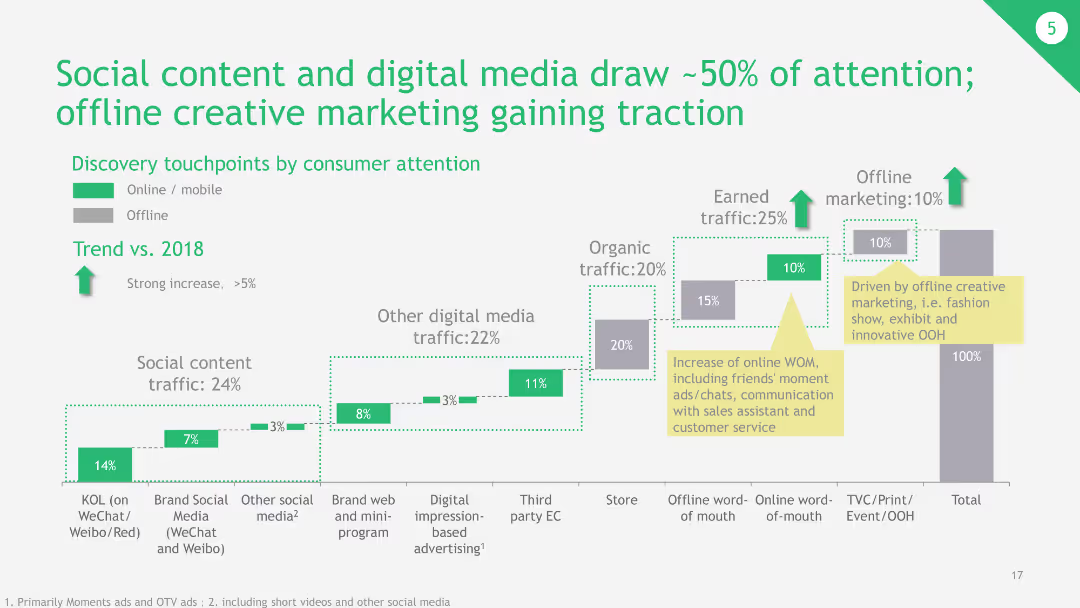
This slide has a combination of a column chart and bar chart. The column chart represents the discovery touchpoints by consumer attention in percentages, with a trend comparison from 2018.
Technology and Digital Transformation
Media & Entertainment
The slide highlights the significant role of social content and digital media in drawing consumer attention, showing a strong increase in digital media usage and earned traffic.
social content, digital media, offline marketing, consumer attention, discovery
false
Technology and Digital Transformation
Media & Entertainment
Single Chart
BCG
Add to my slides
Remove from favorites
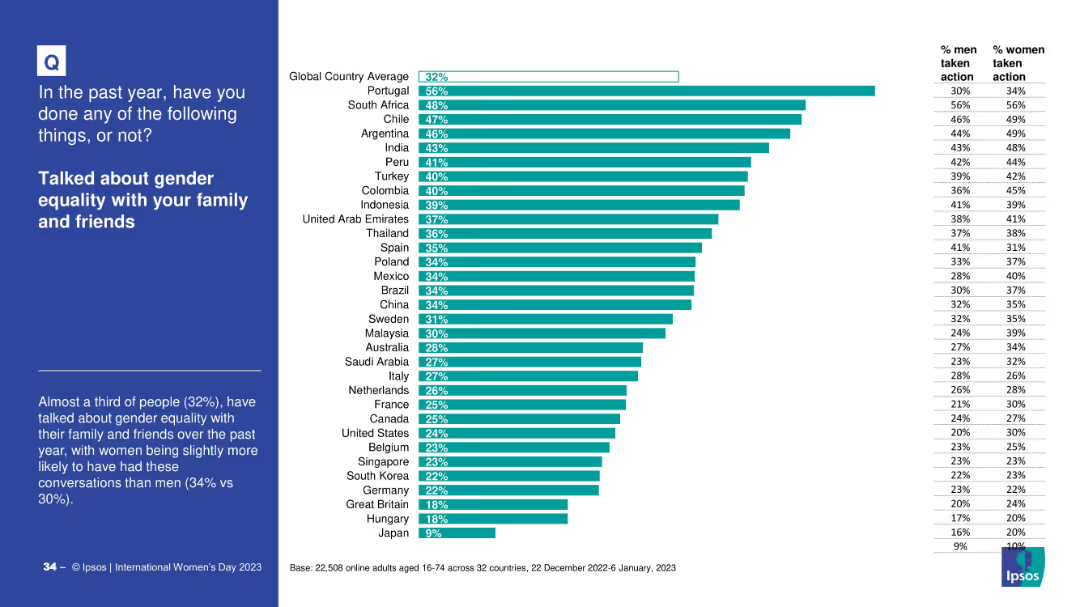
Country-level bar chart showing percentage of people who discussed gender equality with family/friends. Gender differences noted.
Strategic Planning
Government & Public Sector
This slide presents data on how often people discuss gender equality with family or friends, by country. Portugal leads at 56%, while Japan is lowest at 9%. Women are more likely to engage in such discussions than men.
social dialogue, family conversations, gender topics, awareness by country, opinion trends
false
Strategic Planning
Government & Public Sector
Mixed Chart
IPSOS
Add to my slides
Remove from favorites
Features a three-part diagram in shades of purple, each part highlighting a different social impact goal (access to finance, save money, reduce debt).
Operational Efficiency
Financial Services
This slide presents Experian's mission to leverage its platform to provide social benefits, detailing goals to improve financial access, save money for consumers, and reduce debt among US consumers.
social good, financial access, consumer savings, debt reduction, Experian
false
Operational Efficiency
Financial Services
Pillar
Barclays
Add to my slides
Remove from favorites
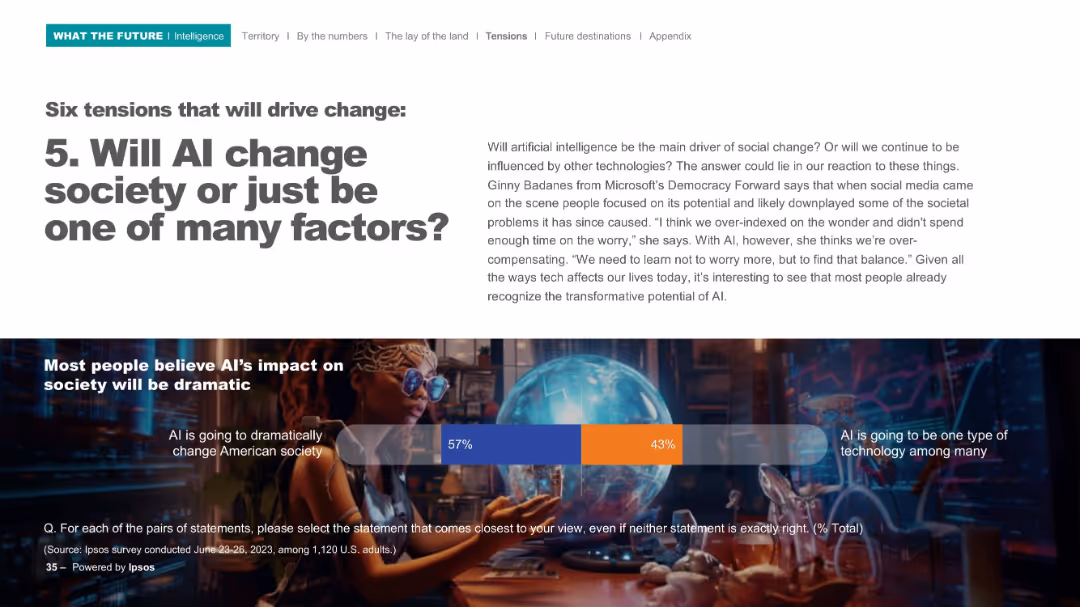
Slide has a large title and paragraph followed by a split bar chart with sentiment data. AI-themed background image supports narrative.
Industry Overview
Artificial Intelligence
This slide examines whether AI will be a major transformative force in society or just one among many. Survey results show most people believe AI will dramatically change society, with fewer viewing it as just another tech evolution.
social impact, AI, transformation, technology
false
Industry Overview
Artificial Intelligence
Mixed Chart
IPSOS
Add to my slides
Remove from favorites
The slide uses flowchart to compare the terminology used in different approaches to social impact measurement. It features lists and connecting lines to match related terms.
Industry Overview
Telecommunications
This slide compares various methodologies for measuring social impact, emphasizing the commonality despite different terminologies used. It breaks down the process into seven steps.
social impact, measurement, terminology, methodology, comparison, steps
false
Industry Overview
Telecommunications
Linear Flow
Accenture
Add to my slides
Remove from favorites
The slide uses a structured format with headers and bullet points under each of the seven steps, describing the actions associated with each phase of social impact reporting.
Regulatory and Compliance
Telecommunications
This slide outlines a structured seven-step approach for assessing social impact, using NBN Co as a case study, highlighting industry-referenced frameworks.
social impact, NBN Co, frameworks, reporting, case study, structured approach
false
Regulatory and Compliance
Telecommunications
Linear Flow
Accenture
Add to my slides
Remove from favorites
This slide presents a column chart comparing product development and profitability from socially-driven initiatives, contrasting German and global data. Layout is clear and focused on highlighting comparative analysis.
Product and Service Analysis
Professional Services
Discusses the development and impact of socially-driven products, comparing approaches and outcomes between German and global businesses. It is useful for evaluating corporate social responsibility in product development and business profitability.
Social impact, product development, CSR, profitability, German vs. global
false
Product and Service Analysis
Professional Services
Single Chart
Deloitte
Add to my slides
Remove from favorites
Slide includes a structured layout with purple highlights. Features guiding principles from various standards and input from NBN Co regarding social impact measurements.
Market Analysis and Trends
Telecommunications
Discusses the guiding principles for social impact assessments in broadband projects, referencing industry standards and stakeholder inputs.
social impact, standards, broadband, NBN Co, guidelines, measurement, industry standards, principles, documentation, stakeholder input
false
Market Analysis and Trends
Telecommunications
Header Vertical
Accenture
Add to my slides
Remove from favorites
The slide is split into three sections by diagonal lines with icons and text boxes listing various standards and systems related to social impact measurement.
Industry Overview
Telecommunications
This slide presents an overview of the complex landscape of social impact measurement, highlighting the lack of a standardized approach and listing various methodologies and frameworks.
social impact, standards, measurement, methodologies, frameworks, complexity
false
Industry Overview
Telecommunications
Header Vertical
Accenture
Add to my slides
Remove from favorites
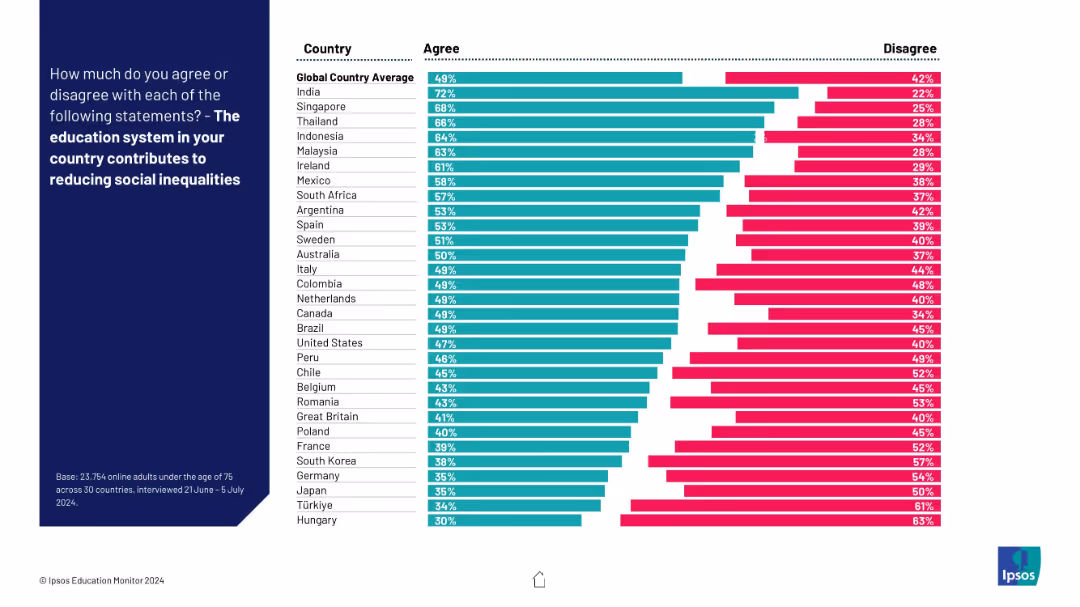
Horizontal bar chart ranking countries by agreement/disagreement. Uses teal and pink to differentiate views.
Regulatory and Compliance
Education & Training
This chart highlights varying national views on whether education systems help reduce social inequality. India and Singapore score highest; Hungary ranks lowest. It suggests wide disparities in perceived social impact of education systems.
social inequality, education impact, global opinion, regulatory context, country-level data
false
Regulatory and Compliance
Education & Training
Mixed Chart
IPSOS
Add to my slides
Remove from favorites
Packed with line graphs, area charts, and world maps, detailing economic and social indicators across different regions.
Market Analysis and Trends
Financial Services
Explores the global economic divides and social instability, providing insights into economic policies and social welfare strategies.
Social Instability, Economic Divide, Global Analysis, Policy Development, Welfare Strategies
false
Market Analysis and Trends
Financial Services
Multiple Chart
PwC/Strategy&
Add to my slides
Remove from favorites
Includes image of a workplace and a timeline graph, with text discussing the impact of digital interactions on social connections.
Customer and Market Segmentation
Technology & Software
Discusses the shift in consumer interactions, focusing on authentic and emotionally driven engagements due to digital overload.
social interaction, digital fatigue, brand engagement, emotional impact
false
Customer and Market Segmentation
Technology & Software
Multiple Chart
Bain
Add to my slides
Remove from favorites
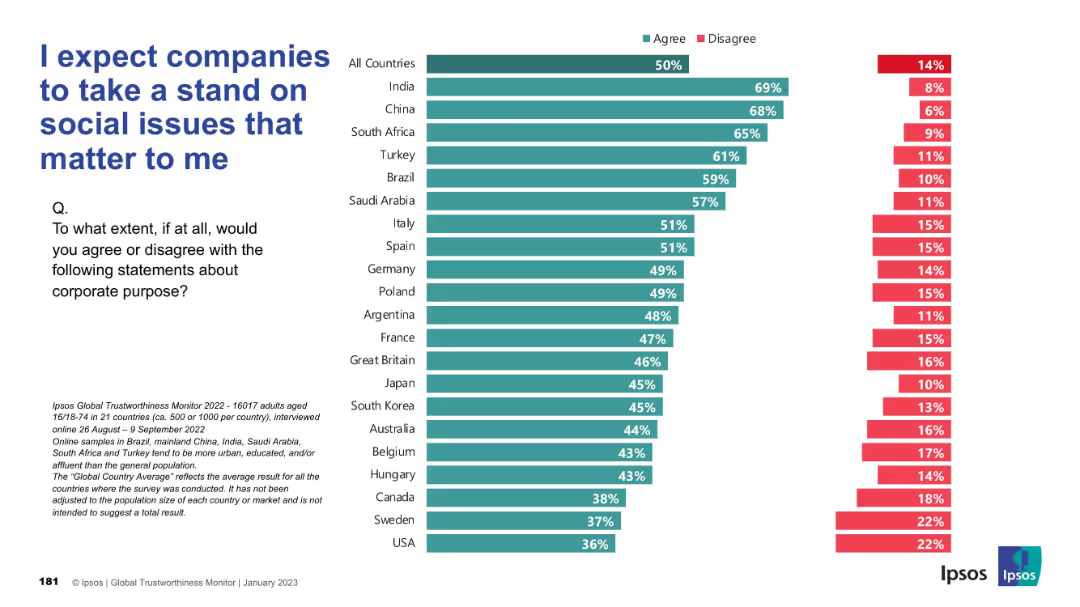
Horizontal bar chart, percentages of agreement vs disagreement per country, typical Ipsos format
Customer and Market Segmentation
Consumer Goods
This slide explores expectations for companies to engage in social issues. India and China show high expectations, while USA and Sweden show the least. The global average indicates that half of respondents support activism by brands.
social issues, corporate activism, consumer expectation, public opinion, Ipsos, global sentiment, brand responsibility
false
Customer and Market Segmentation
Consumer Goods
Mixed Chart
IPSOS
Add to my slides
Remove from favorites
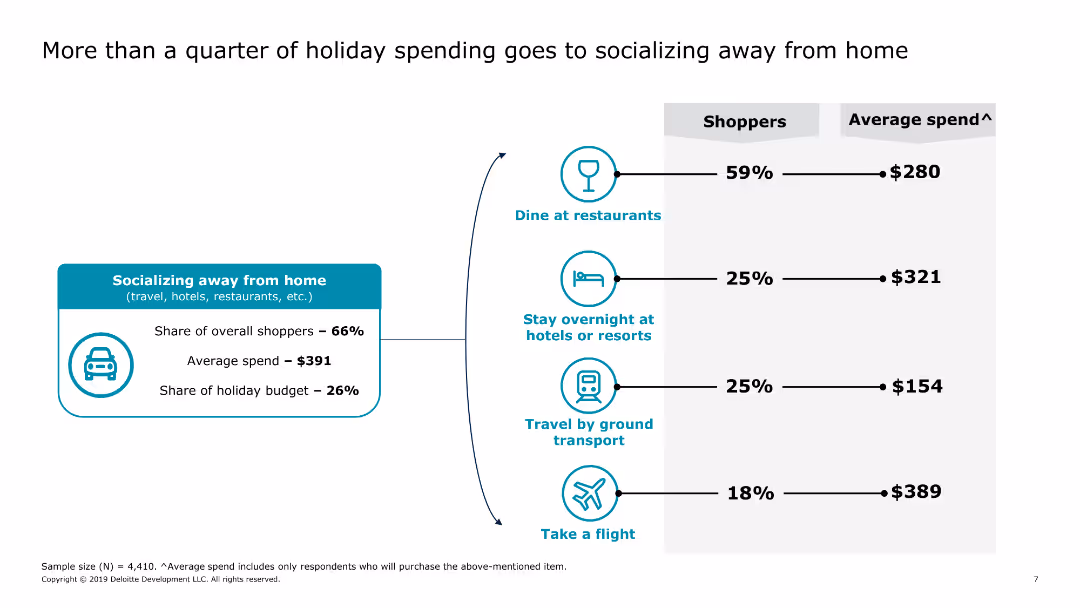
The slide features a combination of icons and a bar chart detailing socializing-related spending.
Market Analysis and Trends
Retail & E-commerce
Details the portion of holiday spending dedicated to socializing away from home, including dining, travel, and accommodations, with average spend per category.
socializing, holiday, spending, dining, travel, accommodations
false
Market Analysis and Trends
Retail & E-commerce
Diagram
Deloitte
Add to my slides
Remove from favorites
Features bar charts displaying preferred locations for socialization, along with a notable quote from a survey respondent.
Market Analysis and Trends
Retail & E-commerce
Reveals consumer preferences for socializing in the upcoming months, with a strong inclination towards home settings and virtual connections.
Socializing trends, Consumer preferences, Virtual connection, Home setting, Market research, Bar charts, Survey insights, Telecommunications
false
Market Analysis and Trends
Retail & E-commerce
Single Chart
Accenture
Add to my slides
Remove from favorites
Bar chart showing the share of consumers by age who describe themselves as addicted to social media in 2019, and a column chart showing the average daily time spent on social media from 2012 to 2021.
Market Analysis and Trends
Media & Entertainment
The slide highlights the impact of social media addiction, particularly among younger age groups. It presents data on the percentage of users addicted to social media by age and the increasing amount of time spent on social media daily, raising concerns about the negative societal effects of pervasive social media use.
Social Media, Addiction, Time Spent, Age Groups
false
Market Analysis and Trends
Media & Entertainment
Multiple Chart
Roland Berger
Add to my slides
Remove from favorites
Features a line graph showing social media advertising revenues from 2012 to 2020, split into first and last six months of each year, indicating growth over time.
Market Analysis and Trends
Media & Entertainment
Highlights the continuous growth in social media advertising revenues, reaching $41.5 billion in 2020, with a substantial rise in the latter half of the year.
social media, advertising, revenue, growth, 2012-2020
false
Market Analysis and Trends
Media & Entertainment
Single Chart
PwC/Strategy&
Add to my slides
Remove from favorites
Previous
Next
You don't have any favorites yet.
Please wait loading your favorites slides...
Create a FREE account to continue browsing
Receive Instant Access to 1,000+ slides from companies like McKinsey, Google, and Goldman Sachs
First Name
Last Name
Email
Password
I agree to all
Terms & Privacy Policy
Thank you! Your submission has been received!
Oops! Something went wrong while submitting the form.
Have an account?
Sign in
Upgrade to PRO to Save slides
Advanced Search and Filters
Access to 15,000+ slides
Access to Category Pages
Save/Bookmark Slides
PowerPoint Template Library
Pick a Plan
MONTHLY
$12/month
Billed every month, Cancel anytime.
YEARLY
$9/year
Billed $108 annually, Cancel anytime.
Checkout for $12/month
Checkout for $108/yr
Secured by Stripe | AES-256 bit encryption


![Exhibit 24 SME and Corporate NPL Sales Volume Expected Growth [TRY bn, 2010-23]](https://cdn.prod.website-files.com/654e70fb59937215cac87b19/6877e21aeb476b1fdcc185c3_JUV2Ft2aoK3lB7moNg0pc5IvqkFprqK0Sp_gat148wU.avif)
![Exhibit 21 Net SME and Corporate NPL inflow volume expected growth [TRY bn, 2010-23]](https://cdn.prod.website-files.com/654e70fb59937215cac87b19/6877e20fe12f348b3c826c6c_tkMlruY99zc1fTgrR_-gzjy8w1cEAcGj7PCF5vr-SHw.avif)