My Account
My Slides
Search by Category
Pricing
Templates
View All Templates
Download Template Slides
✦ AI Search
Feedback
Login
Logout
Get Started
Browse all Slides
Browse all Slides
Create a FREE Account
Instant access to 1,000+ real slides from top companies like McKinsey, BCG, Goldman Sachs, Google and many more!
First Name
Last Name
Email
Password
I agree to all
Terms & Privacy Policy
Thank you! Your submission has been received!
Oops! Something went wrong while submitting the form.
Have an account?
Sign in
Saved Slides
Total No. of slides saved
0
↻ Refresh
✖ Clear all
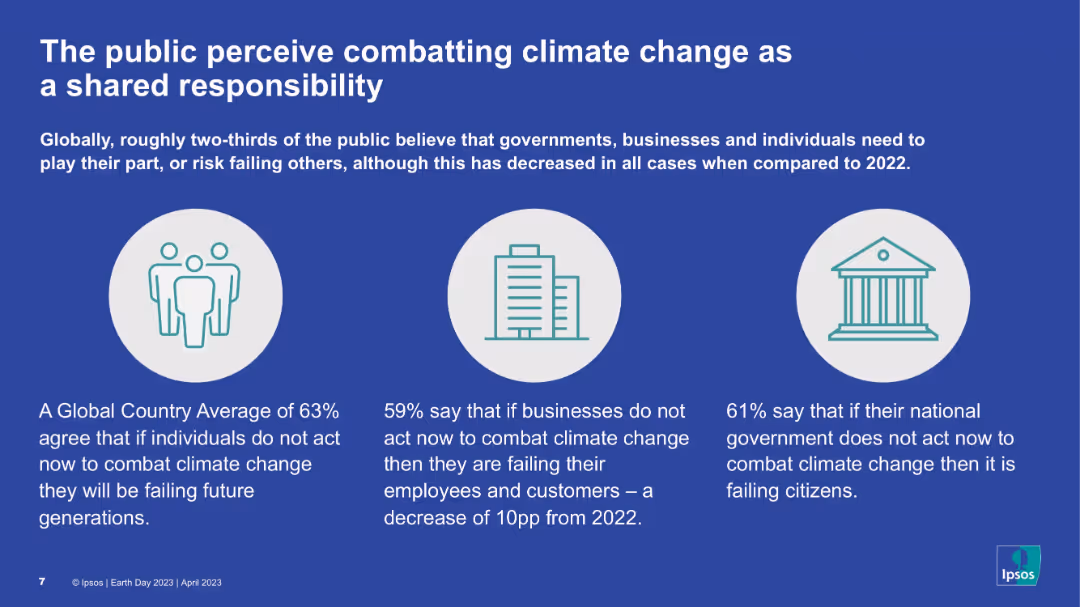
Blue background, three circular icons representing people, buildings, and government; text below each icon summarizing opinions.
Strategic Planning
Environmental Services & Sustainability
The slide communicates that most people globally believe combating climate change is a shared duty among individuals, businesses, and governments. While agreement is still high, it has declined from previous years. Visuals simplify key message segments by stakeholder.
Shared responsibility, Climate change, Individuals, Government, Businesses, Public views
false
Strategic Planning
Environmental Services & Sustainability
Pillar
IPSOS
Add to my slides
Remove from favorites
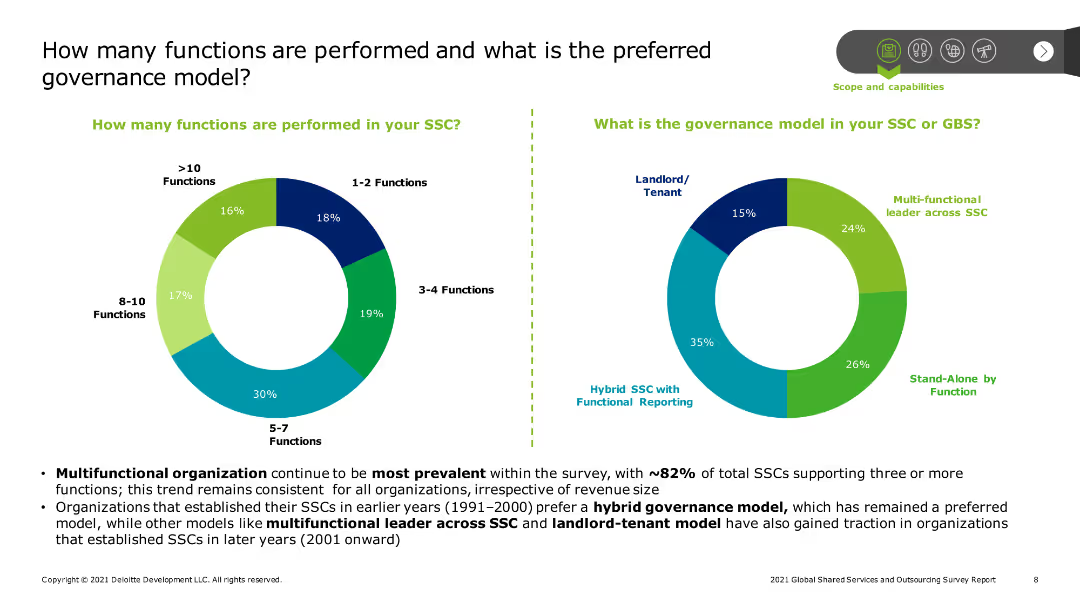
The slide features two pie charts. The left chart shows the distribution of functions performed by SSCs, ranging from 1-2 to more than 10 functions. The right chart displays preferred governance models, including multi-functional leader, stand-alone by function, and hybrid SSC.
Operational Efficiency
Professional Services
The slide analyzes the operational scope and governance models of Shared Service Centers (SSCs). It presents data on the number of functions performed by SSCs and the preferred governance structures, indicating trends towards multifunctionality and hybrid models.
Shared Service Centers, SSC functions, governance models, multifunctionality, hybrid SSC, operational efficiency, professional services, operational scope
false
Operational Efficiency
Professional Services
Multiple Chart
Deloitte
Add to my slides
Remove from favorites
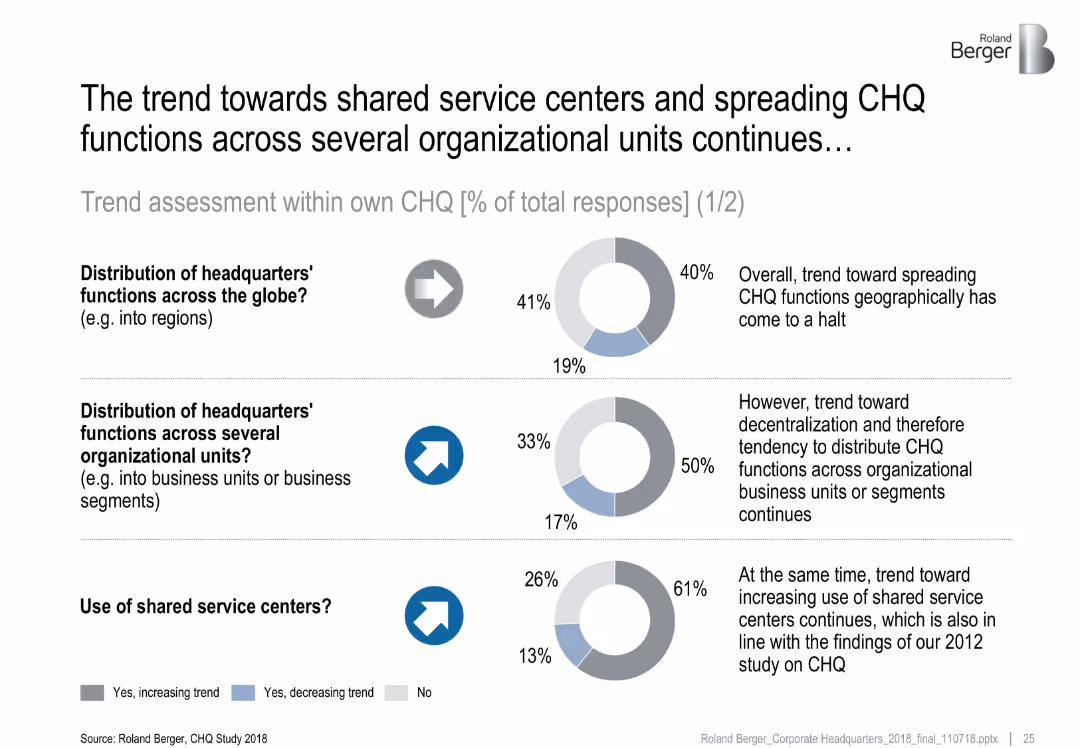
Three donut charts show survey results on distribution and shared services; arrows and commentary text provided
Organizational Structure and Change
Professional Services
This slide highlights survey responses on CHQ functional distribution trends. While global spreading has stagnated, decentralization into business units and the use of shared service centers are rising. Commentary explains strategic implications.
shared services, CHQ, decentralization, trend analysis, headquarters
false
Organizational Structure and Change
Professional Services
Multiple Chart
Roland Berger
Add to my slides
Remove from favorites
Pie chart and a bar chart detailing plans for refining shared services center footprints over the next three years.
Operational Efficiency
Professional Services
Details strategies and plans for optimizing the footprint of shared services centers, highlighting cost and talent factors.
shared services, footprint refinement, pie chart, bar chart, optimization
false
Operational Efficiency
Professional Services
Multiple Chart
Deloitte
Add to my slides
Remove from favorites
Features a pie chart illustrating the distribution of functions within service centers, reflecting scope of operations.
Strategic Planning
Professional Services
Focuses on the expanding scope of shared services, particularly in functions performed, useful for strategic planning and development of service centers.
shared services, functions, strategic, planning, expansion, development, operations
false
Strategic Planning
Professional Services
Mixed Chart
Deloitte
Add to my slides
Remove from favorites
Slide shows a bar chart with rankings of service attributes, a bulleted list of key findings on shared services, and simple graphical elements in green and blue. Layout includes side-by-side content and graphics sections.
Market Analysis and Trends
Professional Services
The slide presents key findings from a 2017 survey on shared services, focusing on governance and operational priorities such as cost and timeliness of services. It’s used to compare changes in priorities over time and their impact on business strategies.
Shared services, governance, cost, timeliness, survey, operational priorities
false
Market Analysis and Trends
Professional Services
Mixed Chart
Deloitte
Add to my slides
Remove from favorites
Contains circular diagrams and a timeline, visually depicting the process and timing of adopting shared services. The design is clean and focused on displaying chronological data.
Strategic Planning
Professional Services
Discusses strategies and approaches to implementing shared services, focusing on timing and standardization processes. It can be used to guide strategic planning and risk management during the transition to shared services.
Shared services, implementation strategies, standardization, process timing, transition
false
Strategic Planning
Professional Services
Multiple Chart
Deloitte
Add to my slides
Remove from favorites
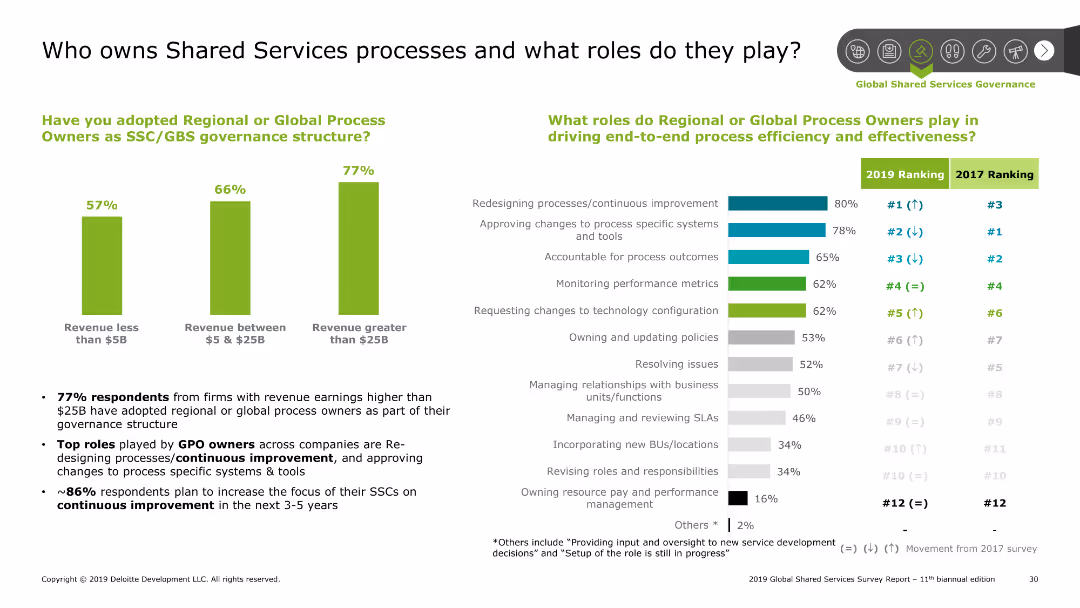
The slide has a column chart and bar chart. The column chart shows the adoption of process owners by revenue, and the bar chart shows roles by rank.
Human Resources and Talent Management
Professional Services
This slide discusses the ownership of shared services processes and the roles of global process owners. It highlights the adoption rate by company size and key roles.
Shared Services, processes, roles, governance, adoption
false
Human Resources and Talent Management
Professional Services
Multiple Chart
Deloitte
Add to my slides
Remove from favorites
This slide presents multiple bar charts depicting productivity improvements and cost savings in shared services. The layout balances text and graphical data effectively.
Operational Efficiency
Professional Services
Analyzes the annual productivity improvements and cost savings achieved through shared services, useful for evaluating operational efficiency and financial performance in organizational settings.
Shared services, productivity, cost savings, operational efficiency, financial performance
false
Operational Efficiency
Professional Services
Multiple Chart
Deloitte
Add to my slides
Remove from favorites
Features bar charts comparing functions within shared services and their expected changes in scope and capacity over time. The layout is straightforward with a focus on future planning.
Strategic Planning
Professional Services
Evaluates future strategic directions for shared services, including increases in scope and capacity. This slide is useful for discussions on long-term planning and the integration of technology in service delivery.
Shared services, strategic planning, scope expansion, technology integration, future trends
false
Strategic Planning
Professional Services
Mixed Chart
Deloitte
Add to my slides
Remove from favorites
Percentages and sector-specific icons representing various industries, discussing survey response distribution and focus areas.
Industry Overview
Professional Services
Provides an overview of industry responses to a global survey, focusing on shared services and sectoral breakdown.
shared services, survey, industry distribution, bar chart, operational efficiency
false
Industry Overview
Professional Services
Pillar
Deloitte
Add to my slides
Remove from favorites
A content slide with text on the left and a column chart on the right. The chart shows areas with current or planned central team utilities.
Operational Efficiency
Financial Services
The slide addresses the future of shared utilities in risk management, focusing on areas like AI model risk management and data governance for centralized teams.
shared utility, risk management, AI, data governance, central teams
false
Operational Efficiency
Financial Services
Mixed Chart
EY
Add to my slides
Remove from favorites
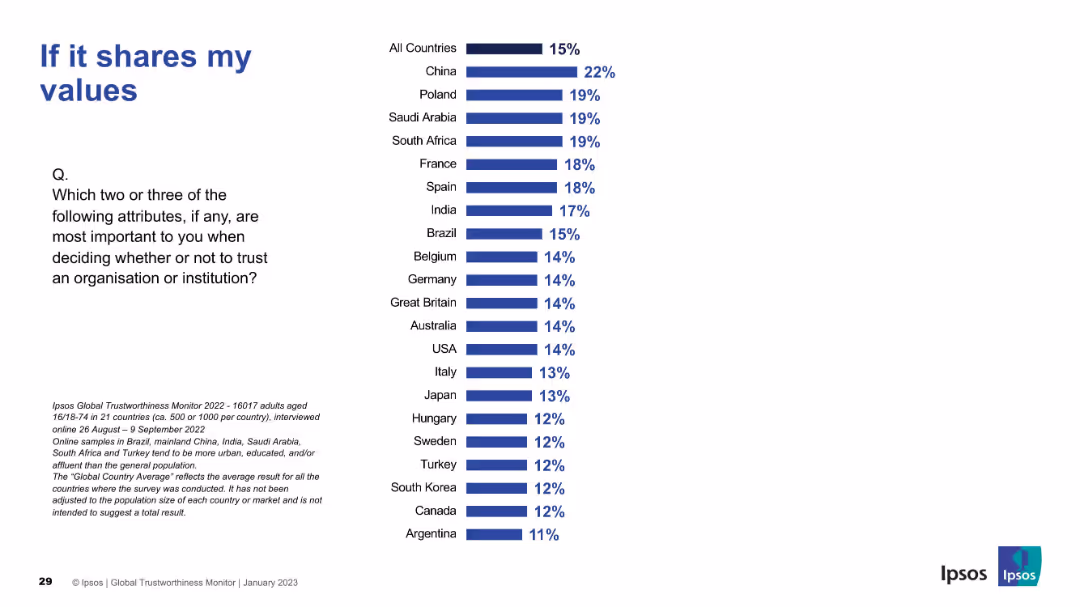
Standard bar chart layout. China, Poland, and Saudi Arabia show higher importance placed on value alignment.
Market Analysis and Trends
Professional Services
This slide evaluates how alignment of values affects trust. Cultural differences are evident, with Western countries generally placing less emphasis than Eastern ones.
shared values, personal beliefs, trust alignment, Ipsos, international differences
false
Market Analysis and Trends
Professional Services
Mixed Chart
IPSOS
Add to my slides
Remove from favorites
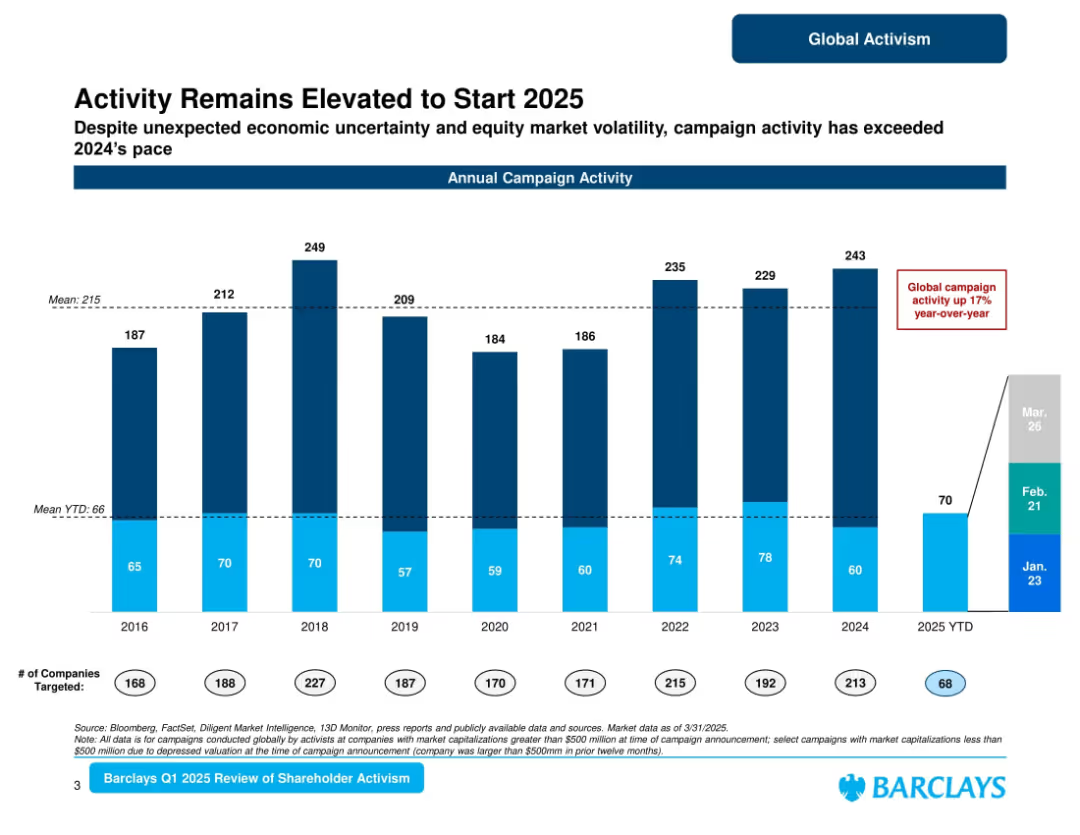
Large central bar chart of annual campaign activity; includes mean markers and current YTD bar; supporting metrics below.
Market Analysis and Trends
Financial Services
Summarizes global shareholder activism campaigns from 2016 to Q1 2025. Notes a 17% YoY increase in campaign activity and a strong start to 2025. Includes number of companies targeted and average values. Highlights continued investor interest despite volatility.
shareholder activism, campaign trends, annual activity, 2025, Barclays, global campaigns, equity markets
false
Market Analysis and Trends
Financial Services
Single Chart
Barclays
Add to my slides
Remove from favorites
The slide has a combination of icons, bullet points, and a column chart showing annual shareholder activism campaigns in the US by size from 2017 to 2023. The layout is visually appealing and informative.
Risk Assessment and Management
Financial Services
The slide outlines key areas of focus for shareholder activism and the trends in activism campaigns over recent years, emphasizing the sectors most targeted by activists.
shareholder activism, trends, campaigns
false
Risk Assessment and Management
Financial Services
Mixed Chart
JP Morgan
Add to my slides
Remove from favorites
Slide contains column charts showing historical and projected shareholder distributions, including dividends and share buy-backs, presented in an easy-to-follow layout.
Strategic Planning
Financial Services
Summarizes the bank's shareholder distribution strategy, showing past data and future targets, suitable for discussions on financial planning and shareholder engagement.
shareholder, distribution, dividends, buy-backs, financial, planning, strategy, future, past, engagement
false
Strategic Planning
Financial Services
Multiple Chart
Deutsche Bank
Add to my slides
Remove from favorites
This slide features a combination of column charts and text. The left chart illustrates total payout, with the columns representing different amounts for dividends and buybacks from 2022 to 2026. The right chart provides detailed breakdowns.
Financial Performance
Financial Services
The slide discusses Deutsche Bank's commitment to increasing shareholder distributions, including share buybacks and dividends from 2022 to 2026. It highlights specific figures and projections for payouts and capital generation.
shareholder, distributions, dividends, buybacks, capital generation, projections, payouts, financial performance, Deutsche Bank
false
Financial Performance
Financial Services
Multiple Chart
Deutsche Bank
Add to my slides
Remove from favorites
Depicts future shareholder distributions through column charts for share buy-backs and dividends over upcoming years.
Financial Performance
Financial Services
Illustrates Deutsche Bank's strategy for increasing shareholder payouts, showing historical data and future projections.
shareholder, distributions, dividends, buy-backs, future, strategy, financial, bar graphs, payouts, projections
false
Financial Performance
Financial Services
Multiple Chart
Deutsche Bank
Add to my slides
Remove from favorites
Slide contains column charts and future projections.
Investment Analysis
Financial Services
Highlights plans and performance regarding shareholder distributions.
shareholder, dividends, buybacks
false
Investment Analysis
Financial Services
Multiple Chart
Deutsche Bank
Add to my slides
Remove from favorites
This slide uses column charts to illustrate past and projected shareholder distributions, emphasizing growth in dividends with a clean, professional layout.
Financial Performance
Financial Services
Illustrates Deutsche Bank's historical and future shareholder distribution plans, emphasizing increased dividends and buy-backs.
Shareholder, dividends, Deutsche Bank, distribution, growth, financial planning, buy-backs
false
Financial Performance
Financial Services
Multiple Chart
Deutsche Bank
Add to my slides
Remove from favorites
A column chart comparing equity ownership percentages among senior leadership in Permian Resources, in black and green.
Financial Performance
Energy & Utilities
Discusses the alignment of interests between Permian Resources' management and shareholders, with details on equity ownership and compensation strategies.
shareholder, equity, management, Permian Resources, alignment
false
Financial Performance
Energy & Utilities
Mixed Chart
Barclays
Add to my slides
Remove from favorites
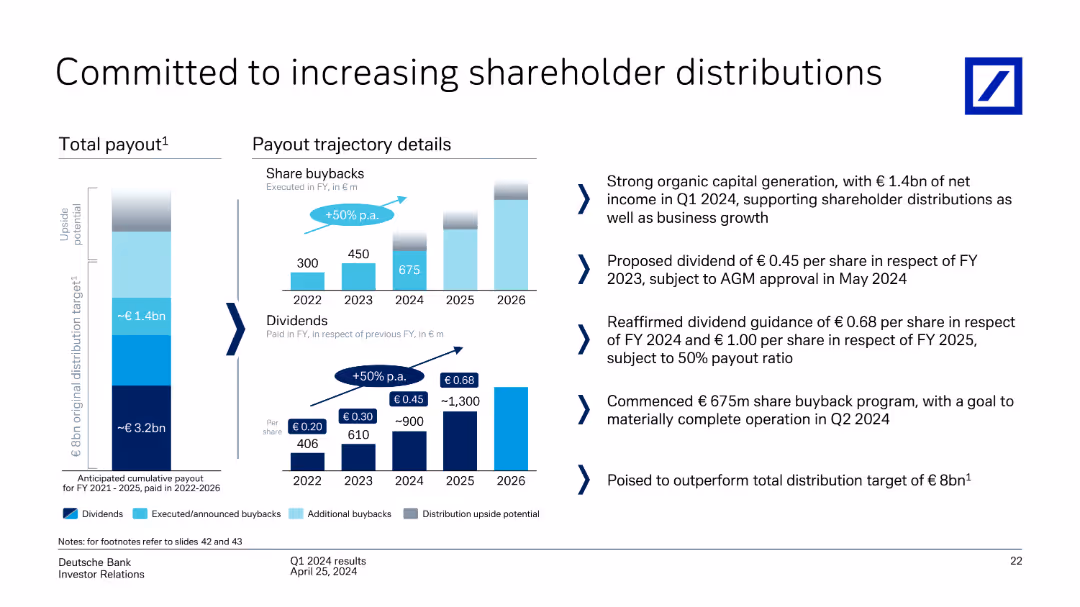
Vertical bar chart (left), timeline bar charts (middle), and bullet points (right)
Strategic Planning
Financial Services
Describes Deutsche Bank’s ongoing capital return strategy via dividends and share buybacks. Shows payout trajectory and guidance for 2024–2026. Notes €1.4bn income in Q1 2024 and buyback activity as supporting these distributions.
shareholder return, dividends, buybacks, payout strategy, capital return
false
Strategic Planning
Financial Services
Multiple Chart
Deutsche Bank
Add to my slides
Remove from favorites
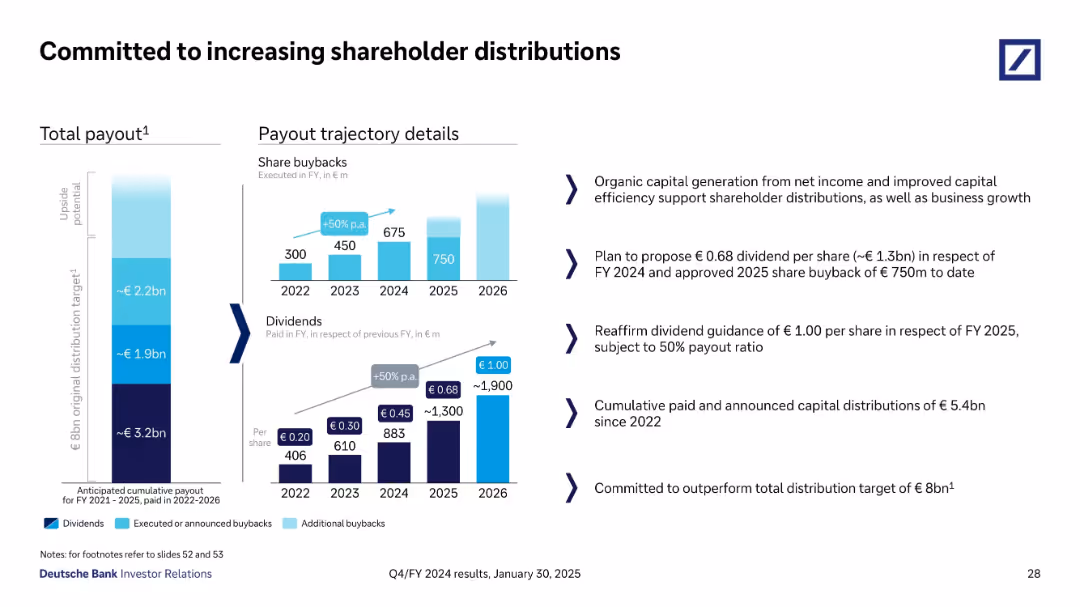
Split layout with vertical payout chart, bar charts of buybacks/dividends, and strategy bullet points
Strategic Planning
Financial Services
This slide outlines Deutsche Bank’s strategy to increase shareholder distributions through dividends and share buybacks. It shows a trajectory aiming for €8bn in distributions from FY 2021–2026, including a proposed €0.68 dividend for FY 2024 and €750m in buybacks for 2025.
Shareholder Return, Dividends, Buybacks, Strategy, FY2024, FY2025
false
Strategic Planning
Financial Services
Multiple Chart
Deutsche Bank
Add to my slides
Remove from favorites
Presents a blue column chart with amounts of cash returned to shareholders over four fiscal years, highlighting a significant share repurchase initiative.
Financial Performance
Consumer Goods
Reviews the substantial amounts returned to shareholders through dividends and share repurchases, underscoring the company's commitment to shareholder returns.
shareholder return, dividends, share repurchase, fiscal years, investment
false
Financial Performance
Consumer Goods
Single Chart
Barclays
Add to my slides
Remove from favorites
Slide features a column chart comparing the total shareholder return of Clorox to its peers and the S&P 500 over five years, using green and blue colors to differentiate between share price appreciation and dividends paid.
Financial Performance
Consumer Goods
Analyzes Clorox's shareholder returns from FY13 to FY18, showing how it compares to competitors and the broader market, emphasizing strong financial performance. Useful for investor relations and financial analysis.
shareholder return, financial analysis, Clorox, market comparison
false
Financial Performance
Consumer Goods
Single Chart
Barclays
Add to my slides
Remove from favorites
A line graph showing total shareholder return over time, comparing tech-forward companies to others. Text analyzes financial performance trends before, during, and after the pandemic.
Performance Metrics and KPIs
Technology & Software
The slide compares the total shareholder return of tech-forward companies with other companies, using a line graph to illustrate performance over different periods.
Shareholder Return, Financial Performance, Pandemic, Tech-Forward, Comparison
false
Performance Metrics and KPIs
Technology & Software
Mixed Chart
Accenture
Add to my slides
Remove from favorites
Features a multi-colored line chart tracking the total shareholder return over ten years, comparing company performance against peers and the S&P 500.
Investment Analysis
Consumer Goods
Highlights the exceptional shareholder returns generated by the company over a decade, comparing favorably against industry peers and market averages.
shareholder return, long-term performance, S&P 500, peers, market comparison
false
Investment Analysis
Consumer Goods
Single Chart
Barclays
Add to my slides
Remove from favorites
The slide contains a table comparing dividend, net income, payout ratio, and return over multiple years, with highlighted projections for the year 2022. It includes a sidebar with dividend and share buy-back policy details and targets. The visual elements are supported by the brand color scheme and include the Michelin logo at the bottom left.
Financial Performance
Financial Services
Detailing the shareholder return policy with a focus on dividends and share buy-backs, this slide outlines Michelin's financial commitment towards its shareholders. It is likely used in annual general meetings or investor briefings to discuss shareholder value and financial strategies.
shareholder, return, policy, dividend, Michelin, net income, payout ratio, investment, finance, strategy
false
Financial Performance
Financial Services
Table
Morgan Stanley
Add to my slides
Remove from favorites
Line charts and points showing yearly shareholder returns across various sectors, highlighting performance disparities.
Competitive Landscape
Financial Services
Analyzes the impact of COVID-19 on shareholder returns across different sectors, distinguishing between those that have managed to mitigate impacts effectively.
shareholder returns, COVID-19 impact, sector performance, performance disparities, financial resilience, market analysis
false
Competitive Landscape
Financial Services
Single Chart
BCG
Add to my slides
Remove from favorites
Line chart comparing cumulative shareholder returns of Eaton, S&P 500, and a peer group from 2000 to 2019, with color-coded lines on a green gradient background.
Investment Analysis
Financial Services
Analyzes Eaton's performance in shareholder returns compared to broader market indices and a peer group, useful for investors and financial analysts.
shareholder returns, Eaton, investment, financial analysis
false
Investment Analysis
Financial Services
Single Chart
Deutsche Bank
Add to my slides
Remove from favorites
The slide features column charts showing shareholder distributions and line charts depicting dividend initiations by Russell 1000 companies.
Strategic Planning
Financial Services
The slide explores the shift in corporate priorities between growth investments and shareholder returns, emphasizing the impact of rising rates on dividends and buybacks. It suggests a re-evaluation of growth versus shareholder return strategies. This slide is suitable for discussions on strategic planning and corporate finance.
shareholder returns, growth, dividends, buybacks, strategic planning
false
Strategic Planning
Financial Services
Multiple Chart
JP Morgan
Add to my slides
Remove from favorites
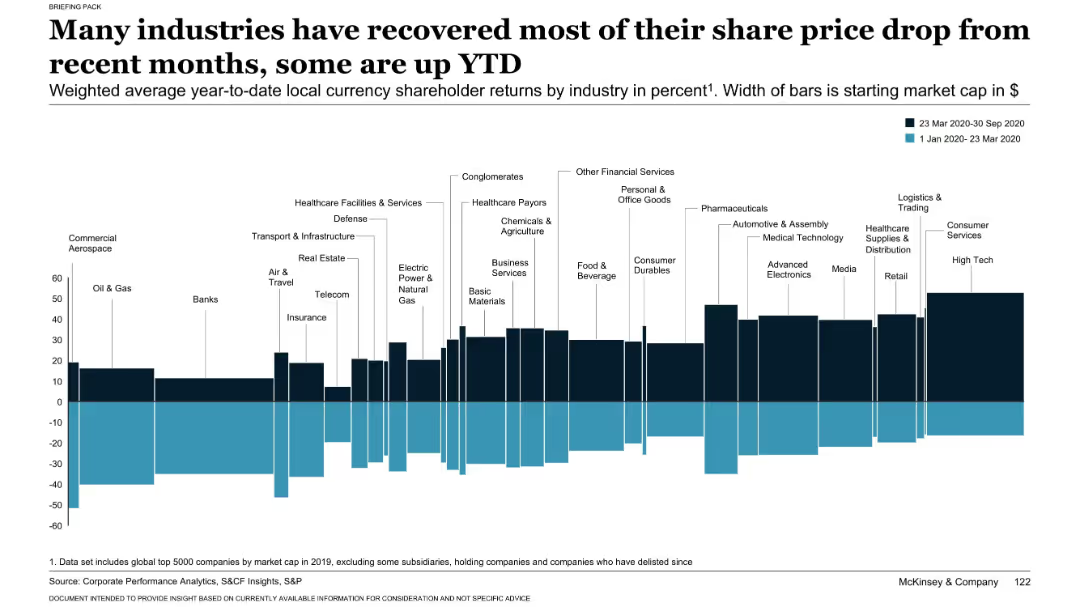
Bar chart showing shareholder returns by industry for two periods (pre-March 23 and post-March 23, 2020).
Performance Metrics and KPIs
Financial Services
Assesses year-to-date shareholder returns across industries. Despite the COVID-19 impact, many sectors (e.g., High Tech, Healthcare, Pharma) show full or partial recovery. Commercial aerospace and banks remain laggards.
shareholder returns, industry recovery, COVID-19 impact, performance
false
Performance Metrics and KPIs
Financial Services
Single Chart
McKinsey
Add to my slides
Remove from favorites
The slide features a line graph showing Macquarie's performance over time against the ASX200 index, with green fill indicating outperformance. It also includes a table comparing outperformance metrics since listing, over 10 years, and over 5 years. The layout is well-organized with a clear visual hierarchy.
Investment Analysis
Financial Services
The slide highlights Macquarie's outperformance compared to the ASX200 and MSCI World Capital Markets Index, focusing on the shareholder value generated over time. It is used to show Macquarie's long-term financial growth and its comparison with major indices for investor insights.
shareholder returns, Macquarie, ASX200, MSCI World Index, long-term performance, outperformance, financial analysis, investment
false
Investment Analysis
Financial Services
Single Chart
Morgan Stanley
Add to my slides
Remove from favorites
The slide features two column charts comparing Booz Allen's total shareholder returns to core peers and broader indexes over one-, three-, and five-year periods. The bars are clearly labeled with percentages and time frames.
Investment Analysis
Financial Services
This slide highlights Booz Allen's market performance, illustrating total shareholder returns compared to core peers and broader indexes. It underscores the company's strong financial performance and effective capital management over different periods.
shareholder returns, market performance, investment, comparison
false
Investment Analysis
Financial Services
Multiple Chart
Booz Allen Hamilton
Add to my slides
Remove from favorites
Presents a line graph tracking Macquarie's performance against the ASX 200 and a table with outperformance metrics, providing a historical overview and current data.
Investment Analysis
Financial Services
This slide illustrates Macquarie's long-term shareholder value creation, juxtaposing historical outperformance against market indices. Tailored for current and potential investors analyzing past and prospective returns.
shareholder, returns, performance, ASX, value, historical, investment, indices, market, outperformance
false
Investment Analysis
Financial Services
Mixed Chart
Goldman Sachs
Add to my slides
Remove from favorites
This slide includes a line chart tracking Total Shareholder Returns for US non-financial companies, categorized by high and low resilience.
Risk Assessment and Management
Financial Services
Analyzes shareholder returns over two decades, showing how companies with higher resilience tend to marginally outperform across economic cycles.
Shareholder returns, Resilience, Economic cycles, US companies, High risk, Performance analysis
false
Risk Assessment and Management
Financial Services
Single Chart
Bain
Add to my slides
Remove from favorites
Contains a combination of line and scatter plots showing year-to-date shareholder returns by sector with variability highlighted.
Market Analysis and Trends
Financial Services
Shows year-to-date shareholder returns for various sectors, indicating performance spread within each sector and identifying sectoral winners in a downturn.
shareholder returns, sectors, performance, variability, downturn
false
Market Analysis and Trends
Financial Services
Multiple Chart
BCG
Add to my slides
Remove from favorites
Featuring a box plot distribution chart, the slide has a title, descriptive subtext, and clearly labeled axes. Each box plot indicates the inter-quartile and 90th percentile ranges of year-to-date total shareholder returns by industry.
Risk Assessment and Management
Financial Services
Showcases the variability of shareholder returns within industries, highlighting that even companies within the same sector can experience widely different financial performances. Designed for risk analysis within sectors.
Shareholder returns, Variability, Industry analysis, Risk management, Financial performance
false
Risk Assessment and Management
Financial Services
Single Chart
McKinsey
Add to my slides
Remove from favorites
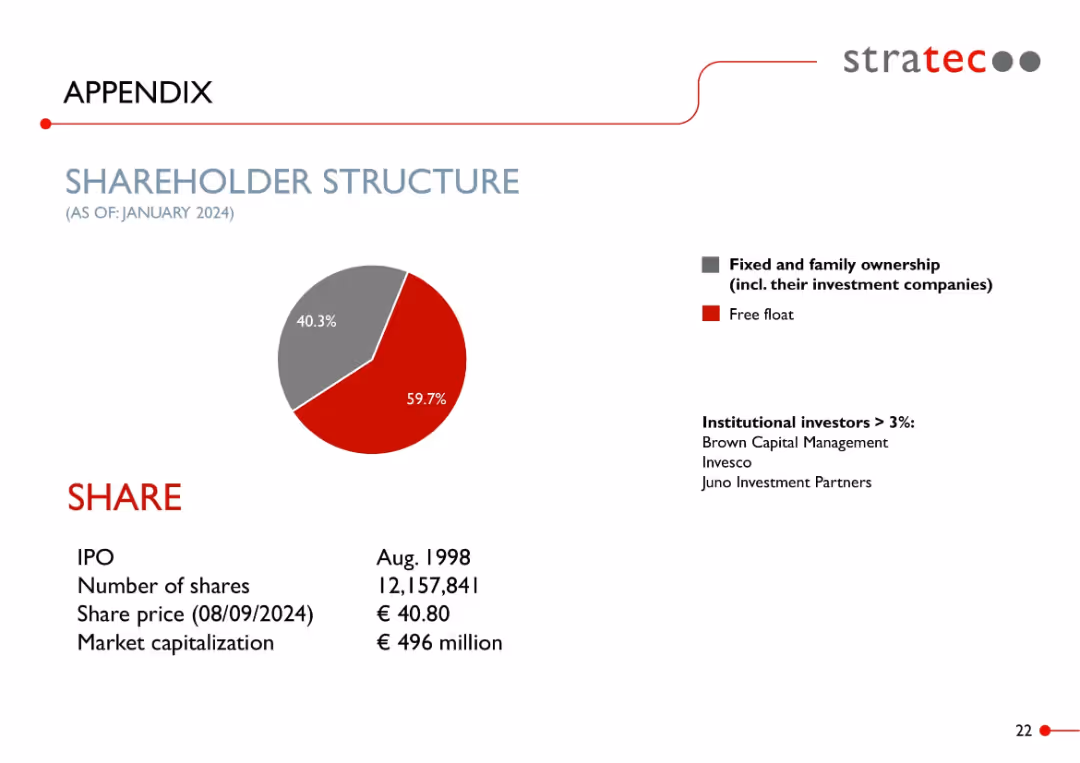
Pie chart showing ownership split; text data below includes share price, market cap, and major institutional investors.
Corporate Finance and Valuation
Healthcare & Pharmaceuticals
Describes STRATEC’s shareholder composition as of January 2024: 59.7% free float and 40.3% fixed/family ownership. Lists key institutional investors and outlines stock details including IPO year, market cap, and current share price.
shareholder structure, free float, institutional investors, market cap, STRATEC, equity, share price
false
Corporate Finance and Valuation
Healthcare & Pharmaceuticals
Single Chart
Goldman Sachs
Add to my slides
Remove from favorites
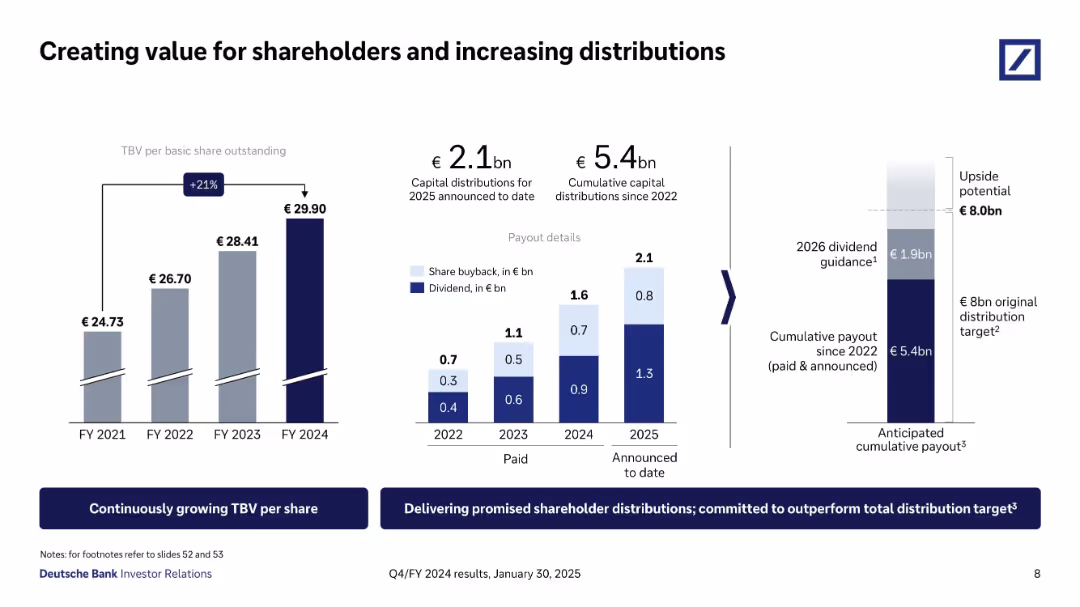
Bar chart of TBV per share from FY21–FY24 and bar graphs for payout breakdown from 2022–2025. Also includes future payout guidance.
Investment Analysis
Financial Services
Highlights Deutsche Bank’s shareholder value creation strategy through capital distributions and buybacks. TBV/share increased 21% from FY21 to FY24. Future payout targets total €8bn by 2026, with €2.1bn already announced for 2025.
shareholder value, TBV, buybacks, dividends, Deutsche Bank, capital return, investor strategy
false
Investment Analysis
Financial Services
Multiple Chart
Deutsche Bank
Add to my slides
Remove from favorites
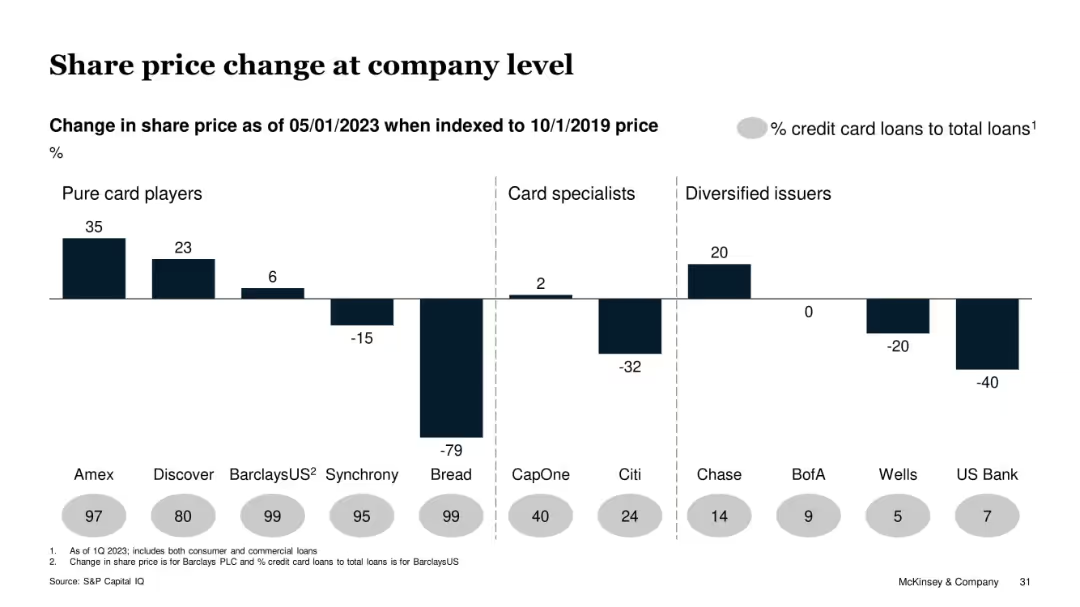
Bar chart segmented by type of issuer with annotations on credit card loan ratios
Investment Analysis
Financial Services
This slide shows share price changes (indexed to 2019) for various card issuers as of May 2023. It compares pure card players, card specialists, and diversified issuers. Players with high exposure to credit card loans (e.g., Bread) saw mixed or negative performance, while Amex had the highest gain.
share price, credit card loans, issuer comparison, McKinsey, performance analysis, equities
false
Investment Analysis
Financial Services
Single Chart
McKinsey
Add to my slides
Remove from favorites
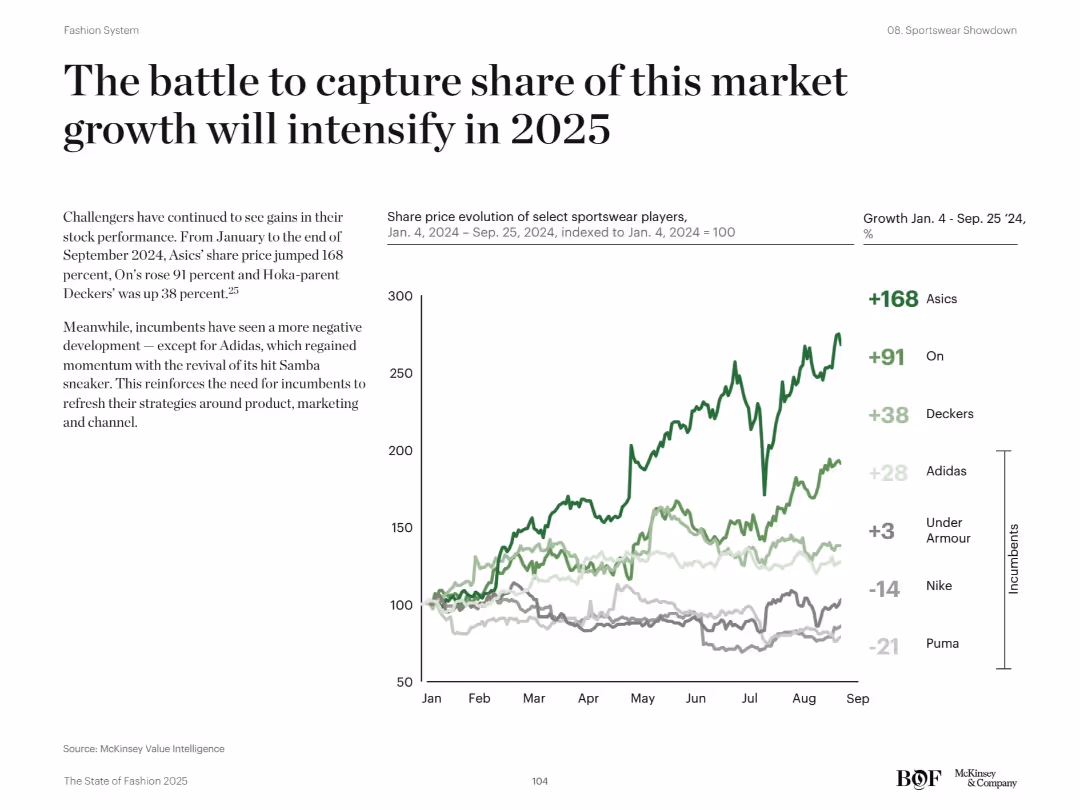
Left text section with commentary; right-hand line chart showing share price growth of key sportswear players
Competitive Landscape
Consumer Goods
The slide focuses on the rising share prices of challenger sportswear brands like Asics, On, and Deckers in 2024, contrasting with weaker performance from incumbents such as Nike and Puma. The chart tracks indexed share prices from January to September 2024. The narrative emphasizes the need for incumbents to revamp strategies to stay competitive.
share price, growth, Asics, On, Deckers, Nike, incumbents, 2025, stock performance
false
Competitive Landscape
Consumer Goods
Mixed Chart
McKinsey
Add to my slides
Remove from favorites
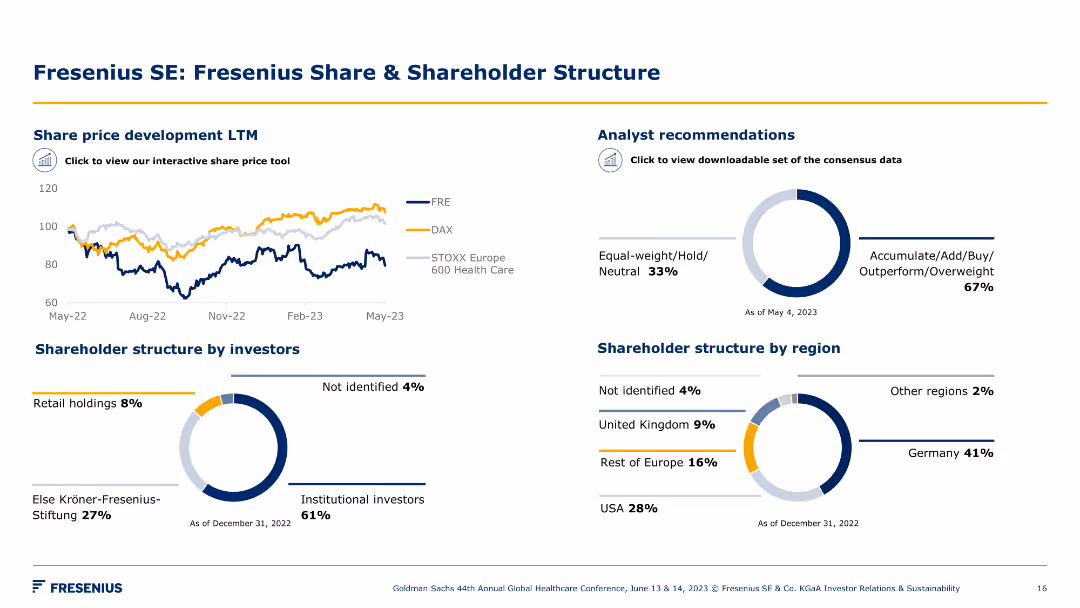
Multiple charts showing share price development, analyst recommendations, and shareholder structure. Visual elements include pie charts and line charts.
Financial Performance
Healthcare & Pharmaceuticals
The slide provides an overview of Fresenius' share price trends, analyst recommendations, and the shareholder structure by investor type and region.
share price, shareholder structure, financial performance, analyst recommendations, investment, strategy, healthcare, Fresenius, growth, trends
false
Financial Performance
Healthcare & Pharmaceuticals
Multiple Chart
Goldman Sachs
Add to my slides
Remove from favorites
Column chart showing the recovery of share prices across multiple industries. Uses a mix of green and blue to show recovery and remaining declines.
Market Analysis and Trends
Financial Services
Analyzes share price recovery across industries post-COVID-19, highlighting which sectors have bounced back or still struggle.
Share prices, Recovery, COVID-19, Industries, Analysis
false
Market Analysis and Trends
Financial Services
Single Chart
McKinsey
Add to my slides
Remove from favorites
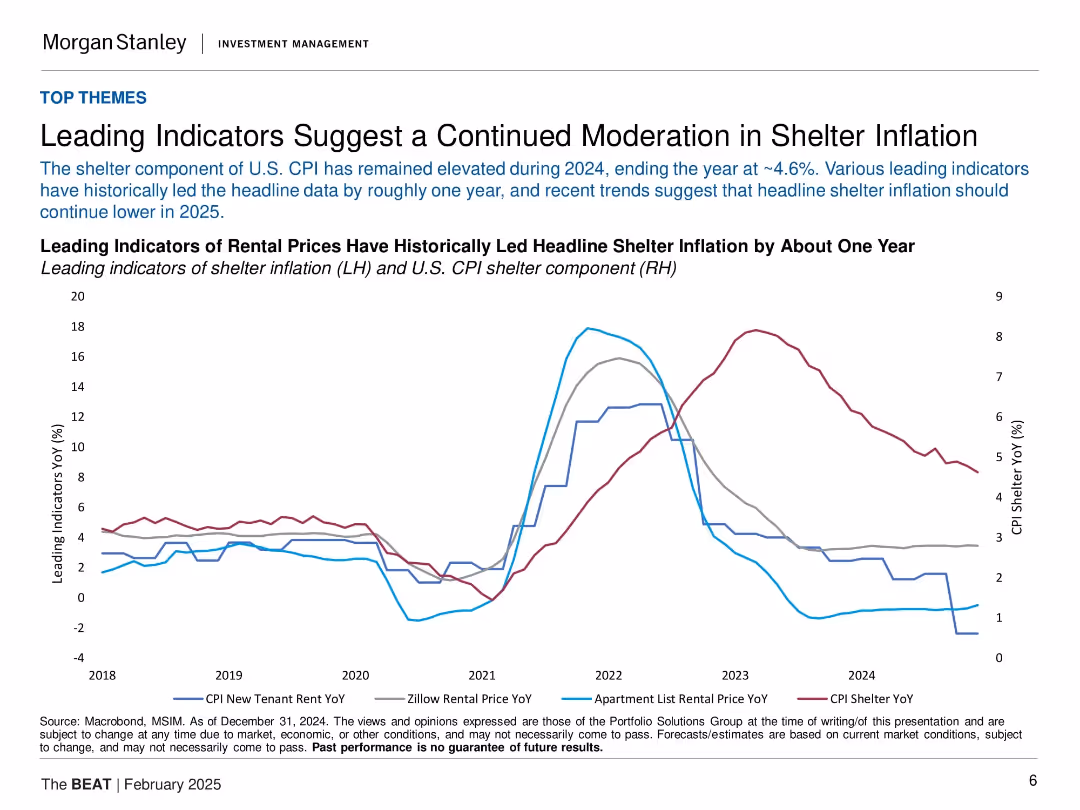
Line chart with four rental indicators and CPI shelter data. Minimal text, data-heavy with historical context.
Market Analysis and Trends
Real Estate & Construction
The slide presents rental price trends as leading indicators for shelter inflation in the U.S. It shows these indicators have declined ahead of CPI shelter, suggesting continued moderation in 2025. This is relevant for inflation expectations and interest rate decisions.
shelter inflation, CPI, rental prices, leading indicators, U.S. housing, macro trends, inflation outlook, interest rates
false
Market Analysis and Trends
Real Estate & Construction
Single Chart
Morgan Stanley
Add to my slides
Remove from favorites
This slide includes a pie chart of global seaborne trade volumes and on the right column showing the distribution of commodities transported by a shipping company.
Operational Efficiency
Transportation & Logistics
Details the volume and types of commodities transported globally by a shipping company in 2022, highlighting its role in global trade and operational focus on diverse commodity transport.
shipping, commodities, trade volumes, operational efficiency
false
Operational Efficiency
Transportation & Logistics
Mixed Chart
Deutsche Bank
Add to my slides
Remove from favorites
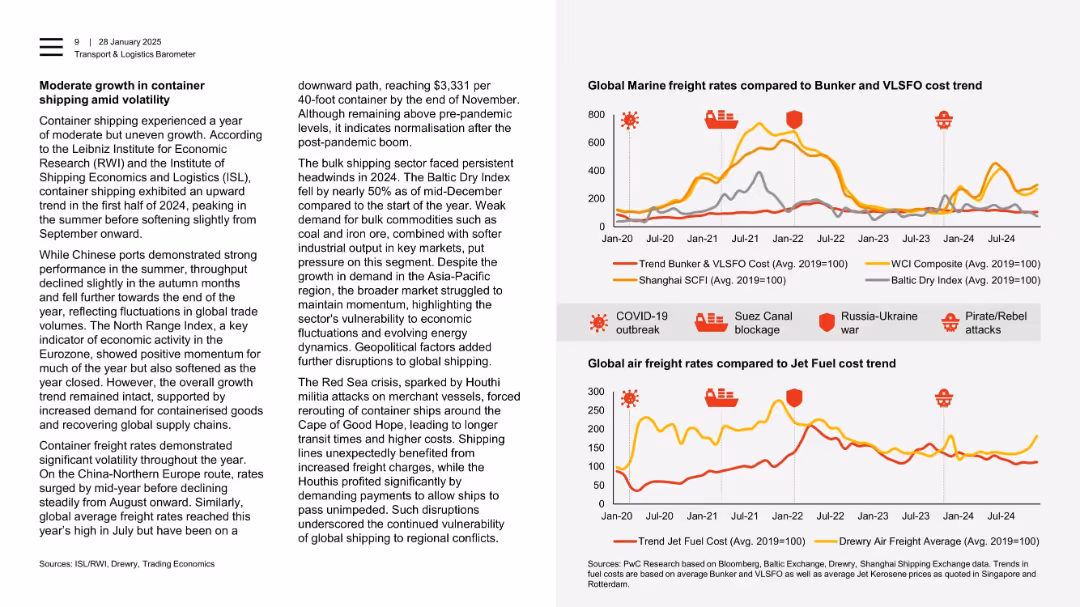
Left-aligned text with two freight rate trend charts on the right comparing marine and air freight rates.
Market Analysis and Trends
Transportation & Logistics
This slide explains the moderate but volatile growth in container shipping in 2024. It cites economic indicators, fluctuating global trade volumes, and geopolitical disruptions. Charts depict rate movements and highlight COVID, war, and crises impacting freight costs.
shipping, container freight, volatility, bunker costs, air freight, supply chain, geopolitical risks, Baltic Index
false
Market Analysis and Trends
Transportation & Logistics
Multiple Chart
PwC/Strategy&
Add to my slides
Remove from favorites
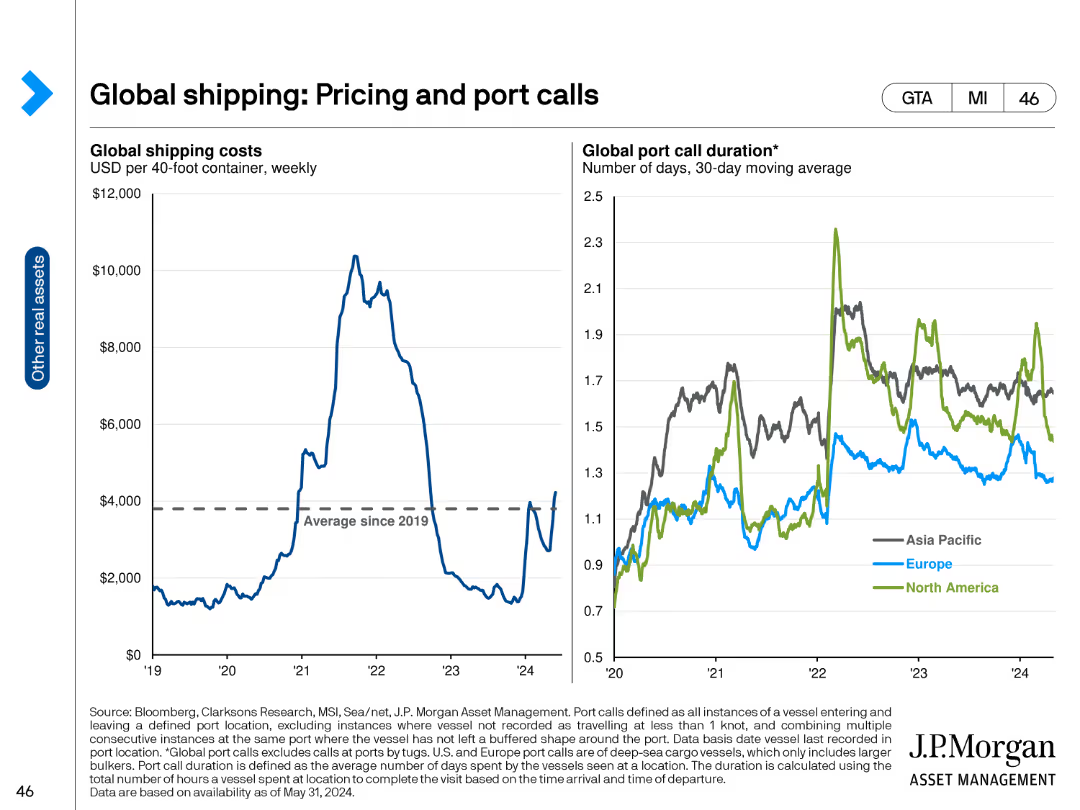
The slide includes two line charts. The left chart shows global shipping costs per 40-foot container from 2019 to 2024. The right chart presents the global port call duration in days for Asia Pacific, Europe, and North America from 2019 to 2024. The line charts use distinct colors for different regions and provide a clear visual of trends.
Market Analysis and Trends
Transportation & Logistics
This slide examines global shipping costs and port call durations, highlighting trends across different regions. It is intended to provide insights into the shipping industry’s pricing and operational efficiencies.
Shipping costs, port call duration, global shipping, pricing trends, regional analysis, shipping industry
false
Market Analysis and Trends
Transportation & Logistics
Multiple Chart
JP Morgan
Add to my slides
Remove from favorites
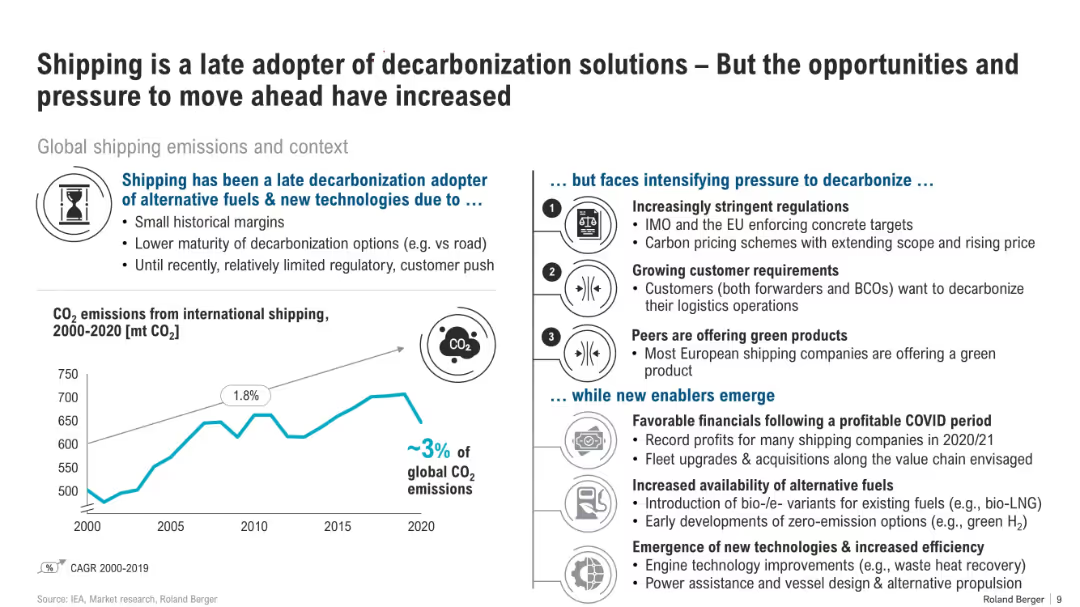
Dual-column layout with a line graph showing historical shipping emissions and list-style breakdown of challenges and enablers.
Strategic Planning
Transportation & Logistics
The slide explains why shipping has lagged in decarbonization—due to margin and tech maturity issues—but now faces growing pressure from regulations and customers. It outlines opportunities like new fuels and tech.
shipping, decarbonization, CO2, regulatory pressure, green tech, IMO, EU, biofuels, market enablers
false
Strategic Planning
Transportation & Logistics
Mixed Chart
Roland Berger
Add to my slides
Remove from favorites
The slide is split into two sections. The left side contains images depicting growth estimates for various vessel types from 2023 to 2024. The right side lists key market catalysts for the drybulk sector.
Market Analysis and Trends
Transportation & Logistics
This slide analyzes the growth projections for different vessel types in the drybulk sector and identifies major market catalysts affecting this industry.
shipping, drybulk, growth estimates, market catalysts, transportation
false
Market Analysis and Trends
Transportation & Logistics
Header Horizontal
Deutsche Bank
Add to my slides
Remove from favorites
The slide features a column chart forecasting shipping energy consumption by fuel type (oil, electricity, biofuels) from 2018 to 2040 under a stated scenario. It also includes a detailed analysis of the industry environment and bioenergy economic competitiveness.
Market Analysis and Trends
Transportation & Logistics
This slide projects energy consumption in the shipping industry, highlighting the role of biofuels as the only reliable alternative for decarbonization, and analyzing the economic competitiveness and industry environment.
shipping industry, energy consumption, fuel type, biofuels, 2018-2040, economic competitiveness, industry environment
false
Market Analysis and Trends
Transportation & Logistics
Mixed Chart
Kearney
Add to my slides
Remove from favorites
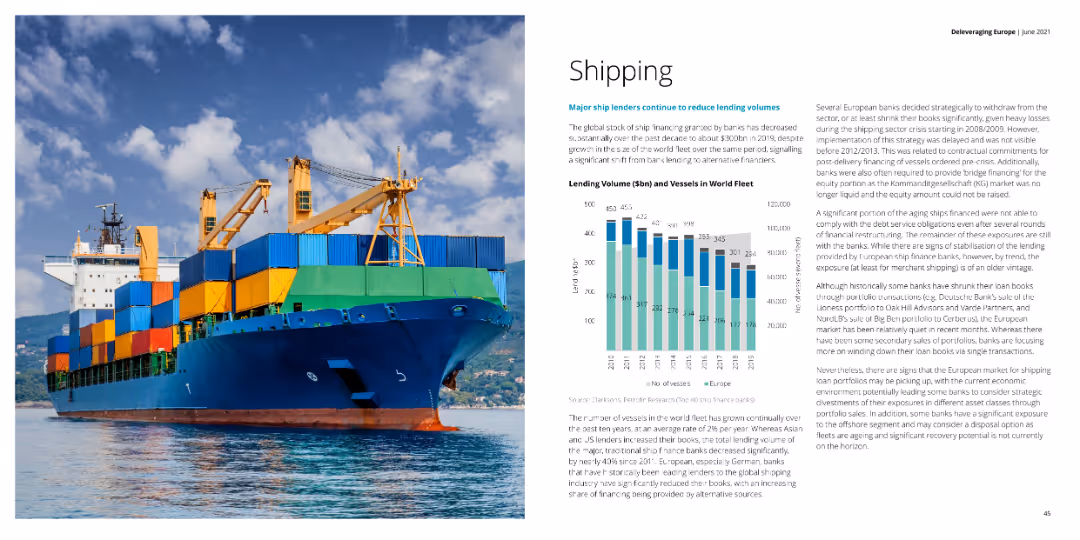
The slide has a large image of a container ship and a column chart showing lending volumes and the number of vessels in the world fleet. Text explains the trends in ship financing and fleet size.
Market Analysis and Trends
Transportation & Logistics
This slide analyzes trends in the shipping industry, focusing on the decline in ship financing by banks and changes in the global fleet size over the past decade.
shipping, lending volumes, global fleet, trends
false
Market Analysis and Trends
Transportation & Logistics
Mixed Chart
Deloitte
Add to my slides
Remove from favorites
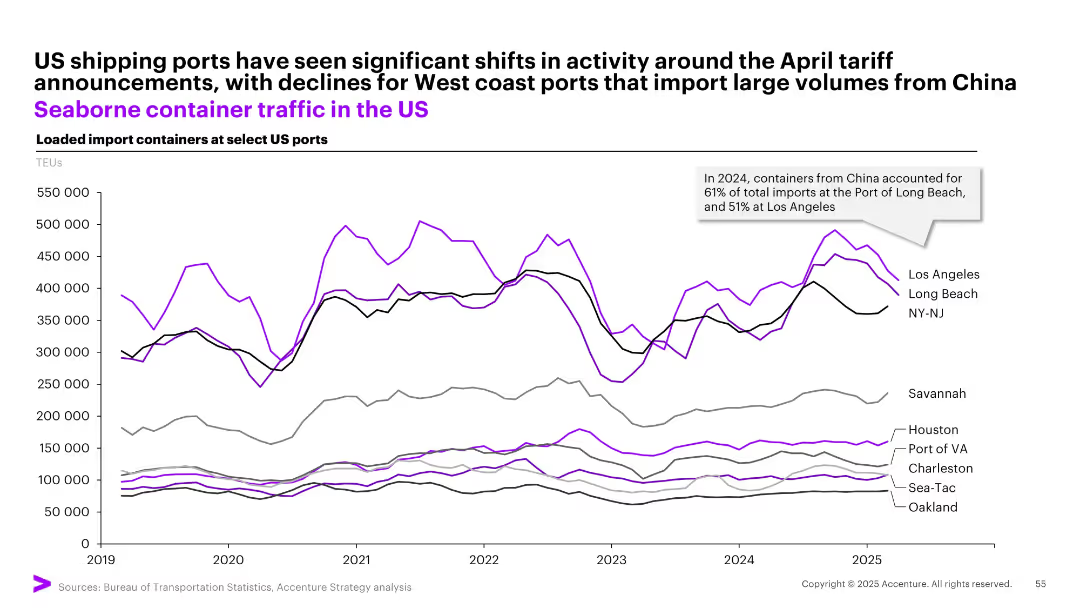
Multiline time-series graph showing TEUs of loaded imports at major US ports, color-coded by port.
Performance Metrics and KPIs
Transportation & Logistics
Depicts changes in import container volumes at key US ports from 2019–2025, noting a decline in West Coast ports due to April tariff shifts. Notes China's dominance in import origin volumes, with Long Beach and LA most affected.
shipping, TEU, tariffs, imports, China, ports, Long Beach, Los Angeles, NY-NJ, container traffic
false
Performance Metrics and KPIs
Transportation & Logistics
Single Chart
Accenture
Add to my slides
Remove from favorites
Column charts, related textual data.
Market Analysis and Trends
Retail & E-commerce
Highlights leading categories in luxury fashion.
shoes, jewelry, leather, beauty, watches
false
Market Analysis and Trends
Retail & E-commerce
Mixed Chart
Bain
Add to my slides
Remove from favorites
Contains check marks, text boxes, icons in a three-step outline. Green color scheme dominant.
Technology and Digital Transformation
Technology & Software
Explains the three-step approach to data-led customer engagement using the SHoP framework.
SHoP, framework, customer engagement, CMOs, maturity
false
Technology and Digital Transformation
Technology & Software
Vertical Flow
BCG
Add to my slides
Remove from favorites
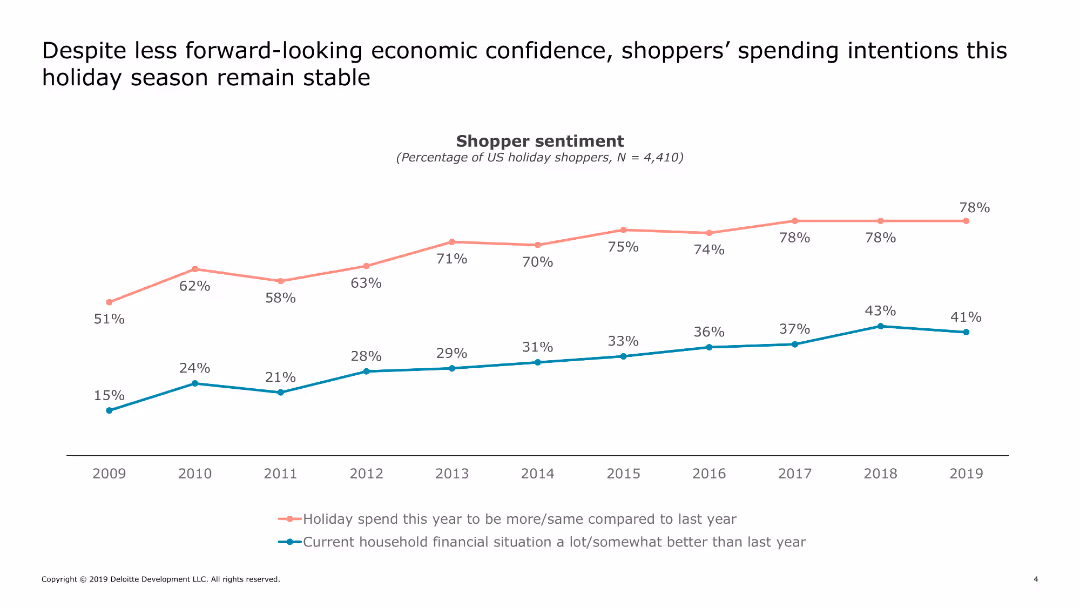
Displays a line chart comparing holiday spending intentions with household financial situations from 2009 to 2019.
Market Analysis and Trends
Retail & E-commerce
Analyzes shopper sentiment regarding holiday spending and household financial situations over a decade, showing trends and changes in economic confidence.
shopper, sentiment, holiday, spending, financial, confidence, trend, analysis
false
Market Analysis and Trends
Retail & E-commerce
Single Chart
Deloitte
Add to my slides
Remove from favorites
Slide shows a comparison chart and large percentage figure, with annotations and a sidebar summary. Text is balanced with graphics, clear fonts, and a mix of colors.
Customer and Market Segmentation
Retail & E-commerce
Discusses the trend of consumers switching shopping platforms for better prices and quality, based on a Southeast Asian survey.
Shoppers, platforms, value, quality, SEA
false
Customer and Market Segmentation
Retail & E-commerce
Multiple Chart
Bain
Add to my slides
Remove from favorites
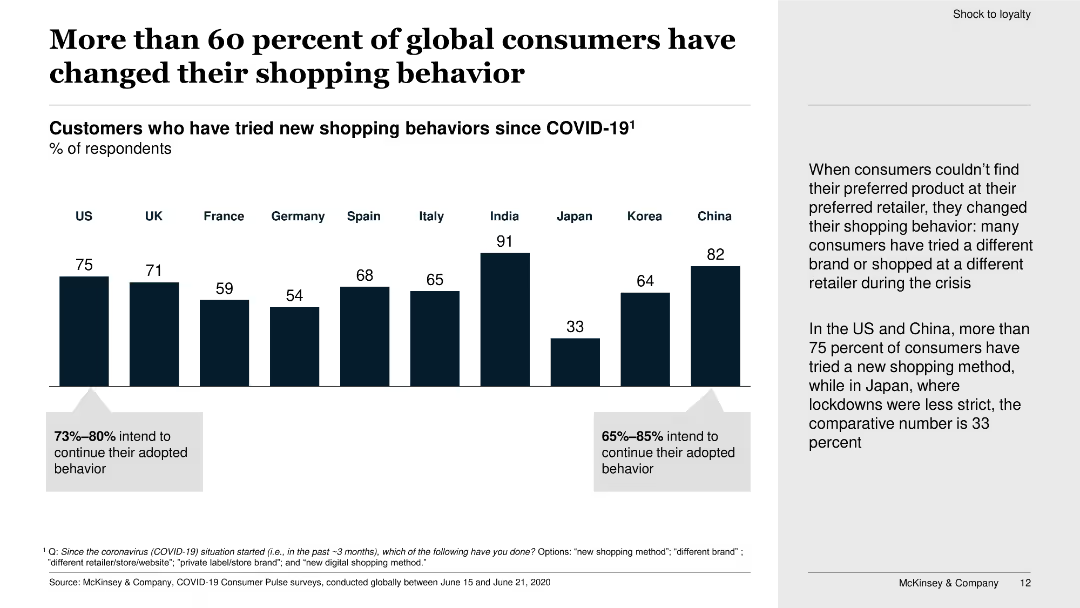
This slide contains a bar chart showing the percentage of consumers in various countries who have tried new shopping behaviors since COVID-19.
Market Analysis and Trends
Retail & E-commerce
The slide details the changes in global consumer shopping behavior during COVID-19, with a high percentage of consumers trying new shopping methods and intending to continue them.
shopping behavior, global consumers, COVID-19, bar chart, new shopping methods, survey, behavior change, continuation
false
Market Analysis and Trends
Retail & E-commerce
Mixed Chart
McKinsey
Add to my slides
Remove from favorites
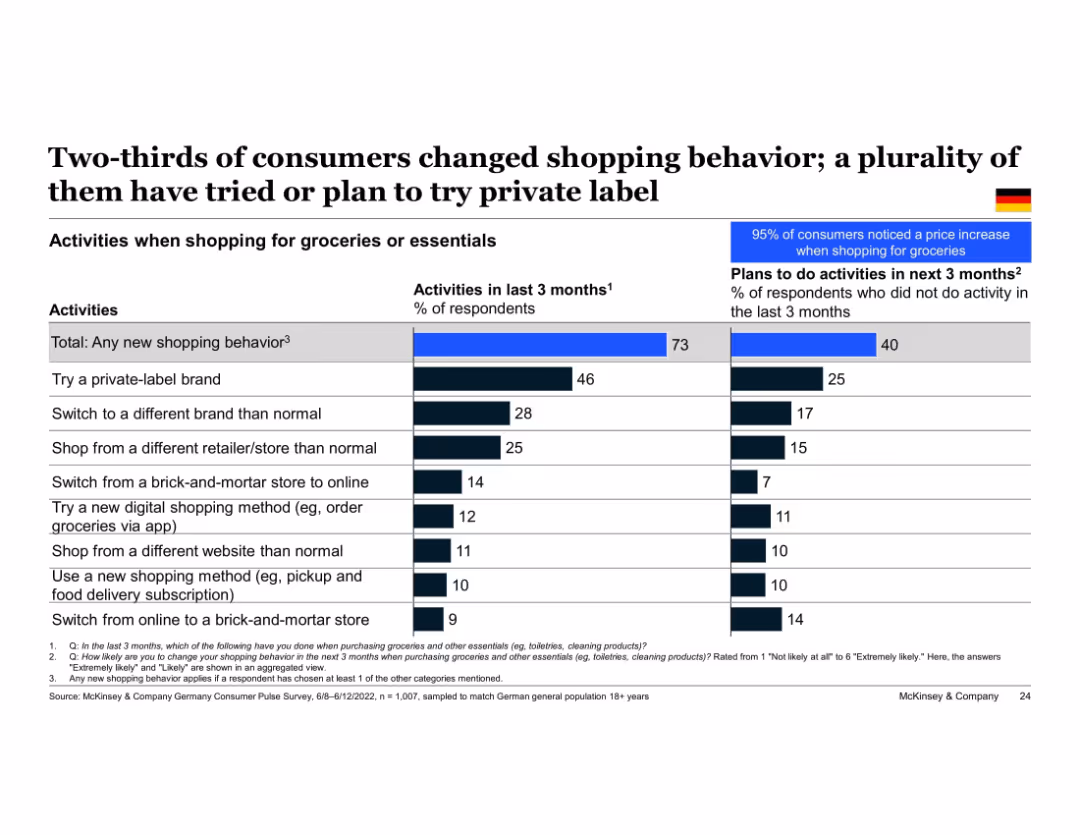
Split-bar chart with two columns showing shopping activity percentages; left side represents past 3 months, right side future intent; includes horizontal bars and color-coded segments. Small German flag icon.
Customer and Market Segmentation
Retail & E-commerce
This slide shows that 73% of German consumers changed their shopping behavior in the past 3 months. A significant number tried private-label brands, switched retailers or brands, or adopted new digital shopping methods. The slide also outlines consumers' future plans, with 40% intending to continue or adopt new behaviors. The data highlights the extent of consumer adaptation amidst price increases.
shopping behavior, private label, brand switching, digital shopping, consumer trends, Germany, grocery, inflation response, e-commerce
false
Customer and Market Segmentation
Retail & E-commerce
Single Chart
McKinsey
Add to my slides
Remove from favorites
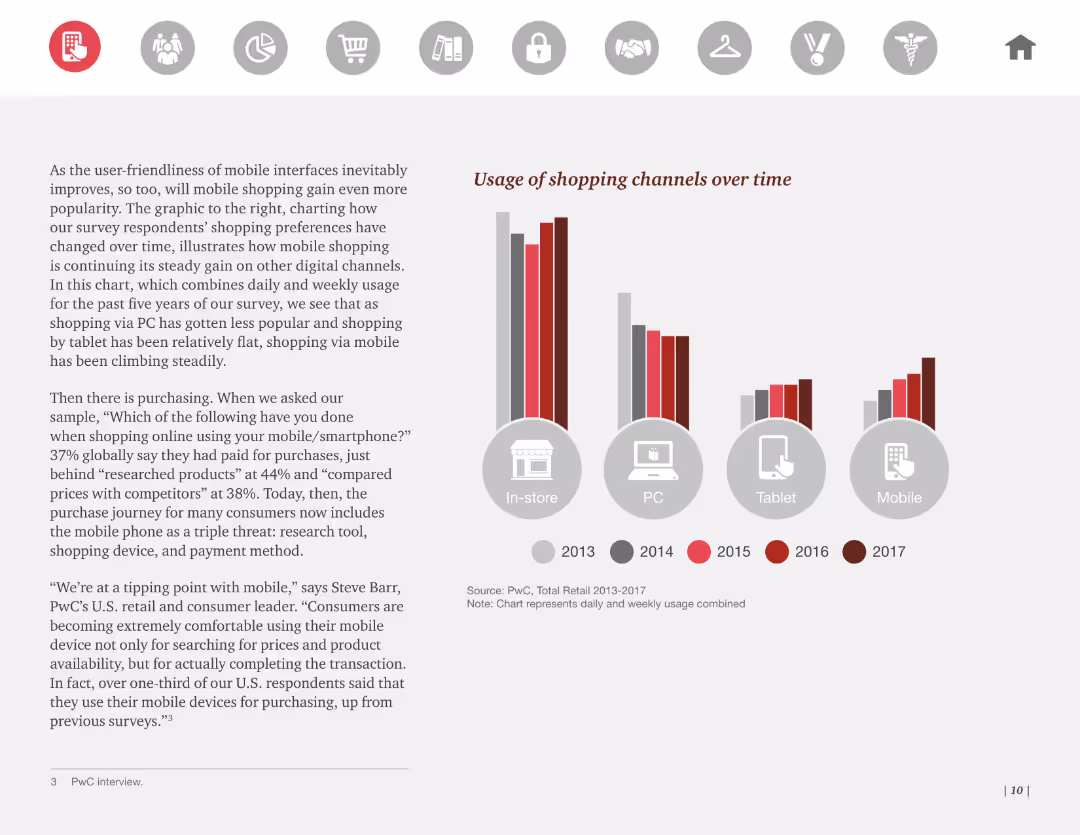
Column chart showing the usage of various shopping channels (in-store, PC, tablet, mobile) over multiple years, highlighting the growth of mobile shopping.
Market Analysis and Trends
Retail & E-commerce
This slide presents the usage of different shopping channels over time, emphasizing the growth in mobile shopping. Useful for tracking changes in consumer shopping behavior.
shopping, channels, usage, trends, mobile
false
Market Analysis and Trends
Retail & E-commerce
Mixed Chart
PwC/Strategy&
Add to my slides
Remove from favorites
Compares the reasons customers prefer online vs. offline shopping through bar charts and explores potential future trends like the use of Gen AI in the Metaverse for shopping experiences.
Market Analysis and Trends
Retail & E-commerce
Highlights the evolving nature of shopping experiences and consumer preferences between online and offline channels, emphasizing the impact of technological advancements on retail strategies.
shopping experience, online, offline, Gen AI, Metaverse, retail
false
Market Analysis and Trends
Retail & E-commerce
Multiple Chart
Bain
Add to my slides
Remove from favorites
This slide includes a bar chart showing reasons why consumers prefer shopping in physical stores, such as checking the product, enjoying in-store shopping, and avoiding online delivery costs.
Customer and Market Segmentation
Retail & E-commerce
The slide explores why consumers in the Middle East choose to shop in physical stores, highlighting preferences like checking product quality, enjoying the shopping experience, and avoiding online issues.
shopping, in-store, consumer, Middle East, product, quality, delivery, preference
false
Customer and Market Segmentation
Retail & E-commerce
Mixed Chart
PwC/Strategy&
Add to my slides
Remove from favorites
The slide displays pie charts illustrating the distribution of high and low-intensity shoppers and returners among different age groups (Generation Z, Millennials, Over 41s).
Market Analysis and Trends
Retail & E-commerce
Analyzes the shopping and return behavior of different age groups, highlighting the proportion of high and low-intensity shoppers and returners among them.
Shopping intensity, Returners, Age groups, Consumer analysis, Generation Z
false
Market Analysis and Trends
Retail & E-commerce
Multiple Chart
Roland Berger
Add to my slides
Remove from favorites
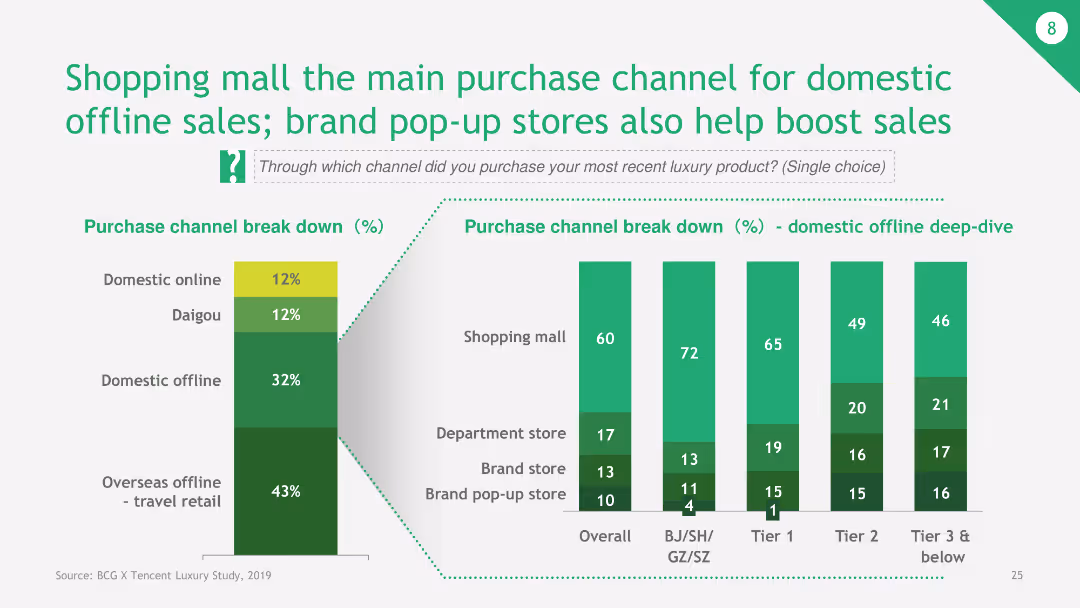
The slide features a combination of bar charts detailing the breakdown of purchase channels for luxury products, with a focus on shopping malls and pop-up stores for offline sales.
Sales and Business Development
Retail & E-commerce
The slide indicates that shopping malls are the primary purchase channels for domestic offline sales in luxury markets, with pop-up stores also contributing significantly. It shows the percentage breakdown for various purchase channels.
shopping mall, purchase channel, domestic offline sales, pop-up stores, luxury products
false
Sales and Business Development
Retail & E-commerce
Multiple Chart
BCG
Add to my slides
Remove from favorites
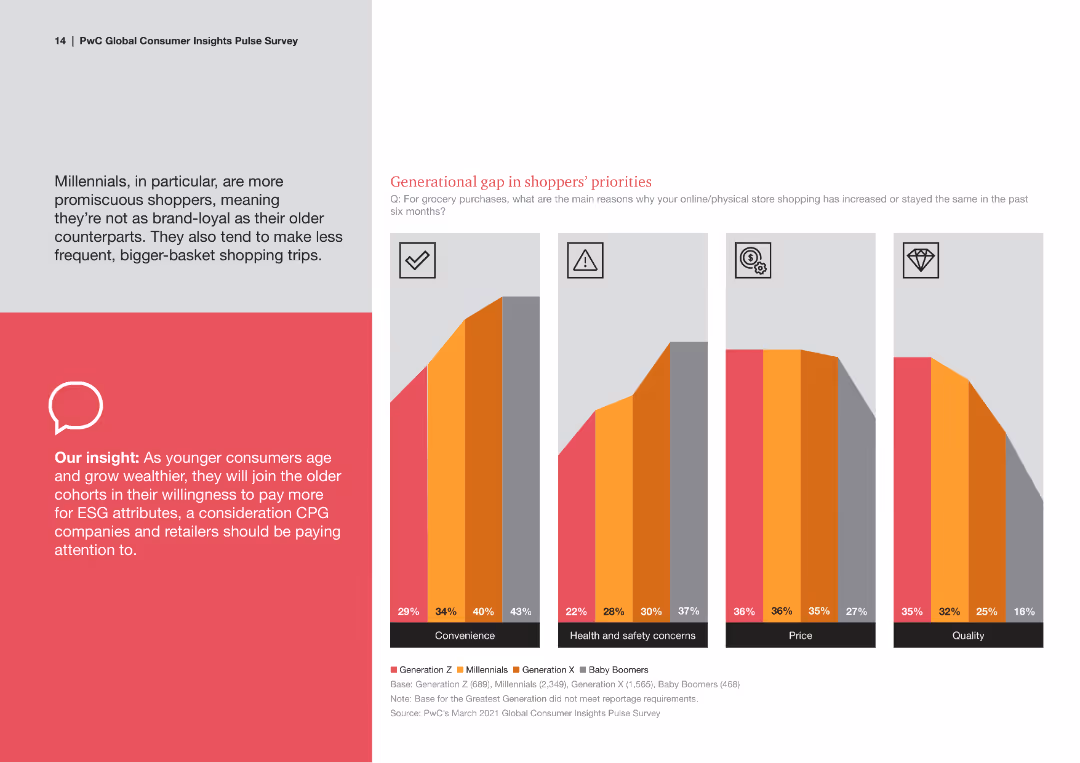
A mixed chart with colored bars representing different generations' priorities in shopping. Text blocks provide detailed insights and there is an iconography for quick understanding.
Market Analysis and Trends
Consumer Goods
The slide analyzes generational gaps in shopping priorities, focusing on aspects like convenience, health, safety, price, and quality, with a focus on ESG factors.
Shopping Priorities, Generational Analysis, ESG, Convenience, Health and Safety
false
Market Analysis and Trends
Consumer Goods
Multiple Chart
PwC/Strategy&
Add to my slides
Remove from favorites
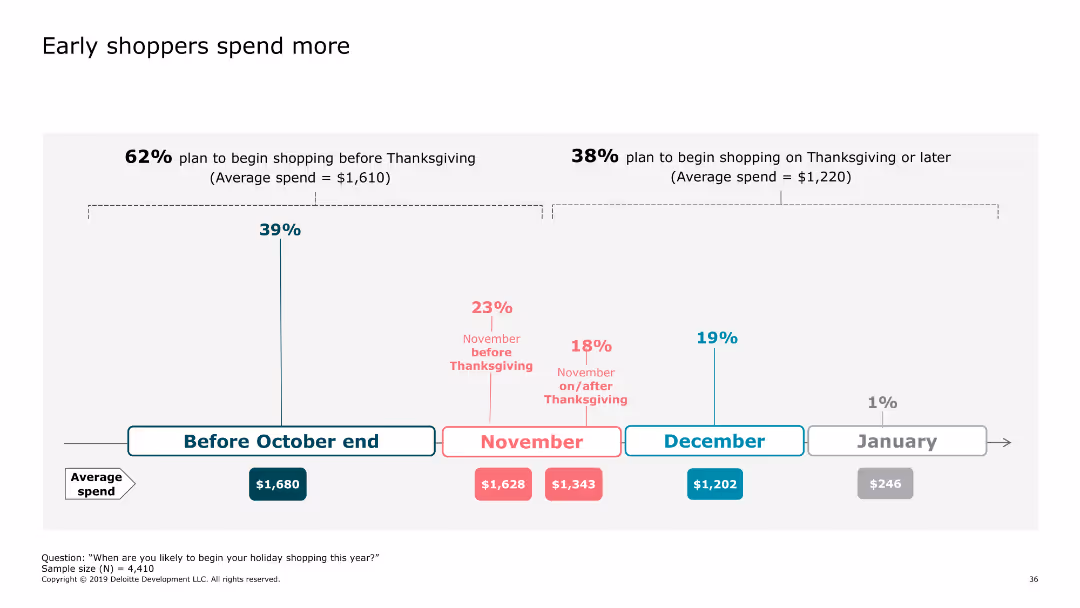
This slide features a horizontal bar chart showing different shopping periods with respective average spend values. The chart is divided into months, highlighting consumer spend trends.
Market Analysis and Trends
Retail & E-commerce
The slide explains how consumer spending habits vary based on the shopping period, emphasizing higher spending by early shoppers before Thanksgiving compared to late shoppers.
shopping, spending, consumers, holidays, trends
false
Market Analysis and Trends
Retail & E-commerce
Linear Flow
Deloitte
Add to my slides
Remove from favorites
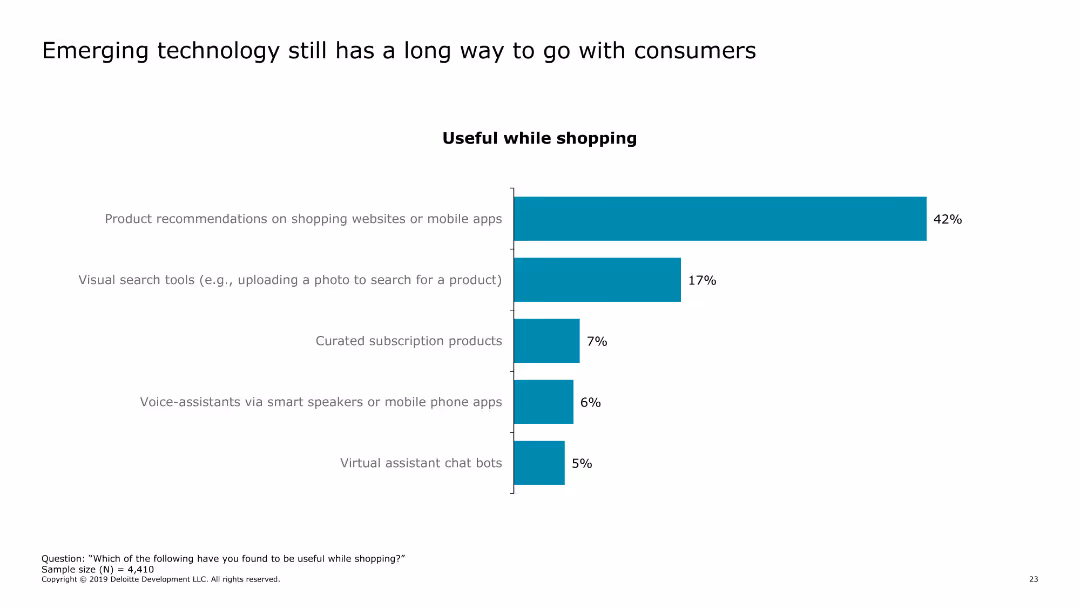
This slide features a column chart showing the usefulness of various shopping technologies. The chart includes categories like product recommendations, visual search tools, curated subscription products, voice assistants, and virtual assistant chat bots.
Technology and Digital Transformation
Technology & Software
The slide presents data on consumer perceptions of emerging shopping technologies, highlighting the percentage of users who find each technology useful while shopping. It emphasizes the gaps in technology adoption and usefulness.
shopping technology, consumer technology, retail tech, product recommendations, visual search
false
Technology and Digital Transformation
Technology & Software
Single Chart
Deloitte
Add to my slides
Remove from favorites
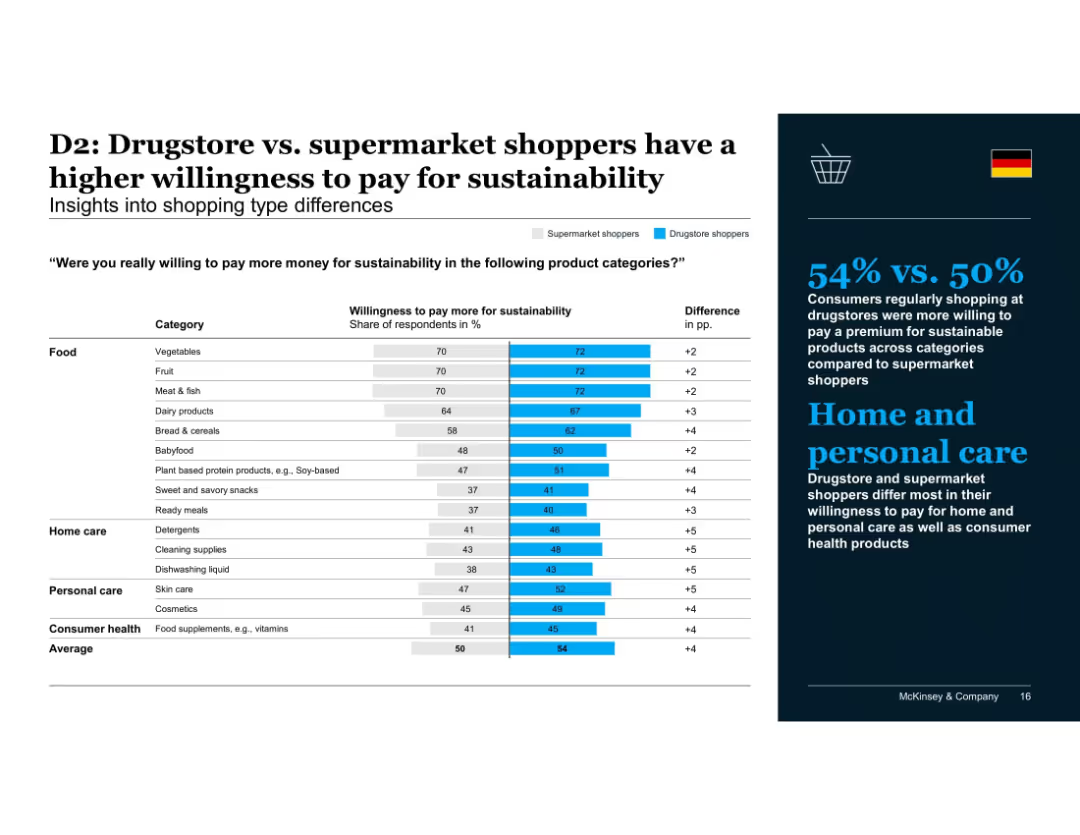
Comparison bar chart showing supermarket vs. drugstore shopper behavior; focuses on product categories
Customer and Market Segmentation
Consumer Goods
Drugstore shoppers exhibit greater willingness to pay for sustainable products, particularly in home and personal care. The trend suggests higher alignment of health-conscious shopping habits with sustainability values.
shopping type, drugstore, supermarket, personal care, home care, sustainability spending, consumer behavior, McKinsey, Germany
false
Customer and Market Segmentation
Consumer Goods
Mixed Chart
McKinsey
Add to my slides
Remove from favorites
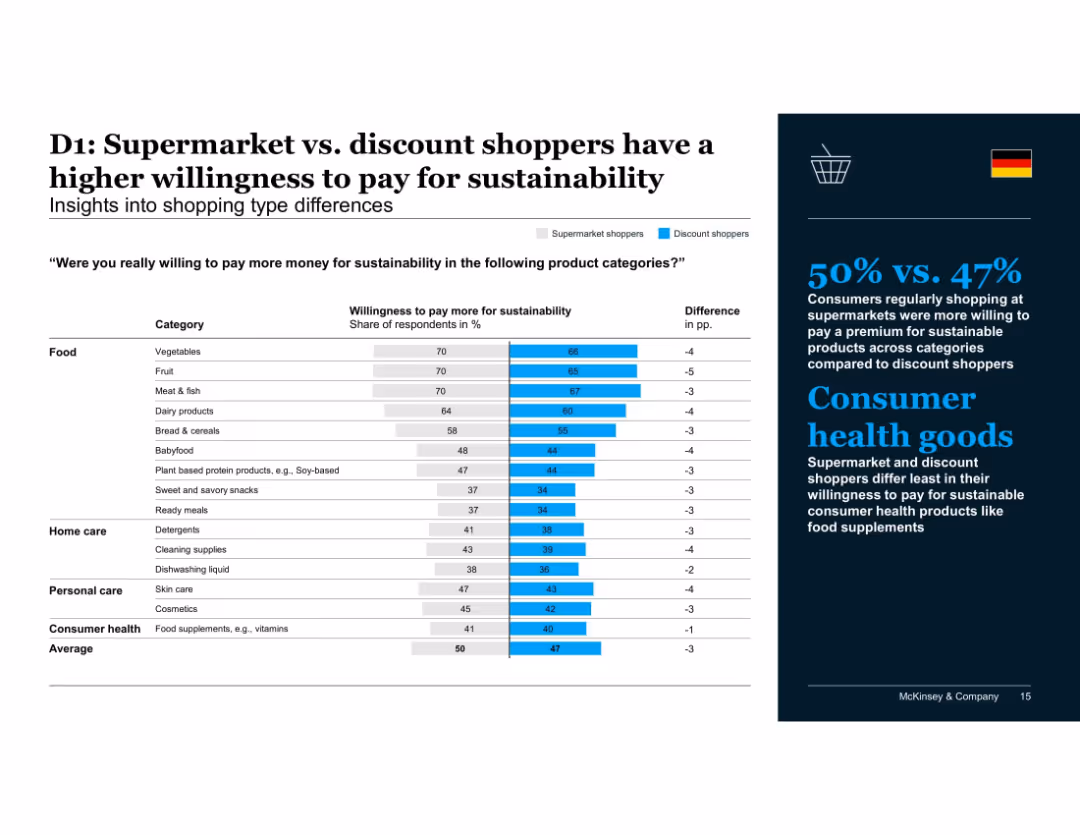
Comparison bar chart showing supermarket vs. discount shopper behavior across product categories
Customer and Market Segmentation
Consumer Goods
Consumers shopping at supermarkets show slightly higher willingness to pay for sustainability across food and non-food categories compared to discount shoppers. The difference is modest but consistent across all segments.
shopping type, supermarket, discounter, consumer behavior, sustainability pricing, product categories, McKinsey, Germany
false
Customer and Market Segmentation
Consumer Goods
Mixed Chart
McKinsey
Add to my slides
Remove from favorites
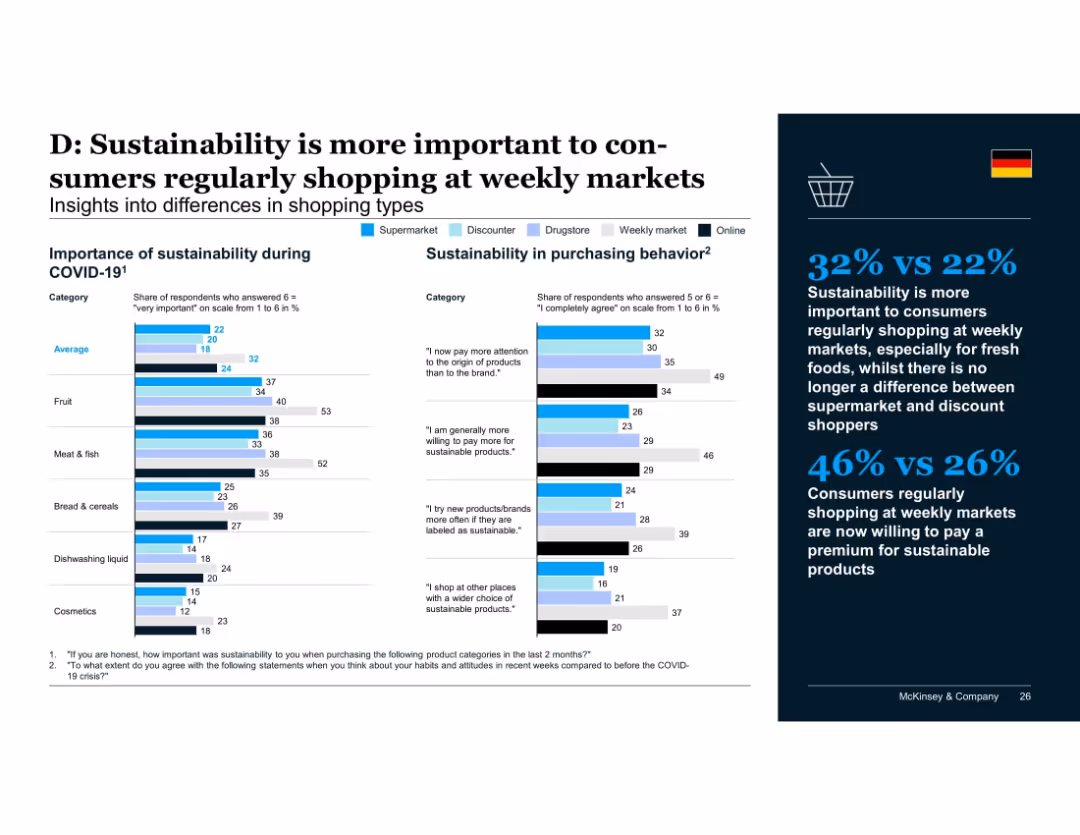
Multi-category comparison chart with different shopper types (supermarket, discounter, drugstore, weekly market, online) shown via color-coded bars across product categories; insights panel on the right.
Customer and Market Segmentation
Retail & E-commerce
Consumers who regularly shop at weekly markets value sustainability more, especially for fresh food categories. They also exhibit higher willingness to pay premiums, unlike discount and supermarket shoppers where differentiation has diminished.
shopping types, weekly markets, sustainability, fresh produce, consumer segmentation, willingness to pay
false
Customer and Market Segmentation
Retail & E-commerce
Mixed Chart
McKinsey
Add to my slides
Remove from favorites
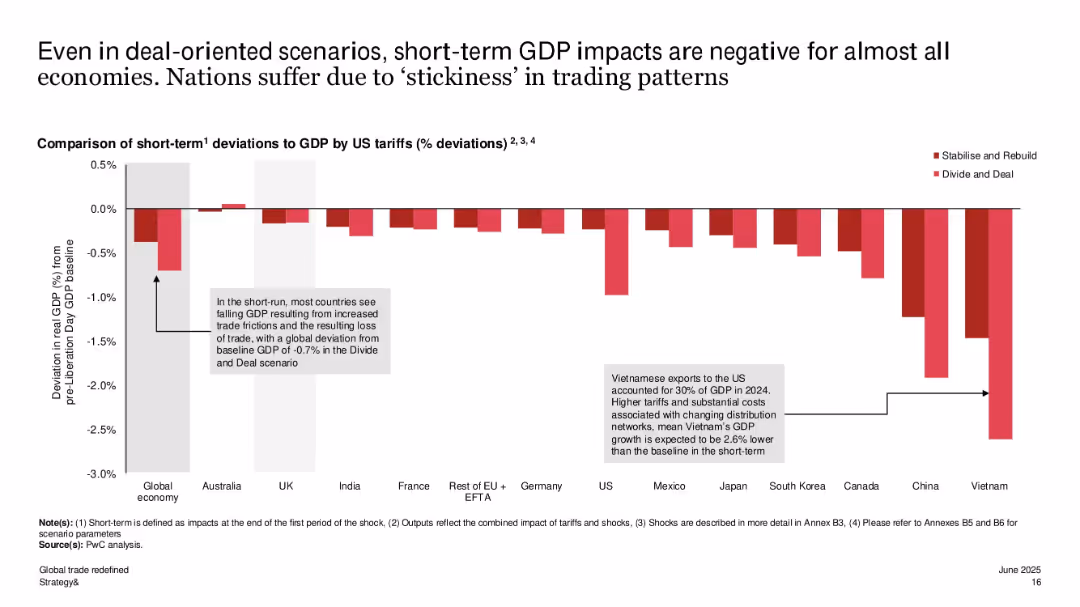
Bar chart comparing short-term GDP deviations for multiple countries; red bars represent different policy scenarios; country labels at bottom.
Market Analysis and Trends
Government & Public Sector
This slide visualizes how short-term GDP impacts from US tariffs vary by country. Most economies show negative deviations due to disrupted trade flows. Vietnam and China are most affected, with global GDP contracting by up to 0.7% under "Divide and Deal".
short-term GDP, trade disruption, tariffs, country impact, global economy, Vietnam, China, scenario comparison, PwC
false
Market Analysis and Trends
Government & Public Sector
Single Chart
PwC/Strategy&
Add to my slides
Remove from favorites
A split-layout design with two content blocks for text. It uses a blue and grey color scheme with bulleted lists to present information. The layout is simple and focuses on textual information.
Risk Assessment and Management
Financial Services
Discusses the short-term factors affecting different sectors of the company, useful for risk management and forecasting. It provides an analysis of the impact of market conditions on various business areas.
Short-Term Outlook, Annuities, Market Conditions, Risk Management, Banking
false
Risk Assessment and Management
Financial Services
Table
Goldman Sachs
Add to my slides
Remove from favorites
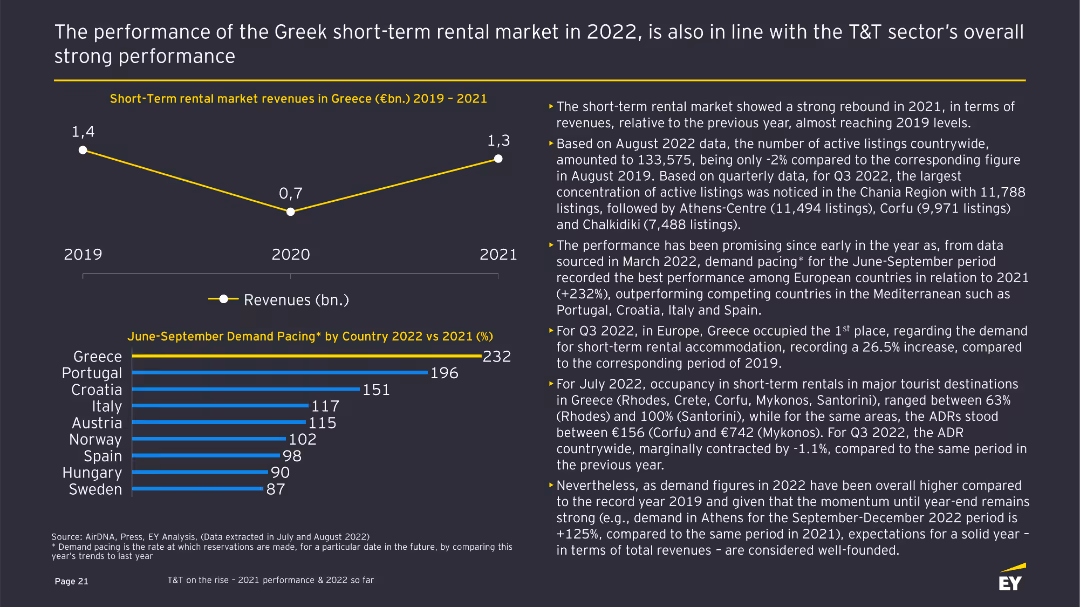
The slide features a line chart showing short-term rental market revenues in Greece from 2019 to 2021 and a column chart showing June-September demand pacing by country in 2022 vs 2021. There are accompanying text explanations and data insights.
Market Analysis and Trends
Hospitality & Tourism
Shows the strong performance of the Greek short-term rental market in 2022, including a revenue rebound in 2021 and demand pacing by country for the June-September period. It discusses occupancy rates and trends across various Greek destinations.
Short-term rental, Greece, Revenue, Demand, Trends
false
Market Analysis and Trends
Hospitality & Tourism
Multiple Chart
EY
Add to my slides
Remove from favorites
This slide features a pie chart showing the impact of regulations on short-term rental decisions. Segments include no longer purchase (teal), have tenants rent (light blue), and no impact (dark blue).
Regulatory and Compliance
Real Estate & Construction
The slide analyzes survey data on the impact of short-term rental regulations, indicating how regulatory changes affect investment property purchasing decisions.
short-term rentals, regulations, survey, rental decisions, investment property
false
Regulatory and Compliance
Real Estate & Construction
Single Chart
IPSOS
Add to my slides
Remove from favorites
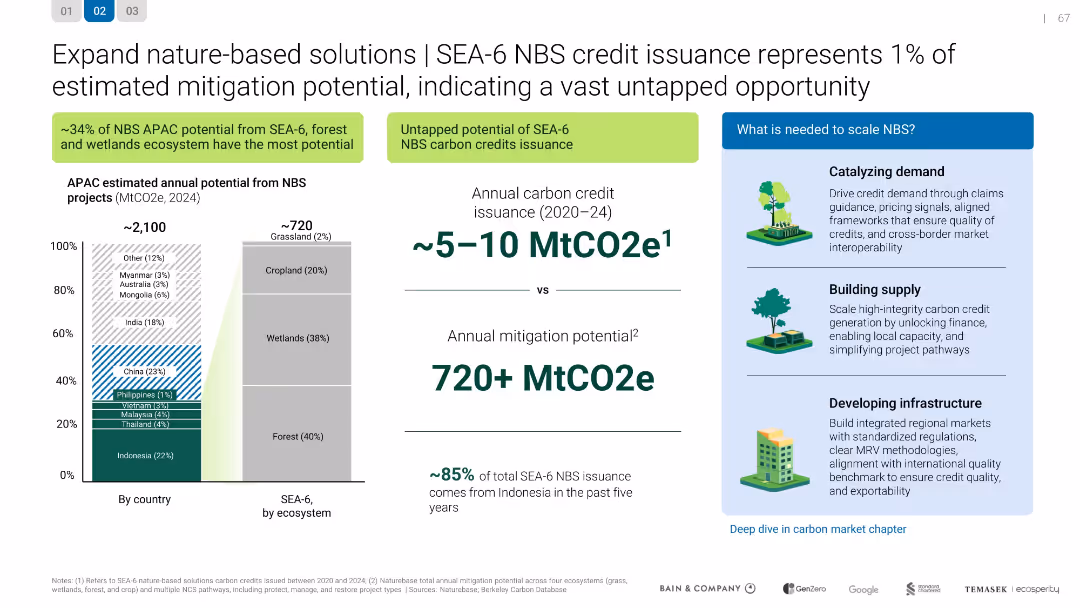
SEA-6 NBS credit issuance represents 1% of estimated mitigation potential
Investment Analysis
Environmental Services & Sustainability
Investment Analysis
Shows SEA-6's underutilized potential in issuing carbon credits from nature-based solutions, with >720 MtCO2e mitigation possible. Recommends steps to scale NBS through demand, supply, and infrastructure development.
false
Investment Analysis
Environmental Services & Sustainability
Mixed Chart
Bain
Add to my slides
Remove from favorites
The slide includes text sections and a column chart comparing the percentage of Gen Zs and Millennials engaging in side jobs. It is organized to highlight the financial pressures leading to increased participation in side jobs.
Market Analysis and Trends
Retail & E-commerce
This slide explores the financial pressures faced by Gen Zs and Millennials, showing the rise in side jobs as a response to living paycheck to paycheck, and details the types of side jobs and motivations behind taking on additional work.
Side jobs, financial pressure, paycheck to paycheck, Gen Z, Millennials
false
Market Analysis and Trends
Retail & E-commerce
Mixed Chart
Deloitte
Add to my slides
Remove from favorites
Bar chart showing global spending in 2024–2025 by age groups. Left-aligned text explains economic power, resilience, and spending habits of consumers over 50. Uses purple gradient blocks.
Customer and Market Segmentation
Retail & E-commerce
Highlights economic influence of the 50+ age group, noting they account for 49% of global spend in 2025. Emphasizes their higher disposable income, resilience during economic uncertainty, and greater willingness to spend on fashion.
Silver Generation, fashion spending, older consumers, wealth, disposable income
false
Customer and Market Segmentation
Retail & E-commerce
Mixed Chart
McKinsey
Add to my slides
Remove from favorites
Column chart showing agreement and disagreement percentages regarding the desire for a simpler life across countries.
Market Analysis and Trends
Government & Public Sector
The slide analyzes the desire for simplicity in life, particularly in Asia and Latin America, with significant variation across countries.
simplicity, lifestyle, regional trends, Asia, Latin America
false
Market Analysis and Trends
Government & Public Sector
Mixed Chart
IPSOS
Add to my slides
Remove from favorites
Column chart showing agreement percentages for simplicity and solitude by age groups.
Market Analysis and Trends
Government & Public Sector
This slide examines the importance of simplicity and solitude, noting a decline in the desire for solitude with age.
simplicity, solitude, age differences, lifestyle, emotional trends
false
Market Analysis and Trends
Government & Public Sector
Multiple Chart
IPSOS
Add to my slides
Remove from favorites
Line chart showing trends in the desire for a simpler life over several years in various countries.
Market Analysis and Trends
Government & Public Sector
The slide tracks the importance of simplicity over time, highlighting trends in different countries.
simplicity, trend analysis, longitudinal study, lifestyle, global trends
false
Market Analysis and Trends
Government & Public Sector
Mixed Chart
IPSOS
Add to my slides
Remove from favorites
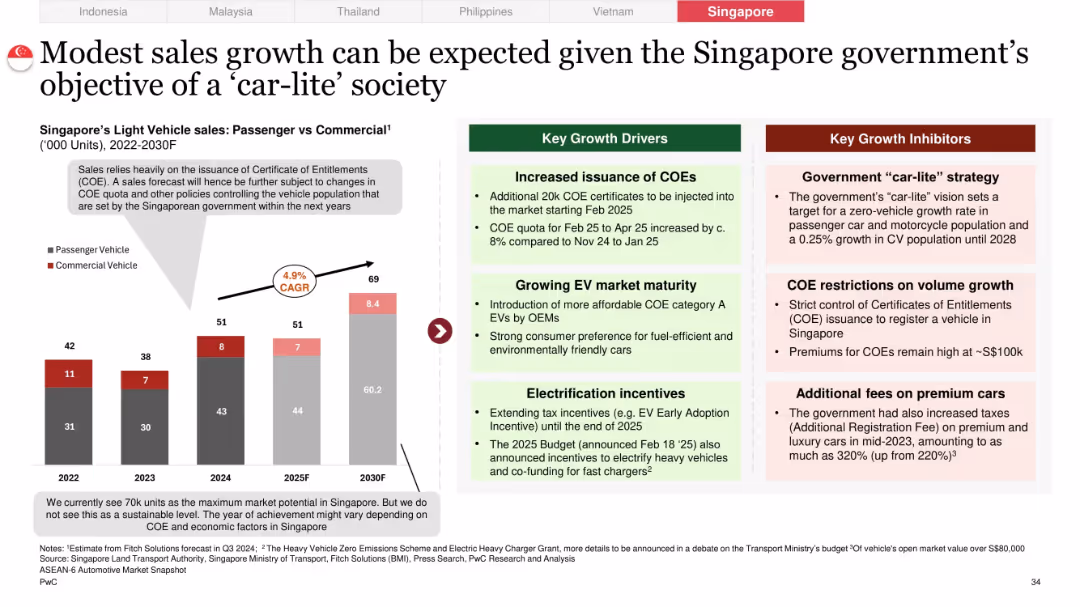
Split layout with PV/CV bar chart and CAGR noted, paired with policy-driven growth/inhibitor blocks
Market Analysis and Trends
Industrial & Manufacturing
Highlights Singapore’s capped vehicle sales due to COE (Certificate of Entitlement) restrictions and car-lite policy goals. EV-friendly incentives are improving affordability, but market growth is tightly regulated.
Singapore, COE system, car-lite strategy, vehicle quota, premium car taxes, policy-driven market
false
Market Analysis and Trends
Industrial & Manufacturing
Mixed Chart
PwC/Strategy&
Add to my slides
Remove from favorites
Contains text blocks summarizing key points on Singapore's role in the regional digital market, with a title, subtitles, and clear separations between points.
Strategic Planning
Technology & Software
Highlights Singapore’s role as a growth enabler in the digital sector, despite certain sector declines, used for discussing regional market dynamics and strategies.
Singapore, Digital Market, Regional, Strategy
false
Strategic Planning
Technology & Software
Mixed Chart
Bain
Add to my slides
Remove from favorites
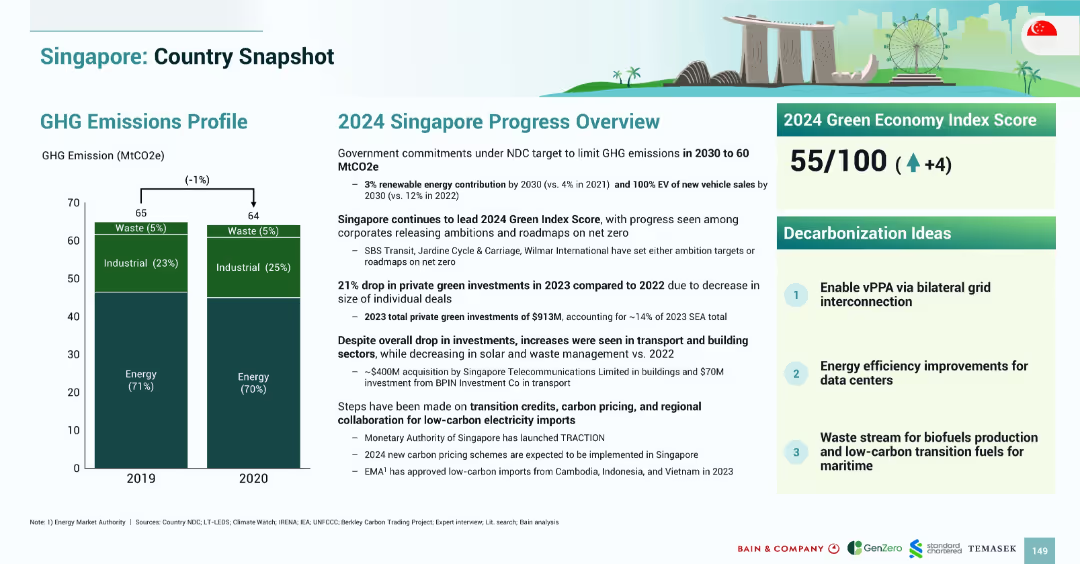
Bar chart on left showing GHG trends; progress summary on right includes text blocks, Green Index Score, and decarbonization ideas in numbered blocks.
Strategic Planning
Government & Public Sector
Singapore aims to cut emissions to 60 MtCO2e by 2030. It leads SEA in Green Index Score (55/100). 2023 saw a drop in private green investments, but building and transport sectors saw gains. Key strategies include vPPA, data center efficiency, and waste-to-fuel transitions.
Singapore, emissions, decarbonization, energy, transport, data centers, vPPA, 2024
false
Strategic Planning
Government & Public Sector
Mixed Chart
Bain
Add to my slides
Remove from favorites
The slide contains a mix of column charts and text segments detailing Singapore's emission profile, government commitments, and a "2030 Trajectory" map with recommended actions.
Regulatory and Compliance
Environmental Services & Sustainability
Discusses Singapore's approach to green transitions, highlighting government commitments to the environment by 2030, and the challenges and enabling factors for these policies.
Singapore, emissions, green buildings, carbon tax, 2030
false
Regulatory and Compliance
Environmental Services & Sustainability
Header Horizontal
Bain
Add to my slides
Remove from favorites
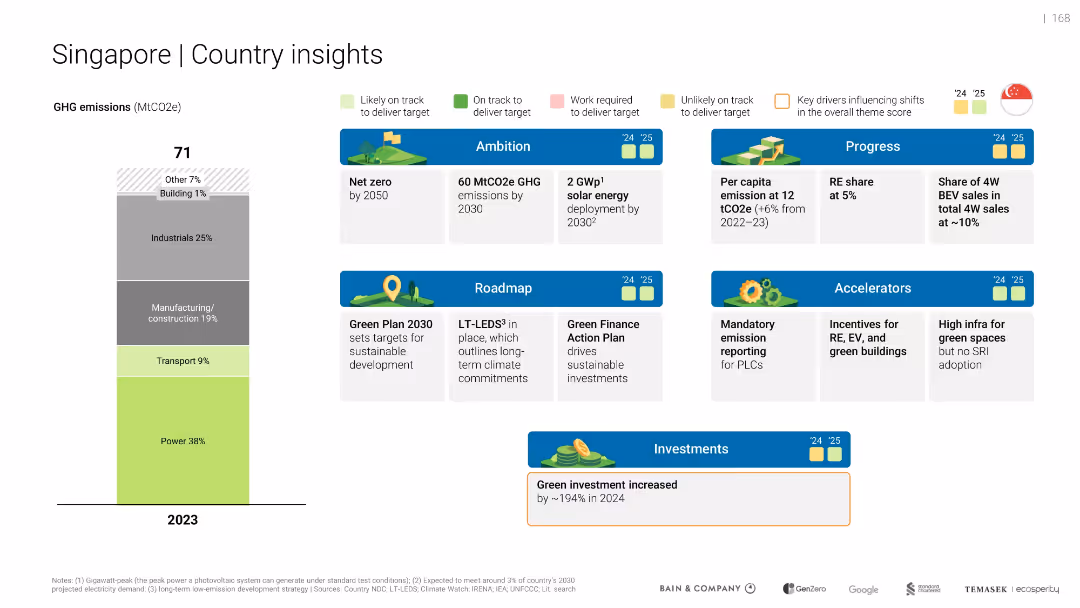
Vertical emissions breakdown bar and multiple colored status cards arranged in grid. Color-coded icons for tracking performance and roadmaps.
Strategic Planning
Government & Public Sector
Presents Singapore’s GHG emissions by sector (2023) and outlines goals, progress, and policy measures for decarbonization and green investment. Includes visual indicators for performance against targets.
Singapore, emissions, targets, solar energy, RE share, green finance
false
Strategic Planning
Government & Public Sector
Mixed Chart
Bain
Add to my slides
Remove from favorites
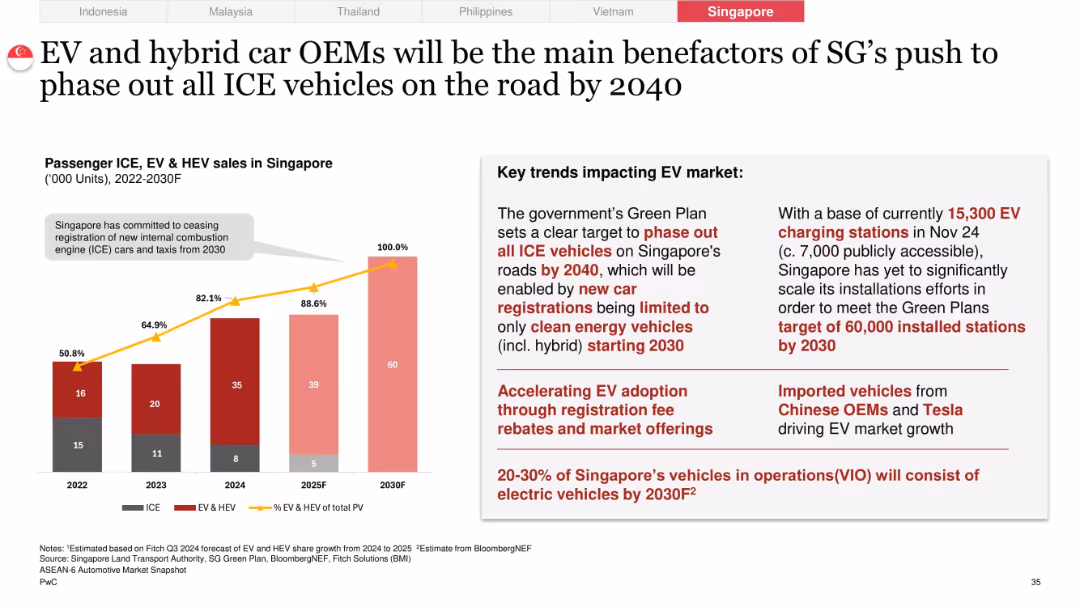
EV/ICE bar and line chart on the left; right-hand panel outlines market evolution, OEMs, charging targets, and Green Plan goals
Technology and Digital Transformation
Industrial & Manufacturing
Singapore targets 100% clean energy vehicle registration by 2030, with full ICE phaseout by 2040. Slide details Green Plan policies, EV imports from Chinese OEMs, and an EV charging target of 60,000 stations.
Singapore, EV phaseout, ICE ban, Green Plan 2040, charging stations, Tesla, Chinese EVs, VIO targets
false
Technology and Digital Transformation
Industrial & Manufacturing
Mixed Chart
PwC/Strategy&
Add to my slides
Remove from favorites
This slide contains multiple stacked column charts displaying the decline of private funding value in Singapore across different sectors from 2019 to H1 2023. The charts are color-coded to distinguish sectors such as Travel, Transport & Food, Digital Media, E-commerce, and DFS. A legend is provided, and the slide includes a note on nascent sectors and the source of the data.
Market Analysis and Trends
Technology & Software
The slide shows a trend of decreasing private funding in Singapore, segmented by industry sectors, highlighting the broader implications for the SEA region's market. This could be used for discussions on investment strategy and economic forecasting.
Singapore, funding decline, SEA region, private investment, nascent sectors, 2019-2023 trends, stacked column charts, market analysis.
false
Market Analysis and Trends
Technology & Software
Single Chart
Bain
Add to my slides
Remove from favorites
This slide presents a column chart and bullet points. There is a balance of text and graphical data. The slide's design is clean, with a structured layout for the charts and bullet points on a white background.
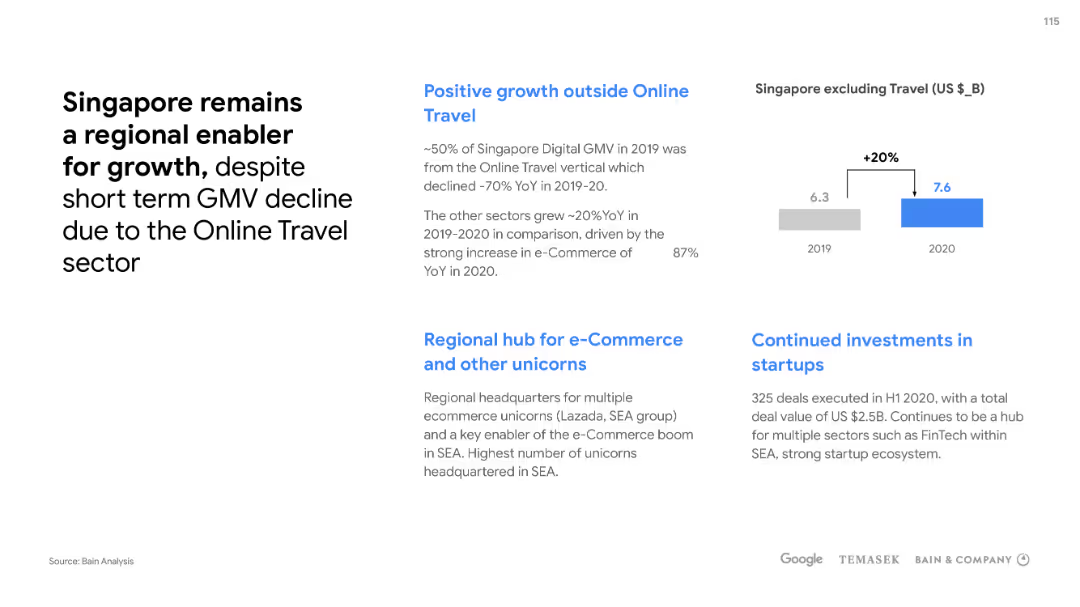
Market Analysis and Trends
Technology & Software
The slide illustrates Singapore's growth trends despite declines in specific sectors like online travel. It also highlights the positive aspects such as being a regional hub for e-commerce and investments in startups. Intended to showcase market resilience.
Singapore, growth, e-commerce, online travel, investments, startups, GMV, regional hub
false
Market Analysis and Trends
Technology & Software
Mixed Chart
Bain
Add to my slides
Remove from favorites
Consists of bar graphs comparing HVUs vs non-HVUs spending in Singapore, with demographic and geographic composition data. It uses a bold blue color theme.
Customer and Market Segmentation
Technology & Software
Analyzes the spending patterns between HVUs and non-HVUs in Singapore, emphasizing the significant spending gap and demographic data.
Singapore, HVUs, Spending Gap, Demographics, Online Spending, Gaming, Streaming, Transport, Market Segmentation
false
Customer and Market Segmentation
Technology & Software
Multiple Chart
Bain
Add to my slides
Remove from favorites
Column chart showing the private funding value by country with a legend, set against a white background with a bold title at the top.
Market Analysis and Trends
Financial Services
Highlights Singapore and Indonesia as the top investment destinations in 2022, presenting the private funding values and market shares.
Singapore, Indonesia, investment destinations, private funding, market share, SEA, column chart, 2022
false
Market Analysis and Trends
Financial Services
Single Chart
Bain
Add to my slides
Remove from favorites
Slide with a title, a column chart showing historical and projected GMV for Singapore’s internet economy from 2015 to 2025, legends, and a source.
Market Analysis and Trends
Technology & Software
Discusses the contraction and future growth projection of Singapore’s internet economy, likely used to examine the impacts of market forces and potential recovery trajectories.
Singapore, Internet Economy, Contraction, Projection
false
Market Analysis and Trends
Technology & Software
Single Chart
Bain
Add to my slides
Remove from favorites
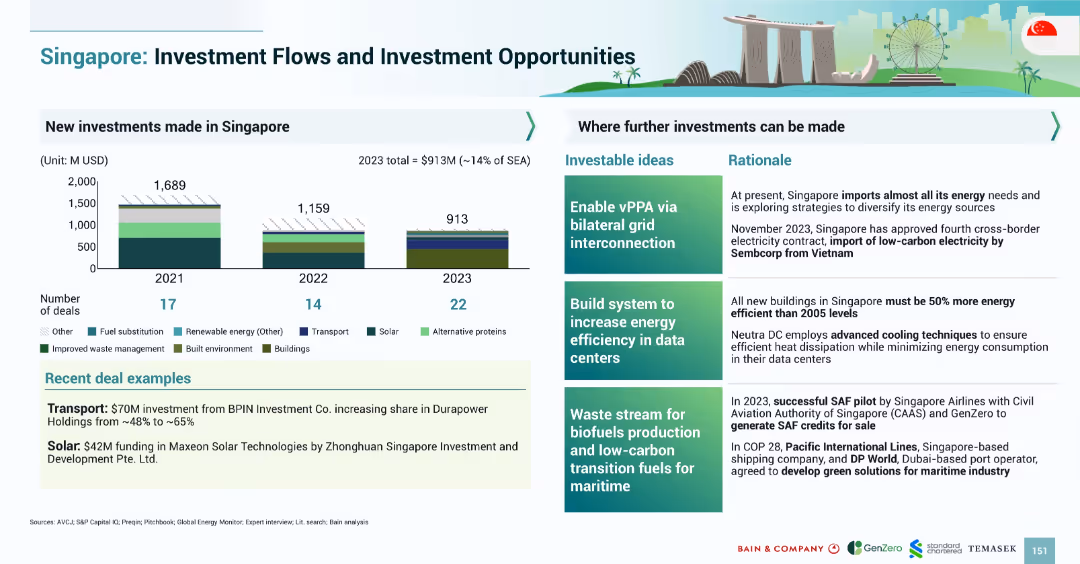
Investment chart by sector and year (2021–2023) on left; right side lists investment themes and rationale. Bottom includes recent deal highlights.
Investment Analysis
Government & Public Sector
Singapore’s green investment totaled $913M in 2023 (~14% SEA). Focus areas include vPPA infrastructure, data center efficiency, and maritime biofuels. Deals include funding in solar and EV transport. Rationales stress energy import reliance and sustainability goals.
Singapore, investment, energy efficiency, solar, transport, vPPA, maritime, 2023
false
Investment Analysis
Government & Public Sector
Mixed Chart
Bain
Add to my slides
Remove from favorites
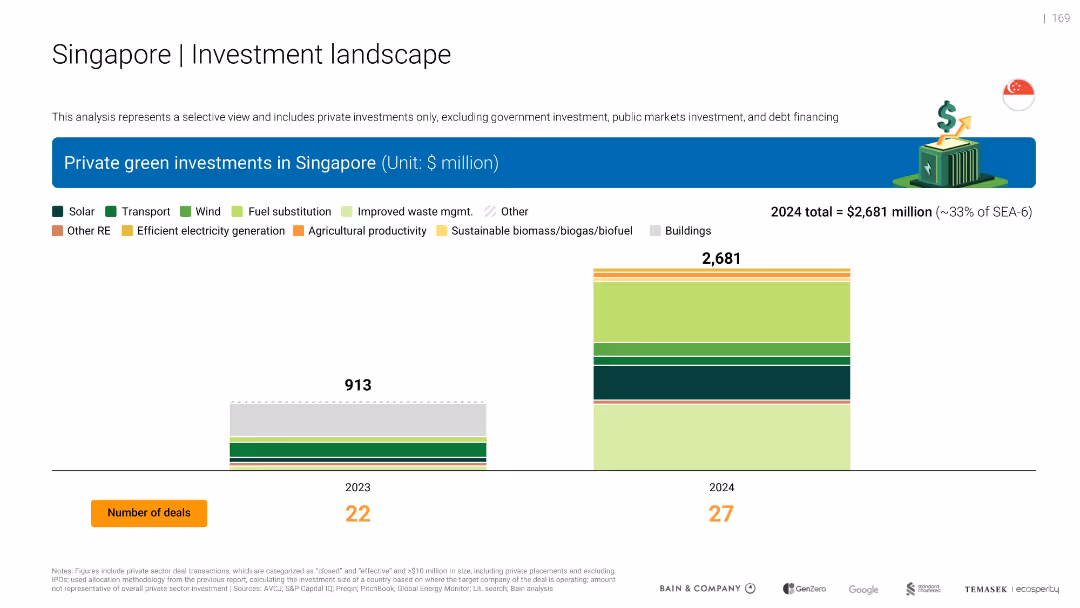
Two bar charts showing private green investments in Singapore for 2023 and 2024 by multiple categories including solar, transport, waste, biomass, etc.
Investment Analysis
Environmental Services & Sustainability
Illustrates a dramatic increase in Singapore’s private green investments from $913M in 2023 to $2.68B in 2024. Includes sector breakdowns and number of deals (22 in 2023, 27 in 2024).
Singapore, investments, biomass, transport, solar, 2024, deals, sectors
false
Investment Analysis
Environmental Services & Sustainability
Single Chart
Bain
Add to my slides
Remove from favorites
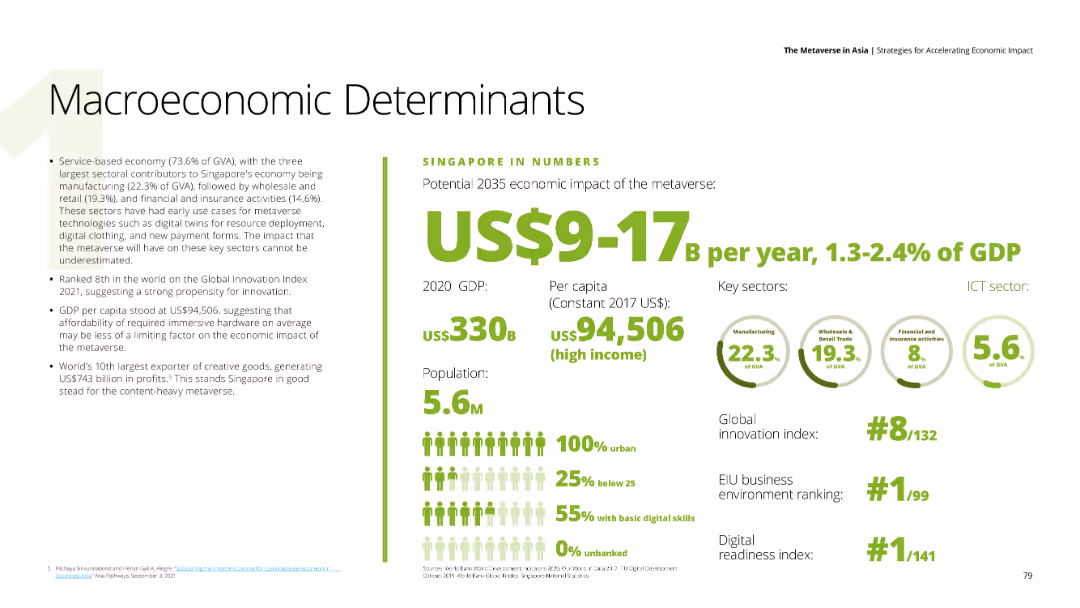
Detailed text on Singapore's economic impact of the metaverse, with numerical data on GDP, per capita income, and key sectors like manufacturing, wholesale trade, and financial activities. Background is white with green and black text.
Market Analysis and Trends
Financial Services
Evaluates Singapore's strong economic position and potential metaverse impact, mentioning GDP, innovation index ranking, and key sectors contributing to the economy.
Singapore, metaverse, economic impact, GDP, innovation index
false
Market Analysis and Trends
Financial Services
Mixed Chart
Deloitte
Add to my slides
Remove from favorites
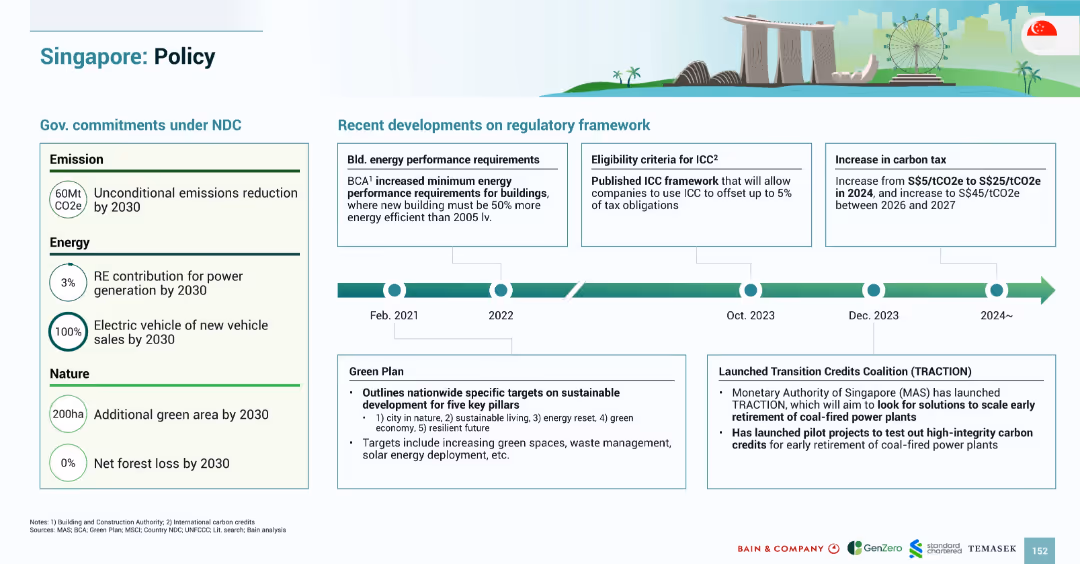
Structured timeline view (2021–2024) with regulatory highlights and a left-aligned panel of 2030 targets for emissions, energy, and nature.
Regulatory and Compliance
Government & Public Sector
The slide presents Singapore’s climate commitments (60 MtCO2e, 100% EV sales, green spaces) and timeline of policy updates. These include new carbon tax levels, building energy performance standards, and the TRACTION initiative for early coal plant retirements.
Singapore, regulation, policy, carbon tax, TRACTION, building efficiency, EV, 2030
false
Regulatory and Compliance
Government & Public Sector
Mixed Chart
Bain
Add to my slides
Remove from favorites
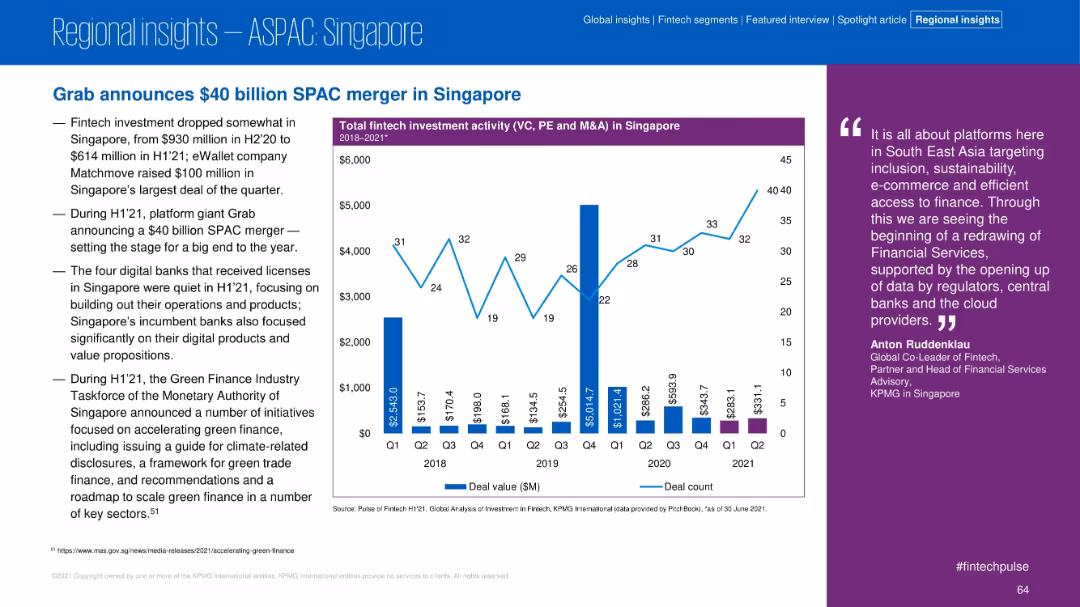
Left-aligned bullet points and a chart showing fintech investment trends in Singapore from 2018 to 2021.
Mergers and Acquisitions
Financial Services
Highlighting Singapore’s fintech landscape in H1’21, the slide discusses a $40B Grab SPAC deal, falling overall investment from H2’20, and increased attention to green finance. Deal activity chart included.
Singapore, SPAC, M&A, Fintech, Green Finance, Grab
false
Mergers and Acquisitions
Financial Services
Mixed Chart
KPMG
Add to my slides
Remove from favorites
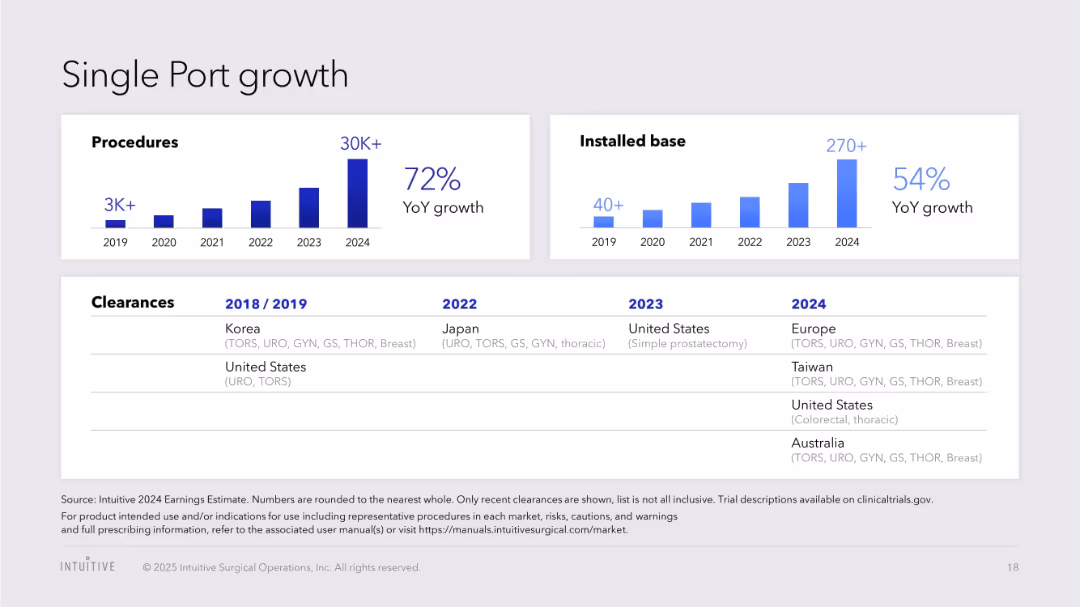
Bar charts for procedures and installed base; global regulatory clearance table
Product and Service Analysis
Healthcare & Pharmaceuticals
Reviews the expansion of Single Port technology with YoY growth in procedures and installations, supported by a timeline of regional clearances.
Single Port, procedures, regulatory approvals, installations, da Vinci, global growth, healthcare robotics
false
Product and Service Analysis
Healthcare & Pharmaceuticals
Multiple Chart
JP Morgan
Add to my slides
Remove from favorites
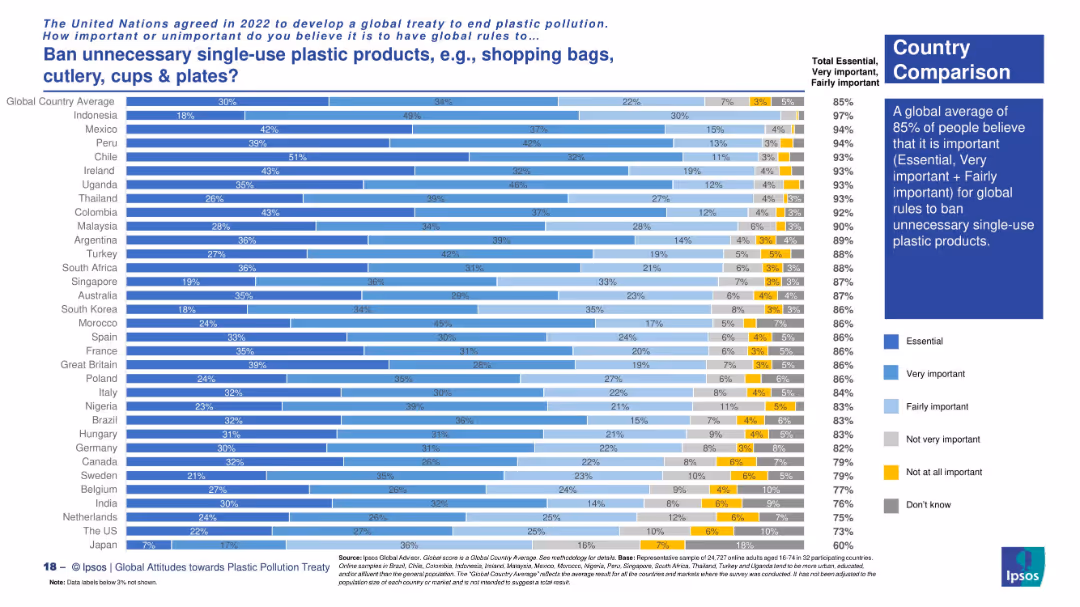
Vertical bar chart showing public opinion in different countries using five-color gradients to represent perceived importance. Includes summary statistics.
Regulatory and Compliance
Environmental Services & Sustainability
This slide highlights that a global average of 85% of people support banning unnecessary single-use plastic products. Latin American countries and Uganda show particularly high levels of support.
single-use plastics, environmental policy, global regulation, Ipsos data, public opinion, global treaty
false
Regulatory and Compliance
Environmental Services & Sustainability
Mixed Chart
IPSOS
Add to my slides
Remove from favorites
Displays a table comparing sin tax rates for various products over two years, alongside an illustrative crowd of diverse people.
Regulatory and Compliance
Government & Public Sector
Provides details on the adjustments in sin tax rates for alcoholic beverages and cigarettes in Namibia, reflecting policy changes in consumer taxation.
sin taxes, tax rates, Namibia, alcoholic beverages, cigarettes, consumer taxation
false
Regulatory and Compliance
Government & Public Sector
Table
PwC/Strategy&
Add to my slides
Remove from favorites
Previous
Next
You don't have any favorites yet.
Please wait loading your favorites slides...
Create a FREE account to continue browsing
Receive Instant Access to 1,000+ slides from companies like McKinsey, Google, and Goldman Sachs
First Name
Last Name
Email
Password
I agree to all
Terms & Privacy Policy
Thank you! Your submission has been received!
Oops! Something went wrong while submitting the form.
Have an account?
Sign in
Upgrade to PRO to Save slides
Advanced Search and Filters
Access to 15,000+ slides
Access to Category Pages
Save/Bookmark Slides
PowerPoint Template Library
Pick a Plan
MONTHLY
$12/month
Billed every month, Cancel anytime.
YEARLY
$9/year
Billed $108 annually, Cancel anytime.
Checkout for $12/month
Checkout for $108/yr
Secured by Stripe | AES-256 bit encryption


![Organizations continue to adopt multifunctional centers, with respondents reporting an average of three functions within their SSC [Figure 6]](https://cdn.prod.website-files.com/654e70fb59937215cac87b19/67036888374598b495386998_qyiDoUewMcewo9ANId8uBDttW7bY5n-e0-_VFggd3pc.avif)


![SSCs continue to focus on moving up the process value chain, with over three-quarters of respondents planning to increase the number of knowledge-based SSC processes [Figure 17]](https://cdn.prod.website-files.com/654e70fb59937215cac87b19/670368c5fced7b219f99ffed_H-yv0oQyiwsSgrSVfOC31pS9DqGWH4logwgb8IZOwy4.avif)