My Account
My Slides
Search by Category
Pricing
Templates
View All Templates
Download Template Slides
✦ AI Search
Feedback
Login
Logout
Get Started
Browse all Slides
Browse all Slides
Create a FREE Account
Instant access to 1,000+ real slides from top companies like McKinsey, BCG, Goldman Sachs, Google and many more!
First Name
Last Name
Email
Password
I agree to all
Terms & Privacy Policy
Thank you! Your submission has been received!
Oops! Something went wrong while submitting the form.
Have an account?
Sign in
Saved Slides
Total No. of slides saved
0
↻ Refresh
✖ Clear all
The slide includes a bar chart and textual data focusing on demographics and characteristics of Brazilian startup founders.
Market Analysis and Trends
Technology & Software
Provides detailed demographics of Brazilian startup founders, including average age, educational background, and gender distribution, offering insights into the entrepreneurial landscape.
startups, Brazil, demographics, founders, education
false
Market Analysis and Trends
Technology & Software
Mixed Chart
McKinsey
Add to my slides
Remove from favorites
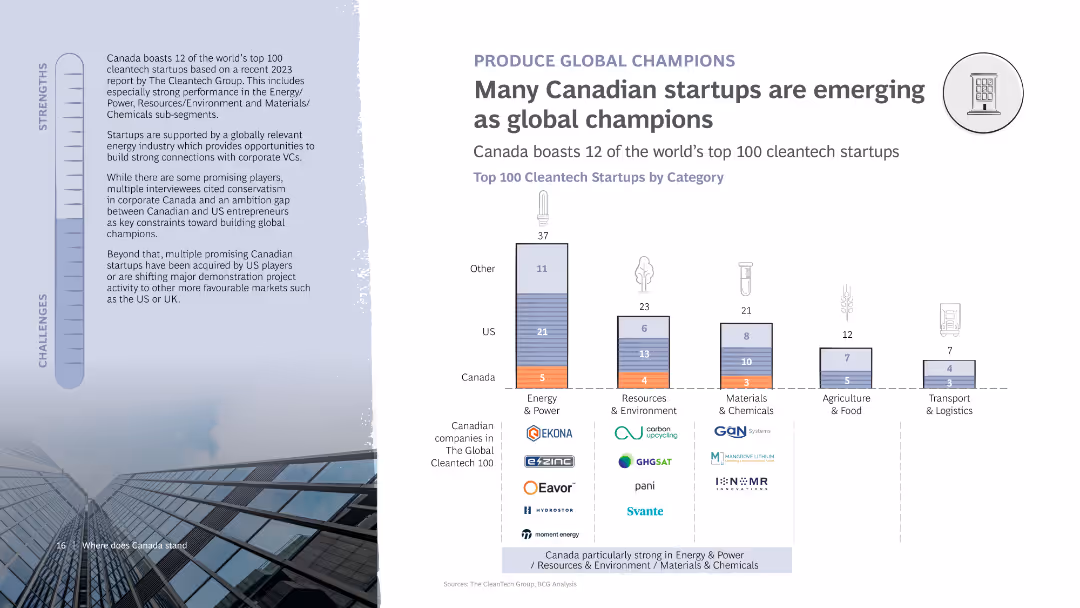
The slide includes a column chart showing the top 100 cleantech startups by category, with a breakdown of companies from Canada and the US. It features text discussing the strengths and challenges of Canadian startups in becoming global champions.
Competitive Landscape
Technology & Software
Discusses the emergence of Canadian startups as global leaders in cleantech, with specific examples from various categories. Highlights strengths and challenges in achieving global recognition and success.
Startups, Cleantech, Canada, Global champions, Chart
false
Competitive Landscape
Technology & Software
Mixed Chart
BCG
Add to my slides
Remove from favorites
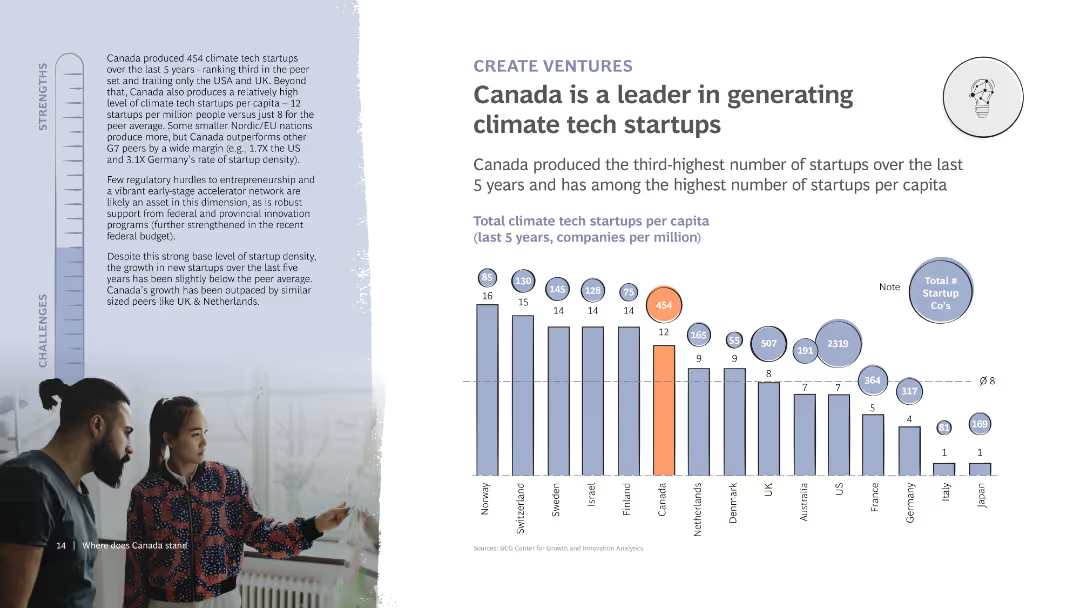
The slide includes a column chart showing the number of climate tech startups per capita in various countries. It also features detailed text discussing Canada’s startup ecosystem and its strengths and challenges, with a photo of two people collaborating.
Market Analysis and Trends
Technology & Software
Highlights Canada's leadership in generating climate tech startups, showing it ranks high in startups per capita. Discusses the supportive ecosystem and challenges in maintaining growth and innovation in the sector.
Startups, Climate tech, Canada, Innovation, Ecosystem
false
Market Analysis and Trends
Technology & Software
Mixed Chart
BCG
Add to my slides
Remove from favorites
Similar two-column structure with a bar chart on the right and text-based explanation on the left. Purple color scheme with gradient chart bars.
Strategic Planning
Government & Public Sector
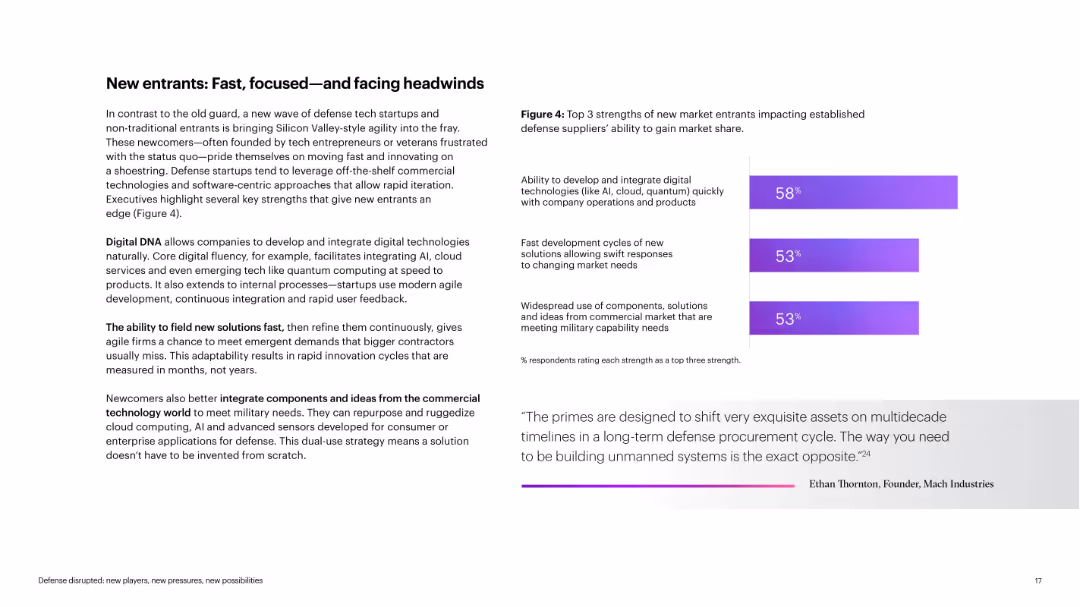
Describes strengths of new defense tech startups, including speed, digital fluency, and agile innovation cycles. The slide emphasizes their competitive advantages over traditional primes in integrating cutting-edge tech.
startups, defense, agility, innovation, digital, iteration
false
Strategic Planning
Government & Public Sector
Mixed Chart
Accenture
Add to my slides
Remove from favorites
Depicts a column chart of perceptions regarding the French start-up ecosystem's support for digital transformation, with quotes from industry professionals.
Market Analysis and Trends
Technology & Software
Reviews the impact of the French start-up ecosystem on digital transformation, noting the positive perception among stakeholders about its role in fostering innovation.
start-ups, digital transformation, France, innovation, ecosystem
false
Market Analysis and Trends
Technology & Software
Mixed Chart
Bain
Add to my slides
Remove from favorites
Bar chart displaying the age distribution of startup founders in the U.S., distinguishing between all startups and high-growth startups. Text boxes provide key statistics on founders' ages.
Market Analysis and Trends
Professional Services
Challenges the common belief that most successful startup founders are young, showing that founders are typically older. Useful in discussions about entrepreneurship and age demographics.
startups, entrepreneurship, age, myths, data
false
Market Analysis and Trends
Professional Services
Single Chart
McKinsey
Add to my slides
Remove from favorites
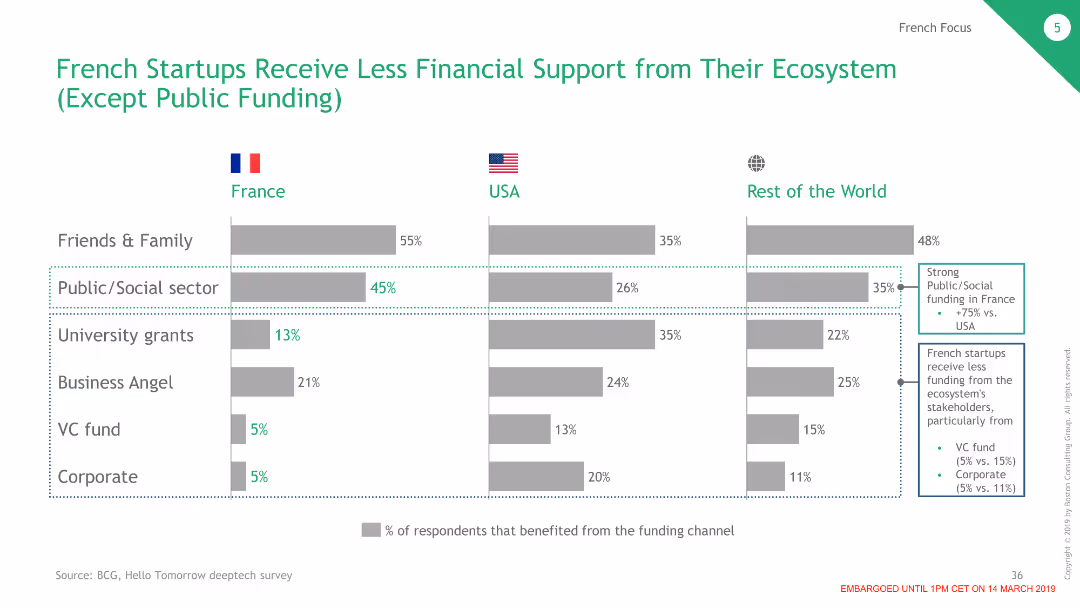
Features a bar chart comparing sources of financial support for startups in France, the USA, and the RoW, emphasizing public sector support.
Financial Performance
Financial Services
Highlights the relative lack of financial support from private sources for French startups compared to public sector support.
startups, financial support, France, public sector, funding
false
Financial Performance
Financial Services
Multiple Chart
BCG
Add to my slides
Remove from favorites
This slide provides an overview of the investment landscape in Italy, using maps to depict the distribution and growth of startups, along with future market predictions.
Market Analysis and Trends
Technology & Software
Discusses the current and projected state of the startup ecosystem in Italy, emphasizing investment trends, challenges, and the growth potential within the European Union.
startups, Italy, investment, innovation, EU market, growth potential
false
Market Analysis and Trends
Technology & Software
Graphic
Bain
Add to my slides
Remove from favorites
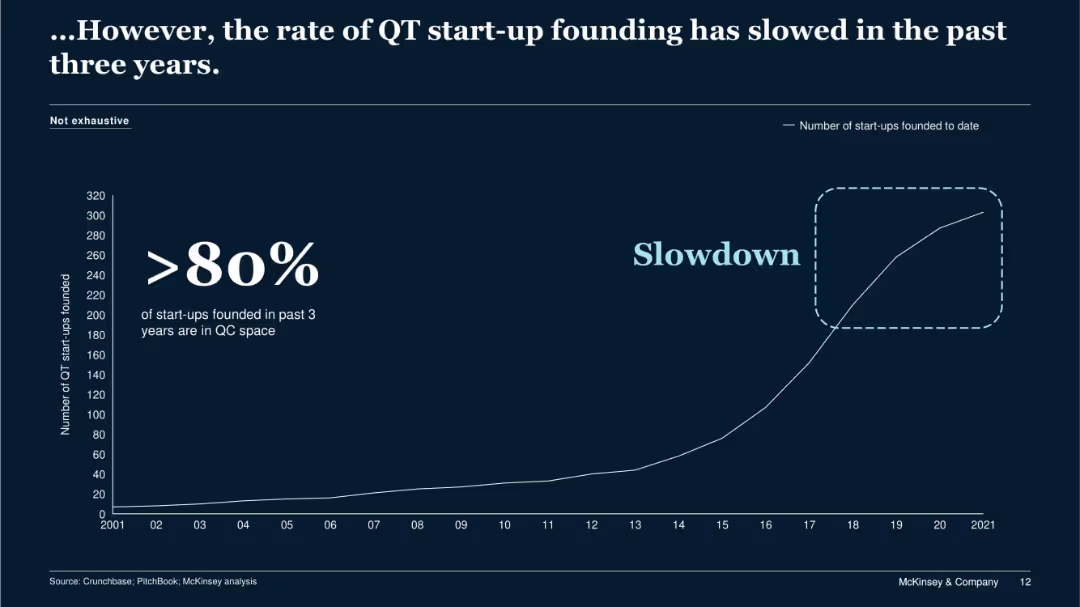
Line graph showing cumulative QT startup founding over time; dark background with large highlighted text and a marked slowdown region.
Market Analysis and Trends
Technology & Software
The slide highlights a slowdown in the formation of QT startups over the last three years despite prior growth. Over 80% of the new startups were in the quantum computing (QC) space. The chart suggests maturing market conditions and possibly barriers to new entrants.
startup slowdown, QT, QC, market trend, startup founding, saturation
false
Market Analysis and Trends
Technology & Software
Single Chart
McKinsey
Add to my slides
Remove from favorites
Two isometric illustrations depict startup environments. Text boxes and percentages discuss recruitment challenges and reasons for job changes among tech employees.
Human Resources and Talent Management
Technology & Software
Highlights major recruitment challenges faced by startups and reasons why tech talent may change jobs. Useful for HR strategy discussions.
startups, recruitment challenges, tech talent, job change, HR strategy, isometric illustration
false
Human Resources and Talent Management
Technology & Software
Boxed
Kearney
Add to my slides
Remove from favorites
Features a column chart comparing salaries across corporate levels between top corporates and startups, highlighting salary gaps
Human Resources and Talent Management
Technology & Software
Analyzes how salary structures at startups compare with larger corporations, particularly in attracting senior talent
startups, salaries, talent, corporate, HR
false
Human Resources and Talent Management
Technology & Software
Single Chart
McKinsey
Add to my slides
Remove from favorites
Displays column charts and startup logos, organized in a visually engaging and informative manner to showcase growth and investment trends.
Investment Analysis
Environmental Services & Sustainability
Examines the booming startup ecosystem in SEA focused on sustainability, detailing the rapid increase in startups and investments in the sector since 2015.
Startups, sustainability, SEA, growth, investments
false
Investment Analysis
Environmental Services & Sustainability
Multiple Chart
Bain
Add to my slides
Remove from favorites
The slide compares key roles needed across different startup stages with icons representing each stage. It features a clear structure and a green-to-blue gradient.
Strategic Planning
Professional Services
Outlines key roles in various startup stages from product validation to unicorn status, aiding in workforce planning and organizational development.
startup stages, key roles, workforce planning, organizational development, product validation, unicorn status
false
Strategic Planning
Professional Services
Boxed
Kearney
Add to my slides
Remove from favorites
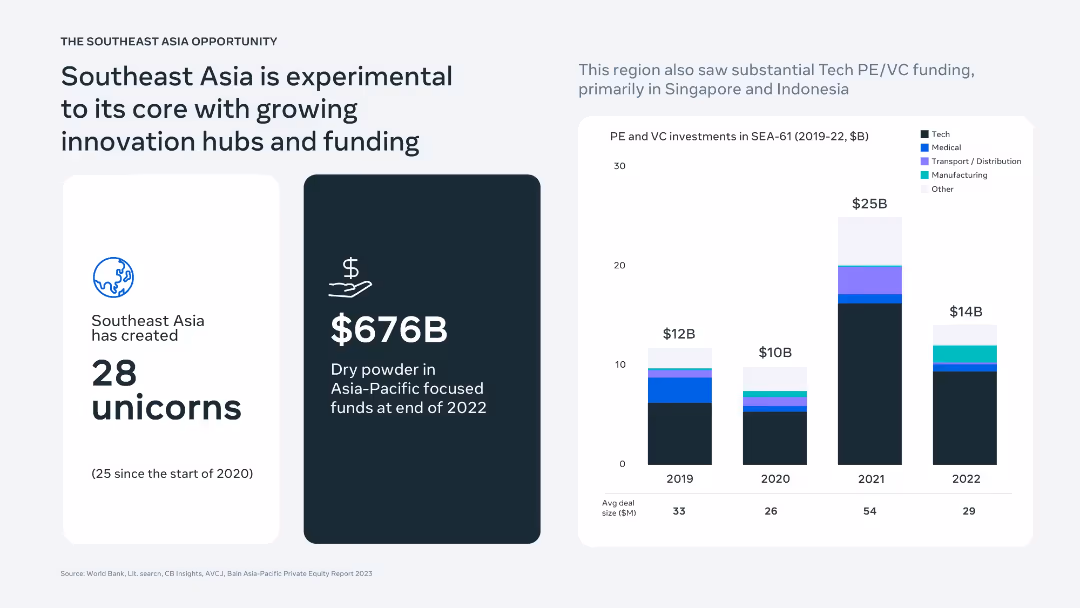
Three-panel layout showing unicorn creation stats, funding availability, and PE/VC investment trends in SEA via bar charts and infographics.
Investment Analysis
Financial Services
Presents SEA as a hub of innovation with 28 unicorns and $676B in dry powder. Highlights rising PE/VC investments (especially in 2021) across tech, medical, transport, and manufacturing sectors, emphasizing Singapore and Indonesia as key recipients.
startups, unicorns, Southeast Asia, PE/VC funding, tech investment, innovation hubs
false
Investment Analysis
Financial Services
Mixed Chart
Bain
Add to my slides
Remove from favorites
Features a man with VR goggles next to a bar chart comparing the time taken by various banks to reach 1 million clients, and statistics on local vs. international expansion goals
Market Analysis and Trends
Financial Services
Discusses the impact of high valuations on startups' strategies, focusing on the aggressive expansion either locally or internationally
startups, valuations, expansion, VR, market
false
Market Analysis and Trends
Financial Services
Mixed Chart
McKinsey
Add to my slides
Remove from favorites
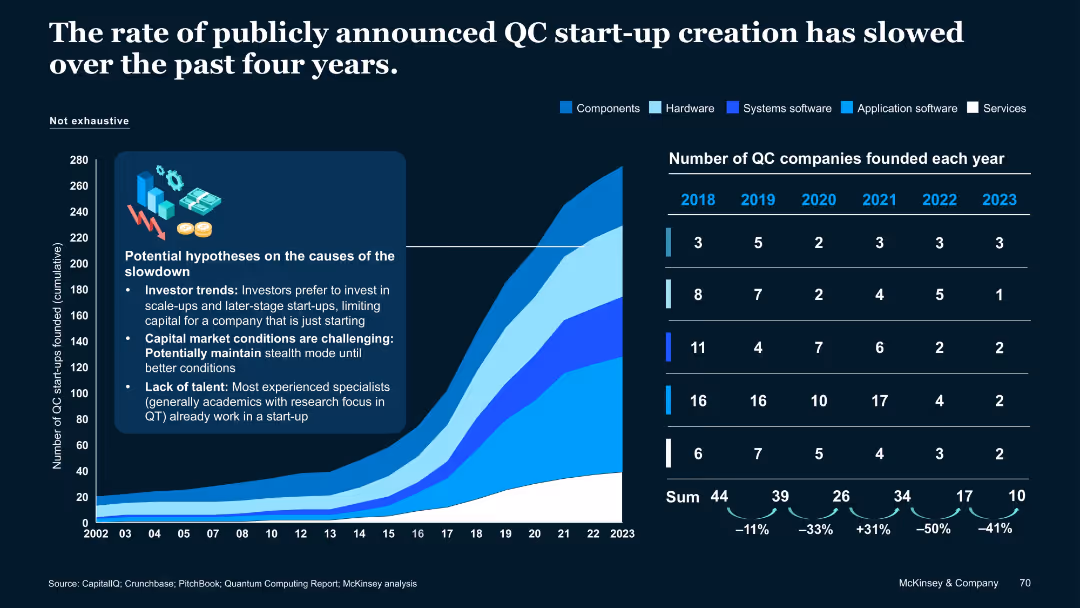
Combination of line graph and bar chart with annotations; left side includes potential causes of slowdown in a callout box.
Market Analysis and Trends
Artificial Intelligence
Shows declining trend in quantum computing start-up creation since 2020, analyzing causes like investor behavior, market conditions, and talent shortages. Visualizes number of start-ups founded by category and year.
Start-up trends, investment, talent shortage, market analysis, QC growth
false
Market Analysis and Trends
Artificial Intelligence
Mixed Chart
McKinsey
Add to my slides
Remove from favorites
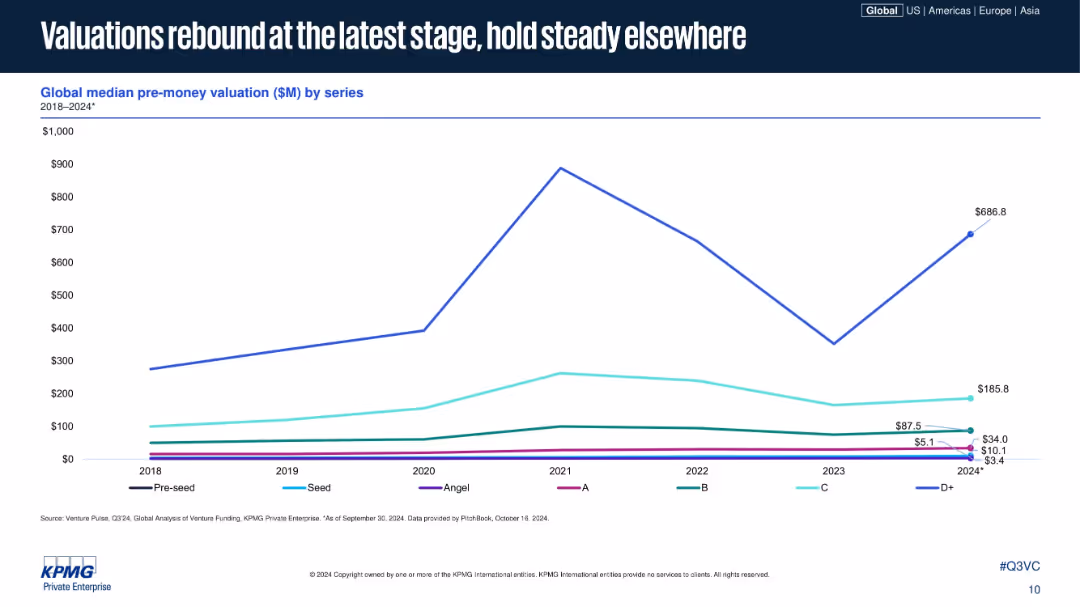
Line chart similar in style to previous, plotting median pre-money valuations across funding series; D+ shows significant increase in 2024; uses same visual and color scheme.
Investment Analysis
Financial Services
The slide displays median pre-money valuations across venture funding series from 2018 to 2024, showing that while early and mid-stage valuations are flat, late-stage valuations (Series D+) have seen a strong recovery. It emphasizes how later-stage optimism is rebounding first.
startup valuation, venture capital, pre-money, funding stages, D+ recovery, series B, investment climate, 2024, KPMG, VC metrics
false
Investment Analysis
Financial Services
Single Chart
KPMG
Add to my slides
Remove from favorites
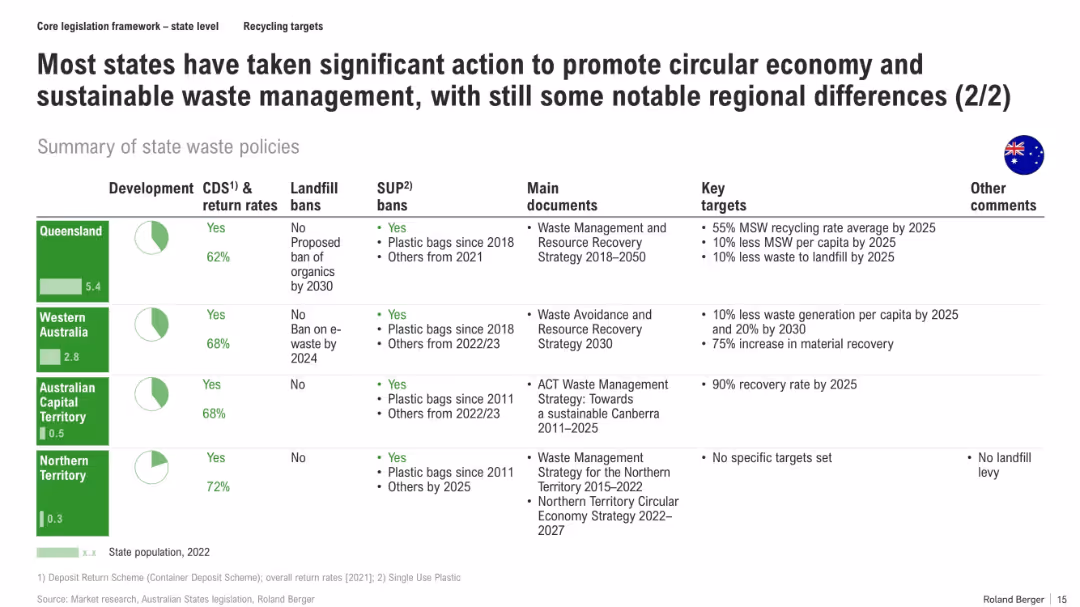
Continuation of the previous slide, using the same tabular format to cover the remaining Australian states and territories
Regulatory and Compliance
Environmental Services & Sustainability
The slide continues coverage of state waste policies, detailing Queensland, Western Australia, ACT, and Northern Territory. It compares CDS return rates, bans, and strategic targets, identifying gaps in NT and strong recovery goals in others.
state policies, CDS, plastic bans, landfill strategy, recovery targets, circular economy, recycling, Australia
false
Regulatory and Compliance
Environmental Services & Sustainability
Mixed Chart
Roland Berger
Add to my slides
Remove from favorites
The slide presents statistical data regarding the significance of survey results in a formatted text layout with bullet points and headers.
Performance Metrics and KPIs
Telecommunications
This slide explains the statistical significance and methodology behind a survey conducted by NBN Co, detailing confidence levels and sample sizes.
statistical significance, survey, methodology, NBN Co, data analysis, sample size
false
Performance Metrics and KPIs
Telecommunications
Table
Accenture
Add to my slides
Remove from favorites
Six line graphs with search volumes for staycations by country, indexed to January, annotated with spikes post-lockdown. The graphs reflect the increased interest in staycations during the pandemic.
Market Analysis and Trends
Technology & Software
Shows the surge in interest for staycations as lockdown restrictions eased, indicating market opportunities for the hospitality industry. Relevant for businesses adapting to changing consumer preferences in tourism during the pandemic.
Staycations, Search volumes, Lockdown effects, Market opportunities, Hospitality industry
false
Market Analysis and Trends
Technology & Software
Multiple Chart
Bain
Add to my slides
Remove from favorites
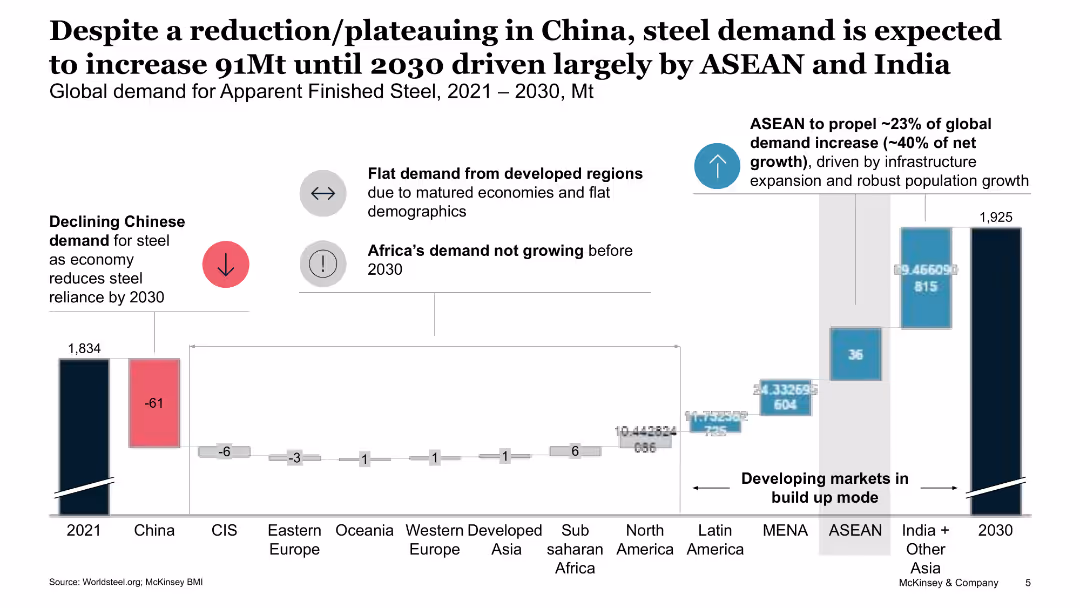
The slide features a complex column chart illustrating global steel demand projections, highlighting demand changes by region, with a focus on ASEAN and India.
Market Analysis and Trends
Industrial & Manufacturing
This slide forecasts global steel demand growth until 2030, driven by ASEAN and India, and discusses the reduction in Chinese demand and flat demand in developed regions.
steel demand, ASEAN, India, global projections, market trends
false
Market Analysis and Trends
Industrial & Manufacturing
Mixed Chart
McKinsey
Add to my slides
Remove from favorites
The slide presents a column chart showing global steel demand projections from 2021 to 2030, with regional breakdowns and future growth drivers indicated.
Market Analysis and Trends
Industrial & Manufacturing
This slide forecasts global steel demand up to 2030, noting a decline in Chinese demand but growth driven by ASEAN and India, and highlights regional differences in demand.
Steel demand, projections, 2030, ASEAN, India, China, regional growth, market analysis, future, trends
false
Market Analysis and Trends
Industrial & Manufacturing
Single Chart
BCG
Add to my slides
Remove from favorites
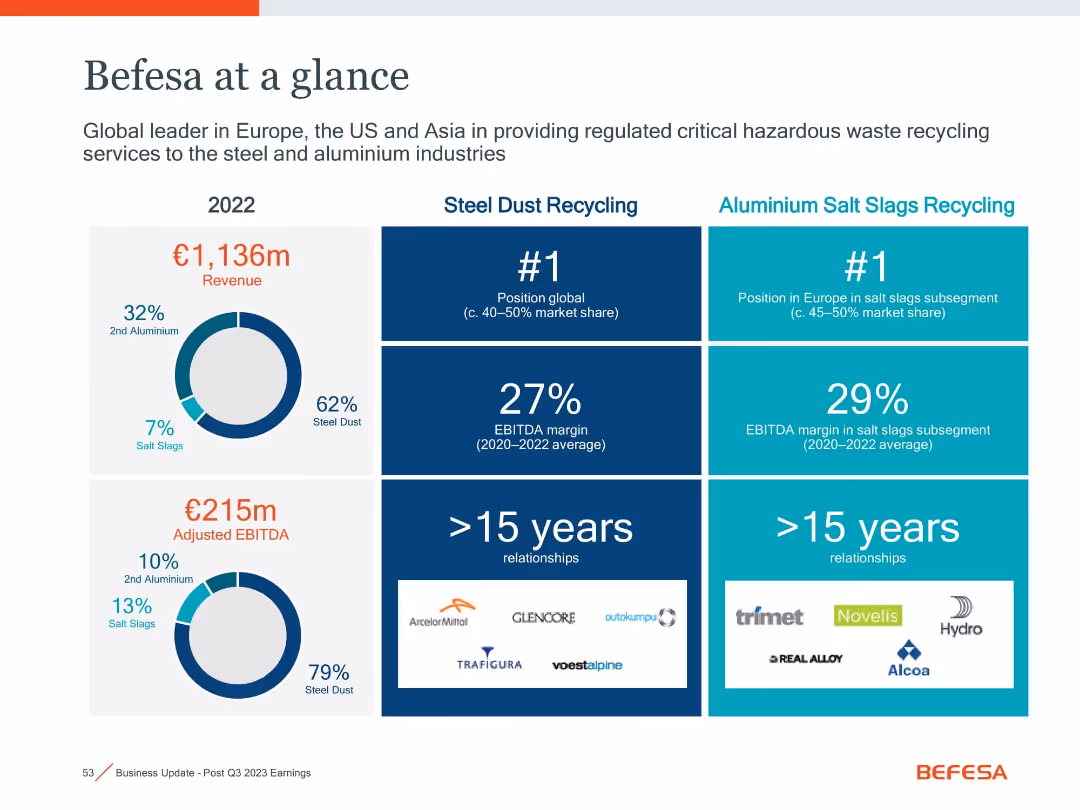
Split layout with pie charts, bar stats, and relationship logos, divided between Steel Dust and Aluminium segments.
Industry Overview
Industrial & Manufacturing
Provides a high-level snapshot of Befesa’s 2022 performance, showing €1.136bn revenue dominated by steel dust recycling, with strong EBITDA margins and longstanding client relationships in both aluminum and steel segments.
steel dust, aluminum, Befesa, revenue mix, market share, client base
false
Industry Overview
Industrial & Manufacturing
Mixed Chart
Goldman Sachs
Add to my slides
Remove from favorites
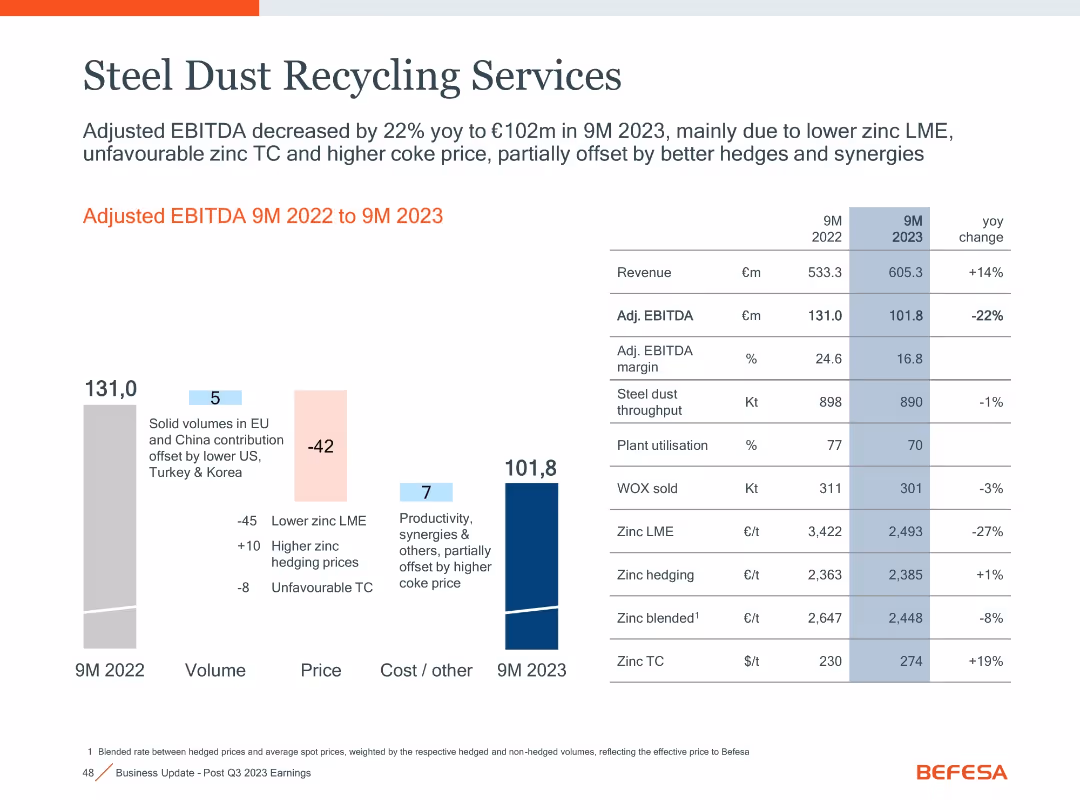
Waterfall chart of EBITDA changes with volume/price/cost blocks, table on right comparing 9M 2022 vs 9M 2023 metrics.
Performance Metrics and KPIs
Industrial & Manufacturing
Details 22% YoY drop in adjusted EBITDA for Steel Dust Recycling to €101.8m, impacted by zinc LME price drop, higher treatment charges, and offsetting synergies. Volume, price, and cost drivers are itemized.
steel dust, EBITDA, zinc LME, throughput, synergies, KPIs
false
Performance Metrics and KPIs
Industrial & Manufacturing
Mixed Chart
Goldman Sachs
Add to my slides
Remove from favorites
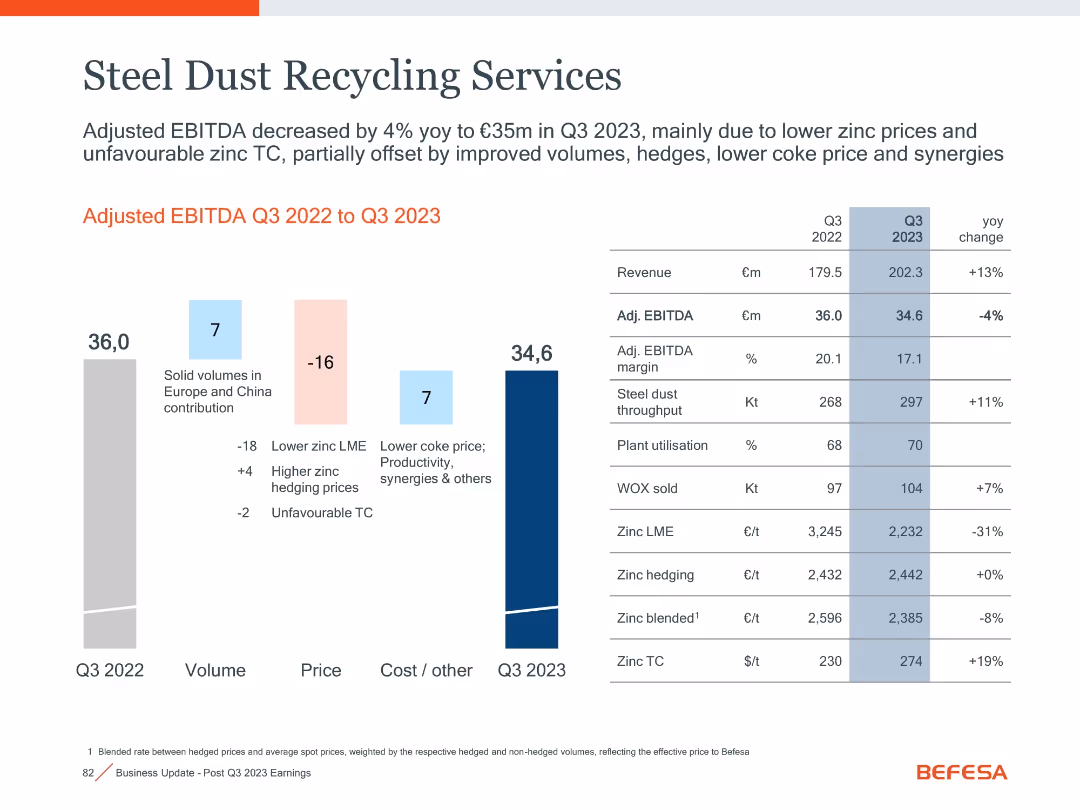
Bar chart with waterfall logic; financial summary table
Operational Efficiency
Industrial & Manufacturing
The slide provides a performance summary of steel dust recycling, with changes in EBITDA attributed to pricing, volume, and cost efficiency for Q3 2023.
Steel Dust, Recycling, EBITDA, Volumes, Zinc Prices, Q3 2023
false
Operational Efficiency
Industrial & Manufacturing
Mixed Chart
Goldman Sachs
Add to my slides
Remove from favorites
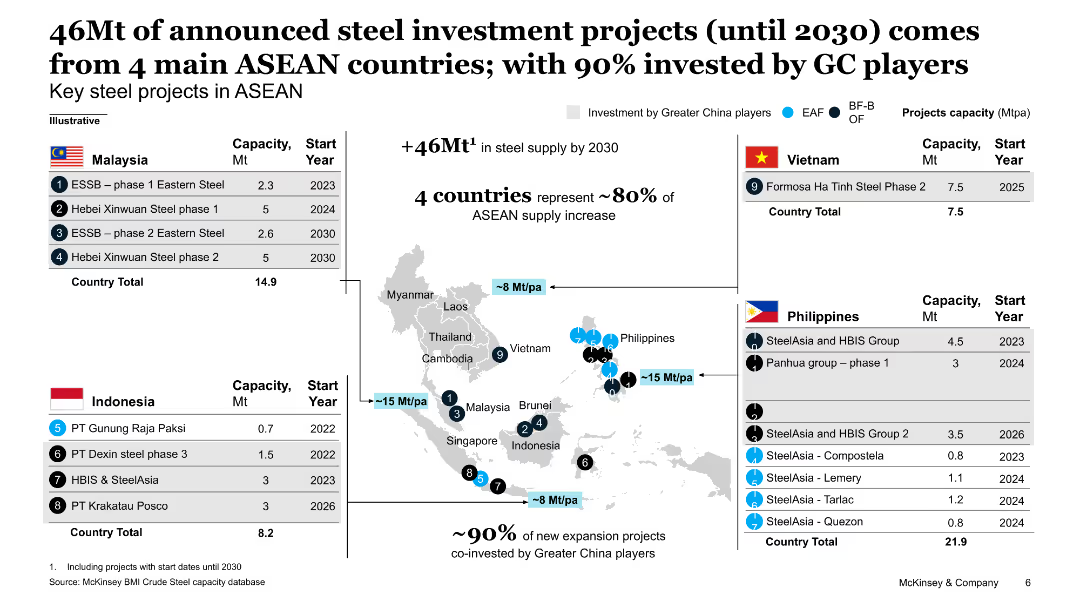
The slide includes a map highlighting key steel investment projects in ASEAN countries, a table of projects with capacities and start years, and regional supply increase data.
Investment Analysis
Industrial & Manufacturing
This slide details steel investment projects in ASEAN countries, indicating major projects, capacities, start years, and the regional contribution to steel supply increase by 2030.
Steel investment, ASEAN, projects, capacities, start years, regional supply, 2030, key projects, map
false
Investment Analysis
Industrial & Manufacturing
Single Chart
BCG
Add to my slides
Remove from favorites
The slide includes a map highlighting key steel projects in ASEAN countries, with accompanying tables listing project capacities and start years.
Investment Analysis
Industrial & Manufacturing
This slide details 46Mt of announced steel investment projects in ASEAN countries, with specific projects listed by country, showing capacities and start years, emphasizing Chinese investment.
steel investment, ASEAN, projects, capacity, Chinese investment
false
Investment Analysis
Industrial & Manufacturing
Graphic
McKinsey
Add to my slides
Remove from favorites
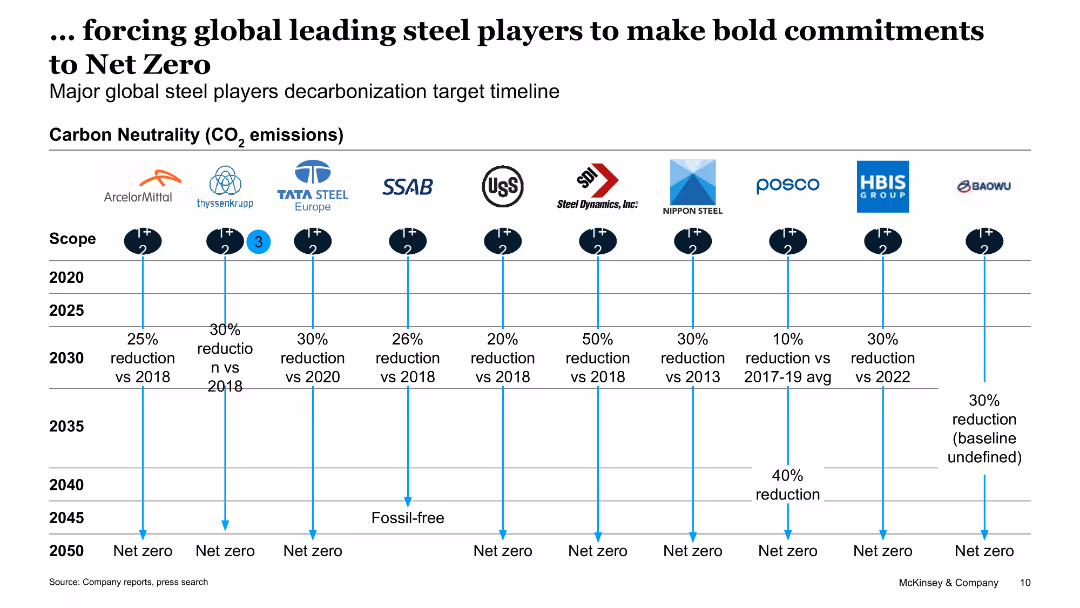
The slide contains a comparative timeline chart showing decarbonization targets for major global steel players, with reduction percentages and years to achieve net-zero emissions.
Strategic Planning
Industrial & Manufacturing
This slide outlines the decarbonization commitments of major global steel players, detailing their reduction targets and timelines towards achieving net-zero emissions by 2050.
steel players, decarbonization, net-zero, reduction targets, global commitments
false
Strategic Planning
Industrial & Manufacturing
Table
McKinsey
Add to my slides
Remove from favorites
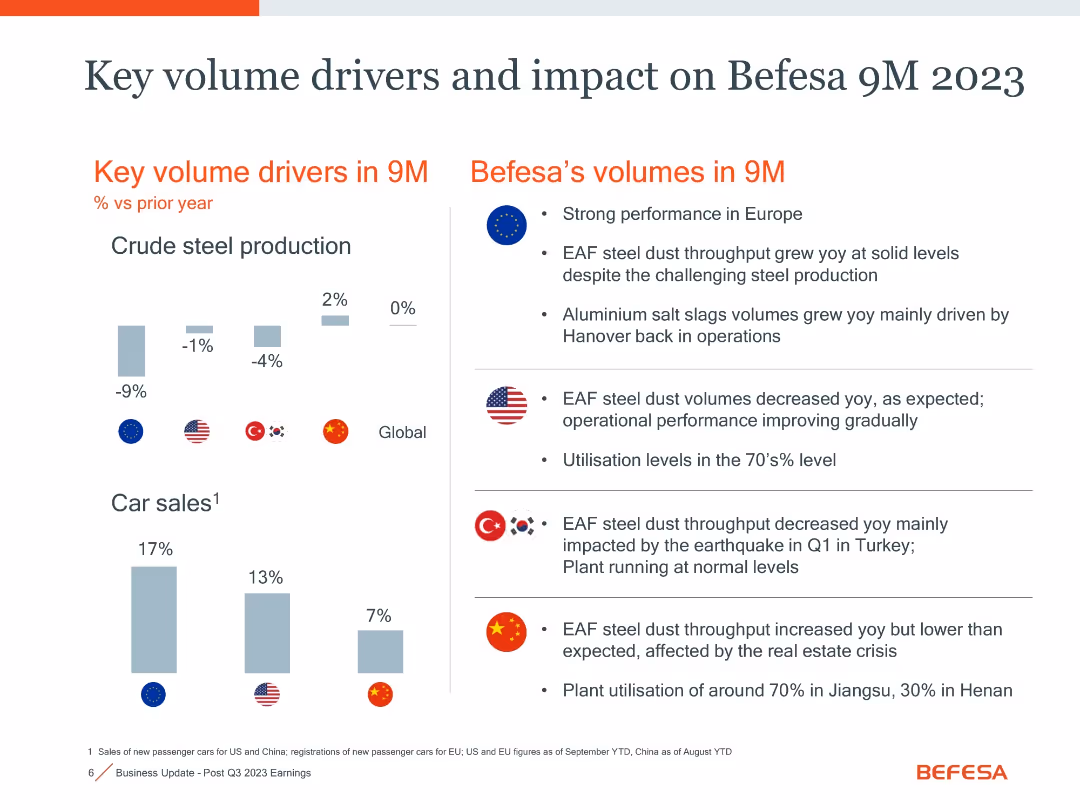
Split-screen layout with bar graphs on the left and bullet-point summaries on the right
Performance Metrics and KPIs
Industrial & Manufacturing
Shows regional trends in steel production and car sales, linking them to Befesa’s volume performance. Highlights Europe’s strength and challenges in US, Turkey, and China due to external disruptions and utilization rates.
steel production, car sales, utilization, regional performance, volumes
false
Performance Metrics and KPIs
Industrial & Manufacturing
Mixed Chart
Goldman Sachs
Add to my slides
Remove from favorites
The slide features multiple line charts displaying price trends of steel HRC, scrap, iron ore, and met coal from Q1 2020 to October 2022, accompanied by key challenge notes on the side.
Risk Assessment and Management
Industrial & Manufacturing
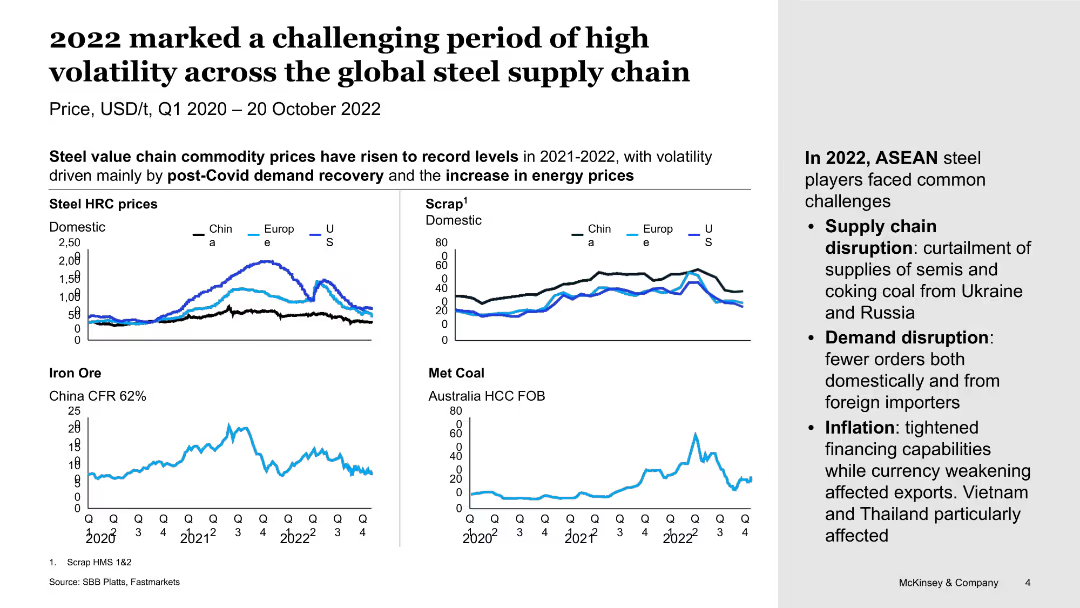
This slide discusses the volatility in the global steel supply chain in 2022, highlighting supply chain disruptions, demand disruptions, and inflation impacts through various price charts.
Steel supply chain, volatility, price trends, disruptions, demand, inflation, global, 2022, charts, risks
false
Risk Assessment and Management
Industrial & Manufacturing
Single Chart
BCG
Add to my slides
Remove from favorites
The slide contains multiple line charts showing price trends for steel HRC, scrap, iron ore, and met coal. It is visually dense with detailed data.
Market Analysis and Trends
Industrial & Manufacturing
This slide discusses the high volatility in the steel supply chain during 2022, driven by post-COVID demand recovery and energy price increases, with specific commodity price trends.
steel supply chain, volatility, price trends, post-COVID recovery, energy prices
false
Market Analysis and Trends
Industrial & Manufacturing
Multiple Chart
McKinsey
Add to my slides
Remove from favorites
The slide features a combination of charts and text, including bar charts of steel product imports from Russia and Ukraine, and a detailed analysis of supply risks for producers in Europe and the US.
Market Analysis and Trends
Industrial & Manufacturing
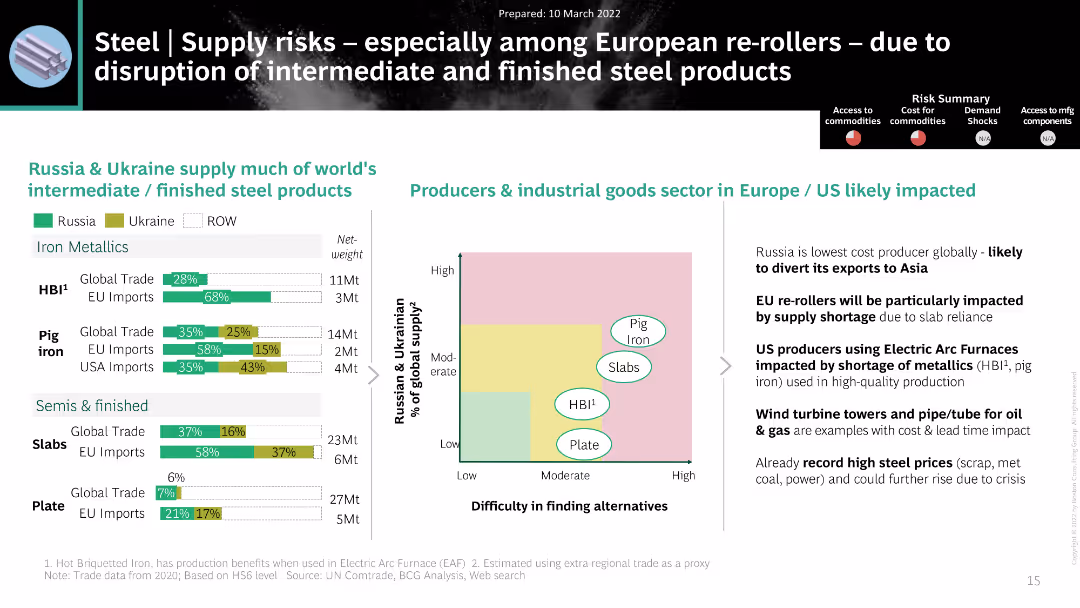
The slide analyzes the supply risks associated with disruptions in intermediate and finished steel products from Russia and Ukraine. It includes data on import percentages and the difficulty in finding alternative suppliers, with a focus on the impact on European and US industries.
steel, supply risks, intermediate products, finished products, import percentages
false
Market Analysis and Trends
Industrial & Manufacturing
Mixed Chart
BCG
Add to my slides
Remove from favorites
This slide illustrates year-over-year quarterly changes in volumes, price-mix, and currency with a trio of column charts. It features colored bars to represent growth or decline over quarters for 2022 and 2023, against a simple blue and white background. The Michelin logo is present at the bottom, and the overall design is clean, utilizing the brand's color palette.
Operational Efficiency
Financial Services
The slide analyzes quarterly performance in terms of volumes, price-mix, and currency impacts. It likely serves as an operational review tool to steer company strategies during periods of weak market demand. It may be used in management meetings or financial briefings to guide decision-making.
steering, volumes, price-mix, currency, performance, Michelin, operational, market, analysis, efficiency
false
Operational Efficiency
Financial Services
Multiple Chart
Morgan Stanley
Add to my slides
Remove from favorites
Simple circular infographic with bubble sizes indicating allocated amounts to different agencies; clean and minimalist visual design.
Strategic Planning
Government & Public Sector
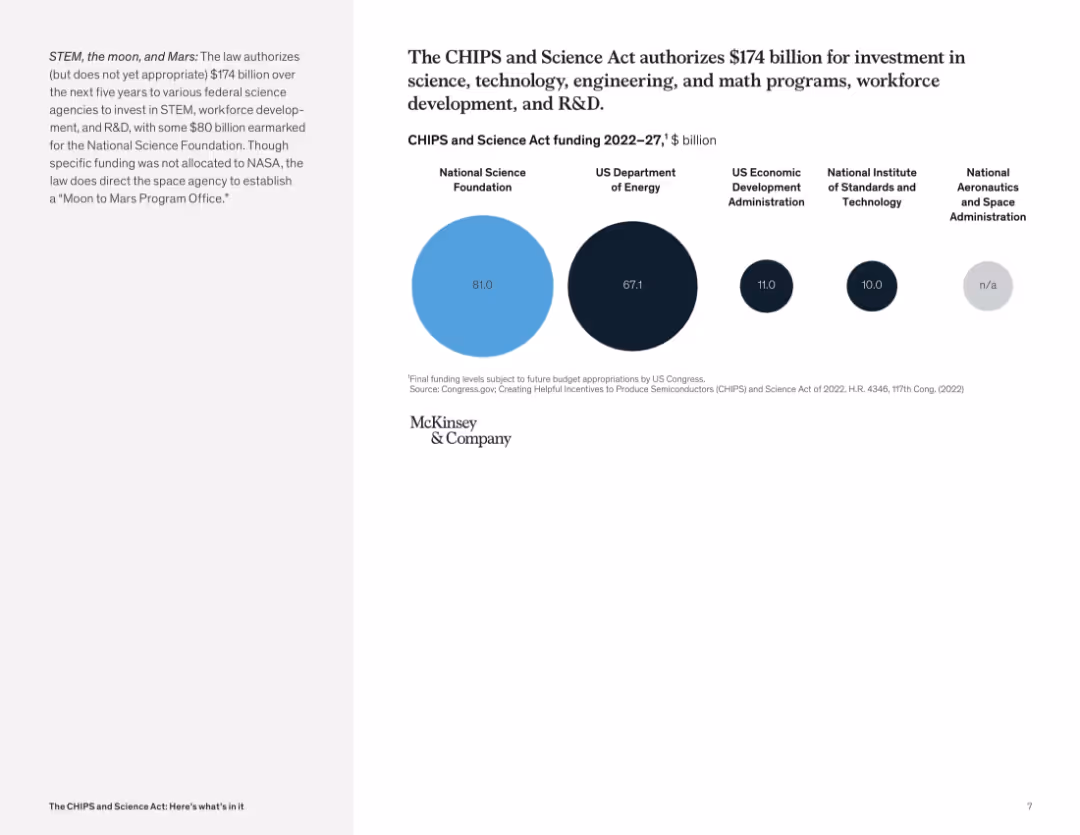
The slide outlines the $174B in authorized but not yet appropriated funds over five years for various federal science agencies. It emphasizes funding for STEM, workforce development, and the NSF, with additional mentions of energy and space initiatives.
STEM, CHIPS Act, science funding, workforce development, NSF, DOE, federal budget, R&D, NASA
false
Strategic Planning
Government & Public Sector
Mixed Chart
McKinsey
Add to my slides
Remove from favorites
Contains a chart titled "Figure 8", headers, and bullet points with descriptions. The chart and text are set against a white background with a purple footer.
Technology and Digital Transformation
Technology & Software
Examines the shift in emphasis from technical skills to complex reasoning and analysis skills across various job sectors.
STEM, Complex Reasoning, Skills Analysis, Job Market, Educational Trends
false
Technology and Digital Transformation
Technology & Software
Table
Accenture
Add to my slides
Remove from favorites
The slide features two text sections on the left, discussing the firm’s work in creating inclusive STEM pathways in DC, and on the right, it presents a photo with a focus on technology and education. The design is professional, with a clear separation between text and imagery, and a teal accent color. A page number '27' is found on the bottom right.
Strategic Planning
Professional Services
It delves into the company’s foundation efforts in supporting underrepresented individuals in STEM fields, in partnership with several nonprofits in Washington, D.C. The slide presents how these partnerships work to break barriers and create educational and professional opportunities, with an emphasis on diversity and inclusion. It serves to illustrate the company’s broader commitment to corporate social responsibility and the impact of its foundation’s work.
STEM, inclusion, nonprofit, education, diversity, partnership
false
Strategic Planning
Professional Services
Text Only
Booz Allen Hamilton
Add to my slides
Remove from favorites
Focuses on the educational aspect with photos and text, presenting moderate visual complexity.
Technology and Digital Transformation
Education & Training
The slide covers the Tempest programme's school outreach efforts to promote STEM careers, featuring specific programmes and their impacts.
STEM, outreach, Tempest, education, UK
false
Technology and Digital Transformation
Education & Training
Boxed
PwC/Strategy&
Add to my slides
Remove from favorites
This slide is primarily textual with bold, red headings to highlight key messages. It includes six text blocks with bullet points, focusing on initiatives for attracting youth to STEM careers. The layout is clean and structured, with a consistent use of fonts and a red and white color theme.
Strategic Planning
Education & Training
It summarizes the strategic efforts of the Tempest program in attracting and developing the next generation of engineers and technologists, with an emphasis on STEM education and youth engagement, suitable for strategic planning presentations.
STEM, Youth Engagement, Workforce Development, Education, Technology
false
Strategic Planning
Education & Training
Text Only
PwC/Strategy&
Add to my slides
Remove from favorites
The slide uses a simple text-based format with green highlights, outlining three steps for strategic planning.
Strategic Planning
Professional Services
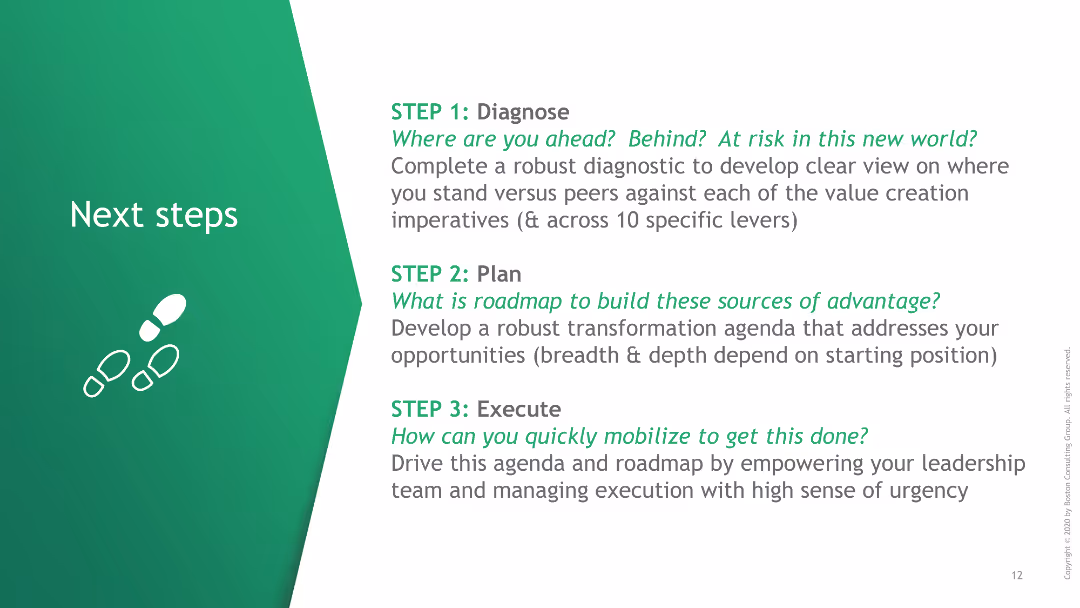
It provides a step-by-step guide for diagnosing, planning, and executing a transformation agenda in response to current challenges.
Steps, Strategy, Planning, Execution, Transformation
false
Strategic Planning
Professional Services
Vertical Flow
BCG
Add to my slides
Remove from favorites
This slide uses vertical bar graphs to compare data from 2022 and 2023 regarding comfort in discussing mental health and support received from employers. The design is straightforward and clean.
Organizational Structure and Change
Professional Services
Focusing on workplace stigma around mental health, the slide reveals statistics on comfort in discussing and disclosing mental health issues, including employer support. It's useful for HR policy planning.
stigma, mental health, workplace, discussion, support, employers, disclosure, comfort, 2022, 2023
false
Organizational Structure and Change
Professional Services
Multiple Chart
Deloitte
Add to my slides
Remove from favorites
Contains a mixed display of bullet points and column chart showing government stimulus efforts globally and industry shifts toward onshoring. The narrative includes both textual analysis and data presentation.
Regulatory and Compliance
Financial Services
Analysis of how governmental economic measures and free-market adaptations during crises influence corporate strategy and operations, focusing on shifting production strategies and onshoring.
stimulus, regulations, onshoring, government, market shifts
false
Regulatory and Compliance
Financial Services
Mixed Chart
McKinsey
Add to my slides
Remove from favorites
The slide features a line chart showing correlations between stocks and sovereign bonds, with the six-month correlation in gray and the one-year correlation in purple, covering the period from 1998 to 2023.
Market Analysis and Trends
Financial Services
This slide analyzes the correlations between stocks and sovereign bonds, providing insights into market trends and investment strategies.
Stock-bond correlation, market analysis, investment strategy, financial analysis, six-month correlation, one-year correlation
false
Market Analysis and Trends
Financial Services
Multiple Chart
JP Morgan
Add to my slides
Remove from favorites
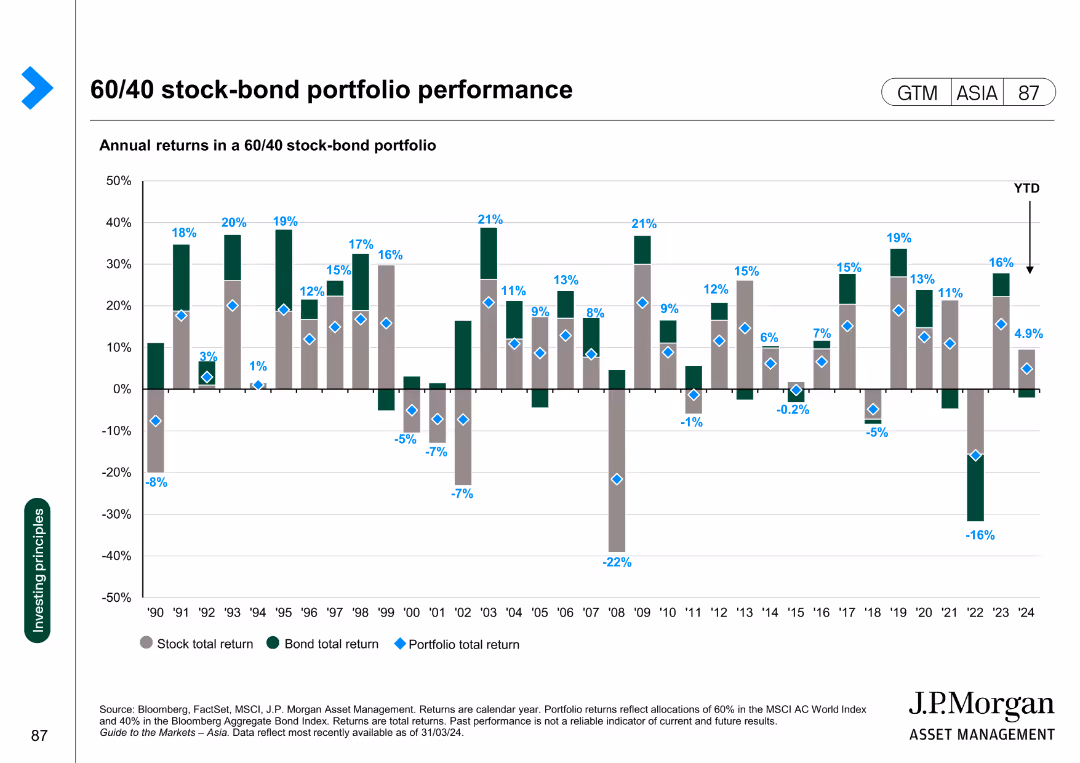
Column chart showing annual returns of a 60/40 stock-bond portfolio from 1990 to 2024, with stock, bond, and total portfolio returns highlighted.
Investment Analysis
Financial Services
This slide analyzes the performance of a 60/40 stock-bond portfolio over the years, illustrating the annual returns for stocks, bonds, and the overall portfolio from 1990 to 2024.
stock-bond, portfolio, returns, performance, analysis
false
Investment Analysis
Financial Services
Single Chart
JP Morgan
Add to my slides
Remove from favorites
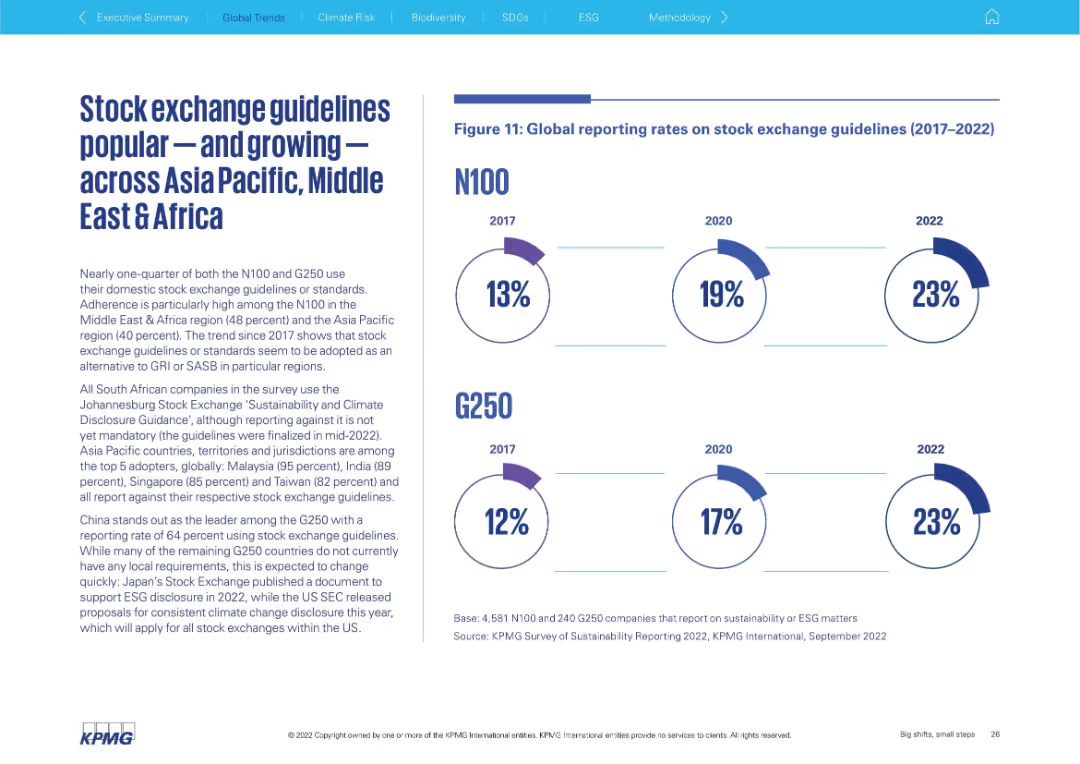
Left-aligned detailed text; right side has circular charts for N100 and G250 showing growth (2017–2022)
Regulatory and Compliance
Professional Services
This slide highlights growing adherence to domestic stock exchange sustainability guidelines, especially in the Middle East & Africa (48%) and Asia Pacific (40%). Charts show increases in adoption rates for both N100 and G250 groups.
stock exchange, ESG guidelines, N100, G250, Middle East, Asia Pacific, sustainability reporting
false
Regulatory and Compliance
Professional Services
Mixed Chart
KPMG
Add to my slides
Remove from favorites
Contains column charts comparing trading volumes and costs across different stock exchanges, highlighting advantages for Brazilian companies
Strategic Planning
Financial Services
Discusses why Brazilian companies prefer US stock exchanges, focusing on trading volume, investor profiles, and cost advantages
stock exchanges, Brazil, US, trading, costs
false
Strategic Planning
Financial Services
Mixed Chart
McKinsey
Add to my slides
Remove from favorites
Contains two column charts ranking stock exchanges by the number of IPOs and proceeds in Q1 2023, highlighting emerging markets and major exchanges.
Market Analysis and Trends
Financial Services
The slide analyzes stock exchanges from emerging markets benefitting from smaller IPO deals, while China and US remain key for larger transactions.
stock exchanges, emerging markets, IPOs, proceeds, Q1 2023, financial services, market trends, column charts
false
Market Analysis and Trends
Financial Services
Multiple Chart
EY
Add to my slides
Remove from favorites
The slide features a detailed table listing the most active stock exchanges by number of IPOs and proceeds for 2021 and 2022 YTD.
Financial Performance
Financial Services
The slide shows the rankings of stock exchanges globally by number of IPOs and proceeds, illustrating the market activity across different exchanges.
stock exchanges, IPOs, market activity, rankings, global
false
Financial Performance
Financial Services
Table
EY
Add to my slides
Remove from favorites
Graphs tracking major stock indices' performance over time against economic indicators like CPI, inflation, and unemployment. Extensive textual explanations on side.
Market Analysis and Trends
Financial Services
Analyzes stock market trends during the pandemic, noting significant recoveries and the challenges posed by economic factors. Provides a detailed view of market resilience.
stock market, pandemic, economic indicators, resilience, performance
false
Market Analysis and Trends
Financial Services
Mixed Chart
PwC/Strategy&
Add to my slides
Remove from favorites
The slide features two column charts: one showing annual stock market returns by political party control and another showing stock market returns by year in the presidential cycle.
Market Analysis and Trends
Financial Services
This slide presents data indicating that past stock market performance, segmented by political control and presidential cycles, does not predict future results. It underscores the unpredictability of market performance.
Stock Market, Political Control, Presidential Cycle, Performance, Analysis
false
Market Analysis and Trends
Financial Services
Multiple Chart
JP Morgan
Add to my slides
Remove from favorites
A table heatmap comparing the stock market performance across various sectors before and after COVID-19.
Strategic Planning
Financial Services
Evaluates the stock market's resilience and recovery, with sector-specific data highlighting areas above or below pre-crisis levels.
stock market, sectors, performance, data
false
Strategic Planning
Financial Services
Table
BCG
Add to my slides
Remove from favorites
Features a bar chart comparing sector-wise total shareholder return and a heatmap of default probabilities.
Investment Analysis
Financial Services
Provides an outlook on stock market performance and risk across sectors, useful for investors and financial analysts.
stock market, shareholder return, investment risk, sector analysis, financial outlook
false
Investment Analysis
Financial Services
Table
BCG
Add to my slides
Remove from favorites
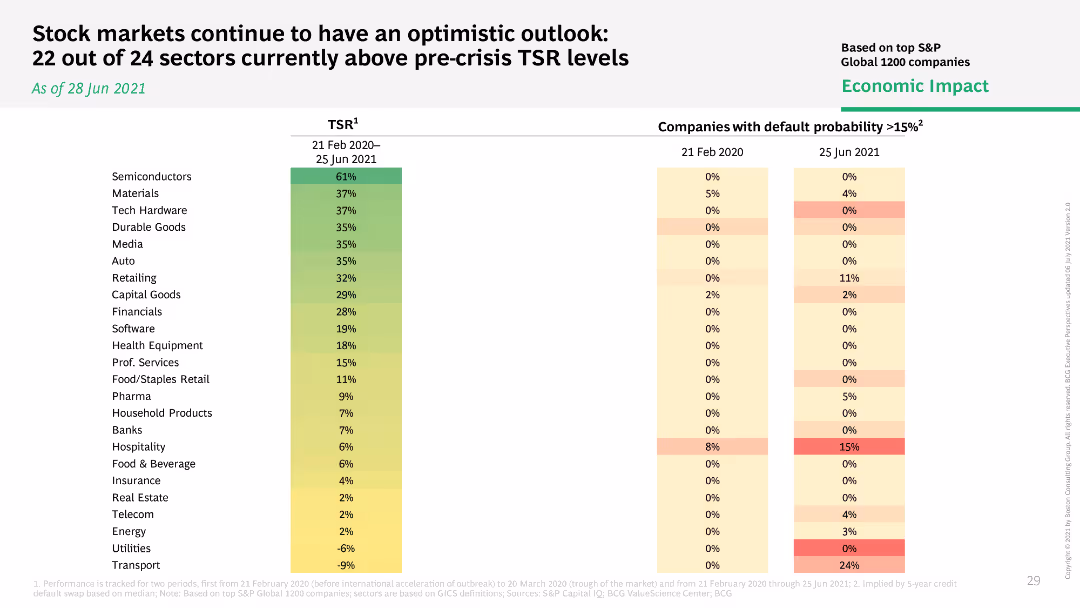
Heatmap showing TSR levels of different sectors pre-crisis and currently, with a column chart comparing companies' default probability over time.
Market Analysis and Trends
Financial Services
Assesses the optimistic outlook of stock markets, showing TSR levels of various sectors above pre-crisis levels, with default probability comparisons.
stock markets, TSR levels, sectors, outlook
false
Market Analysis and Trends
Financial Services
Table
BCG
Add to my slides
Remove from favorites
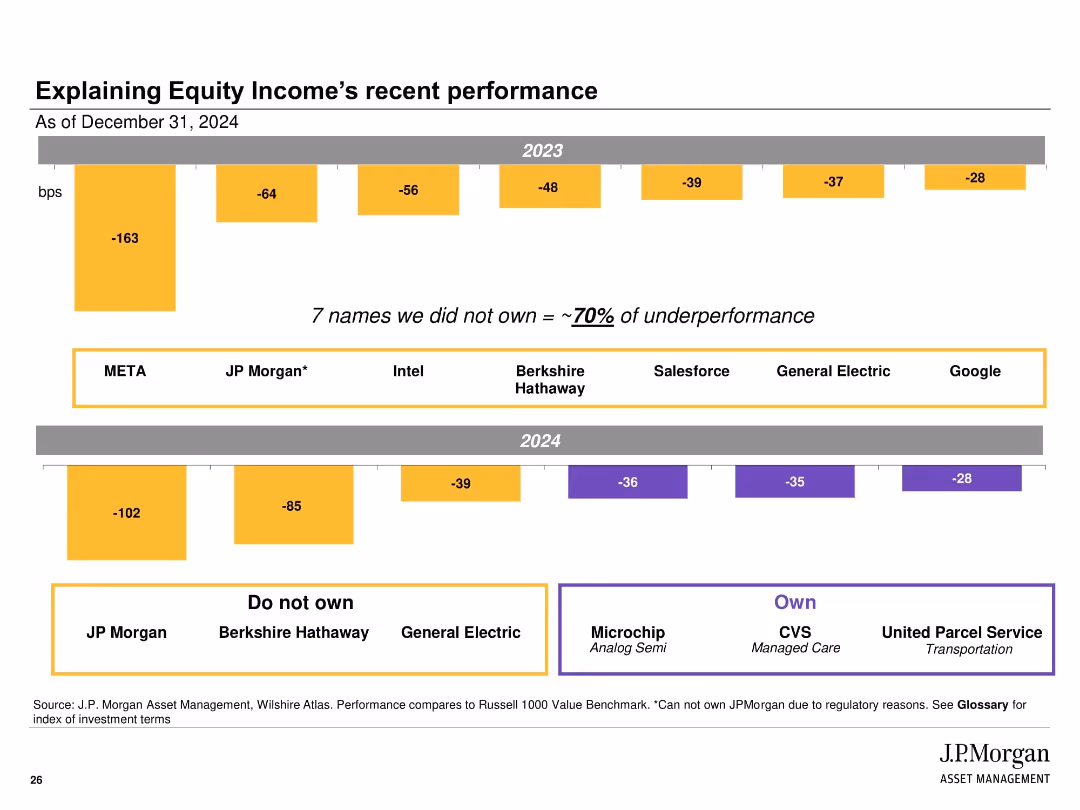
Bar charts for years 2023 and 2024 showing negative basis points contributions; annotations highlight specific stocks not held that explain underperformance.
Performance Metrics and KPIs
Financial Services
The slide attributes ~70% of recent underperformance to the absence of seven specific stocks in the portfolio. It compares contributions in 2023 and 2024 and categorizes stocks by ownership status to explain relative results.
stock ownership, basis points, performance attribution, 2023, 2024, equity income, JPMorgan, portfolio composition, missing names
false
Performance Metrics and KPIs
Financial Services
Multiple Chart
JP Morgan
Add to my slides
Remove from favorites
Line graph and table detailing distributor stock performance and M&A activity, color-coded by industry segment.
Investment Analysis
Financial Services
Shows distributor stock performance against the S&P 500 and the number of acquisitions by segment since 2000.
Stock Performance, M&A, Distribution, Acquisition, Benchmark, Industry
false
Investment Analysis
Financial Services
Single Chart
EY
Add to my slides
Remove from favorites
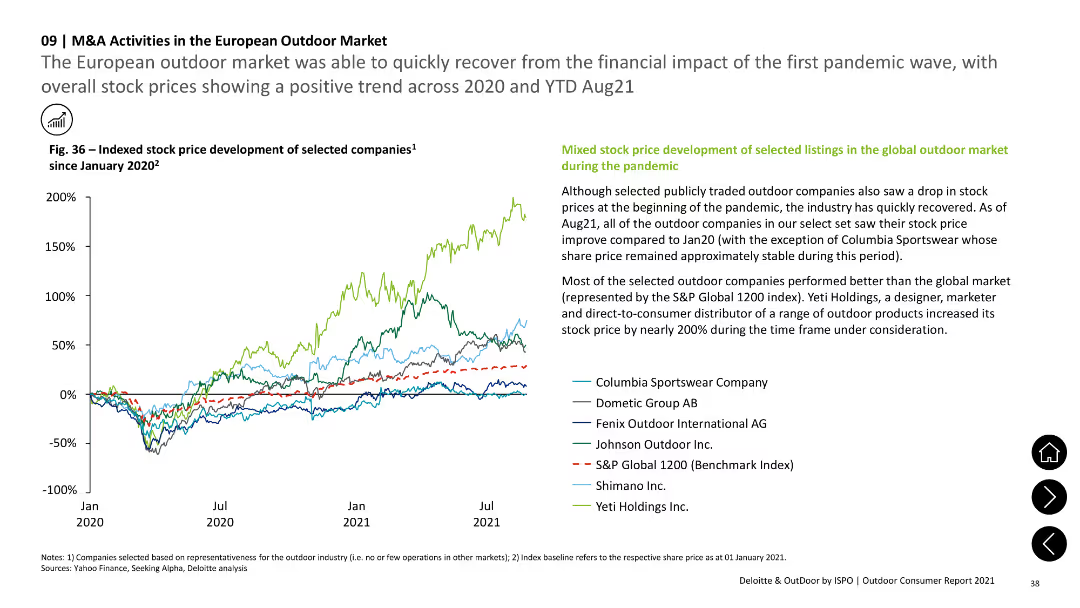
The slide includes a line chart showing indexed stock price development of selected companies from January 2020 to August 2021. Text sections provide explanations and context.
Market Analysis and Trends
Financial Services
The slide highlights the recovery of the European outdoor market from the pandemic, with a line chart showing positive trends in stock prices for selected companies, reflecting investor confidence and market recovery.
stock price, financial trends, market recovery, European market, pandemic impact
false
Market Analysis and Trends
Financial Services
Mixed Chart
Deloitte
Add to my slides
Remove from favorites
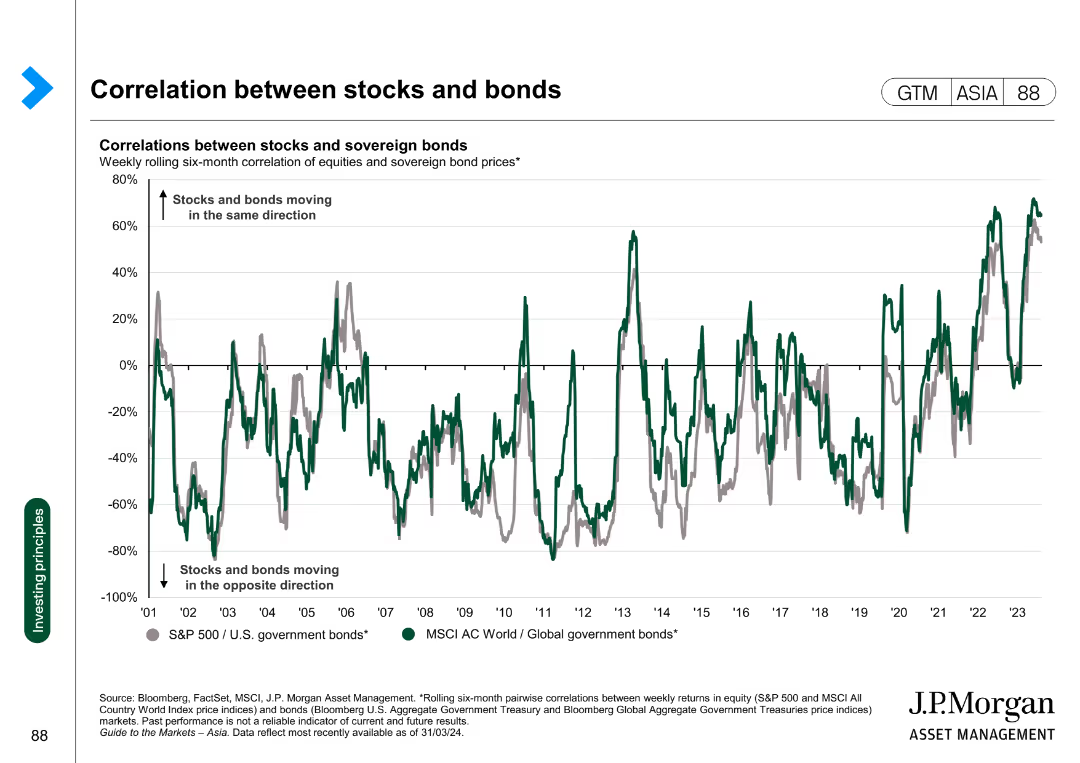
The slide features a line chart showing weekly rolling six-month correlations between equities and sovereign bond prices from 2001-2023.
Risk Assessment and Management
Financial Services
This slide explores the correlation trends between stocks and bonds, providing insights into diversification and risk management strategies.
stocks, bonds, correlation, risk management, diversification
false
Risk Assessment and Management
Financial Services
Single Chart
JP Morgan
Add to my slides
Remove from favorites
The slide includes two donut charts comparing 2023 and 2022 responses on investment knowledge, with key percentages highlighted.
Market Analysis and Trends
Financial Services
It displays the percentage of Canadians who correctly answered a question about stocks vs. mutual funds, comparing 2022 to 2023.
Stocks, Mutual Funds, Knowledge, Canadians, Percentage, 2023, 2022, Chart, Financial, Trends
false
Market Analysis and Trends
Financial Services
Multiple Chart
IPSOS
Add to my slides
Remove from favorites
The slide includes a donut chart displaying responses to a true/false question about the safety of company stocks versus mutual funds. The layout is moderately complex.
Market Analysis and Trends
Financial Services
This slide evaluates the perception of the safety of investing in company stocks versus mutual funds, showing that 51% correctly identified mutual funds as generally safer. It aims to assess investment knowledge.
stocks, mutual funds, safety, perception, investment
false
Market Analysis and Trends
Financial Services
Single Chart
IPSOS
Add to my slides
Remove from favorites
The slide shows icons with percentages representing different methods of storing crypto assets, such as exchanges, online wallets, and hardware wallets.
Technology and Digital Transformation
Financial Services
This slide details how participants store their crypto assets, including exchange platforms, online wallets, and offline methods.
Storage methods, crypto, assets, security, digital wallets
false
Technology and Digital Transformation
Financial Services
Pillar
IPSOS
Add to my slides
Remove from favorites
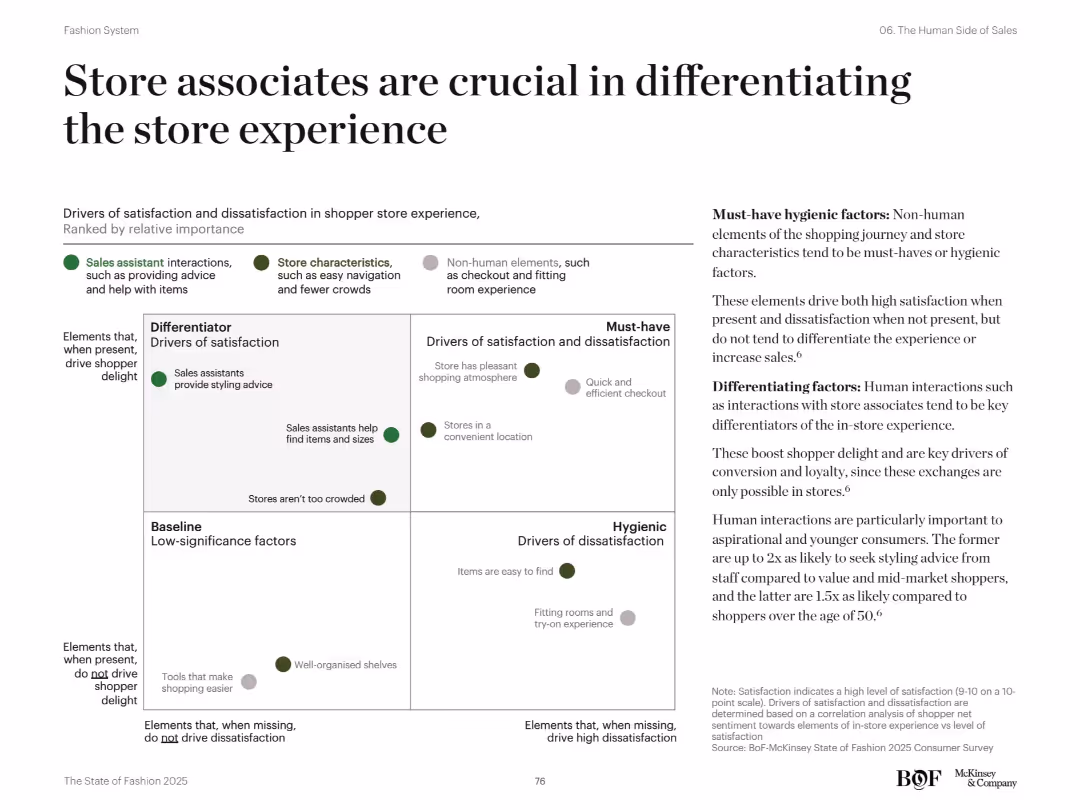
2x2 quadrant chart categorizing satisfaction/dissatisfaction drivers in store experience. Green and gray dots represent factors like store characteristics and human interactions. Explanatory text on right.
Human Resources and Talent Management
Retail & E-commerce
Outlines importance of human interaction in physical stores. Sales associates providing help and advice are key differentiators of satisfaction. Store features like pleasant atmosphere are must-haves, but only staff interactions boost customer delight and loyalty significantly.
store associates, customer experience, in-store drivers, satisfaction, human interaction
false
Human Resources and Talent Management
Retail & E-commerce
Mixed Chart
McKinsey
Add to my slides
Remove from favorites
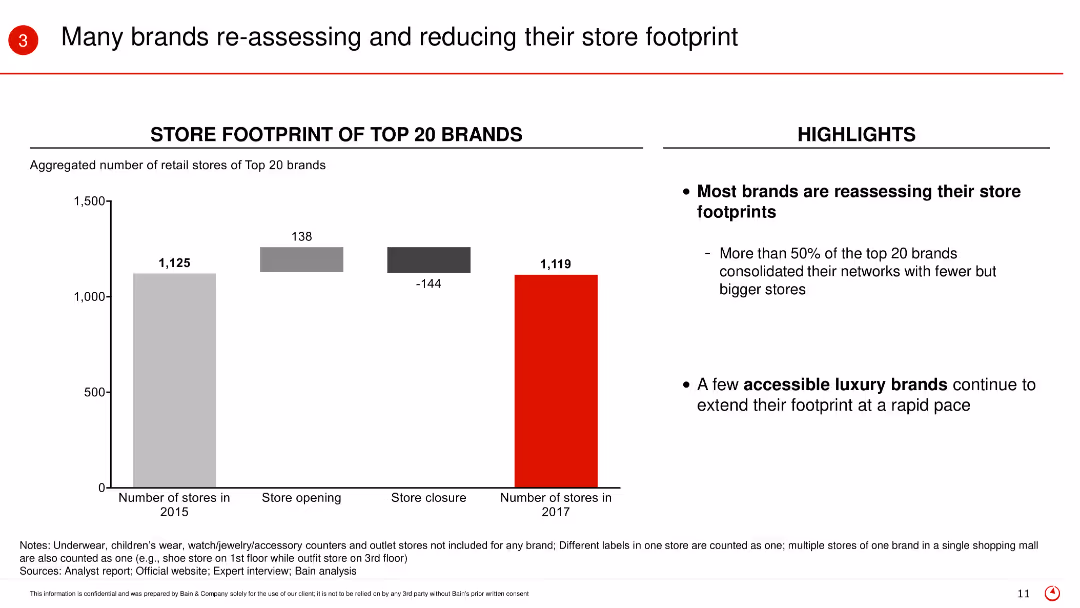
The slide includes a column chart showing the aggregated number of retail stores of top 20 brands from 2015 to 2017, with categories for store openings and closures. Highlights on the right side emphasize key points about brands reassessing their store footprints.
Operational Efficiency
Retail & E-commerce
This slide highlights the trend of brands reducing their store footprint by consolidating their networks, with a focus on efficiency and bigger stores.
Store footprint, retail brands, consolidation, operational efficiency, store closures
false
Operational Efficiency
Retail & E-commerce
Mixed Chart
Bain
Add to my slides
Remove from favorites
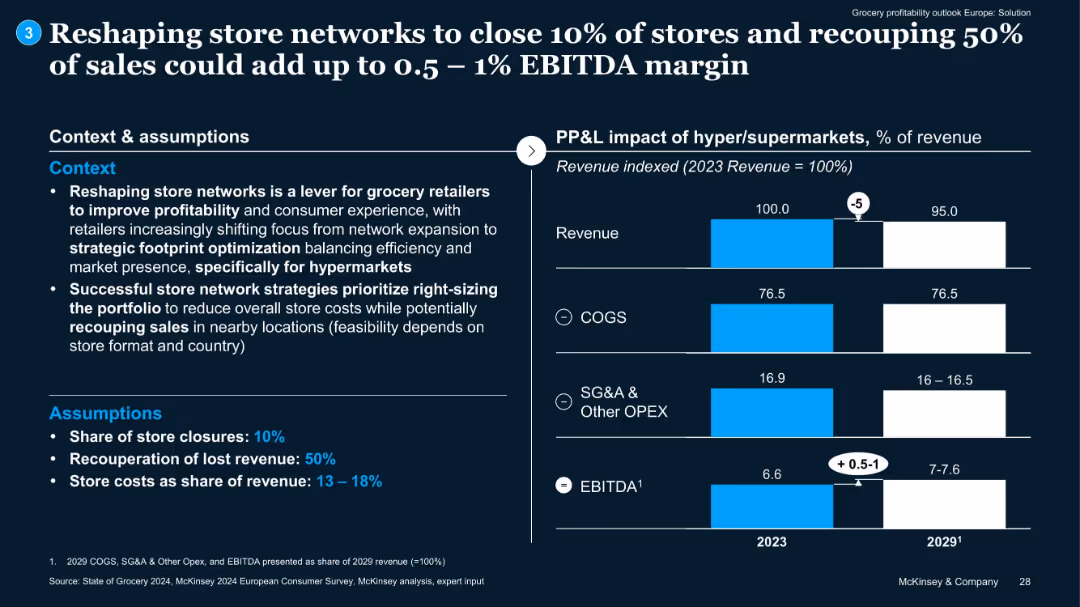
Context and assumptions on left; bar chart on right comparing 2023 and 2029 cost components. EBITDA uplift is marked with arrows.
Operational Efficiency
Retail & E-commerce
Proposes store network reshaping (10% closure) with 50% sales recouped to drive 0.5–1% EBITDA uplift. Assumptions on cost reduction and efficiency gains included.
store optimization, EBITDA, cost reduction, footprint, hypermarkets
false
Operational Efficiency
Retail & E-commerce
Mixed Chart
McKinsey
Add to my slides
Remove from favorites
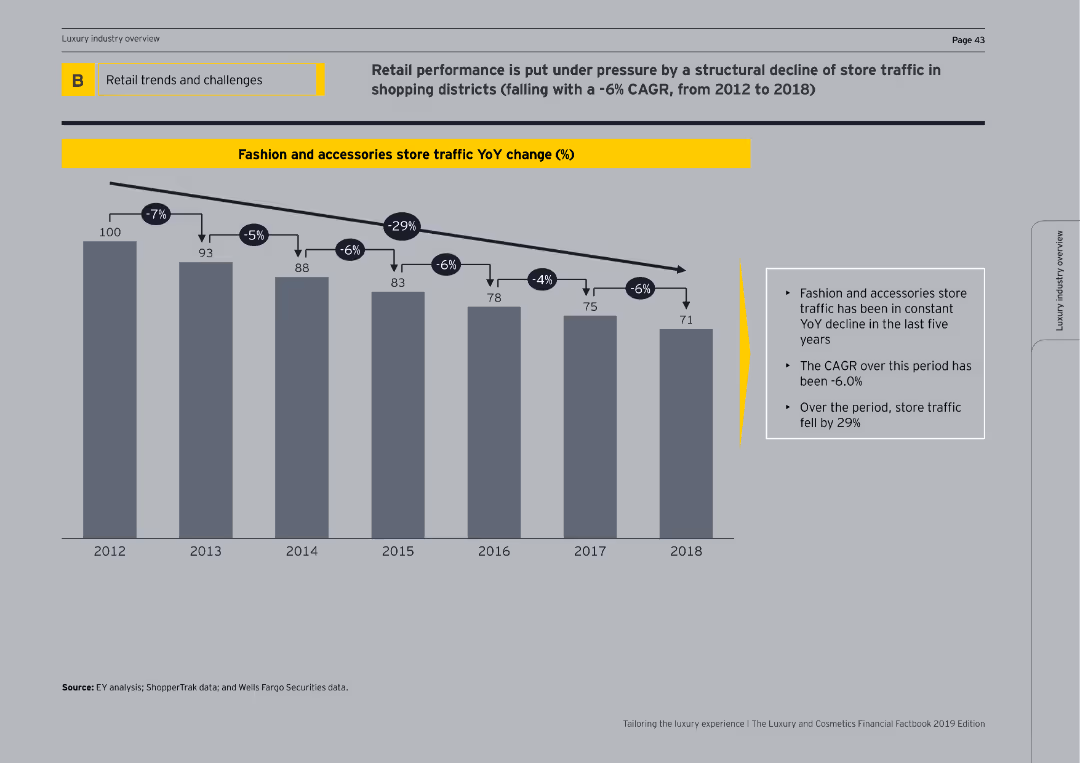
Features a column chart illustrating the year-over-year percentage change in store traffic for fashion and accessories from 2012 to 2018.
Market Analysis and Trends
Retail & E-commerce
Reviews the decline in store traffic for fashion and accessories, showing a -6% CAGR and discussing potential impacts on retail performance.
store traffic, fashion, accessories, YoY change, CAGR, decline, retail performance, column chart, market analysis
false
Market Analysis and Trends
Retail & E-commerce
Mixed Chart
EY
Add to my slides
Remove from favorites
Features a large column chart depicting the monthly development of STO funding volume across two years. Uses a red color palette for bars, with annotations for notable peaks and descriptions of specific STO events.
Regulatory and Compliance
Financial Services
Discusses the trends in STO funding over time, emphasizing key periods of growth and decline. It offers insights into the regulatory developments affecting the market and predicts the future relevance of STOs in the investment landscape, noting the importance of a stable regulatory infrastructure.
STOs, blockchain, funding trends, regulatory, 2018, 2019, growth, investment
false
Regulatory and Compliance
Financial Services
Single Chart
PwC/Strategy&
Add to my slides
Remove from favorites
This slide is a detailed table listing several major institutions and their respective security token offerings. It includes columns for institution name, tokenization specifics, date, and amount raised, presented with a clear, tabular layout.
Investment Analysis
Financial Services
Focuses on major corporate security token offerings by institutions like the Austrian Government and Banco Santander. Details include types of securities tokenized and the financial scope of these offerings, reflecting on the growing adoption of blockchain technology in traditional financial sectors.
STOs, corporate, blockchain, tokenization, securities, financial institutions
false
Investment Analysis
Financial Services
Table
PwC/Strategy&
Add to my slides
Remove from favorites
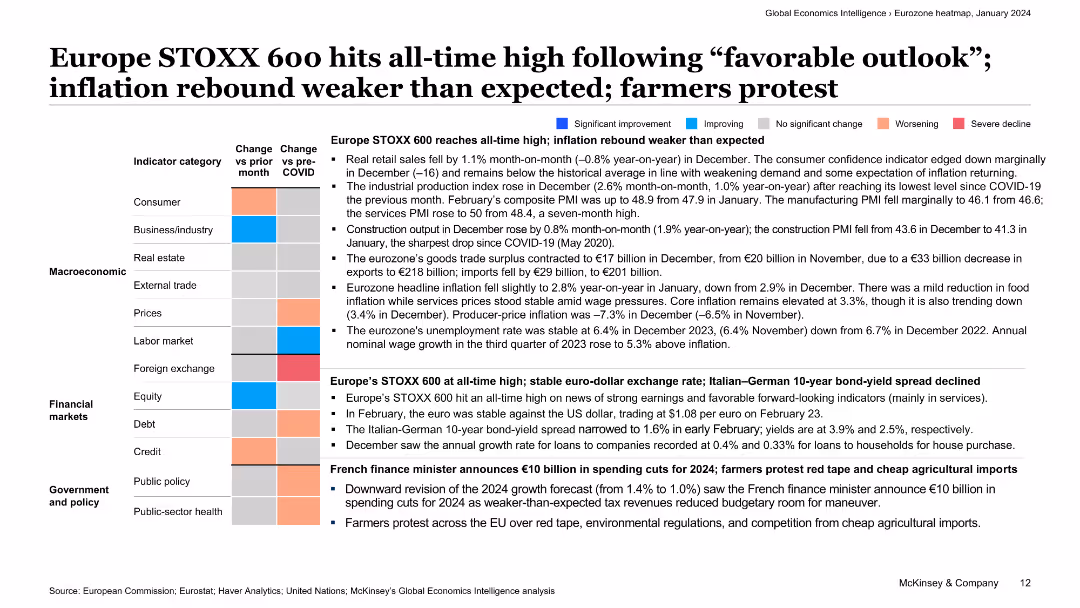
The slide includes a colorful table showing changes in economic indicators and a text summary of factors driving the STOXX 600 to an all-time high.
Market Analysis and Trends
Financial Services
This slide discusses the factors behind the STOXX 600 reaching an all-time high, supported by a detailed table of economic indicators and analysis of the European market outlook.
STOXX 600, economic indicators, market analysis, trends, Europe, financial services, stock market, overview, economic conditions, analysis
false
Market Analysis and Trends
Financial Services
Table
McKinsey
Add to my slides
Remove from favorites
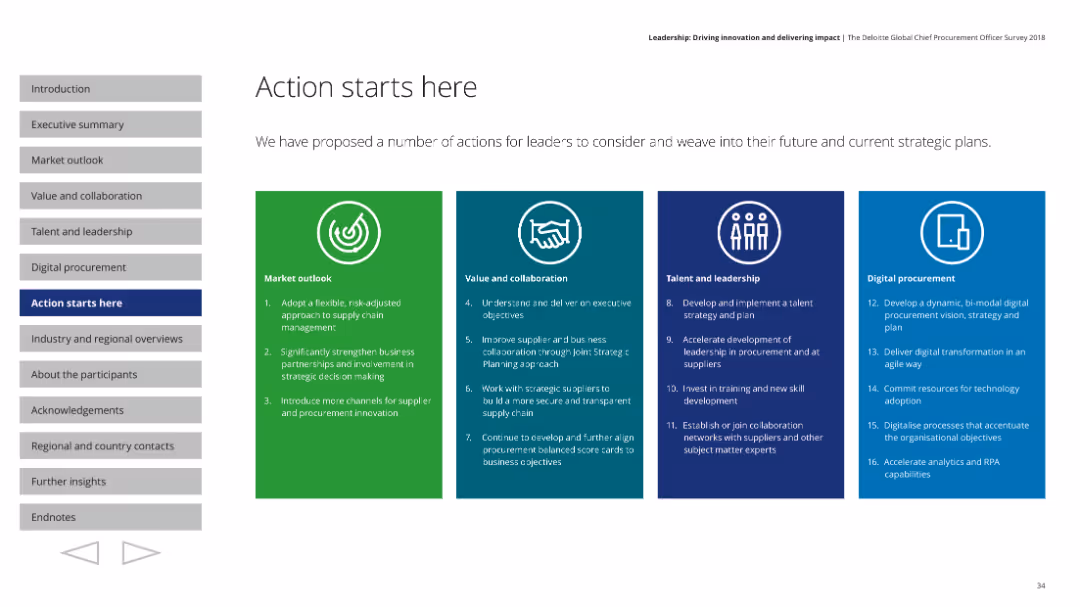
Features a structured layout with four distinct colored sections, each outlining strategic actions across different focus areas like market outlook and leadership.
Strategic Planning
Professional Services
Proposes strategic actions for leaders to integrate into their plans, covering market outlook, collaboration, leadership, and digital procurement.
Strategic actions, market outlook, collaboration, leadership
false
Strategic Planning
Professional Services
Pillar
Deloitte
Add to my slides
Remove from favorites
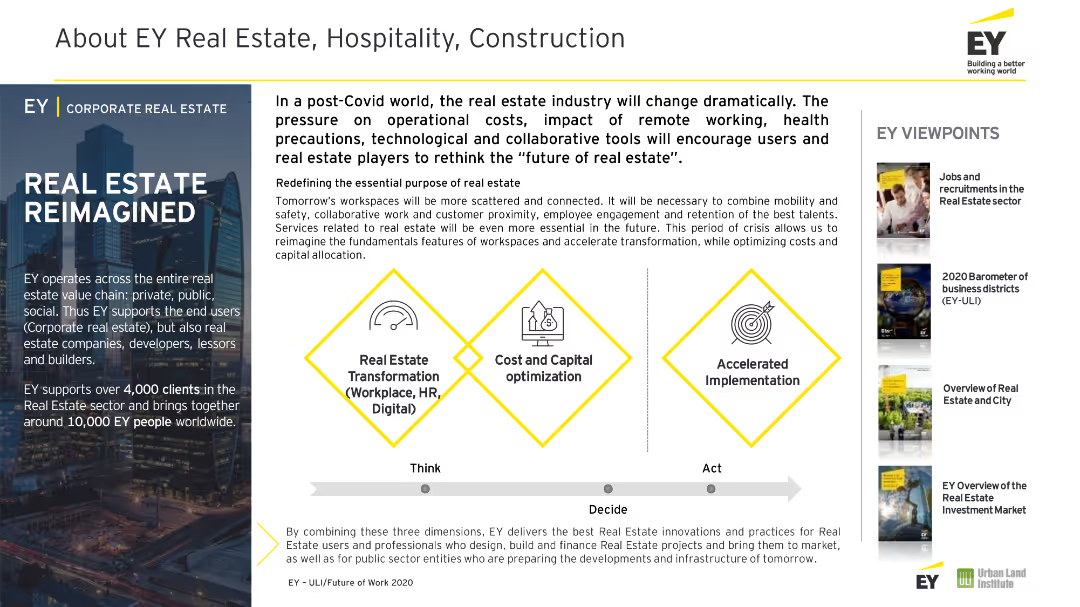
Bar chart showing division of tasks likely to be carried out remotely versus onsite. Colors used are yellow and gray, with a clear division between remote and onsite activities.
Strategic Planning
Real Estate & Construction
Analyzes which business tasks will remain onsite versus becoming remote, highlighting strategic and creative tasks staying onsite while routine tasks move remote.
Strategic Activities, Teamwork, Creative Tasks, Onsite, Remote, Business, Management, Delivery, Division
false
Strategic Planning
Real Estate & Construction
Linear Flow
EY
Add to my slides
Remove from favorites
This slide features a combination of text and illustrative icons outlining adaptive strategies for reimagining business in the insurance industry. The design is clean with a focus on key strategic imperatives.
Strategic Planning
Financial Services
The slide provides a framework for insurance companies to adapt and innovate by engaging in digital ecosystems, enhancing customer value, focusing on execution, embedding ESG principles, and upskilling talent. It emphasizes strategic adaptability.
Strategic Adaptation, Insurance, Digital Ecosystems, Customer Value, Execution, ESG, Talent Management, Strategic Imperatives, Innovation, Business Reimagination
false
Strategic Planning
Financial Services
Framework
PwC/Strategy&
Add to my slides
Remove from favorites
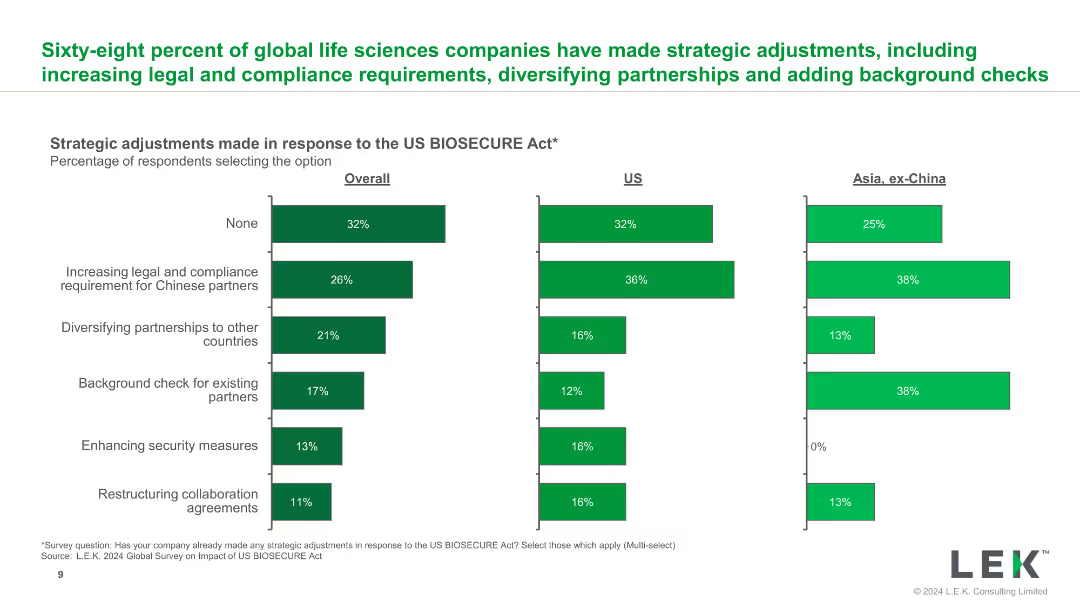
The slide has a bar chart representing strategic adjustments made by companies in response to the BIOSECURE Act, with categories such as legal compliance, partnerships, and security measures.
Strategic Planning
Healthcare & Pharmaceuticals
It outlines the various strategic adjustments that companies have implemented in response to the BIOSECURE Act, highlighting key areas of change.
strategic adjustments, BIOSECURE Act, compliance, partnerships, security
false
Strategic Planning
Healthcare & Pharmaceuticals
Multiple Chart
LEK
Add to my slides
Remove from favorites
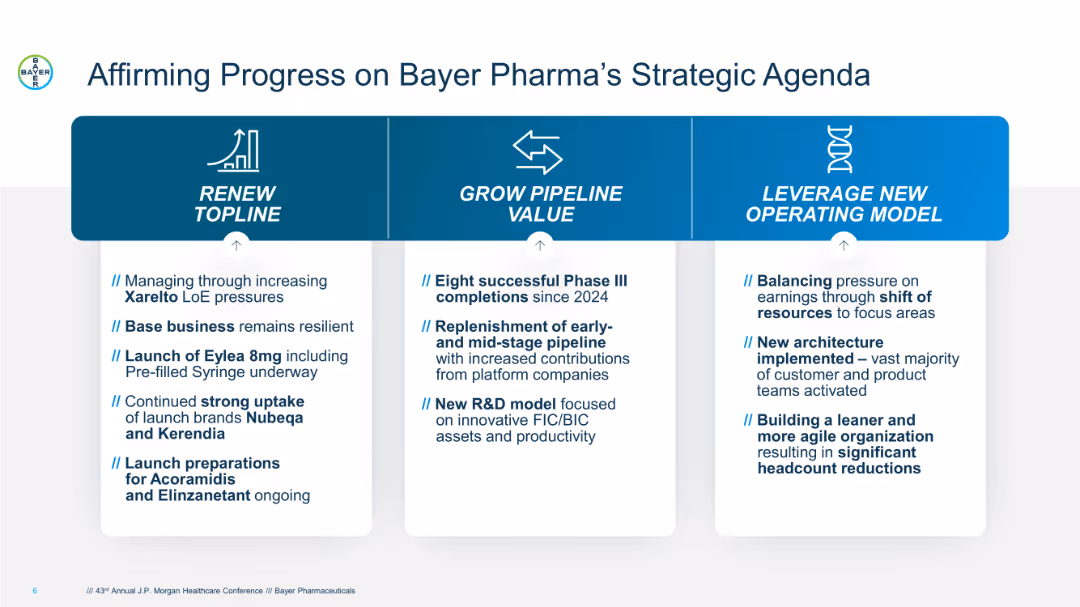
Three-column layout with icons and bold headings, each highlighting a key strategic pillar: Renew Topline, Grow Pipeline Value, and Leverage New Operating Model. Light background with blue gradients and bullet-point text in each column.
Strategic Planning
Healthcare & Pharmaceuticals
The slide outlines Bayer Pharma's strategic focus areas: sustaining revenue through product launches and resilience, enhancing pipeline value via R&D and Phase III successes, and optimizing operations through organizational changes and resource reallocation.
strategic agenda, R&D, topline growth, operating model, Bayer Pharma, pipeline, innovation
false
Strategic Planning
Healthcare & Pharmaceuticals
Agenda
JP Morgan
Add to my slides
Remove from favorites
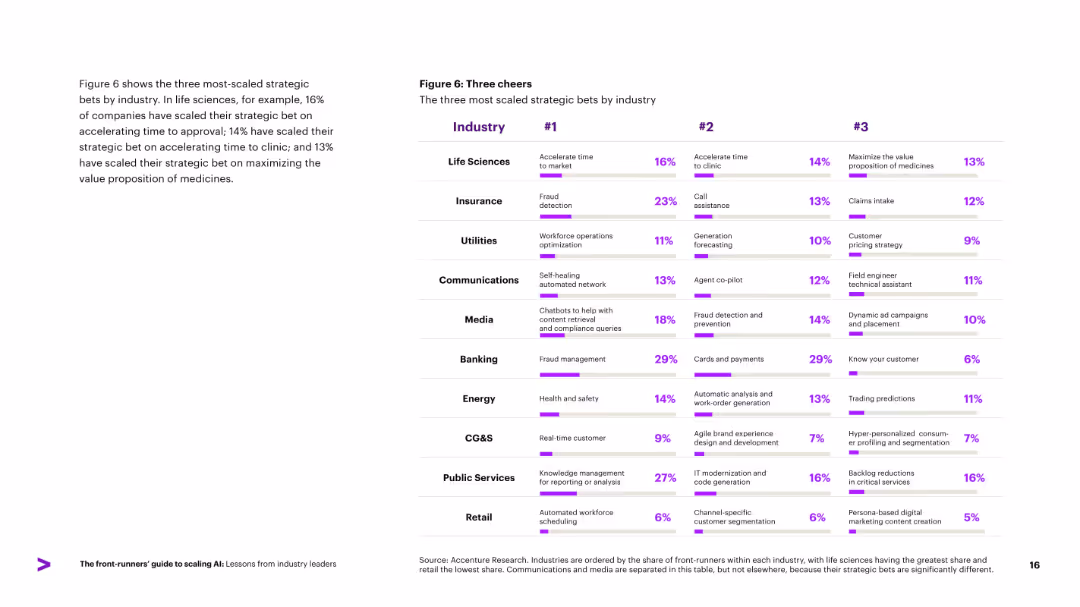
Table listing the top three most-scaled strategic bets by industry. Percentages shown next to each bet. Left column includes explanatory text.
Strategic Planning
Artificial Intelligence
Outlines the top strategic bets being scaled in different industries, such as fraud detection in insurance and accelerating drug approval in life sciences. Percentages reveal where companies are focusing AI investments to achieve competitive advantage and industry-specific innovation.
strategic bets, scaling, industry focus, fraud detection, AI investment
false
Strategic Planning
Artificial Intelligence
Mixed Chart
Accenture
Add to my slides
Remove from favorites
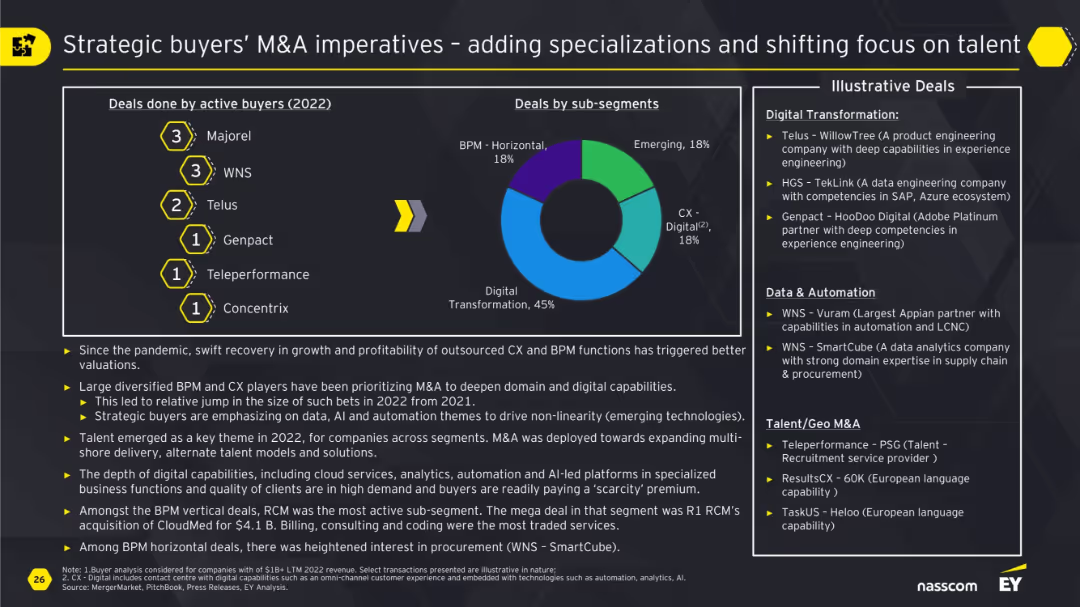
Left section lists top buyers with deal counts, center doughnut chart by sub-segment, and right box for illustrative deals.
Human Resources and Talent Management
Technology & Software
This slide presents the shift in M&A strategy among strategic buyers toward acquiring talent-rich and capability-deep firms, especially in digital transformation and analytics. Key buyers like WNS and Genpact are shown alongside deal examples, with a focus on talent acquisition and specialization.
strategic buyers, M&A, talent acquisition, digital, data, CX, analytics, automation
false
Human Resources and Talent Management
Technology & Software
Mixed Chart
EY
Add to my slides
Remove from favorites
Three columns juxtapose elements of 'Engage with 16MM Relationships', 'Offerings Across Wealth Levels and Preferences', and 'Industry Leading Capabilities'.
Strategic Planning
Financial Services
This slide outlines strategic capabilities that differentiate the company, categorizing them into engagement, service offerings, and leading industry capabilities, suggesting a unique positioning.
Strategic capabilities, Industry leadership, Engagement, Offerings, Wealth levels
false
Strategic Planning
Financial Services
Table
Goldman Sachs
Add to my slides
Remove from favorites
The layout presents a comparison of strategic commitments against outcomes, using checkmarks for achievement illustration, with succinct text.
Financial Performance
Financial Services
Communicates a firm's achievements against strategic priorities, focusing on customer growth, data migration, value from AI/ML, risk controls, and financial outcomes.
strategic commitments, customer growth, AI, ML, data migration, financial outcomes, risk management, talent acquisition
false
Financial Performance
Financial Services
Table
JP Morgan
Add to my slides
Remove from favorites
Slide contrasts two lists detailing what Strategic Cost Transformation (SCT) is and is not, with highlighted focus points in green.
Strategic Planning
Professional Services
Defines and differentiates Strategic Cost Transformation (SCT) from traditional cost management approaches, focusing on its scope, nature, and business alignment, tailored to specific business challenges.
Strategic Cost Transformation, Business Alignment, Organizational Change, Scope
false
Strategic Planning
Professional Services
Table
Deloitte
Add to my slides
Remove from favorites
A straightforward layout featuring three columns of bullet points accompanied by directional arrows. The color scheme is predominantly blue and white, maintaining a professional appearance.
Strategic Planning
Financial Services
The slide outlines the strategic directions of the company, focusing on business growth, product diversification, and operational efficiency. It presents a concise strategic plan with clear objectives for the future.
strategic direction, growth, diversification, efficiency, operational, business plan
false
Strategic Planning
Financial Services
Vertical Flow
Goldman Sachs
Add to my slides
Remove from favorites
Features listing of focus areas, icons, and strategic drivers with a blue and white color scheme emphasizing digital trends.
Strategic Planning
Financial Services
Articulates strategic focuses such as product offerings, client relations, and trends like digital transformation in markets.
strategic focus, market trends, digital transformation, client engagement, trade lifecycle
false
Strategic Planning
Financial Services
Table
JP Morgan
Add to my slides
Remove from favorites
The slide features a blue arrow flowchart with four key strategy elements at the top and four boxes below illustrating principles and values with icons and bullet points.
Strategic Planning
Financial Services
The slide compares strategic principles of a financial company, such as client franchises and business practices, and their impact on long-term value and sustainability.
strategic framework, principles, client franchises, shareholder value, sustainability, financial services, comparison, flowchart
false
Strategic Planning
Financial Services
Pillar
JP Morgan
Add to my slides
Remove from favorites
The layout presents a three-column text arrangement with headers like 'Global Banking & Markets', 'Asset & Wealth Management', and 'Platform Solutions'. The text is white on a dark background for contrast, with bullet points summarizing objectives and accomplishments in each sector.
Strategic Planning
Financial Services
Describes the strategic objectives and achievements in various business units, such as expanding banking footprint and client assets under supervision, relevant for understanding the company's strategic focus areas and growth measures.
Strategic goals, banking, wealth management
false
Strategic Planning
Financial Services
Table
Goldman Sachs
Add to my slides
Remove from favorites
Slide includes structured text blocks outlining Essity's vision, mission, objectives, and strategies with distinct color coding for each section.
Strategic Planning
Financial Services
Outlines Essity's strategic goals and methods to enhance stakeholder value, improve customer satisfaction, and promote sustainability, useful in corporate strategy sessions.
Strategic Goals, Stakeholder Value, Customer Satisfaction, Sustainability
false
Strategic Planning
Financial Services
Framework
Barclays
Add to my slides
Remove from favorites
The slide shows a three-column layout with text and arrows. It details different strategic focuses and projected financial impacts.
Strategic Planning
Financial Services
Explains strategic growth areas, including business diversification and efficiency. Designed for strategy presentations or stakeholder meetings.
Strategic Growth, Business Diversification, Efficiency, Financial Impact, Planning, Stakeholders
false
Strategic Planning
Financial Services
Vertical Flow
Goldman Sachs
Add to my slides
Remove from favorites
Minimalistic design with text highlighting four major points accompanied by circular icons. Color scheme is purple and white.
Strategic Planning
Healthcare & Pharmaceuticals
Summarizes the strategic direction and growth achievements of the company, specifically in the healthcare sector. Intended for use in executive summaries or strategy review meetings.
strategic growth, healthcare, market drivers, data assets
false
Strategic Planning
Healthcare & Pharmaceuticals
Vertical Flow
Barclays
Add to my slides
Remove from favorites
The slide splits into two sections, one with bullet points outlining strategic imperatives and the other with a graphic metaphor of "timeboxing" the virus. It's simple with minimal color usage, primarily black and white.
Strategic Planning
Healthcare & Pharmaceuticals
This slide discusses strategic imperatives to safeguard lives and livelihoods amid COVID-19, alongside a graphic illustrating the concept of "timeboxing" the pandemic's impact. It's useful for conveying strategic actions and their expected outcomes.
Strategic Imperatives, COVID-19, Timeboxing, Safety
false
Strategic Planning
Healthcare & Pharmaceuticals
Mixed Chart
McKinsey
Add to my slides
Remove from favorites
A structured layout with categorized initiatives for various industries, highlighting specific digital trends and strategies.
Industry Overview
Technology & Software
Summarizes key digital initiatives across industries like healthcare, logistics, and telecommunications, aiming to guide strategic planning and innovation efforts.
Strategic Initiatives, Digital Transformation, Industry Overview, Future Trends, Multi-Industry
false
Industry Overview
Technology & Software
Table
Accenture
Add to my slides
Remove from favorites
Several lists with bullet points, divided into four sections with different colored headers, describing various business strategies.
Strategic Planning
Financial Services
Describes strategic investments in distribution, products, technology, and cost efficiency to strengthen the franchise.
Strategic investment, distribution, product expansion, technology, cost efficiency
false
Strategic Planning
Financial Services
Table
JP Morgan
Add to my slides
Remove from favorites
The slide includes a column chart and structured data on modernization, common architecture, and IT investments by capability. Charts show the percentages of applications decommissioned and new applications introduced.
Strategic Planning
Financial Services
This slide highlights strategic investments in modernizing the IT estate and maintaining a common architecture, showing data on application management and IT investments.
strategic investment, modernization, IT architecture, applications, decommission, new applications, common architecture, IT investments, consistency
false
Strategic Planning
Financial Services
Mixed Chart
Credit Suisse
Add to my slides
Remove from favorites
Contains several data blocks and bullet points explaining the strategic rationale and outcomes of investments.
Investment Analysis
Financial Services
Highlights JPMorgan's strategic investments and acquisitions, including performance metrics and integration of technology platforms.
Strategic investments, acquisitions, market share, banking, investment platforms, digital transformation
false
Investment Analysis
Financial Services
Table
JP Morgan
Add to my slides
Remove from favorites
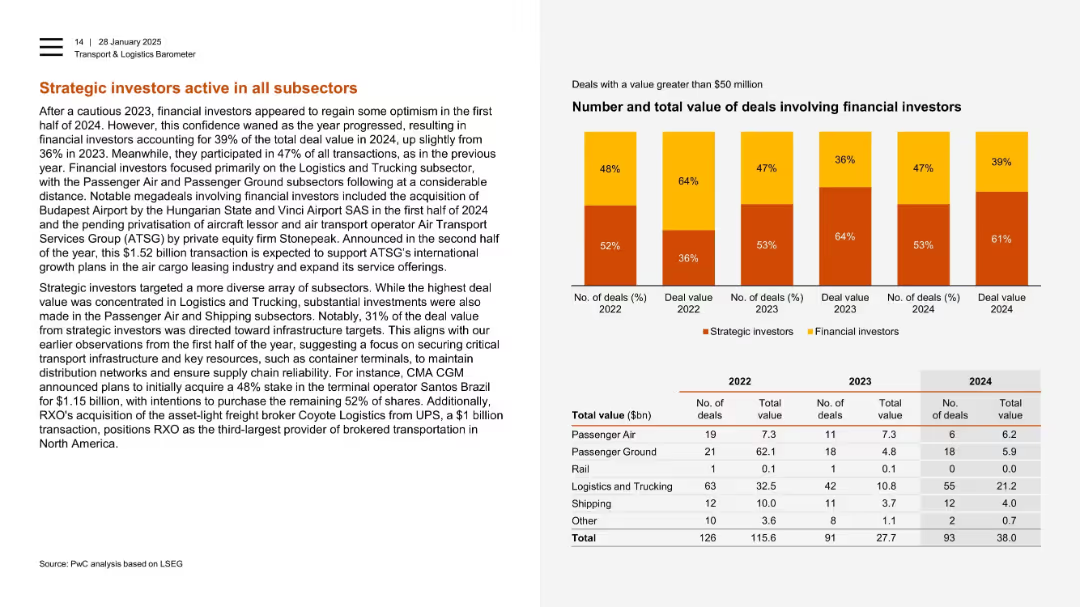
Two-column layout with a stacked bar chart and deal count/value table by subsector at the bottom.
Investment Analysis
Transportation & Logistics
Financial investors regained confidence in 2024, accounting for a larger share of deal value. Focus was on logistics, trucking, and infrastructure, with notable deals in terminal operations and freight brokerage. Investment data is broken down by subsector.
strategic investors, infrastructure, trucking, transport, private equity, financial investors, deal breakdown
false
Investment Analysis
Transportation & Logistics
Mixed Chart
PwC/Strategy&
Add to my slides
Remove from favorites
The slide features a matrix showing the usage of strategic levers by leaders, with a heatmap indicating the percentage of companies selecting each lever.
Strategic Planning
Professional Services
It presents the strategic levers used by leaders to create value, highlighting the importance of supply and demand power in procurement strategies.
Strategic levers, procurement, supply power, demand power, value creation, leaders, strategic planning
false
Strategic Planning
Professional Services
Mixed Chart
Kearney
Add to my slides
Remove from favorites
The slide features a matrix showing the usage of strategic levers by leaders, with a heatmap indicating the percentage of companies selecting each lever.
Strategic Planning
Professional Services
It presents the strategic levers used by leaders to create value, highlighting the importance of supply and demand power in procurement strategies.
Strategic levers, procurement, supply power, demand power, value creation, leaders, strategic planning
false
Strategic Planning
Professional Services
Table
Kearney
Add to my slides
Remove from favorites
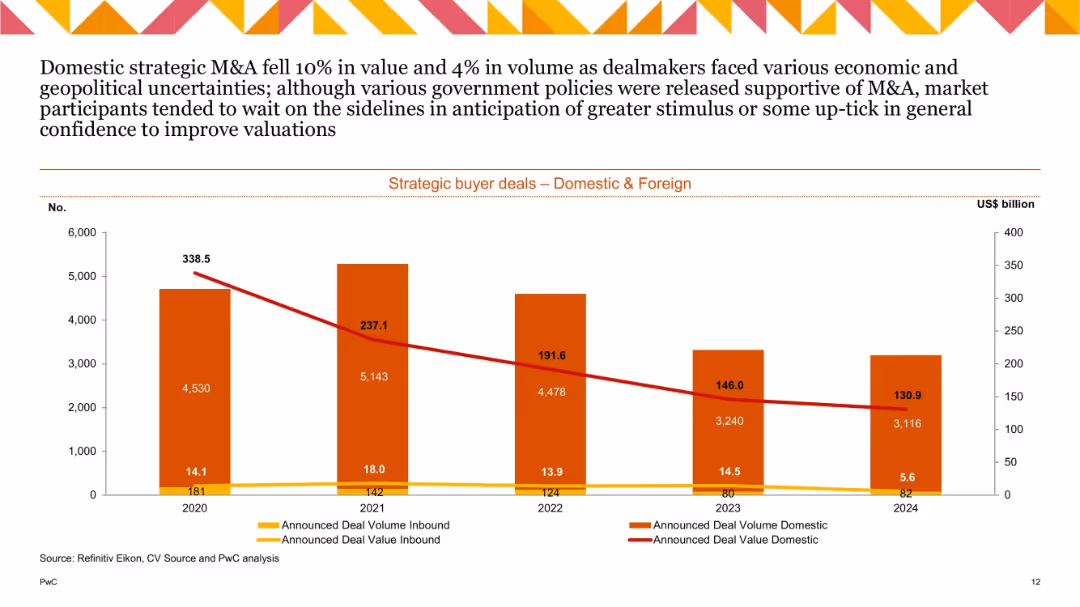
Dual-axis bar chart with orange/red bars (domestic/foreign volume) and red/yellow lines (value); covers 2020–2024; bars show significant decline.
Strategic Planning
Financial Services
Tracks strategic buyer M&A deals by origin. Domestic deals fell 10% in value and 4% in volume in 2024. Uncertainty and lack of stimulus kept participants cautious, resulting in continued deal volume/value decline across years.
strategic M&A, domestic, foreign, deal value, deal volume, trend
false
Strategic Planning
Financial Services
Single Chart
PwC/Strategy&
Add to my slides
Remove from favorites
The slide contains a column chart progressing from 'Today' to a '5-year aspiration', divided into segments labeled 'Pick well', 'Do better', and 'Green box'. The colors vary with each segment to emphasize progression and focus on innovation.
Strategic Planning
Professional Services
Focuses on the strategic importance of setting measurable innovation goals in the 'Green Box' to drive resource allocation and long-term planning. This slide is essential for discussions on strategic management and goal setting in corporate environments, providing a clear visualization of planning and execution stages.
Strategic management, goal setting, innovation goals, resource allocation, corporate strategy
false
Strategic Planning
Professional Services
Single Chart
McKinsey
Add to my slides
Remove from favorites
The slide features a diagram of Deloitte's "bank of the future" model, including options like exponential platform and banking provider. The right side includes bullet points discussing strategic pressures and collaboration for FinTechs.
Strategic Planning
Financial Services
This slide outlines Deloitte's strategic model for future banking, detailing options such as becoming an exponential platform or a traditional banking provider. It also discusses the pressures FinTechs face and the need for collaboration with incumbents.
strategic options, banking, FinTechs, Deloitte, future model
false
Strategic Planning
Financial Services
Diagram
Deloitte
Add to my slides
Remove from favorites
The slide consists of a complex flowchart detailing various business areas and their interconnections. It is text-heavy, with specific color coding to highlight different departments like Investment Banking, Commercial Banking, and Payments. There are icons representing collaboration and client engagement.
Financial Performance
Financial Services
Discusses strategic partnerships within a financial services firm, highlighting how payments are integral to the firm's success and contribute to cross-divisional collaborations. It illustrates a unified approach to client lifecycle engagement, fostering growth and international expansion.
strategic partnership, financial services, client engagement, collaboration
false
Financial Performance
Financial Services
Boxed
JP Morgan
Add to my slides
Remove from favorites
A U.S. map pinpointing U.S. Bank and State Farm locations, alongside line graphs showcasing crypto fund flows and the number of new accounts, using red and blue colors.
Strategic Planning
Financial Services
Outlines strategic partnerships with State Farm and NYDIG, detailing the expansion of deposit accounts and the introduction of cryptocurrency custody services, reflecting diversification and digital advancement strategies.
Strategic Partnerships, Crypto, State Farm
false
Strategic Planning
Financial Services
Multiple Chart
Goldman Sachs
Add to my slides
Remove from favorites
The slide shows a central circular diagram with four divisions, each representing a line of business. Around this central feature, various services and market segments are interconnected.
Strategic Planning
Financial Services
This diagram represents JPMorgan Chase's strategic partnerships across different lines of business, emphasizing cross-functional collaboration and services offered.
Strategic Partnerships, JPMorgan Chase, Cross-LOB, Market Segmentation, Business Strategy, Client Services, Financial Planning
false
Strategic Planning
Financial Services
Mixed Chart
JP Morgan
Add to my slides
Remove from favorites
Circular diagram with five segments outlining steps for Nigeria's FX management strategy. Each segment has an icon and a brief description.
Strategic Planning
Financial Services
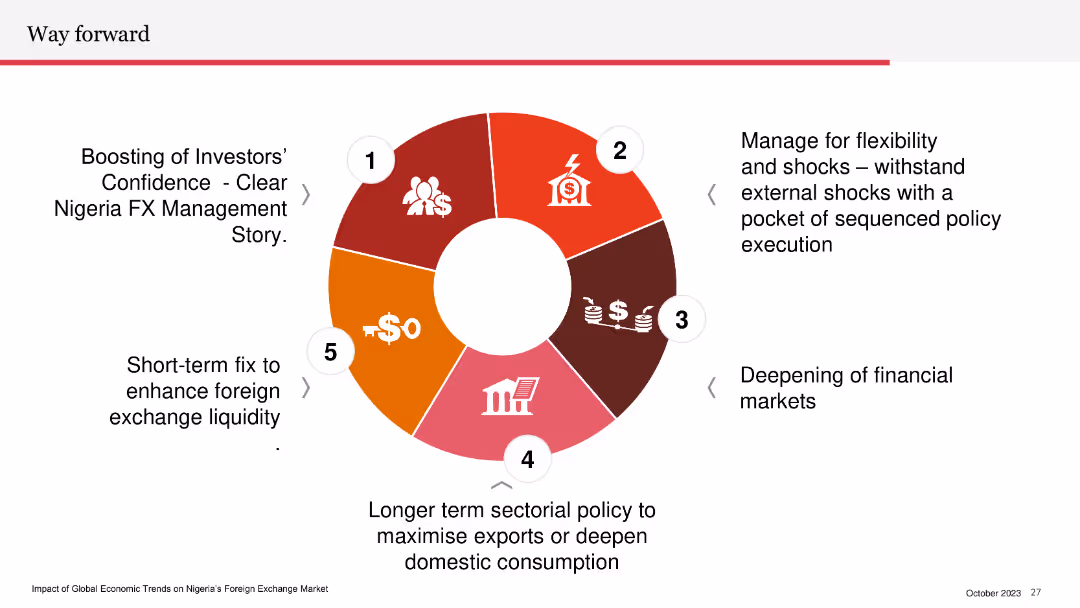
The slide outlines a strategic plan for managing Nigeria's foreign exchange market, focusing on boosting investor confidence, managing external shocks, deepening financial markets, sectorial policy, and enhancing foreign exchange liquidity.
strategic plan, FX management, investor confidence, financial markets, liquidity
false
Strategic Planning
Financial Services
Vertical Flow
PwC/Strategy&
Add to my slides
Remove from favorites
The slide is divided into three blocks, each with a headline and bullet points. The colors used are blue, white, and a touch of green. There are no graphs or charts, but the slide is content-dense with strategic statements and initiatives highlighted.
Strategic Planning
Professional Services
This slide is geared towards strategic planning, highlighting the company’s outlook and priorities. It delineates active asset management strategies, investment focus, and responsible capital management tactics. Useful in executive meetings or strategic planning sessions to communicate future direction and financial prudence.
strategic planning, asset management, investment strategy, capital management
false
Strategic Planning
Professional Services
Header Horizontal
Morgan Stanley
Add to my slides
Remove from favorites
Two U.S. maps comparing branch network coverage in 2017 vs 2021, with additional statistics on coverage expansion.
Strategic Planning
Financial Services
Emphasizes strategic planning in branch distribution to serve more communities effectively rather than maximizing the number of branches.
Strategic Planning, Branch Network, Community Service, Coverage Expansion, Customer Needs, Financial Goals
false
Strategic Planning
Financial Services
Text Only
JP Morgan
Add to my slides
Remove from favorites
Previous
Next
You don't have any favorites yet.
Please wait loading your favorites slides...
Create a FREE account to continue browsing
Receive Instant Access to 1,000+ slides from companies like McKinsey, Google, and Goldman Sachs
First Name
Last Name
Email
Password
I agree to all
Terms & Privacy Policy
Thank you! Your submission has been received!
Oops! Something went wrong while submitting the form.
Have an account?
Sign in
Upgrade to PRO to Save slides
Advanced Search and Filters
Access to 15,000+ slides
Access to Category Pages
Save/Bookmark Slides
PowerPoint Template Library
Pick a Plan
MONTHLY
$12/month
Billed every month, Cancel anytime.
YEARLY
$9/year
Billed $108 annually, Cancel anytime.
Checkout for $12/month
Checkout for $108/yr
Secured by Stripe | AES-256 bit encryption


![Available strategic options depend on current position and aspirations to become platform [3/3]](https://cdn.prod.website-files.com/654e70fb59937215cac87b19/6874b2a33059d8d969b8e586_rMALuQmM0zAtfOjKi59nQrnBGitGr6BQL-6pJtzKbF4.avif)