My Account
My Slides
Search by Category
Pricing
Templates
View All Templates
Download Template Slides
✦ AI Search
Feedback
Login
Logout
Get Started
Browse all Slides
Browse all Slides
Create a FREE Account
Instant access to 1,000+ real slides from top companies like McKinsey, BCG, Goldman Sachs, Google and many more!
First Name
Last Name
Email
Password
I agree to all
Terms & Privacy Policy
Thank you! Your submission has been received!
Oops! Something went wrong while submitting the form.
Have an account?
Sign in
Saved Slides
Total No. of slides saved
0
↻ Refresh
✖ Clear all
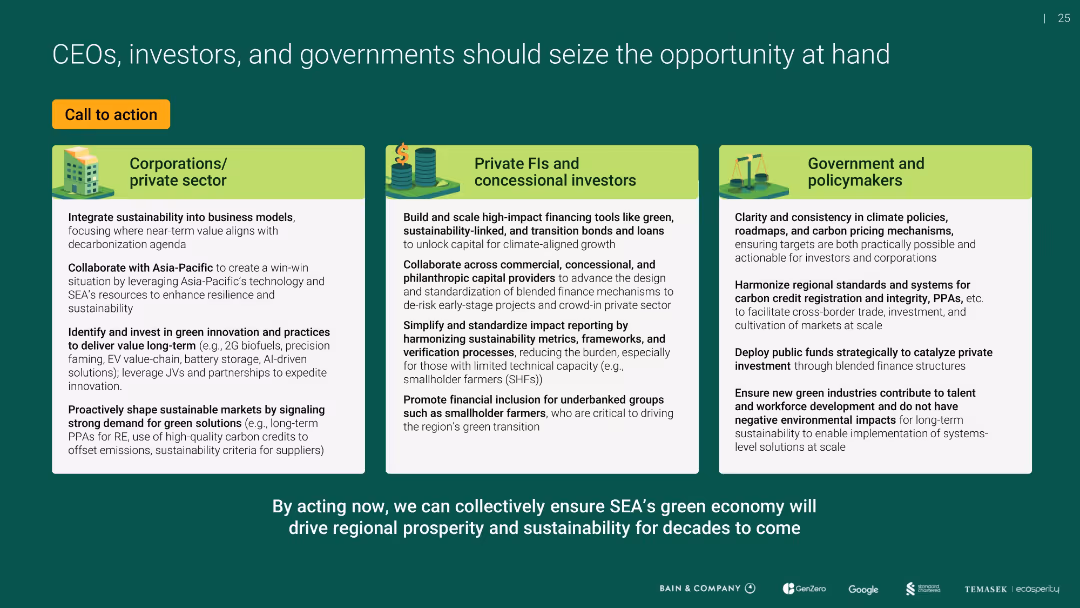
Three-column layout with icons for corporations, investors, and policymakers; light green boxes with bulleted text; bolded headers for each sector
Strategic Planning
Environmental Services & Sustainability
Outlines a call to action for different stakeholders—corporates, investors, and governments—to support Southeast Asia’s green transition through financing, innovation, policy consistency, and sustainable market development.
sustainability, green economy, policy, private sector, financing, SEA, transition, investors, governments
false
Strategic Planning
Environmental Services & Sustainability
Pillar
Bain
Add to my slides
Remove from favorites
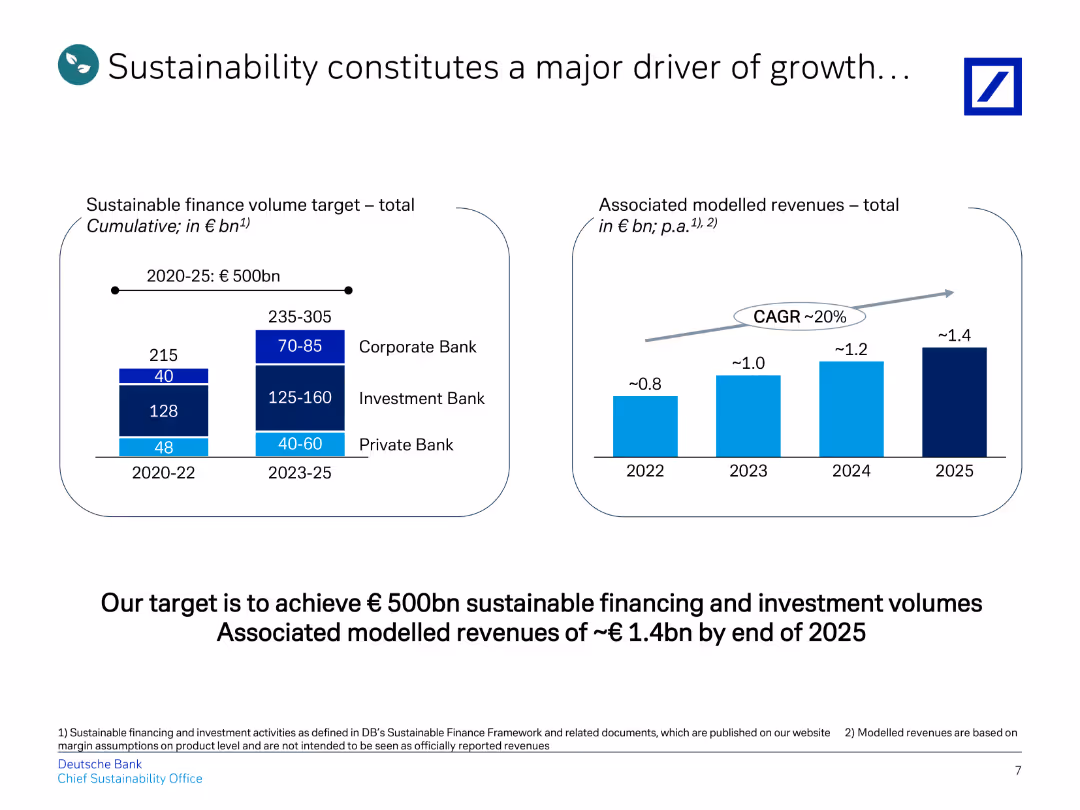
This slide features a title, a vertical bar chart on the left, and a column chart on the right, showing cumulative targets and revenue.
Market Analysis and Trends
Financial Services
Demonstrates how sustainability initiatives drive growth, with cumulative finance volume targets and modeled revenue projections.
sustainability, growth, finance, targets, revenue
false
Market Analysis and Trends
Financial Services
Multiple Chart
Deutsche Bank
Add to my slides
Remove from favorites
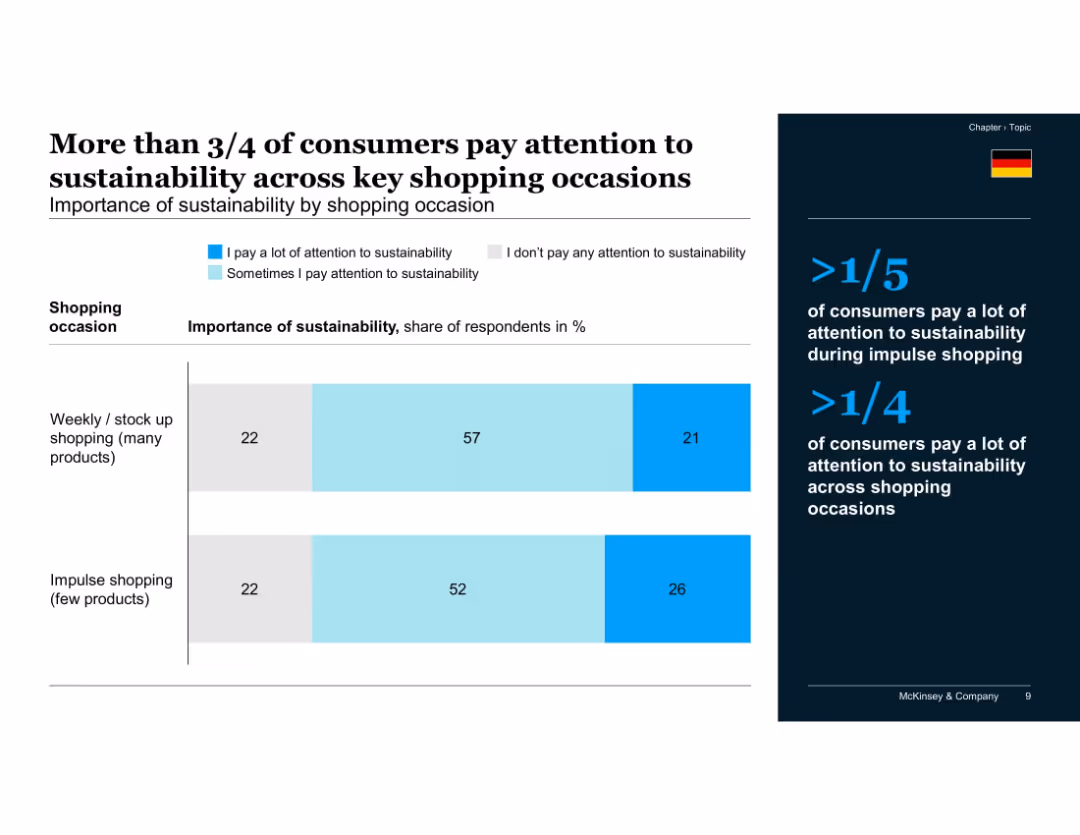
Two stacked bar charts comparing sustainability attention during different shopping types, with right-side key points
Customer and Market Segmentation
Consumer Goods
The majority of consumers consider sustainability in their shopping, with 78% doing so during weekly stock-up trips and 73% even during impulse buying. Highlights that sustainability is a consistent consideration across shopping contexts.
sustainability, impulse shopping, weekly shopping, consumer behavior, shopping habits, attention span, environmental concern, McKinsey, Germany
false
Customer and Market Segmentation
Consumer Goods
Mixed Chart
McKinsey
Add to my slides
Remove from favorites
The slide is advanced, filled with both text and icons representing different aspects of sustainability. Each category such as "Addressing climate change" or "Promoting inclusion and diversity" is accompanied by relevant icons and a brief list of achievements or goals. The design is clean and organized, using the company's color scheme of blue and green to differentiate sections.
Operational Efficiency
Financial Services
This slide details the company's sustainability priorities and metrics, focusing on addressing climate change, promoting inclusion, keeping the customer at the center, demonstrating employee commitment, and community strengthening. It's used to communicate corporate social responsibility efforts and operational efficiency in these areas.
Sustainability, Inclusion, Customer Focus, Employee Commitment, Community Engagement, Environmental Goals, Diversity, Growth Metrics
false
Operational Efficiency
Financial Services
Pillar
Morgan Stanley
Add to my slides
Remove from favorites
Incorporates a mix of colored texts in boxes, infographics, and progress bars to represent sustainability goals and social commitments in finance.
Market Analysis and Trends
Technology & Software
Conveys financial commitments to sustainability and inclusivity, outlining progress in green finance, community, and diversity initiatives.
sustainability, inclusivity, finance, community development, green, social responsibility, progress
false
Market Analysis and Trends
Technology & Software
Table
JP Morgan
Add to my slides
Remove from favorites
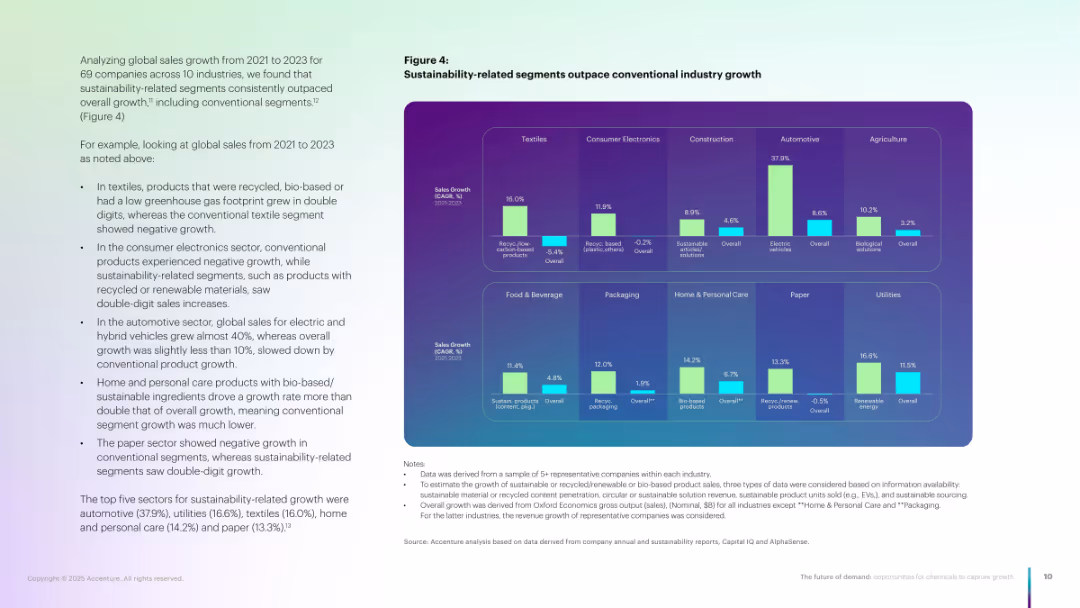
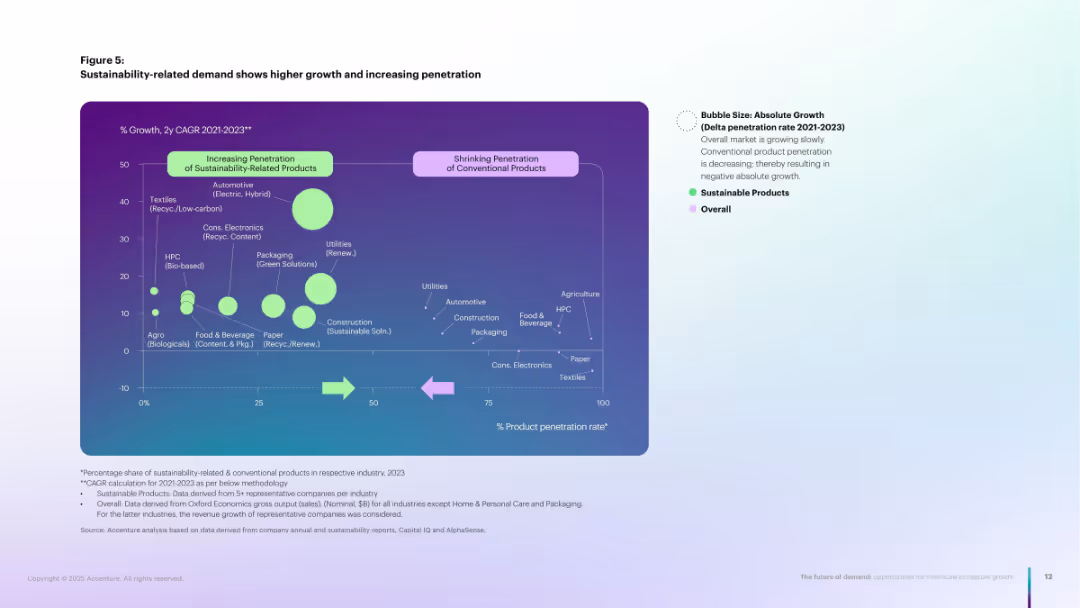
Grid-style chart with 10 industry segments; each has dual bars (sustainable vs. overall).
Market Analysis and Trends
Environmental Services & Sustainability
Compares growth of sustainable vs. conventional products across ten industries. Shows double-digit growth in sustainable segments in textiles, auto, HPC, etc., with overall demand lagging behind.
Sustainability, industry growth, recycled products, bio-based, segments
false
Market Analysis and Trends
Environmental Services & Sustainability
Multiple Chart
Accenture
Add to my slides
Remove from favorites
Compares industry implications with icons and headers, using a blue and white color theme for readability.
Operational Efficiency
Environmental Services & Sustainability
Outlines sustainable tech's impact across industries. Ideal for operational strategy meetings.
sustainability, industry impact, technology adoption, operational strategy, automotive
false
Operational Efficiency
Environmental Services & Sustainability
Header Vertical
McKinsey
Add to my slides
Remove from favorites
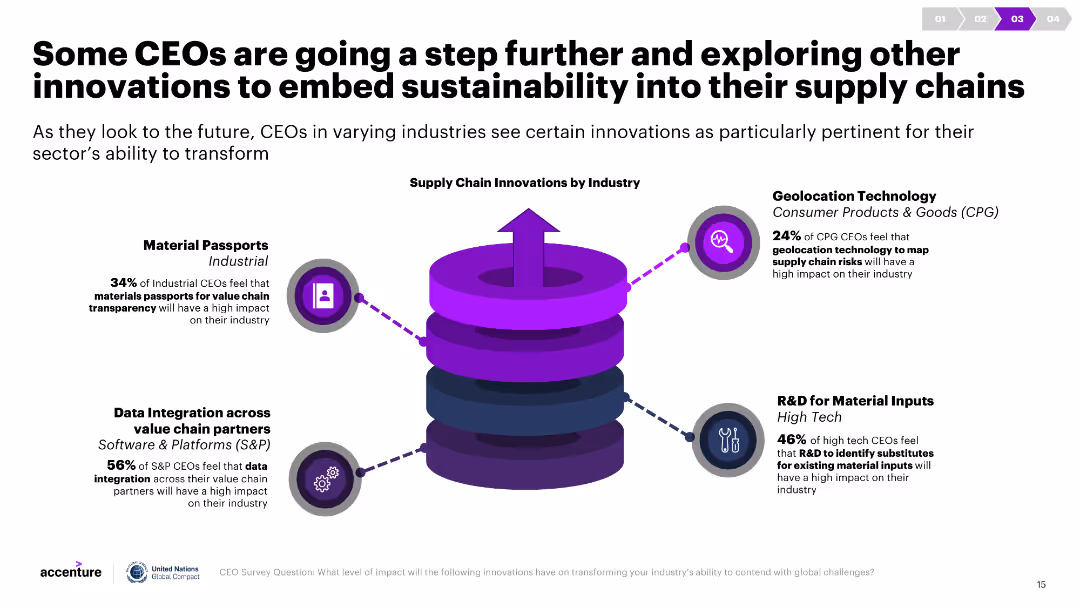
The slide has a central 3D diagram depicting a supply chain surrounded by icons and text descriptions of innovations by industry. It is visually engaging.
Technology and Digital Transformation
Environmental Services & Sustainability
This slide highlights innovations such as geolocation technology and material passports that CEOs are using to enhance sustainability in their supply chains.
Sustainability, innovation, supply chain, material passports, geolocation technology, R&D, data integration, industry, transformation, impact
false
Technology and Digital Transformation
Environmental Services & Sustainability
Diagram
Accenture
Add to my slides
Remove from favorites
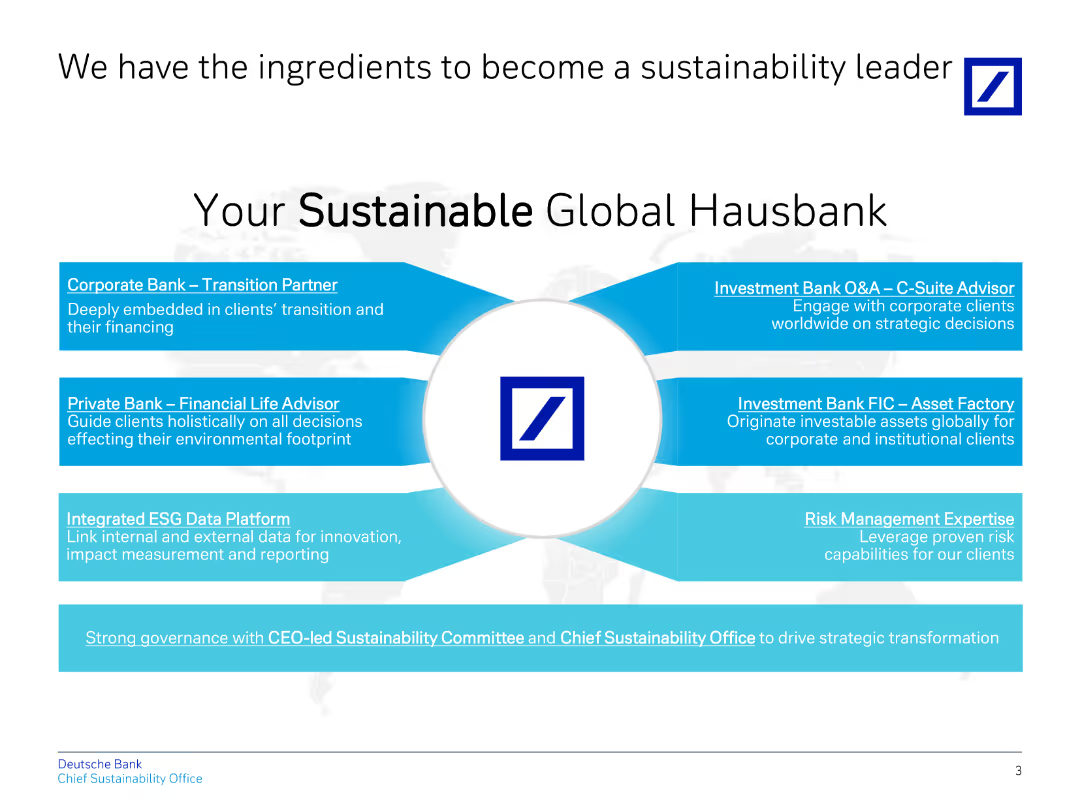
The slide features a central image with several surrounding labels detailing key components for sustainability leadership.
Strategic Planning
Financial Services
Presents the components Deutsche Bank believes are necessary to become a sustainability leader, including various banking segments.
sustainability, leadership, components, strategy, ESG
false
Strategic Planning
Financial Services
Diagram
Deutsche Bank
Add to my slides
Remove from favorites
The slide includes a circular diagram illustrating various aspects of sustainability outcomes. Text boxes on the right explain Gartner's focus on sustainability.
Strategic Planning
Professional Services
It discusses Gartner’s commitment to sustainability, covering strategies, leadership, and initiatives to support sustainable development goals.
Sustainability, leadership, strategy, innovation, growth, Gartner, initiatives
false
Strategic Planning
Professional Services
Diagram
Gartner
Add to my slides
Remove from favorites
Features circular graphics and supporting statistics discussing the impact of sustainability on consumer behaviors in the luxury sector.
Market Analysis and Trends
Environmental Services & Sustainability
Highlights how sustainability considerations are increasingly influencing the purchasing decisions of luxury consumers.
sustainability, luxury consumers, consumer behavior, environmental impact, purchasing decisions
false
Market Analysis and Trends
Environmental Services & Sustainability
Vertical Flow
BCG
Add to my slides
Remove from favorites
Features stacked column charts and icons to illustrate the preferred sustainability criteria.
Product and Service Analysis
Environmental Services & Sustainability
Highlights different sustainability criteria valued by consumers when purchasing luxury goods.
sustainability, luxury goods, consumer preferences, criteria
false
Product and Service Analysis
Environmental Services & Sustainability
Multiple Chart
BCG
Add to my slides
Remove from favorites
A large column chart details the reasons why sustainability matters in luxury goods purchases.
Customer and Market Segmentation
Environmental Services & Sustainability
Analyzes consumer priorities regarding sustainability in the context of luxury goods.
sustainability, luxury goods, consumer priorities, environmental impact
false
Customer and Market Segmentation
Environmental Services & Sustainability
Single Chart
BCG
Add to my slides
Remove from favorites
The slide contains bold headers, bullet points, and infographics, illustrating macro and micro levels of sustainability impact.
Investment Analysis
Environmental Services & Sustainability
Urges the importance of sustainability for market potential and regulatory compliance. Suitable for leadership briefings.
sustainability, market size, regulations, corporate strategy, leadership
false
Investment Analysis
Environmental Services & Sustainability
Header Horizontal
McKinsey
Add to my slides
Remove from favorites
The Comparative Slide juxtaposes the potential savings in materials and CO2 emissions if the world used Michelin tires, with comparative visuals such as the Statue of Liberty for scale. The use of comparison and statistical data effectively emphasizes Michelin's environmental benefits. The layout is visually engaging and informative, highlighting the impact of tire technology on sustainability.
Regulatory and Compliance
Industrial & Manufacturing
The slide contrasts the environmental benefits of using Michelin tires versus other brands, illustrating significant reductions in material use and CO2 emissions. It serves as a persuasive argument for Michelin's sustainability initiatives, aligning with global decarbonization goals and setting industry standards in product performance and eco-friendliness.
sustainability, materials, CO2 emissions, tires, environmental impact, Michelin, decarbonization, resource saving
false
Regulatory and Compliance
Industrial & Manufacturing
Mixed Chart
Morgan Stanley
Add to my slides
Remove from favorites
Two column charts comparing the percentage spend on circular materials in direct and indirect categories across various percentages. Each chart is clearly labeled with scales and categories.
Product and Service Analysis
Environmental Services & Sustainability
Presents survey results assessing the inefficiency in material use, showing the percentage of spend on sustainable vs. non-sustainable materials. It highlights areas for potential improvement in sustainability practices.
Sustainability, Materials, Inefficiency, Survey, Circular Economy
false
Product and Service Analysis
Environmental Services & Sustainability
Multiple Chart
Accenture
Add to my slides
Remove from favorites
Features bullet points, bold headers, and a large pie chart illustrating market growth by 2030. Graphical elements are well-spaced and the slide is easy to read.
Market Analysis and Trends
Transportation & Logistics
Explores the growth potential in sustainable mobility due to regulatory changes and market electrification, stressing on the expected market evolution and Faurecia's strategic positioning to leverage these opportunities.
sustainability, mobility, market growth, electrification, regulations, 2030
false
Market Analysis and Trends
Transportation & Logistics
Boxed
Deutsche Bank
Add to my slides
Remove from favorites
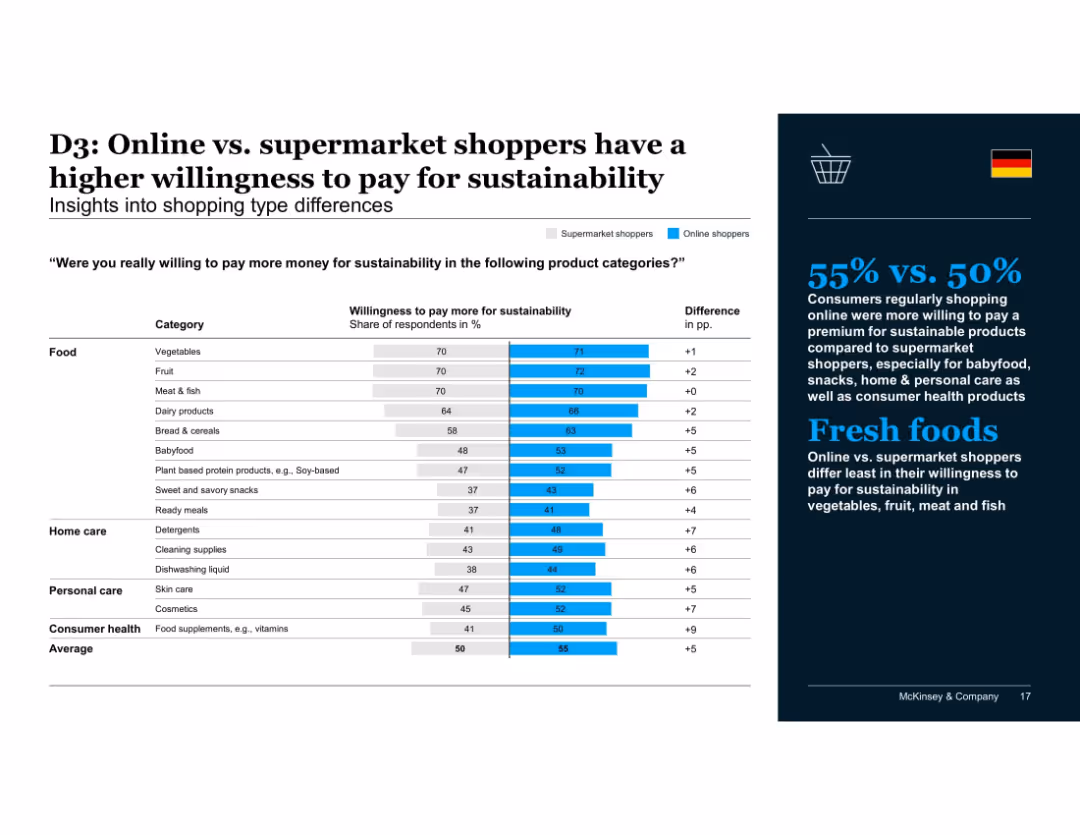
Two-part layout: left side features a bar chart comparing supermarket vs. online shopper willingness to pay more for sustainability across product categories, with numeric labels and color-coded bars; right side has a dark blue background with bold white and blue text summarizing insights and a German flag icon.
Customer and Market Segmentation
Retail & E-commerce
Highlights that online shoppers show greater willingness to pay for sustainability than supermarket shoppers in categories such as babyfood, snacks, and personal care, with less difference for fresh food categories like meat, fruit, and vegetables.
sustainability, online shopping, supermarkets, consumer behavior, willingness to pay, food categories, fresh produce, babyfood, personal care, market segmentation
false
Customer and Market Segmentation
Retail & E-commerce
Mixed Chart
McKinsey
Add to my slides
Remove from favorites
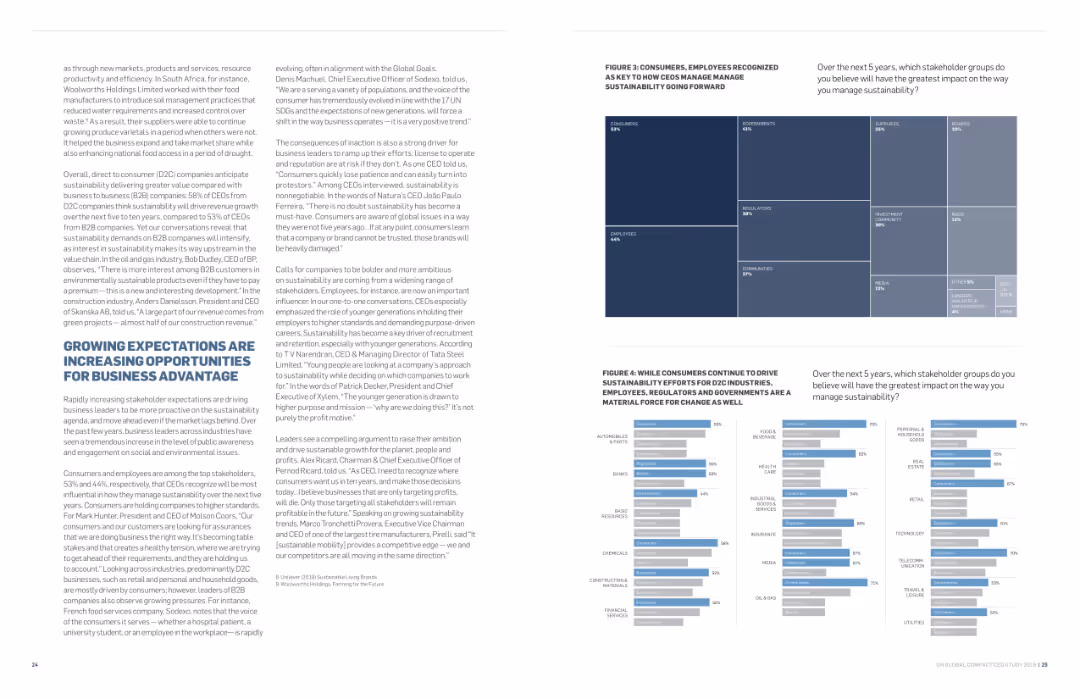
Contains text in two columns with a treemap on the right showing stakeholder groups impacting sustainability. Uses a white background with blue highlights and clear typography.
Strategic Planning
Professional Services
Explores how growing expectations for sustainability are creating business opportunities. The treemap highlights key stakeholder groups like consumers and employees, emphasizing their impact on driving sustainability efforts forward.
sustainability, opportunities, business advantage, expectations, stakeholders
false
Strategic Planning
Professional Services
Multiple Chart
Accenture
Add to my slides
Remove from favorites
Green themed slide showcasing circular statistics about organizational views on sustainability and its impact on workers and society.
Regulatory and Compliance
Environmental Services & Sustainability
Discusses the growing focus on sustainability in business strategies and the readiness of organizations to implement sustainable practices.
sustainability, organizational readiness, human element, societal impact, business strategy
false
Regulatory and Compliance
Environmental Services & Sustainability
Multiple Chart
Deloitte
Add to my slides
Remove from favorites
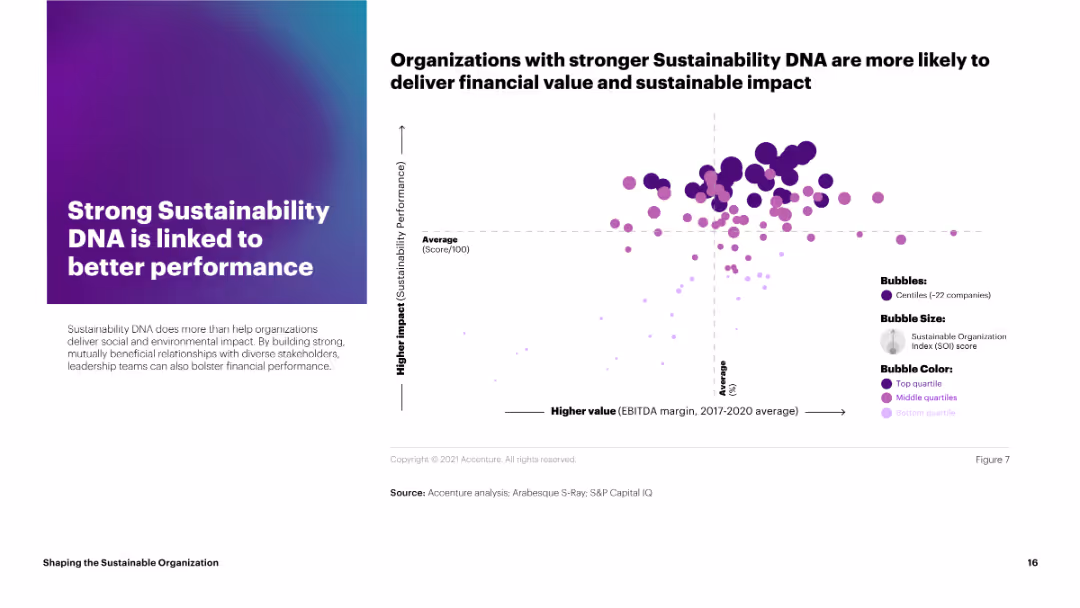
This slide features a bubble chart linking sustainability performance scores to EBITDA margins for various companies. The bubbles are color-coded by quartile and vary in size.
Strategic Planning
Environmental Services & Sustainability
The slide demonstrates that organizations with stronger sustainability DNA tend to achieve better financial performance, linking higher sustainability scores to improved EBITDA margins.
sustainability, performance, EBITDA, bubble chart, quartiles
false
Strategic Planning
Environmental Services & Sustainability
Mixed Chart
Accenture
Add to my slides
Remove from favorites
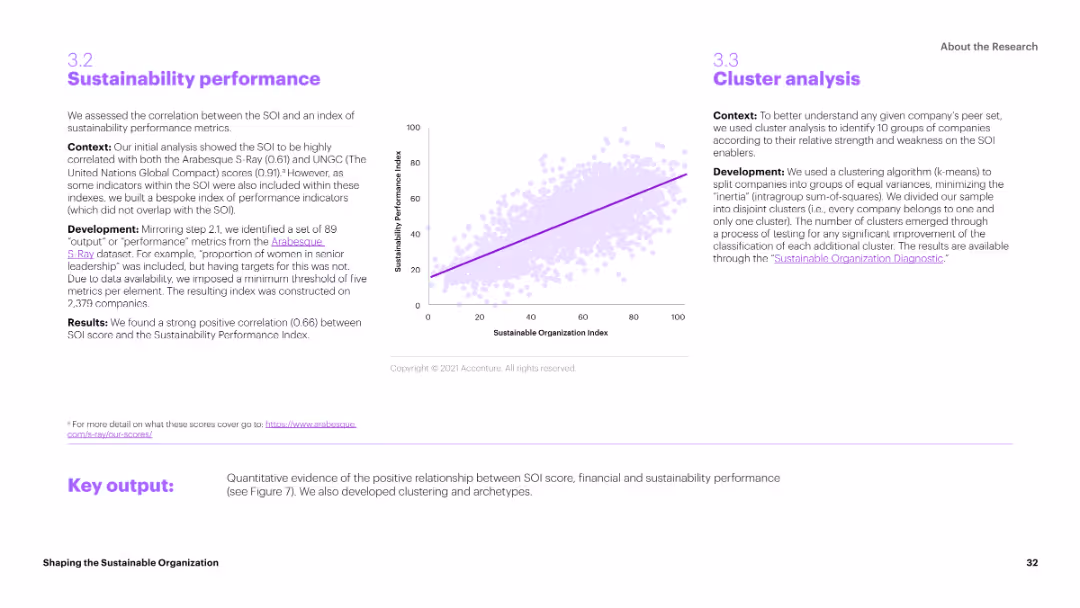
The slide includes a scatter plot correlating Sustainability Organization Index (SOI) scores with sustainability performance metrics. The layout is data-driven, with clear axis labels and a trend line indicating the correlation.
Performance Metrics and KPIs
Environmental Services & Sustainability
The slide assesses the correlation between the SOI and an index of sustainability performance metrics. It shows a strong positive correlation, suggesting that higher SOI scores are associated with better sustainability performance.
Sustainability, Performance, SOI, Metrics, Correlation
false
Performance Metrics and KPIs
Environmental Services & Sustainability
Mixed Chart
Accenture
Add to my slides
Remove from favorites
Includes small images and infographics highlighting sustainability initiatives and their impacts on health and the environment.
Regulatory and Compliance
Agriculture & Food Production
Reviews the company's leading initiatives in sustainability, focusing on plant-based products and reduction of food waste.
sustainability, plant-based, food waste, environmental impact, health initiatives
false
Regulatory and Compliance
Agriculture & Food Production
Header Horizontal
Deutsche Bank
Add to my slides
Remove from favorites
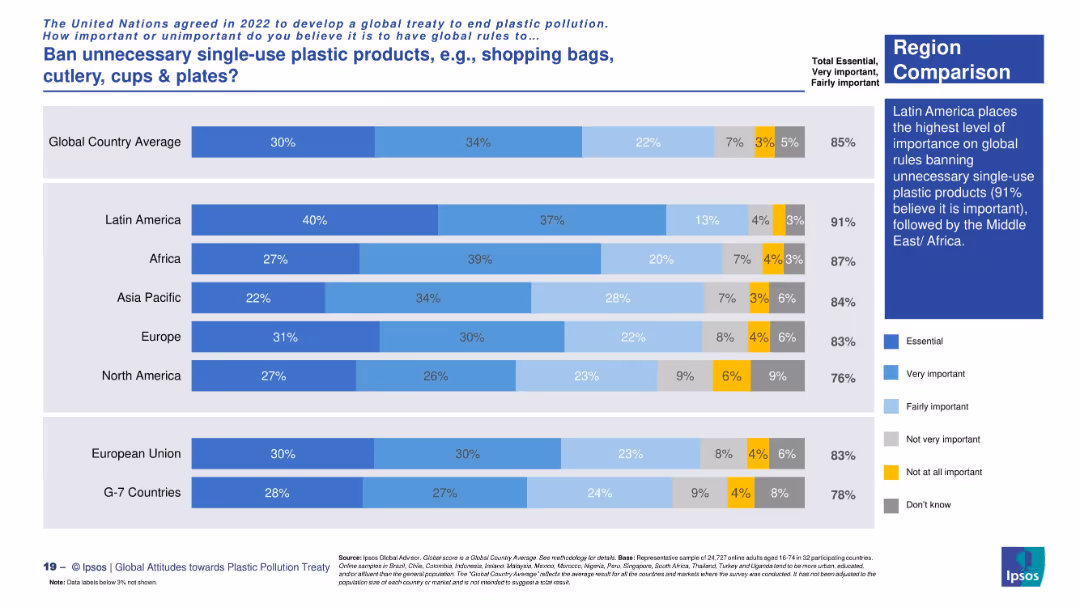
Horizontal bar chart showing regional support levels. Five-segment bars and right-hand insight box summarize the overall trend.
Regulatory and Compliance
Environmental Services & Sustainability
This slide shows strong regional backing for banning unnecessary single-use plastics, especially in Latin America and Africa. It reflects a shared priority in advancing environmental sustainability through global regulation.
sustainability, plastic ban, global agreement, regional data, Latin America, Ipsos study
false
Regulatory and Compliance
Environmental Services & Sustainability
Mixed Chart
IPSOS
Add to my slides
Remove from favorites
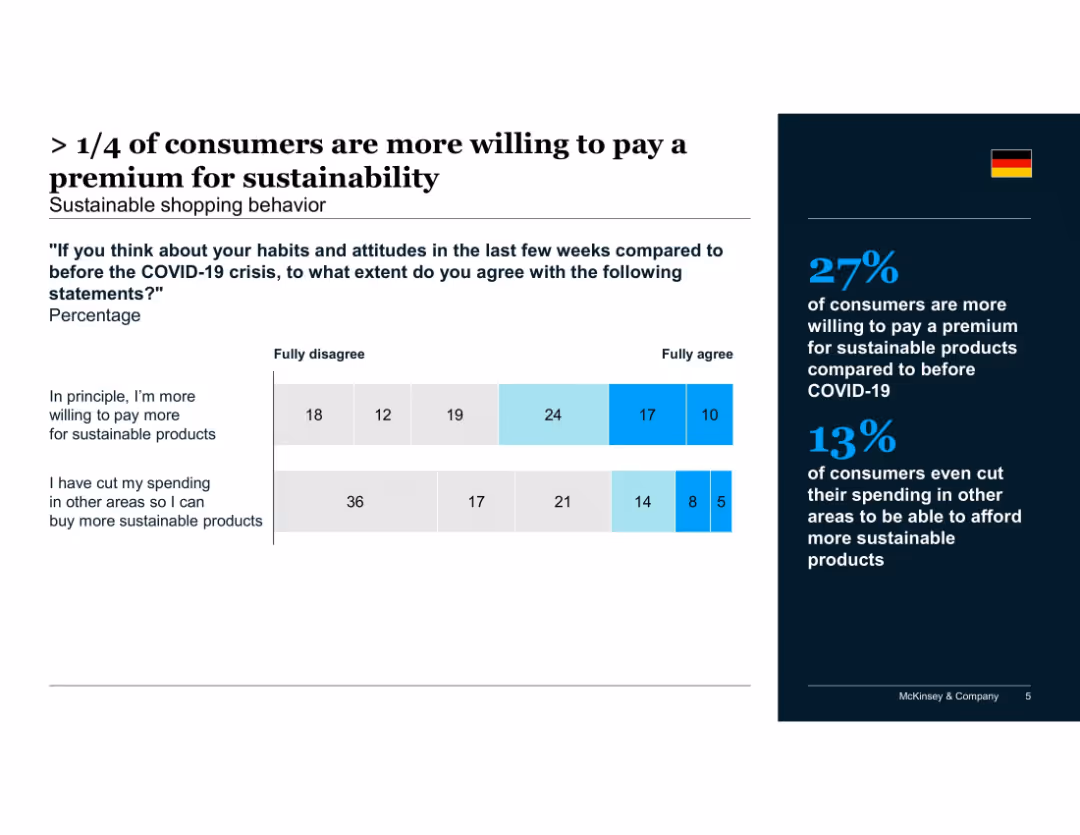
Stacked bar chart showing levels of agreement; focused on sustainable shopping
Market Analysis and Trends
Consumer Goods
Depicts increase in willingness among German consumers to pay more for sustainable products post-COVID. Also shows that some cut spending elsewhere to afford sustainability.
sustainability, premium pricing, post-COVID behavior, Germany, consumer willingness, spending shifts
false
Market Analysis and Trends
Consumer Goods
Mixed Chart
McKinsey
Add to my slides
Remove from favorites
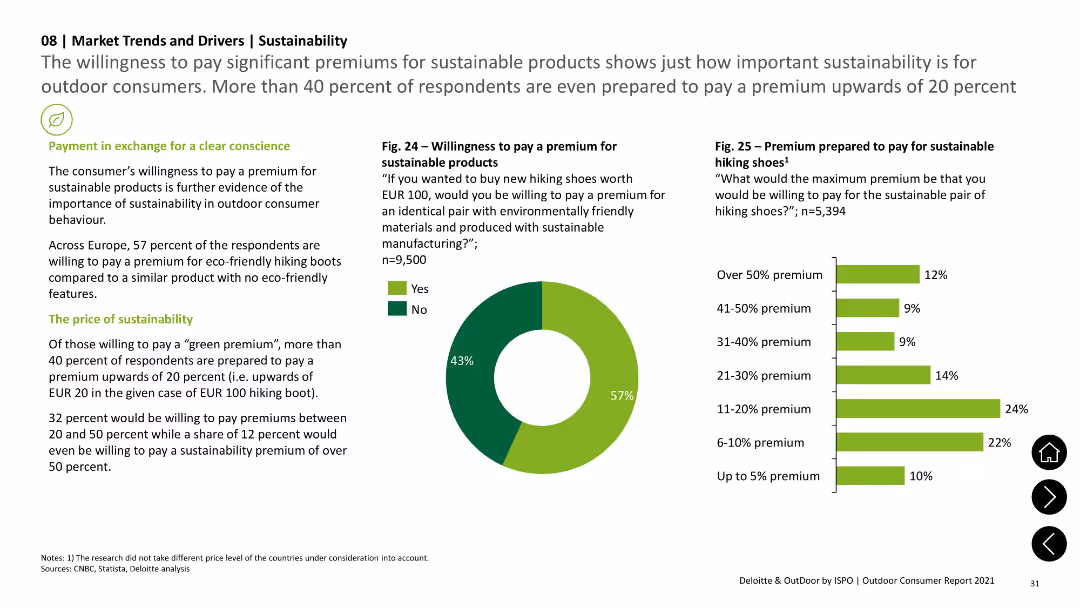
The slide features a pie chart showing willingness to pay a premium for sustainable products and a column chart displaying the range of premiums consumers are willing to pay. Text sections provide context and explanations.
Technology and Digital Transformation
Consumer Goods
The slide focuses on consumers' willingness to pay a premium for sustainable products, with survey data indicating the percentage of respondents ready to pay different premium levels for eco-friendly hiking boots.
sustainability, pricing, consumer behavior, premium, eco-friendly products
false
Technology and Digital Transformation
Consumer Goods
Multiple Chart
Deloitte
Add to my slides
Remove from favorites
Includes multiple column charts comparing sustainability priorities across different industries, with text explaining the findings.
Market Analysis and Trends
Healthcare & Pharmaceuticals
This slide compares the sustainability priorities of the energy, resources, and industrial sectors with life sciences and health care, highlighting key focus areas.
sustainability, priorities, energy, healthcare, market trends
false
Market Analysis and Trends
Healthcare & Pharmaceuticals
Multiple Chart
Deloitte
Add to my slides
Remove from favorites
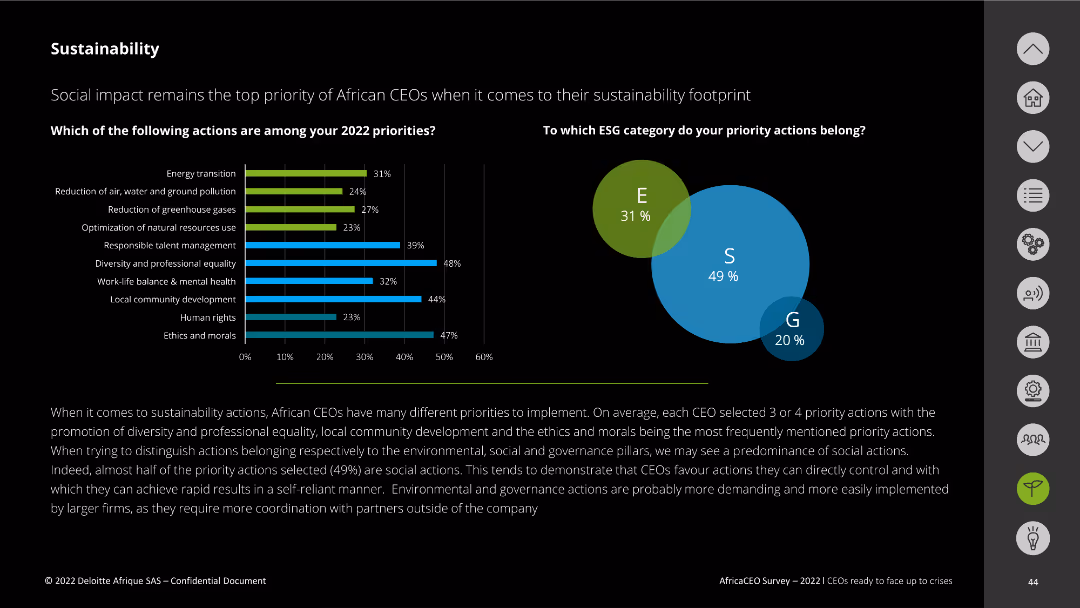
This slide includes vertical bar charts and a Venn diagram. It lists 2022 sustainability priorities and categorizes actions by ESG pillars.
Market Analysis and Trends
Environmental Services & Sustainability
The slide details the top sustainability priorities for African CEOs in 2022 and categorizes these actions into environmental, social, and governance pillars.
sustainability priorities, ESG, African CEOs, social actions, environmental impact
false
Market Analysis and Trends
Environmental Services & Sustainability
Multiple Chart
Deloitte
Add to my slides
Remove from favorites
This slide features six column charts with face icons representing different focus areas of companies. The charts are color-coded in shades of blue.
Industry Overview
Environmental Services & Sustainability
The slide presents statistics on the current focus areas of companies for responsible production. It highlights the emphasis on sustainable materials and solutions within the supply chain.
Sustainability, Production, Focus Areas, Companies, Supply Chain
false
Industry Overview
Environmental Services & Sustainability
Single Chart
Deloitte
Add to my slides
Remove from favorites
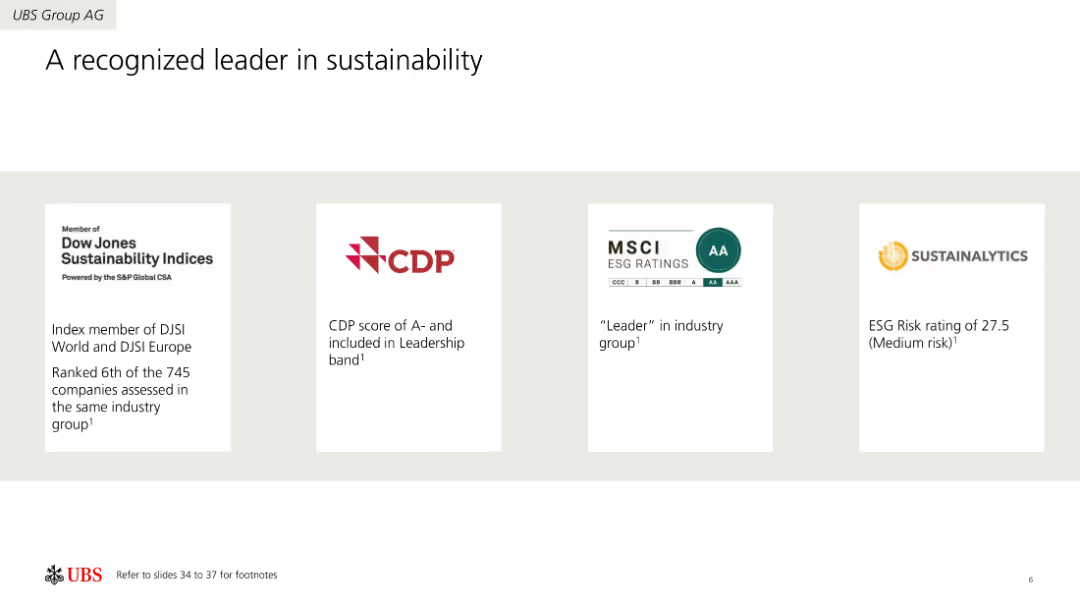
Four-column layout showcasing sustainability ratings and recognitions from different organizations like Dow Jones, CDP, MSCI, and Sustainalytics. Each column includes a logo and a brief description of the recognition.
Industry Overview
Environmental Services & Sustainability
Highlights UBS Group AG's achievements in sustainability, recognized by various rating agencies. Includes information on ratings, scores, and leadership positions in the sustainability sector.
Sustainability, Ratings, Recognition, Environment, Leadership, Achievements
false
Industry Overview
Environmental Services & Sustainability
Pillar
UBS
Add to my slides
Remove from favorites
Dark green background with white and green text, a comparative table with percentage values of different sustainability behaviors across age groups.
Regulatory and Compliance
Consumer Goods
The slide examines top behaviors for personal sustainability among different age groups, emphasizing the importance of recycling and the preference for refurbished or rental models.
Sustainability, recycling, consumer behavior, age groups, survey
false
Regulatory and Compliance
Consumer Goods
Single Chart
Oliver Wyman
Add to my slides
Remove from favorites
Slide features icons and segmented text areas discussing the impact of regulations, customer expectations, and investors on business transformations towards sustainability.
Strategic Planning
Environmental Services & Sustainability
Explores the driving factors pushing companies towards sustainability, including new regulations, changing customer expectations, and investment shifts. The slide aims to illustrate the interconnectedness of these drivers and their cumulative impact on business practices.
sustainability, regulations, business impact, customer expectations, investors
false
Strategic Planning
Environmental Services & Sustainability
Pillar
Accenture
Add to my slides
Remove from favorites
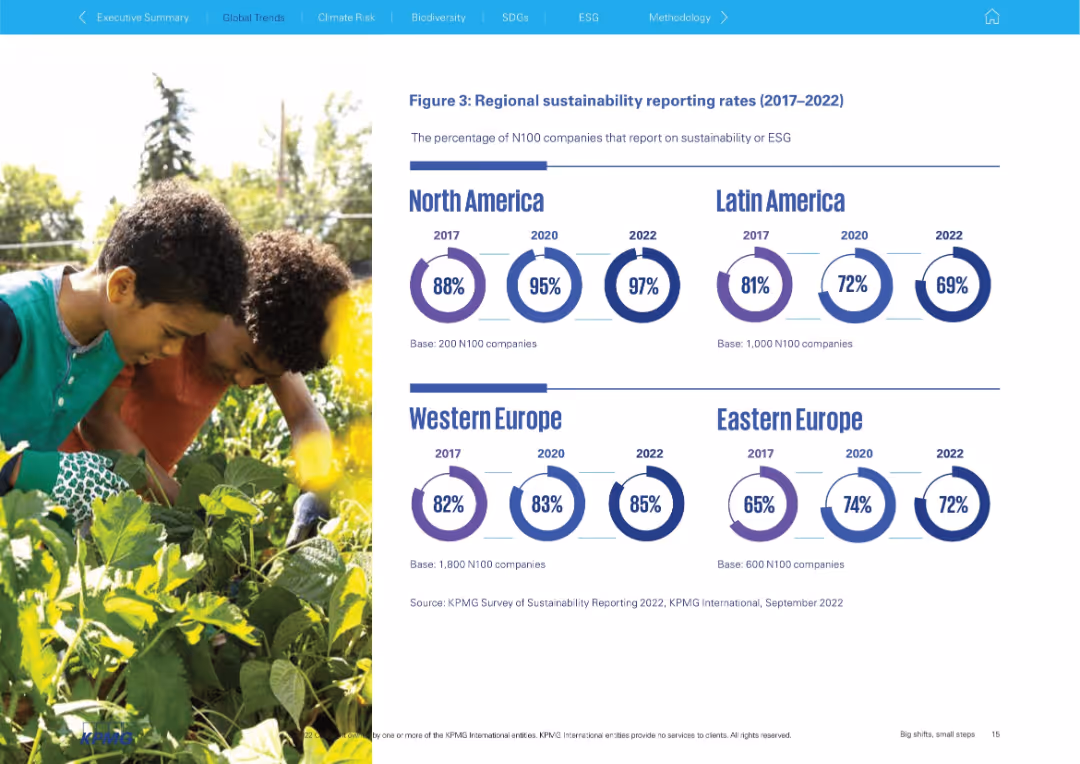
Right-side infographic of circular progress visuals by region; left side features a background image of children gardening
Performance Metrics and KPIs
Professional Services
The slide displays regional sustainability reporting rates of N100 companies between 2017 and 2022 using circular visualizations. North America shows the highest rate (97% in 2022), while Latin America has declined. Eastern and Western Europe are also covered.
sustainability reporting, ESG, regional comparison, North America, Latin America, Europe, N100, time-series
false
Performance Metrics and KPIs
Professional Services
Mixed Chart
KPMG
Add to my slides
Remove from favorites
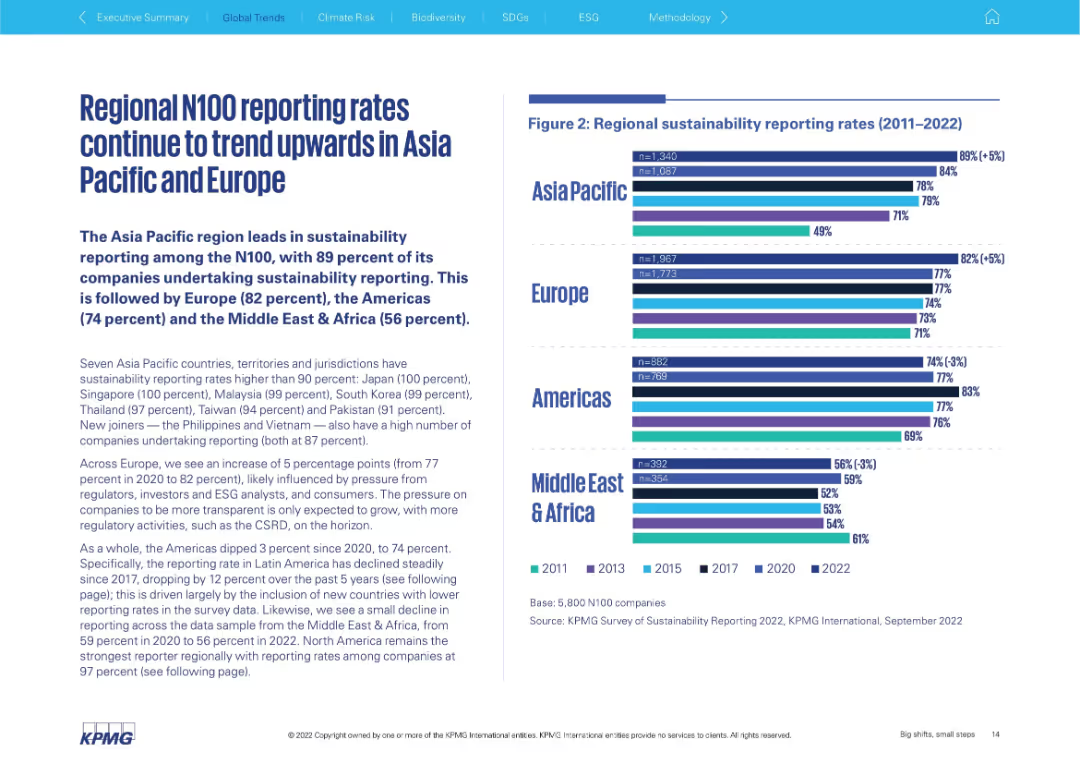
Two-panel layout; left side features bold headline and paragraph text, right side has horizontal bar chart (2011–2022) segmented by region
Performance Metrics and KPIs
Professional Services
This slide shows how sustainability reporting rates among N100 companies have increased across regions, with Asia Pacific and Europe leading. It presents specific country-level reporting stats and discusses the pressure to adopt transparency practices. A bar chart illustrates regional progress from 2011 to 2022.
sustainability, reporting rates, Asia Pacific, Europe, N100, ESG, transparency, benchmarking, regional trends
false
Performance Metrics and KPIs
Professional Services
Mixed Chart
KPMG
Add to my slides
Remove from favorites
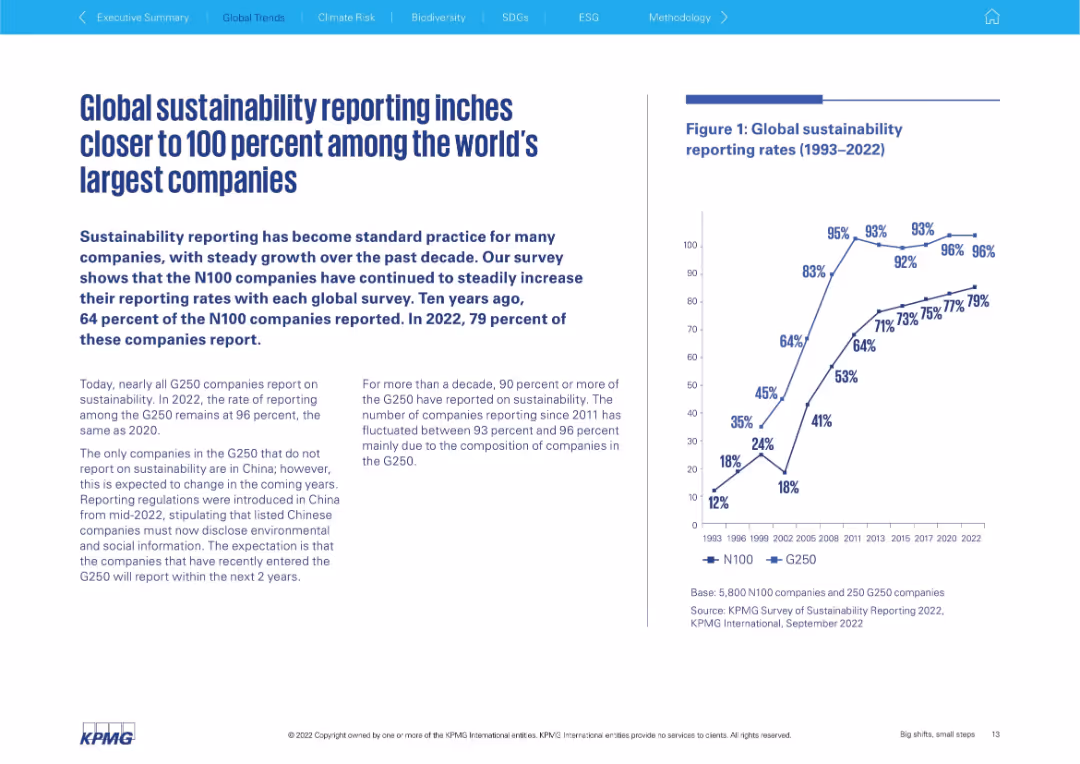
Bar and line chart showing global sustainability reporting rates; accompanying text elaborates on survey findings.
Market Analysis and Trends
Professional Services
Demonstrates growing global adoption of sustainability reporting among the world's largest companies, based on KPMG’s global surveys. Shows long-term trend from 1993 to 2022, with reporting rates climbing steadily toward 100%. Discusses regional and sector differences, especially the role of regulation in driving disclosure.
sustainability reporting, trends, ESG, corporate reporting, N100, G250, global survey, KPMG, compliance
false
Market Analysis and Trends
Professional Services
Mixed Chart
KPMG
Add to my slides
Remove from favorites
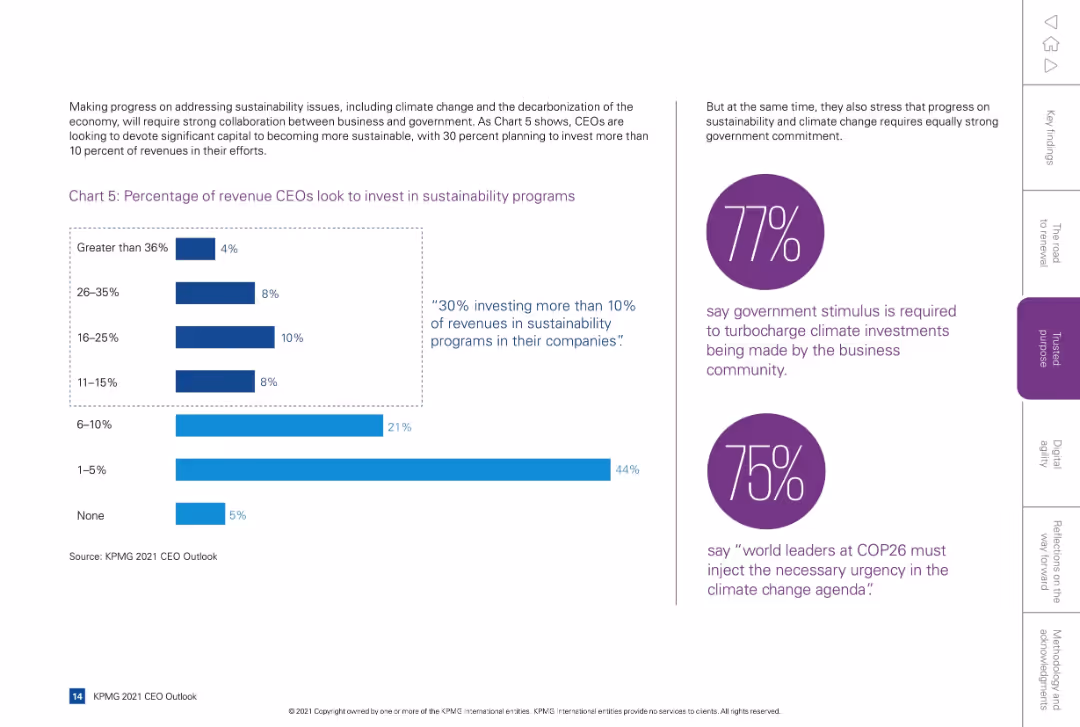
Split layout: left side with bar chart and supporting text, right side has two purple circular callouts with statistics and quotes.
Regulatory and Compliance
Environmental Services & Sustainability
Shows CEO intentions to invest revenue in sustainability programs, with 30% allocating more than 10%. Also emphasizes business-government collaboration on climate issues, highlighting expectations for government stimulus and leadership.
sustainability, revenue allocation, ESG, investment, climate, government
false
Regulatory and Compliance
Environmental Services & Sustainability
Mixed Chart
KPMG
Add to my slides
Remove from favorites
Two-column layout with bullet points and graphical elements like a pie chart and stick figures carrying a target on the left.
Market Analysis and Trends
Environmental Services & Sustainability
Outlines the benefits and risks when engaging with sustainable consumption, primarily in the energy sector.
Sustainability, Risks, Leaders, Energy, Consumption, Climate Tech, Green Bonds, Commercialization, Decarbonization
false
Market Analysis and Trends
Environmental Services & Sustainability
Boxed
McKinsey
Add to my slides
Remove from favorites
This slide uses a Venn diagram centered around "Collective action" with segments detailing the roles of "Communities", "Investors", "Governments", and "Businesses". Each segment includes an image and brief descriptive text
Industry Overview
Environmental Services & Sustainability
The slide presents the concept of a sustainable SEA (Southeast Asia), highlighting the necessary individual and collective actions across different societal sectors to achieve sustainability goals.
sustainability, SEA, collective action, governments, businesses
false
Industry Overview
Environmental Services & Sustainability
Framework
Bain
Add to my slides
Remove from favorites
The slide has four quadrants with icons representing Investors, Consumers, Companies, and Governments, detailing their roles in sustainability.
Strategic Planning
Environmental Services & Sustainability
The slide discusses the responsibility each stakeholder group has in the pursuit of sustainability, emphasizing the need for collaboration.
sustainability, stakeholders, investors, consumers, companies, governments
false
Strategic Planning
Environmental Services & Sustainability
Diagram
Bain
Add to my slides
Remove from favorites
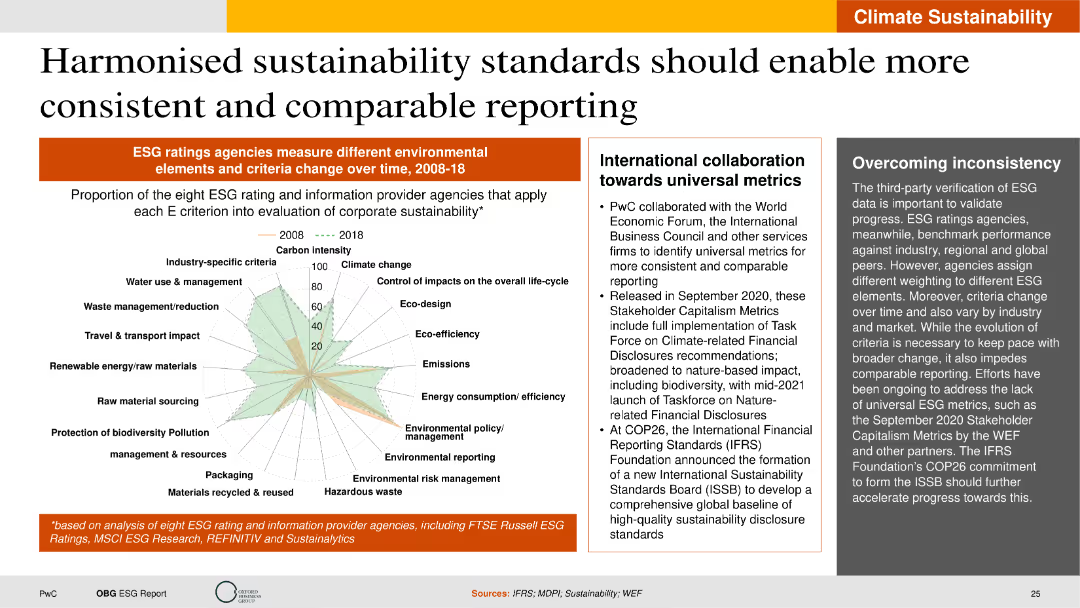
The slide features a radar chart and text boxes, providing a comprehensive view of changes in ESG rating criteria and international collaboration efforts. The layout is clear and structured.
Regulatory and Compliance
Environmental Services & Sustainability
This slide discusses the need for harmonized sustainability standards to improve the consistency and comparability of ESG reporting. It presents a radar chart showing changes in ESG rating criteria over time and outlines international collaboration efforts towards universal metrics. The slide emphasizes the importance of standardized methodologies for validating and comparing ESG performance across different industries and regions.
Sustainability standards, ESG reporting, international collaboration, universal metrics
false
Regulatory and Compliance
Environmental Services & Sustainability
Mixed Chart
PwC/Strategy&
Add to my slides
Remove from favorites
This slide includes a Venn diagram of "2020 Strategy" and "Good Growth," emphasizing sustainability with icons for performance, people, products, planet, and purpose around it.
Strategic Planning
Consumer Goods
Presents the Clorox Company's strategy focused on profitability, sustainability, and responsibility through environmental, social, and governance commitments. Useful for presenting company values and strategic direction.
sustainability, strategy, ESG, profitability, Clorox
false
Strategic Planning
Consumer Goods
Framework
Barclays
Add to my slides
Remove from favorites
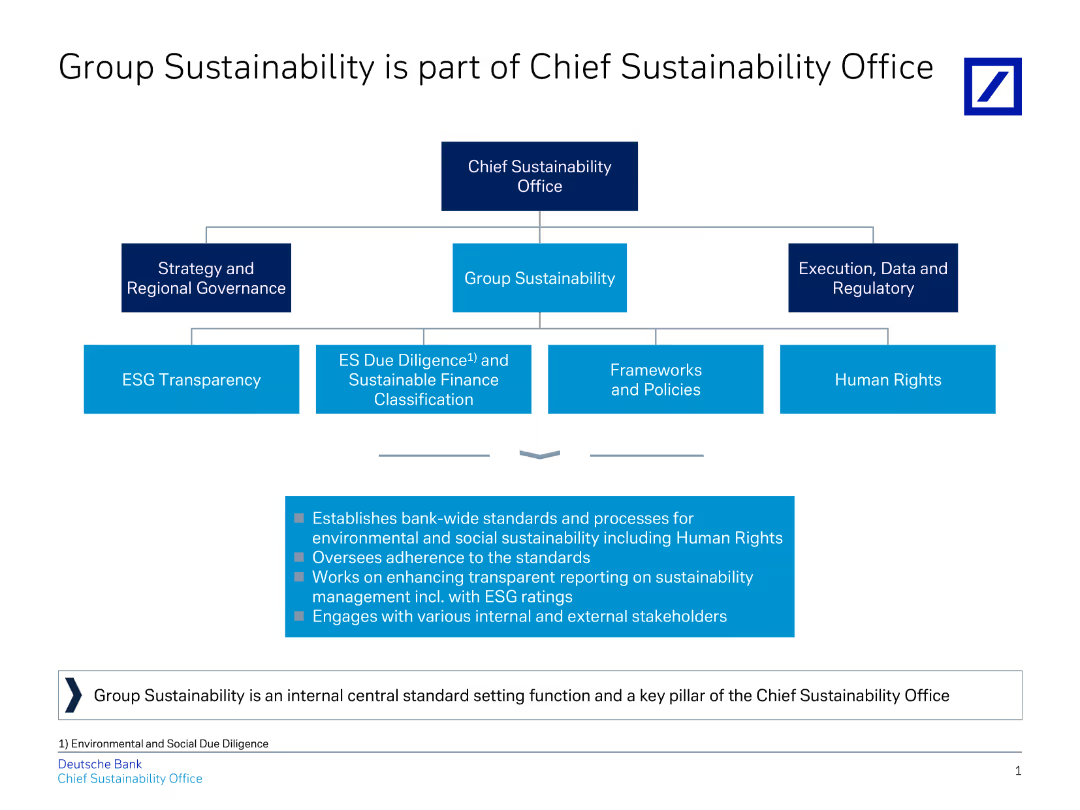
The slide presents an organizational structure chart of the Chief Sustainability Office, detailing its various divisions and responsibilities.
Strategic Planning
Financial Services
This slide outlines the components and functions of Deutsche Bank's Chief Sustainability Office, emphasizing their role in setting and maintaining sustainability standards.
Sustainability, structure, governance, transparency, policies, human rights, ESG, banking, strategy, organization
false
Strategic Planning
Financial Services
Diagram
Deutsche Bank
Add to my slides
Remove from favorites
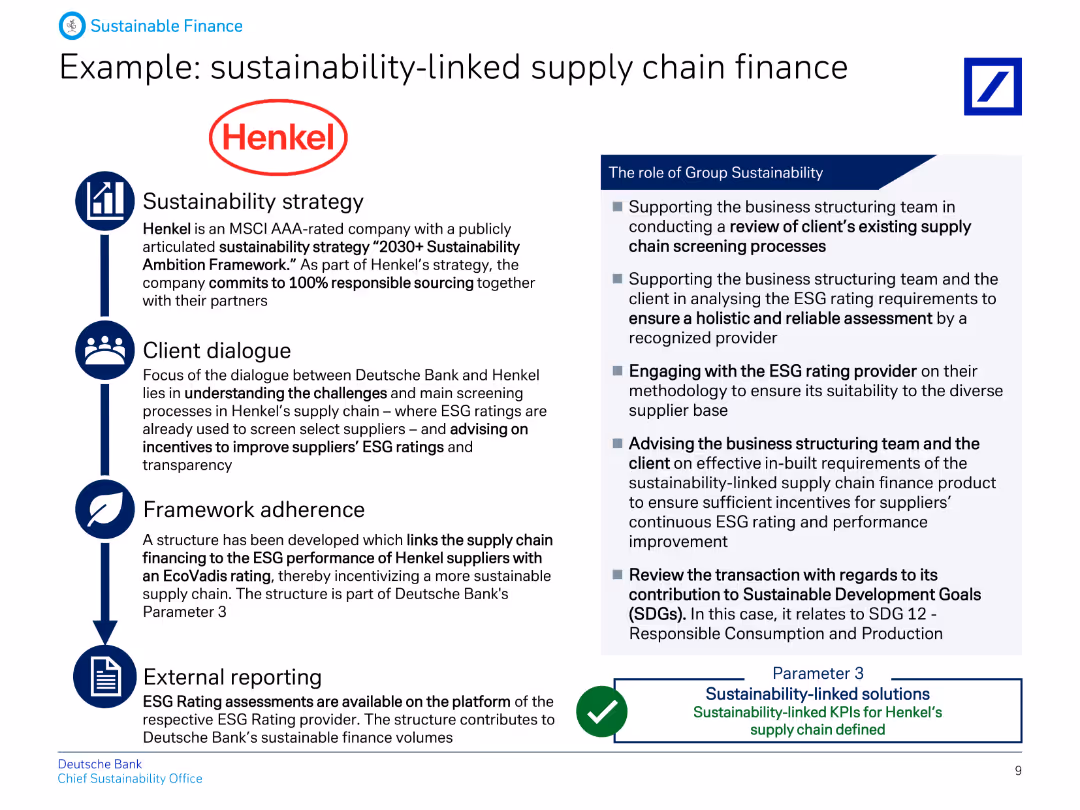
This slide presents a case study with Henkel, detailing their sustainability strategy, client dialogue, framework adherence, and external reporting, with relevant icons.
Client Case Studies
Financial Services
Provides an example of how Deutsche Bank supports Henkel in sustainability-linked supply chain finance, outlining the strategy, client dialogue, framework adherence, and reporting.
Sustainability, supply chain, finance, Henkel, strategy, client, framework, reporting, banking, ESG
false
Client Case Studies
Financial Services
Vertical Flow
Deutsche Bank
Add to my slides
Remove from favorites
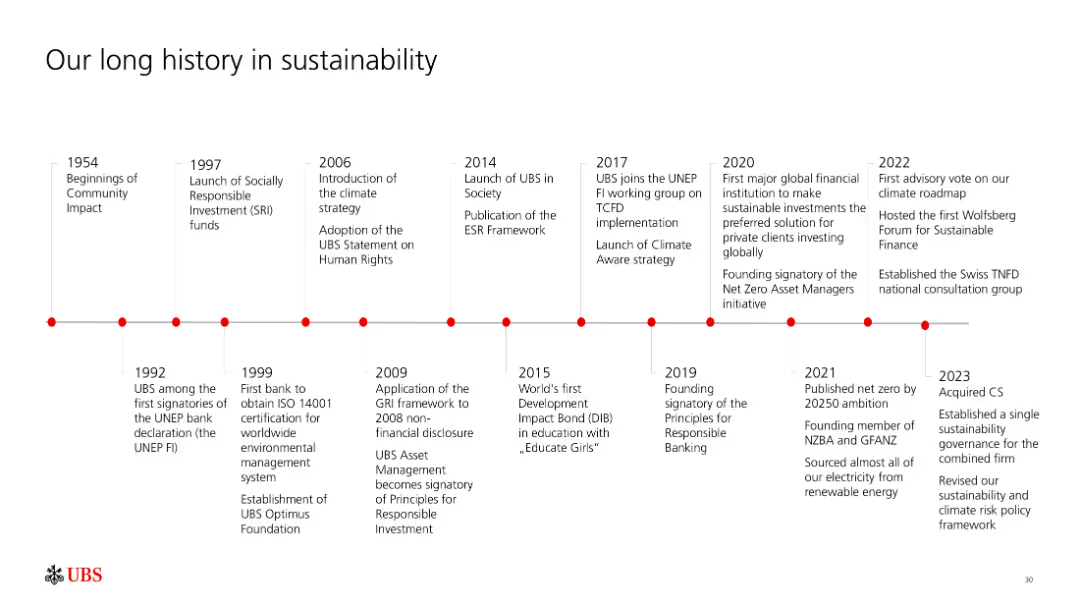
This slide features a timeline depicting UBS's milestones and achievements in sustainability, spanning from 1954 to 2023.
Strategic Planning
Financial Services
It highlights key moments in UBS's sustainability journey, including the launch of socially responsible investment funds, environmental certifications, and sustainability initiatives.
Sustainability, timeline, UBS, milestones, history
false
Strategic Planning
Financial Services
Linear Flow
UBS
Add to my slides
Remove from favorites
Includes pie chart and infographics detailing the pursuit of sustainability in the travel industry, like green preferences and SAFs.
Operational Efficiency
Transportation & Logistics
Examines how sustainability drives consumer choices and industry responses, focusing on green travel options and emission reduction goals.
sustainability, travel industry, green travel, emissions, SAFs, consumer preferences
false
Operational Efficiency
Transportation & Logistics
Mixed Chart
BCG
Add to my slides
Remove from favorites
This slide uses a timeline format to detail significant events in Tyson's sustainability efforts, marked by circular nodes. The visual arrangement is clear and orderly, using colors to differentiate dates and events, which enhances readability.
Regulatory and Compliance
Environmental Services & Sustainability
Outlines key milestones in Tyson's sustainability journey, including appointments, program rollouts, and strategic partnerships. This slide is likely aimed at stakeholders interested in corporate responsibility, providing a concise overview of Tyson's commitment to environmental and social initiatives.
Sustainability, Tyson, Corporate Responsibility, Milestones, Timeline
false
Regulatory and Compliance
Environmental Services & Sustainability
Linear Flow
Barclays
Add to my slides
Remove from favorites
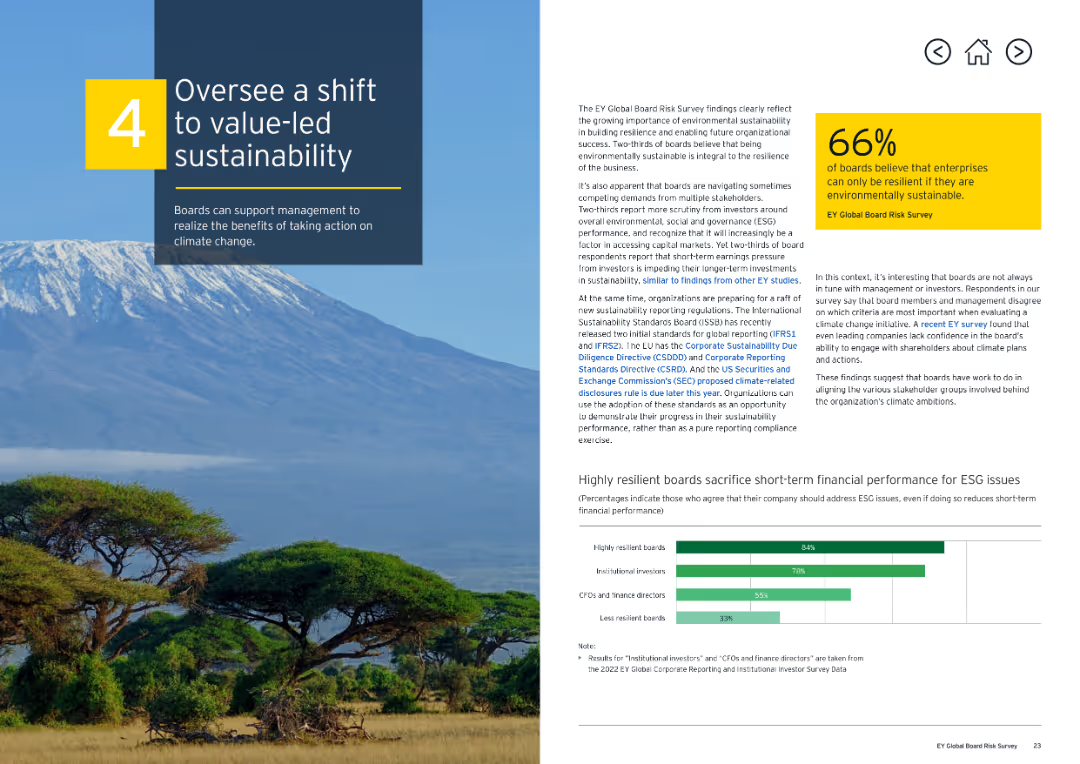
The slide features a large image of a natural landscape with a mountain in the background on the left side. On the right, there is a text block with bullet points and a column chart below.
Strategic Planning
Environmental Services & Sustainability
The slide discusses the importance of value-led sustainability for boards and highlights findings from the EY Global Board Risk Survey. It includes a statistic indicating that 66% of boards believe environmental sustainability is crucial.
sustainability, value-led, climate change, boards, ESG
false
Strategic Planning
Environmental Services & Sustainability
Mixed Chart
EY
Add to my slides
Remove from favorites
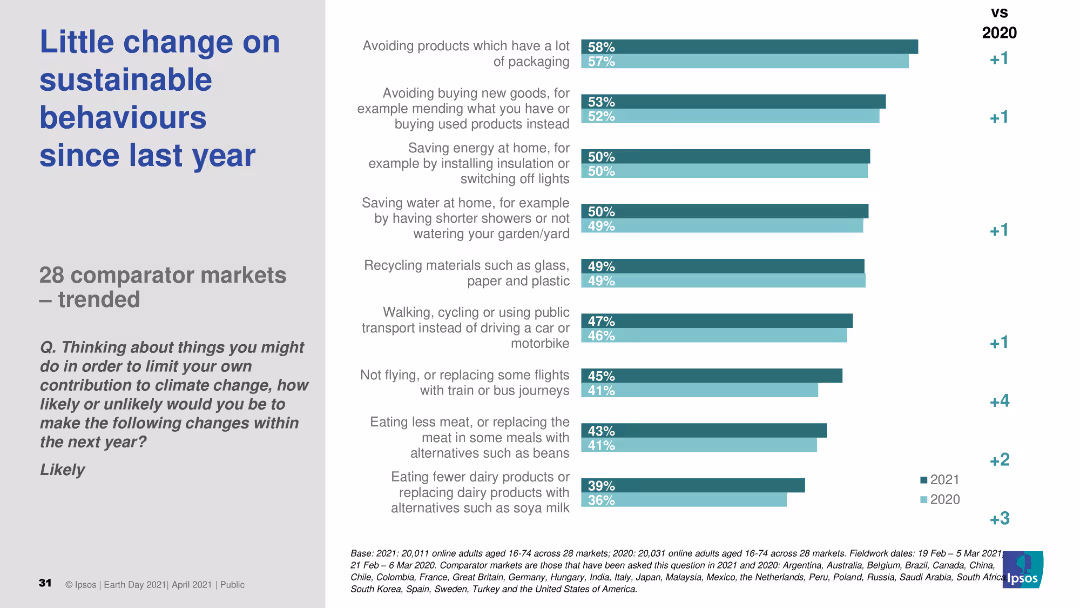
The slide features a column chart comparing sustainable behavior changes across 28 markets from 2020 to 2021. The chart displays percentages for different actions, with a comparison to the previous year.
Market Analysis and Trends
Environmental Services & Sustainability
The slide shows survey results on sustainable behaviors across 28 markets, indicating little change in engagement from 2020 to 2021.
sustainable behaviors, market trends, survey, year comparison, 2021
false
Market Analysis and Trends
Environmental Services & Sustainability
Single Chart
IPSOS
Add to my slides
Remove from favorites
A line chart comparing the percentage of remote workers versus those working away from home who engage in sustainable shopping behaviors, such as buying eco-friendly products and checking for sustainability certifications.
Market Analysis and Trends
Consumer Goods
The slide analyzes the sustainable shopping behaviors of remote workers compared to those who work away from home, showing trends in eco-friendly purchasing and awareness of product sustainability.
sustainable behaviors, remote workers, eco-friendly, shopping habits, sustainability awareness
false
Market Analysis and Trends
Consumer Goods
Mixed Chart
PwC/Strategy&
Add to my slides
Remove from favorites
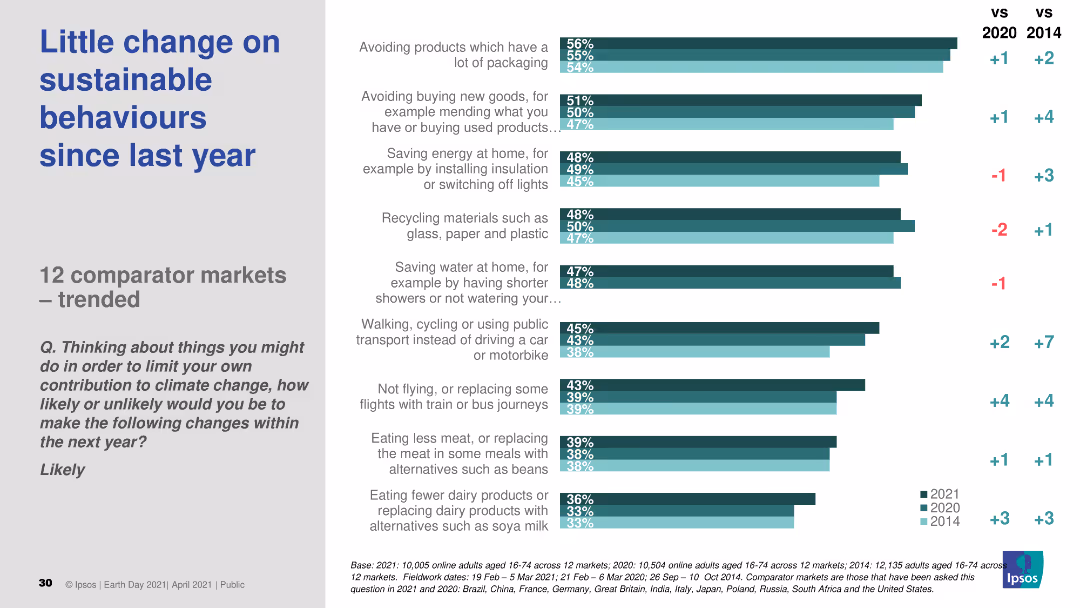
This slide contains a column chart comparing the likelihood of engaging in sustainable behaviors in 2021 versus previous years (2020 and 2014). The chart uses bars to show percentages for various actions and comparisons over the years.
Market Analysis and Trends
Environmental Services & Sustainability
The slide presents survey data on sustainable behaviors, comparing the likelihood of various actions in 2021 to those in 2020 and 2014, across 12 comparator markets.
sustainable behaviors, trends, survey, market comparison, years
false
Market Analysis and Trends
Environmental Services & Sustainability
Single Chart
IPSOS
Add to my slides
Remove from favorites
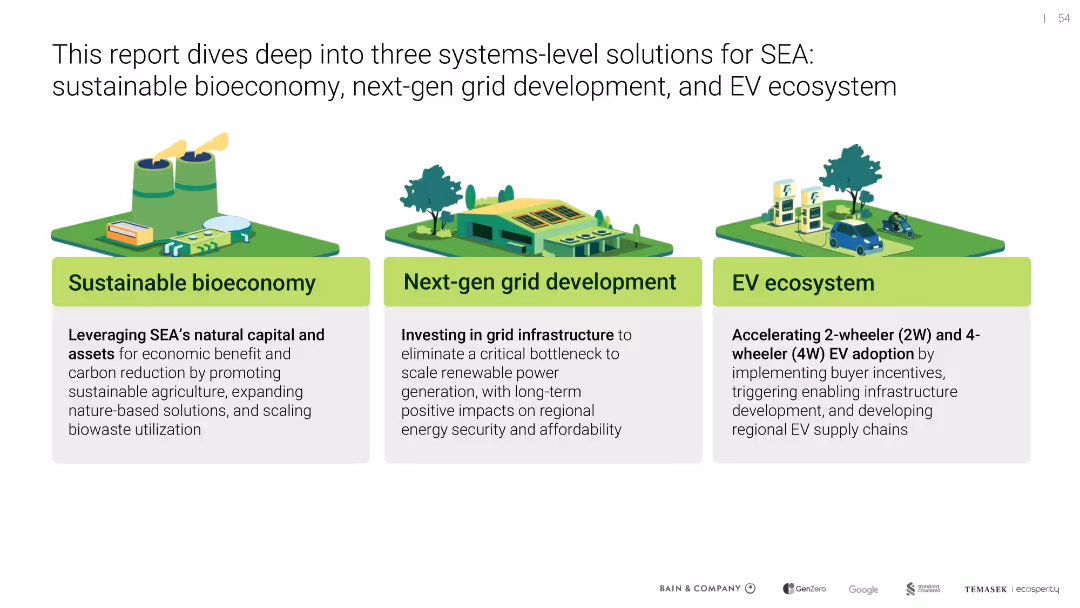
Horizontal 3-column layout with colorful illustrations and bolded subheads in green boxes; iconography for each solution
Strategic Planning
Environmental Services & Sustainability
The slide introduces three system-level solutions for Southeast Asia (SEA): sustainable bioeconomy, next-gen grid development, and EV ecosystem. Each is summarized with emphasis on carbon reduction, infrastructure investment, and EV adoption, highlighting their economic and environmental potential.
sustainable bioeconomy, grid development, EV adoption, carbon reduction, Southeast Asia, green infrastructure, electric vehicles
false
Strategic Planning
Environmental Services & Sustainability
Pillar
Bain
Add to my slides
Remove from favorites
A descriptive page featuring key issuance metrics for sustainable bonds, a summary table, and a column chart with minimal design elements.
Corporate Finance and Valuation
Financial Services
The slide provides details on JPMorgan Chase’s sustainable bond issuances and their environmental impact, highlighting key financials and project types for investor relations and reporting.
sustainable bond, JPMorgan Chase, environmental impact, finance, investment, green projects, annual report, key metrics
false
Corporate Finance and Valuation
Financial Services
Table
JP Morgan
Add to my slides
Remove from favorites
Slide with a central circular segmented diagram depicting a cycle of services, development, construction, and investment around sustainable urban development. Three text sections flank the diagram, detailing strategic approaches. To the right, a background image of a city skyline.
Strategic Planning
Government & Public Sector
Discusses strategies for enhancing the sustainability of urban environments through service improvements, asset growth, and development. For urban development and sustainable city planning presentations.
sustainable cities, urban development, construction, investment, services, asset management, growth strategy, partnerships, project development
false
Strategic Planning
Government & Public Sector
Linear Flow
Goldman Sachs
Add to my slides
Remove from favorites
The slide includes an image of a person holding a green plant, with two columns of text and a trend assessment.
Operational Efficiency
Consumer Goods
Explains the concept of sustainable consumption, focusing on the importance of eco-friendly practices and consumer expectations.
Sustainable Consumption, Eco-friendly, Consumer Expectations, Greenwashing, Ethical Consumption, Sustainability
false
Operational Efficiency
Consumer Goods
Multiple Chart
Deloitte
Add to my slides
Remove from favorites
An explanatory slide with bullet points detailing patterns of consumption. Utilizes icons and contrasting colors to differentiate topics.
Market Analysis and Trends
Environmental Services & Sustainability
Explains sustainable consumption trends. Can be used for environmental impact analyses in market studies.
sustainable consumption, low carbon, biobased, biodegradable, market analysis
false
Market Analysis and Trends
Environmental Services & Sustainability
Header Horizontal
McKinsey
Add to my slides
Remove from favorites
Bubble chart comparing CAGR and product penetration for sustainable vs. conventional products.
Market Analysis and Trends
Environmental Services & Sustainability
Bubble chart illustrating how sustainable products are gaining higher market penetration and faster growth compared to conventional ones. Emphasizes accelerating demand for bio-based, recycled, or renewable offerings.
Sustainable demand, CAGR, penetration, bubble chart, green growth
false
Market Analysis and Trends
Environmental Services & Sustainability
Single Chart
Accenture
Add to my slides
Remove from favorites
Three content boxes with lists, checkmarks, and two column charts. Header and footer text are present. The slide is evenly spaced.
Strategic Planning
Financial Services
Discusses commitments to green financing, renewable energy, and sustainable development focus areas with financial goals.
Sustainable development, green financing, renewable energy, business practices
false
Strategic Planning
Financial Services
Diagram
JP Morgan
Add to my slides
Remove from favorites
Contains a mixture of images and text, with highlighted numerical targets and progress indicators in bold fonts, set against a background image of solar panels, which implies a green investment focus.
Corporate Finance and Valuation
Financial Services
Highlights a financial firm’s goals and progress in sustainable and inclusive economic practices, ideal for investor relations or sustainability reporting.
Sustainable Development, Green Goals, Community, Racial Equity, Investment
false
Corporate Finance and Valuation
Financial Services
Mixed Chart
JP Morgan
Add to my slides
Remove from favorites
This slide visually summarizes with icons and brief texts the continued focus on sustainable farming, linking back to the broader discussions from previous slides.
Market Analysis and Trends
Agriculture & Food Production
Wrapping up the segment on sustainable farming, this slide revisits key investment opportunities and strategic actions required to foster growth and scalability in the sector. It serves as a summary for investors and policymakers, linking back to detailed discussions in earlier slides, and highlighting the ongoing importance of sustainable practices in agriculture.
sustainable farming, investment, growth, scalability, strategic actions, summary, agriculture
false
Market Analysis and Trends
Agriculture & Food Production
Header Horizontal
Bain
Add to my slides
Remove from favorites
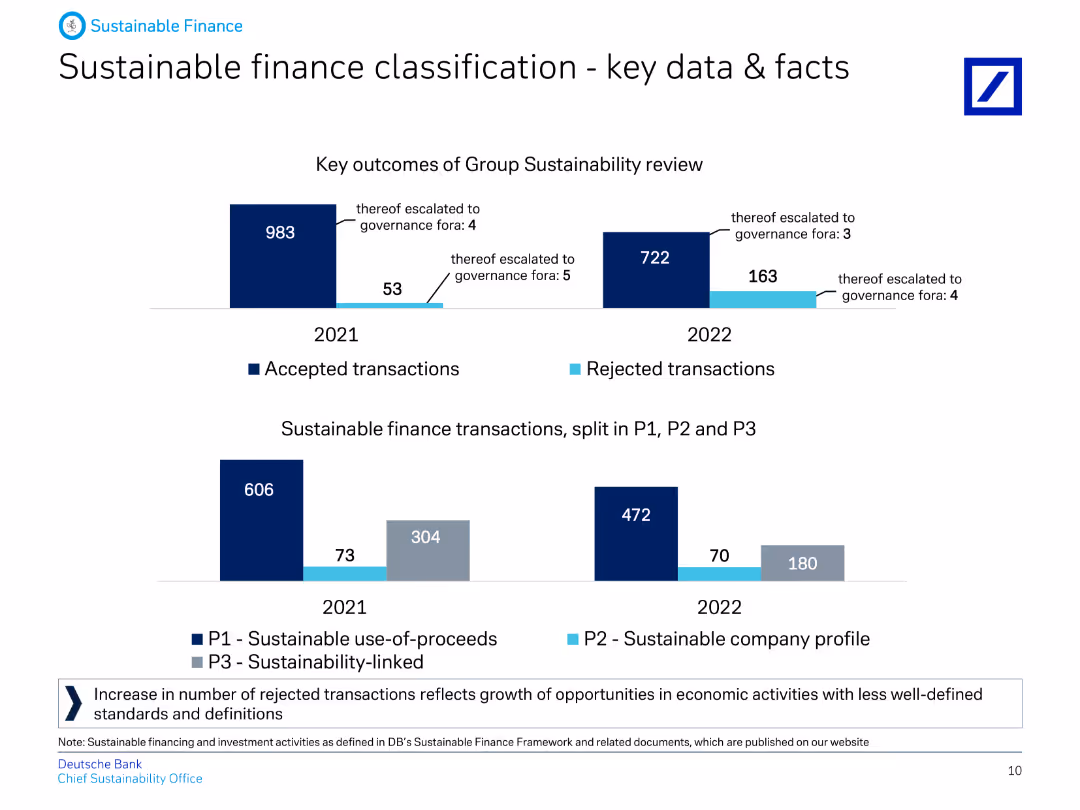
The slide includes column charts comparing accepted and rejected transactions for sustainable finance across 2021 and 2022, with detailed categorization of transaction types.
Regulatory and Compliance
Financial Services
It outlines key data and facts about sustainable finance classifications, showing accepted vs. rejected transactions and their categorization into P1, P2, and P3 classifications.
sustainable finance, accepted transactions, rejected transactions, classification, P1, P2, P3, regulatory compliance
false
Regulatory and Compliance
Financial Services
Multiple Chart
Deutsche Bank
Add to my slides
Remove from favorites
The slide showcases hexagonal shapes arranged in a honeycomb pattern, each containing a different aspect of sustainable finance such as "Clean Energy" and "Financial Inclusion." The layout is clean and visually focuses on the concept of "Climate Transition."
Investment Analysis
Government & Public Sector
It discusses Goldman Sachs' approach to sustainable finance, with a goal of $750 billion by 2030. This slide is ideal for discussing environmental, social, and governance (ESG) investment strategies, highlighting how finance can support inclusive growth and climate transition.
sustainable finance, ESG, Goldman Sachs, climate transition, inclusion
false
Investment Analysis
Government & Public Sector
Text Only
Goldman Sachs
Add to my slides
Remove from favorites
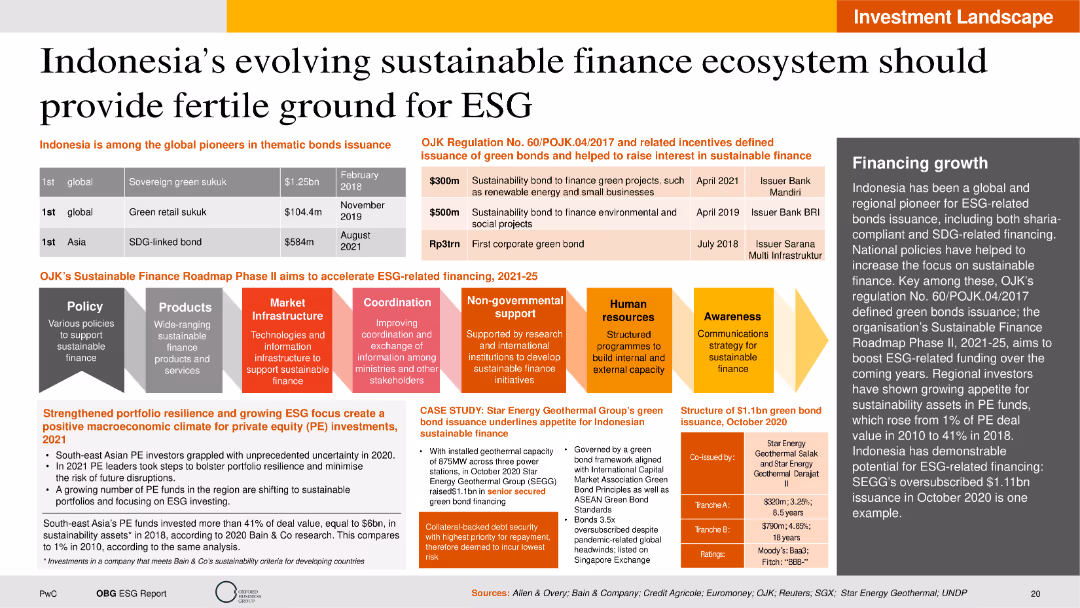
The slide is visually dense with a mix of tables, column charts, and process diagrams. It includes a structured presentation of statistics on thematic bonds issuance and a strategic roadmap for sustainable finance.
Strategic Planning
Financial Services
This slide covers the development of Indonesia’s sustainable finance ecosystem and its potential for fostering ESG investments. It details the issuance of thematic bonds, the implementation of regulatory frameworks, and the Sustainable Finance Roadmap Phase II. The slide also includes case studies and structural details of green bond issuance, emphasizing Indonesia's growth in ESG-related financing.
Sustainable finance, ESG, thematic bonds, regulatory framework, case study
false
Strategic Planning
Financial Services
Linear Flow
PwC/Strategy&
Add to my slides
Remove from favorites
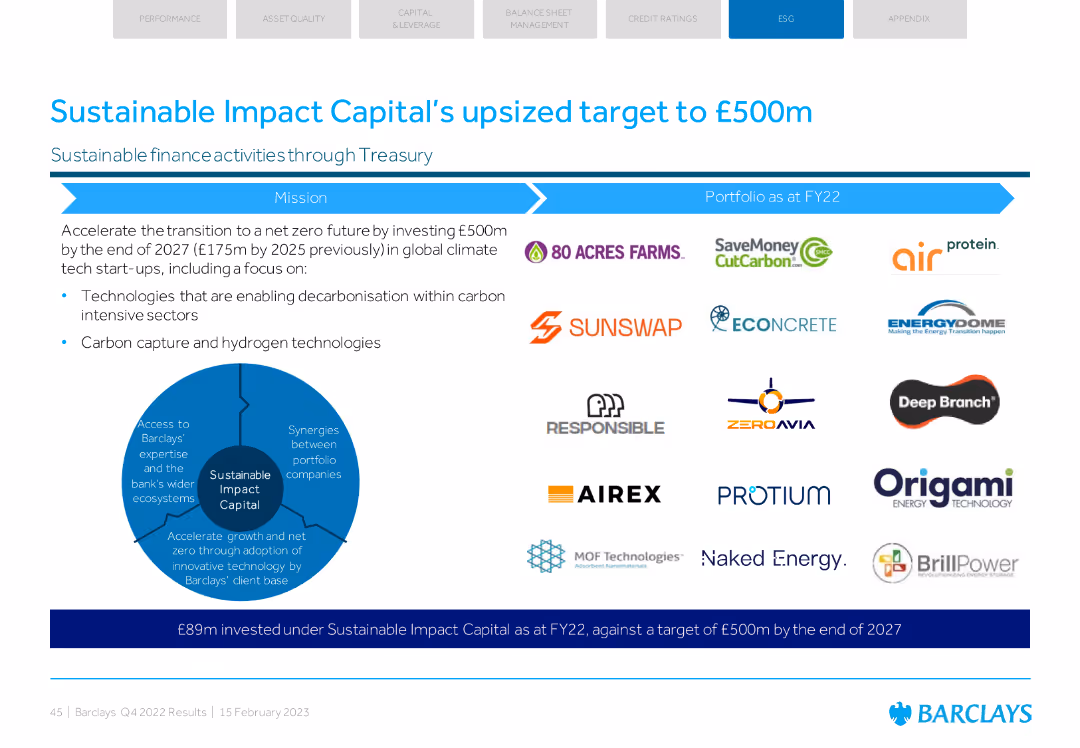
Text and icons depicting sustainable finance activities and portfolio companies.
Regulatory and Compliance
Financial Services
Describes the increased investment target for Sustainable Impact Capital and the focus areas such as decarbonization and carbon capture.
sustainable finance, impact capital, investment, decarbonization, carbon capture
false
Regulatory and Compliance
Financial Services
Vertical Flow
Barclays
Add to my slides
Remove from favorites
A central black board with sections radiating outwards details client priorities and sustainable finance offerings, alongside a narrative of client solutions on the right.
Client Case Studies
Financial Services
Highlights a case study on sustainable finance, showing client priorities and the firm’s sustainable offerings in various business sectors.
Sustainable, Finance, Investment, Asset, Wealth, Management, Solutions, Client
false
Client Case Studies
Financial Services
Table
Goldman Sachs
Add to my slides
Remove from favorites
Includes column charts displaying the growth of green and sustainable financing at Barclays over the years.
Investment Analysis
Financial Services
Reviews Barclays' achievements in green and sustainable financing, detailing annual progress and future targets.
sustainable financing, green bonds, investment, financial services, growth, targets, environmental impact
false
Investment Analysis
Financial Services
Multiple Chart
Barclays
Add to my slides
Remove from favorites
Displays stacked bar graphs comparing sustainable fuel demand by sector and feedstock type, with a clear legend and annotations.
Investment Analysis
Energy & Utilities
Highlights the demand for different types of sustainable fuel feedstocks, which is critical information for investors considering the bioenergy sector.
Sustainable Fuels, Bioenergy, Feedstock Demand, Investment Analysis, Sector Comparison, 2050 Trends
false
Investment Analysis
Energy & Utilities
Multiple Chart
McKinsey
Add to my slides
Remove from favorites
This slide contains three graphs with a legend. The left graph has a vertical axis representing percentages and a horizontal axis showing years. The middle and right graphs have similar axes but represent different metrics. All three use blue tones and lines of varying styles for distinction.
Market Analysis and Trends
Energy & Utilities
The slide projects the growth of sustainable fuels, hydrogen, and CCUS across different future scenarios. It emphasizes the significant increase after 2030 and shows comparisons in global hydrogen demand and global CCUS uptake by scenario.
Sustainable Fuels, Hydrogen, CCUS, Energy Transition, Global Demand, 2050, Scenarios, Decarbonization, Growth Projections
true
Market Analysis and Trends
Energy & Utilities
Multiple Chart
McKinsey
Add to my slides
Remove from favorites
The slide features pie charts showing improvements in self-confidence, presentation skills, and business networking skills for participants in the program.
Regulatory and Compliance
Environmental Services & Sustainability
The slide highlights the Sustainable Futures program, which supports young people in achieving DEI goals and understanding business sustainability practices.
Sustainable Futures, DEI, business sustainability, skills development
false
Regulatory and Compliance
Environmental Services & Sustainability
Multiple Chart
EY
Add to my slides
Remove from favorites
The slide has two sections. The first discusses 'Earthshots' with a chart on capital shift, the second, 'Downround IPOs' with a scatter graph showing cost of capital and deal growth. There are links to additional reports.
Investment Analysis
Financial Services
Highlights sustainable investment opportunities termed 'Earthshots' and the trend of downround IPOs, offering strategic insights for investments in sustainability and the tech market landscape.
Sustainable investment, Earthshots, downround IPOs, capital growth, investment trends, technology market, strategic insights, capital shifts, deal growth, sustainability
false
Investment Analysis
Financial Services
Multiple Chart
Morgan Stanley
Add to my slides
Remove from favorites
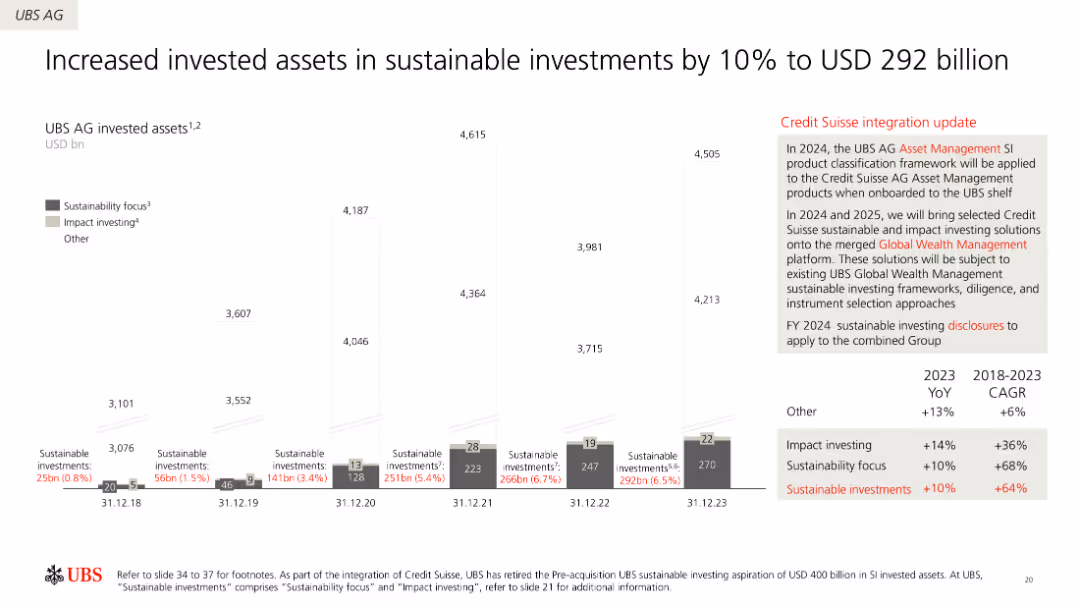
The slide features column charts illustrating the growth of UBS AG's sustainable investments over time, with annotations on impact investing and sustainability focus.
Investment Analysis
Financial Services
This slide highlights UBS AG's increased investments in sustainable assets, including a significant rise in sustainability-focused and impact investing from 2018 to 2023.
Sustainable investments, growth, UBS, impact investing, sustainability focus
false
Investment Analysis
Financial Services
Mixed Chart
UBS
Add to my slides
Remove from favorites
Features images and captions related to sustainable rubber sourcing, statistical data, and information on projects in different regions to improve sustainability in the rubber supply chain.
Market Analysis and Trends
Industrial & Manufacturing
Presents information on Michelin's approach to sustainable natural rubber procurement and their efforts to drive sustainability across the tire industry, including supplier assessments and impact projects.
Sustainable, Natural Rubber, Michelin, Supply Chain, Sustainability, Agriculture, Smallholders, Global Impact, Supplier Assessment, Roadmap 2025
false
Market Analysis and Trends
Industrial & Manufacturing
Header Vertical
Morgan Stanley
Add to my slides
Remove from favorites
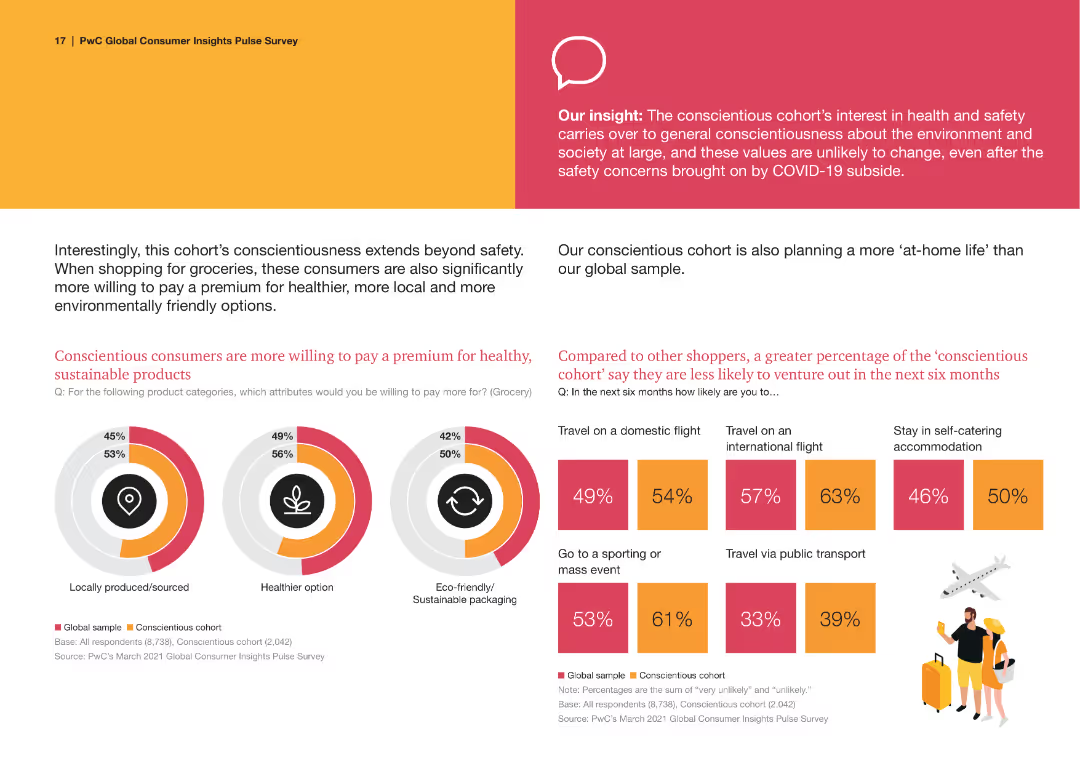
The slide has two circular charts comparing willingness to pay premiums for sustainable products. Text blocks provide additional context. Design is colorful and organized.
Market Analysis and Trends
Consumer Goods
It details how conscientious consumers are more willing to pay for health, local, and eco-friendly products, and their travel habits in the near future.
Sustainable Products, Consumer Preferences, Health, Local Products, Eco-friendly
false
Market Analysis and Trends
Consumer Goods
Multiple Chart
PwC/Strategy&
Add to my slides
Remove from favorites
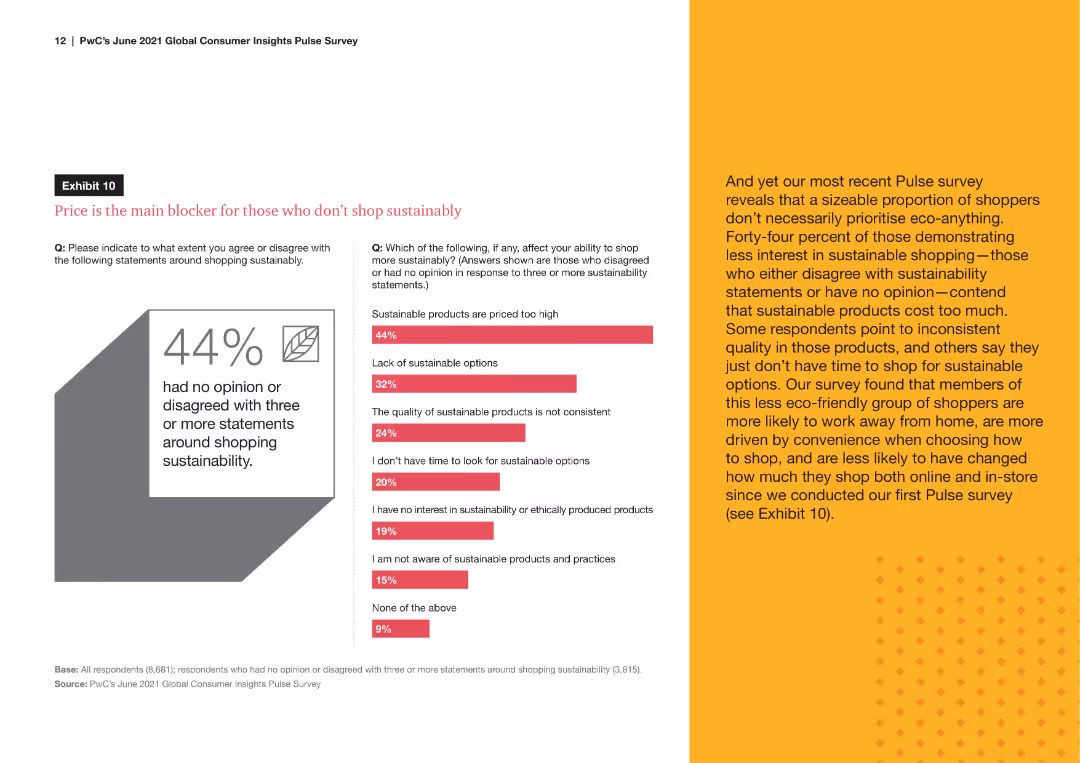
A column chart detailing the main barriers consumers face when it comes to sustainable shopping, such as high prices, lack of options, and inconsistent product quality, with percentages for each barrier.
Market Analysis and Trends
Retail & E-commerce
The slide identifies key barriers preventing consumers from shopping sustainably, emphasizing issues like cost, availability, and quality of sustainable products, based on survey data.
sustainable shopping, consumer barriers, high prices, lack of options, product quality
false
Market Analysis and Trends
Retail & E-commerce
Mixed Chart
PwC/Strategy&
Add to my slides
Remove from favorites
Highlights multiple technologies with circular icons and brief descriptions set against a dark background.
Technology and Digital Transformation
Environmental Services & Sustainability
Details emerging sustainable technologies. Useful for presentations on tech innovation and R&D strategies.
sustainable technology, agriculture, circular economy, green construction, innovation
false
Technology and Digital Transformation
Environmental Services & Sustainability
Header Vertical
McKinsey
Add to my slides
Remove from favorites
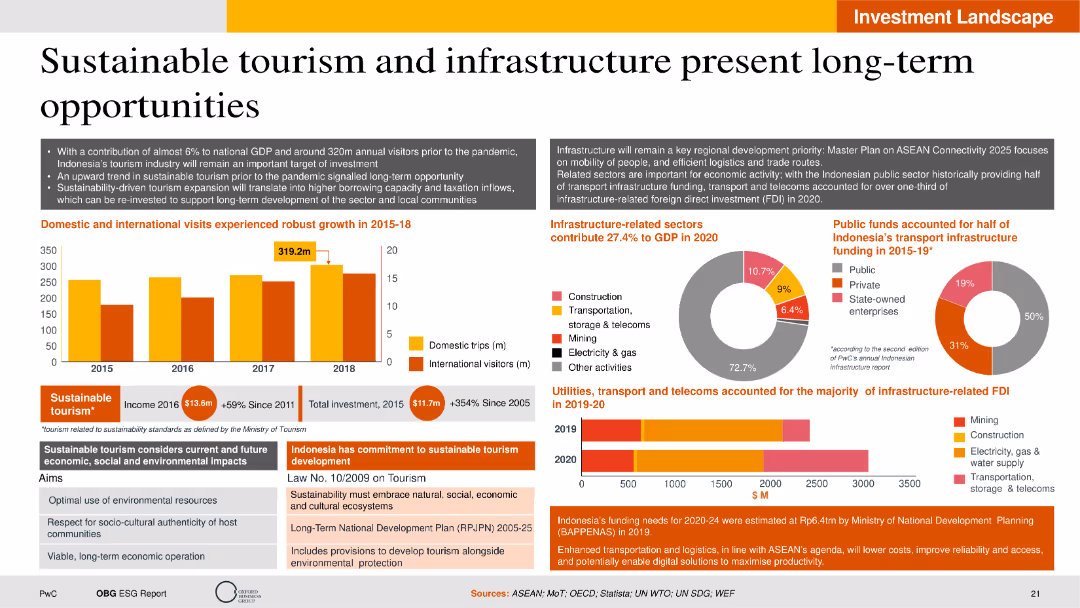
The slide features a combination of column charts, pie charts, and text boxes with a balanced layout. Visual elements highlight domestic and international tourism growth, sector contributions to GDP, and public funding distribution.
Strategic Planning
Hospitality & Tourism
The slide discusses the potential long-term opportunities in sustainable tourism and infrastructure in Indonesia. It presents data on tourism growth, contributions to GDP, and infrastructure-related FDI. The slide also covers Indonesia's commitment to sustainable tourism development, infrastructure-related sector performance, and future investment strategies.
Sustainable tourism, infrastructure, GDP contribution, FDI, development strategy
false
Strategic Planning
Hospitality & Tourism
Multiple Chart
PwC/Strategy&
Add to my slides
Remove from favorites
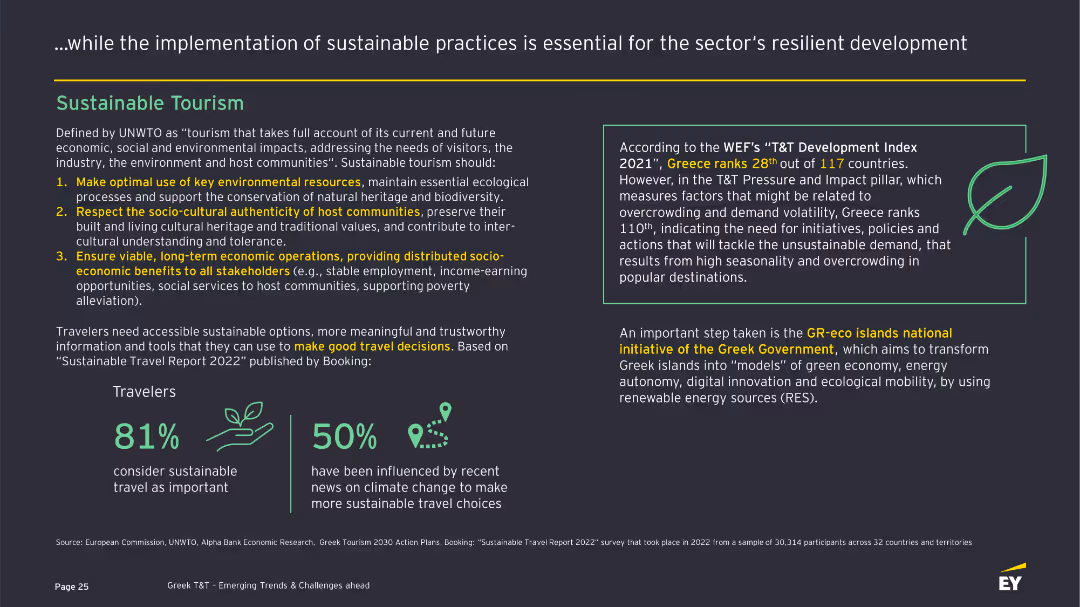
This slide defines sustainable tourism according to UNWTO guidelines, emphasizing economic, social, and environmental impacts. It includes key points on sustainable practices and a box with statistics on sustainable travel preferences among travelers.
Strategic Planning
Hospitality & Tourism
Outlines principles of sustainable tourism, emphasizing the importance of conserving resources, respecting local cultures, and providing socio-economic benefits. It includes data on traveler preferences for sustainable travel options and government initiatives.
Sustainable tourism, UNWTO, Environment, Travelers, Preferences
false
Strategic Planning
Hospitality & Tourism
Vertical Flow
EY
Add to my slides
Remove from favorites
This slide defines sustainable tourism according to UNWTO guidelines, emphasizing economic, social, and environmental impacts. It includes key points on sustainable practices and a box with statistics on sustainable travel preferences among travelers.
Strategic Planning
Hospitality & Tourism
Outlines principles of sustainable tourism, emphasizing the importance of conserving resources, respecting local cultures, and providing socio-economic benefits. It includes data on traveler preferences for sustainable travel options and government initiatives.
Sustainable tourism, UNWTO, Environment, Travelers, Preferences
false
Strategic Planning
Hospitality & Tourism
Mixed Chart
EY
Add to my slides
Remove from favorites
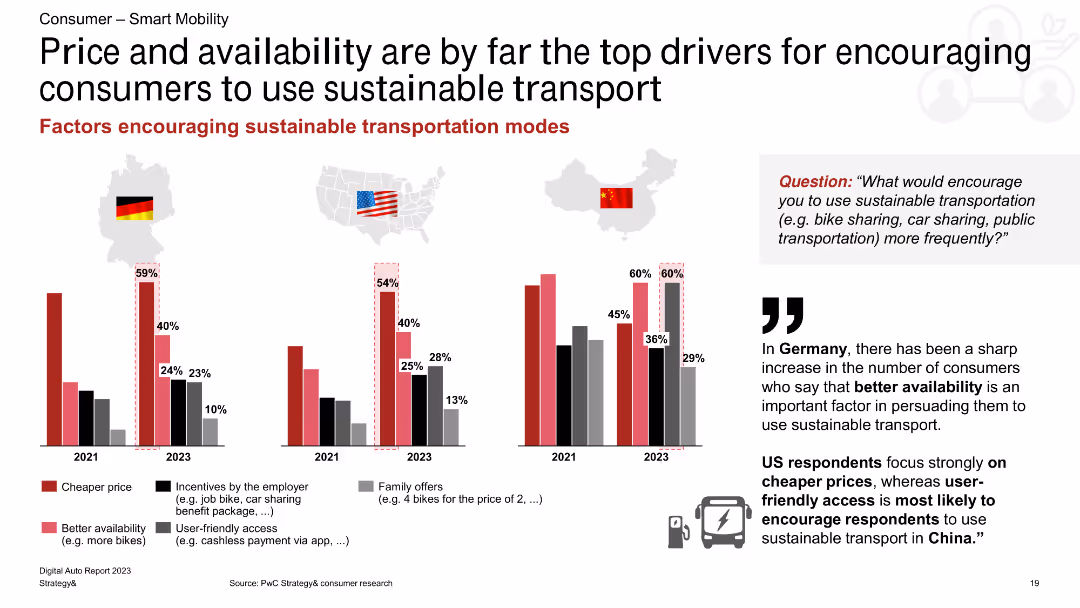
This slide features a column chart showing factors that encourage the use of sustainable transport in Germany, the US, and China, with percentage bars for each factor.
Market Analysis and Trends
Transportation & Logistics
The slide identifies price and availability as the main drivers for encouraging the use of sustainable transport, with regional variations in other motivating factors such as employer incentives and family offers.
sustainable transport, price, availability, incentives, Germany, US, China, consumer behavior, transportation trends
false
Market Analysis and Trends
Transportation & Logistics
Multiple Chart
PwC/Strategy&
Add to my slides
Remove from favorites
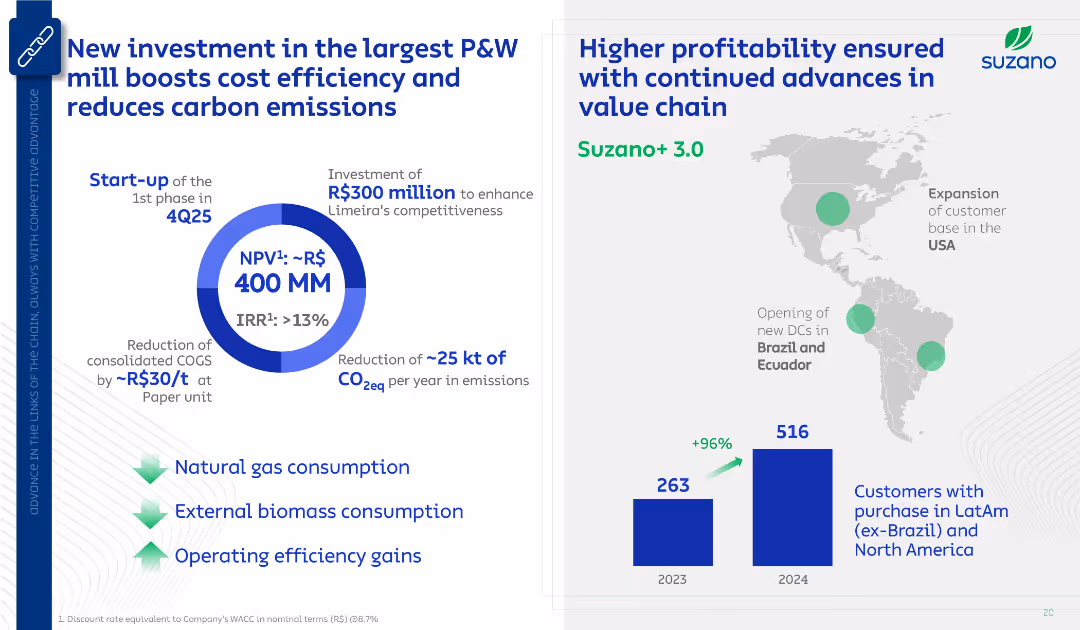
Two-part layout: Left shows investment highlights with a circular ROI visual; right shows geographic expansion map and customer base bar chart. Clean blue-and-white design with icons and arrows.
Strategic Planning
Industrial & Manufacturing
Communicates Suzano’s investment in a P&W mill to reduce cost and emissions. Also notes expansion in distribution centers and a doubling of customer base from 2023 to 2024, highlighting strategic and environmental benefits.
Suzano, investment, CO2 reduction, customer growth, ROI, P&W, logistics
false
Strategic Planning
Industrial & Manufacturing
Multiple Chart
Goldman Sachs
Add to my slides
Remove from favorites
Features a column chart reflecting SVOD account sharing statistics by age group, using varied shades of green to differentiate data sets, presented in a clear format.
Regulatory and Compliance
Media & Entertainment
Discusses the prevalence of SVOD account sharing, which may challenge service terms and impact revenue models in the entertainment industry. Key for compliance and regulatory strategy considerations.
SVOD, account sharing, compliance, entertainment, strategy
false
Regulatory and Compliance
Media & Entertainment
Mixed Chart
Deloitte
Add to my slides
Remove from favorites
Incorporates line charts comparing global SVOD revenue against traditional box office figures from 2015 to 2024, with a separate focus on India. The chart uses contrasting colors to highlight the overtaking of box office revenue by SVOD, underscoring a significant industry shift.
Competitive Landscape
Media & Entertainment
Discusses the impact of digital streaming services on traditional cinema, marking a pivotal shift as SVOD revenue surpasses box office collections globally and in India. This slide is vital for analyzing market dynamics, consumer behavior changes, and the strategic implications for content distributors and film producers.
SVOD, box office, digital transformation, cinema
false
Competitive Landscape
Media & Entertainment
Multiple Chart
PwC/Strategy&
Add to my slides
Remove from favorites
Features multiple bar charts detailing subscription and cancellation rates for SVOD services, using contrasting colors to enhance data readability.
Risk Assessment and Management
Media & Entertainment
Analyzes the reasons for SVOD subscription cancellations, highlighting cost as a significant factor. Offers insights into consumer retention challenges in the streaming service industry.
SVOD, churn, cancellation, streaming, cost
false
Risk Assessment and Management
Media & Entertainment
Single Chart
Deloitte
Add to my slides
Remove from favorites
This slide includes a pie chart to depict how SVOD users are sharing costs, using shades of green and blue to distinguish different user groups.
Financial Performance
Media & Entertainment
Explores how SVOD costs are shared among users, highlighting variations in payment responsibilities, which is essential for understanding consumer payment behaviors in media subscription services.
SVOD, cost sharing, media, consumer behavior, subscriptions
false
Financial Performance
Media & Entertainment
Mixed Chart
Deloitte
Add to my slides
Remove from favorites
Displays a line graph showing the adoption rates of SVOD from 2018 to 2023, with a highlight on the COVID-19 impact. The design is minimalistic with a focus on trend lines and data points.
Market Analysis and Trends
Media & Entertainment
Reviews the subscription rates of video streaming services over recent years, noting a plateau in growth. Useful for analyzing media consumption trends and forecasting future changes in the entertainment industry.
SVOD, media trends, COVID-19, streaming, adoption
false
Market Analysis and Trends
Media & Entertainment
Mixed Chart
Deloitte
Add to my slides
Remove from favorites
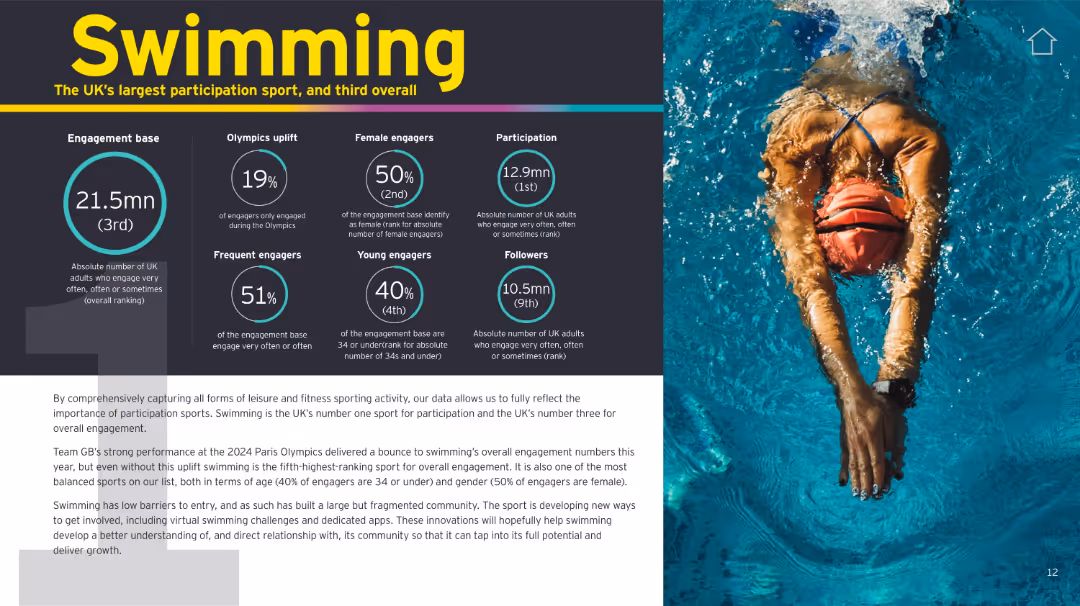
Split-screen: Left has infographics and text summary, right has a large action photo. Black, teal, and white theme.
Customer and Market Segmentation
Media & Entertainment
Swimming is highlighted as the UK’s top participation sport and third in overall engagement, with strong gender and youth representation. The slide also emphasizes its Olympic impact and future growth opportunities.
swimming, participation, gender balance, Olympics, youth, engagement, UK sports
false
Customer and Market Segmentation
Media & Entertainment
Mixed Chart
EY
Add to my slides
Remove from favorites
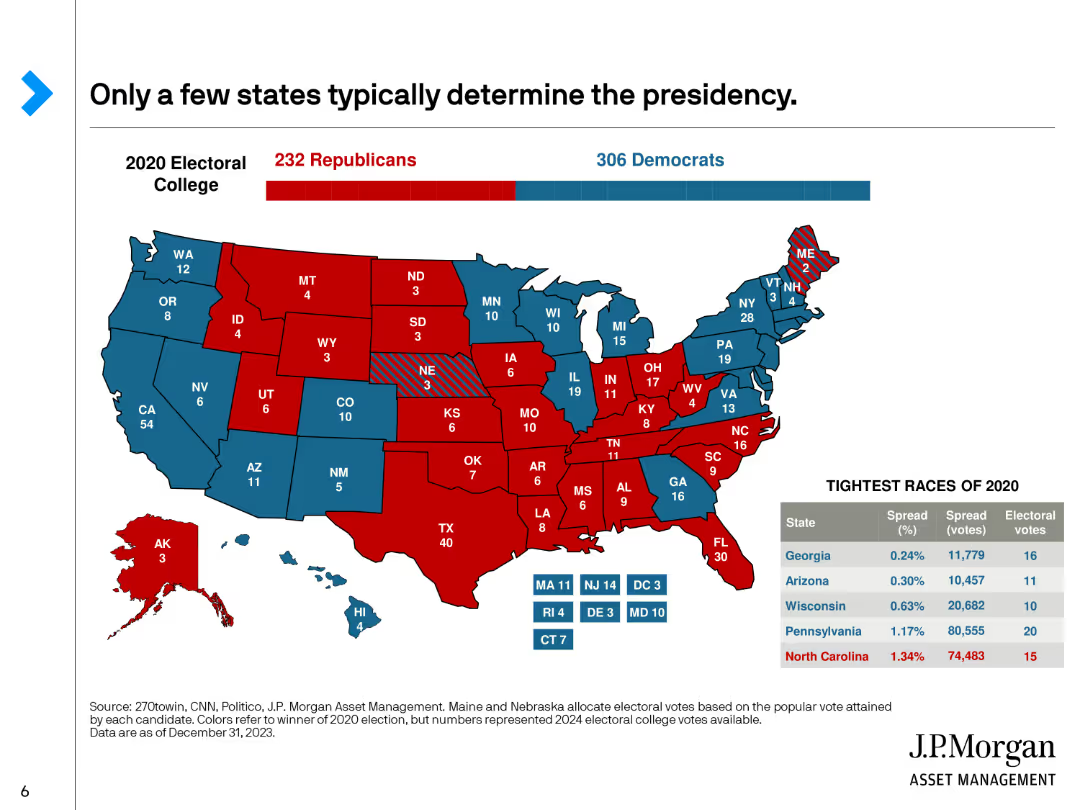
A U.S. map showing the 2020 Electoral College results by state with red and blue colors, along with a table listing the tightest races in key states.
Market Analysis and Trends
Government & Public Sector
Highlights the importance of swing states in determining the U.S. presidency, showing the electoral votes and margins in critical states from the 2020 election.
Swing States, Electoral College, Presidency, 2020, Key States
false
Market Analysis and Trends
Government & Public Sector
Graphic
JP Morgan
Add to my slides
Remove from favorites
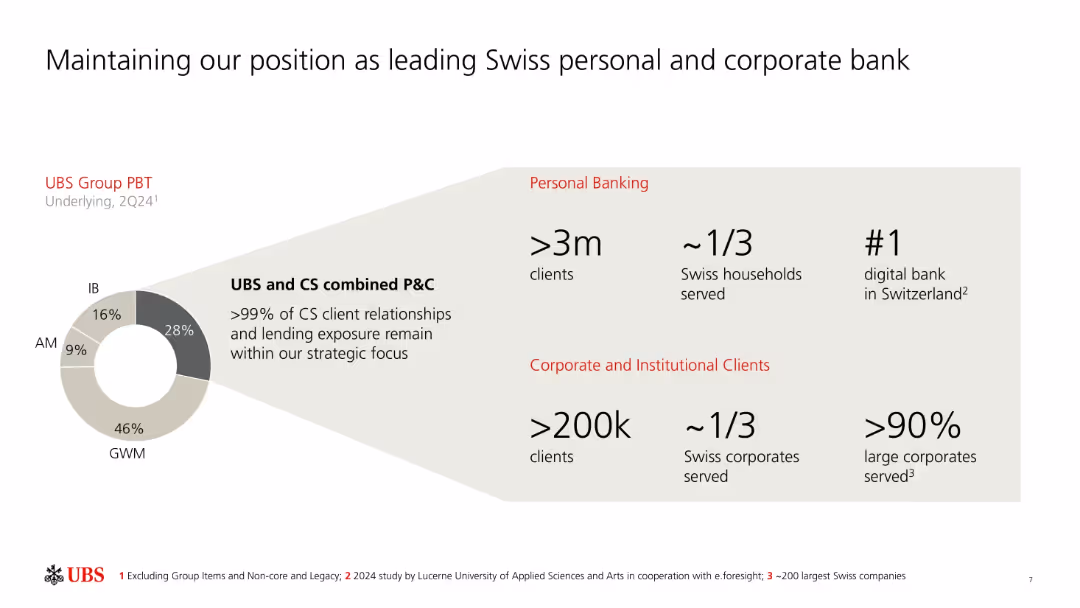
Donut chart and infographics on left and right; red-highlighted headers for key stats.
Strategic Planning
Financial Services
UBS emphasizes its dominant role in Swiss banking, serving over 3 million personal clients and 200k corporates. It shows client distribution and a donut chart of UBS Group PBT by division, highlighting its continued strategic alignment post-Credit Suisse acquisition.
Swiss banking, market share, PBT, UBS, personal banking, corporate banking, digital bank, CS integration
false
Strategic Planning
Financial Services
Mixed Chart
UBS
Add to my slides
Remove from favorites
The slide features column charts showing adjusted net revenues, cost/income ratio, assets under management, and more for Swiss Bank.
Financial Performance
Financial Services
This slide provides financial performance metrics for the Swiss Bank sector, highlighting net revenues, cost/income ratio, and pre-tax income.
Swiss Bank, net revenues, cost/income ratio, assets under management, financial performance
false
Financial Performance
Financial Services
Multiple Chart
Credit Suisse
Add to my slides
Remove from favorites
A detailed text layout with three columns providing information on Swiss Bank, Share-Backed Lending, and IB Leveraged Finance portfolios. Text boxes highlight forward-looking risk management measures for each portfolio.
Risk Assessment and Management
Financial Services
Provides an in-depth look at selected portfolios, their investment grade ratings, exposure levels, and forward-looking risk management measures. It focuses on high-quality assets, conservative lending standards, and de-risking strategies.
Swiss Bank, Share-Backed Lending, IB Leveraged Finance, risk management, portfolios
false
Risk Assessment and Management
Financial Services
Table
Credit Suisse
Add to my slides
Remove from favorites
Features a main column chart with several smaller charts, detailing the number of startups in various sectors of the Swiss FoodTech ecosystem.
Industry Overview
Agriculture & Food Production
Overview of the Swiss FoodTech ecosystem, showing trends and startup prevalence in sectors like AgTech and Food Waste. Useful for understanding innovation distribution and identifying significant startup activity areas.
Swiss FoodTech, Ecosystem, Startups, AgTech, Food Waste, Innovation Distribution
false
Industry Overview
Agriculture & Food Production
Mixed Chart
Accenture
Add to my slides
Remove from favorites
Detailed with multiple small bar charts for each trend category within the Swiss FoodTech ecosystem, showing startup numbers in specific areas.
Market Analysis and Trends
Agriculture & Food Production
Details niche areas within the Swiss FoodTech ecosystem like Nutricosmetics and Precision Agriculture, highlighting startup involvement and emerging trends. Valuable for stakeholders interested in niche investment or innovation opportunities.
Swiss FoodTech, Trend Categories, Startups, Nutricosmetics, Precision Agriculture
false
Market Analysis and Trends
Agriculture & Food Production
Multiple Chart
Accenture
Add to my slides
Remove from favorites
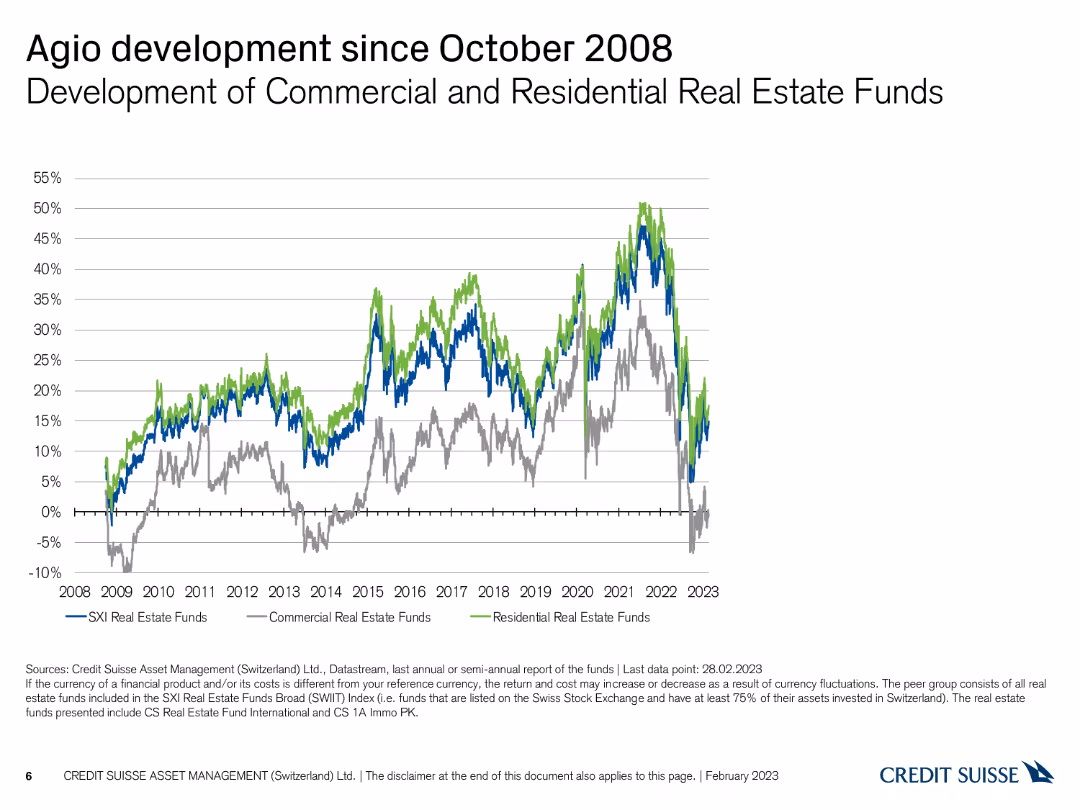
The slide features a line chart showing the development of commercial and residential real estate funds since 2008.
Financial Performance
Real Estate & Construction
This slide examines the agio development of Swiss commercial and residential real estate funds, highlighting trends since October 2008.
Swiss real estate, agio, commercial funds, residential funds, line chart
false
Financial Performance
Real Estate & Construction
Single Chart
Credit Suisse
Add to my slides
Remove from favorites
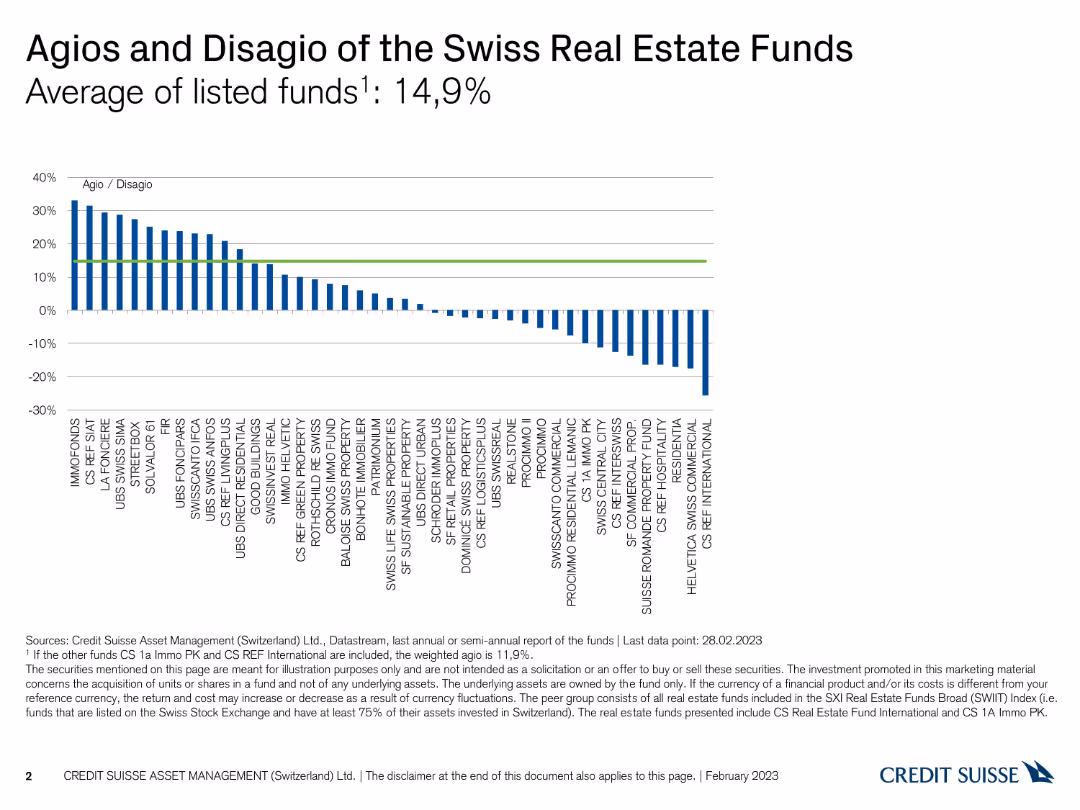
The slide presents a column chart showing the agios and disagio of various Swiss real estate funds, with performance percentages.
Financial Performance
Real Estate & Construction
This slide provides an overview of the agios (premiums) and disagio (discounts) of Swiss real estate funds, highlighting the average listed funds' performance.
Swiss real estate, agio, disagio, fund performance, column chart
false
Financial Performance
Real Estate & Construction
Single Chart
Credit Suisse
Add to my slides
Remove from favorites
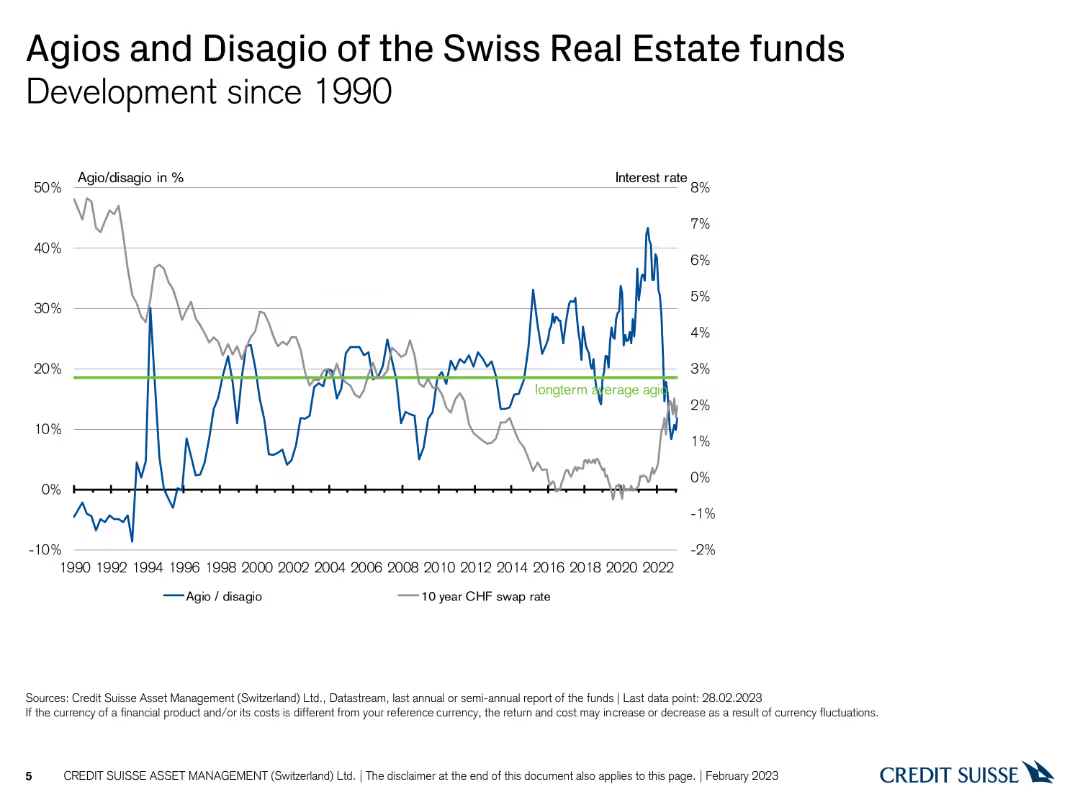
The slide presents a line chart depicting the development of agios/disagios and interest rates since 1990.
Financial Performance
Real Estate & Construction
This slide illustrates the historical development of agios/disagios and long-term interest rates for Swiss real estate funds since 1990.
Swiss real estate, agio, disagio, historical trends, line chart
false
Financial Performance
Real Estate & Construction
Single Chart
Credit Suisse
Add to my slides
Remove from favorites
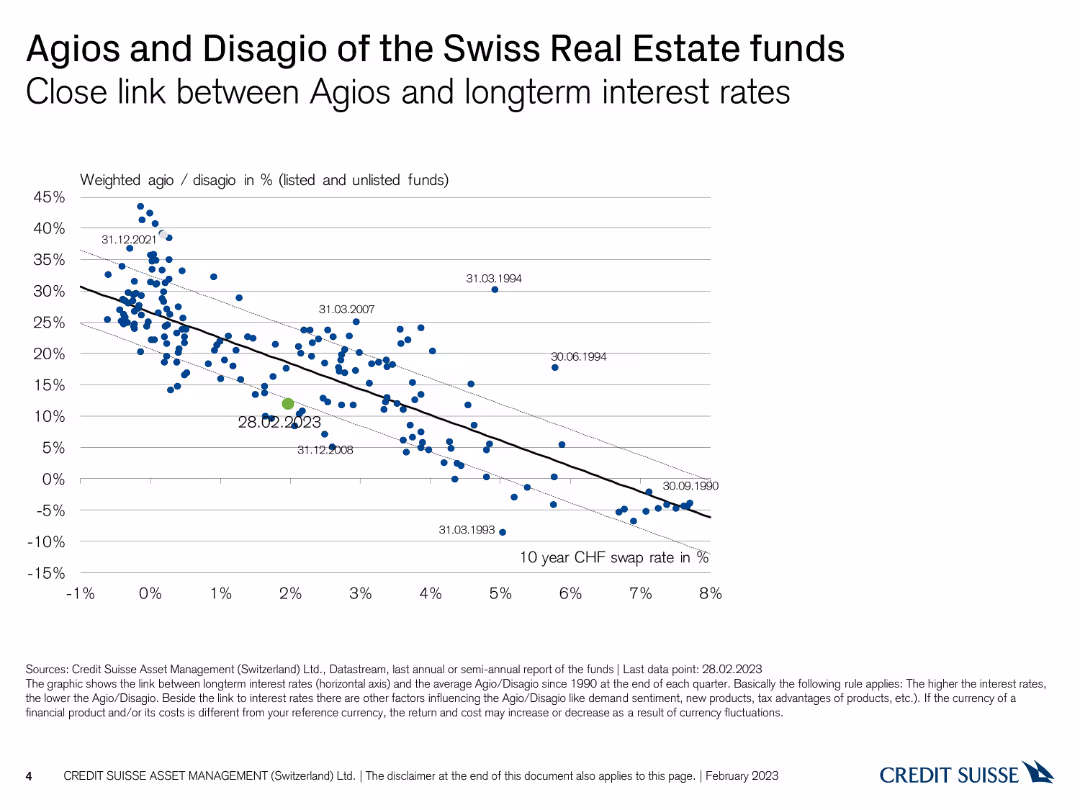
The slide features a scatter plot linking agios/disagios with long-term interest rates, showing data points over time.
Financial Performance
Real Estate & Construction
This slide explores the relationship between agios/disagios of Swiss real estate funds and long-term interest rates, indicating trends over time.
Swiss real estate, agio, disagio, interest rates, scatter plot
false
Financial Performance
Real Estate & Construction
Single Chart
Credit Suisse
Add to my slides
Remove from favorites
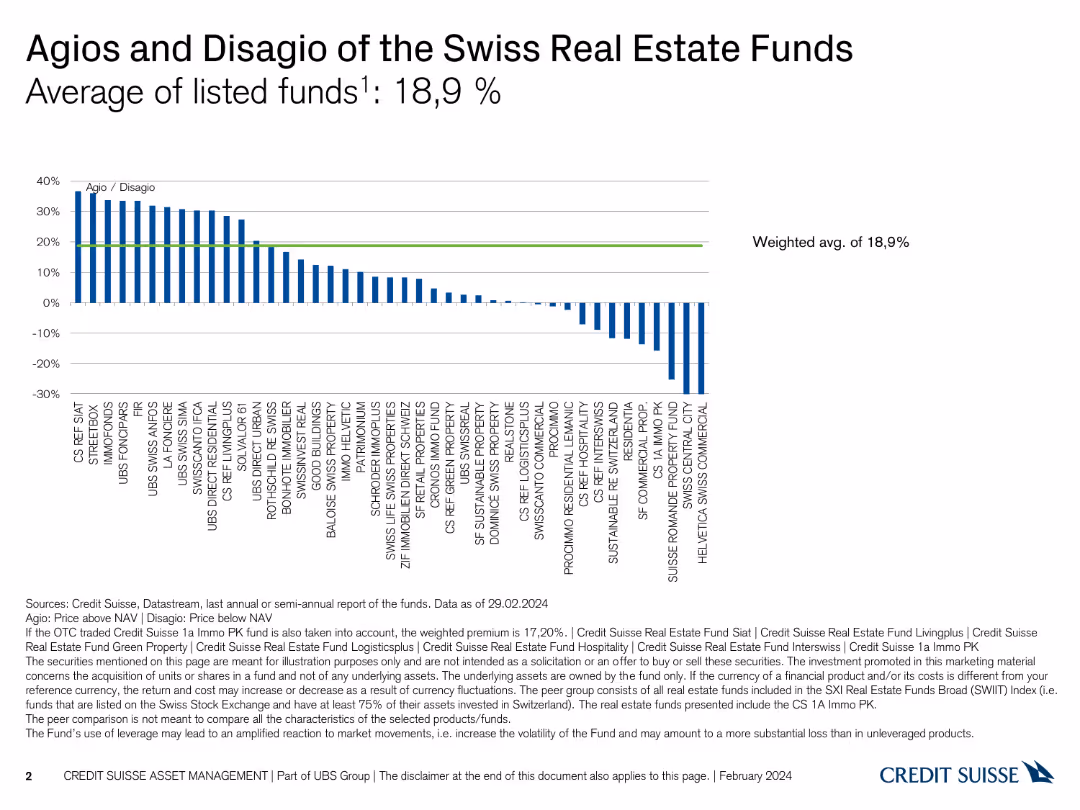
Column chart showing agios and disagios of various Swiss real estate funds, including a weighted average.
Market Analysis and Trends
Real Estate & Construction
Compares the premium and discount (agio/disagio) across listed Swiss real estate funds, providing a weighted average analysis.
Swiss real estate, agio, disagio, market analysis, funds
false
Market Analysis and Trends
Real Estate & Construction
Single Chart
Credit Suisse
Add to my slides
Remove from favorites
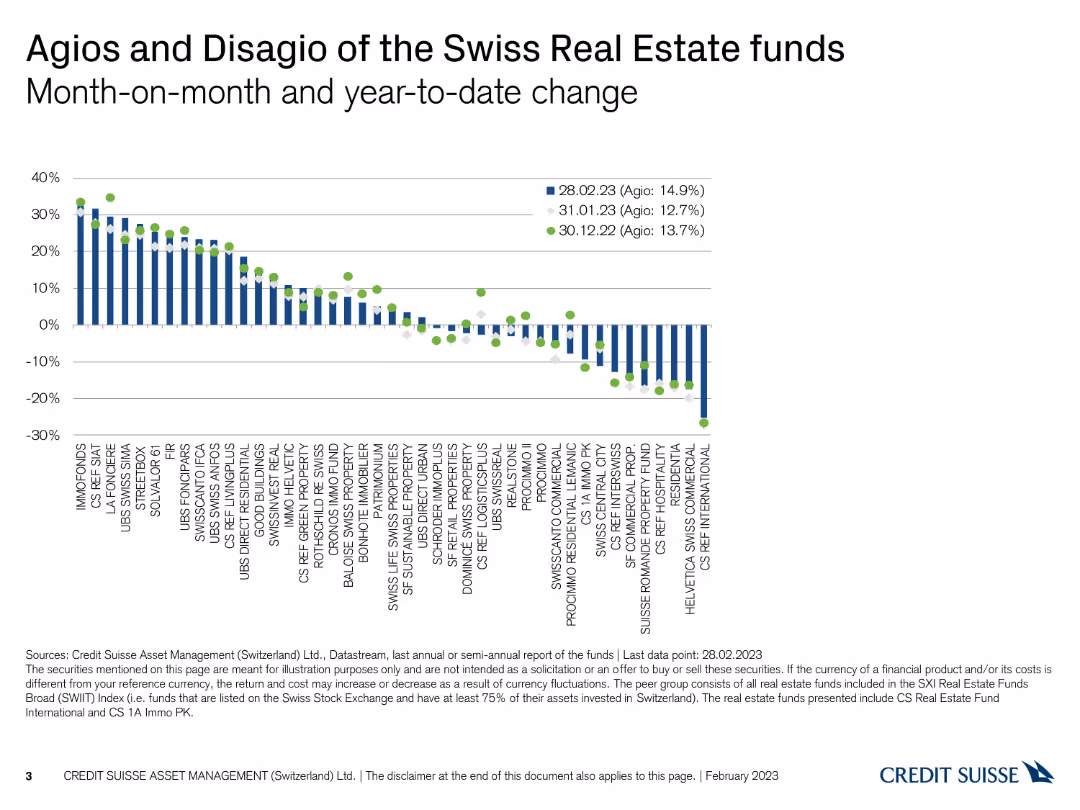
The slide displays a column chart with dots representing month-on-month and year-to-date changes in agios and disagios.
Financial Performance
Real Estate & Construction
This slide compares the monthly and year-to-date changes in agios and disagios of Swiss real estate funds, providing performance insights.
Swiss real estate, agio, disagio, performance, monthly change
false
Financial Performance
Real Estate & Construction
Single Chart
Credit Suisse
Add to my slides
Remove from favorites
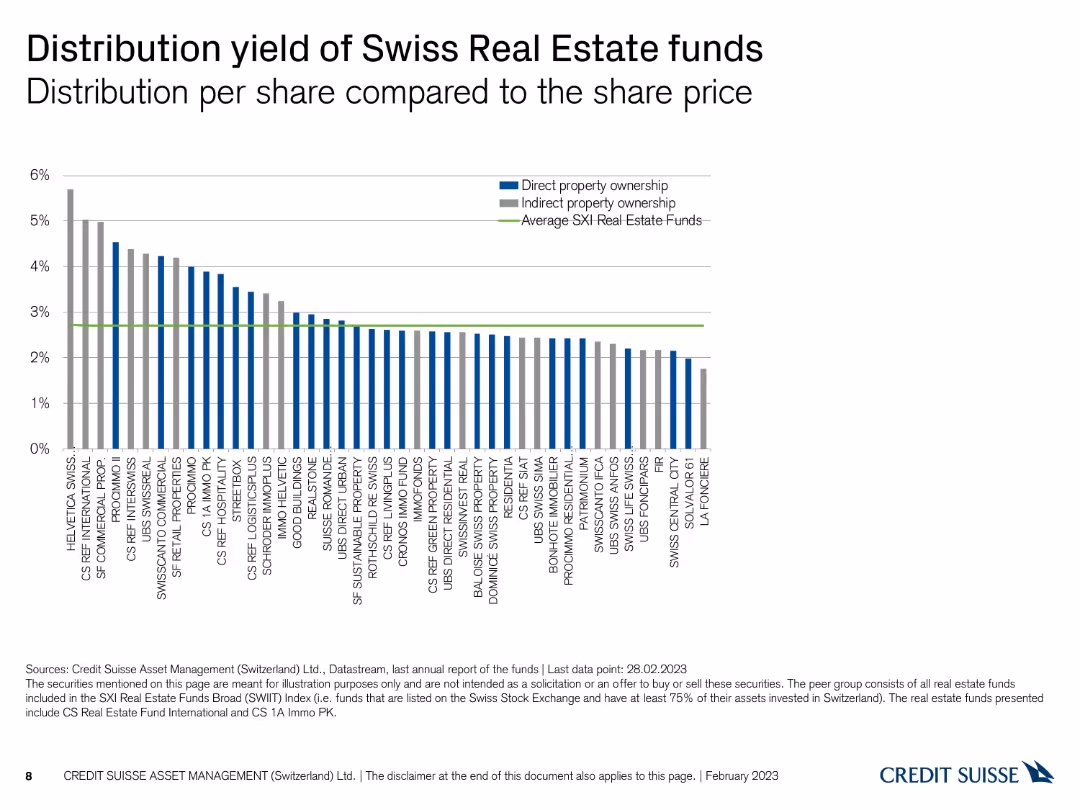
The slide presents a column chart comparing the distribution yield per share of Swiss real estate funds.
Financial Performance
Real Estate & Construction
This slide compares the distribution yield of Swiss real estate funds per share, highlighting differences among funds.
Swiss real estate, distribution yield, comparison, column chart, share price
false
Financial Performance
Real Estate & Construction
Single Chart
Credit Suisse
Add to my slides
Remove from favorites
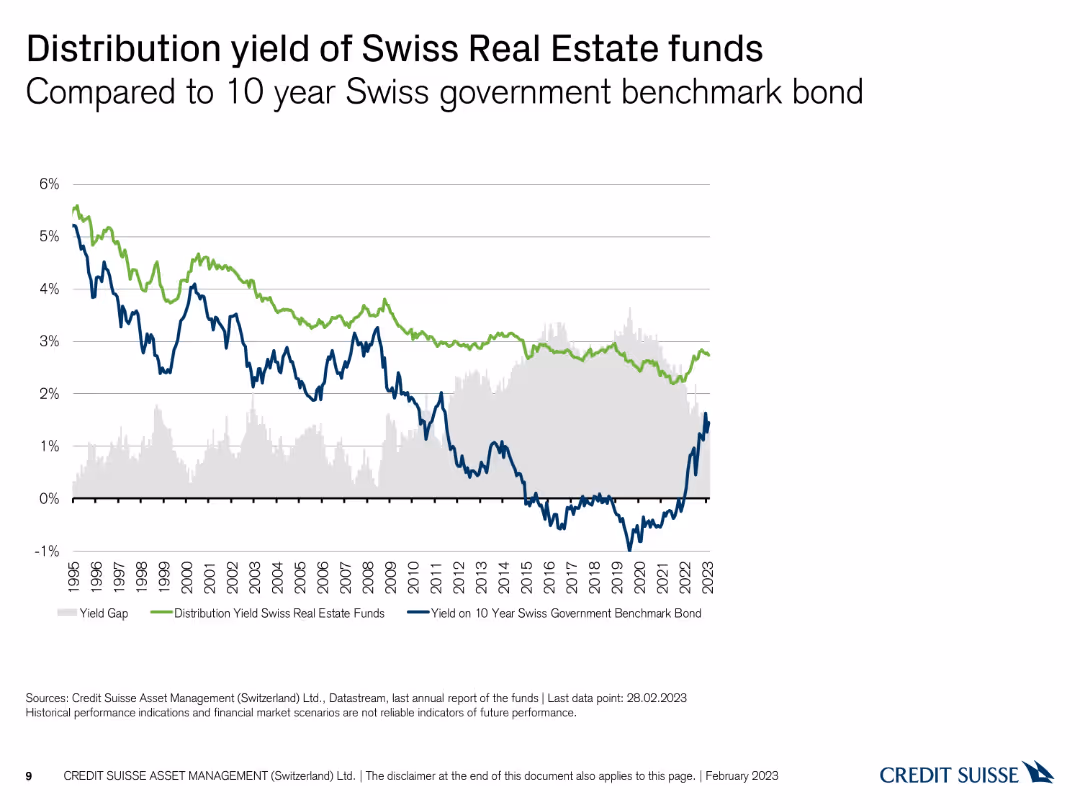
The slide features a line chart comparing the distribution yield of Swiss real estate funds to a 10-year Swiss government bond.
Financial Performance
Real Estate & Construction
This slide compares the distribution yield of Swiss real estate funds with the yield on a 10-year Swiss government benchmark bond, providing insights into performance.
Swiss real estate, distribution yield, government bond, comparison, line chart
false
Financial Performance
Real Estate & Construction
Single Chart
Credit Suisse
Add to my slides
Remove from favorites
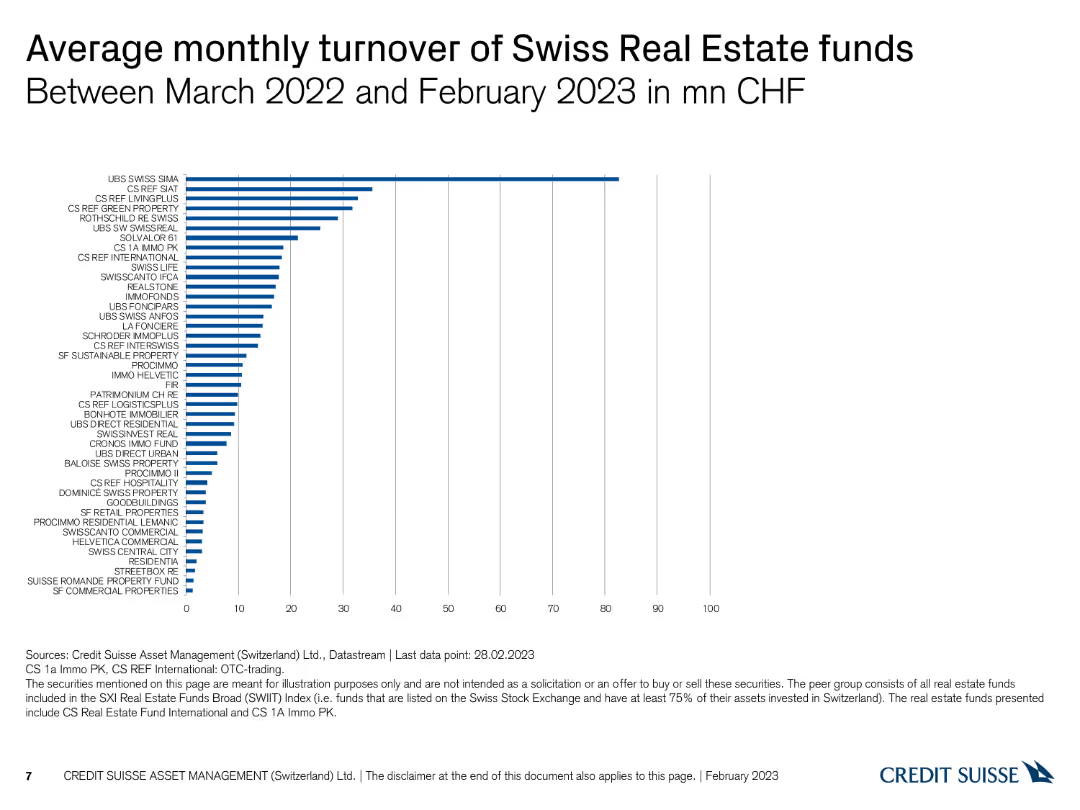
The slide includes a column chart displaying the average monthly turnover of Swiss real estate funds in million CHF.
Financial Performance
Real Estate & Construction
This slide reports the average monthly turnover of various Swiss real estate funds from March 2022 to February 2023, measured in million CHF.
Swiss real estate, turnover, monthly turnover, column chart, CHF
false
Financial Performance
Real Estate & Construction
Single Chart
Credit Suisse
Add to my slides
Remove from favorites
Previous
Next
You don't have any favorites yet.
Please wait loading your favorites slides...
Create a FREE account to continue browsing
Receive Instant Access to 1,000+ slides from companies like McKinsey, Google, and Goldman Sachs
First Name
Last Name
Email
Password
I agree to all
Terms & Privacy Policy
Thank you! Your submission has been received!
Oops! Something went wrong while submitting the form.
Have an account?
Sign in
Upgrade to PRO to Save slides
Advanced Search and Filters
Access to 15,000+ slides
Access to Category Pages
Save/Bookmark Slides
PowerPoint Template Library
Pick a Plan
MONTHLY
$12/month
Billed every month, Cancel anytime.
YEARLY
$9/year
Billed $108 annually, Cancel anytime.
Checkout for $12/month
Checkout for $108/yr
Secured by Stripe | AES-256 bit encryption