My Account
My Slides
Search by Category
Pricing
Templates
View All Templates
Download Template Slides
✦ AI Search
Feedback
Login
Logout
Get Started
Browse all Slides
Browse all Slides
Create a FREE Account
Instant access to 1,000+ real slides from top companies like McKinsey, BCG, Goldman Sachs, Google and many more!
First Name
Last Name
Email
Password
I agree to all
Terms & Privacy Policy
Thank you! Your submission has been received!
Oops! Something went wrong while submitting the form.
Have an account?
Sign in
Saved Slides
Total No. of slides saved
0
↻ Refresh
✖ Clear all
This slide presents a line chart showing the growth in the number of financing rounds of Swiss startups from 2012 to 2020, along with multiple bullet points detailing innovations and academic contributions to the startup environment.
Industry Overview
Professional Services
The slide focuses on the financial evolution of Swiss startups, showcasing a consistent increase in financing rounds over the years. It also discusses local innovation hubs and academic influences driving the startup landscape.
Swiss startups, financing rounds, innovation, academic influence, growth
false
Industry Overview
Professional Services
Mixed Chart
Accenture
Add to my slides
Remove from favorites
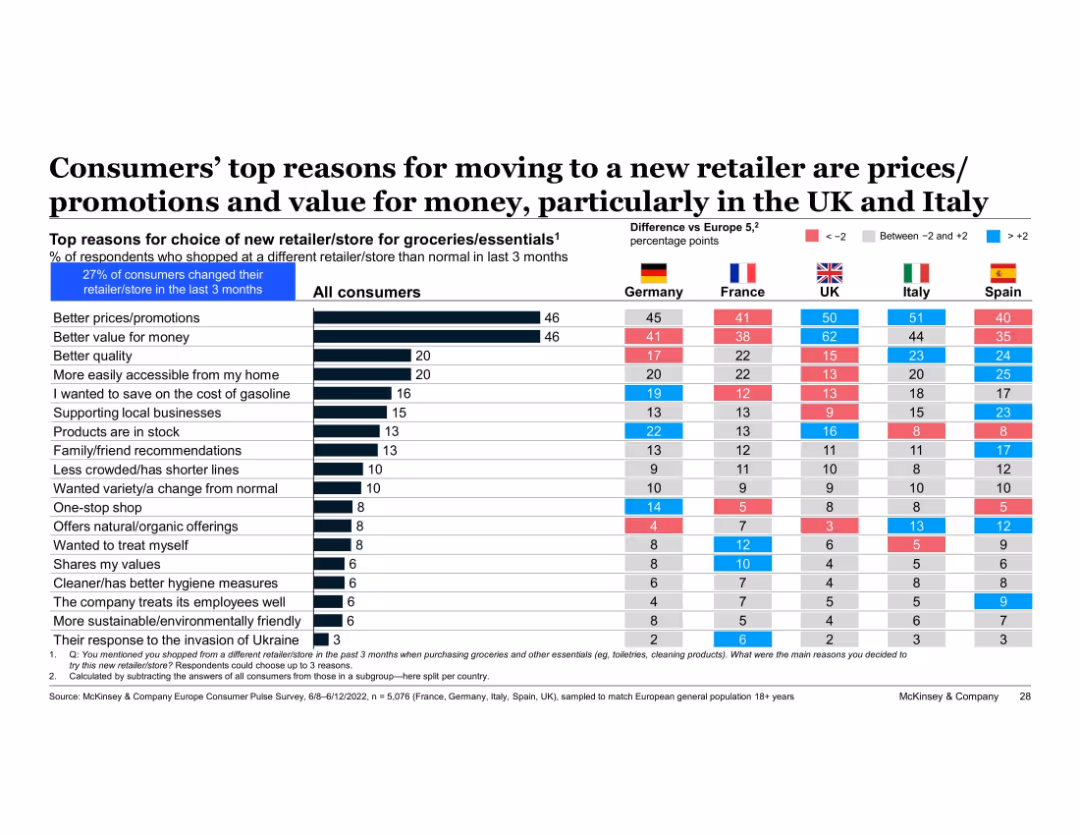
Table format with consumer reasons for changing retailer, broken down by country; difference from European average color-coded
Customer and Market Segmentation
Retail & E-commerce
Pricing and value are the top drivers for consumers switching grocery retailers across Europe, with especially high emphasis in the UK and Italy. Other drivers include product availability, accessibility, and promotions. Differences by country show varied priorities, including local business support and fuel savings.
switching retailer, pricing, value for money, country comparison, consumer motivation, retail behavior, Europe
false
Customer and Market Segmentation
Retail & E-commerce
Multiple Chart
McKinsey
Add to my slides
Remove from favorites
Detailed textual content with logos and a list of various organizational types supporting the FoodTech sector.
Market Analysis and Trends
Agriculture & Food Production
Describes the core entities that support and enable food innovation in Switzerland, including corporations and research centers.
Switzerland, FoodTech, support, innovation, ecosystem
false
Market Analysis and Trends
Agriculture & Food Production
Header Horizontal
Accenture
Add to my slides
Remove from favorites
Slide displays detailed text content with logos representing various support entities within the FoodTech ecosystem.
Investment Analysis
Agriculture & Food Production
Describes the core entities supporting food innovation in Switzerland, with a focus on their contributions and origins.
Switzerland, FoodTech, support, innovation, entities
false
Investment Analysis
Agriculture & Food Production
Header Vertical
Accenture
Add to my slides
Remove from favorites
Contains text blocks and images showcasing infrastructure and activities in Switzerland's food sector.
Market Analysis and Trends
Agriculture & Food Production
Highlights Switzerland's role as a leader in food and nutrition, focusing on corporate and academic contributions.
Switzerland, innovation, food, academia, corporates
false
Market Analysis and Trends
Agriculture & Food Production
Header Horizontal
Accenture
Add to my slides
Remove from favorites
The slide features pie charts showing total revenues and PBT breakdowns for 2H23, along with a list of medium-term priorities for clients, integration, and productivity. Text highlights ambitions for cost/income ratio and key achievements in client reach and service.
Financial Performance
Financial Services
The slide emphasizes UBS's leading position in Switzerland with strong returns and extensive client reach. It outlines medium-term priorities in client services, integration, and productivity improvements. This slide can be used to highlight market leadership and strategic priorities in the Swiss banking sector.
Switzerland, market leadership, client reach, productivity, integration
false
Financial Performance
Financial Services
Multiple Chart
UBS
Add to my slides
Remove from favorites
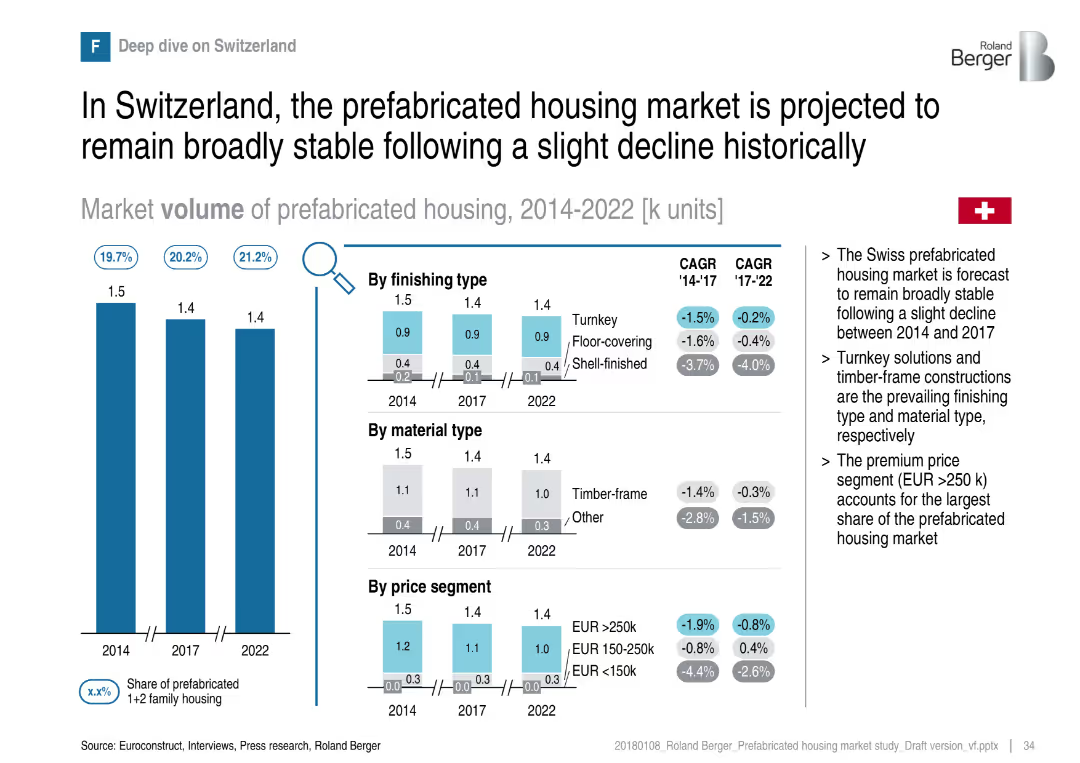
Bar chart and segments showing minor fluctuations; stable forecast emphasized
Market Analysis and Trends
Real Estate & Construction
Switzerland’s prefabricated housing market has declined slightly but is expected to stabilize. The market favors turnkey solutions and premium price segments, with timber-frame as the preferred material.
Switzerland, stability, prefabricated, turnkey, timber-frame, market trends
false
Market Analysis and Trends
Real Estate & Construction
Multiple Chart
Roland Berger
Add to my slides
Remove from favorites
This slide features a large map of Switzerland color-coded to display investment data by canton and sector for 2020. Several bar charts depict investment amounts in different sectors like Biotech, Medtech, ICT, etc. It also includes a detailed bullet point text explaining the startup ecosystem in Switzerland.
Industry Overview
Professional Services
The slide provides an overview of the Swiss startup ecosystem, emphasizing the investments in various sectors across cantons in 2020. It highlights Switzerland's ranking in European startup ecosystems and discusses the investment trends in detail.
Switzerland, startup, investment, ecosystem, biotech, medtech, ICT, 2020
false
Industry Overview
Professional Services
Graphic
Accenture
Add to my slides
Remove from favorites
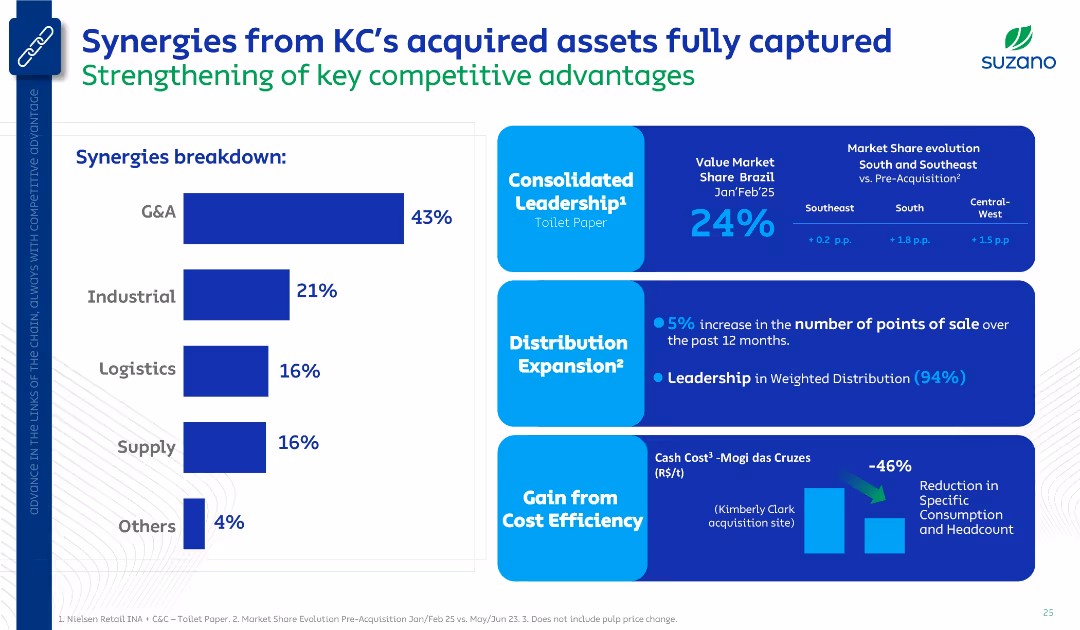
Left side shows synergy breakdown bar chart; right highlights market share gains, expansion in distribution, and cost efficiency from KC asset acquisition. Corporate styling with contrasting data blocks.
Mergers and Acquisitions
Consumer Goods
Highlights synergies realized from Kimberly-Clark asset acquisition. Main gains in G&A (43%) and Industrial (21%) segments. Market share rose in South and Southeast Brazil with distribution expansion and 46% cost reduction at a key site.
synergies, Kimberly-Clark, Suzano, acquisition, market share, cost cut
false
Mergers and Acquisitions
Consumer Goods
Multiple Chart
Goldman Sachs
Add to my slides
Remove from favorites
Horizontal axis graph depicting stages of value capture and creation with interconnections shown between various operational elements.
Operational Efficiency
Professional Services
Discusses how to effectively operationalize synergies in a business integration context, emphasizing quick wins and long-term value projects.
synergies, operational efficiency, business, integration, value creation, projects
false
Operational Efficiency
Professional Services
Mixed Chart
Deloitte
Add to my slides
Remove from favorites
Features a detailed flow diagram showing the various processes syngas can undergo based on its purity, including PSA purification and methanol synthesis.
Technology and Digital Transformation
Energy & Utilities
Describes the multiple processes that syngas can undergo to either extract hydrogen or convert into liquid fuels, depending on its purity and composition.
Syngas, hydrogen extraction, liquid fuels, PSA purification, methanol synthesis
false
Technology and Digital Transformation
Energy & Utilities
Diagram
Kearney
Add to my slides
Remove from favorites
Contains a comparative column chart showing the usual composition of syngas per production method, with key takeaways listed on the right.
Technology and Digital Transformation
Energy & Utilities
Explains the composition of syngas produced by different methods (SMR, ATR, gasification), emphasizing its uses and energy density relative to natural gas.
Syngas, hydrogen, SMR, ATR, gasification, production methods
false
Technology and Digital Transformation
Energy & Utilities
Mixed Chart
Kearney
Add to my slides
Remove from favorites
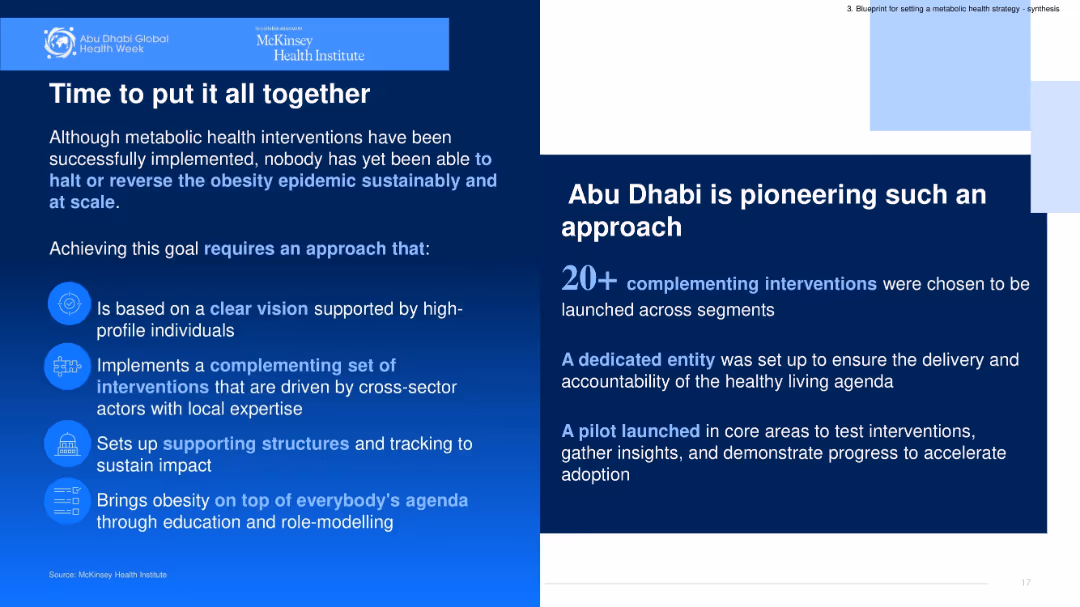
Two-column layout; left side lists a 4-point approach for intervention success, right highlights Abu Dhabi’s implementation. Text-heavy with bolded keywords and simple icons for visual clarity.
Strategic Planning
Healthcare & Pharmaceuticals
Synthesizes key success criteria for addressing metabolic health issues. Reinforces the need for vision, supporting structures, interventions, and leadership. Abu Dhabi is presented as a case study with over 20 interventions and dedicated governance.
synthesis, intervention strategy, Abu Dhabi, obesity, pilot programs
false
Strategic Planning
Healthcare & Pharmaceuticals
Boxed
McKinsey
Add to my slides
Remove from favorites
Left side features percentage circles, right side has a column chart and text
Technology and Digital Transformation
Technology & Software
Benefits and challenges of using AI-generated synthetic data, focusing on accuracy and efficiency improvements
synthetic data, AI-generated, accuracy, efficiency
false
Technology and Digital Transformation
Technology & Software
Multiple Chart
Gartner
Add to my slides
Remove from favorites
The slide features a column chart showing estimated net revenue increase in CHF mm from strategic clients, from actual (2016 to 2018) to ambition (2020 to 2022). It also includes bullet points with various strategies for systematic solution delivery.
Strategic Planning
Financial Services
The slide presents strategies for increasing net revenue from strategic clients, emphasizing holistic reviews, bespoke solutions, fast-track service paths, and adding senior bankers. The aim is to systematically deliver solutions to enhance client relationships and revenue.
systematic, revenue, strategic clients, bespoke solutions, fast-track
false
Strategic Planning
Financial Services
Mixed Chart
Credit Suisse
Add to my slides
Remove from favorites
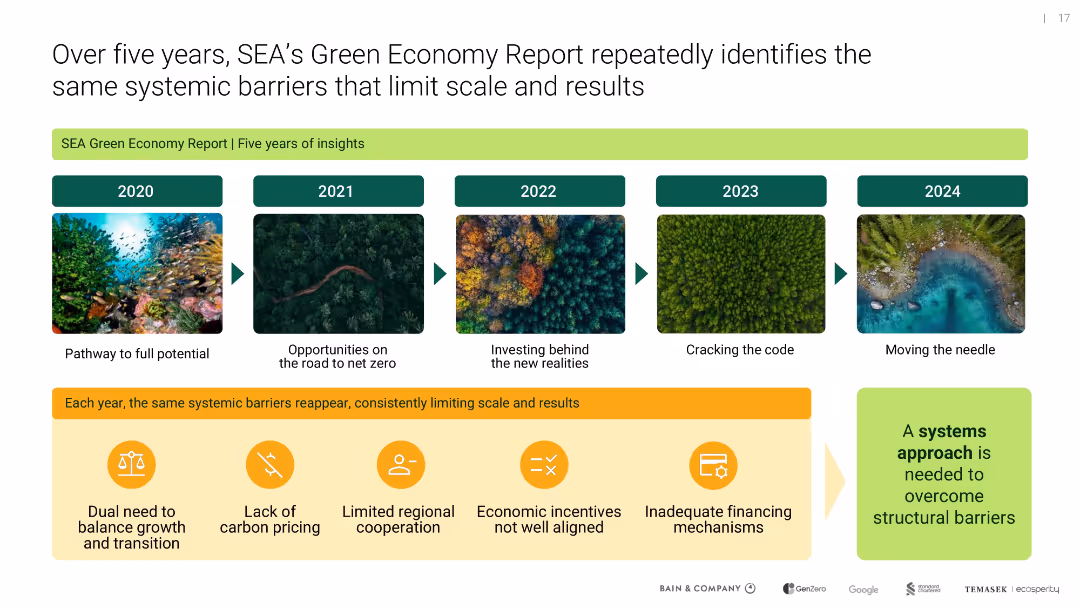
Horizontal timeline with yearly report titles and nature-themed imagery; icons illustrate recurring barriers below
Performance Metrics and KPIs
Environmental Services & Sustainability
Summarizes insights from five years of reports, showing consistent structural barriers like poor incentives, limited cooperation, and need for dual transition-growth balance in Southeast Asia.
systemic barriers, SEA reports, climate transition, green economy, policy gaps
false
Performance Metrics and KPIs
Environmental Services & Sustainability
Linear Flow
Bain
Add to my slides
Remove from favorites
This slide has a text-heavy format with five sections, each including a header, percentage, description, and associated icon, with a footnote at the bottom.
Market Analysis and Trends
Technology & Software
Details the systemic changes driving the growth of ecommerce in SEA, focusing on demographics, internet infrastructure, GDP growth, payment ecosystems, and retail infrastructure, indicating substantial opportunities for market expansion.
Systemic changes, ecommerce growth, SEA, demographics, internet infrastructure
false
Market Analysis and Trends
Technology & Software
Header Vertical
Bain
Add to my slides
Remove from favorites
Structured with headings and subheadings, the slide breaks down systemic interventions into four categories with accompanying text.
Strategic Planning
Government & Public Sector
Illustrates the collaborative strategies between governments and the private sector to address the skilled labor shortage.
systemic interventions, stakeholders, private sector, government, workforce, upskilling, graduates
false
Strategic Planning
Government & Public Sector
Pillar
Kearney
Add to my slides
Remove from favorites
A slide featuring a several bar graphs detailing perceptions of systemic racism across various institutions.
Market Analysis and Trends
Professional Services
Highlights survey results on the perceptions of systemic racism within different societal institutions among Millennials and Gen Z.
Systemic Racism, Institutions, Survey, Millennials, Gen Z, Perceptions, Society, Workplace
false
Market Analysis and Trends
Professional Services
Mixed Chart
Deloitte
Add to my slides
Remove from favorites
This slide features a table format discussing the impact on integrator industry over the last three years, industry drivers, and digitalization. It also includes quotes from industry leaders and logos of companies such as Schott, Edgewater Automation, Kuka, and Strama-MPS.
Competitive Landscape
Industrial & Manufacturing
The slide outlines key themes and challenges for system integrators, including market commentary on the impact of recent years on the integrator industry, industry drivers, and the importance of digitalization.
System Integrators, Industry Challenges, Market Commentary, CEO Interviews, Digitalization
false
Competitive Landscape
Industrial & Manufacturing
Table
LEK
Add to my slides
Remove from favorites
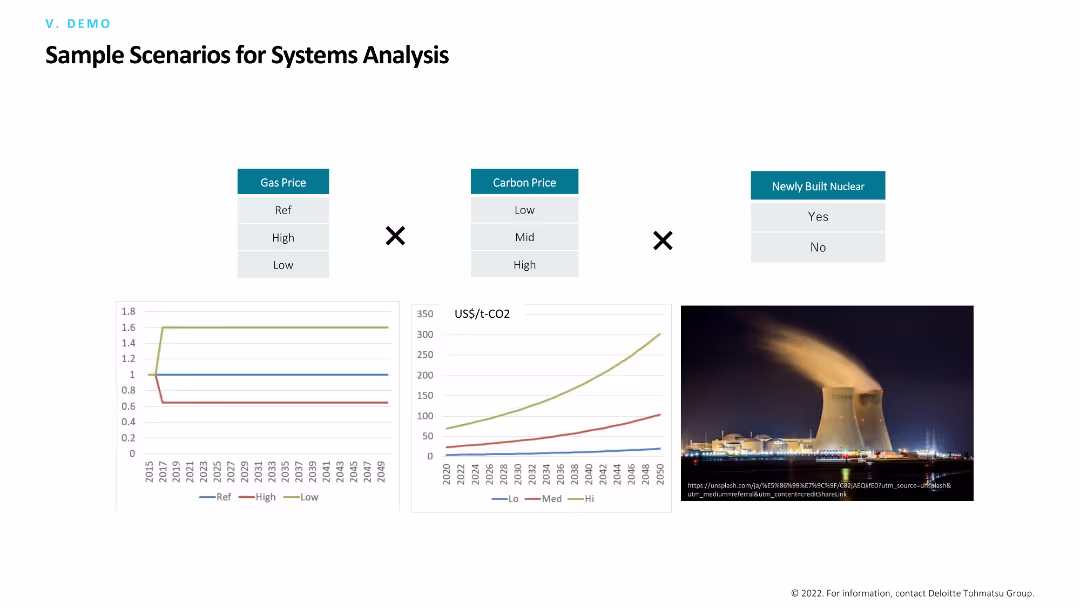
The slide compares various scenarios for systems analysis, including gas prices, carbon prices, and newly built nuclear. It features a mix of comparative tables, line charts, and an image of a nuclear power plant.
Risk Assessment and Management
Industrial & Manufacturing
The slide presents different scenarios for analyzing systems in the energy sector, focusing on how variables like gas and carbon prices, as well as nuclear infrastructure, impact overall performance and risks.
Systems analysis, scenarios, gas prices, carbon prices, nuclear
false
Risk Assessment and Management
Industrial & Manufacturing
Multiple Chart
Deloitte
Add to my slides
Remove from favorites
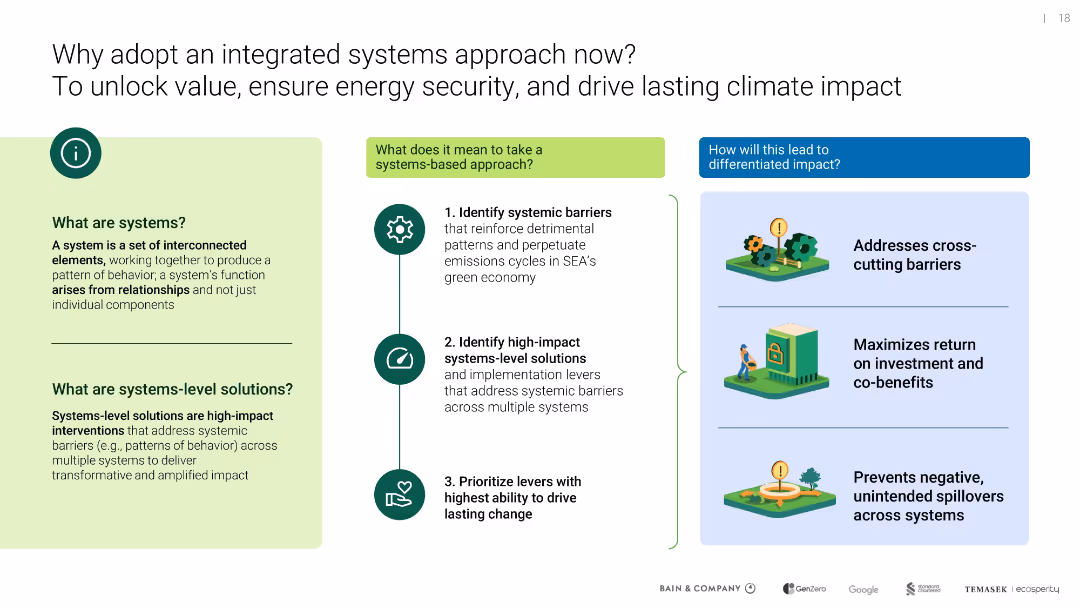
Split into explanatory sections; left defines systems-level thinking, center outlines approach steps, right shows impact benefits
Strategic Planning
Environmental Services & Sustainability
Introduces systems-level thinking as a superior method to overcome systemic barriers, enhance ROI, and prevent negative spillovers in SEA’s green transition. Emphasizes cross-system integration.
systems approach, SEA, energy security, ROI, decarbonization strategy
false
Strategic Planning
Environmental Services & Sustainability
Vertical Flow
Bain
Add to my slides
Remove from favorites
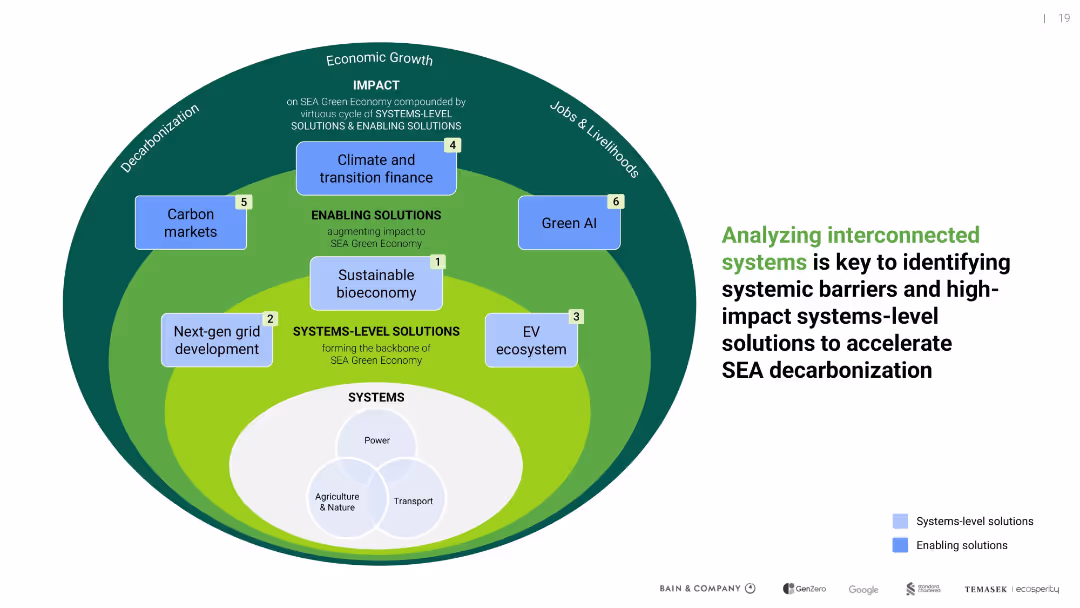
Circular diagram with labeled layers for systems, solutions, and outcomes; color-coded into systems-level vs enabling solutions
Technology and Digital Transformation
Environmental Services & Sustainability
Visualizes the relationship between foundational systems and high-impact solutions driving SEA decarbonization, including energy grids, finance, EVs, and green AI.
systems-level solutions, enabling solutions, SEA, decarbonization, green tech
false
Technology and Digital Transformation
Environmental Services & Sustainability
Uncategorized
Bain
Add to my slides
Remove from favorites
A scatter plot showing the relationship between system strength and revenue growth during the pandemic. Accompanied by a strategy recommendation text.
Strategic Planning
Technology & Software
This slide provides strategic recommendations based on system strength and IT budget allocation, illustrated by a scatter plot showing revenue growth trends.
Systems Strength, Revenue Growth, Strategy, Pandemic, Recommendations
false
Strategic Planning
Technology & Software
Single Chart
Accenture
Add to my slides
Remove from favorites
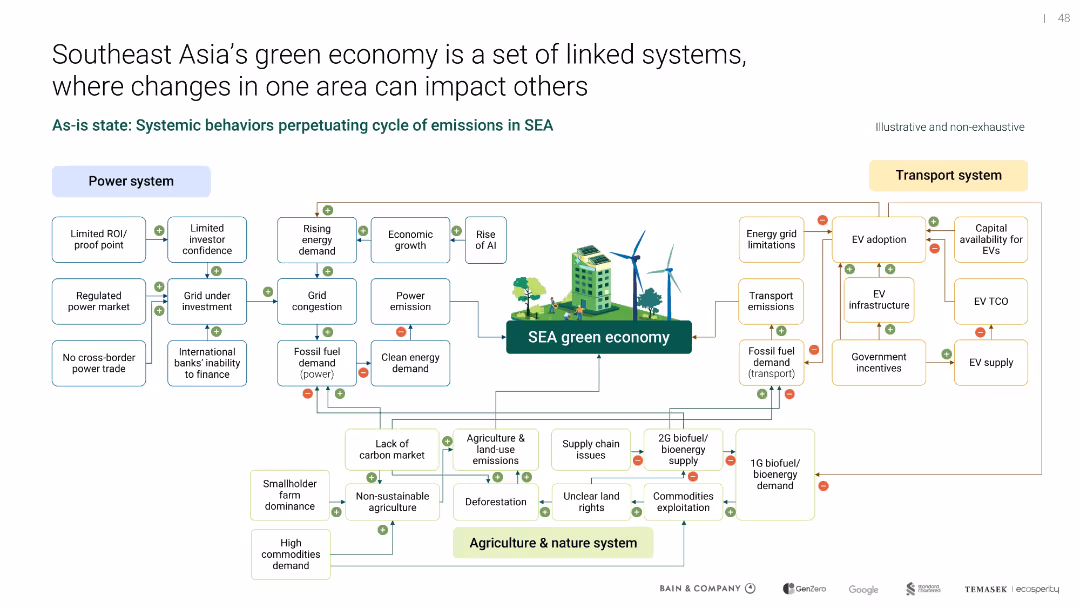
Complex systems map with interlinked categories (power, transport, agriculture) surrounding central “green economy”
Operational Efficiency
Environmental Services & Sustainability
A systems diagram illustrates how power, transport, and agriculture interact to shape SEA’s green economy. It identifies bottlenecks, demand pressures, and feedback loops that hinder decarbonization and sustainability progress.
systems thinking, SEA, emissions, green economy, agriculture, transport
false
Operational Efficiency
Environmental Services & Sustainability
Uncategorized
Bain
Add to my slides
Remove from favorites
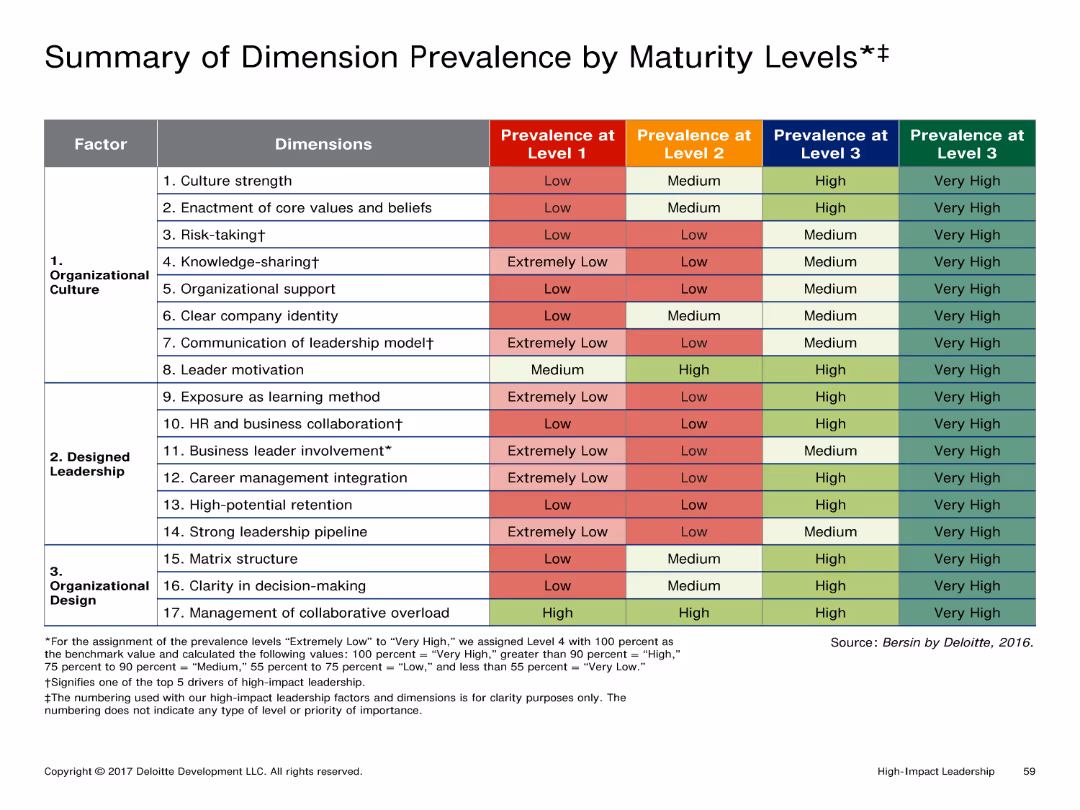
Table showing the prevalence of various dimensions by maturity levels (Low, Medium, High, Very High). The table is color-coded for easy visual differentiation.
Performance Metrics and KPIs
Professional Services
Summarizes how different organizational dimensions are prevalent at various maturity levels, useful for assessing organizational development stages.
Table, dimension prevalence, maturity levels, color-coded
false
Performance Metrics and KPIs
Professional Services
Table
Deloitte
Add to my slides
Remove from favorites
This slide acts as a navigational tool for the presentation, listing topics and corresponding page numbers. The design is straightforward, with a clean white background and organized text alignment for easy reading.
Operational Efficiency
Technology & Software
An organizational slide designed to guide the viewer through the report's structure, covering topics from the introduction to specific analyses and the appendix. It ensures clarity in the presentation's flow and content distribution.
table of contents, agenda, report navigation, presentation structure, topics
false
Operational Efficiency
Technology & Software
Agenda
Oliver Wyman
Add to my slides
Remove from favorites
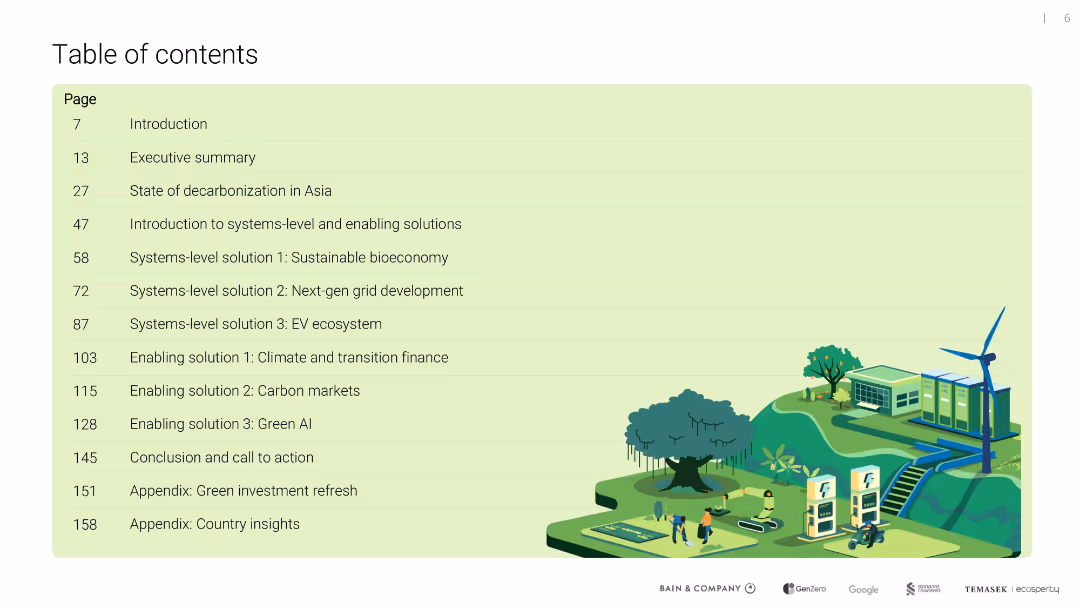
Full-page green-tinted slide with a clean tabular list of page numbers and section titles; illustrated bottom area with eco-themed imagery (windmill, EV, solar panel)
Strategic Planning
Environmental Services & Sustainability
Provides a structured overview of the report’s sections, covering decarbonization strategies, enabling technologies, climate finance, and regional green investment insights in Asia.
table of contents, decarbonization, systems-level solutions, finance, green AI
false
Strategic Planning
Environmental Services & Sustainability
Agenda
Bain
Add to my slides
Remove from favorites
The slide has basic visual complexity with a text-based list that outlines the sections of a report. The design is straightforward and utilitarian, with a clean white background and clear, readable fonts.
Technology and Digital Transformation
Industrial & Manufacturing
The slide provides an agenda or table of contents for a report on process automation, detailing the various segments to be covered. It gives viewers a clear structure of the topics that will be discussed, such as industry views, megatrend impacts, and market profitability.
Table of contents, Report structure, Automation, Industry segments
false
Technology and Digital Transformation
Industrial & Manufacturing
Agenda
LEK
Add to my slides
Remove from favorites
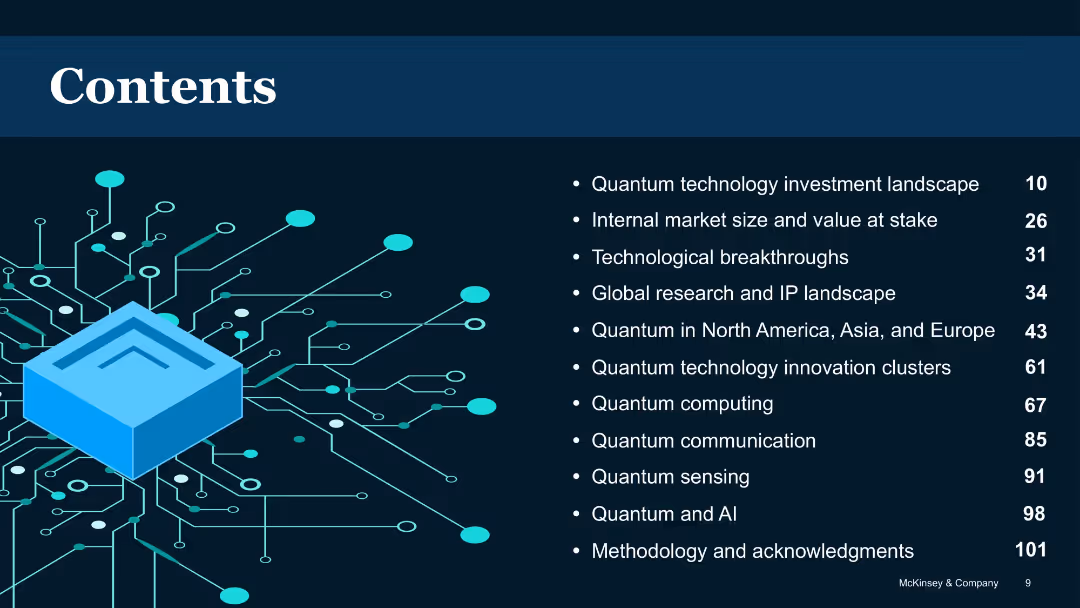
Dark background with blue circuit illustration and list-style table of contents
Industry Overview
Artificial Intelligence
Provides a structured overview of the report’s sections, including topics like investment landscape, technological breakthroughs, global perspectives, and specific quantum technologies like computing, sensing, and communication.
Table of contents, report structure, quantum sections, chapter list
false
Industry Overview
Artificial Intelligence
Agenda
McKinsey
Add to my slides
Remove from favorites
Visually segmented grid layout with four numbered blocks on a digital-tech style background.
Organizational Structure and Change
Healthcare & Pharmaceuticals
Lists four main sections of a report related to metabolic health and strategic planning. Each box provides section title and page range. Provides a clear overview for navigating the document.
table of contents, strategy, healthcare, metabolic health, report
false
Organizational Structure and Change
Healthcare & Pharmaceuticals
Agenda
McKinsey
Add to my slides
Remove from favorites
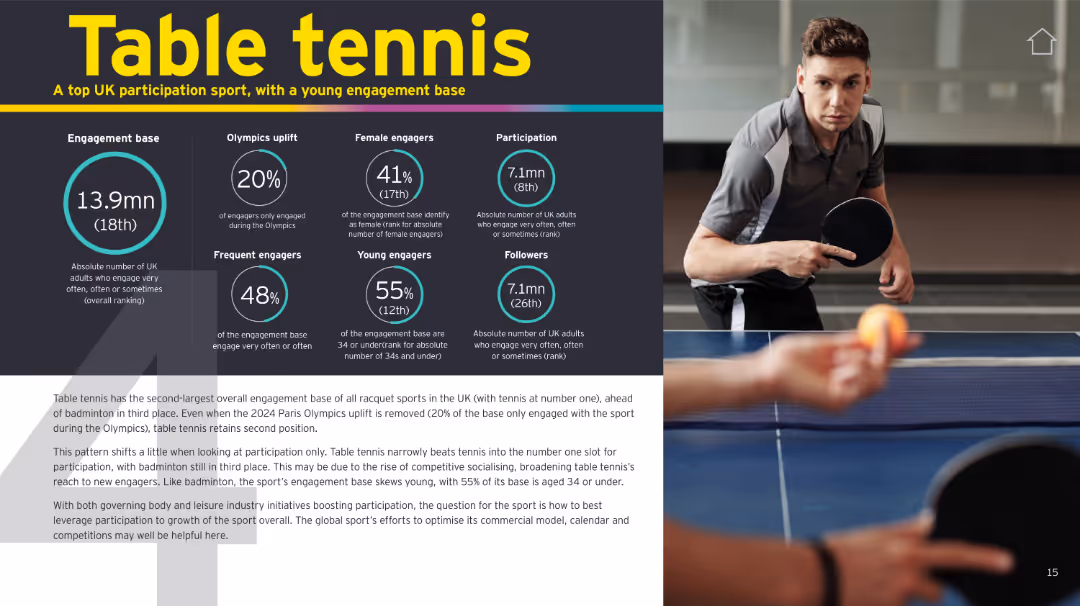
Similar format to previous sports slides, featuring infographics and supporting text alongside a photo.
Customer and Market Segmentation
Media & Entertainment
Table tennis is shown as a rising sport in the UK with strong participation and a young demographic. It discusses competitive social appeal and the sport's second-place ranking among racquet sports.
table tennis, participation, young audience, UK sports, Olympic uplift, racquet sports
false
Customer and Market Segmentation
Media & Entertainment
Mixed Chart
EY
Add to my slides
Remove from favorites
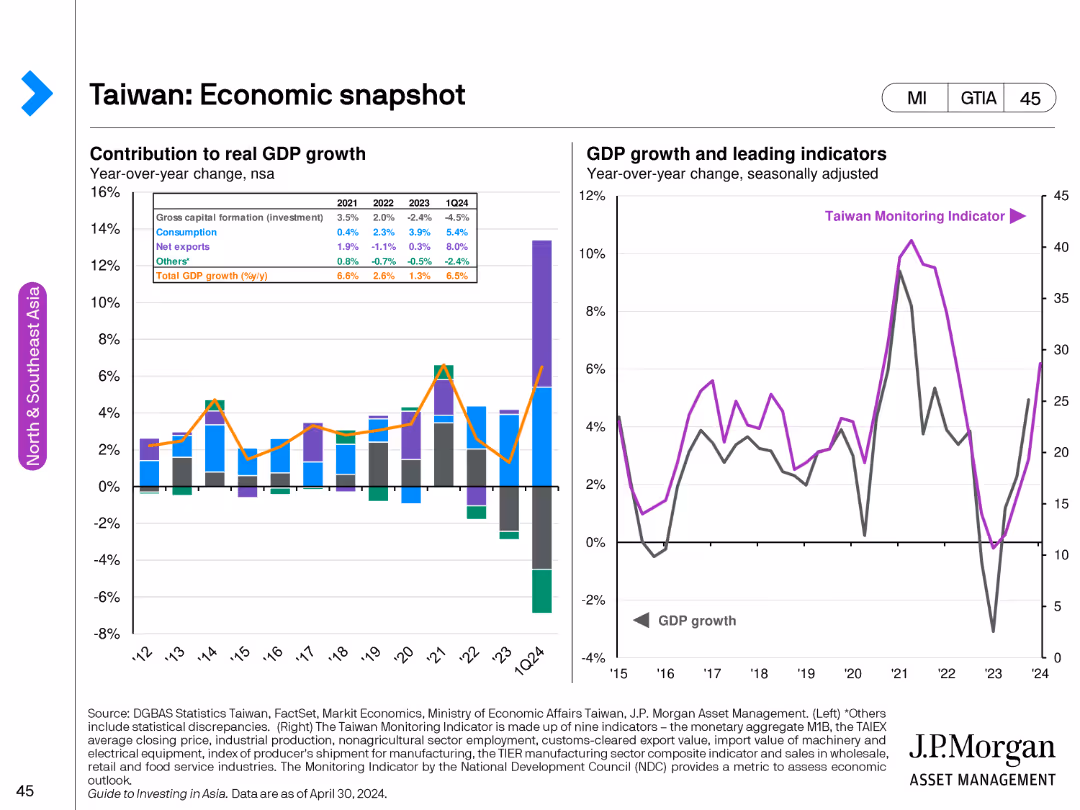
The left side has a stacked column chart showing the contribution to Taiwan's GDP growth by different components from 2012 to 2024F. The right side has a line graph comparing GDP growth and the Taiwan Monitoring Indicator.
Market Analysis and Trends
Financial Services
This slide presents an economic overview of Taiwan, showing detailed components of GDP growth and key economic indicators to assess the country's economic health.
Taiwan, GDP growth, economic indicators, market analysis, Taiwan Monitoring Indicator
false
Market Analysis and Trends
Financial Services
Multiple Chart
JP Morgan
Add to my slides
Remove from favorites
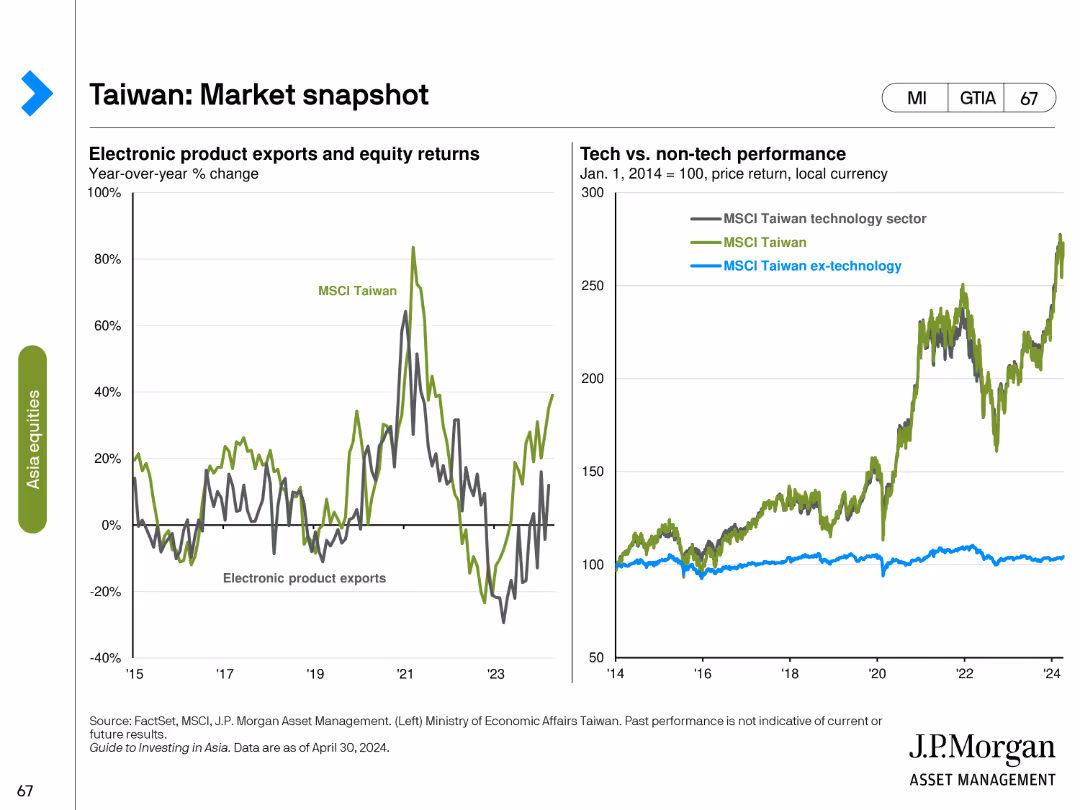
This slide includes two line charts: one showing electronic product exports and equity returns, and the other showing the performance of the MSCI Taiwan technology sector versus non-technology sectors.
Market Analysis and Trends
Financial Services
The slide provides an overview of Taiwan's market, focusing on the relationship between electronic product exports and equity returns, and comparing the performance of technology and non-technology sectors to identify key market drivers.
Taiwan, market snapshot, electronic exports, equity returns, MSCI Taiwan, technology sector, non-technology, market drivers, financial analysis, market overview
false
Market Analysis and Trends
Financial Services
Multiple Chart
JP Morgan
Add to my slides
Remove from favorites
A clean layout with multiple text boxes summarizing key takeaways, including advertiser objectives, channel measurement, and data challenges. Each box contains a brief summary and a small icon representing the concept.
Strategic Planning
Media & Entertainment
This slide provides key takeaways on brand awareness, measurement, and data strategies. It emphasizes the importance of leveraging multiple channels and addressing data challenges to enhance marketing effectiveness.
Takeaways, Strategy, Brand, Measurement, Data
false
Strategic Planning
Media & Entertainment
Multiple Chart
Nielsen
Add to my slides
Remove from favorites
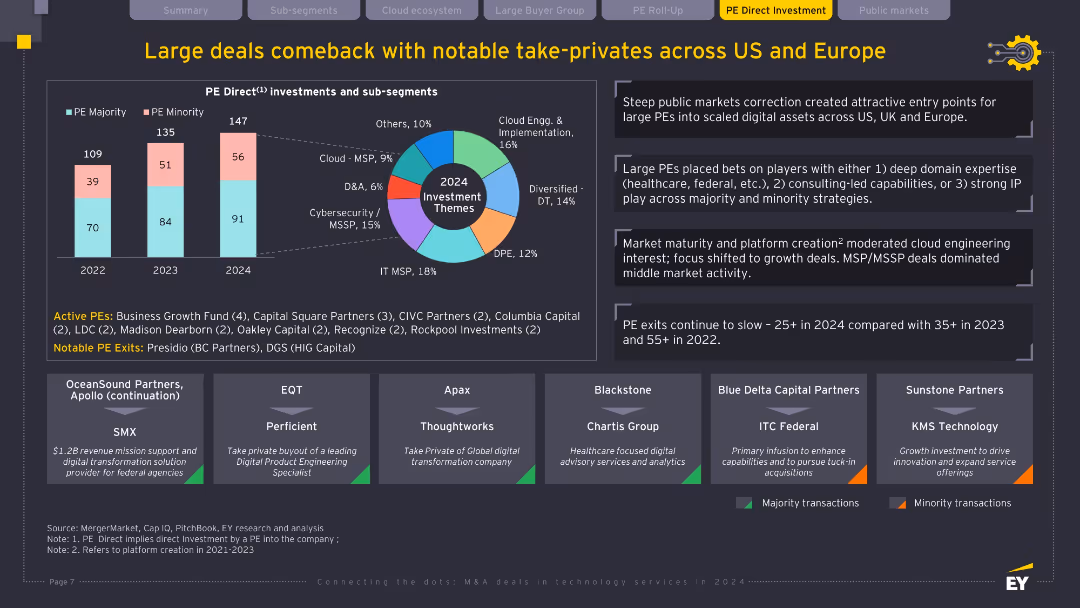
Bar chart, pie chart, textual insights, and deal highlights in labeled boxes; follows same visual style as prior slide with structured data and insights.
Mergers and Acquisitions
Technology & Software
This slide covers the resurgence of large PE deals, particularly take-privates in 2024. It highlights key investment sub-segments and strategic focuses such as cloud engineering and domain expertise. The chart shows the shift in PE majority/minority deals, while the text emphasizes market timing, domain-driven investments, and notable exits, pointing to a maturing market for direct investments.
Take-private, PE direct investment, IT MSP, cybersecurity, exits, platform creation
false
Mergers and Acquisitions
Technology & Software
Multiple Chart
EY
Add to my slides
Remove from favorites
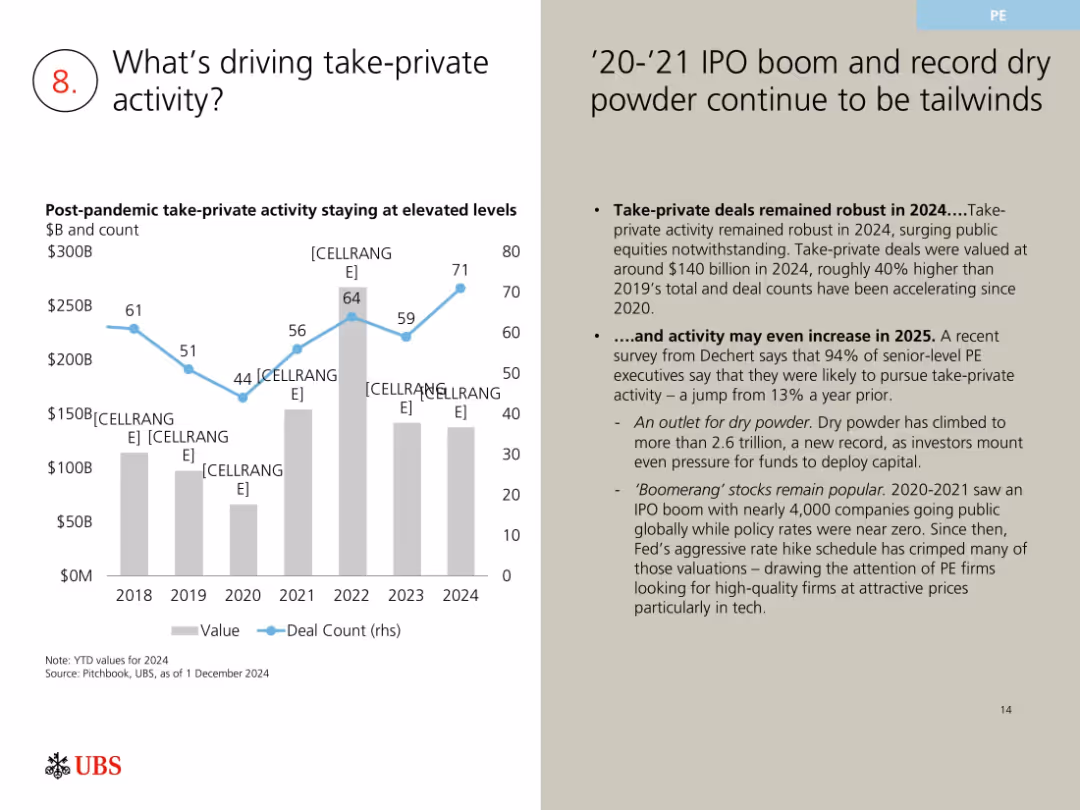
Left-aligned chart with blue line and gray bars; right-hand side has bulleted analysis text on a beige background.
Market Analysis and Trends
Financial Services
The slide examines why take-private deals remain strong post-pandemic. Key drivers include ample dry powder, tech valuations, and interest from PE firms. The 2020-2024 chart shows increasing deal counts and value, signaling robust ongoing interest and possibly more in 2025.
take-private, PE, dry powder, IPO boom, 2024 deals, valuations, M&A
false
Market Analysis and Trends
Financial Services
Mixed Chart
UBS
Add to my slides
Remove from favorites
Combines text sections and graphical elements to discuss talent acquisition strategies and neurodiversity initiatives.
Strategic Planning
Professional Services
Details strategies to attract and develop talent, highlighting the firm's inclusive goals and partnerships.
talent acquisition, neurodiversity, recruitment, analytics, growth strategy
false
Strategic Planning
Professional Services
Text Only
Booz Allen Hamilton
Add to my slides
Remove from favorites
This slide has a blue and white color scheme with four sections labeled A to D with icons and short texts. There is a sidebar that has the main points in a larger text size.
Human Resources and Talent Management
Technology & Software
The slide details strategies for effective talent acquisition to improve candidate pool, conversion, and success rate. It's suitable for HR departments and recruitment agencies.
talent acquisition, strategy, HR, recruitment, candidate pool, conversion rate, onboarding, success rate
false
Human Resources and Talent Management
Technology & Software
Header Horizontal
Kearney
Add to my slides
Remove from favorites
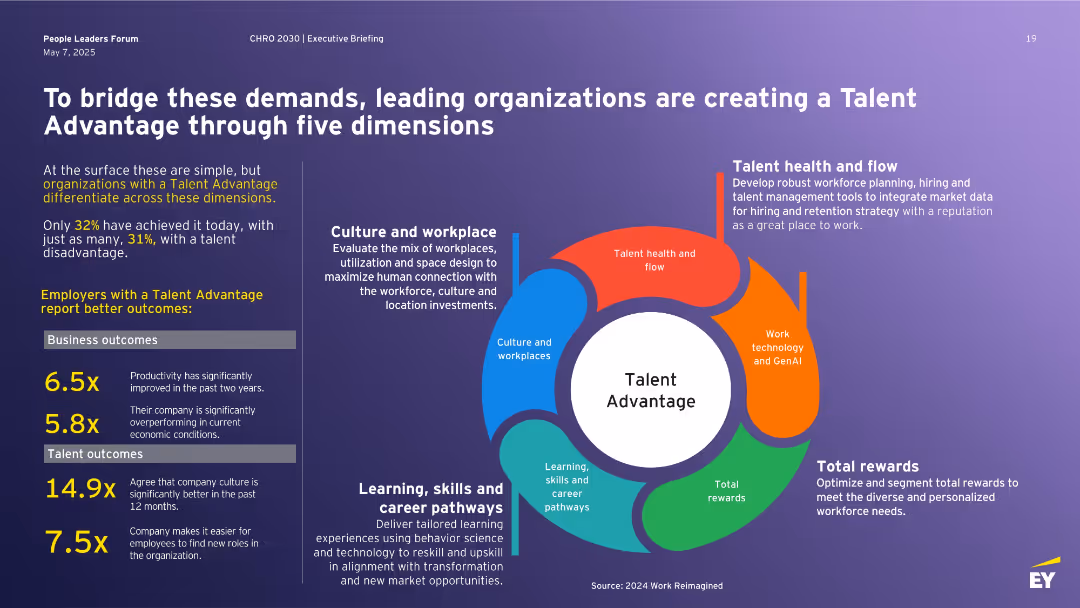
Left block of stats and outcomes; right side features a circular infographic with five dimensions of Talent Advantage: culture, learning, rewards, health, and tech.
Human Resources and Talent Management
Professional Services
Describes how leading companies build a Talent Advantage across five dimensions to address workforce challenges. Includes stats on performance outcomes for talent-advantaged firms and emphasizes the strategic value of culture, learning pathways, reward systems, technology, and workforce planning to stay competitive.
Talent Advantage, workforce strategy, learning, rewards, culture, technology, retention
false
Human Resources and Talent Management
Professional Services
Vertical Flow
EY
Add to my slides
Remove from favorites
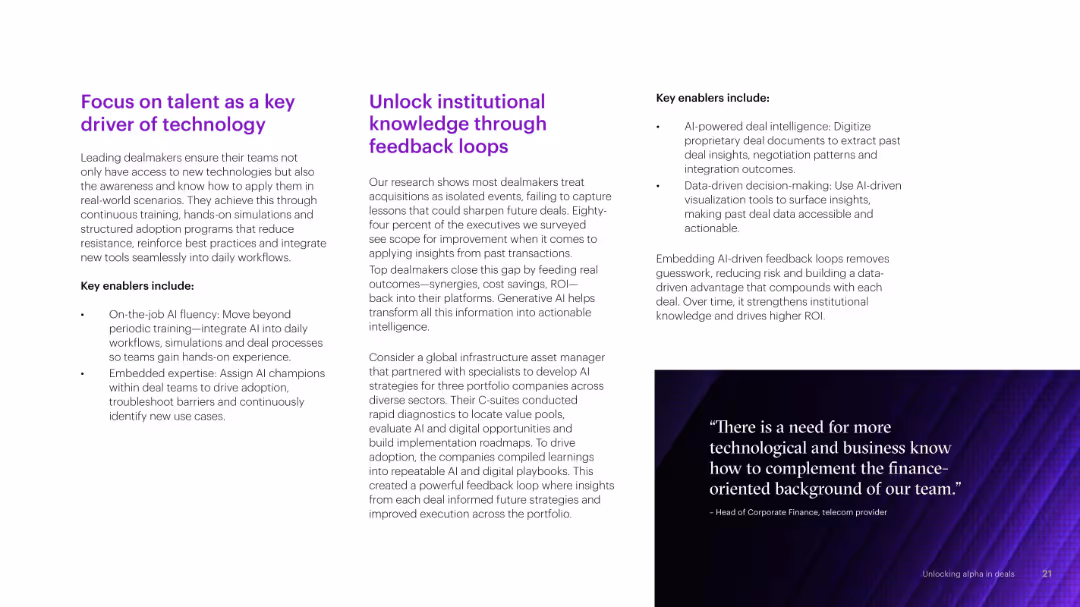
Two-column layout with text and bullet points on talent development and AI champions. Includes a visual quote box. Light background with purple accents.
Organizational Structure and Change
Artificial Intelligence
Explains the importance of hands-on AI training and the role of internal AI champions. Emphasizes the human element of digital transformation through continuous learning and structured adoption processes.
talent, AI fluency, champions, training, transformation
false
Organizational Structure and Change
Artificial Intelligence
Header Horizontal
Accenture
Add to my slides
Remove from favorites
The slide features a column chart showing various methods banks are using to attract and retain talent, including adjusted salaries and enhanced career progression programs.
Human Resources and Talent Management
Financial Services
This slide presents different strategies banks are employing to attract and retain talent, such as offering competitive salaries, developing flexible work schedules, and enhancing employee experience.
talent attraction, banks, column charts, retention
false
Human Resources and Talent Management
Financial Services
Multiple Chart
EY
Add to my slides
Remove from favorites
Line chart detailing responses regarding I&D in talent attraction, highlighting differences between North American and other respondents with demographic insights.
Strategic Planning
Professional Services
Evaluates the perceived effectiveness of I&D in attracting talent, particularly from the perspective of U.S. non-minority women.
talent attraction, I&D, U.S., non-minority women, line chart, demographic analysis, effectiveness evaluation
false
Strategic Planning
Professional Services
Mixed Chart
Accenture
Add to my slides
Remove from favorites
Two columns present percentage metrics and years of experience with highlights, and a quote from a Goldman Sachs client.
Human Resources and Talent Management
Financial Services
Highlights the firm's focus on exceptional talent, exemplified by leadership experience and diversity within its workforce.
talent, client focus, leadership, diversity, workforce, Goldman Sachs, retention rate, talent management
false
Human Resources and Talent Management
Financial Services
Boxed
Goldman Sachs
Add to my slides
Remove from favorites
A central circular diagram with four segments, each representing a different aspect of company culture, surrounded by additional quantitative data.
Organizational Structure and Change
Financial Services
Showcases the firm's cultural strengths and accolades, highlighting factors like client service and partnership through a segmented circle diagram.
talent, culture, service, partnership, integrity
false
Organizational Structure and Change
Financial Services
Framework
Goldman Sachs
Add to my slides
Remove from favorites
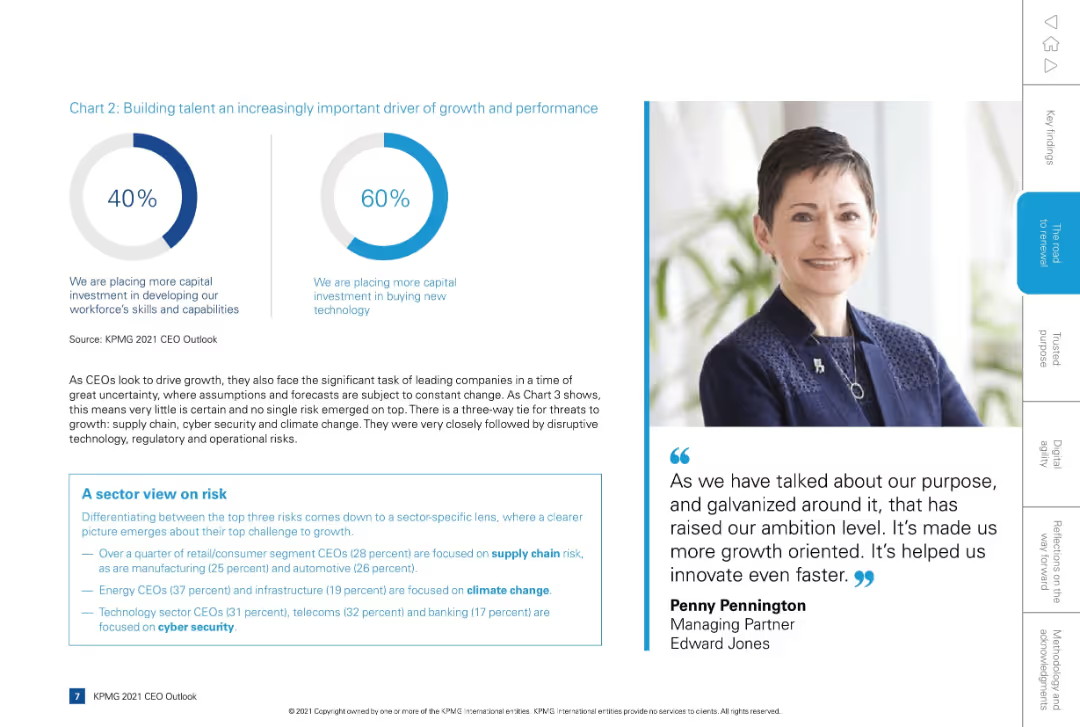
Left side contains a dual pie chart (skills vs. tech investment), bottom left includes a boxed text segment. Right side features an executive photo + quote.
Human Resources and Talent Management
Professional Services
Focuses on capital investment in workforce skills (40%) vs. technology (60%) and sector-specific risk insights. Emphasizes the increasing importance of people investments for growth. Includes commentary on top risks like supply chain, cybersecurity, and climate change, and a quote about innovation and purpose.
talent development, capital investment, risk, cybersecurity, skills, ESG
false
Human Resources and Talent Management
Professional Services
Mixed Chart
KPMG
Add to my slides
Remove from favorites
Text-heavy layout detailing talent development programs and technical experience groups within the company.
Strategic Planning
Professional Services
Explains the integration of learning technology to enhance the company's ecosystem and workforce management.
talent development, learning, technology, workforce strategy, growth
false
Strategic Planning
Professional Services
Boxed
Booz Allen Hamilton
Add to my slides
Remove from favorites
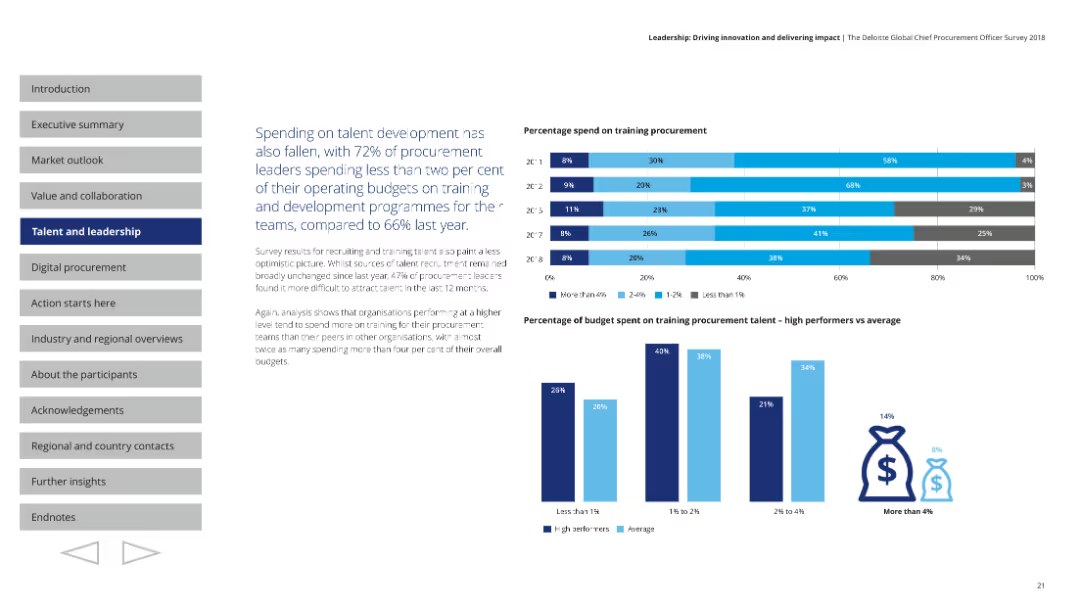
Horizontal bar charts showing the percentage of operating budget spent on training procurement talent. Additional charts compare high performers vs. average in spending. The layout uses blue shades and clear sections for easy comparison.
Human Resources and Talent Management
Professional Services
Discusses the decline in spending on talent development, with 72% of leaders spending less than 2% of their budgets on training. Highlights the disparity in spending between high performers and average organizations, emphasizing the need for better investment in talent.
talent development, procurement, training, budget, investment
false
Human Resources and Talent Management
Professional Services
Multiple Chart
Deloitte
Add to my slides
Remove from favorites
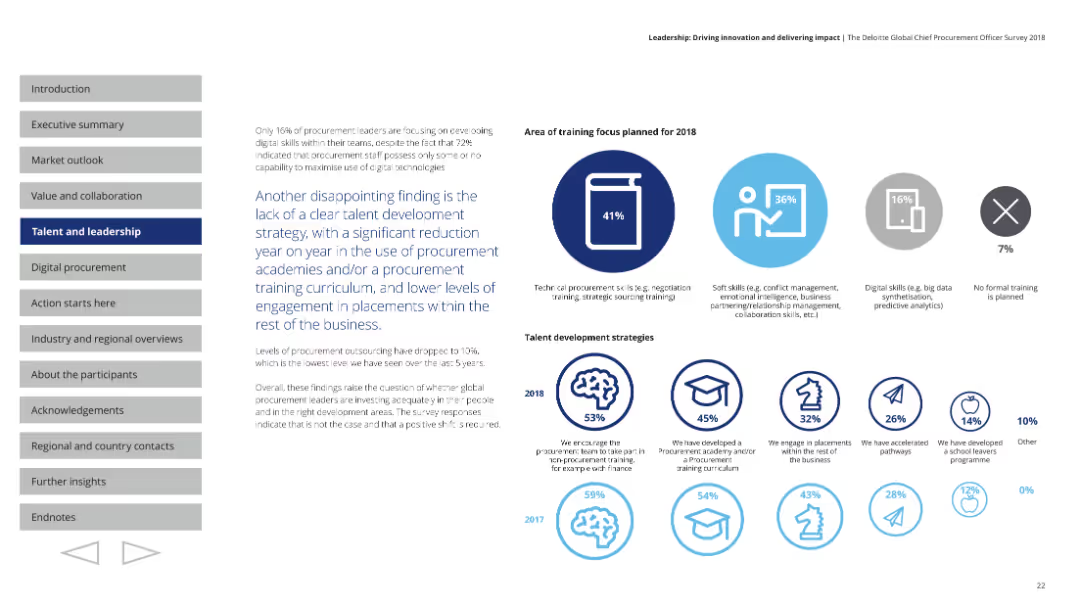
A pie chart showing the area of training focus for 2018, including technical, soft, and digital skills. Additional circular diagrams illustrate various talent development strategies. Text on the left with visual elements on the right, using blue and grey shades.
Human Resources and Talent Management
Professional Services
Highlights the lack of a clear talent development strategy in procurement, with a significant reduction in training investments. Emphasizes the need for strategic talent development plans and better engagement in training programs within the business.
talent development, training, strategy, procurement, skills
false
Human Resources and Talent Management
Professional Services
Multiple Chart
Deloitte
Add to my slides
Remove from favorites
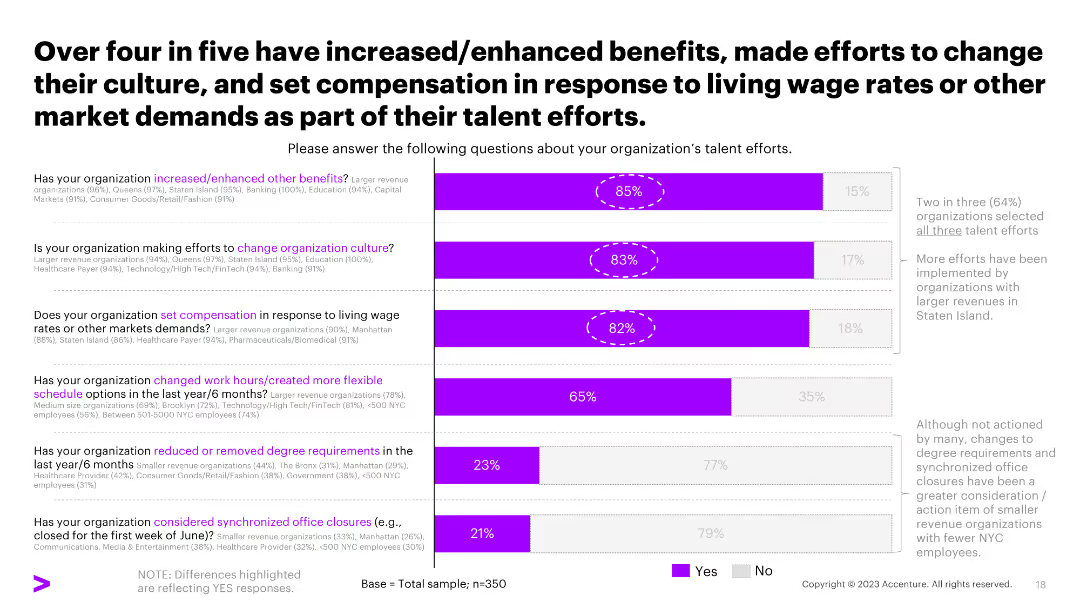
The slide features a column chart indicating organizational talent efforts, such as enhancing benefits and changing culture. The design is moderately dense with text and visuals.
Human Resources and Talent Management
Professional Services
Highlights various organizational efforts to enhance benefits, culture, and compensation in response to market demands.
talent efforts, benefits, culture, compensation, market demands
false
Human Resources and Talent Management
Professional Services
Single Chart
Accenture
Add to my slides
Remove from favorites
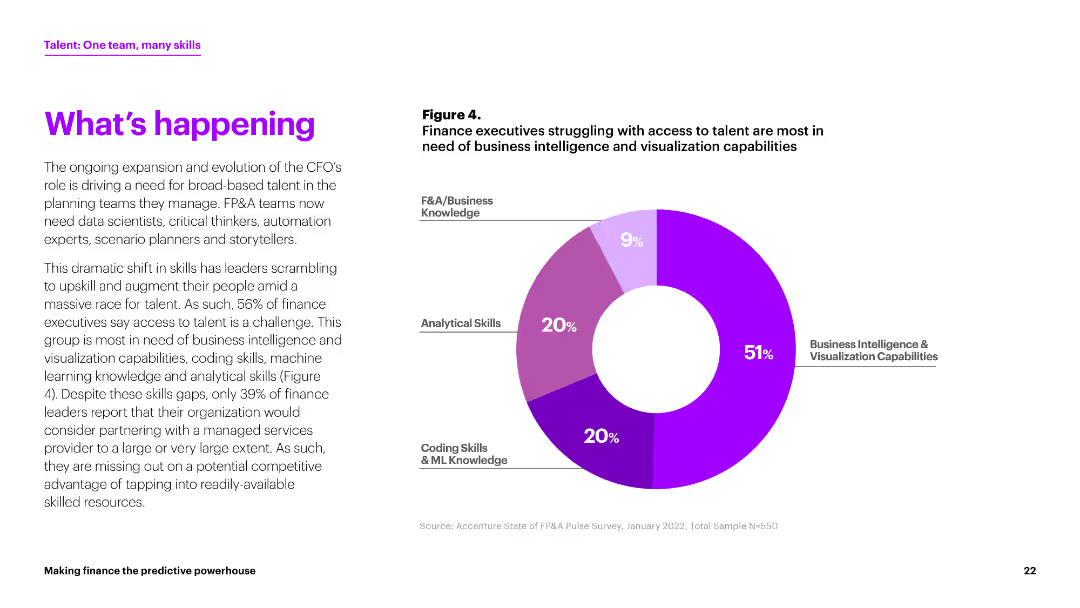
The slide includes a pie chart showing the percentage of finance executives struggling with access to talent in various skill areas. The chart is in shades of purple. The text discusses the implications of these findings.
Human Resources and Talent Management
Financial Services
This slide discusses the need for finance teams to have diverse skills, highlighting that 51% of executives struggle with business intelligence and visualization capabilities.
talent, finance executives, skills, business intelligence, visualization
false
Human Resources and Talent Management
Financial Services
Mixed Chart
Accenture
Add to my slides
Remove from favorites
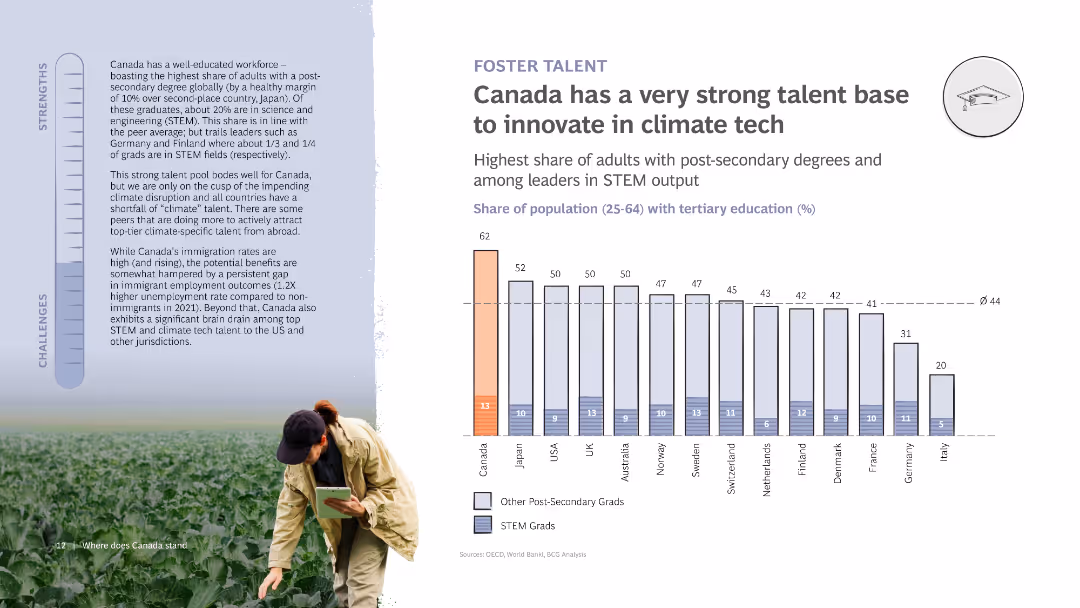
The slide features a column chart comparing tertiary education levels in various countries. It includes a photo of a person in a field, a strengths and challenges bar, and detailed text discussing Canada's educational strengths.
Human Resources and Talent Management
Education & Training
Discusses Canada's strong educational base for climate tech innovation, highlighting high post-secondary education rates and STEM graduates. Includes challenges in immigration rates and talent retention.
Talent, Innovation, Climate tech, Education, Canada
false
Human Resources and Talent Management
Education & Training
Mixed Chart
BCG
Add to my slides
Remove from favorites
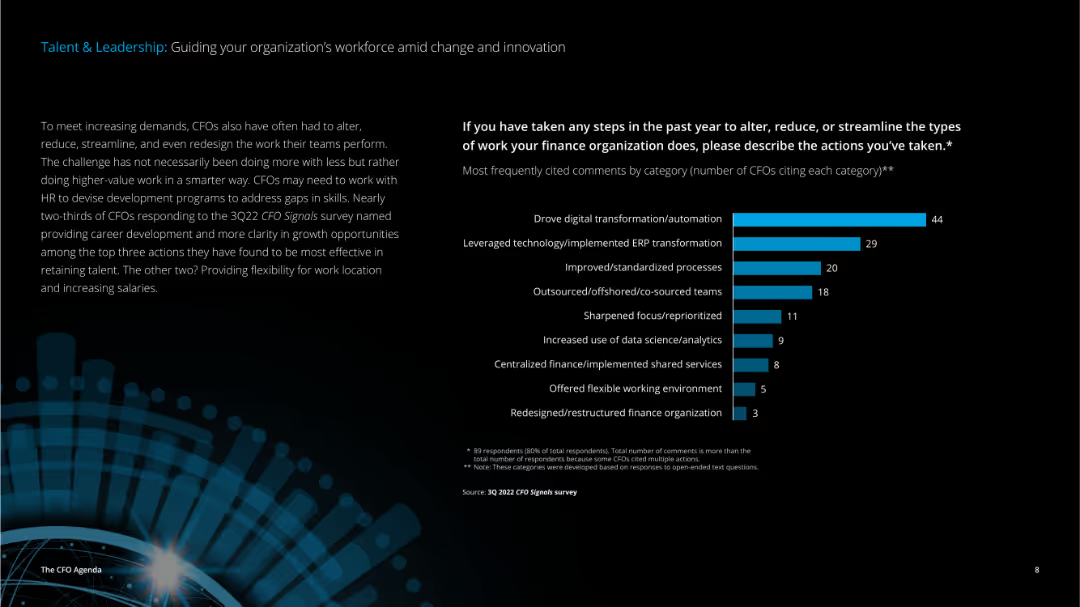
The slide has a detailed text on the left discussing CFO responsibilities and a vertical column chart on the right showing actions taken to streamline finance operations.
Human Resources and Talent Management
Professional Services
This slide outlines the steps CFOs have taken to improve finance operations, focusing on digital transformation, ERP implementation, and process improvements to better manage workforce changes and innovations.
talent, leadership, workforce, innovation, CFO, digital transformation, ERP, process improvement, finance operations
false
Human Resources and Talent Management
Professional Services
Mixed Chart
Deloitte
Add to my slides
Remove from favorites
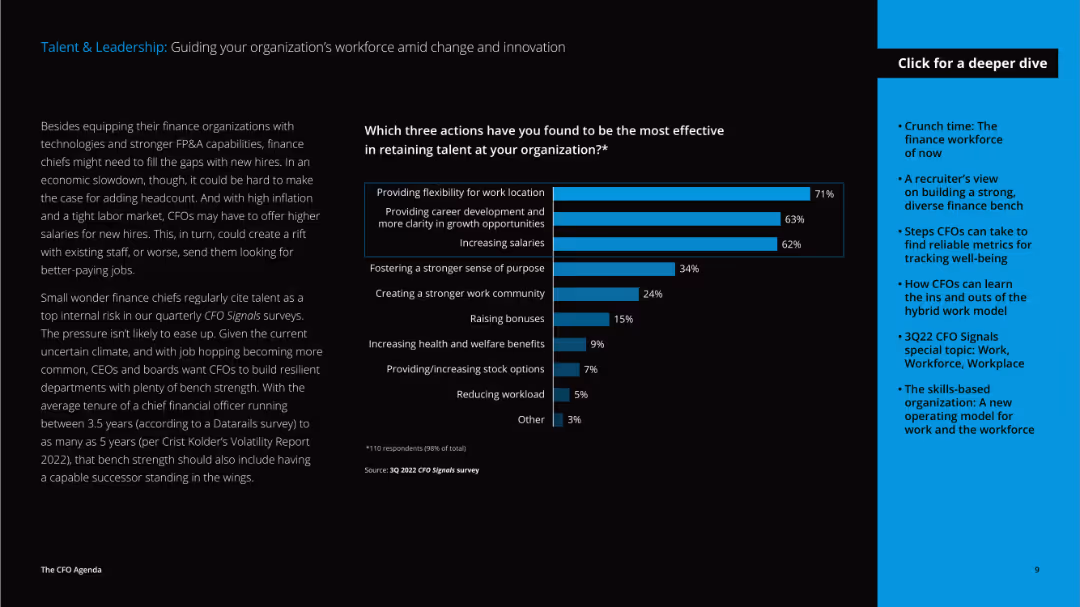
The slide features a detailed text on the left discussing talent retention strategies and a vertical column chart on the right showing effective actions taken by organizations.
Human Resources and Talent Management
Professional Services
The slide discusses strategies for retaining talent, including providing work flexibility, career development, and increasing salaries, highlighting the challenges and solutions CFOs face in talent management.
talent, leadership, workforce, retention, flexibility, career development, salaries, CFO, challenges, solutions
false
Human Resources and Talent Management
Professional Services
Mixed Chart
Deloitte
Add to my slides
Remove from favorites
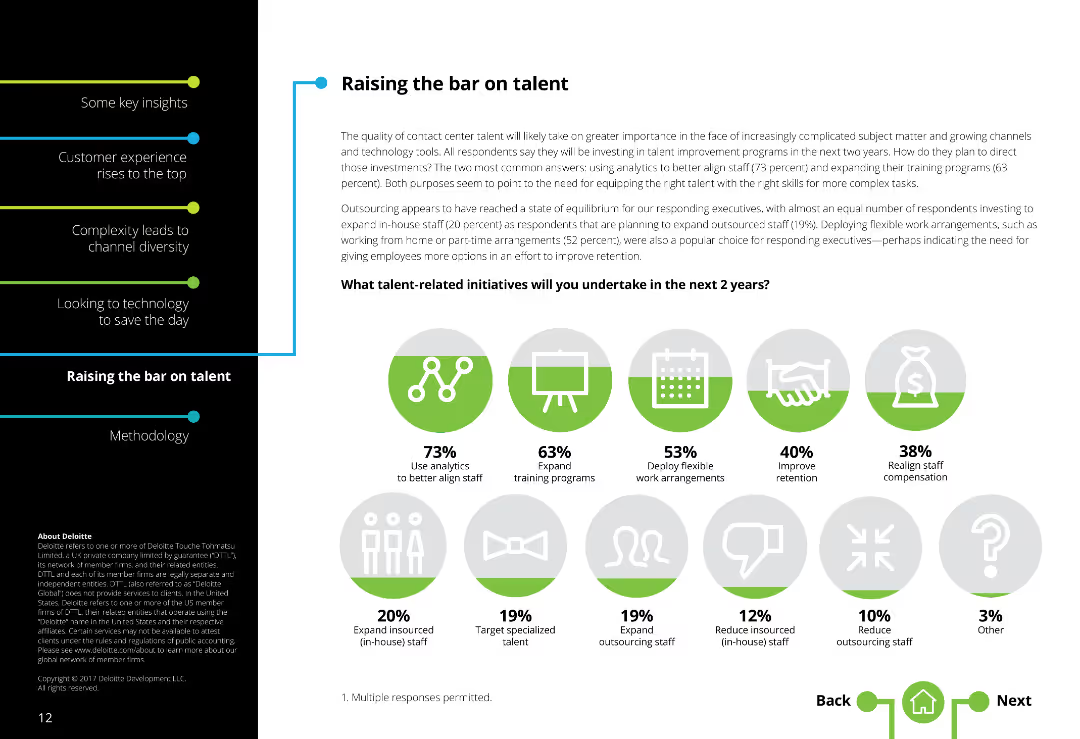
Two-column layout with text on the left and icons representing various talent initiatives on the right. Text density is moderate.
Market Analysis and Trends
Professional Services
Discusses initiatives for improving talent in contact centers, such as using analytics for staff, expanding training programs, and deploying flexible work arrangements.
Talent management, Contact centers, Analytics, Training programs, Flexible work arrangements, Staff improvement
false
Market Analysis and Trends
Professional Services
Mixed Chart
Deloitte
Add to my slides
Remove from favorites
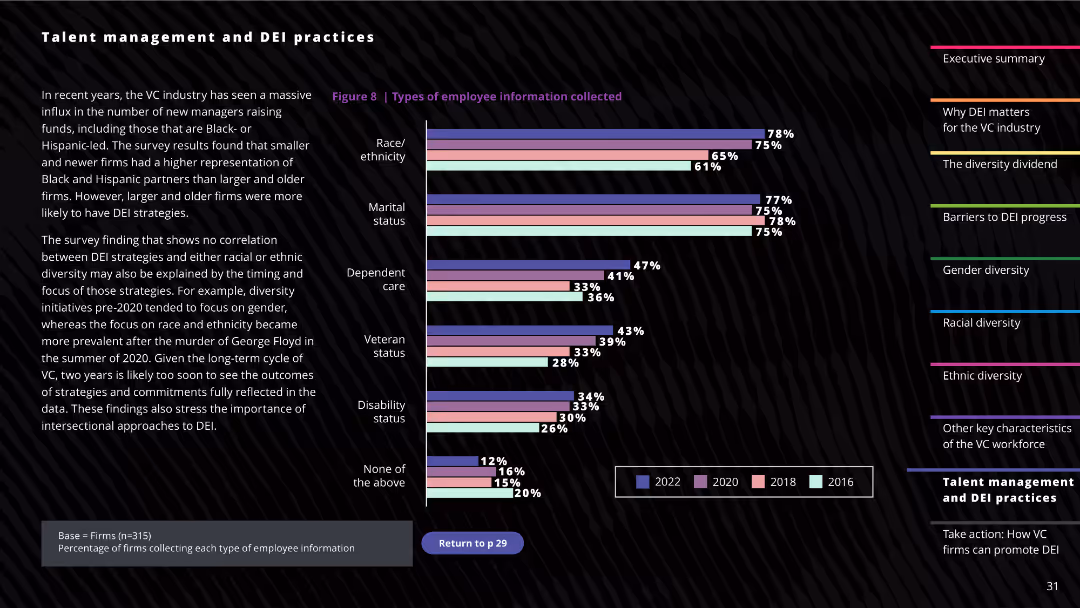
The slide contains a column chart showing the types of employee information collected by firms, such as race/ethnicity, marital status, and veteran status. Textual descriptions and notes on the importance of DEI practices are included.
Human Resources and Talent Management
Professional Services
This slide presents data on the types of demographic information collected by firms to support DEI practices, highlighting the increasing focus on race, ethnicity, and other diversity factors within the workforce.
Talent management, DEI practices, Employee information, Workforce diversity, Demographic data
false
Human Resources and Talent Management
Professional Services
Mixed Chart
Deloitte
Add to my slides
Remove from favorites
Combines text with bar charts to highlight the differences in how highly resilient boards handle talent and culture-related issues.
Human Resources and Talent Management
Professional Services
The slide discusses the importance of prioritizing talent discussions, using data to drive insights, and overseeing DE&I initiatives, comparing highly resilient boards to less resilient ones.
talent management, DE&I, resilient boards, professional services, data insights, culture, bar charts
false
Human Resources and Talent Management
Professional Services
Multiple Chart
EY
Add to my slides
Remove from favorites
Contains stats on talent acquisition and diversity spotlight, presented in a two-column layout. It's clear with a corporate blue and gray color palette.
Human Resources and Talent Management
Financial Services
This slide emphasizes Goldman Sachs' commitment to talent development and diversity, sharing figures on partner promotions and diversity increases, potentially used in HR presentations or recruitment campaigns to exhibit the company's values and performance culture.
Talent management, diversity, human resources, Goldman Sachs, culture
false
Human Resources and Talent Management
Financial Services
Boxed
Goldman Sachs
Add to my slides
Remove from favorites
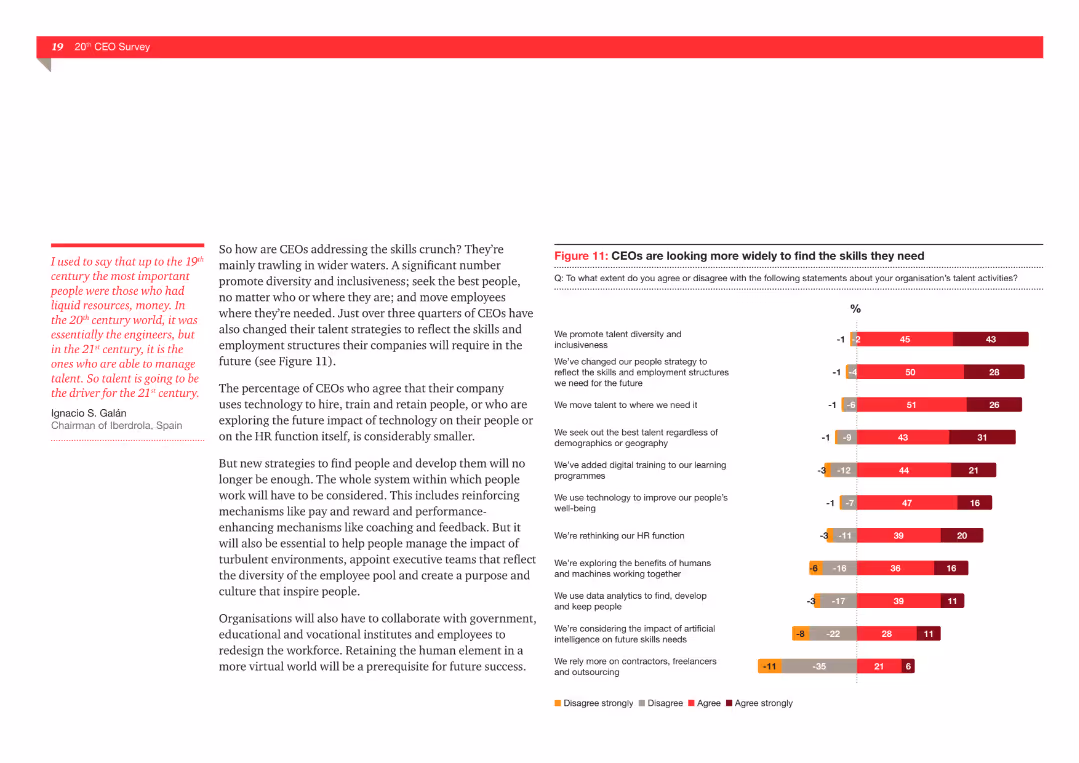
The slide presents a column chart showing the percentage of CEOs agreeing with various statements about their organization's talent activities, such as promoting diversity and using technology to improve well-being.
Human Resources and Talent Management
Professional Services
This slide explores the extent to which CEOs agree or disagree with various talent management strategies, including promoting diversity, changing people strategy, and using technology for employee well-being.
Talent management, diversity, technology, well-being, CEOs, recruitment, HR strategies
false
Human Resources and Talent Management
Professional Services
Mixed Chart
PwC/Strategy&
Add to my slides
Remove from favorites
Slide contains multiple bar charts. The layout is clean with blue and gray color scheme, minimal text outside the charts.
Human Resources and Talent Management
Professional Services
Discusses strategies and challenges in talent management within GBS, highlighting key initiatives and challenges with talent retention and acquisition.
Talent management, GBS, initiatives, challenges, retention
false
Human Resources and Talent Management
Professional Services
Multiple Chart
Deloitte
Add to my slides
Remove from favorites
Slide with four bar charts and accompanying text blocks highlighting talent presence in various industries in Italy, colored distinctly for each sector.
Human Resources and Talent Management
Technology & Software
Discusses talent distribution across different sectors, emphasizing on the gaps and how companies might bridge these to match top-performing companies.
talent management, HR, technology, analytics, digital marketing
false
Human Resources and Talent Management
Technology & Software
Multiple Chart
Bain
Add to my slides
Remove from favorites
A series of circular graphics and arrows guide the eye through various stages of talent development. Ample text supports the visuals, creating a moderately dense slide.
Operational Efficiency
Education & Training
This slide outlines the stages in building and managing a talent pool for the Tempest partners. It addresses workforce development strategies from school outreach to inclusive opportunities.
talent management, school outreach, apprenticeships, graduates, skills policy, inclusive opportunities, STEM, workforce development
false
Operational Efficiency
Education & Training
Linear Flow
PwC/Strategy&
Add to my slides
Remove from favorites
The slide showcases horizontal bar charts comparing the superior ratings in talent management from two different years across various criteria. Each bar is distinctly color-coded to represent different years, enhancing the visual comparison between them.
Human Resources and Talent Management
Financial Services
Compares talent management performance across two surveys, showing trends over time in aspects like collaboration and career path development. It’s instrumental for longitudinal analysis and strategic planning in human resources within the financial sector.
talent management, trends, comparison, historical data, HR, financial services
false
Human Resources and Talent Management
Financial Services
Single Chart
Accenture
Add to my slides
Remove from favorites
The slide contains multiple horizontal bar charts comparing the performance of various talent management aspects within an organization. It uses color gradients to represent different performance ratings from superior to deficient, labeled for easy interpretation.
Human Resources and Talent Management
Financial Services
Examines the performance of different talent management practices like recruitment, training, and succession planning in underwriting. Highlights areas needing improvement and those performing well, essential for HR strategy development in financial services.
talent management, underwriting, performance, HR, recruitment, training, succession planning
false
Human Resources and Talent Management
Financial Services
Single Chart
Accenture
Add to my slides
Remove from favorites
Slide with a mixed bar and column chart and lists detailing aspects of work-from-home programs and staffing strategies in contact centers. Colors vary between green shades for clarity.
Human Resources and Talent Management
Professional Services
Explores talent management strategies within global contact centers, focusing on work-from-home programs and responses to staffing shortages.
Talent Management, Work-From-Home, Staffing Strategies, Contact Centers, Global Trends, Human Resources
false
Human Resources and Talent Management
Professional Services
Multiple Chart
Deloitte
Add to my slides
Remove from favorites
Line chart showing trends from 2013 to 2022 with annotations and an insight box. Muted purple theme with graphical data points at intervals.
Market Analysis and Trends
Professional Services
Discusses trends in companies having the right talent to leverage marketing analytics, highlighting industry-specific gaps and overall satisfaction levels.
talent, marketing analytics, B2B, B2C, industry trends
false
Market Analysis and Trends
Professional Services
Mixed Chart
Deloitte
Add to my slides
Remove from favorites
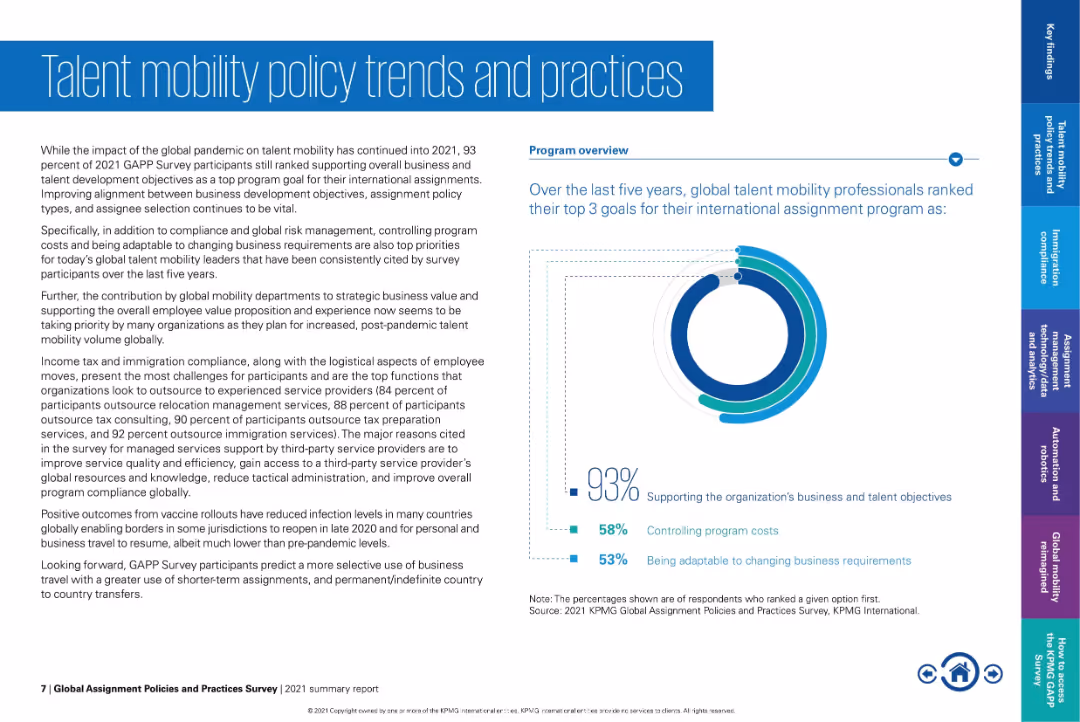
Text-heavy slide with central chart and left-aligned narrative. Circular chart on the right visualizes top global mobility program goals.
Human Resources and Talent Management
Professional Services
The slide identifies key goals in international talent mobility programs based on survey results. It emphasizes alignment with business objectives, controlling costs, and adapting to business needs. A circular infographic illustrates percentage breakdowns.
talent mobility, workforce strategy, employee relocation, business alignment, cost control, global HR, survey results, policy trends
false
Human Resources and Talent Management
Professional Services
Mixed Chart
KPMG
Add to my slides
Remove from favorites
White background with a single purple column chart on talent confidence in NYC
Human Resources and Talent Management
Technology & Software
It shows the confidence levels of companies in securing tech skills from New York City's talent pool
Talent, NYC, Confidence, Tech Skills, Workforce
false
Human Resources and Talent Management
Technology & Software
Multiple Chart
Accenture
Add to my slides
Remove from favorites
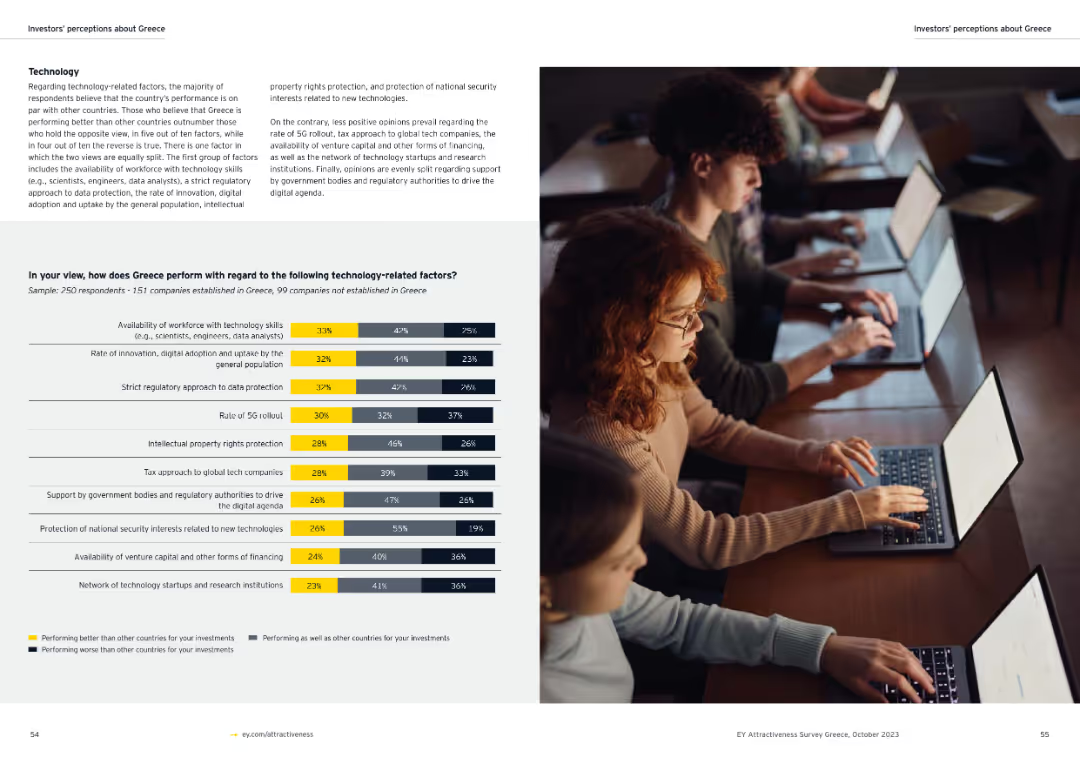
The slide has text about talent management in Greece, with a table showing various talent-related areas and percentages indicating performance comparison.
Human Resources and Talent Management
Education & Training
The slide discusses Greece’s performance in talent-related areas, such as workplace culture, training, digital skills, and business-oriented curriculum, highlighting areas of strength and weakness.
talent, performance, Greece, workplace, training, digital skills, curriculum
false
Human Resources and Talent Management
Education & Training
Mixed Chart
EY
Add to my slides
Remove from favorites
A column chart and bullet points showing sentiments of skilled workers feeling underqualified to apply for multinational jobs.
Human Resources and Talent Management
Professional Services
Discusses the challenges and opportunities for multinational companies in tapping into underutilized skilled talent pools.
Talent pools, skilled workers, multinational hiring, job application challenges
false
Human Resources and Talent Management
Professional Services
Mixed Chart
Accenture
Add to my slides
Remove from favorites
The slide features a bubble chart and a text section. The chart displays preferences of highly skilled workers by country in percentages, with bubble sizes representing worker numbers.
Market Analysis and Trends
Professional Services
Discusses the preference of skilled workers in various countries for multinational companies, balancing business priorities and sustainability.
talent preferences, multinational companies, skilled workers, business priorities, sustainability goals, global markets, workforce trends
false
Market Analysis and Trends
Professional Services
Mixed Chart
Accenture
Add to my slides
Remove from favorites
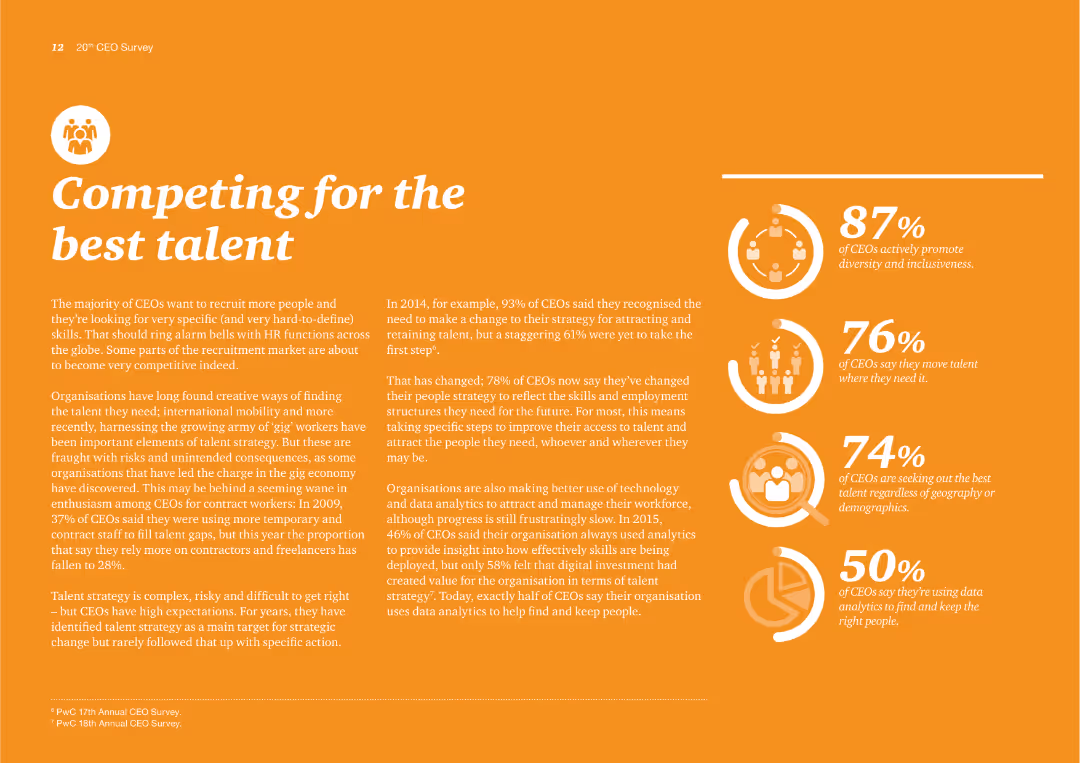
Orange background with percentage statistics on CEO actions: promoting diversity, moving talent, seeking talent, and using data analytics. Text discusses recruitment trends and challenges.
Human Resources and Talent Management
Professional Services
The slide details CEO strategies for attracting and retaining talent, highlighting diversity, mobility, and data analytics in talent management practices.
Talent, Recruitment, CEOs, Diversity, Mobility, Data analytics, Talent management, Strategies, Trends, Challenges
false
Human Resources and Talent Management
Professional Services
Multiple Chart
PwC/Strategy&
Add to my slides
Remove from favorites
The slide presents a statement on talent recruitment priorities with an arrow pointing towards the statistic that 87% of companies prefer cultural fit. It features a bar graph with percentages of respondents and statements on recruitment strategies. The design uses contrasting colors to distinguish between different categories of responses.
Human Resources and Talent Management
Professional Services
This slide addresses a contradiction in recruitment strategy where a significant majority of companies favor cultural fit over innovative thinking. It uses a bar graph to depict responses of all participants, and includes direct quotes from companies explaining their approach towards balancing cultural fit and diversity of thought in their hiring processes.
talent recruitment, cultural fit, disruptive thinking, company strategy, hiring, innovation, survey
false
Human Resources and Talent Management
Professional Services
Text Only
Kearney
Add to my slides
Remove from favorites
The slide contains three overlapping circles in shades of blue, symbolizing a Venn diagram with icons and short texts within. It features rankings and statistics related to talent recruitment and development in a clear, easy-to-read sans-serif font.
Human Resources and Talent Management
Financial Services
This slide presents the company's standing as a top employer, showcasing its attractiveness to both new recruits and experienced talent. It demonstrates the company's achievements in talent development, with a focus on leadership development statistics.
talent, recruitment, employer, leadership, development, rankings, statistics, Venn diagram
false
Human Resources and Talent Management
Financial Services
Framework
Goldman Sachs
Add to my slides
Remove from favorites
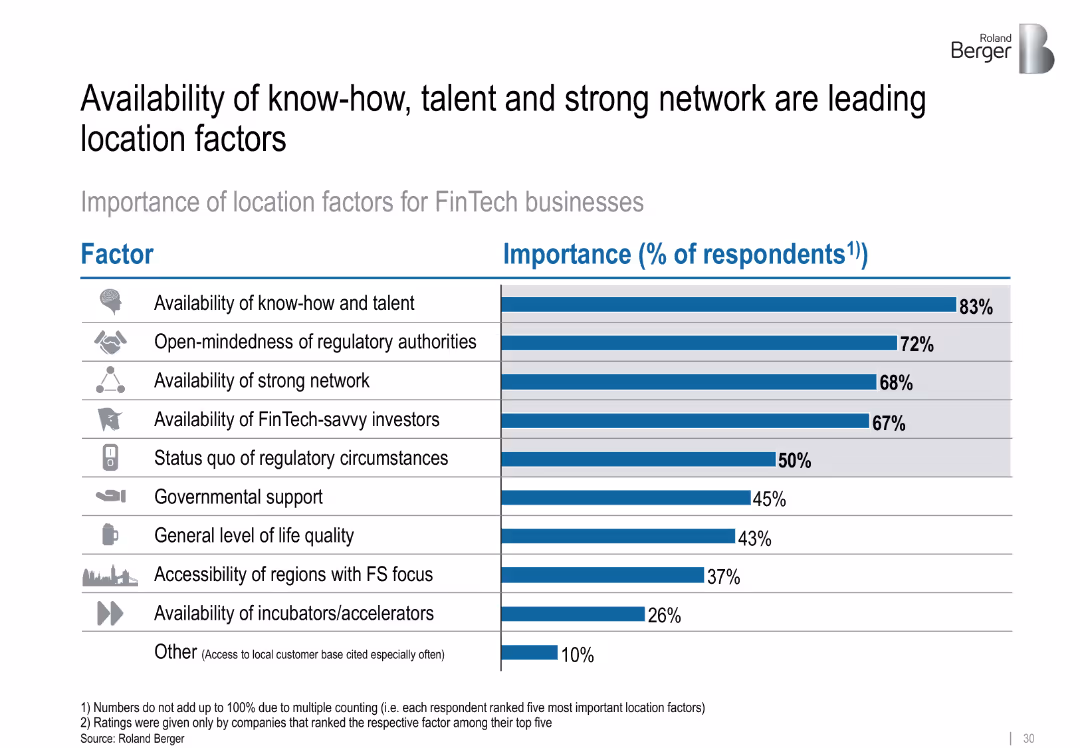
Bar chart displays percentage importance of location factors; icons represent each factor; clean layout with horizontal bar emphasis
Market Analysis and Trends
Financial Services
Key factors for choosing FinTech business locations include access to talent, regulatory openness, and strong networks. Investors and regulatory support also matter. The slide quantifies each factor’s importance based on respondent input.
talent, regulatory support, network, investors, FinTech, location factors, business environment
false
Market Analysis and Trends
Financial Services
Single Chart
Roland Berger
Add to my slides
Remove from favorites
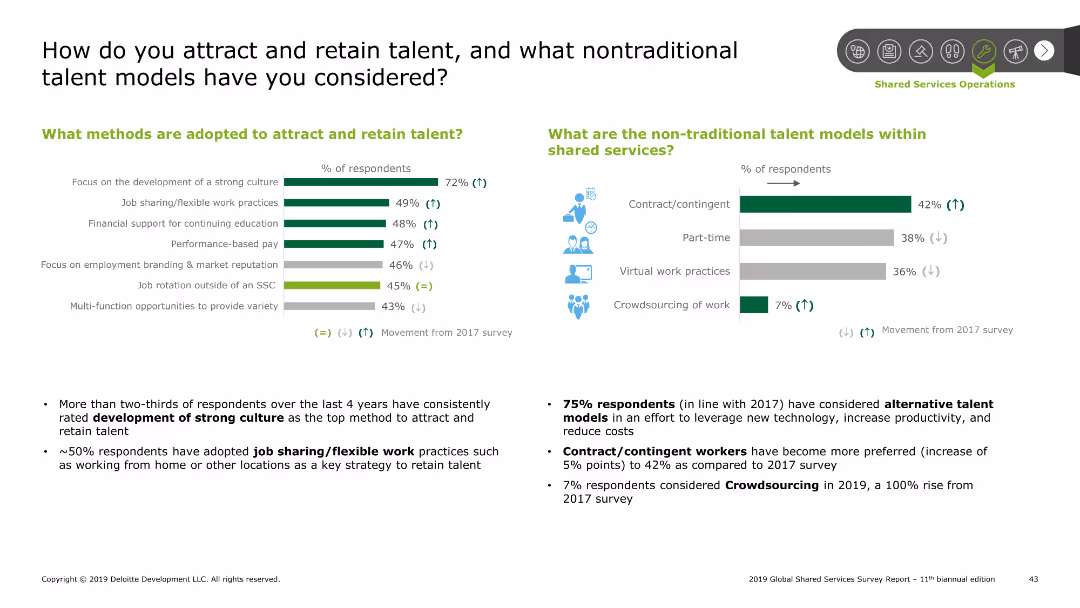
The slide is divided into two main sections with column charts and icons. The left section focuses on traditional methods, while the right on non-traditional models.
Human Resources and Talent Management
Professional Services
Discusses various methods for attracting and retaining talent, highlighting the percentage of respondents adopting each method, and trends in non-traditional talent models like crowdsourcing.
talent, retention, culture, non-traditional, job sharing, contingent, flexible, performance, branding, rotation
false
Human Resources and Talent Management
Professional Services
Multiple Chart
Deloitte
Add to my slides
Remove from favorites
Slide shows a line chart analyzing the perspectives on talent retention within I&D frameworks, comparing U.S. and global views with demographic detail.
Strategic Planning
Professional Services
Discusses opinions from U.S. non-minority women on improving I&D efforts in talent retention.
talent retention, I&D, U.S., non-minority women, line chart, global comparison, improvement opportunities
false
Strategic Planning
Professional Services
Mixed Chart
Accenture
Add to my slides
Remove from favorites
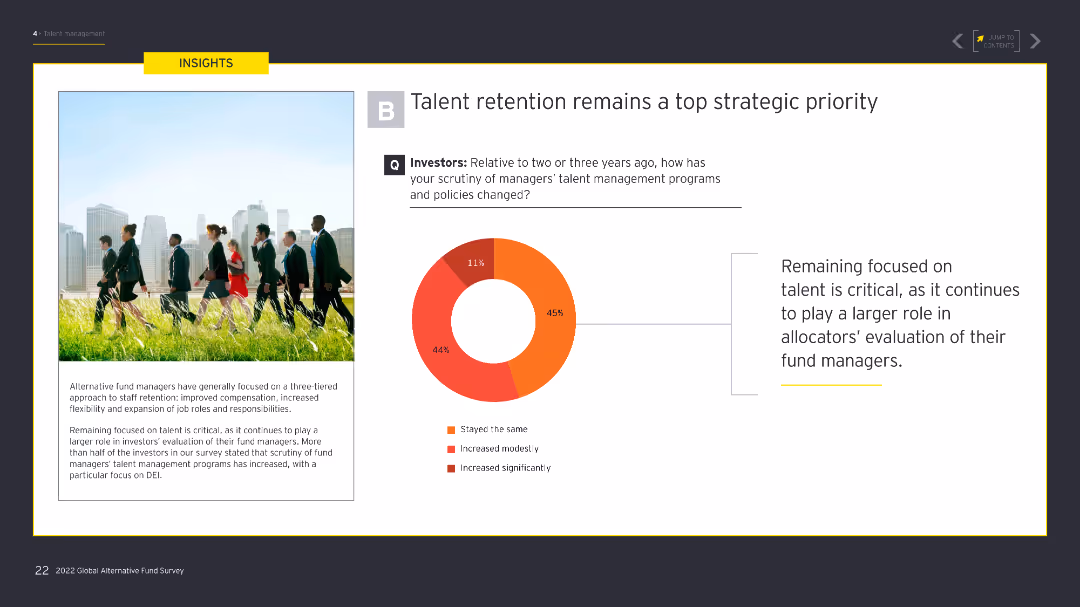
The slide contains a donut chart showing the level of scrutiny investors have on managers' talent management programs. The left side has an image of professionals walking in a park. The donut chart uses shades of red and orange to indicate different levels of scrutiny.
Human Resources and Talent Management
Financial Services
The slide emphasizes the increased focus on talent retention among investors, showing that scrutiny of talent management programs has grown significantly over the past few years, reflecting its strategic importance.
Talent retention, investor scrutiny, DEI, talent management, strategic priority
false
Human Resources and Talent Management
Financial Services
Mixed Chart
EY
Add to my slides
Remove from favorites
Contains a mix of text and bar charts, detailing reasons for job satisfaction and factors that attract Gen Zs and millennials to employers.
Human Resources and Talent Management
Professional Services
The slide discusses strategies for employers to attract and retain Gen Z and millennial talent, focusing on key factors like work-life balance, learning opportunities, and salary. It includes supporting bar charts showing the importance of these factors.
Talent retention, job satisfaction, employers, Gen Z, millennials
false
Human Resources and Talent Management
Professional Services
Mixed Chart
Deloitte
Add to my slides
Remove from favorites
The slide features a column chart depicting managers' top three talent management priorities. On the left side, there is an image of a group of professionals in a meeting. The chart uses a mix of orange and red shades to represent different priorities.
Human Resources and Talent Management
Financial Services
The slide highlights that retaining talent is the top priority for managers, followed by hiring/recruiting and ensuring an inclusive culture. It shows that talent retention is critical, particularly in EMEA and Asia-Pacific regions.
Talent retention, recruiting, inclusive culture, diversity, hybrid work, employee productivity
false
Human Resources and Talent Management
Financial Services
Mixed Chart
EY
Add to my slides
Remove from favorites
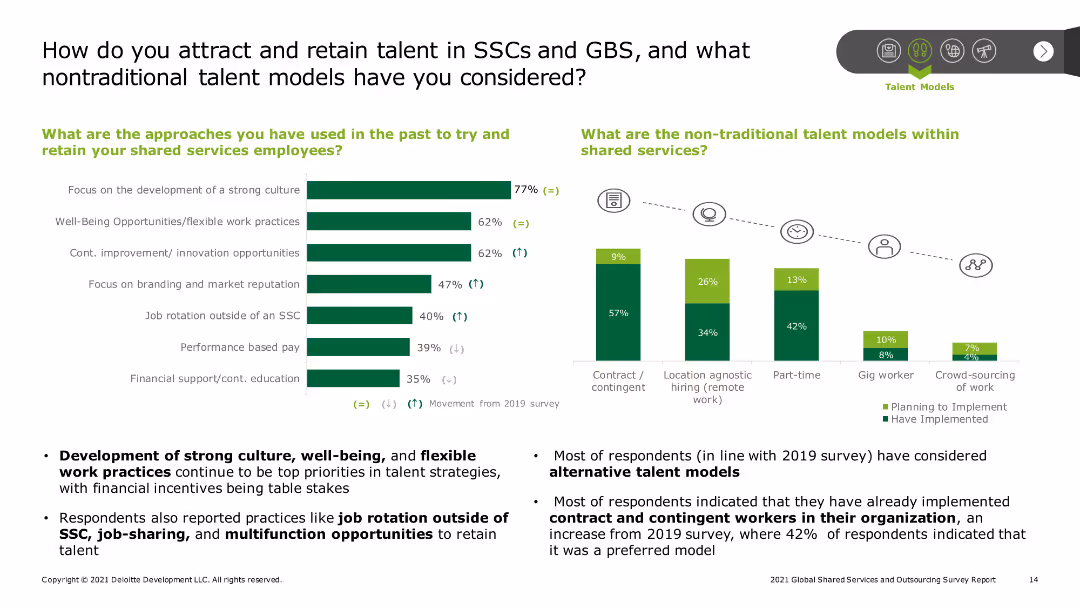
The slide contains a column chart on the left displaying various approaches for talent retention and a bar chart on the right depicting the non-traditional talent models within shared services. Text descriptions highlight key statistics and findings.
Human Resources and Talent Management
Professional Services
The slide discusses strategies for attracting and retaining talent in Shared Services Centers (SSCs) and Global Business Services (GBS), including traditional and non-traditional models. Key points include development of strong culture and flexible work practices.
Talent retention, SSC, GBS, flexible work, non-traditional models
false
Human Resources and Talent Management
Professional Services
Multiple Chart
Deloitte
Add to my slides
Remove from favorites
The slide includes column charts showing the significance of talent risk to banks, with data on various aspects like talent being one of the most significant long-term risks.
Human Resources and Talent Management
Financial Services
This slide highlights the significance of talent risk in the banking industry, emphasizing the challenges in attracting and retaining talent, and the critical role of talent in operational resilience.
talent risk, banking, column charts, long-term risks
false
Human Resources and Talent Management
Financial Services
Mixed Chart
EY
Add to my slides
Remove from favorites
The slide presents a comparative analysis of hiring difficulties across sectors in the UK, US, and EU, with color-coded arrows indicating improving or worsening trends. Sectors include mining, manufacturing, and healthcare among others. Commentary highlights key insights.
Human Resources and Talent Management
Professional Services
The slide analyzes talent shortages in the US, UK, and EU, noting that hiring difficulties are highest in the US. It highlights specific sectors experiencing significant challenges and improvements, emphasizing the persistent labor shortages in healthcare and hospitality industries.
talent shortages, hiring, US, UK, EU, sectors, trends
false
Human Resources and Talent Management
Professional Services
Table
Accenture
Add to my slides
Remove from favorites
A content slide with text on the left and a column chart on the right. The chart identifies skill sets with the most challenges in attracting and maintaining talent.
Human Resources and Talent Management
Financial Services
This slide addresses the need for new talent in risk management, highlighting the most in-demand skills and the challenges in attracting and retaining professionals.
talent, skills, attraction, retention, risk management
false
Human Resources and Talent Management
Financial Services
Mixed Chart
EY
Add to my slides
Remove from favorites
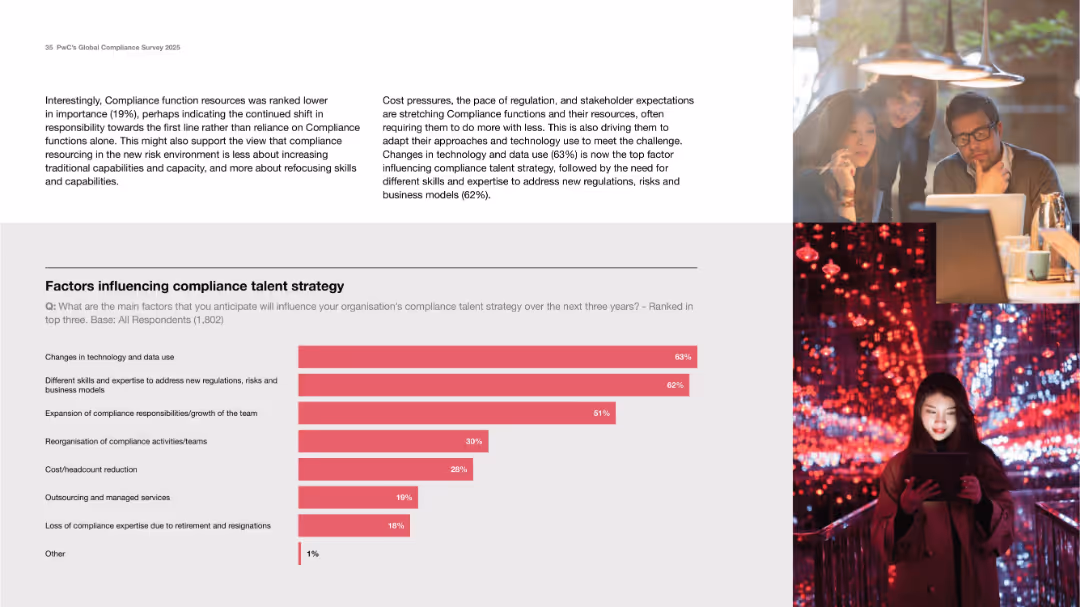
Two-thirds/one-third split layout with narrative text on top and chart below.
Human Resources and Talent Management
Professional Services
Discusses the main drivers shaping compliance talent strategy, with technology and new risks being the top factors. The chart quantifies top influences such as tech/data changes and need for new skills. The narrative stresses adapting compliance teams to new demands while balancing cost and capabilities.
talent strategy, compliance, skills, technology, regulation
false
Human Resources and Talent Management
Professional Services
Mixed Chart
PwC/Strategy&
Add to my slides
Remove from favorites
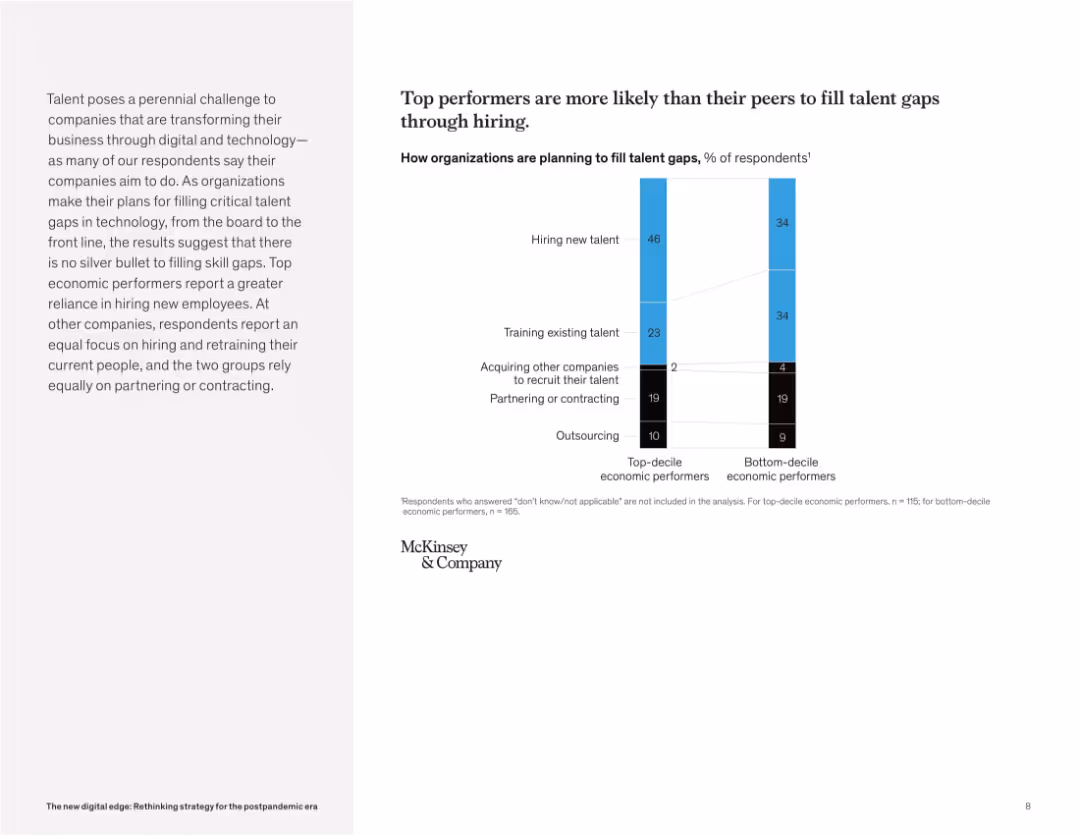
Split-page layout: left side features a paragraph in light gray background, right side shows a vertical stacked bar chart with labels and legend. Simple, clean design.
Human Resources and Talent Management
Technology & Software
The slide compares how top-decile vs. bottom-decile economic performers plan to address talent gaps. It reveals that top performers rely more heavily on hiring new talent, while others focus more on retraining or maintaining existing talent. Both groups use similar levels of partnering and outsourcing.
talent strategy, hiring, retraining, outsourcing, partnering, skill gaps, economic performers, workforce planning, McKinsey, tech skills
false
Human Resources and Talent Management
Technology & Software
Mixed Chart
McKinsey
Add to my slides
Remove from favorites
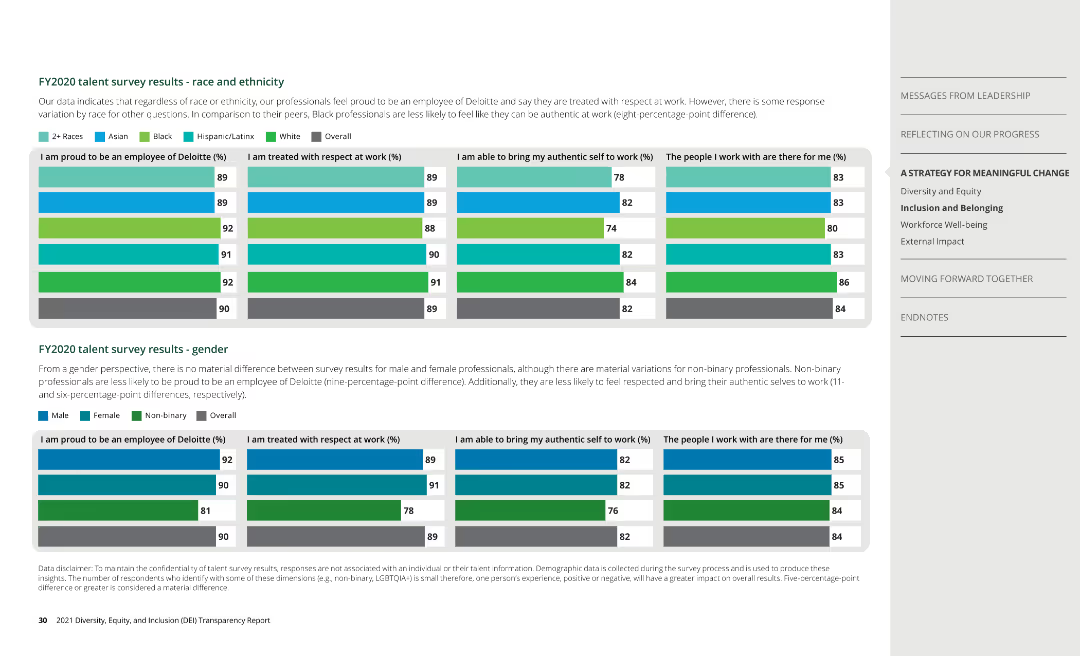
Column charts show survey results by race, ethnicity, and gender, covering aspects of employee experience at Deloitte.
Human Resources and Talent Management
Professional Services
Analyzes survey data on employee satisfaction, highlighting differences in experiences among diverse groups.
talent survey, employee experience, Deloitte
false
Human Resources and Talent Management
Professional Services
Multiple Chart
Deloitte
Add to my slides
Remove from favorites
Column chart displaying Brazilian TAM for BVS's Product Offerings in three categories: Credit Bureau, Debt Renegotiation, E-Commerce Anti-fraud. Red bars, hierarchical values: $700M, $760M, $190M.
Market Analysis and Trends
Financial Services
Slide presents an estimated $2 billion addressable market for BVS's products segmented by type. Details enhancements to BVS products by EFX aiming at increased revenue and market competitiveness.
TAM, Credit Bureau, Debt Renegotiation, E-Commerce, Market Growth, Revenue Enhancement
false
Market Analysis and Trends
Financial Services
Mixed Chart
Barclays
Add to my slides
Remove from favorites
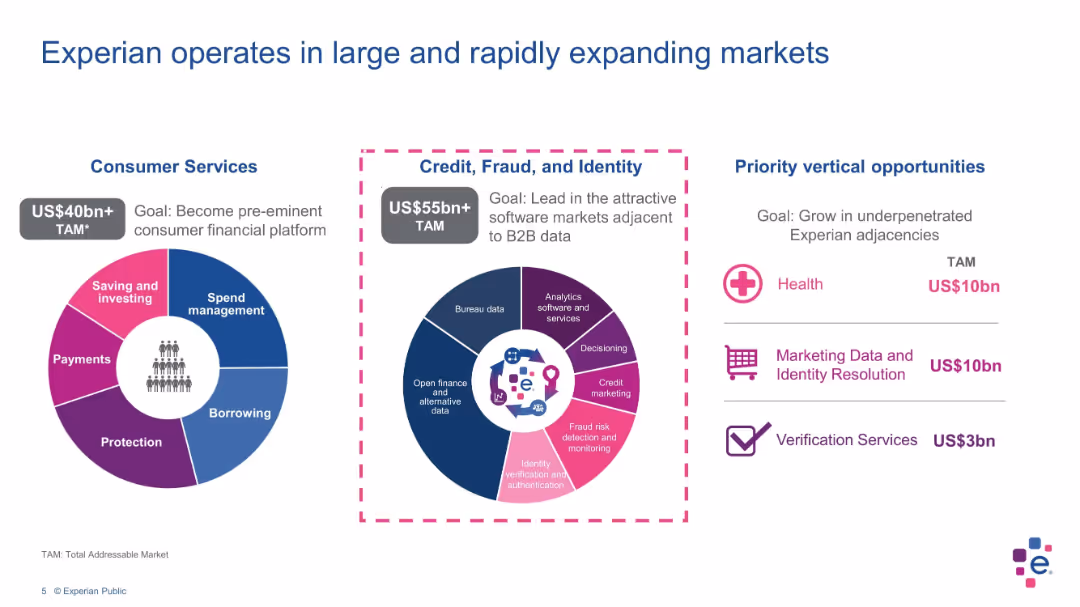
Three circular infographic panels showing market segmentation and TAM values in a colorful layout
Market Analysis and Trends
Technology & Software
This slide outlines Experian’s market opportunities across Consumer Services and Credit, Fraud, and Identity sectors, with total addressable market values and goals. Priority verticals like health and verification services are also highlighted.
TAM, Experian, consumer services, fraud, identity, verticals, strategy
false
Market Analysis and Trends
Technology & Software
Mixed Chart
Barclays
Add to my slides
Remove from favorites
The slide includes a large column chart and textual annotations explaining the potential expansion of the total addressable market (TAM) by Equifax in various segments, particularly in Brazil and other international markets.
Market Analysis and Trends
Technology & Software
Discusses Equifax's strategy to increase its market base and revenue through geographic and product expansion, with a focus on non-mortgage sectors to drive growth in a challenging market environment.
TAM, market expansion, revenue growth, Equifax
false
Market Analysis and Trends
Technology & Software
Mixed Chart
Barclays
Add to my slides
Remove from favorites
The slide features a column chart with five vertical bars representing different financial metrics from 4Q19 to 1Q20, showing an 8% increase overall.
Financial Performance
Financial Services
The slide shows the progression of tangible book value per share from 4Q19 to 1Q20, highlighting net profit and other contributions to the value.
tangible book value, financial metrics, net profit, OCI, quarterly data
false
Financial Performance
Financial Services
Single Chart
UBS
Add to my slides
Remove from favorites
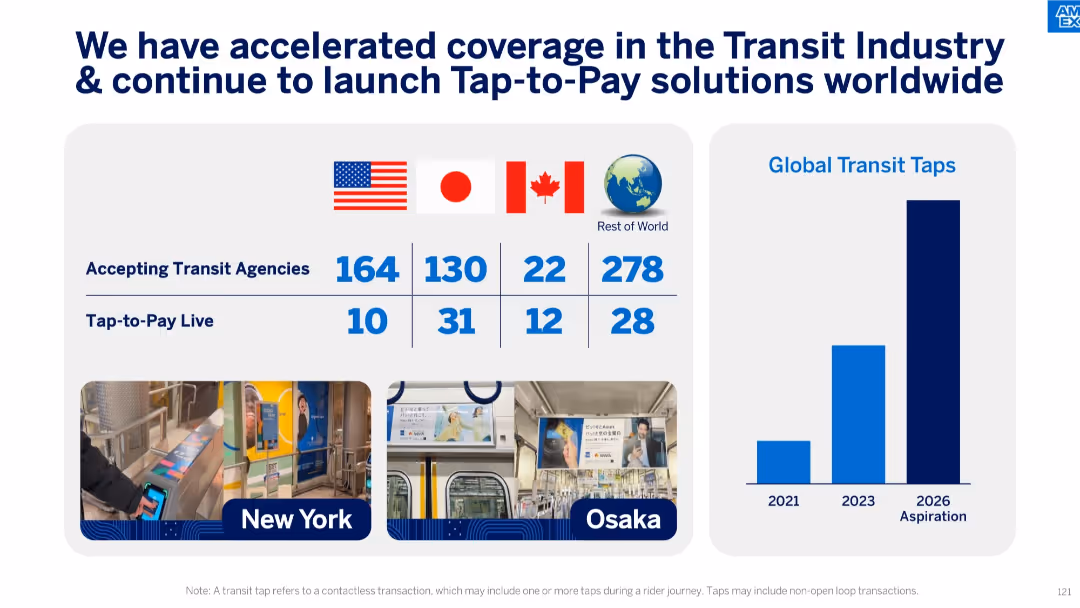
Grid and bar chart layout with flag indicators and tap-to-pay adoption stats, plus transport images.
Technology and Digital Transformation
Transportation & Logistics
Focused on the adoption of tap-to-pay transit solutions globally, the slide lists agencies across countries and growth in transit taps. It highlights major cities like New York and Osaka, underlining ongoing innovation in payment tech.
tap-to-pay, transit, agencies, contactless payments, Amex, transportation, digital payment, global adoption
false
Technology and Digital Transformation
Transportation & Logistics
Mixed Chart
McKinsey
Add to my slides
Remove from favorites
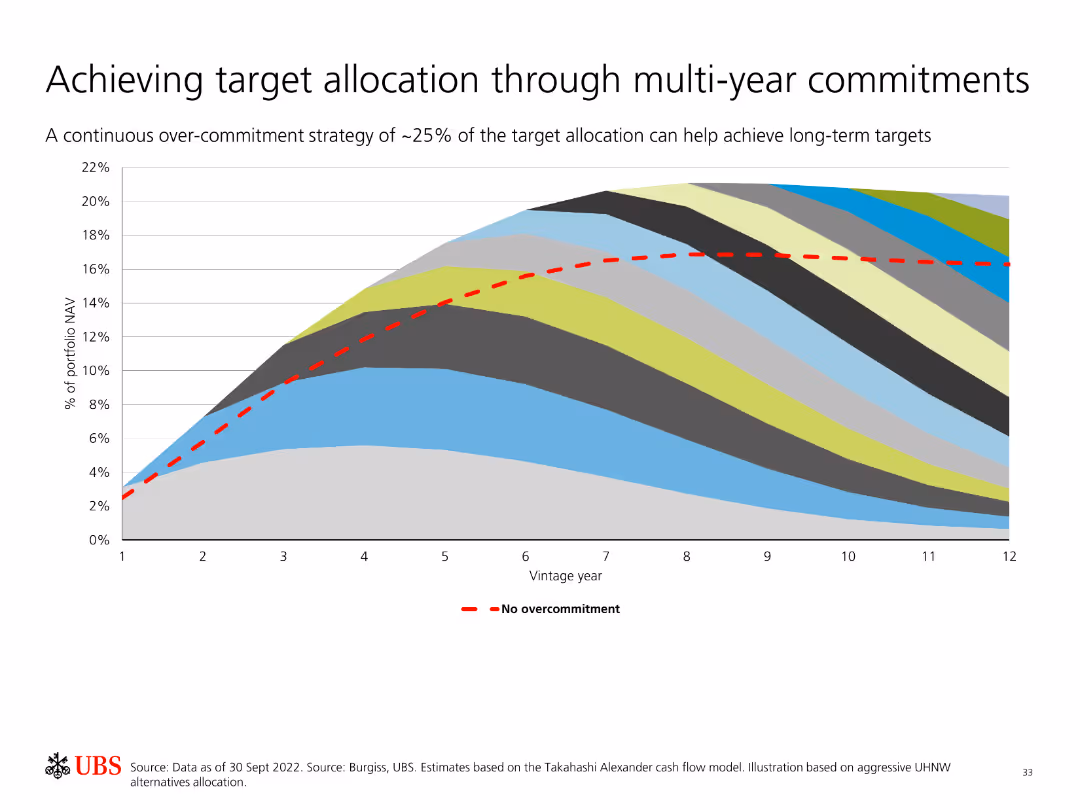
Features an area chart showing portfolio NAV over vintage years with a continuous over-commitment strategy compared to no overcommitment.
Strategic Planning
Financial Services
Discusses the benefits of a continuous over-commitment strategy to achieve target portfolio allocation over multiple years, using historical data for illustration.
Target Allocation, Multi-Year Commitments, Portfolio NAV, Over-Commitment, Strategy, Investment, Analysis, Historical Data, Planning
false
Strategic Planning
Financial Services
Single Chart
UBS
Add to my slides
Remove from favorites
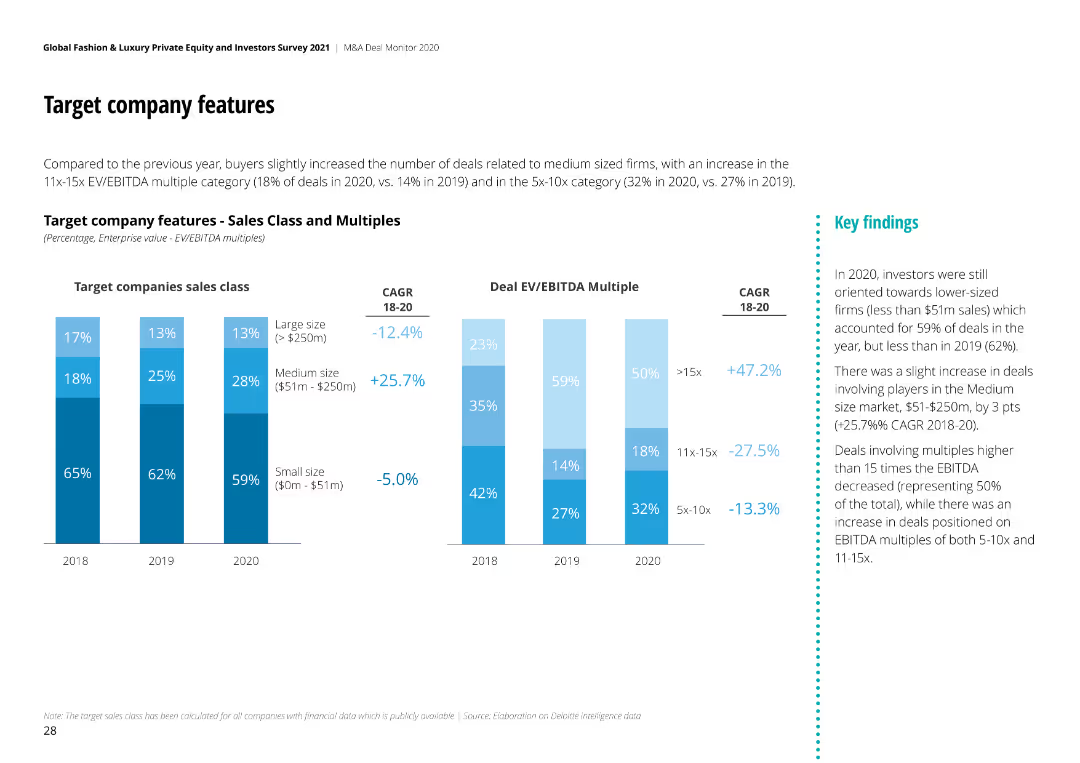
The slide shows bar charts comparing target company features by sales class and deal EV/EBITDA multiples for 2018-2020.
Investment Analysis
Consumer Goods
It examines features of target companies in M&A deals, focusing on sales class and valuation multiples over three years.
Target Company, Sales Class, EV/EBITDA, M&A, 2020
false
Investment Analysis
Consumer Goods
Multiple Chart
Deloitte
Add to my slides
Remove from favorites
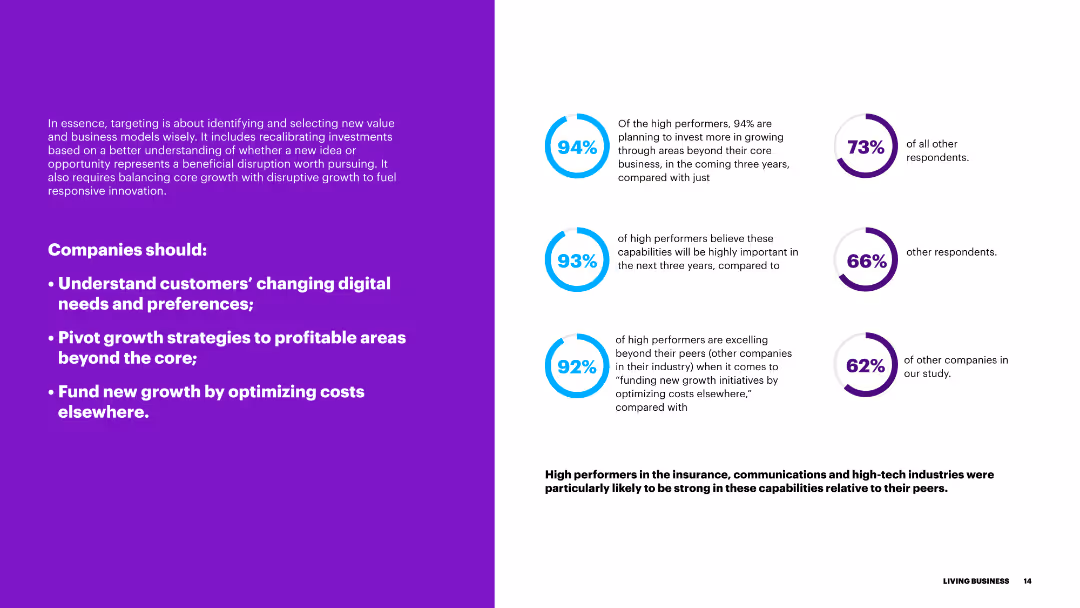
The slide is divided into two sections with a purple background on the left and text on the right. There are circular progress indicators and bullet points on the right side.
Client Case Studies
Education & Training
This slide emphasizes the importance of targeting new value and business models, with a focus on understanding digital needs, pivoting strategies, and optimizing growth investments.
targeting, business models, digital needs, growth, optimization, strategies
false
Client Case Studies
Education & Training
Multiple Chart
Accenture
Add to my slides
Remove from favorites
A diagram illustrating how Nielsen Streaming Signals optimize targeting intelligence. Includes boxes for CTV tuning information, individual/HHLD data, and Nielsen data science.
Technology and Digital Transformation
Media & Entertainment
Explains how Nielsen Streaming Signals improve the performance of targeting intelligence through optimization signals and data integration.
targeting, intelligence, Nielsen, streaming, optimization, data science
false
Technology and Digital Transformation
Media & Entertainment
Diagram
Nielsen
Add to my slides
Remove from favorites
This slide displays column charts showing the percentage of publishers utilizing different types of ad targeting in podcast advertising. The types include genre, geo-targeting, context signals, and demo (age & gender). Colors differentiate between current and planned usage.
Market Analysis and Trends
Media & Entertainment
Focuses on the increasing use of demographic and audience overlays in podcast advertising. It highlights a growing trend towards more targeted advertising strategies, reflecting the industry's push towards more precise and effective advertising placements.
targeting, podcast, advertising, demographics, 2021
false
Market Analysis and Trends
Media & Entertainment
Single Chart
PwC/Strategy&
Add to my slides
Remove from favorites
The slide contains text on the left side and two doughnut charts on the right. The text discusses effective targeting strategies, and the charts compare 'All Entrants' and 'All Winners' with respect to having a primary target.
Strategic Planning
Media & Entertainment
This slide explains the effectiveness of mass and targeted strategies in driving brand growth, comparing the presence of a primary target between all entrants and winners.
targeting strategies, mass, targeted, primary target, brand growth
false
Strategic Planning
Media & Entertainment
Multiple Chart
IPSOS
Add to my slides
Remove from favorites
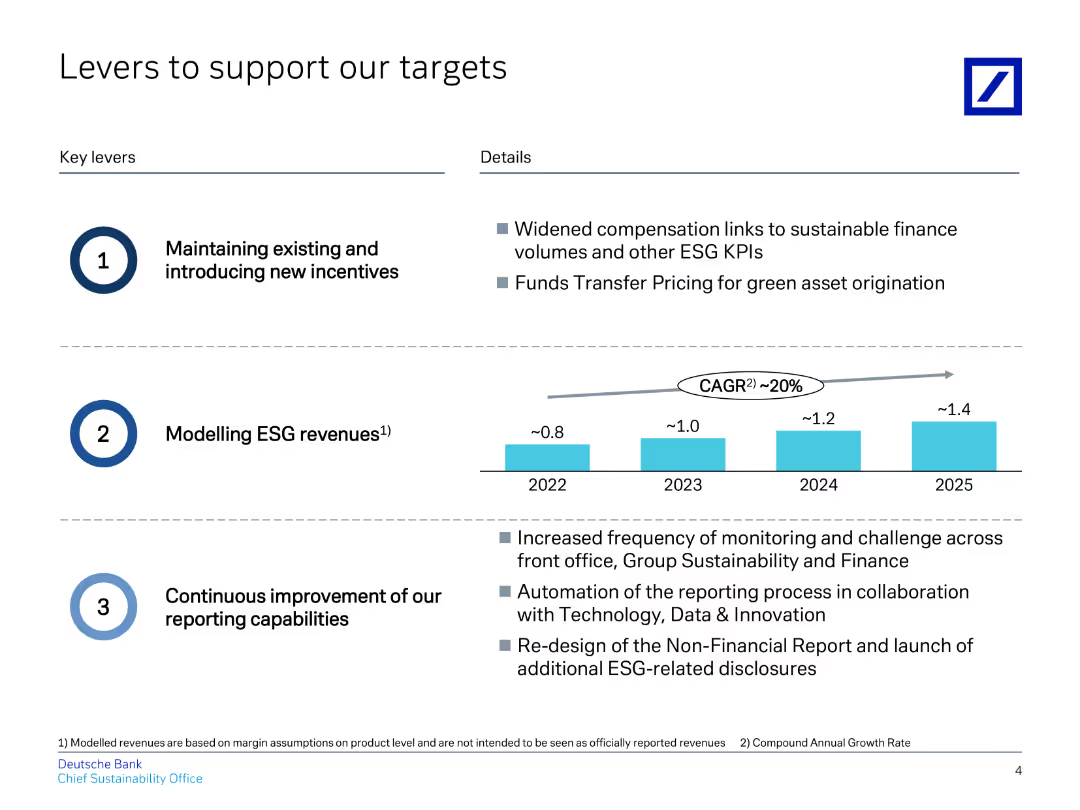
The slide features a title at the top, followed by two sections of key levers with brief descriptions and a column chart in the middle.
Strategic Planning
Financial Services
Describes key levers to support targets, focusing on incentives, ESG revenue modeling, and reporting improvements.
targets, incentives, ESG, revenue, reporting
false
Strategic Planning
Financial Services
Mixed Chart
Deutsche Bank
Add to my slides
Remove from favorites
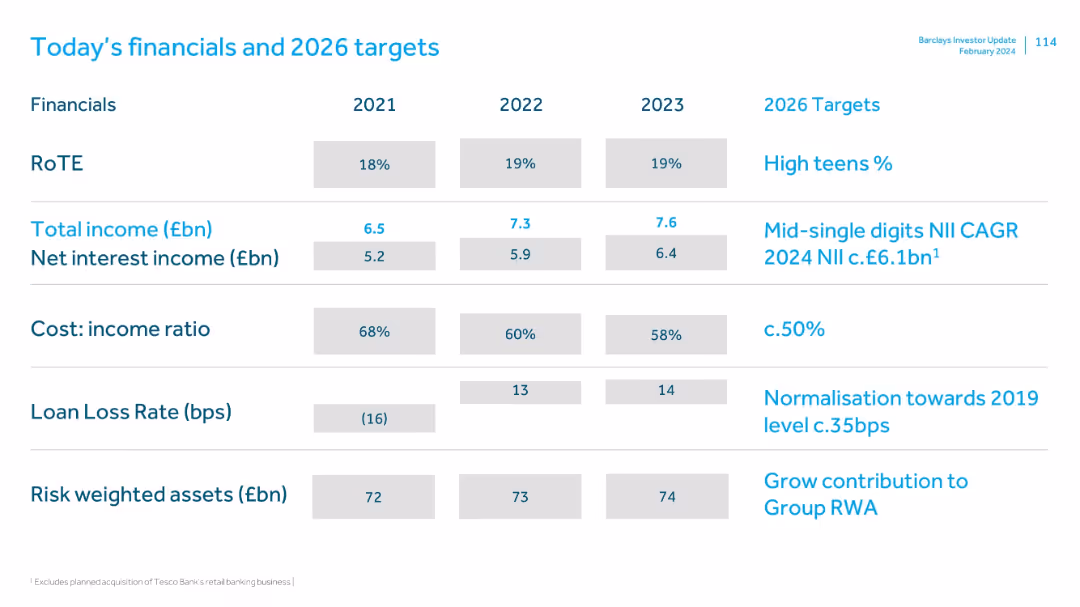
Tabular layout with four-year financial history (2021–2023) and 2026 projections; grey and blue text fields.
Strategic Planning
Financial Services
Summarizes Barclays UK’s historical financial performance and strategic targets for 2026. Covers income, RoTE, cost ratios, and risk metrics, aligning future goals with 2019 benchmarks and mid-digit CAGR.
targets, income, RoTE, planning, 2026, performance, forecast
false
Strategic Planning
Financial Services
Single Chart
Barclays
Add to my slides
Remove from favorites
Previous
Next
You don't have any favorites yet.
Please wait loading your favorites slides...
Create a FREE account to continue browsing
Receive Instant Access to 1,000+ slides from companies like McKinsey, Google, and Goldman Sachs
First Name
Last Name
Email
Password
I agree to all
Terms & Privacy Policy
Thank you! Your submission has been received!
Oops! Something went wrong while submitting the form.
Have an account?
Sign in
Upgrade to PRO to Save slides
Advanced Search and Filters
Access to 15,000+ slides
Access to Category Pages
Save/Bookmark Slides
PowerPoint Template Library
Pick a Plan
MONTHLY
$12/month
Billed every month, Cancel anytime.
YEARLY
$9/year
Billed $108 annually, Cancel anytime.
Checkout for $12/month
Checkout for $108/yr
Secured by Stripe | AES-256 bit encryption