My Account
My Slides
Search by Category
Pricing
Templates
View All Templates
Download Template Slides
✦ AI Search
Feedback
Login
Logout
Get Started
Browse all Slides
Browse all Slides
Create a FREE Account
Instant access to 1,000+ real slides from top companies like McKinsey, BCG, Goldman Sachs, Google and many more!
First Name
Last Name
Email
Password
I agree to all
Terms & Privacy Policy
Thank you! Your submission has been received!
Oops! Something went wrong while submitting the form.
Have an account?
Sign in
Saved Slides
Total No. of slides saved
0
↻ Refresh
✖ Clear all
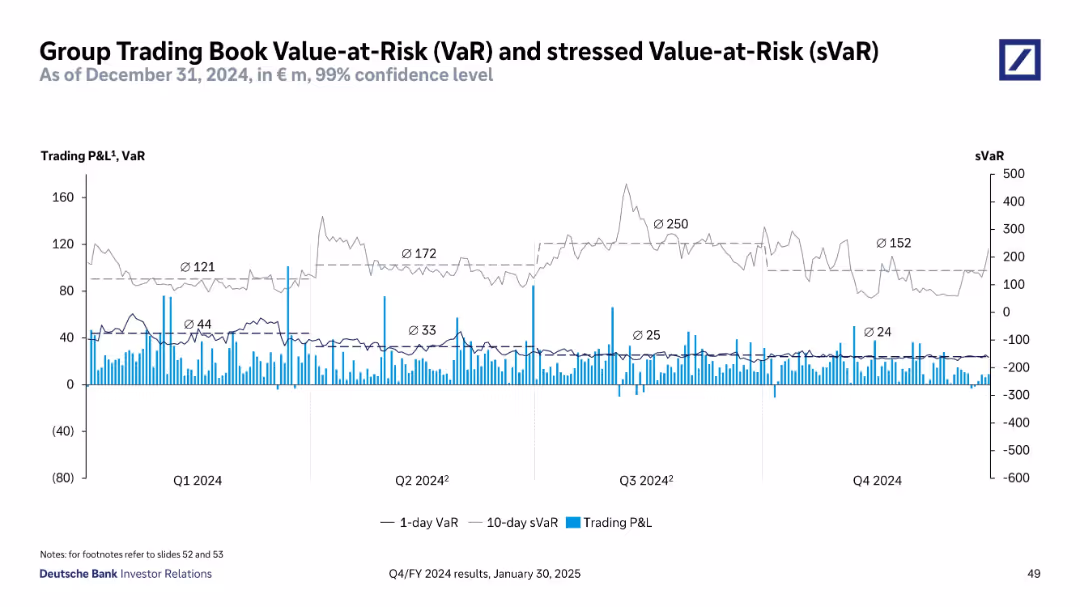
Line and bar chart with dual y-axes; light gray and dark gray lines for 1-day VaR and 10-day sVaR; blue bars for Trading P&L; four quarterly periods labeled
Risk Assessment and Management
Financial Services
This slide shows Deutsche Bank’s VaR and sVaR trends for 2024, illustrating daily risk metrics and profit/loss volatility. Quarterly averages highlight changes in risk exposure and stress scenarios.
VaR, sVaR, Trading P&L, risk metrics, 2024, volatility, confidence level, Deutsche Bank, quarterly trends, market risk
false
Risk Assessment and Management
Financial Services
Single Chart
Deutsche Bank
Add to my slides
Remove from favorites
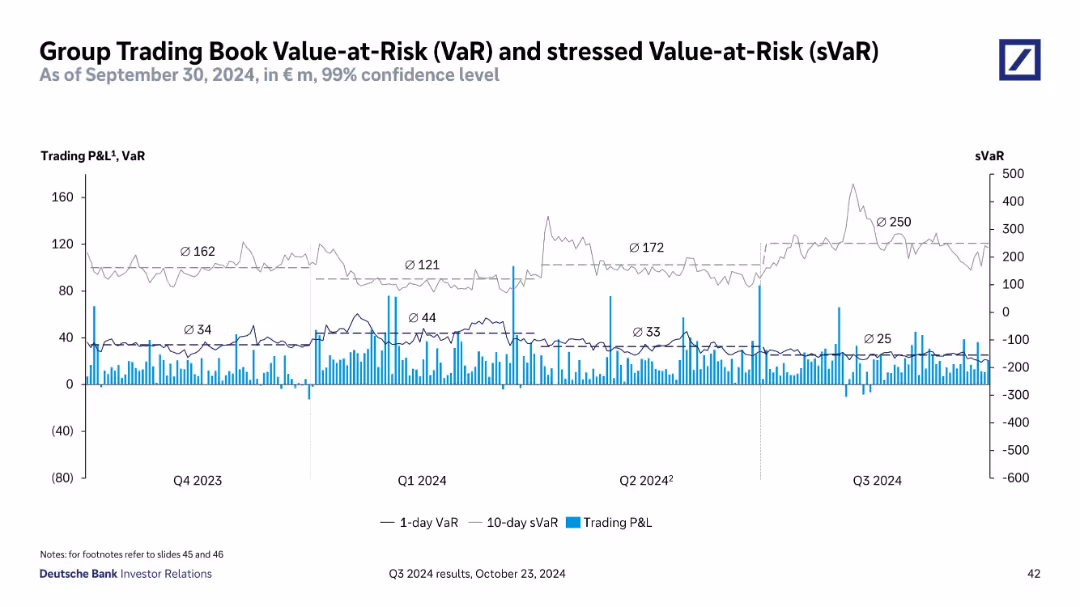
A time-series chart with 1-day VaR, 10-day sVaR, and trading P&L, spanning from Q4 2023 to Q3 2024.
Risk Assessment and Management
Financial Services
Tracks group trading book VaR and sVaR against trading profit and loss from Q4 2023 to Q3 2024. Shows average values for VaR, sVaR, and highlights volatility spikes. Useful for evaluating risk control effectiveness in trading operations.
VaR, sVaR, Trading P&L, Risk Metrics, Volatility, Q3 2024
false
Risk Assessment and Management
Financial Services
Single Chart
Deutsche Bank
Add to my slides
Remove from favorites
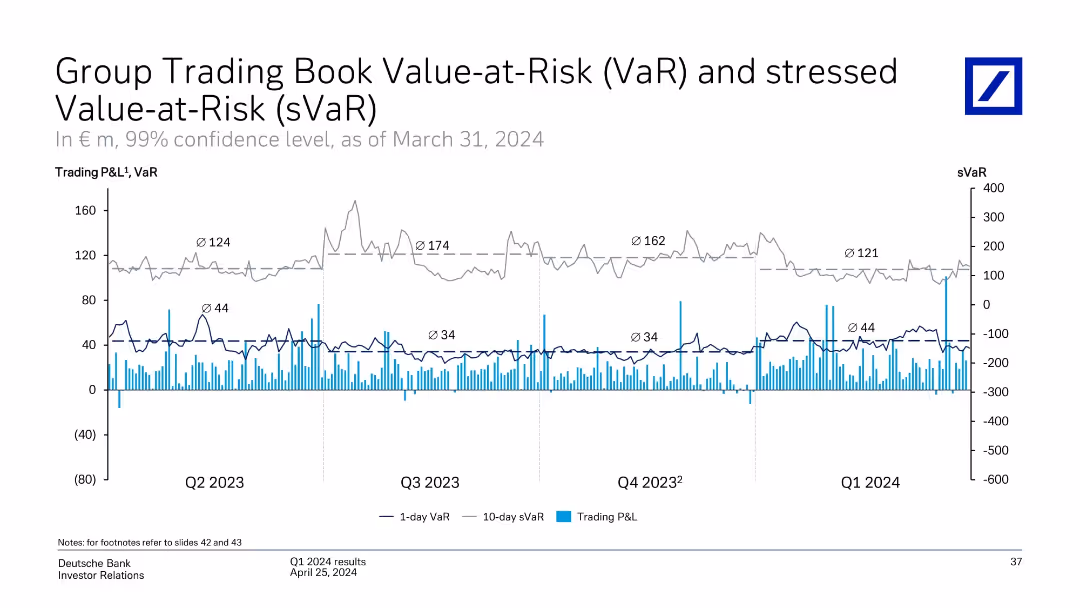
Line and bar graph showing 1-day VaR, 10-day sVaR, and daily trading P&L trends across Q2 2023 to Q1 2024.
Risk Assessment and Management
Financial Services
Tracks Deutsche Bank’s market risk exposure via Value-at-Risk metrics and trading P&L fluctuations over time. Average sVaR and VaR are labeled quarterly. Highlights include risk peaks and P&L volatility patterns, helping assess the bank’s trading risk profile.
VaR, sVaR, trading risk, market risk, P&L volatility, Deutsche Bank
false
Risk Assessment and Management
Financial Services
Single Chart
Deutsche Bank
Add to my slides
Remove from favorites
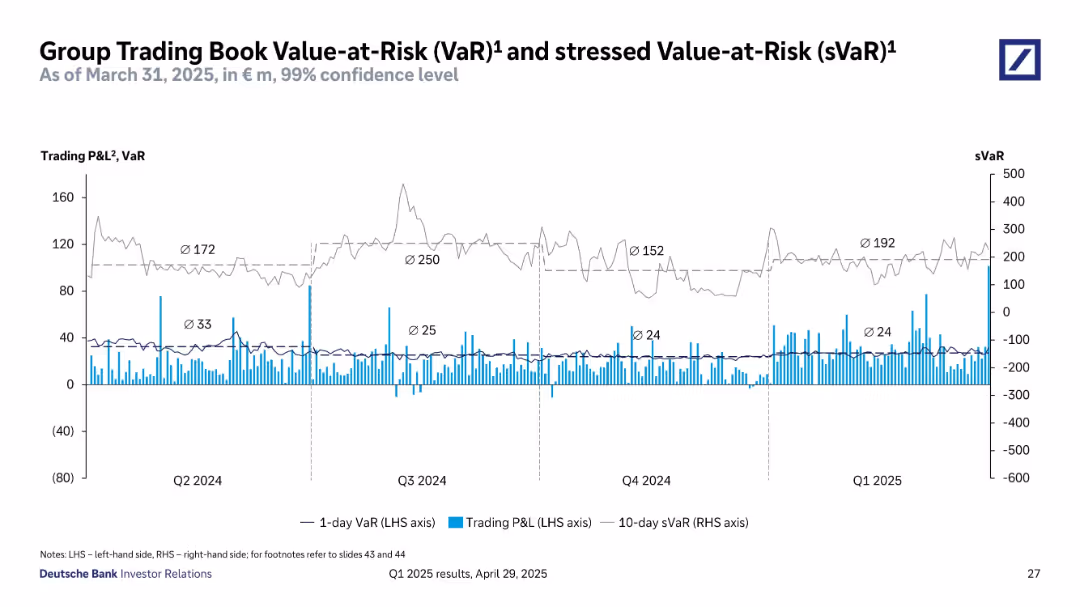
Line and bar chart show daily trading P&L, 1-day VaR, and 10-day sVaR trends over the past quarters.
Risk Assessment and Management
Financial Services
Visualizes Deutsche Bank’s trading risk metrics with 99% confidence level. Highlights stability in VaR and sVaR levels, with spikes in P&L volatility. Useful for understanding trading risk exposure and stress scenarios.
VaR, sVaR, trading risk, P&L, confidence interval, risk monitoring, financial risk
false
Risk Assessment and Management
Financial Services
Single Chart
Deutsche Bank
Add to my slides
Remove from favorites
This slide displays a complex line and column chart showing the VaR and sVaR levels over multiple quarters, with annotations explaining key peaks and trends in trading risk.
Risk Assessment and Management
Financial Services
Analyzes trading risk within the bank's portfolio, highlighting Value-at-Risk and stressed scenarios over time. Key for risk management teams to monitor and adjust strategies based on trading volatility and market conditions. Useful in financial planning and risk mitigation efforts.
VaR, sVaR, trading risk, portfolio management, market conditions, risk mitigation, financial planning
false
Risk Assessment and Management
Financial Services
Single Chart
Deutsche Bank
Add to my slides
Remove from favorites
Slide shows a column chart comparing VAT rates across Southern African countries, using different colors for each country to facilitate comparison.
Competitive Landscape
Government & Public Sector
This slide provides a comparative analysis of VAT rates across Southern African countries, highlighting Namibia's position and its implications for trade and consumer prices in a regional context.
VAT, Rates, Comparison, Trade, Regional
false
Competitive Landscape
Government & Public Sector
Single Chart
PwC/Strategy&
Add to my slides
Remove from favorites
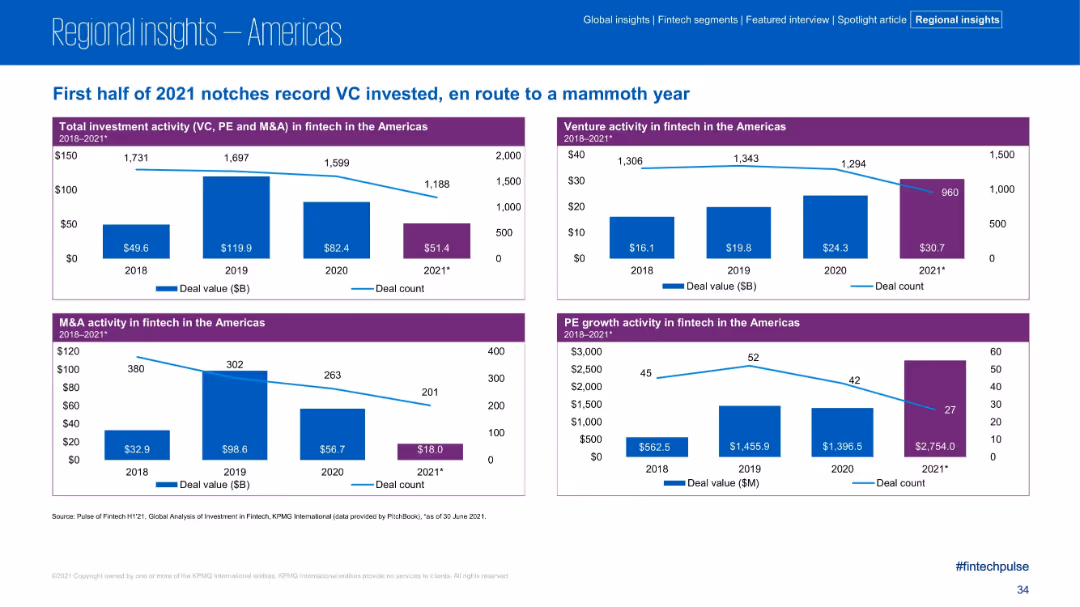
Four quadrant charts showing deal values and counts for different investment types (VC, PE, M&A, Total) in the Americas; clean, blue and purple color coding
Financial Performance
Financial Services
The Americas fintech market saw record VC investment in H1 2021 across multiple segments. Each quadrant displays historical deal value and deal count for Total, Venture, M&A, and PE activity, highlighting notable spikes in PE growth activity ($2.75B) and venture activity ($30.7B).
VC activity, fintech, PE growth, M&A, deal volume, Americas, 2021 trends, financial metrics
false
Financial Performance
Financial Services
Multiple Chart
KPMG
Add to my slides
Remove from favorites
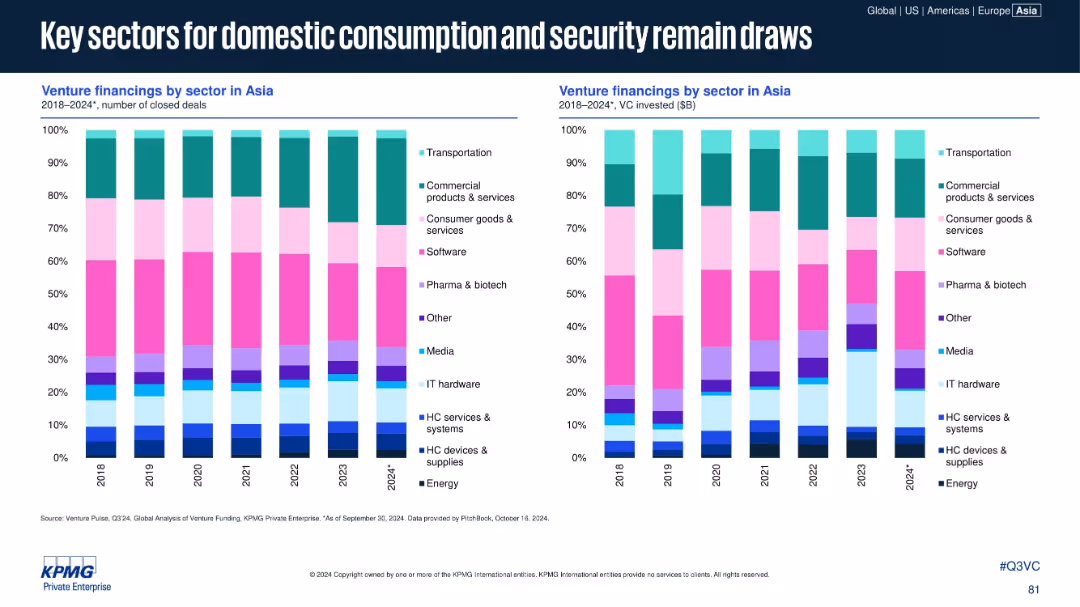
Two stacked bar charts: left shows number of closed deals by sector; right shows VC invested ($B) by sector. Sector legend on far right.
Customer and Market Segmentation
Financial Services
Analyzes sectoral trends in Asian VC investments from 2018–2024. Shows strong concentration in pharma, consumer goods, and commercial services. Sector allocation remains relatively stable but hints at increased focus on strategic industries.
VC by Sector, Asia, Pharma, Consumer Goods, Transportation, Media, Security
false
Customer and Market Segmentation
Financial Services
Multiple Chart
KPMG
Add to my slides
Remove from favorites
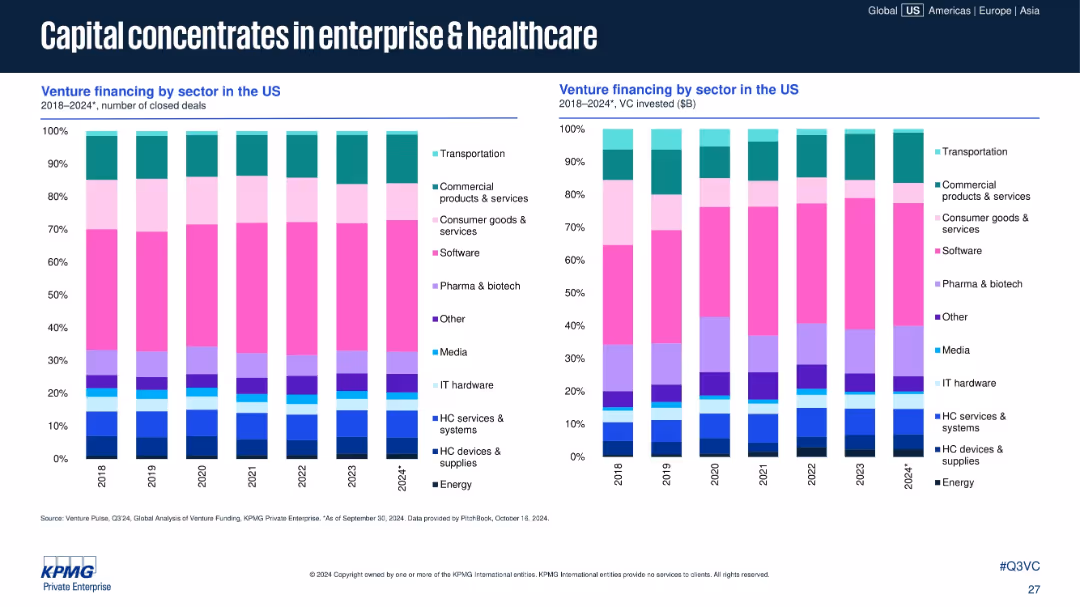
Dual stacked bar charts: left shows number of deals; right shows VC invested. Color-coded by sector (e.g., Software, Pharma, HC services).
Industry Overview
Healthcare & Pharmaceuticals
Capital concentration is increasing in software and healthcare sectors, particularly pharma and health systems. Deal count remains relatively balanced, but the majority of VC dollars are flowing into fewer, dominant sectors.
VC by sector, enterprise funding, healthcare, pharma & biotech, software investment, deal concentration, sector trends
false
Industry Overview
Healthcare & Pharmaceuticals
Multiple Chart
KPMG
Add to my slides
Remove from favorites
Dual charts showing deal value trends by financing stage and corporate participation.
Strategic Planning
Financial Services
The left chart disaggregates venture financing by stage, while the right shows corporate participation trends in VC deals. The slide highlights resurgence in corporate-backed VC deals after a decline, signaling renewed strategic interest.
VC, Corporate Participation, Financing Stages, Early VC, Later VC
false
Strategic Planning
Financial Services
Multiple Chart
KPMG
Add to my slides
Remove from favorites
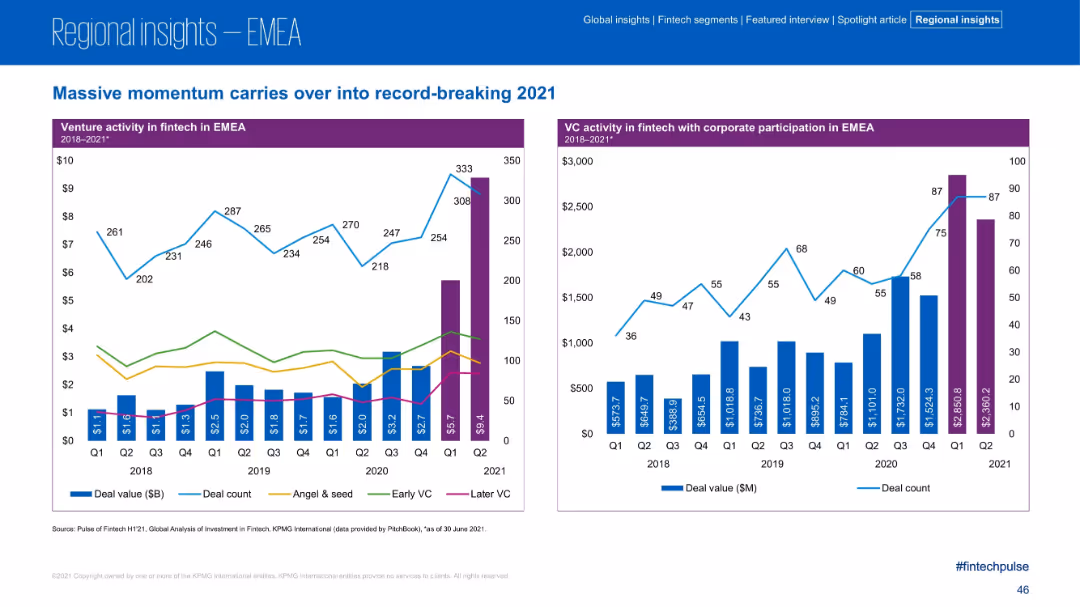
Dual-panel charts; left panel shows VC activity by deal stage (stacked bars) with lines for counts; right panel shows VC with corporate participation using bars and line graphs. Purple headers with blue and green tones.
Investment Analysis
Financial Services
The slide illustrates continued momentum in fintech venture activity across EMEA in 2021, highlighting record-high investments. It splits VC investments by stage and corporate participation, showing significant Q2 2021 growth, particularly in later-stage VC.
VC, Corporate Participation, Fintech, Angel Investment, EMEA, Deal Value, Early Stage, Later Stage
false
Investment Analysis
Financial Services
Multiple Chart
KPMG
Add to my slides
Remove from favorites
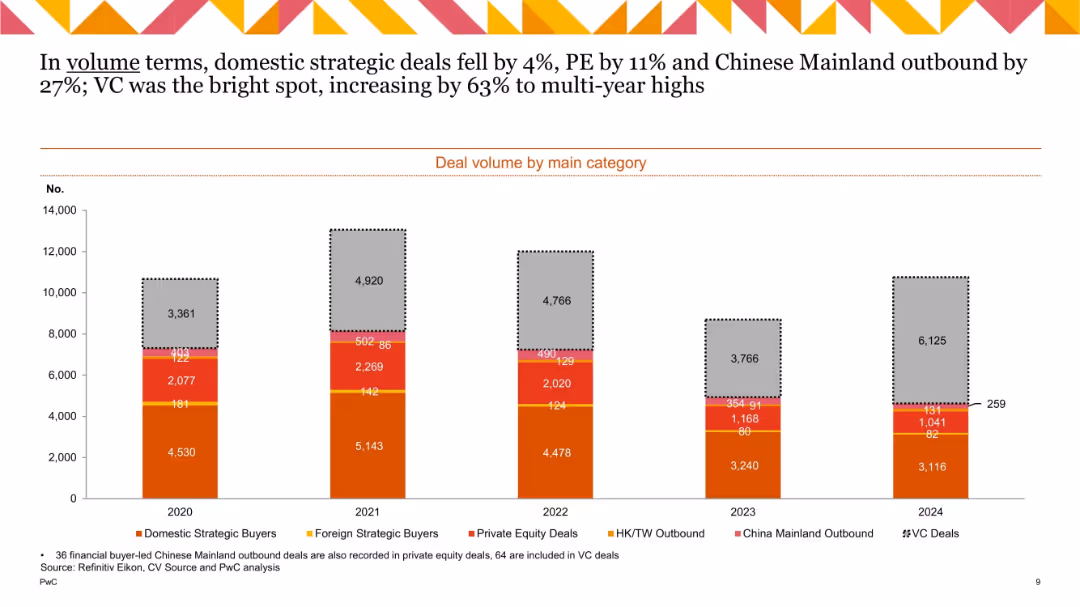
Stacked bar chart showing volume (in numbers) across buyer categories, including VC; gray box highlights VC; vertical axis shows deal count.
Strategic Planning
Financial Services
Visualizes deal volume distribution by buyer type. While most categories declined in 2024, venture capital deals surged by 63% to multi-year highs. Domestic and foreign strategic deals fell modestly.
VC deals, strategic buyers, deal volume, 2024, PE, outbound deals
false
Strategic Planning
Financial Services
Single Chart
PwC/Strategy&
Add to my slides
Remove from favorites
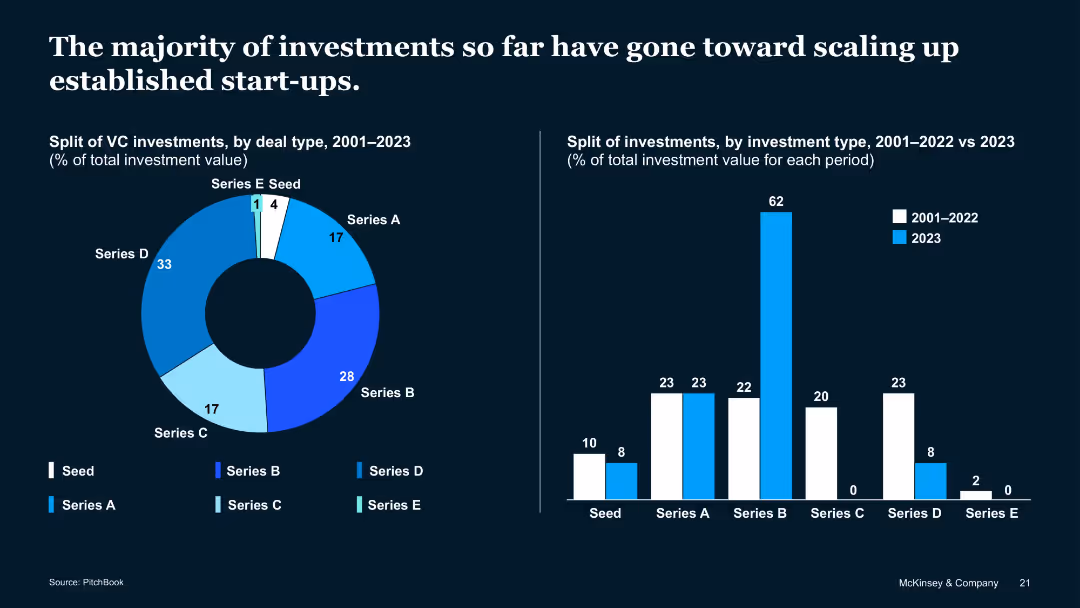
Pie and bar charts indicating split of VC investments by deal type (Series A-E, Seed) and year comparisons
Investment Analysis
Artificial Intelligence
Series D and B dominate QT VC deals, showing focus on scaling up mature start-ups. The 2023 data indicates a strong preference for Series B over earlier or later-stage funding. Seed and Series E are minimal.
VC Deal Type, Series Funding, Scaling Startups, QT, Investment Split
false
Investment Analysis
Artificial Intelligence
Multiple Chart
McKinsey
Add to my slides
Remove from favorites
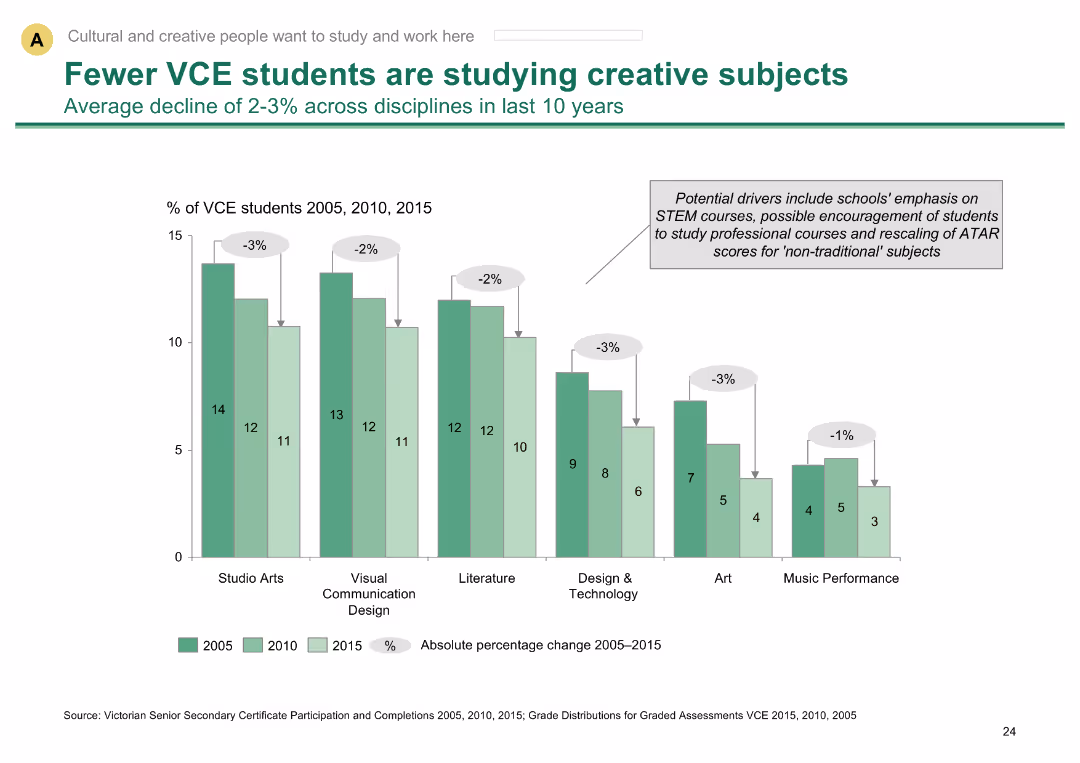
Column chart showing decline in VCE students studying creative subjects over 10 years
Market Analysis and Trends
Education & Training
Shows decline in creative subject participation among VCE students, indicating trends in education preferences
VCE students, creative subjects, education trends, participation decline, Melbourne education
false
Market Analysis and Trends
Education & Training
Single Chart
BCG
Add to my slides
Remove from favorites
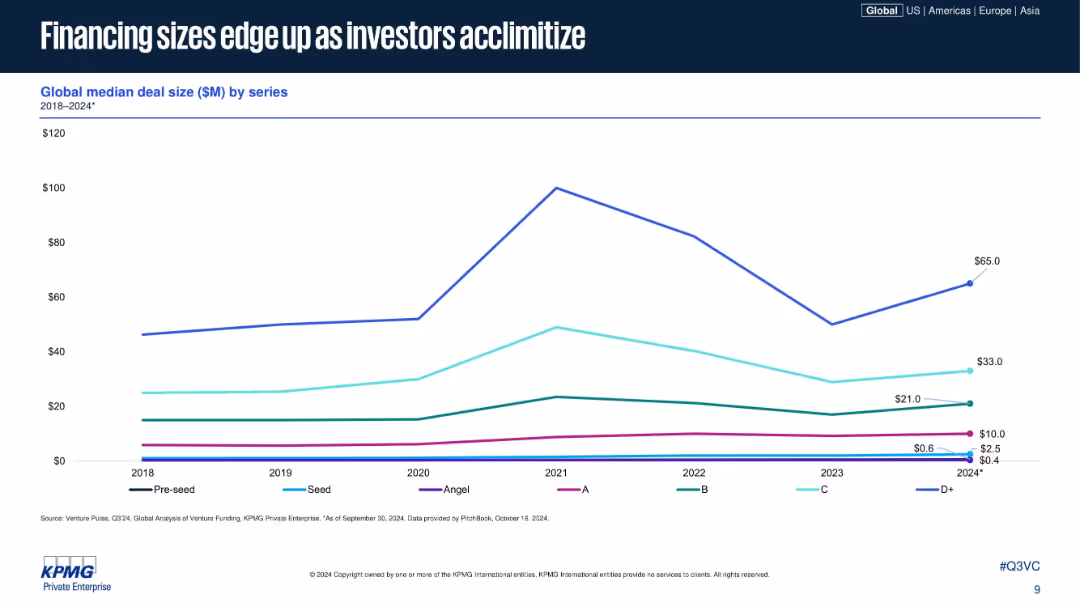
Line chart with colored trend lines per series (Pre-seed to D+) over years 2018–2024, labeled data points for 2024; white background, blue and purple accents, KPMG branding.
Investment Analysis
Financial Services
This slide shows the global median deal size in millions by funding series from 2018 to 2024, highlighting a rebound in 2024 for later-stage (D+) financing and stable or slightly increasing sizes in earlier rounds like Seed and Series A–C. Investors appear to be regaining confidence.
VC funding, deal size, investment trends, growth capital, series A, series D+, startup financing, global trends, venture capital, KPMG
false
Investment Analysis
Financial Services
Single Chart
KPMG
Add to my slides
Remove from favorites
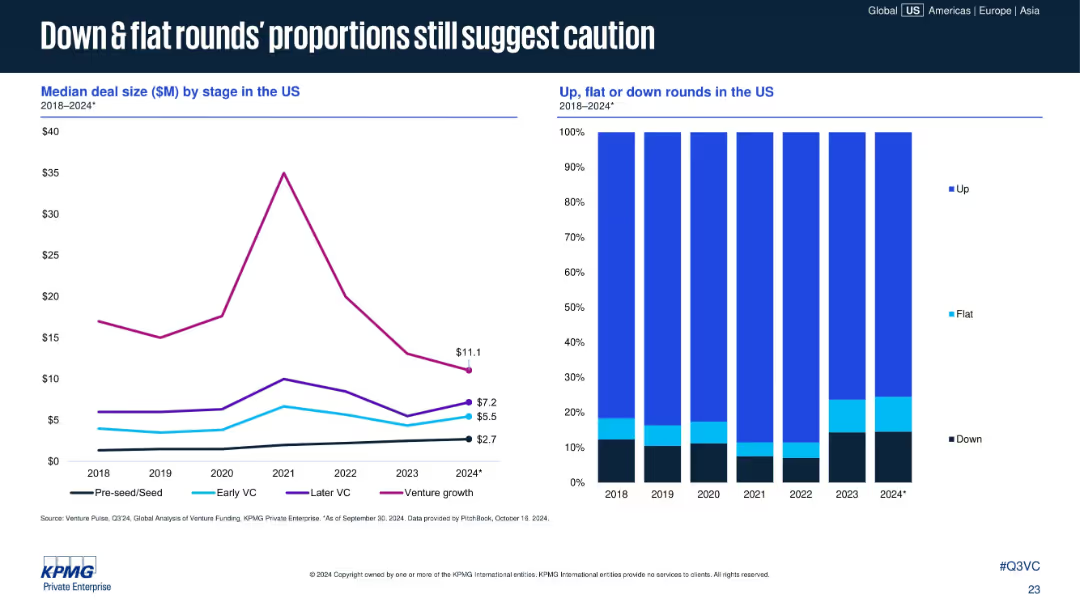
Dual chart layout; left line graph shows median deal size by stage, right stacked bar chart shows proportions of up, flat, and down rounds. Clean layout with legends.
Market Analysis and Trends
Financial Services
The slide highlights cautious investor sentiment in the U.S. VC market, showing median deal size by funding stage (2018–2024*) and the proportion of up, flat, and down rounds. Notably, venture growth deal sizes dropped while down and flat rounds increased.
VC funding, deal size, venture growth, down rounds, flat rounds, early VC, market caution, funding trends, investment stage, US market
false
Market Analysis and Trends
Financial Services
Multiple Chart
KPMG
Add to my slides
Remove from favorites
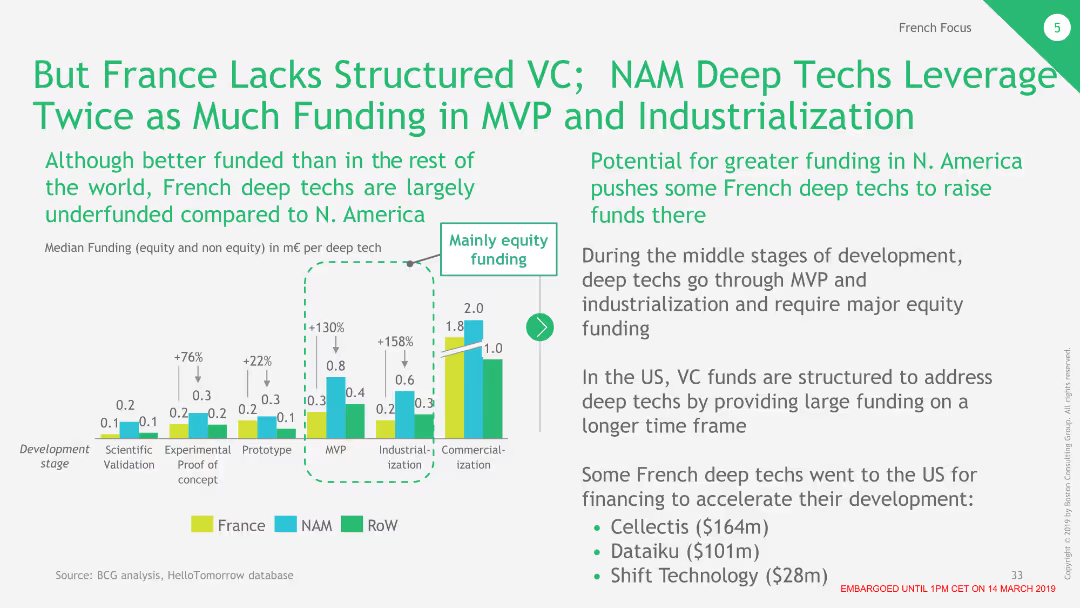
The slide features a bar chart comparing funding stages in France, NAM, and RoW, with additional text discussing funding structures.
Market Analysis and Trends
Financial Services
Discusses the differences in funding structures for deep tech companies in France and North America, highlighting potential improvements.
VC funding, deep tech, NAM, France, market analysis
false
Market Analysis and Trends
Financial Services
Mixed Chart
BCG
Add to my slides
Remove from favorites
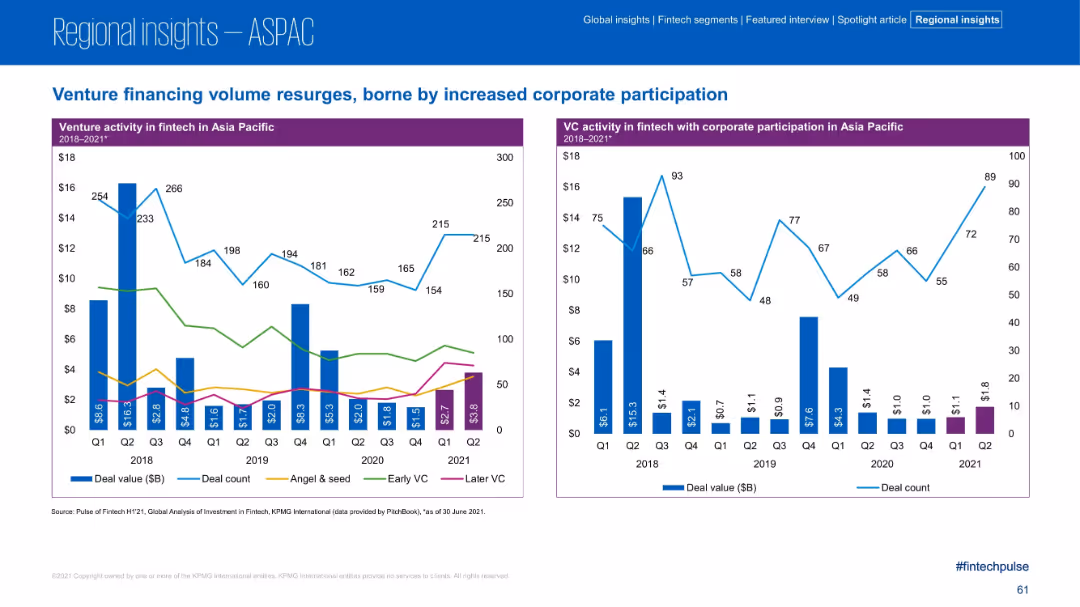
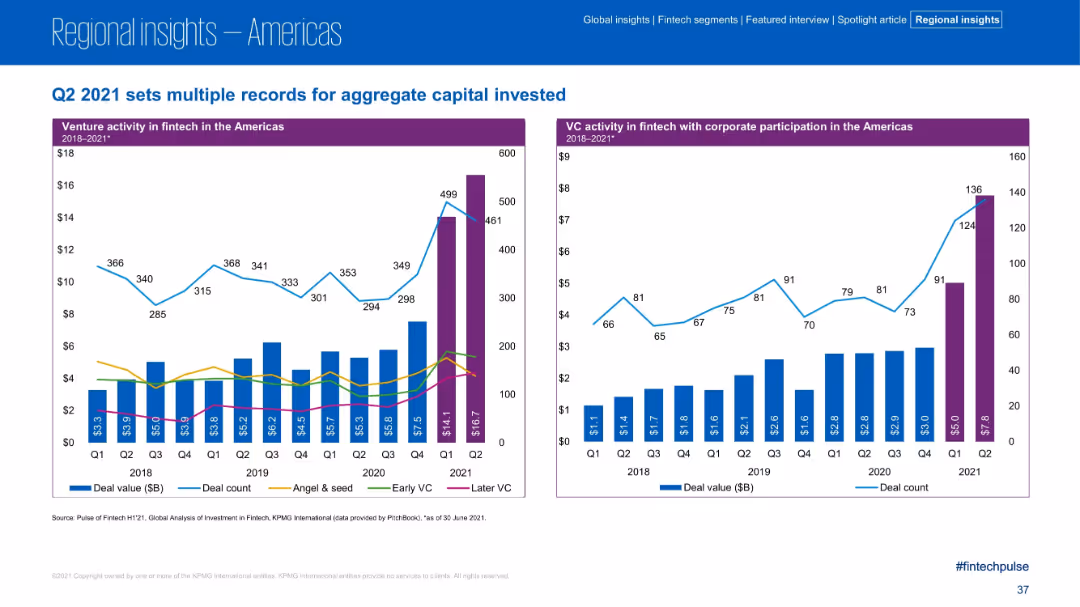
Two bar charts with overlay lines show VC activity and corporate participation over time; color-coded segments for Angel & Seed, Early VC, and Later VC
Strategic Planning
Financial Services
Venture activity in Q2 2021 reached new highs, driven largely by Later VC rounds. Charts show a significant jump in deal value and counts compared to previous quarters, reflecting growing investor confidence and maturing startups. Corporate participation in VC deals also increased sharply.
VC funding, Later VC, corporate VC, fintech investment, Q2 records, angel investors, seed stage
false
Strategic Planning
Financial Services
Multiple Chart
KPMG
Add to my slides
Remove from favorites
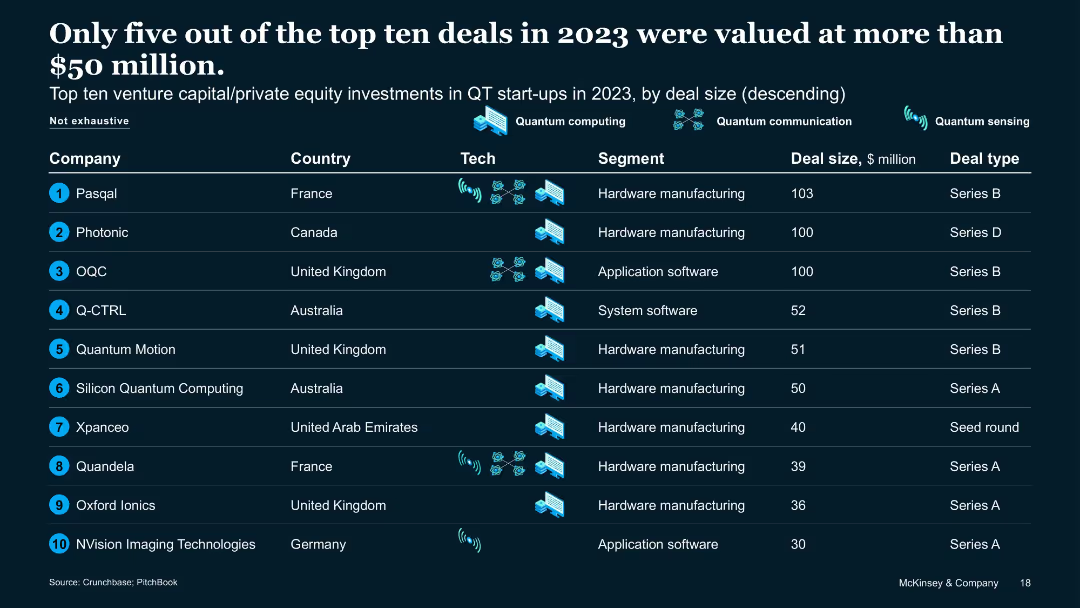
Tabular format with rankings by deal size, country, tech, and funding type
Financial Performance
Artificial Intelligence
Lists top ten QT VC/PE deals in 2023. Only five exceeded $50M. Includes information on country, segment, and deal type. Highlights QT investment concentration in QC hardware and software across France, UK, Australia, and Germany.
VC funding, QT deals, top startups, 2023 investments, hardware focus
false
Financial Performance
Artificial Intelligence
Table
McKinsey
Add to my slides
Remove from favorites
This slide contains a column and line chart illustrating the number of active U.S. VC investors and U.S. information business formations. The design employs bars for one data set and a line for the other, with a color key for differentiation and clarity in representation.
Risk Assessment and Management
Financial Services
Focusing on the decrease in active VC investors amid a challenging fundraising environment, this slide is crucial for understanding market conditions and preparing risk management strategies for businesses and investors navigating a competitive venture landscape.
VC Investors, Fundraising, Business Formations, Market Conditions, Risk Management
false
Risk Assessment and Management
Financial Services
Mixed Chart
JP Morgan
Add to my slides
Remove from favorites
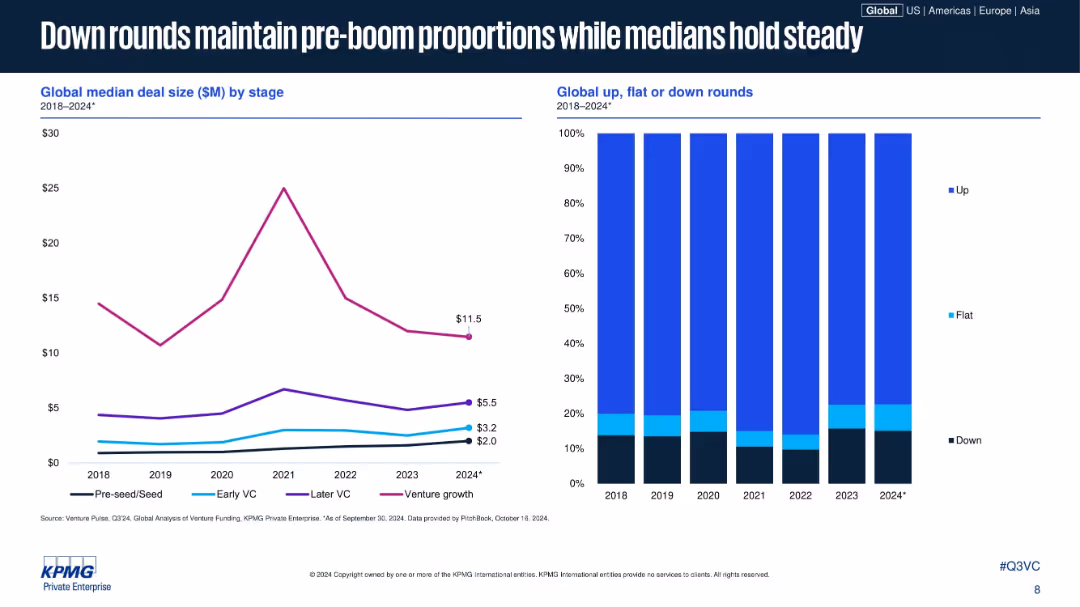
Dual visualizations: median deal size by stage and bar graph of deal round types (up, flat, down).
Performance Metrics and KPIs
Financial Services
This slide contrasts the stability of median deal sizes across stages with a bar graph showing the proportion of up, flat, and down rounds globally from 2018 to 2024. It suggests a reversion to pre-boom norms amid cautious investing.
VC Rounds, Down Rounds, Deal Size, Global Trends, KPIs
false
Performance Metrics and KPIs
Financial Services
Multiple Chart
KPMG
Add to my slides
Remove from favorites
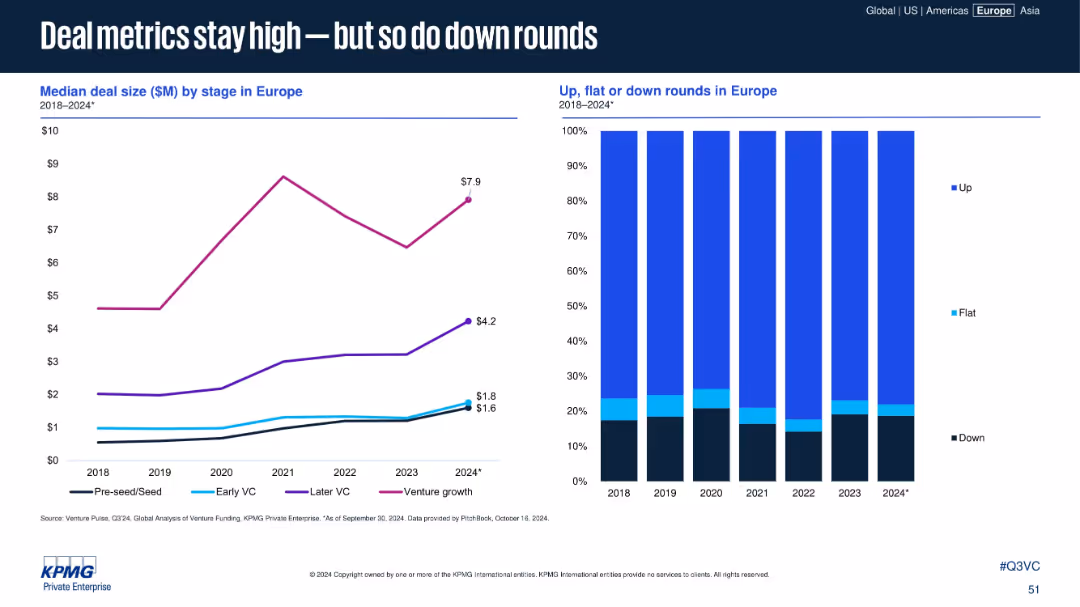
Left panel: line chart of median deal size by stage. Right panel: stacked bar chart of round types (up/flat/down)
Performance Metrics and KPIs
Financial Services
This slide compares deal size trends across VC stages and the distribution of deal rounds (up, flat, down) from 2018 to 2024. Despite high valuations, down rounds remain significant, reflecting investor caution.
VC stage, median deal size, down rounds, early-stage funding, Europe
false
Performance Metrics and KPIs
Financial Services
Multiple Chart
KPMG
Add to my slides
Remove from favorites
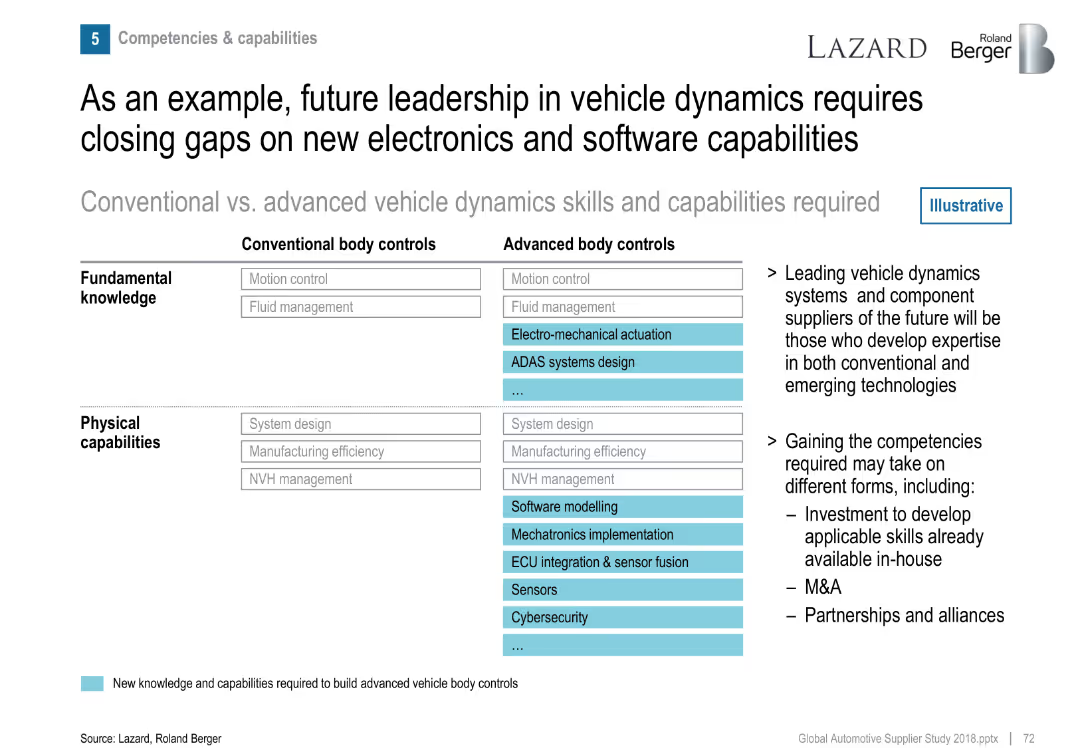
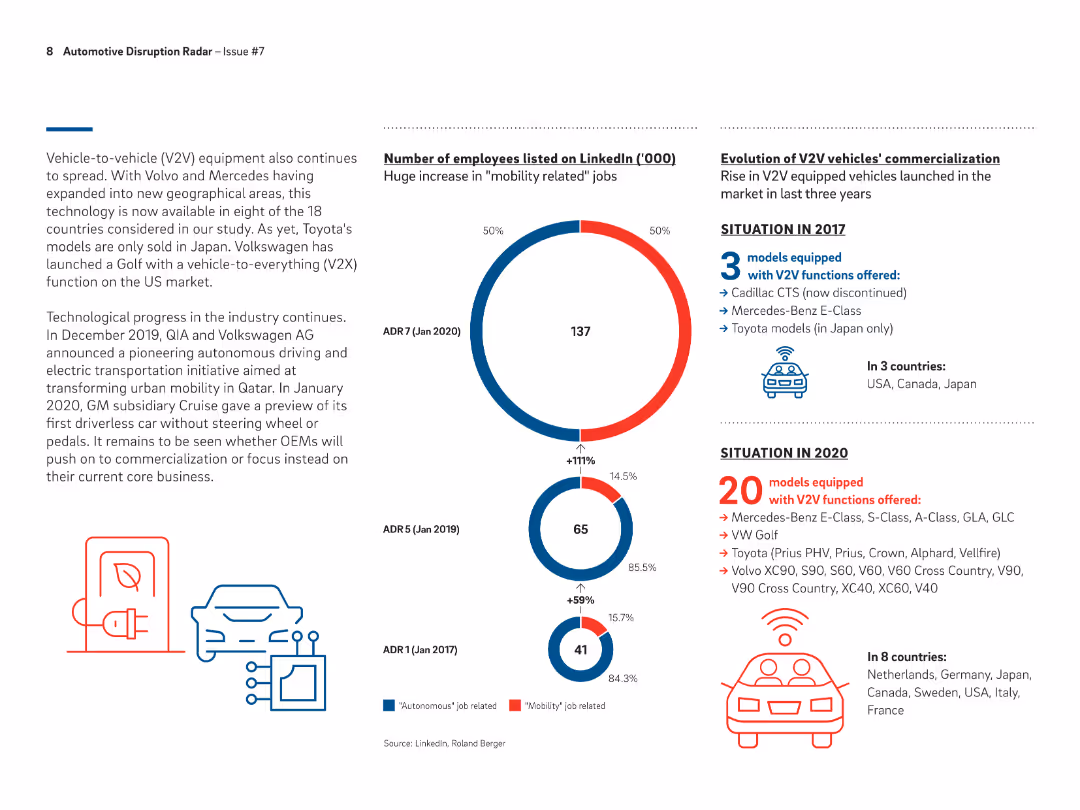
Comparison table of conventional vs. advanced body control skills; side notes on competencies.
Human Resources and Talent Management
Industrial & Manufacturing
Emphasizes the need for suppliers to gain new competencies in electronics/software to lead in future vehicle dynamics, including ADAS and cybersecurity.
vehicle dynamics, ADAS, software skills, competencies, future readiness
false
Human Resources and Talent Management
Industrial & Manufacturing
Table
Roland Berger
Add to my slides
Remove from favorites
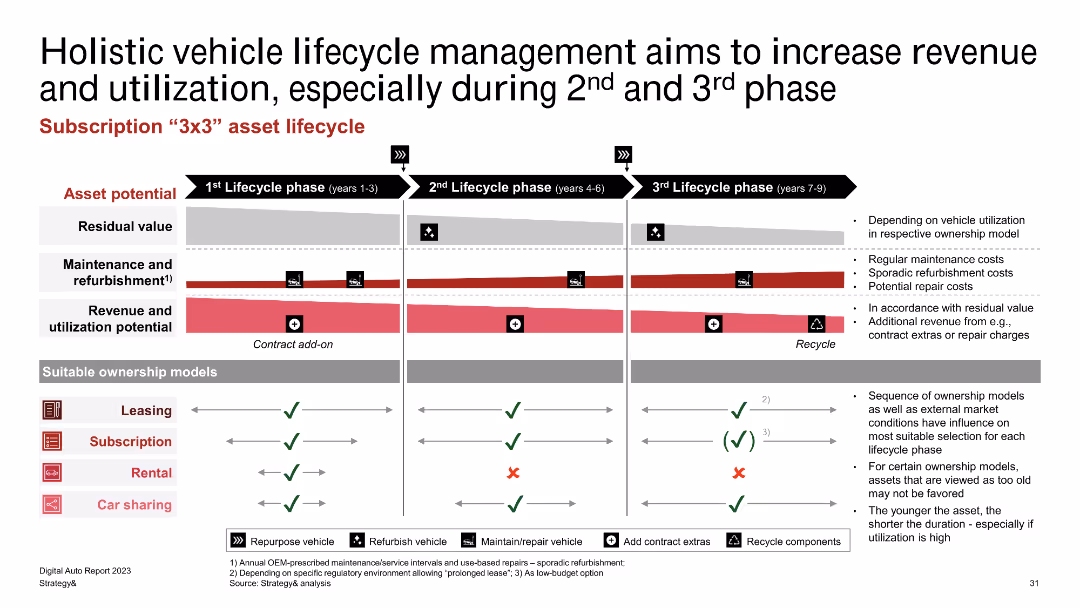
A series of flowcharts showing the 3x3 asset lifecycle phases, detailing asset potential, maintenance, and suitable ownership models.
Operational Efficiency
Transportation & Logistics
Describes a holistic approach to vehicle lifecycle management focusing on increasing revenue and utilization through different phases and ownership models.
vehicle lifecycle, management, revenue, utilization, phases
false
Operational Efficiency
Transportation & Logistics
Table
PwC/Strategy&
Add to my slides
Remove from favorites
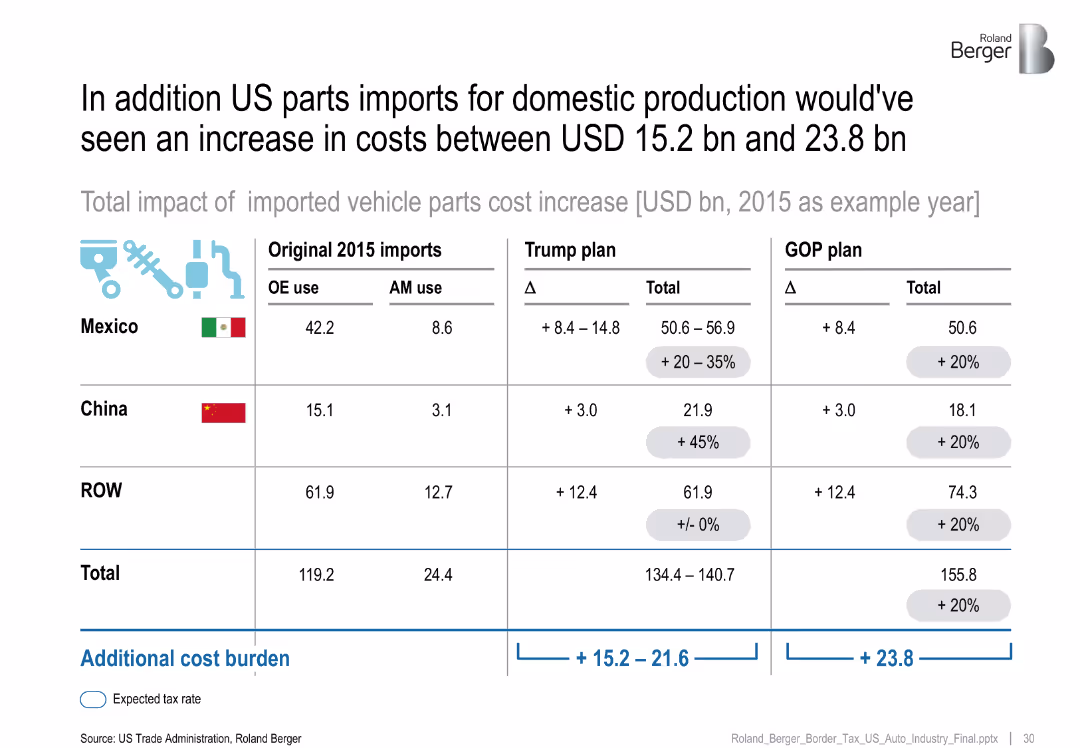
Tabular format breaking down cost increases for vehicle parts imports by source country and use (OE/AM), with changes under Trump and GOP plans
Operational Efficiency
Industrial & Manufacturing
The slide highlights how vehicle parts imports, essential for domestic production, would incur significant cost increases under both tax proposals, especially from Mexico and China.
vehicle parts, import tax, cost increase, GOP plan, Trump plan, OE use, AM use, sourcing impact
false
Operational Efficiency
Industrial & Manufacturing
Table
Roland Berger
Add to my slides
Remove from favorites
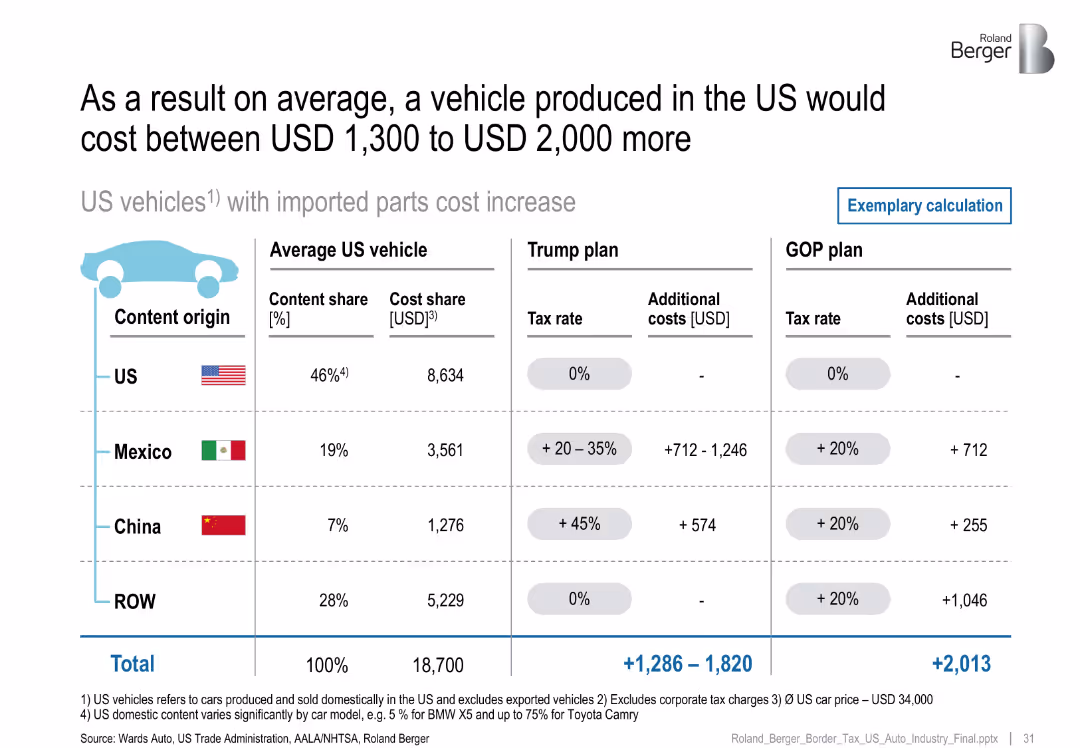
Table showing average vehicle content share by country of origin and associated additional cost per Trump and GOP plans
Financial Performance
Industrial & Manufacturing
Illustrates the compounded cost impact on US-made vehicles due to import tariffs on parts. Shows per vehicle cost increases under both tax scenarios, emphasizing the contribution from Mexican and Chinese components.
vehicle pricing, import parts, tariff impact, cost structure, US production, content share, trade policy
false
Financial Performance
Industrial & Manufacturing
Table
Roland Berger
Add to my slides
Remove from favorites
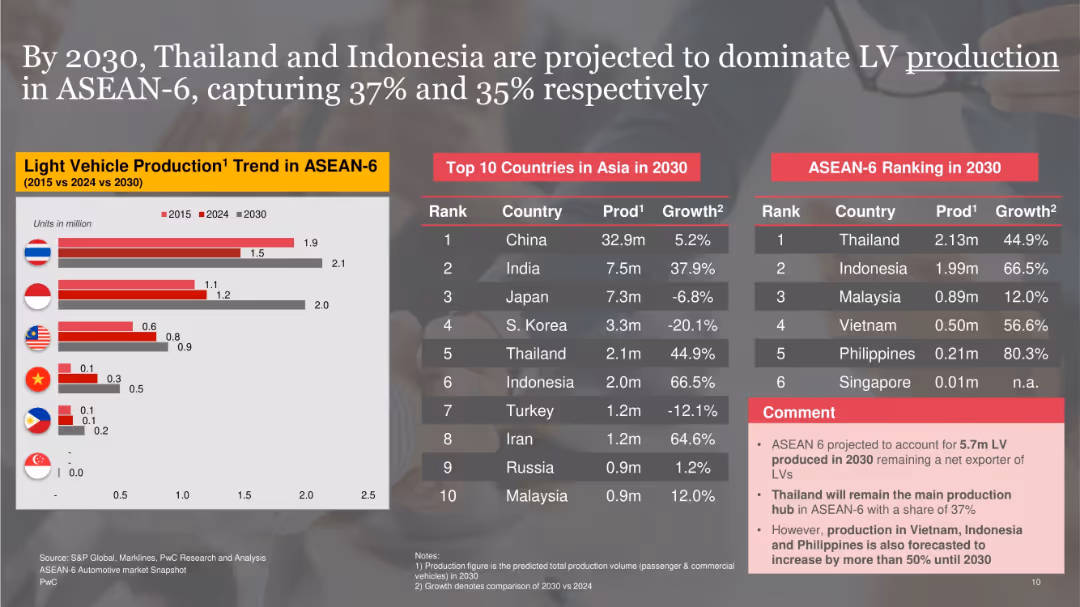
Left bar chart shows production trends in ASEAN-6 (2015, 2024, 2030); right side features Asia’s top 10 producers and ASEAN-6 rankings in 2030.
Strategic Planning
Industrial & Manufacturing
Shows projections for light vehicle production in ASEAN-6, forecasting Thailand and Indonesia as dominant hubs by 2030. Provides context with broader Asian rankings and growth forecasts. Commentary emphasizes Vietnam, Philippines, and Indonesia's rapid production capacity growth.
vehicle production, ASEAN-6, Thailand, Indonesia, 2030, growth, Asia rankings
false
Strategic Planning
Industrial & Manufacturing
Mixed Chart
PwC/Strategy&
Add to my slides
Remove from favorites
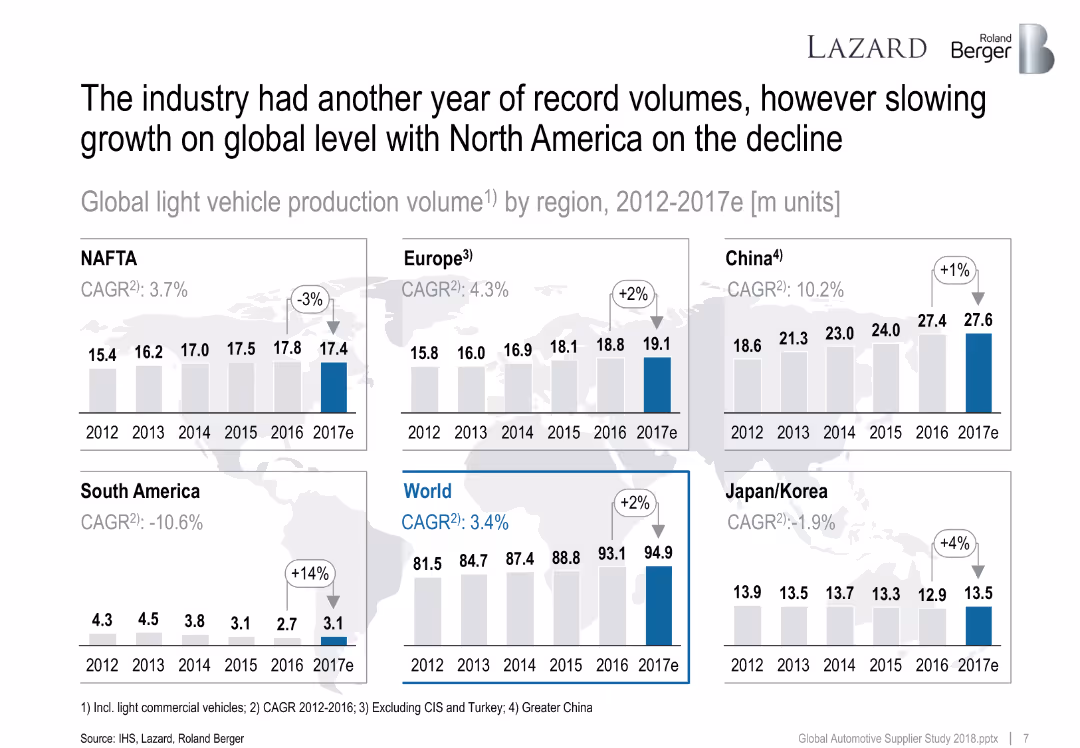
Multiple bar charts arranged by region showing yearly vehicle production from 2012 to 2017e. Growth or decline shown using arrows and CAGR annotations.
Performance Metrics and KPIs
Industrial & Manufacturing
Vehicle production volumes grew globally from 2012–2017e, with China leading. NAFTA showed a decline, while South America saw a rebound in 2017. World production maintained steady growth.
vehicle production, CAGR, regional growth, NAFTA, China, global trends, KPIs
false
Performance Metrics and KPIs
Industrial & Manufacturing
Multiple Chart
Roland Berger
Add to my slides
Remove from favorites
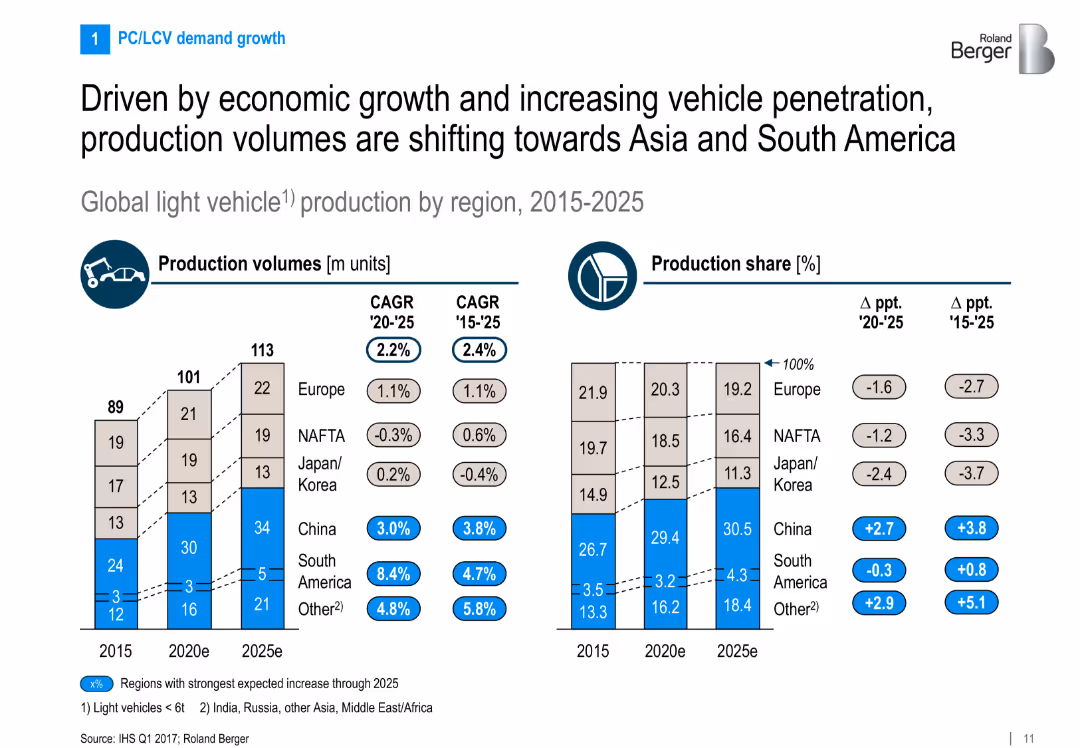
Dual-column bar and share charts showing regional vehicle production data from 2015 to 2025. Growth rates and production shares included.
Market Analysis and Trends
Industrial & Manufacturing
This slide illustrates the regional shift in global vehicle production. Asia, particularly China, is expected to gain the largest share, while traditional markets like Europe, NAFTA, and Japan/Korea decline. Growth projections and share deltas support the regional rebalancing trend.
vehicle production, regional shift, China growth, automotive trends, CAGR, global market
false
Market Analysis and Trends
Industrial & Manufacturing
Multiple Chart
Roland Berger
Add to my slides
Remove from favorites
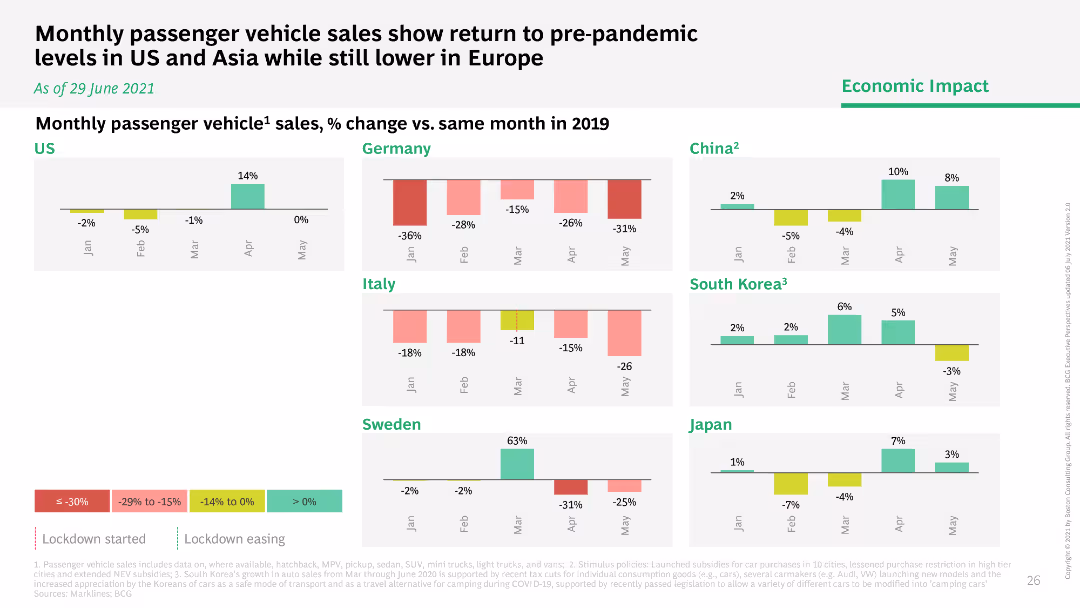
The slide presents a comparative analysis of monthly passenger vehicle sales year-over-year for several countries (US, Germany, Italy, Sweden, China, South Korea, Japan). Each country has a bar graph with monthly data from January to July, with bars colored to indicate the percentage change compared to the previous year. The design is straightforward, with clear labels and a color-coded system that helps in quickly identifying trends and deviations in vehicle sales.
Market Analysis and Trends
Transportation & Logistics
This slide is useful for analyzing trends in the automotive sector, particularly how different regions are recovering from economic impacts of COVID-19 on vehicle sales. It allows stakeholders to compare market dynamics and consumer confidence across various countries, aiding in strategic planning for production adjustments, marketing strategies, and inventory management. The clear month-by-month breakdown helps in understanding the timing and effectiveness of economic recovery measures and consumer sentiment towards vehicle purchases.
vehicle sales, COVID-19, market analysis, economic recovery, automotive sector, consumer confidence, strategic planning
false
Market Analysis and Trends
Transportation & Logistics
Multiple Chart
BCG
Add to my slides
Remove from favorites
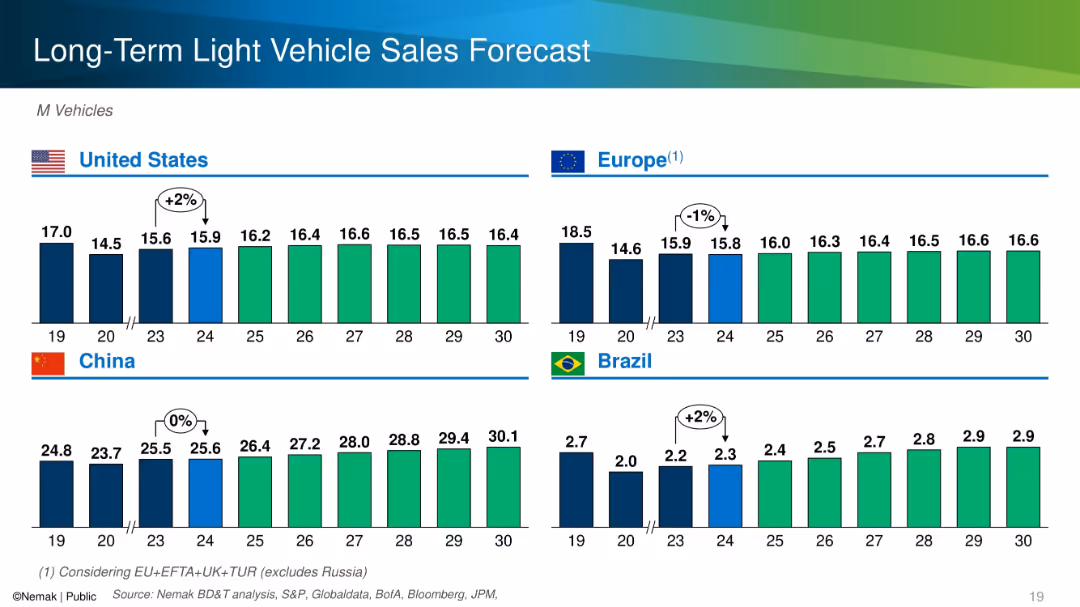
Grid layout of clustered bar charts by country with country flags and color-coded projections through 2030.
Market Analysis and Trends
Industrial & Manufacturing
This slide forecasts light vehicle sales through 2030 for the U.S., Europe, China, and Brazil. It shows recent trends and projected growth or stagnation in each region, with percentage change annotations and historical context.
vehicle sales, forecast, automotive, regional trends, growth
false
Market Analysis and Trends
Industrial & Manufacturing
Single Chart
Barclays
Add to my slides
Remove from favorites
Column charts showing monthly passenger vehicle sales percentage change versus 2019 in different countries, with color-coded categories.
Market Analysis and Trends
Consumer Goods
Examines monthly passenger vehicle sales trends, indicating a return to pre-pandemic levels in the US and Asia, but slower recovery in Europe.
vehicle sales, pre-pandemic, US, Asia, Europe
false
Market Analysis and Trends
Consumer Goods
Multiple Chart
BCG
Add to my slides
Remove from favorites
This slide presents multiple bar charts showing the year-over-year change in vehicle sales per country.
Strategic Planning
Transportation & Logistics
Highlights trends in passenger vehicle sales post-COVID-19, with data showing significant recovery or growth spikes in various regions.
vehicle sales, trends, COVID-19, recovery
false
Strategic Planning
Transportation & Logistics
Multiple Chart
BCG
Add to my slides
Remove from favorites
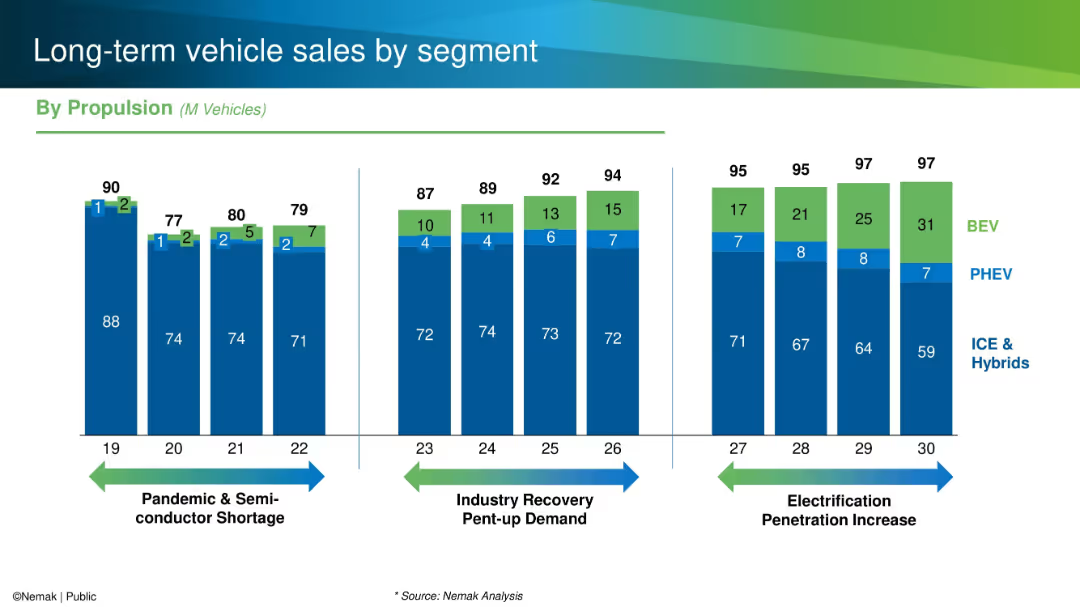
Stacked bar chart with propulsion type breakdown, grouped by period themes (e.g., pandemic, electrification).
Market Analysis and Trends
Industrial & Manufacturing
This slide shows vehicle sales trends segmented by propulsion type (ICE, PHEV, BEV) over time. It outlines three distinct periods: the semiconductor shortage, recovery, and increased EV penetration, illustrating how powertrain mixes are evolving through 2030.
vehicle segment, propulsion, ICE, BEV, PHEV, sales trends
false
Market Analysis and Trends
Industrial & Manufacturing
Single Chart
Barclays
Add to my slides
Remove from favorites
Features column charts detailing the changes in planned vehicle spending due to COVID-19, comparing data from before and during the pandemic across the US, Europe, and Asia.
Market Analysis and Trends
Transportation & Logistics
Evaluates how consumer spending intentions on vehicles have shifted due to the pandemic, offering insights into economic behavior and planning.
vehicle spending, COVID-19 impact, column chart, economic behavior, regional analysis
false
Market Analysis and Trends
Transportation & Logistics
Multiple Chart
McKinsey
Add to my slides
Remove from favorites
Slide includes a column chart and table with data showing interest levels in vehicle subscription services by age, and key characteristics valued in such services.
Product and Service Analysis
Transportation & Logistics
Explores consumer interest in vehicle subscription models, highlighting the importance of cost control, convenience, and flexibility.
Vehicle subscription, consumer interest, cost control, convenience, flexibility
false
Product and Service Analysis
Transportation & Logistics
Mixed Chart
Deloitte
Add to my slides
Remove from favorites
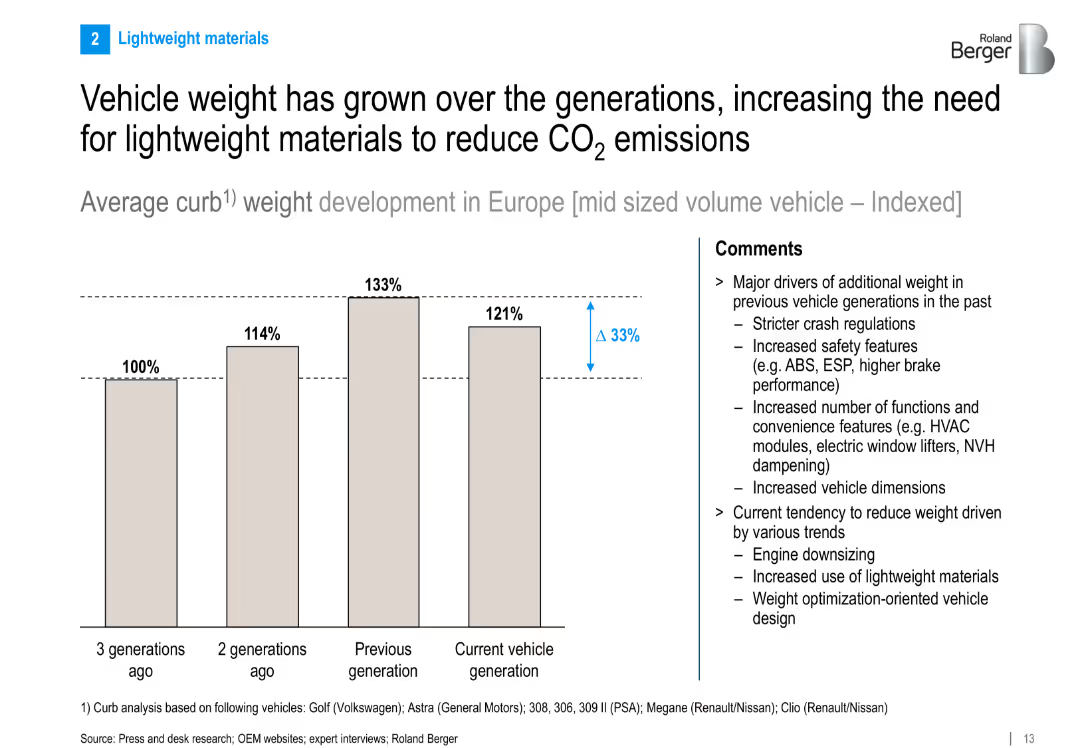
Bar chart illustrating indexed vehicle weight growth across generations. Right panel explains driving factors and emerging lightweighting trends.
Technology and Digital Transformation
Industrial & Manufacturing
This slide tracks the increase in average curb weight of midsize vehicles across generations and discusses the need for lightweighting to meet emissions goals. Key drivers include safety and comfort features, while current trends focus on engine downsizing and advanced materials.
vehicle weight, lightweight materials, emissions reduction, curb weight, automotive engineering
false
Technology and Digital Transformation
Industrial & Manufacturing
Mixed Chart
Roland Berger
Add to my slides
Remove from favorites
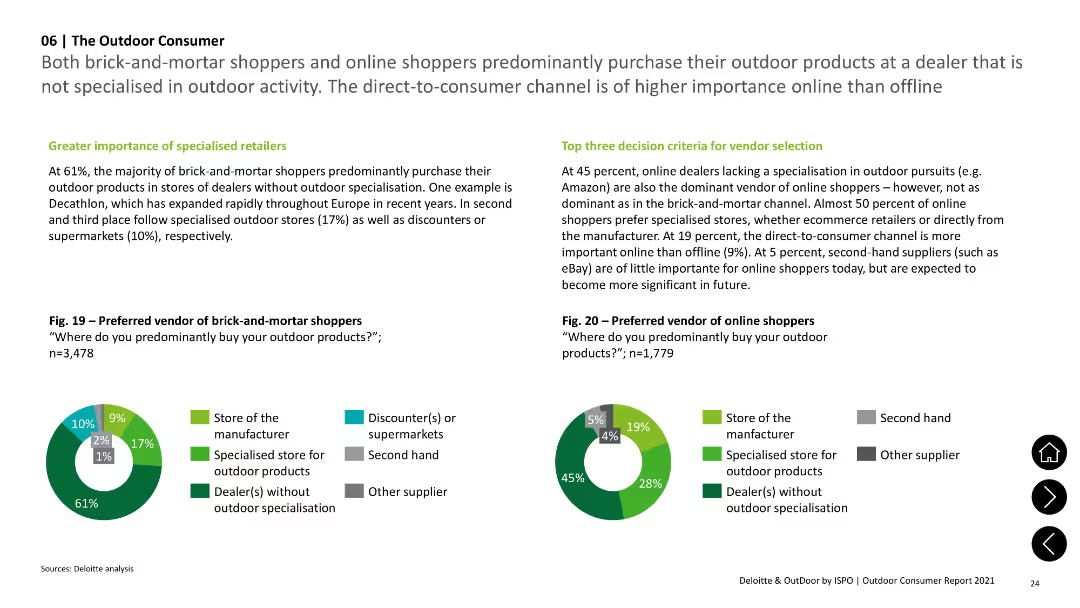
Two pie charts showing preferred vendors for brick-and-mortar and online shoppers, with text on specialized vs non-specialized dealers.
Market Analysis and Trends
Consumer Goods
Shows preferences for purchasing from specialized vs. non-specialized vendors among brick-and-mortar and online shoppers, noting the dominance of online dealers.
Vendors, Preferences, Specialized, Online, Brick-and-Mortar
false
Market Analysis and Trends
Consumer Goods
Multiple Chart
Deloitte
Add to my slides
Remove from favorites
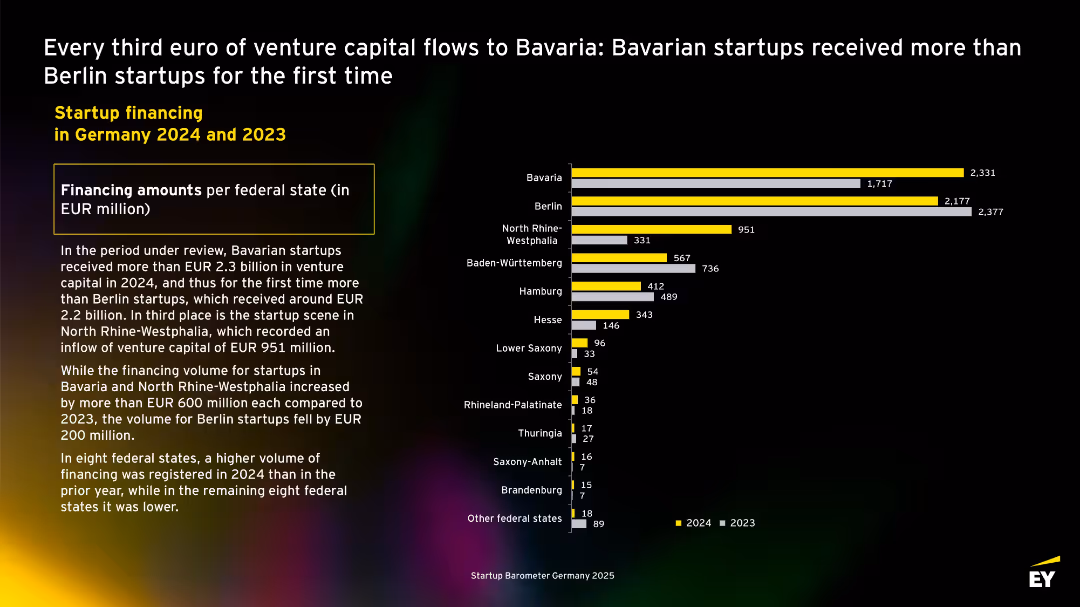
Horizontal bar chart similar in format to Slide 16131, showing investment amounts by state instead of deal count; highlights Bavaria overtaking Berlin for the first time in terms of funding volume.
Investment Analysis
Technology & Software
Illustrates total venture capital amounts received by startups in different German federal states in 2023 vs. 2024. Bavaria surpasses Berlin with €2.3B in 2024. Funding grew in 8 states and fell in the other 8, reflecting a shift in investment concentration.
venture capital, Bavaria, Berlin, funding, 2024, federal states, Germany, startup investment
false
Investment Analysis
Technology & Software
Mixed Chart
EY
Add to my slides
Remove from favorites
The slide shows a timeline with column charts depicting the annual venture capital investment in Brazil over different periods, emphasizing growth.
Investment Analysis
Financial Services
Reviews the evolution of venture capital investment in Brazil, emphasizing major investments and the development of the venture ecosystem over recent years.
venture capital, Brazil, investment growth, VC trends, 2019
false
Investment Analysis
Financial Services
Linear Flow
McKinsey
Add to my slides
Remove from favorites
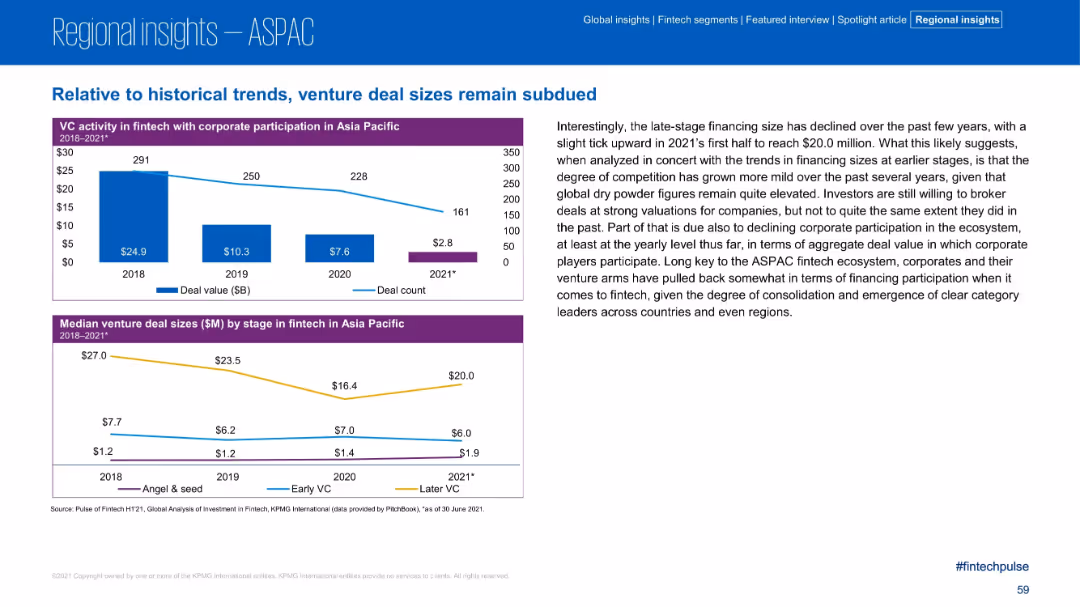
Two graphs (bar and line, plus line chart) on VC activity with corporate participation and median deal size.
Investment Analysis
Financial Services
This slide shows the reduced size and frequency of corporate VC participation in fintech and declining median venture deal sizes across stages from 2018 to 2021. The accompanying text discusses consolidation trends and cautious late-stage financing.
Venture Capital, Corporate VC, Deal Size, Asia Pacific, Fintech, Trends
false
Investment Analysis
Financial Services
Multiple Chart
KPMG
Add to my slides
Remove from favorites
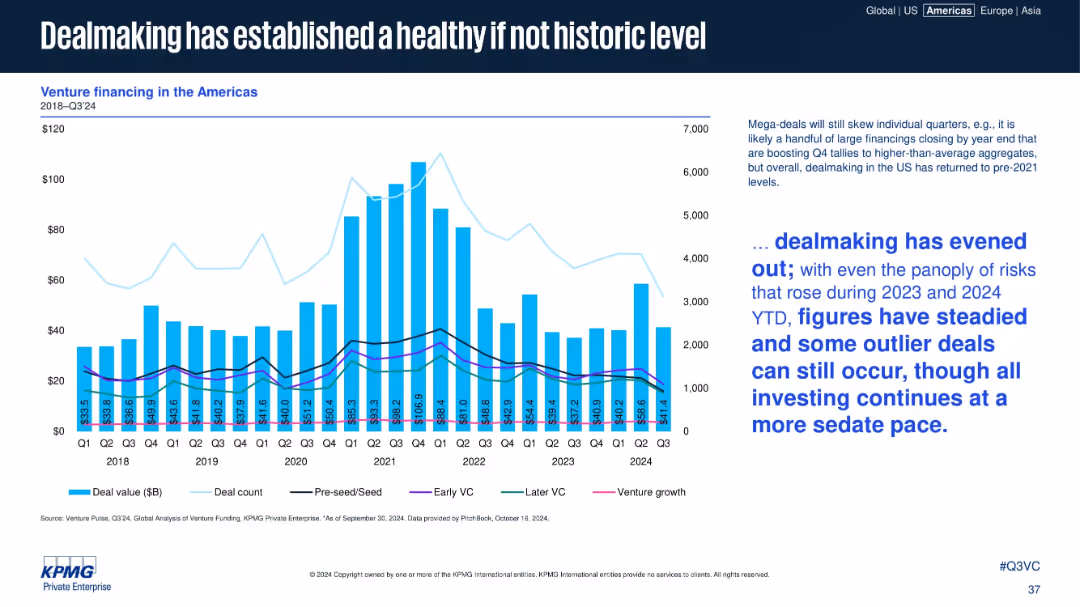
Bar and line combo chart showing quarterly deal values and counts, with overlaid stage-specific lines.
Market Analysis and Trends
Financial Services
The chart tracks venture financing trends in the Americas from 2018 to Q3 2024, indicating that dealmaking has stabilized post-2021 highs. Despite occasional mega-deals, overall activity has normalized, supported by steadier figures across VC stages.
venture capital, deal value, Americas, funding trends, stability, mega-deals, VC stages, normalization
false
Market Analysis and Trends
Financial Services
Mixed Chart
KPMG
Add to my slides
Remove from favorites
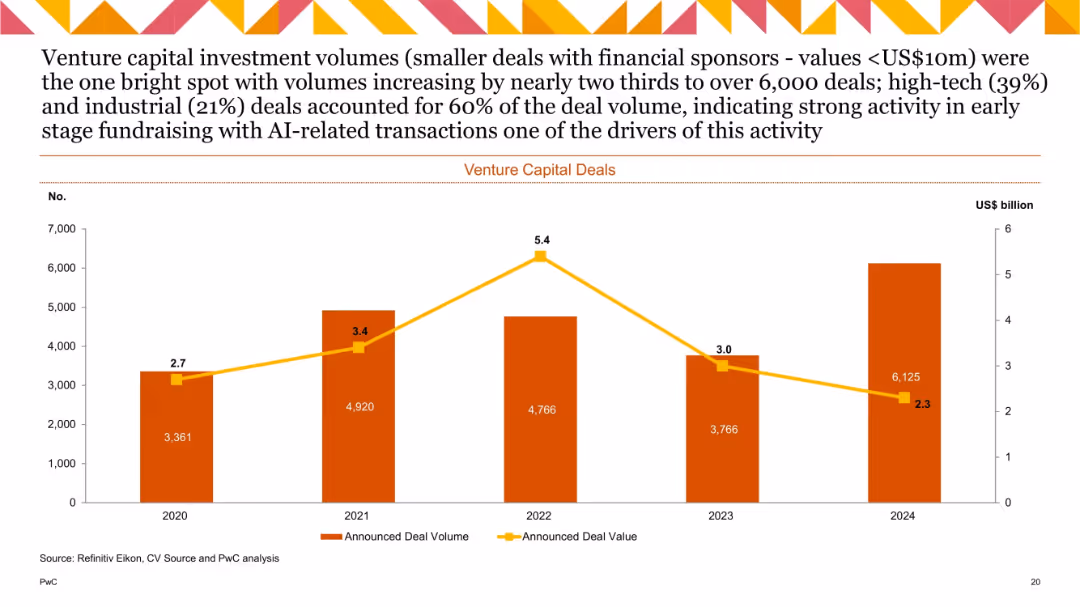
Column and line chart showing VC deal volume and value (2020–2024), labeled bars for volume and yellow trend line for value.
Investment Analysis
Technology & Software
This slide outlines venture capital (VC) deal trends, showing a steady increase in volume with a peak in 2024, while deal values peaked in 2022 and declined after. High tech and industrial sectors accounted for most of the activity, with AI-related deals playing a key role in early-stage fundraising momentum.
Venture capital, deal volume, deal value, AI, early-stage, high tech, fundraising
false
Investment Analysis
Technology & Software
Single Chart
PwC/Strategy&
Add to my slides
Remove from favorites
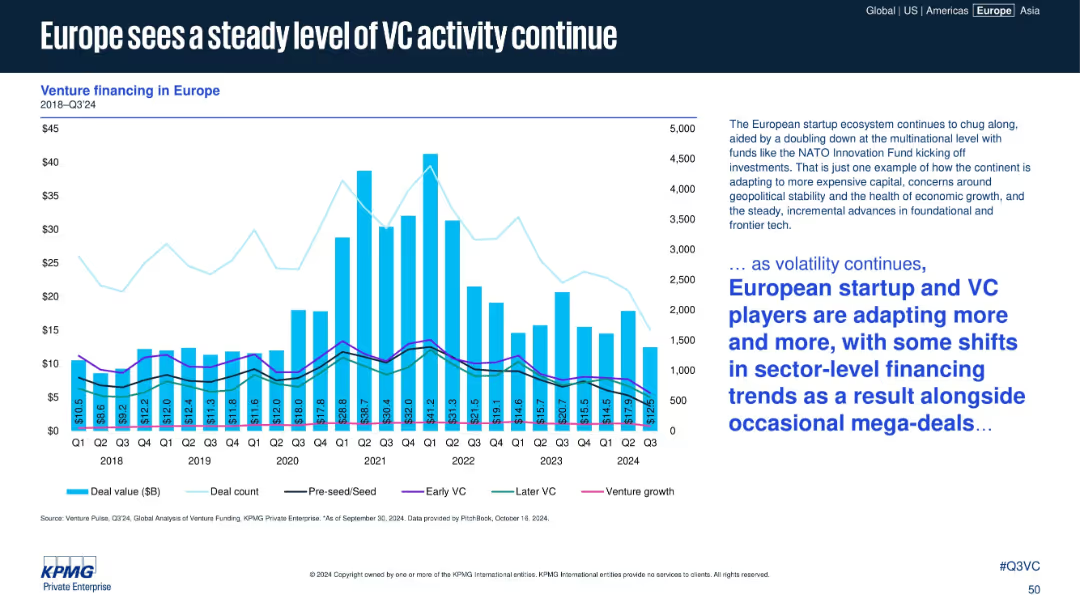
Bar and line chart combination on left, right-side text block with summary insights in blue and black font
Market Analysis and Trends
Financial Services
This slide highlights trends in venture financing in Europe from 2018 to Q3 2024. It presents deal value, deal count, and stage-wise VC activity. Commentary notes that the ecosystem remains stable despite macro volatility and sectoral shifts.
Venture capital, Europe, deal value, startup funding, financing trends
false
Market Analysis and Trends
Financial Services
Mixed Chart
KPMG
Add to my slides
Remove from favorites
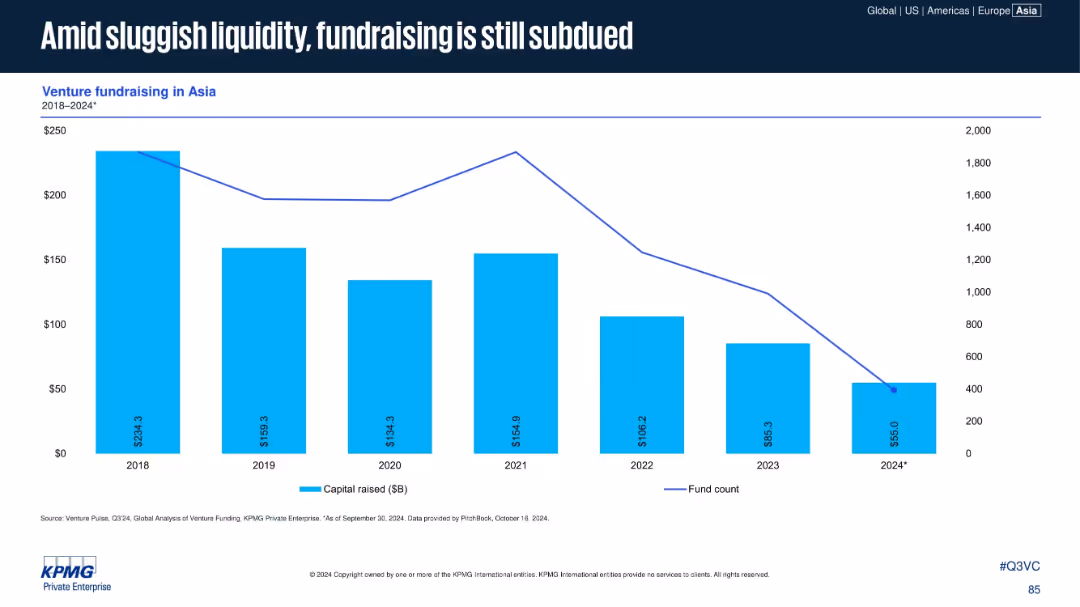
Bar and line chart depicting venture fundraising in Asia (2018–2024) showing capital raised in billions and fund count annually.
Strategic Planning
Financial Services
This slide shows a consistent decline in both capital raised and the number of venture funds in Asia from 2018 to 2024. The drop is particularly stark in 2024, signaling subdued investor sentiment and liquidity constraints in the market.
venture capital, fundraising, Asia, capital raised, fund count, liquidity, trends
false
Strategic Planning
Financial Services
Single Chart
KPMG
Add to my slides
Remove from favorites
The slide features icons representing methodology elements like interviews, data inputs, and research sources for the venture capital study.
Market Analysis and Trends
Financial Services
Details the methodology of the joint study on Indonesia’s venture capital outlook by Google and A.T. Kearney, highlighting data sources and research.
Venture Capital, Indonesia, Methodology, Research
false
Market Analysis and Trends
Financial Services
Multiple Chart
Kearney
Add to my slides
Remove from favorites
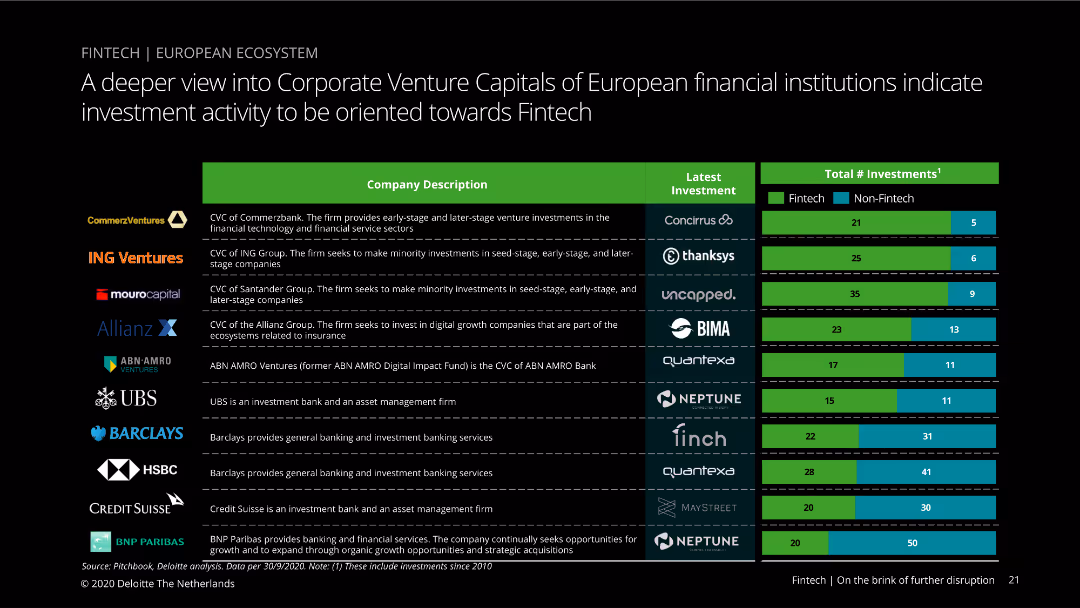
The slide shows a table with company descriptions, latest investments, and total number of investments divided into fintech and non-fintech categories. Visual complexity is moderate, with a clear color scheme and organized data presentation.
Investment Analysis
Financial Services
This slide provides insights into the venture capital investments by European financial institutions, focusing on the fintech sector. It compares the number of fintech versus non-fintech investments made by each institution.
Venture capital, investments, fintech, financial institutions, Europe
false
Investment Analysis
Financial Services
Mixed Chart
Deloitte
Add to my slides
Remove from favorites
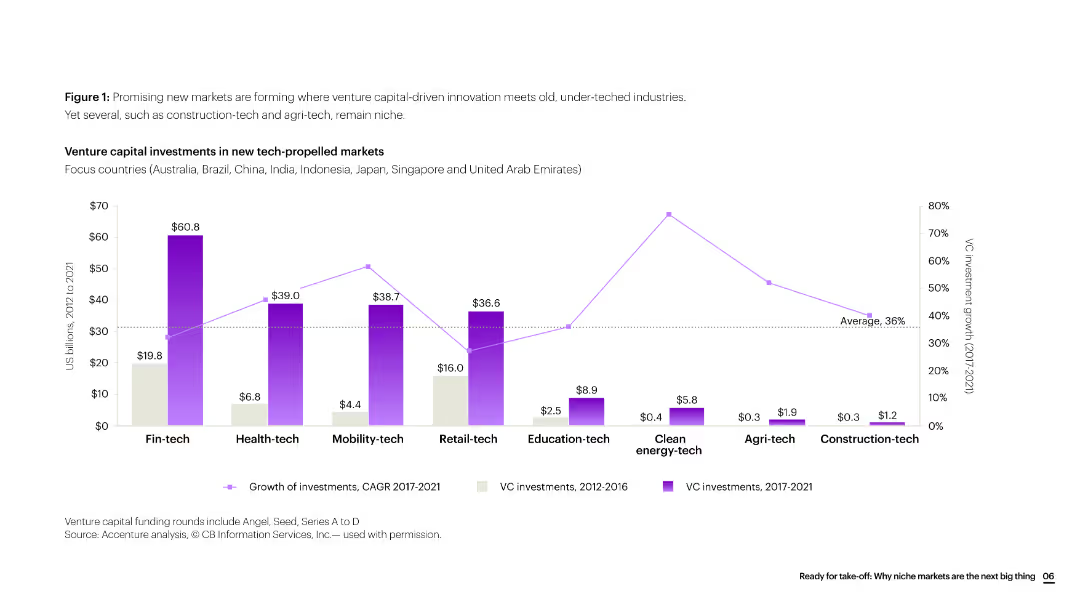
The slide features a column chart showing venture capital investments across various tech-propelled markets, with data segmented by investment growth periods.
Investment Analysis
Financial Services
The slide presents data on venture capital investments in various tech-propelled markets, highlighting significant growth areas and the focus countries for these investments.
venture capital, investments, tech markets, growth, financial services, column chart
false
Investment Analysis
Financial Services
Single Chart
Accenture
Add to my slides
Remove from favorites
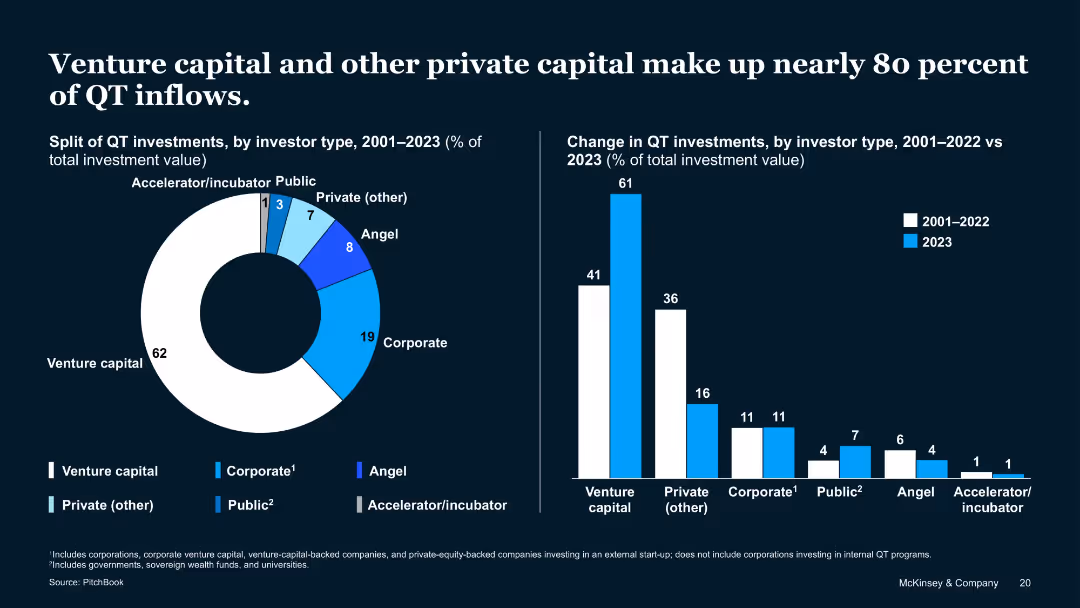
Pie and bar charts showing investment share and changes over time by investor type
Investment Analysis
Artificial Intelligence
The slide shows that venture capital (62%) and other private capital dominate QT investments. There is a notable increase in VC contribution in 2023. Corporate and public investments remained relatively stable.
Venture Capital, Investor Types, QT Inflows, Private Capital, 2023 Growth
false
Investment Analysis
Artificial Intelligence
Multiple Chart
McKinsey
Add to my slides
Remove from favorites
Bubble chart showing venture capital investment trends in mobility platforms and transport technology from 2016 to 2019, with a comparison to AI investment.
Investment Analysis
Financial Services
Analyzes the trends in venture capital investments in mobility and transport technology, highlighting a decline in mobility investment and an increase in AI investment.
venture capital, mobility platforms, transport technology, AI
false
Investment Analysis
Financial Services
Mixed Chart
Roland Berger
Add to my slides
Remove from favorites
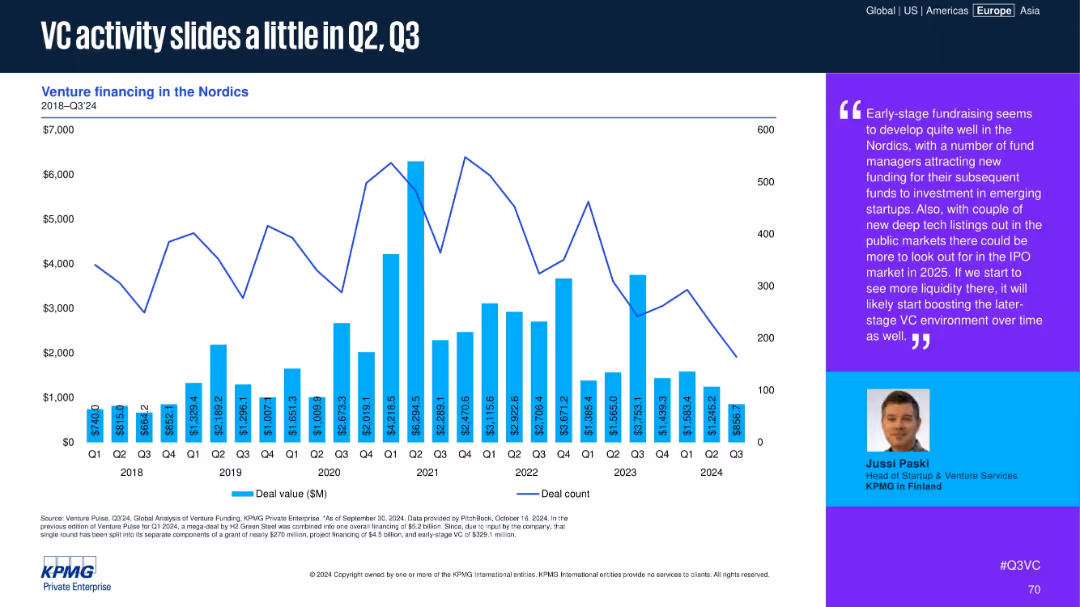
Bar and line chart on left (deal value in bars, deal count in line), large purple quote box on right with speaker image and commentary. Title in bold at top, with a regional focus on the Nordics.
Market Analysis and Trends
Financial Services
Tracks quarterly venture financing trends in the Nordics from 2018 to Q3 2024, showing fluctuations in deal value and count. Commentary highlights promising early-stage activity and potential IPO market developments in 2025.
Venture Capital, Nordics, Deal Count, Deal Value, IPO, Startups, 2024, Q3, Funding
false
Market Analysis and Trends
Financial Services
Mixed Chart
KPMG
Add to my slides
Remove from favorites
The slide includes two sets of graphs: one showing trends in dry powder for VC and PE firms, and the other displaying fundraising and deployment rates. These graphs are well-defined with contrasting colors for differentiation and annotated for clarity.
Financial Performance
Financial Services
This slide presents the current status of venture capital and private equity in terms of available capital and fundraising trends, signaling possible shifts in investment strategies and market outlooks. It's vital for discussions on the health of the investment sector and can help guide strategic decisions based on funding availability.
Venture Capital, Private Equity, Dry Powder, Fundraising, Investment Rate, Market Analysis
false
Financial Performance
Financial Services
Multiple Chart
JP Morgan
Add to my slides
Remove from favorites
The slide features a pie chart and a column chart. The pie chart shows the split of QT investments by investor type (2001-2022), while the column chart shows the change in QT investments by investor type between 2001-21 and 2022.
Investment Analysis
Financial Services
This slide indicates that venture capital and private funding dominate QT investments, making up nearly 80% of inflows, with significant growth in 2022.
venture capital, private funding, QT investments, investor types, growth analysis
false
Investment Analysis
Financial Services
Multiple Chart
McKinsey
Add to my slides
Remove from favorites
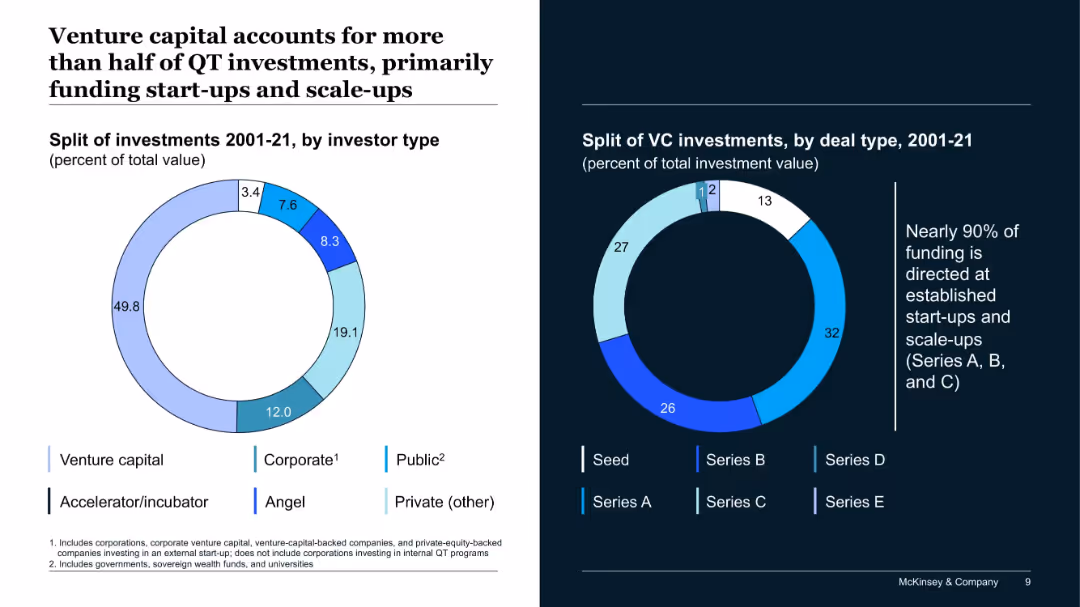
Two donut charts: one for investment split by investor type and one for deal stage (2001–2021). Includes a side note on Series A–C dominance.
Investment Analysis
Artificial Intelligence
The slide breaks down QT investment sources and deal stages, showing that venture capital dominates, and most funding goes to Series A through C. It emphasizes the ecosystem’s maturity level.
venture capital, QT investment, Series A-C, funding types, investor profile
false
Investment Analysis
Artificial Intelligence
Multiple Chart
McKinsey
Add to my slides
Remove from favorites
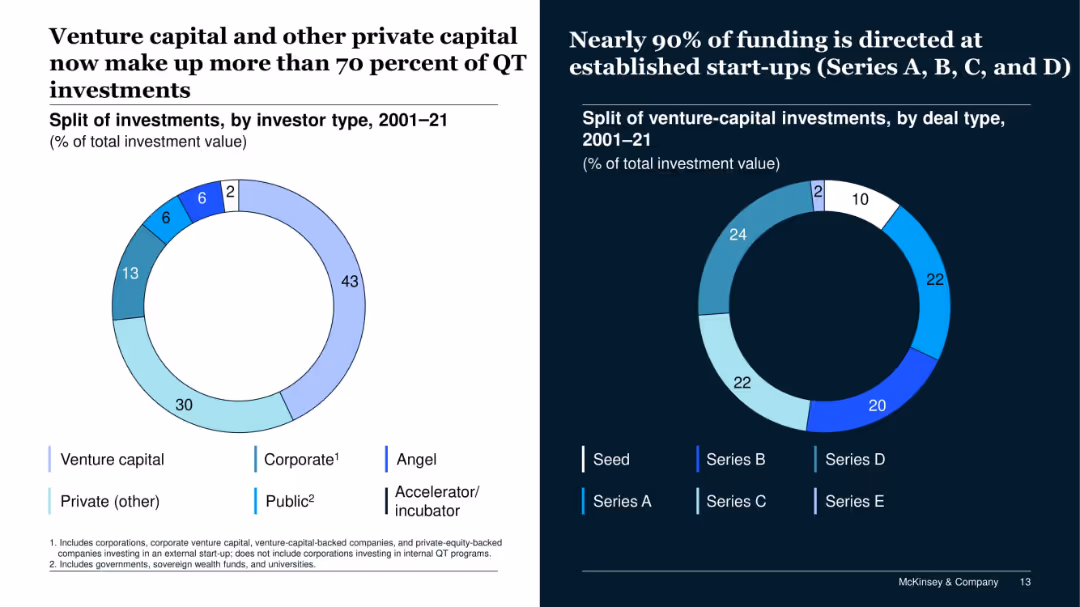
Dual pie charts on white and dark backgrounds showing investor types and deal types; segmented in different colors.
Investment Analysis
Financial Services
This slide breaks down the types of investors and investment deal stages in QT startups from 2001–21. Venture capital dominates with 43%, and 90% of funding is concentrated in Series A–D stages, showing a focus on established companies rather than early-stage ventures.
venture capital, QT, investor type, Series A-D, private capital
false
Investment Analysis
Financial Services
Multiple Chart
McKinsey
Add to my slides
Remove from favorites
Column chart representing the dry powder of SEA funds over years with two key point bullets on the right. The background is white, and the text is predominantly blue and black.
Investment Analysis
Financial Services
Illustrates venture capital funds' remaining investment in the SEA region with $15B, emphasizing a continued but cautious approach amidst economic downturns.
venture capital, SEA, investment, economic downturn, dry powder, cautious approach, funding, startups
false
Investment Analysis
Financial Services
Mixed Chart
Bain
Add to my slides
Remove from favorites
Slide with number 2, a summary of the venture capital landscape across countries, with text and multiple small column charts contrasting the number of startups at various valuation levels.
Investment Analysis
Technology & Software
The slide compares the startup ecosystems in Southeast Asia, with a focus on the number of small startups, unicorns, and centaurs in different countries. Singapore's dominance in successful startups and venture capital activity is highlighted, offering insights into the region's investment climate.
venture capital, startups, valuations, Singapore, comparison, unicorns, centaurs
false
Investment Analysis
Technology & Software
Table
Bain
Add to my slides
Remove from favorites
The slide features a line chart showing venture capital investments in T&L technology from 2016 to 2022H1 and a table listing selected venture capital deals in 2022. Text descriptions accompany these visual elements.
Investment Analysis
Transportation & Logistics
This slide presents an analysis of venture capital investment trends in technology within the Transport & Logistics industry, highlighting major investments and players in the market space.
venture capital, technology, investment, T&L, market trends, 2022, financial analysis, startup, funding series, innovation
false
Investment Analysis
Transportation & Logistics
Mixed Chart
PwC/Strategy&
Add to my slides
Remove from favorites
A comparative chart illustrates sector shares between venture capital investing and equity market capitalisation. The visual elements highlight the disproportionate share attracted by the technology sector.
Investment Analysis
Technology & Software
This slide offers a comparative analysis between the venture investing and equity market capitalization across various sectors from 2013 to 2017. It underscores the technology sector's ability to attract a larger share of venture investments relative to its market capitalization, suggesting a higher investment activity within the sector.
venture capital, technology sector, market share, investment, equity capitalization
false
Investment Analysis
Technology & Software
Mixed Chart
Oliver Wyman
Add to my slides
Remove from favorites
Includes a bar chart and a pie chart showing the number of unicorns by city, location, and industry sector.
Market Analysis and Trends
Financial Services
Analyzes the distribution of unicorns across various cities, regions, and industry sectors, illustrating key market concentrations.
venture capital, unicorns, market, industry, distribution
false
Market Analysis and Trends
Financial Services
Multiple Chart
JP Morgan
Add to my slides
Remove from favorites
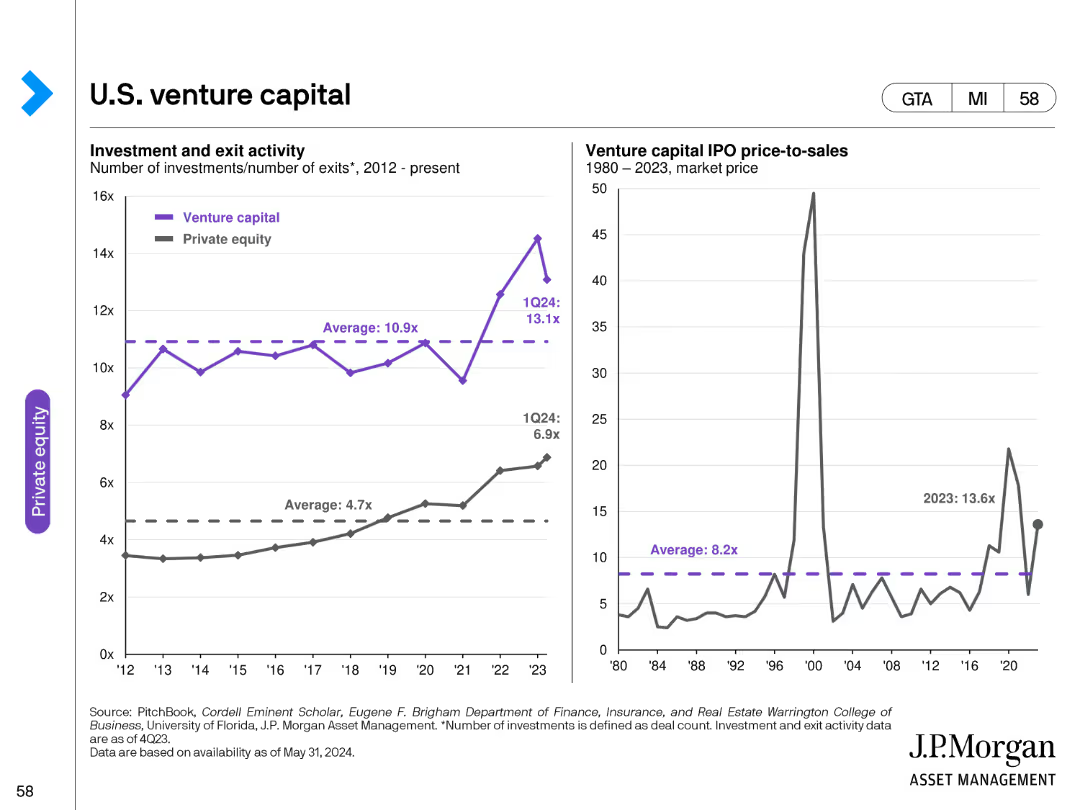
The slide features two line charts: one showing venture capital investment and exit activity, and the other depicting IPO price-to-sales ratios over time.
Investment Analysis
Financial Services
It provides a detailed analysis of U.S. venture capital activities, highlighting investment and exit trends as well as IPO price-to-sales ratios.
venture capital, U.S., investments, exits, IPO, price-to-sales, trends, financial, data analysis
false
Investment Analysis
Financial Services
Multiple Chart
JP Morgan
Add to my slides
Remove from favorites
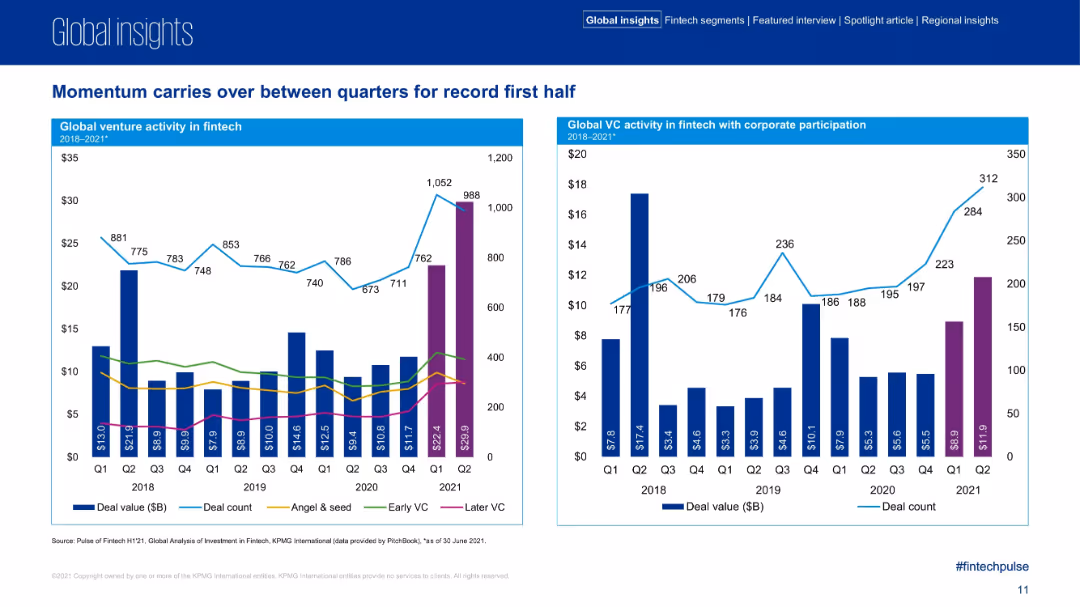
Two bar charts tracking venture activity and VC corporate participation by quarter from 2018 to H1 2021.
Strategic Planning
Financial Services
The slide shows consistent quarterly momentum in venture activity and corporate VC participation. It highlights deal values, counts, and funding types (Angel, Early, Later VC), pointing to sustained growth and investor confidence in fintech innovation through H1 2021.
venture capital, VC, fintech, deal momentum, funding stages, corporate participation
false
Strategic Planning
Financial Services
Multiple Chart
KPMG
Add to my slides
Remove from favorites
Features two sets of data visualizations: a line chart tracking venture deal count trends, and a bar chart segmenting U.S. venture investments by state and sector. The charts are detailed, with a clear legend and marked data points for reference.
Competitive Landscape
Financial Services
This slide assesses the venture capital deal flow and the recovery of investments in California, providing a detailed look at market dynamics and investment distribution by sector. It can be used by financial professionals to analyze regional investment trends and competitive market conditions.
Venture Deals, Investment Trends, California, Market Analysis, Sector Distribution
false
Competitive Landscape
Financial Services
Mixed Chart
JP Morgan
Add to my slides
Remove from favorites
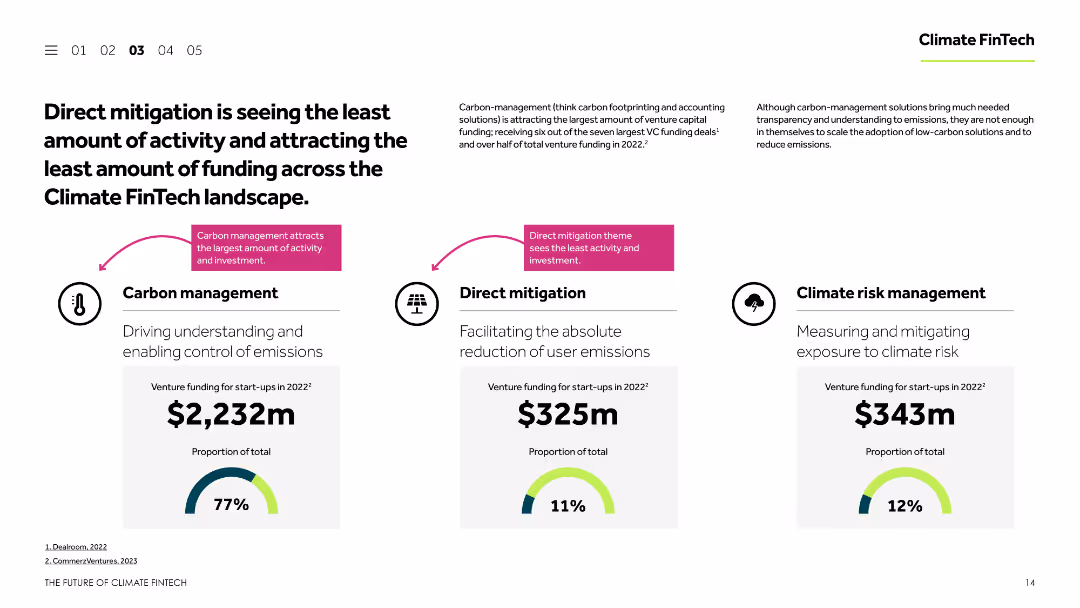
This slide includes a comparative analysis of venture funding across three themes: carbon management, direct mitigation, and climate risk management. The data is presented using column charts and textual descriptions to highlight the differences in funding and activity levels.
Investment Analysis
Financial Services
The slide compares the venture funding and activity levels for different Climate FinTech themes, emphasizing that direct mitigation is receiving the least attention and funding. It uses column charts to visually represent the data and highlights key statistics for each theme.
Venture funding, Climate FinTech, carbon management, direct mitigation, climate risk management
false
Investment Analysis
Financial Services
Multiple Chart
Barclays
Add to my slides
Remove from favorites
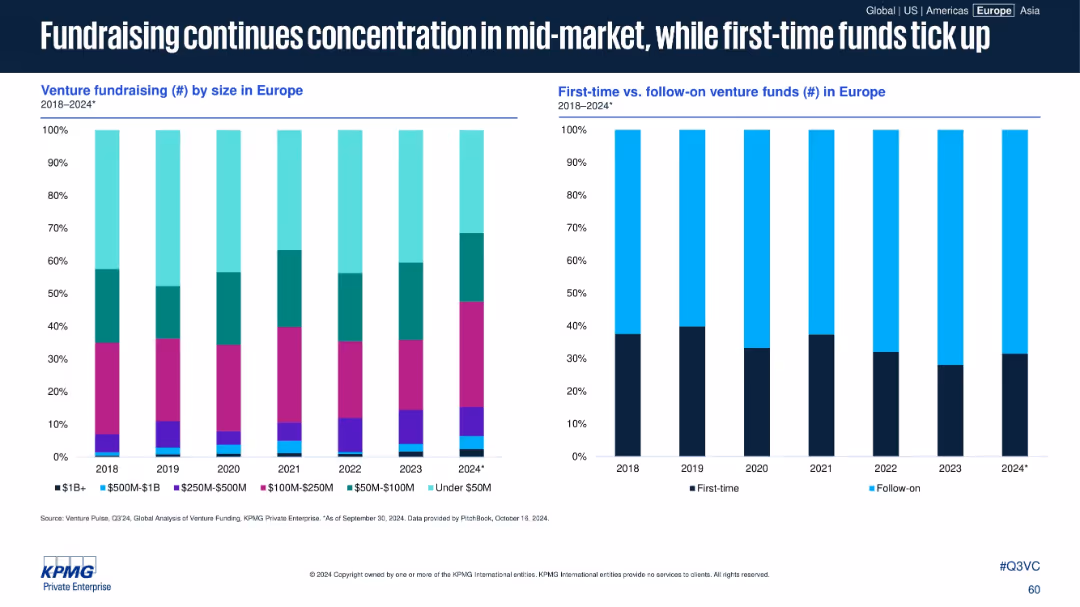
Two side-by-side stacked bar charts showing European venture fundraising data from 2018 to 2024: the left chart splits by fund size; the right splits first-time vs. follow-on funds. Clean, data-centric layout with no clutter.
Market Analysis and Trends
Financial Services
This slide illustrates a trend of mid-market fundraising dominance in Europe from 2018 to 2024, while also showing a gradual increase in first-time venture funds. It reflects investor behavior and evolving fund allocation strategies over time.
Venture funds, Europe, mid-market, first-time funds, follow-on funds, fundraising, fund sizes, capital allocation, investment trends, 2024 forecast
false
Market Analysis and Trends
Financial Services
Multiple Chart
KPMG
Add to my slides
Remove from favorites
This slide presents a dual-line graph depicting both the number of deals and the total deal value over time, with textual analysis below. Key milestones in the venture market are marked for reference.
Investment Analysis
Financial Services
Focusing on the number of venture deals versus deal value, the slide highlights a decline in the number of deals since 2015 while showing a continued increase in deal value. It explores possible causes for this trend and its implications on the venture investing market, emphasizing the role of mega-rounds and the changing dynamics of venture capital investment.
venture investing, deal number, market trends, mega-rounds, investment analysis
false
Investment Analysis
Financial Services
Single Chart
Oliver Wyman
Add to my slides
Remove from favorites
A line graph showing the global venture-investing market's growth from 1998 to 2017, marked by key events like company foundations and economic crises. Annotations provide context for significant points on the timeline.
Investment Analysis
Financial Services
The slide illustrates the growth trend of the global venture-investing market, with key historical points such as the dot-com crisis and subsequent recovery, and markers for the founding of major tech companies and their IPOs. It analyzes the resilience of the venture market in the face of global economic challenges and underlines the strong growth in deal values, particularly post-2003.
venture investing, growth, deal value, dot-com crisis, IPO, market trend
false
Investment Analysis
Financial Services
Mixed Chart
Oliver Wyman
Add to my slides
Remove from favorites
The slide serves as a cover for a report, with a dual-tone image overlaying a forest and a clear title text. It's the introductory slide with additional details like the report's date and affiliating companies' logos.
Investment Analysis
Technology & Software
As a title slide, this introduces the theme of the presentation, which is an assessment of the influence of major technology firms on venture capital investment. It establishes the collaborative nature of the report between Oliver Wyman and Facebook.
venture investment, big tech, title slide, Oliver Wyman, Facebook, report cover
false
Investment Analysis
Technology & Software
Title
Oliver Wyman
Add to my slides
Remove from favorites
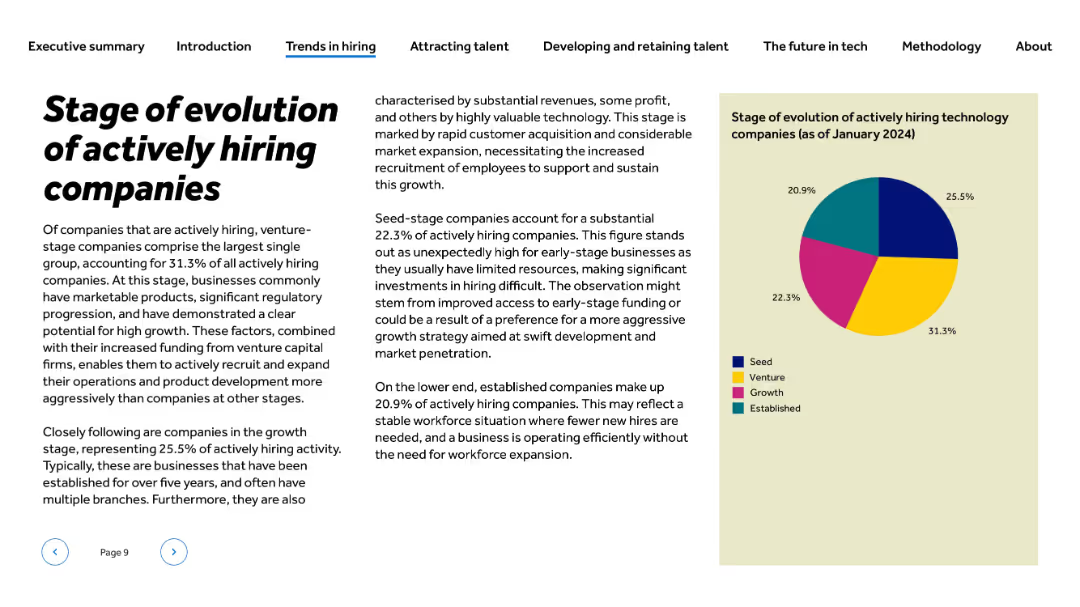
Left-aligned text; pie chart on right on beige background with color-coded legend for business stages
Strategic Planning
Technology & Software
The slide categorizes actively hiring tech firms by their growth stage. Venture-stage companies represent the largest share at 31.3%, followed by growth (25.5%), seed (22.3%), and established (20.9%). The content explains why venture-stage companies lead and notes the implications of early-stage firms actively recruiting despite resource limitations.
venture-stage, startup, seed, established companies, hiring stages, tech company evolution, recruitment phase, market penetration
false
Strategic Planning
Technology & Software
Mixed Chart
Barclays
Add to my slides
Remove from favorites
Bar graphs with trend lines show the deal value and number of deals in the technology venture investing market by region from 2011 to 2017, with color differentiation for regions.
Market Analysis and Trends
Technology & Software
Analyzing global technology venture investing, this slide compares regional deal values and numbers, highlighting the continued growth against a backdrop of contracting deal numbers. It is useful for regional market analysis.
Venture, Technology, Global, Region, Market Analysis
false
Market Analysis and Trends
Technology & Software
Multiple Chart
Oliver Wyman
Add to my slides
Remove from favorites
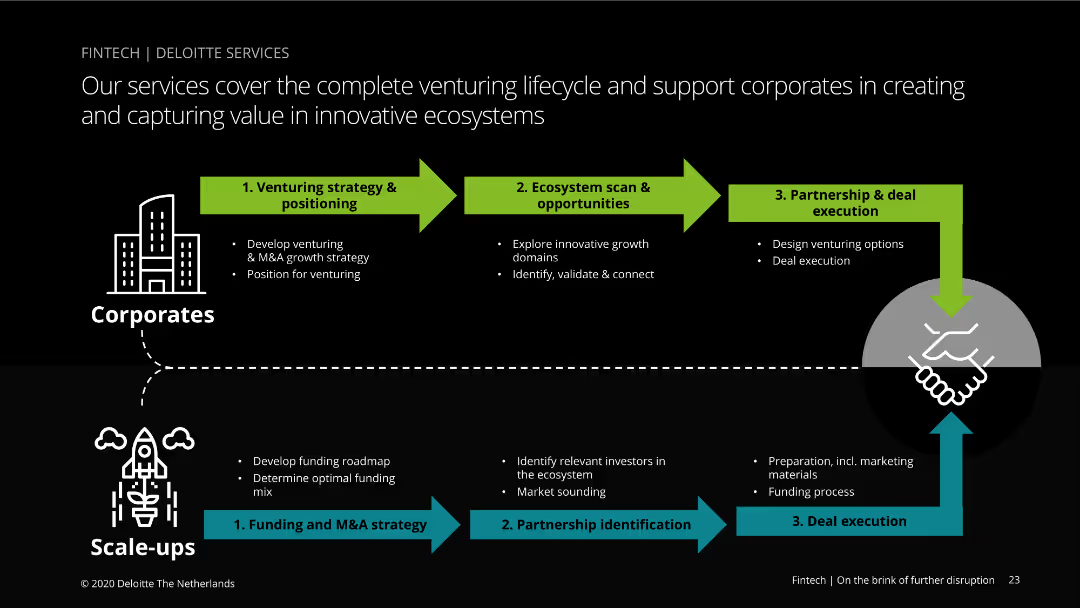
The slide contains a flow diagram showing different phases of venturing lifecycle support provided by Deloitte. The visual is clear with icons representing corporates and scale-ups, arrows indicating progression, and key activities listed.
Strategic Planning
Professional Services
Describes Deloitte's services in the venturing lifecycle, from strategy and positioning to partnership and deal execution. The slide is useful for understanding how Deloitte assists companies in creating and capturing value in ecosystems.
Venturing, lifecycle, Deloitte, services, strategy, execution
false
Strategic Planning
Professional Services
Linear Flow
Deloitte
Add to my slides
Remove from favorites
The slide features a half-doughnut chart and a stepwise strategy block. The chart shows current and target records in terms of millions.
Strategic Planning
Financial Services
The slide presents a strategic plan for increasing record counts accessible for verification services, highlighting current standings, short-term and mid-term goals, and strategies to expand the client base and partnerships.
verification, records, strategy, growth, payroll
false
Strategic Planning
Financial Services
Mixed Chart
Barclays
Add to my slides
Remove from favorites
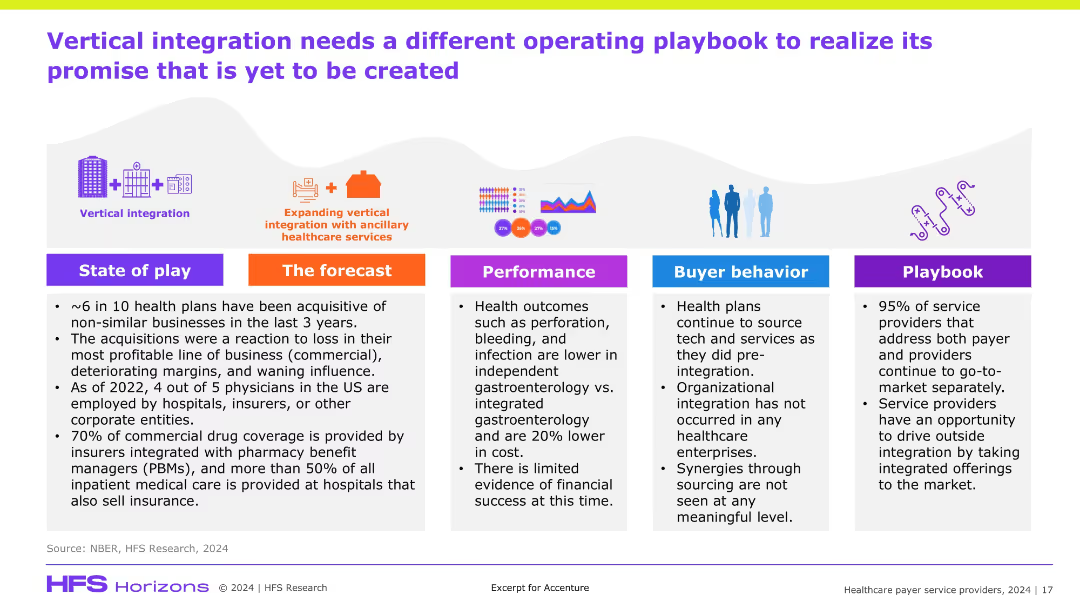
Horizontal layout with five color-coded columns (State of play, Forecast, Performance, Buyer behavior, Playbook), icons and infographics on top, light background, bold color headers.
Strategic Planning
Healthcare & Pharmaceuticals
The slide critiques the ineffectiveness of current vertical integration strategies in healthcare, stating that financial performance hasn't improved and buyer behavior hasn't changed. It highlights the need for a new operating model and playbook, as most service providers still market separately to payers and providers.
vertical integration, healthcare strategy, service providers, playbook, acquisitions
false
Strategic Planning
Healthcare & Pharmaceuticals
Pillar
Accenture
Add to my slides
Remove from favorites
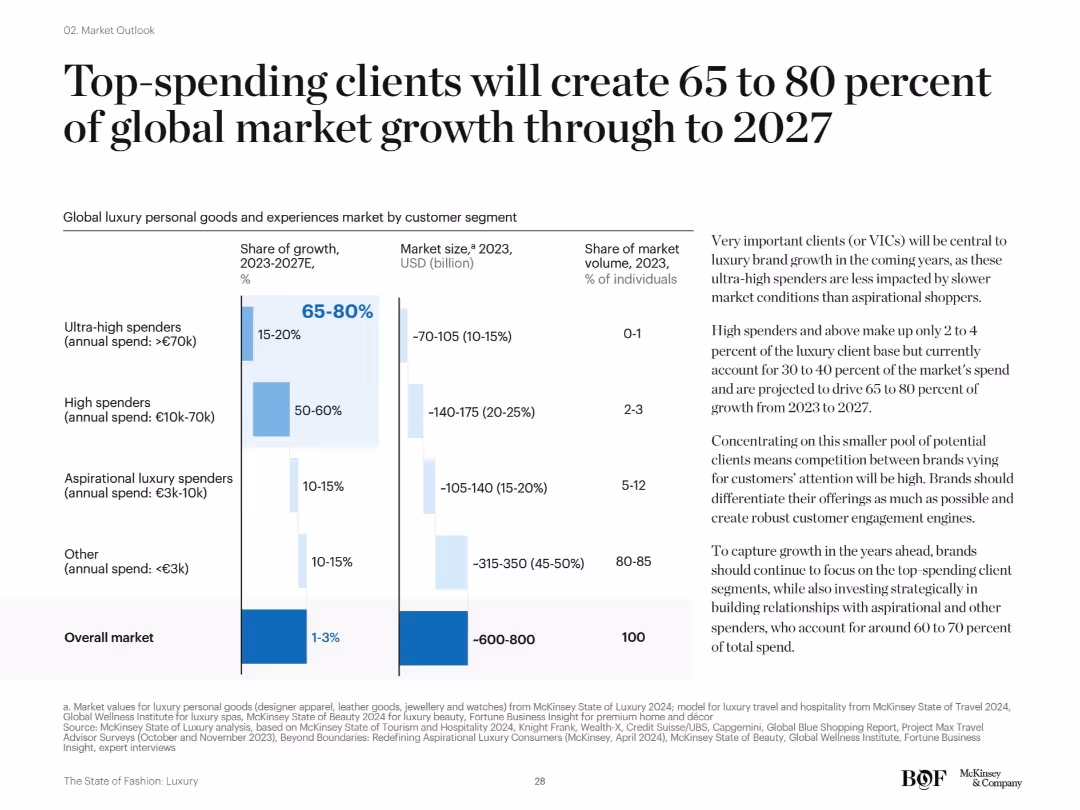
Split layout: bar chart on the left shows market segmentation by spend level and growth share; text on the right provides contextual analysis. Clean design with blue bars and categories clearly separated by spend tiers.
Customer and Market Segmentation
Consumer Goods
The slide highlights that ultra-high and high spenders will drive 65–80% of luxury market growth by 2027, despite representing a small share of consumers. Emphasis is placed on targeting these valuable segments for strategic growth.
VICs, high spenders, market segmentation, luxury growth, forecast 2027, consumer behavior, market share
false
Customer and Market Segmentation
Consumer Goods
Mixed Chart
McKinsey
Add to my slides
Remove from favorites
The slide features comparative data from 2021 to 2022 showcasing the shift in online activities with an emphasis on video consumption. A bar graph and a circular graph highlight the increase in screen time dedicated to video. There's an image of an individual using a smartphone, symbolizing content engagement. The design is modern with a clear, legible font and contrasting colors.
Market Analysis and Trends
Media & Entertainment
This slide highlights the growing importance of video in digital consumer engagement, emphasizing the shift towards video consumption over other online activities in Southeast Asia. It's a valuable tool for discussions about media trends, consumer behavior, and strategic planning for content delivery in the evolving digital landscape.
Video Consumption, Southeast Asia, Media Trends, Consumer Behavior, Digital Engagement, Online Activities, Screen Time, Strategic Planning, Content Delivery, Market Research
false
Market Analysis and Trends
Media & Entertainment
Boxed
Bain
Add to my slides
Remove from favorites
A horizontal bar chart showing the percentage of titles distributed among various linear and OTT services as of February 2022, alongside a key statistic of 817K unique program titles.
Product and Service Analysis
Media & Entertainment
The slide provides an overview of the distribution of video content titles across different services, emphasizing the growth in content availability.
video, content, titles, services, distribution
false
Product and Service Analysis
Media & Entertainment
Mixed Chart
Nielsen
Add to my slides
Remove from favorites
Column chart with bars in different colors representing various types of video game revenue from 2014 to 2023.
Market Analysis and Trends
Media & Entertainment
This slide presents the growth of the global video game industry, with projections showing significant revenue increases driven by various gaming segments.
video game industry, revenue growth, global market, 2019-2023
false
Market Analysis and Trends
Media & Entertainment
Single Chart
PwC/Strategy&
Add to my slides
Remove from favorites
Features a combination of a column chart and a line graph. The bar chart details the revenue from video games in Hong Kong from 2021 to 2025, while the line graph shows the per capita revenue growth over the same period. Both are color-coded for clarity. Additional textual information includes comparisons with global per capita revenues and positions Hong Kong among the top regions worldwide in per capita spending.
Market Analysis and Trends
Media & Entertainment
Discusses the increasing per capita spending on video games and eSports in Hong Kong, placing it within a global context. The slide provides data on revenue growth and highlights Hong Kong as a significant player in the video games market, particularly in comparison to Mainland China and other regions known for high per capita spending on gaming.
video games, eSports, revenue growth, per capita, Hong Kong, global comparison, bar chart, line graph
false
Market Analysis and Trends
Media & Entertainment
Multiple Chart
PwC/Strategy&
Add to my slides
Remove from favorites
This slide presents a column chart plotting the revenue growth of video games in Hong Kong from 2016 to 2025 alongside a pie chart displaying the global revenue shares from the US, Mainland China, and Japan in 2020. The bar chart uses alternating colors to depict yearly changes, and the pie chart uses different shades to represent each region's contribution to the market.
Market Analysis and Trends
Media & Entertainment
Examines the growth trajectory of the video games market in Hong Kong, forecasting strong revenue increases by 2025. The slide compares Hong Kong's market to global revenue distributions, highlighting significant contributions from major regions such as the US, Mainland China, and Japan. It provides insights into market dynamics and potential investment or marketing strategies within the gaming industry.
video games, market growth, Hong Kong, global, revenue, bar chart, pie chart
false
Market Analysis and Trends
Media & Entertainment
Multiple Chart
PwC/Strategy&
Add to my slides
Remove from favorites
This slide features multiple vertical column charts comparing traditional and social/casual gaming revenue growth in Mainland China, the US, and globally from 2020 to 2025. The slide layout is dense with data and includes red and grey bars representing different gaming types within each geographical focus.
Market Analysis and Trends
Media & Entertainment
The slide analyzes video gaming revenue trends from 2020 to 2025, highlighting the growth in different gaming types (traditional vs. social/casual) across Mainland China, the US, and globally. It predicts significant revenue growth in the gaming industry, emphasizing the dominant market positions of China and the US.
video games, revenue growth, traditional gaming, social gaming, market analysis
false
Market Analysis and Trends
Media & Entertainment
Multiple Chart
PwC/Strategy&
Add to my slides
Remove from favorites
Line graphs showing search trends for video streaming services, by country, with annotations indicating multipliers compared to baseline levels.
Market Analysis and Trends
Technology & Software
Highlights the growing consumer interest in video streaming services across different countries. Essential for media companies to track changes in market interest and strategize for content delivery and platform engagement.
Video streaming, Search trends, Consumer interest, Market analysis, Technology
false
Market Analysis and Trends
Technology & Software
Multiple Chart
Bain
Add to my slides
Remove from favorites
This slide features a collection of line graphs for various countries, showing search volumes for video subscription services indexed to 2017. The clean layout with labeled graphs illustrates the trends over time, and fold increases are highlighted to indicate the growth in consumer interest.
Market Analysis and Trends
Media & Entertainment
Focusing on the video streaming market, the slide showcases a consistent rise in consumer interest across different countries as indicated by search volume data, emphasizing the strong and continuing appeal of video subscription services and their importance in the media and entertainment landscape.
video subscription, consumer interest, search volumes, growth trend, media industry, streaming services, market analysis, index data
false
Market Analysis and Trends
Media & Entertainment
Multiple Chart
Bain
Add to my slides
Remove from favorites
The slide features three horizontal bar charts, each depicting user responses to potential changes in video subscription services if account sharing was banned. The bars are color-coded to show levels of agreement ranging from 'Definitely would' to 'Definitely would not'.
Market Analysis and Trends
Media & Entertainment
This slide explores consumer behavior if video account sharing is banned, analyzing willingness to accept ads, pay extra, or take new accounts.
video subscriptions, consumer behavior, account sharing, AVOD, survey results, market analysis, advertising acceptance
false
Market Analysis and Trends
Media & Entertainment
Mixed Chart
Deloitte
Add to my slides
Remove from favorites
A column chart showing the most preferred device for video streaming across different age groups, with devices color-coded and arranged vertically.
Market Analysis and Trends
Media & Entertainment
The slide indicates that smart TVs are the most preferred devices for video viewing across all age groups, with a notable preference among older viewers.
video, viewing, devices, age groups, preferences
false
Market Analysis and Trends
Media & Entertainment
Single Chart
Nielsen
Add to my slides
Remove from favorites
The slide includes bar graphs and bullet points, contrasting SEA average with Vietnam in media usage and intent to use services like e-commerce and transport. The color scheme is blue and grey, with clear demarcation between different categories. Each bar graph is accompanied by percentage values and annotations for clarity.
Market Analysis and Trends
Technology & Software
This slide provides an in-depth look at digital consumer behavior in Vietnam, including media usage frequency and service adoption rates. It’s valuable for understanding consumer trends in the digital space, and could be used to inform strategic decisions for businesses targeting Vietnamese digital users.
Vietnam, digital consumers, media usage, e-commerce, transport, service adoption, SEA, consumer trends
false
Market Analysis and Trends
Technology & Software
Multiple Chart
Bain
Add to my slides
Remove from favorites
Contains multiple column charts, each representing different sectors of Vietnam's digital economy. It's moderately detailed with a mixture of light and dark blue bars, along with percentage labels for future projections.
Market Analysis and Trends
Technology & Software
Depicts Vietnam's digital economy and its expected growth by 2025 across various sectors like e-commerce, online travel, and transport & food. There are also expectations for economic growth influencing these projections.
Vietnam, Digital Economy, Growth, E-commerce, Online Travel, Transport, Food, Projections, 2025, Economic Expectations
false
Market Analysis and Trends
Technology & Software
Multiple Chart
Bain
Add to my slides
Remove from favorites
Consists of blue column charts for different sectors of digital financial services (DFS), including digital payments and lending. Each chart has clear labels and growth percentages. Source by Bain analysis.
Market Analysis and Trends
Financial Services
This slide details the rapid growth trajectory of Vietnam's DFS against a previously low baseline, highlighting potential areas for digital innovation and investment in the financial sector.
Vietnam, Digital Financial Services, Growth Analysis, Digital Payments, Digital Lending, Insurance, Wealth, Market Trends, Innovation, Financial Technology
false
Market Analysis and Trends
Financial Services
Multiple Chart
Bain
Add to my slides
Remove from favorites
This slide features multiple bar graphs comparing digital platforms, financial services, and tools. A side note provides statistics on digital platform reliance, with a vibrant color scheme and clear text.
Market Analysis and Trends
Technology & Software
The slide analyzes the increasing tech-savviness of digital merchants in Vietnam and their expected future reliance on digital platforms and tools. It highlights the critical role of digital platforms during the pandemic.
Vietnam, Digital Merchants, Tech-Savvy, Future, Digital Platforms, Financial Services, Tools, Pandemic, Survival, Growth
false
Market Analysis and Trends
Technology & Software
Multiple Chart
Bain
Add to my slides
Remove from favorites
Two maps of Vietnam, one highlighting e-commerce demand and the other supply density, with green and blue shading. Each map points to Hanoi, Danang, and HCM City. Source information includes Google and Bain Analysis.
Market Analysis and Trends
Technology & Software
Analyzes digital participation across Vietnam's top metro cities, showing demand and supply dynamics in e-commerce, beneficial for regional market strategies and investment considerations.
Vietnam, Digital Participation, E-Commerce Demand, Supply Density, Metro Cities, Market Analysis, Geographic Trends, Consumer Behavior, Investment Insights
false
Market Analysis and Trends
Technology & Software
Multiple Chart
Bain
Add to my slides
Remove from favorites
This slide presents column charts comparing growth in e-Commerce, Transport & Food, and Online Media sectors, with annotations indicating percentage changes and future projections. Layout is balanced with clear headers.
Market Analysis and Trends
Technology & Software
The slide provides a comparative analysis of sector growth in Vietnam, with e-Commerce, Transport & Food, and Online Media seeing growth, while Online Travel decreases. Projected growth rates up to 2025 are also displayed.
Vietnam, e-Commerce, Growth, Projections, Sector Analysis
false
Market Analysis and Trends
Technology & Software
Multiple Chart
Bain
Add to my slides
Remove from favorites
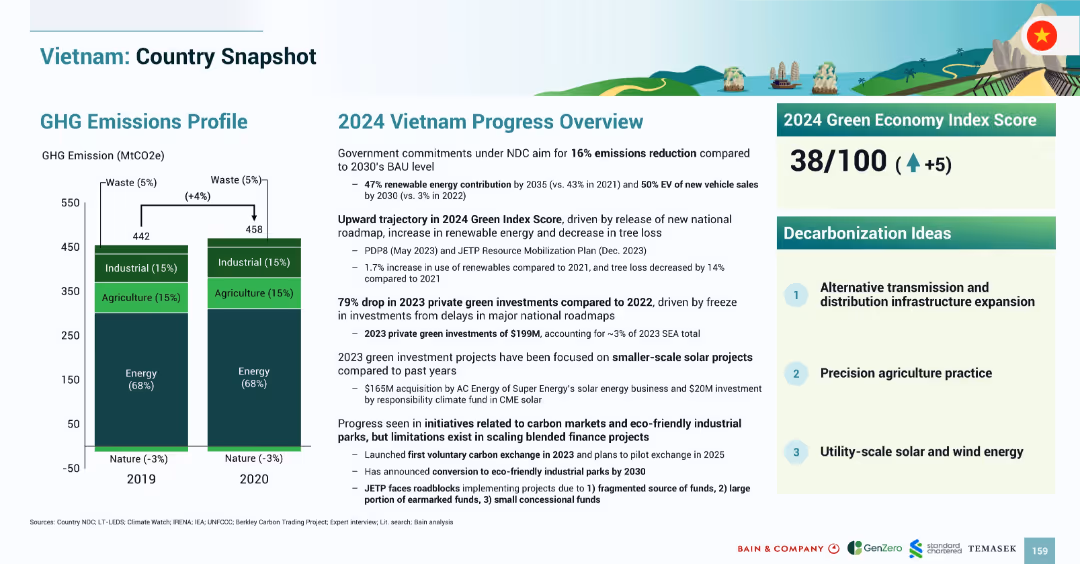
Multi-column layout: emissions chart (left), progress overview (center), green economy index and investment ideas (right); colorful and visual-heavy.
Industry Overview
Government & Public Sector
Presents a snapshot of Vietnam’s GHG emissions by sector, government progress on climate goals, and a moderate improvement in the Green Economy Index. Highlights investment projects and challenges in private funding and renewable project execution.
Vietnam, emissions, energy, investment, green index, decarbonization, agriculture, solar, carbon market
false
Industry Overview
Government & Public Sector
Mixed Chart
Bain
Add to my slides
Remove from favorites
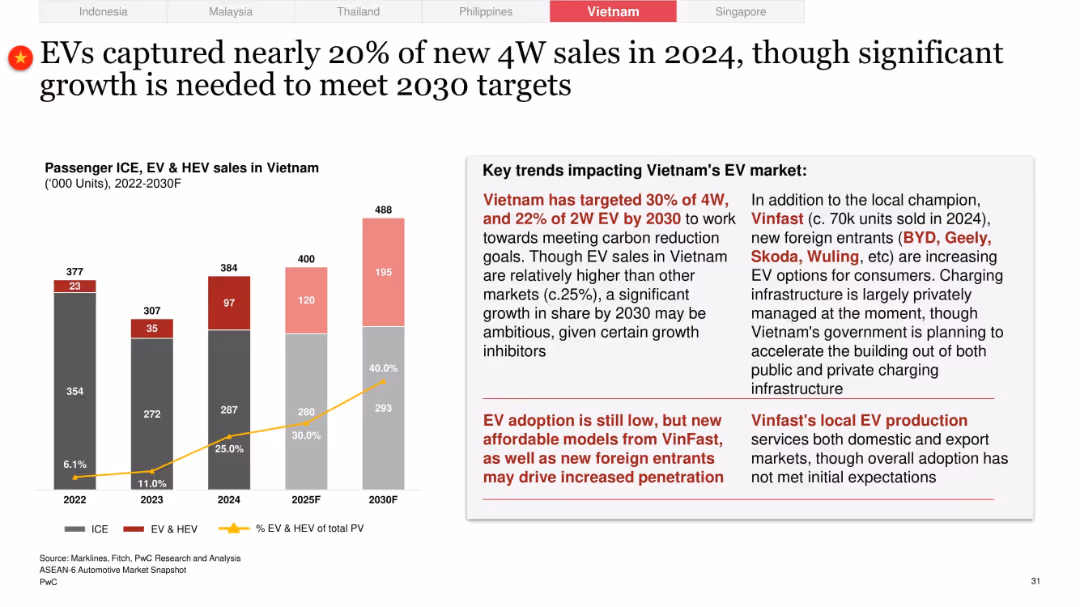
EV/ICE bar and line graph dominates left; right section has red-highlighted EV market commentary and stats
Technology and Digital Transformation
Industrial & Manufacturing
Vietnam's EV share hit ~20% in 2024 with a goal of 30% by 2030. The slide credits VinFast and foreign OEMs like BYD and Geely, but notes infrastructure and cost challenges. Adoption remains below expectations despite policy and private sector support.
Vietnam, EV market, VinFast, BYD, Skoda, infrastructure, foreign entrants, 30% target, 4W vs 2W EVs
false
Technology and Digital Transformation
Industrial & Manufacturing
Mixed Chart
PwC/Strategy&
Add to my slides
Remove from favorites
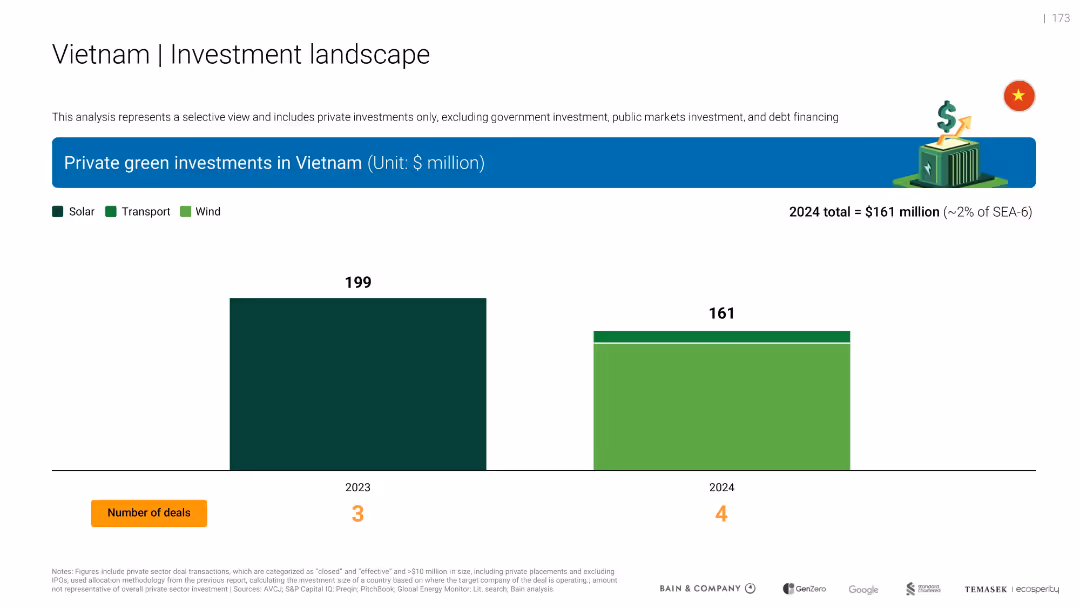
Bar chart comparing private green investments in Vietnam for 2023 and 2024, categorized by Solar, Transport, and Wind. Includes number of deals and icons.
Investment Analysis
Environmental Services & Sustainability
This slide visualizes private green investments in Vietnam, showing a decrease from $199M in 2023 to $161M in 2024. It segments investments into solar, transport, and wind, and notes 4 deals in 2024 versus 3 in 2023.
Vietnam, green investments, solar, transport, wind, 2024, deals, chart
false
Investment Analysis
Environmental Services & Sustainability
Single Chart
Bain
Add to my slides
Remove from favorites
This slide includes comparative data in blue bar charts and two columns with demographics and geographical segmentation. It provides a contrast in online spending between HVUs and non-HVUs in Vietnam. Source includes Bain analysis.
Market Analysis and Trends
Technology & Software
The slide compares online spending habits of high-value users (HVUs) to non-HVUs in Vietnam, useful for understanding consumer segmentation and targeting strategies in the digital economy.
Vietnam, High-Value Users, Consumer Spending, Digital Economy, Online Spend, Demographic Analysis, Geographic Segmentation, Market Research, Spending Habits
false
Market Analysis and Trends
Technology & Software
Multiple Chart
Bain
Add to my slides
Remove from favorites
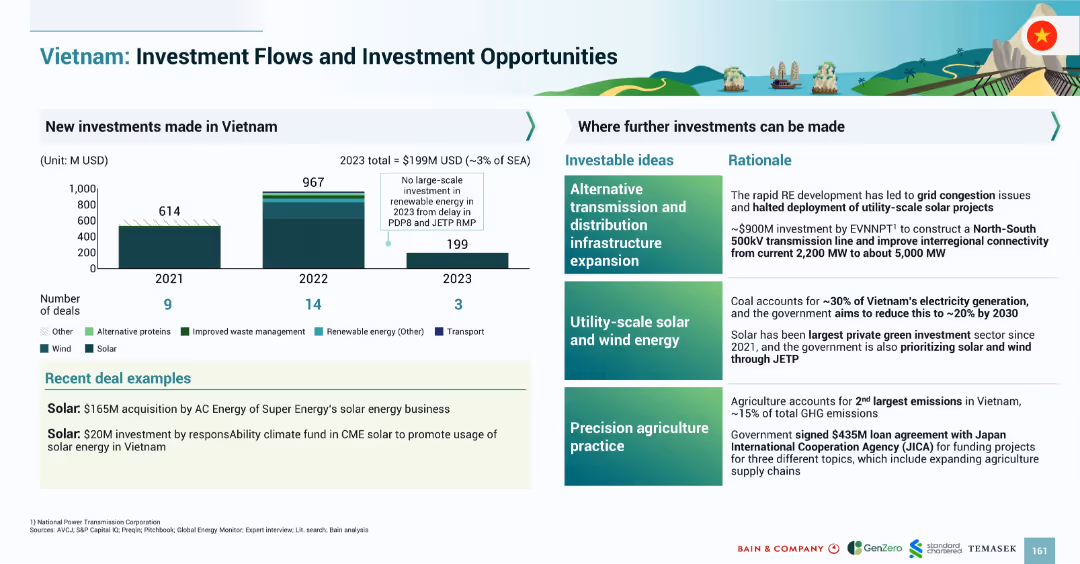
Split layout: investment bar chart (left) for 2021–2023; right side shows investment ideas and rationale; structured infographic style.
Investment Analysis
Environmental Services & Sustainability
Outlines private investments in Vietnam’s energy and sustainability sectors (2021–2023), with sharp drop in 2023. Provides rationale for future investment in grid upgrades, renewables, and agriculture. Highlights two recent solar-focused deals.
Vietnam, investment, energy, solar, wind, infrastructure, agriculture, renewable projects
false
Investment Analysis
Environmental Services & Sustainability
Mixed Chart
Bain
Add to my slides
Remove from favorites
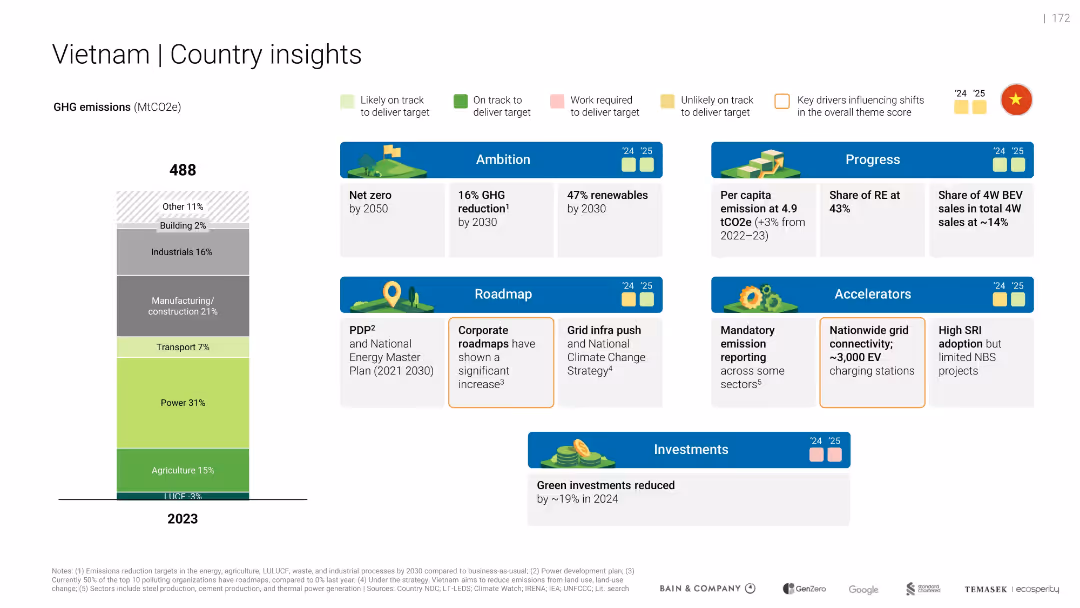
Emissions bar by sector for 2023, and segmented boxes for ambition, roadmap, progress, accelerators, and investments with icons and color-coded indicators.
Strategic Planning
Government & Public Sector
Details Vietnam’s emissions sources and outlines 2030 and 2050 green goals. Emphasizes RE targets, national strategies, and infrastructure plans. Indicates a ~19% decline in green investment for 2024.
Vietnam, net zero, RE, roadmap, grid infra, investment drop
false
Strategic Planning
Government & Public Sector
Mixed Chart
Bain
Add to my slides
Remove from favorites
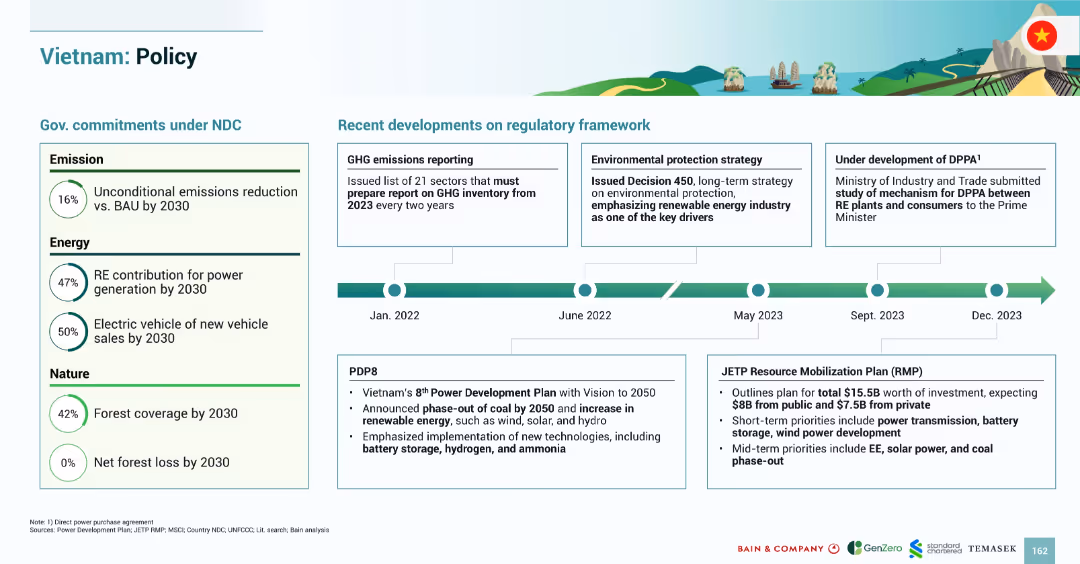
Two-part layout: government NDC commitments on the left, regulatory framework timeline (2022–2023) on the right; clean and structured.
Regulatory and Compliance
Government & Public Sector
Covers Vietnam’s emission, energy, and nature-related climate goals under NDCs, and outlines the policy progress including GHG reporting, power development plans (PDP8), and the $15.5B Just Energy Transition Partnership (JETP) Resource Mobilization Plan.
Vietnam, policy, PDP8, JETP, emissions, forest, EV, renewables, GHG inventory
false
Regulatory and Compliance
Government & Public Sector
Mixed Chart
Bain
Add to my slides
Remove from favorites
This slide displays a stacked column chart with annotations for half-yearly data points from 2019 to H1 2023. It uses grayscale for different sectors with a clear legend. Deal count numbers are presented at the bottom.
Investment Analysis
Financial Services
Shows private funding trends in Vietnam for different sectors, indicating a small increase in H1 2023. It suggests a focus on nascent sectors, hinting at emerging investment areas.
Vietnam, Private Funding, H1 2023, Investment Trends, Nascent Sectors, Deal Count, Travel, Digital Media, E-commerce
false
Investment Analysis
Financial Services
Single Chart
Bain
Add to my slides
Remove from favorites
Includes a complex layout with a column chart, text annotations, icons indicating outlook, and a detailed breakdown of governmental commitments and recommended actions.
Regulatory and Compliance
Energy & Utilities
Examines Vietnam's climate goals and strategies, discussing emissions profiles, government commitments, and suggested actions for clearer energy policies.
Vietnam, renewable energy, government, emissions, climate policy
false
Regulatory and Compliance
Energy & Utilities
Mixed Chart
Bain
Add to my slides
Remove from favorites
Features a mekko chart analyzing investment flows by theme in Vietnam, alongside icons and smaller charts detailing types of investments and key investors.
Investment Analysis
Energy & Utilities
Discusses Vietnam's investment trends in solar and wind energy, with a focus on government support and mobility projects.
Vietnam, solar, wind, government support, investments
false
Investment Analysis
Energy & Utilities
Single Chart
Bain
Add to my slides
Remove from favorites
Previous
Next
You don't have any favorites yet.
Please wait loading your favorites slides...
Create a FREE account to continue browsing
Receive Instant Access to 1,000+ slides from companies like McKinsey, Google, and Goldman Sachs
First Name
Last Name
Email
Password
I agree to all
Terms & Privacy Policy
Thank you! Your submission has been received!
Oops! Something went wrong while submitting the form.
Have an account?
Sign in
Upgrade to PRO to Save slides
Advanced Search and Filters
Access to 15,000+ slides
Access to Category Pages
Save/Bookmark Slides
PowerPoint Template Library
Pick a Plan
MONTHLY
$12/month
Billed every month, Cancel anytime.
YEARLY
$9/year
Billed $108 annually, Cancel anytime.
Checkout for $12/month
Checkout for $108/yr
Secured by Stripe | AES-256 bit encryption