My Account
My Slides
Search by Category
Pricing
Templates
View All Templates
Download Template Slides
✦ AI Search
Feedback
Login
Logout
Get Started
Browse all Slides
Browse all Slides
Create a FREE Account
Instant access to 1,000+ real slides from top companies like McKinsey, BCG, Goldman Sachs, Google and many more!
First Name
Last Name
Email
Password
I agree to all
Terms & Privacy Policy
Thank you! Your submission has been received!
Oops! Something went wrong while submitting the form.
Have an account?
Sign in
Saved Slides
Total No. of slides saved
0
↻ Refresh
✖ Clear all
Multiple tables and column charts showing revenues, profit before tax, and cost/income ratio across different periods.
Financial Performance
Financial Services
Details total revenues, net interest income, recurring fees, transaction income, and profit before tax for Q3 2022.
Wealth management, revenue, profit, cost/income ratio, UBS, financial performance, 3Q22, net interest income
false
Financial Performance
Financial Services
Multiple Chart
UBS
Add to my slides
Remove from favorites
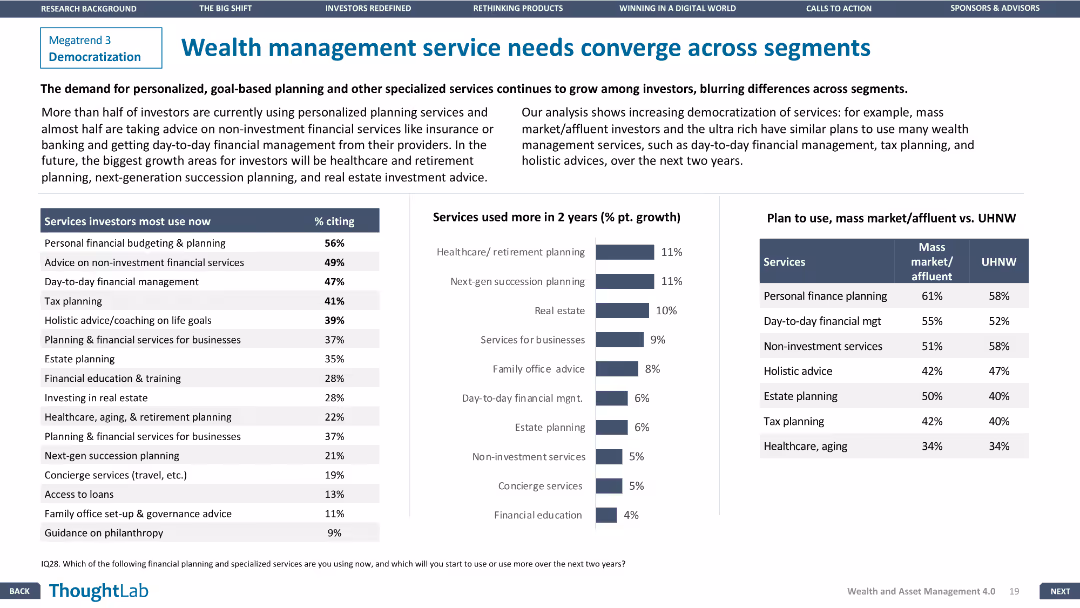
The slide features a column chart of services investors use now vs. in 2 years and a comparison table for mass market vs. UHNW plans.
Customer and Market Segmentation
Financial Services
The slide explores the convergence of wealth management services across different investor segments, highlighting growing demands for personalized services.
Wealth management, Service convergence, Financial Services, Segmentation, Personalized services
false
Customer and Market Segmentation
Financial Services
Mixed Chart
Deloitte
Add to my slides
Remove from favorites
The slide displays three sets of column charts showing changes in fee-based assets, loans, and deposits over time. Two shades of blue are used to differentiate between 2015 and 1Q’21 figures, with percentages indicating growth. Each set has two columns representing different business sectors. Annotations highlight rankings and industry positions.
Financial Performance
Financial Services
This slide shows the strategic growth of a wealth management business with a focus on fee-based assets, loans, and deposits. It emphasizes the company's industry-leading positions and substantial growth percentages over six years, suggesting a solid market presence and financial health.
Wealth management, strategic growth, fee-based assets, loans, deposits, industry ranking, financial health, market presence, business growth, performance analysis
false
Financial Performance
Financial Services
Multiple Chart
Morgan Stanley
Add to my slides
Remove from favorites
Contains icons and short text sections outlining strategies for future readiness.
Strategic Planning
Financial Services
Details five critical strategies for wealth management firms to stay competitive in the digital era.
wealth management, strategies, future readiness, competitive, financial services
false
Strategic Planning
Financial Services
Linear Flow
Deloitte
Add to my slides
Remove from favorites
Diagram and text layout showing partnerships and acquisitions.
Strategic Planning
Financial Services
Outlines how recent acquisitions will influence U.S. wealth management, detailing cross-asset class tax-loss harvesting and comprehensive workplace solutions.
Wealth Management, Tax-Loss, Acquisition
false
Strategic Planning
Financial Services
Diagram
JP Morgan
Add to my slides
Remove from favorites
Combines U.S. map, column chart, and bullet points to discuss growth strategies in wealth management.
Sales and Business Development
Financial Services
Details JPMorgan's approach to capturing U.S. wealth management market potential, highlighting growth from digital solutions and advisors.
Wealth management, US market, growth opportunity, digital solutions, client advisors, market capture
false
Sales and Business Development
Financial Services
Mixed Chart
JP Morgan
Add to my slides
Remove from favorites
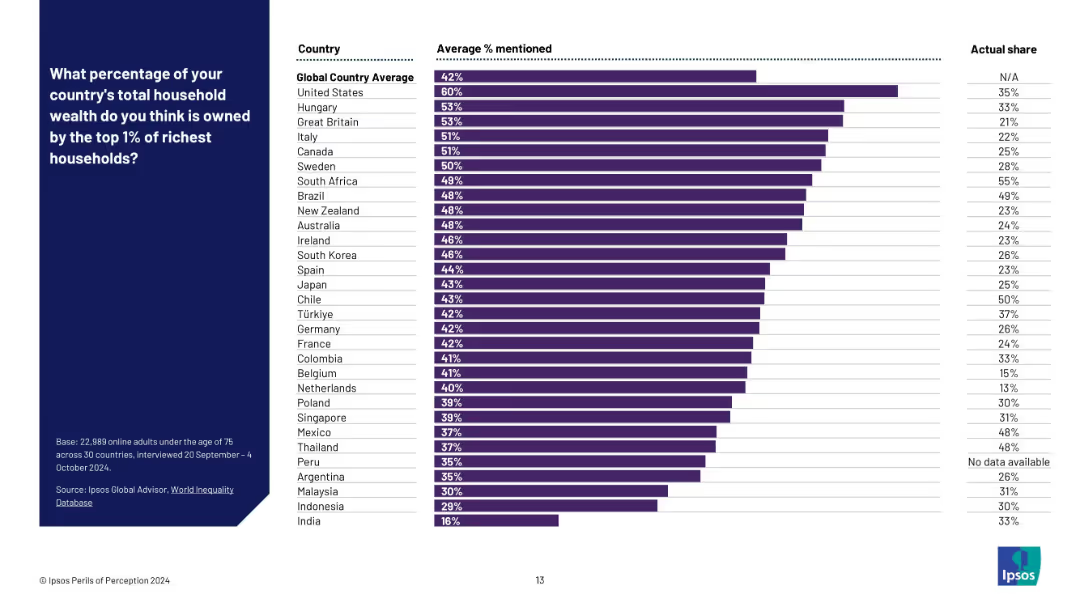
Bar chart with three columns: country, average % mentioned, and actual share; purple bars represent perceived values.
Market Analysis and Trends
Professional Services
This slide compares perceived versus actual estimates of wealth concentration among the top 1% richest households in various countries. It highlights a global trend of overestimating inequality, with perception gaps illustrated via a side-by-side format.
wealth perception, inequality, global survey, household wealth, top 1%, Ipsos, country comparison, data visualization, perception vs reality, public opinion
false
Market Analysis and Trends
Professional Services
Mixed Chart
IPSOS
Add to my slides
Remove from favorites
A slide with mobile UI mockups, a laptop image, and iconography. It's visually dense with a mix of screenshots and text descriptions, adhering to a corporate blue color scheme.
Technology and Digital Transformation
Financial Services
Describes a new platform for managing finances with tools for a consolidated view, personalized planning, and advisor collaboration. This slide is used to present an upcoming digital tool, illustrating its features like consolidation, personalization, and real-time integration for wealth management.
Wealth planning, Digital tool, Personalization, Integration, Finances
false
Technology and Digital Transformation
Financial Services
Graphic
JP Morgan
Add to my slides
Remove from favorites
Four column charts comparing survey findings in wealth & regulation, digital transformation, risk & reputation, and strategy & governance.
Market Analysis and Trends
Financial Services
Highlights key survey findings in four areas: regulatory concerns, digital transformation urgency, risk management issues, and strategy & governance priorities.
wealth, regulation, digital transformation, risk management, strategy, governance
false
Market Analysis and Trends
Financial Services
Multiple Chart
EY
Add to my slides
Remove from favorites
A bar extends across the slide, segmented into various client categories with associated market sizes and wealth management share, presented in a clear, hierarchical manner. The design is simple with a blue color scheme.
Financial Performance
Financial Services
Details the firm's market approach for different client segments across the wealth spectrum, from ultra-high net worth to mass affluent, indicating potential for market expansion.
Wealth Spectrum, Client Segmentation, Market Share
false
Financial Performance
Financial Services
Table
Goldman Sachs
Add to my slides
Remove from favorites
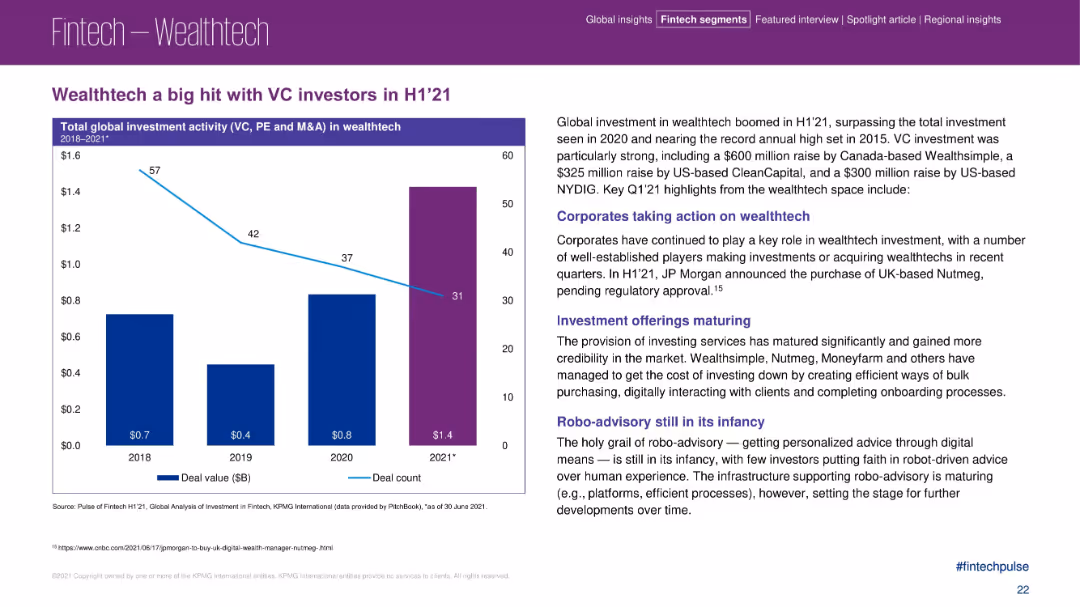
Left-aligned bar and line combo chart with deal value bars and deal count line; right section includes text blocks with bolded headings
Investment Analysis
Financial Services
The slide illustrates a sharp increase in wealthtech investments in H1 2021, reaching $1.4B, outpacing previous years. It highlights key VC deals and trends, including corporate acquisitions and the evolution of investment offerings. The narrative emphasizes the growth and maturing of wealthtech, while pointing out that robo-advisory is still developing.
wealthtech, VC investment, robo-advisory, JP Morgan, CleanCapital, investment trends, Nutmeg, digital onboarding, corporate acquisition
false
Investment Analysis
Financial Services
Mixed Chart
KPMG
Add to my slides
Remove from favorites
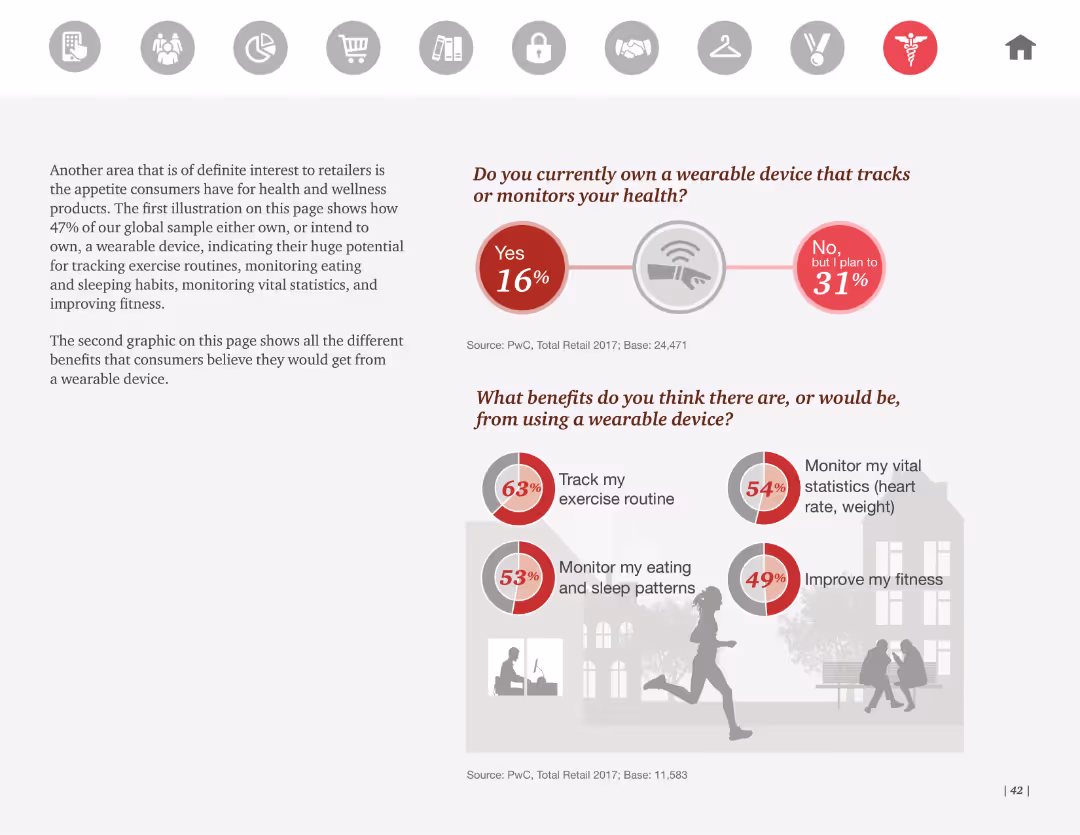
The slide features two circular graphs and supporting text about wearable health devices. It includes an illustration of a person running and a figure indicating the potential benefits of using these devices.
Market Analysis and Trends
Healthcare & Pharmaceuticals
This slide highlights that 16% of consumers currently own wearable health devices, with 31% planning to buy one. It discusses the benefits of wearables, such as tracking exercise routines, monitoring vital statistics, and improving fitness.
Wearable devices, health monitoring, consumer behavior, fitness tracking, survey
false
Market Analysis and Trends
Healthcare & Pharmaceuticals
Mixed Chart
PwC/Strategy&
Add to my slides
Remove from favorites
This slide contrasts the phases of the web: Web 1.0, Web 2.0, and Web 3.0 through text blocks and iconic representations for each stage (e.g., HTTP, Google Chrome, Ethereum logo), arranged in a clear, horizontal timeline format.
Technology and Digital Transformation
Technology & Software
Details the transitions and characteristics of Web 1.0, Web 2.0, and Web 3.0, highlighting shifts in data management and user interaction. It discusses the move from decentralized to centralized, and back to decentralized frameworks.
Web 1.0, Web 2.0, Web 3.0, decentralized, digital services
false
Technology and Digital Transformation
Technology & Software
Linear Flow
McKinsey
Add to my slides
Remove from favorites
Side-by-side comparison of Web2 and Web3, with visual elements and text to illustrate differences.
Technology and Digital Transformation
Technology & Software
Explains the transition from Web2 to Web3, including shifts in data ownership, business models, and technological infrastructure.
Web2 vs Web3, tech trend, data ownership, business model, technical infrastructure
false
Technology and Digital Transformation
Technology & Software
Boxed
McKinsey
Add to my slides
Remove from favorites
Includes examples and visuals of NFTs, digital identities, and Metaverse platforms, emphasizing their roles and applications.
Technology and Digital Transformation
Technology & Software
Highlights the emerging technologies of NFTs and Metaverse, explaining their impact on digital identity and virtual experiences.
Web 3.0, NFT, Metaverse, Digital Identity, Platforms
false
Technology and Digital Transformation
Technology & Software
Linear Flow
McKinsey
Add to my slides
Remove from favorites
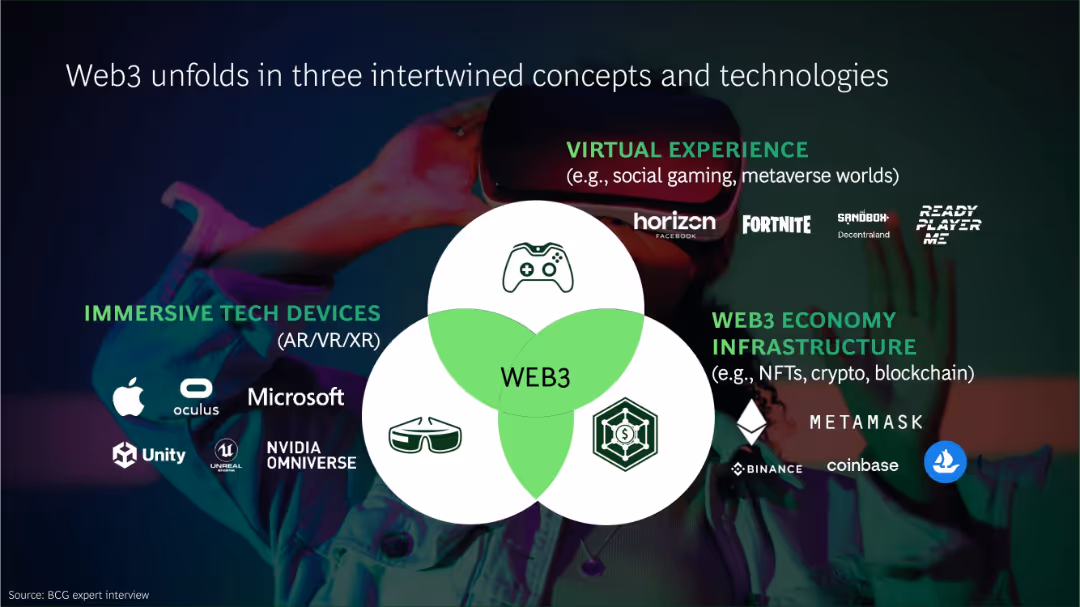
Venn diagram with three labeled segments surrounded by logos and icons of relevant platforms and companies
Technology and Digital Transformation
Technology & Software
Web3 is described as a convergence of immersive tech devices (AR/VR/XR), virtual experiences (e.g., gaming), and blockchain infrastructure. Major platforms and players like Meta, Microsoft, and Binance are highlighted. The slide emphasizes interconnected tech driving next-gen digital experiences.
Web3, blockchain, immersive tech, AR/VR, metaverse, virtual experience, NFTs, crypto
false
Technology and Digital Transformation
Technology & Software
Framework
BCG
Add to my slides
Remove from favorites
Clean layout with tiered blocks diagramming the layers of Web3 technology—Blockchain, Smart Contracts, Digital Assets, and their applications in areas like DeFi and Gaming. Colored in blue shades with icons.
Technology and Digital Transformation
Technology & Software
Explains the structure of Web3 technologies starting from basic blockchain through to various applications like gaming and insurance. Useful for explaining foundational technology and its potential applications.
Web3, blockchain, smart contracts, digital assets, applications
false
Technology and Digital Transformation
Technology & Software
Table
McKinsey
Add to my slides
Remove from favorites
This slide has a complex layout, divided into three main sections with headers and explanatory text below each section. It features two columns of text-based lists, a matrix of labeled squares, and footnotes. The design is blue and white with high contrast.
Industry Overview
Technology & Software
The slide provides an overview of significant technologies and areas of interest within Web3, including applications, technologies, and digital assets like DeFi, gaming, and the metaverse. It’s structured to educate on the foundational aspects of Web3 and how they're employed across different domains.
Web3, DeFi, Metaverse, Digital Assets, Technology
false
Industry Overview
Technology & Software
Header Vertical
McKinsey
Add to my slides
Remove from favorites
Modern building image on a blue-toned background listing topics such as blockchain fundamentals and commercial applications of Web 3 technologies.
Strategic Planning
Technology & Software
Serves as an agenda slide for a presentation on Web 3 and digital assets, outlining the scope and sequence of topics to be covered, from blockchain technology to its commercial applications.
Web 3, digital assets, blockchain, agenda, technologies
false
Strategic Planning
Technology & Software
Agenda
McKinsey
Add to my slides
Remove from favorites
Graphs and statistics showing the growth in talent and capital investment in Web3.
Market Analysis and Trends
Technology & Software
Highlights the significant growth in the number of developers and capital investment in Web3 over recent years.
Web3 growth, talent increase, capital investment, market analysis
false
Market Analysis and Trends
Technology & Software
Multiple Chart
McKinsey
Add to my slides
Remove from favorites
Slide with icons and bullet points, outlining the reasons for leadership to consider Web3 impacts.
Technology and Digital Transformation
Technology & Software
Discusses the implications of Web3 on business models, innovation, access and inclusion, and customer experience.
Web3 implications, leadership, business model disruption, innovation, inclusion
false
Technology and Digital Transformation
Technology & Software
Pillar
McKinsey
Add to my slides
Remove from favorites
Title slide introducing the Web3 section of the 2022 technology trends report.
Technology and Digital Transformation
Professional Services
Acts as the cover page for the Web3 section of the McKinsey Technology Trends Outlook 2022 report.
Web3, technology trends, 2022 outlook, digital identity
false
Technology and Digital Transformation
Professional Services
Title
McKinsey
Add to my slides
Remove from favorites
Slide displays a bar chart with blue bars, listing percentages of VC interest in Web3 areas. Accompanied by quotes on the right side against a gray backdrop. The chart is a column chart, not a bar chart.
Investment Analysis
Technology & Software
Focuses on the growing interest in Web3 sectors among VCs, showing the percentage of VCs investing in areas like privacy, DeFi, and blockchain, with expectations for the future.
Web3, venture capital, investment, privacy, DeFi, blockchain, DAOs, Metaverse, crypto, NFTs
false
Investment Analysis
Technology & Software
Single Chart
Bain
Add to my slides
Remove from favorites
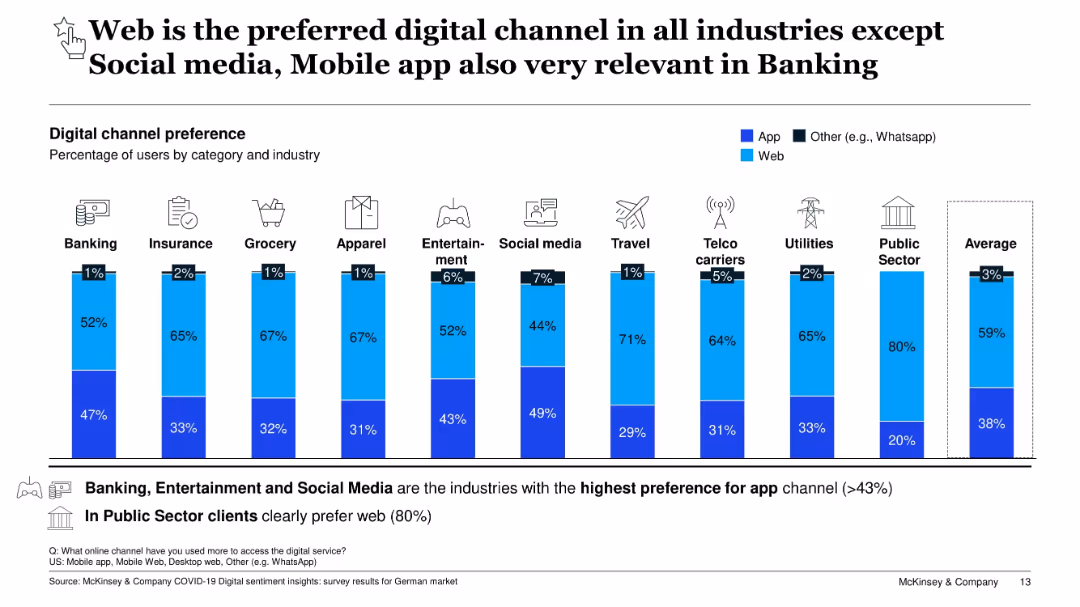
Stacked vertical bar chart showing digital channel preference (web, app, other) by industry; blue gradients
Technology and Digital Transformation
Technology & Software
The slide breaks down digital channel preferences, showing web as the top channel across most industries, except Social Media (apps preferred). Mobile apps are also significant in Banking and Entertainment. Public Sector users clearly prefer web (80%). The visualization provides clear cross-industry channel trends.
web vs app, digital preference, mobile usage, channel strategy, industry comparison, user behavior, Germany, COVID-19
false
Technology and Digital Transformation
Technology & Software
Single Chart
McKinsey
Add to my slides
Remove from favorites
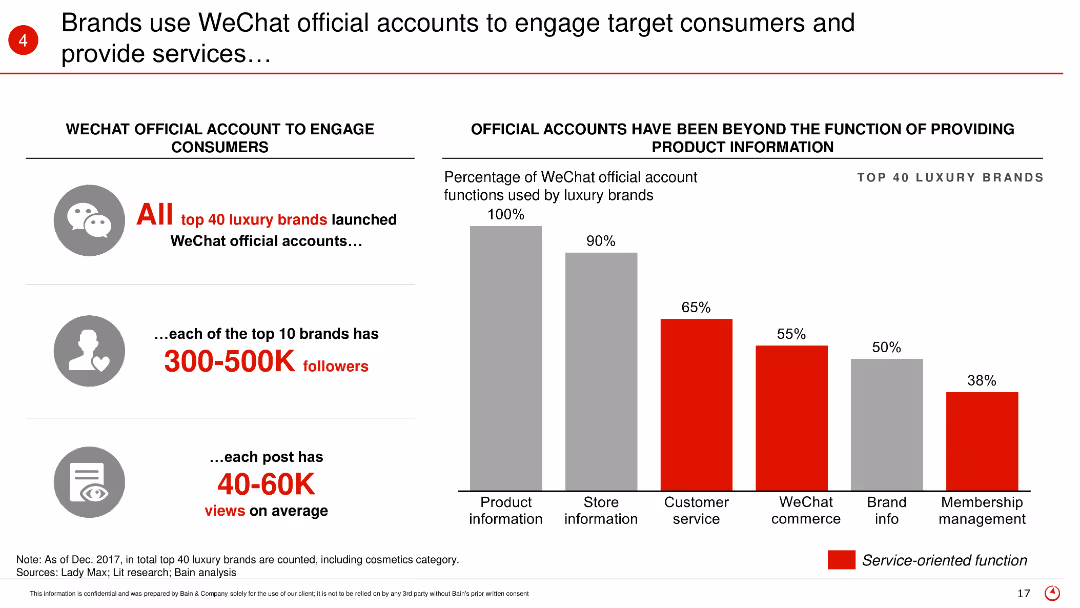
The slide features graphs showing the engagement metrics of WeChat official accounts by top luxury brands, including follower counts and post views. Additional bar charts illustrate the functions used by these accounts.
Customer and Market Segmentation
Retail & E-commerce
This slide explains how luxury brands are leveraging WeChat official accounts to engage with consumers, providing product information, customer service, and more, with substantial follower engagement metrics.
WeChat, luxury brands, consumer engagement, social media, digital strategy
false
Customer and Market Segmentation
Retail & E-commerce
Mixed Chart
Bain
Add to my slides
Remove from favorites
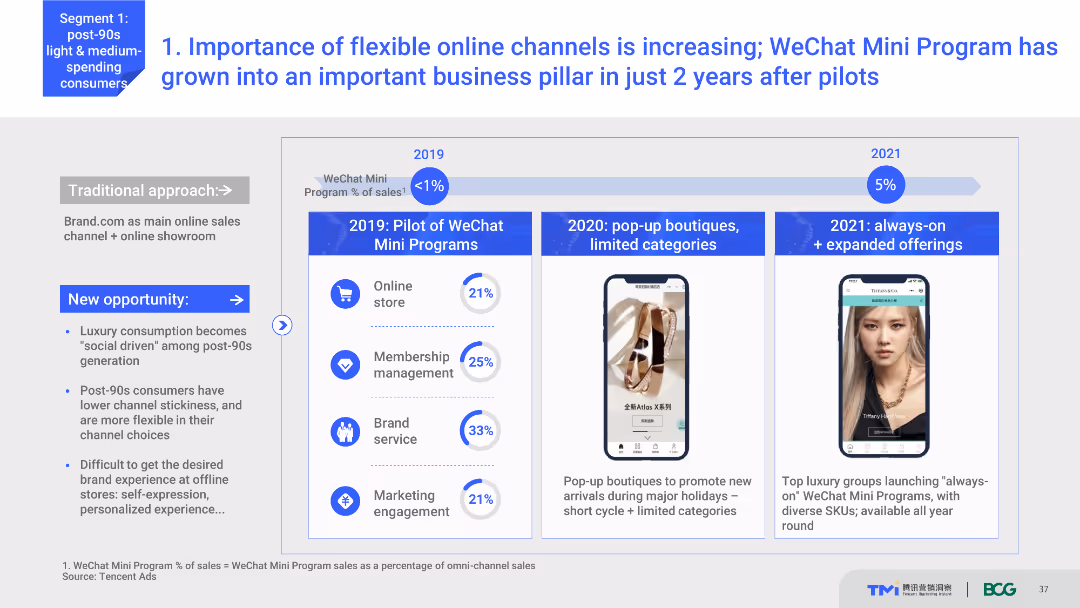
Timeline chart showing the growth of WeChat Mini Programs from 2019 to 2021. Includes key milestones like the introduction of pop-up boutiques and expanded offerings. Text explains the significance of these developments.
Technology and Digital Transformation
Retail & E-commerce
Discusses the growing importance of flexible online channels like WeChat Mini Programs for luxury brands. Shows the timeline of their implementation and growth, highlighting key milestones and their impact on business.
WeChat Mini Programs, online channels, luxury brands, digital transformation, business growth
false
Technology and Digital Transformation
Retail & E-commerce
Mixed Chart
BCG
Add to my slides
Remove from favorites
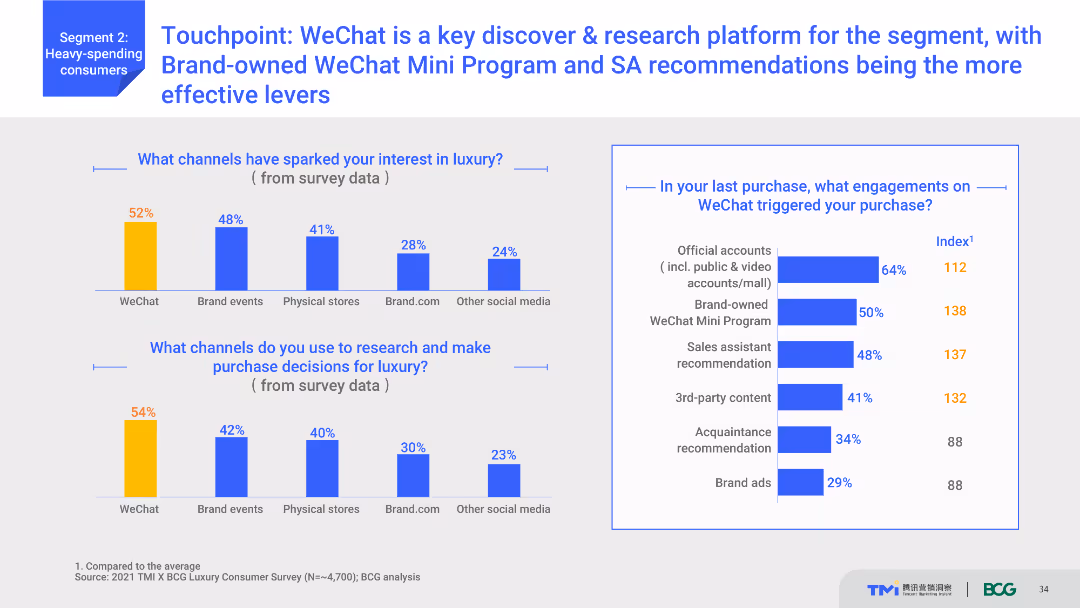
Column charts illustrating channels that spark interest in luxury and research channels, with a focus on WeChat. Additional text highlights specific engagements on WeChat that trigger purchases.
Strategic Planning
Media & Entertainment
Highlights WeChat as a crucial platform for discovery and research among luxury consumers. Shows which WeChat engagements (like Mini Programs and SA recommendations) are most effective in triggering purchases.
WeChat, social media, luxury research, consumer engagement, Mini Programs
false
Strategic Planning
Media & Entertainment
Multiple Chart
BCG
Add to my slides
Remove from favorites
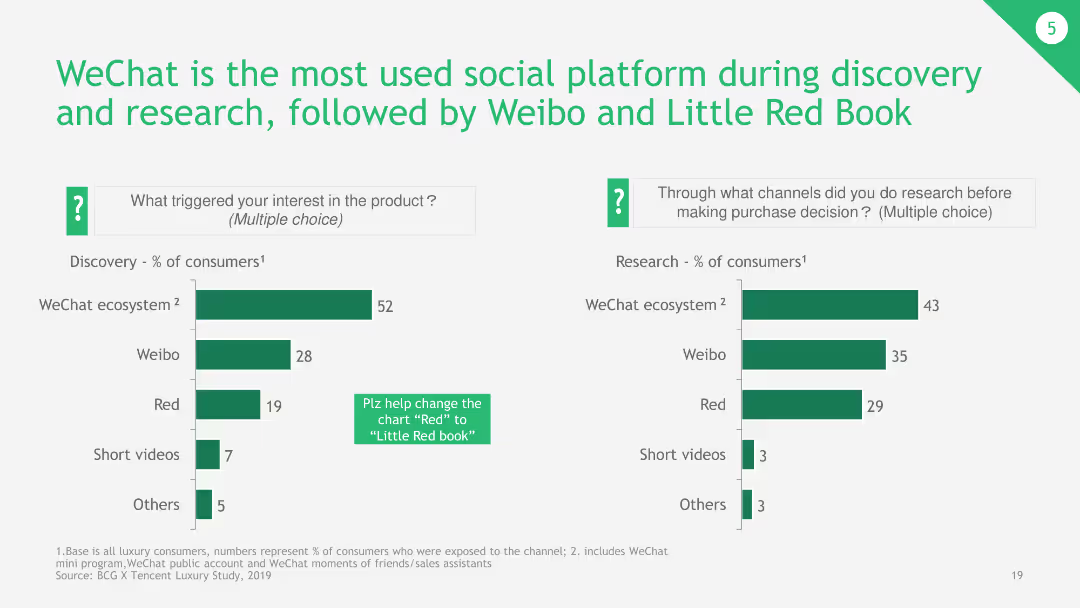
The slide contains bar charts showing percentages of consumers using various social platforms for discovery and research. It also has explanatory notes on usage.
Market Analysis and Trends
Telecommunications
The slide explains the dominance of WeChat as the primary social platform for consumer discovery and research, with comparative data on Weibo and Little Red Book, showing their respective user engagement rates.
WeChat, social platform, discovery, research, Weibo, Little Red Book
false
Market Analysis and Trends
Telecommunications
Multiple Chart
BCG
Add to my slides
Remove from favorites
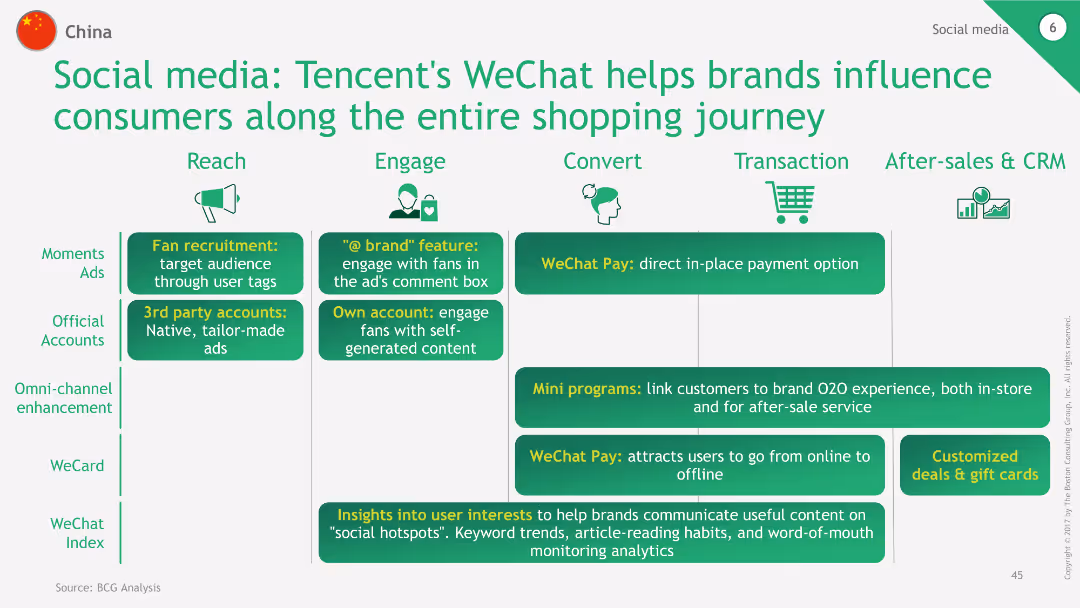
The slide features a process flow diagram illustrating how Tencent's WeChat influences the entire shopping journey from Reach, Engage, Convert, Transaction, to After-sales & CRM. Each stage lists specific WeChat features like Moments Ads, Fan recruitment, WeChat Pay, and Mini programs.
Technology and Digital Transformation
Consumer Goods
This slide outlines Tencent's WeChat capabilities across different stages of the shopping journey, from initial reach and engagement to conversion and after-sales services, showcasing the platform's comprehensive influence on consumer behavior.
WeChat, Tencent, shopping journey, social media, engagement
false
Technology and Digital Transformation
Consumer Goods
Table
BCG
Add to my slides
Remove from favorites
Pie charts showing average weekly reach potential by demographic segments, highlighting changes in linear reach potential and AVOD reach.
Market Analysis and Trends
Media & Entertainment
The slide shows the average weekly reach potential by demographic groups, emphasizing changes in linear reach and the growing impact of AVOD.
weekly reach, demo, linear reach, AVOD, potential
false
Market Analysis and Trends
Media & Entertainment
Multiple Chart
Nielsen
Add to my slides
Remove from favorites
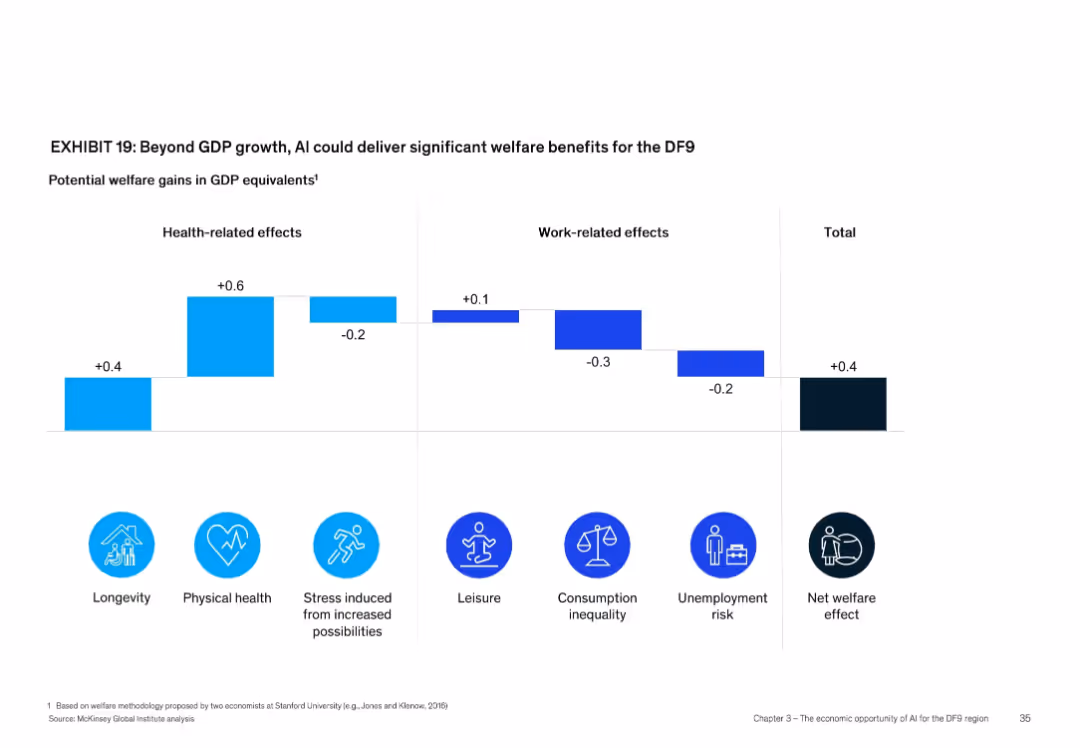
Horizontal bar chart with icons below, categorized into health/work effects and total impact
Strategic Planning
Artificial Intelligence
The slide illustrates AI’s welfare effects for DF9, showing positive gains in longevity (+0.4) and physical health (+0.6) but negative impacts like stress (-0.2) and unemployment risk (-0.2). The net welfare effect is +0.4 in GDP equivalents.
Welfare, longevity, unemployment, stress, GDP equivalent, AI effects
false
Strategic Planning
Artificial Intelligence
Single Chart
McKinsey
Add to my slides
Remove from favorites
Similar design to 17508 with horizontal bar metrics; emphasis on well-being and ethics.
Human Resources and Talent Management
Professional Services
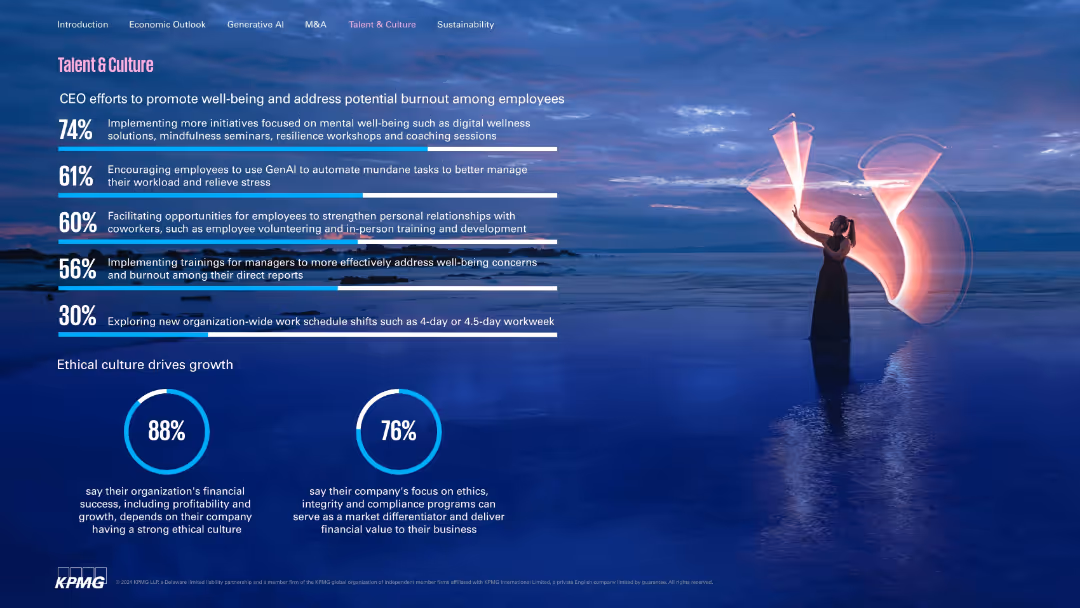
Discusses strategies to enhance employee well-being and reduce burnout, such as mental health initiatives and GenAI automation. Highlights ethics as a growth driver, with most CEOs affirming its financial significance.
well-being, burnout, GenAI, ethics, employee experience, culture
false
Human Resources and Talent Management
Professional Services
Multiple Chart
KPMG
Add to my slides
Remove from favorites
The slide includes text, a Venn diagram, and a column chart. It is moderately dense, with well-being components and survey statistics.
Human Resources and Talent Management
Government & Public Sector
Explores the application of well-being strategies in public services, focusing on physical, financial, and mental well-being components and their importance post-COVID-19.
well-being, COVID-19, public sector, physical, financial, mental, survey, strategy, employee
false
Human Resources and Talent Management
Government & Public Sector
Mixed Chart
Deloitte
Add to my slides
Remove from favorites
On the left, the slide lists the approach to well-being with bullet points, and on the right, a section highlights a new medical plan option. The slide uses a white and teal color scheme with teal accents. The image on the right shows two people, seemingly in a discussion, which may suggest collaboration or support. The layout is professional and clear, with a page number '24' on the bottom right.
Strategic Planning
Professional Services
The slide details the company’s robust employee well-being programs and Total Rewards approach to well-being. It emphasizes the importance of supporting employees’ physical, emotional, financial, and social health, especially in the context of challenges brought by the pandemic and other external factors. It aims to showcase the company’s commitment to employee well-being and the integration of such programs into the company’s culture.
well-being, total rewards, health, pandemic, support
false
Strategic Planning
Professional Services
Text Only
Booz Allen Hamilton
Add to my slides
Remove from favorites
Three-part horizontal timeline (Comfort care → Sick care → Wellness ecosystem); icons around a central "health consumer" visual; descriptive text below each stage; stylized, infographic-heavy design.
Technology and Digital Transformation
Healthcare & Pharmaceuticals
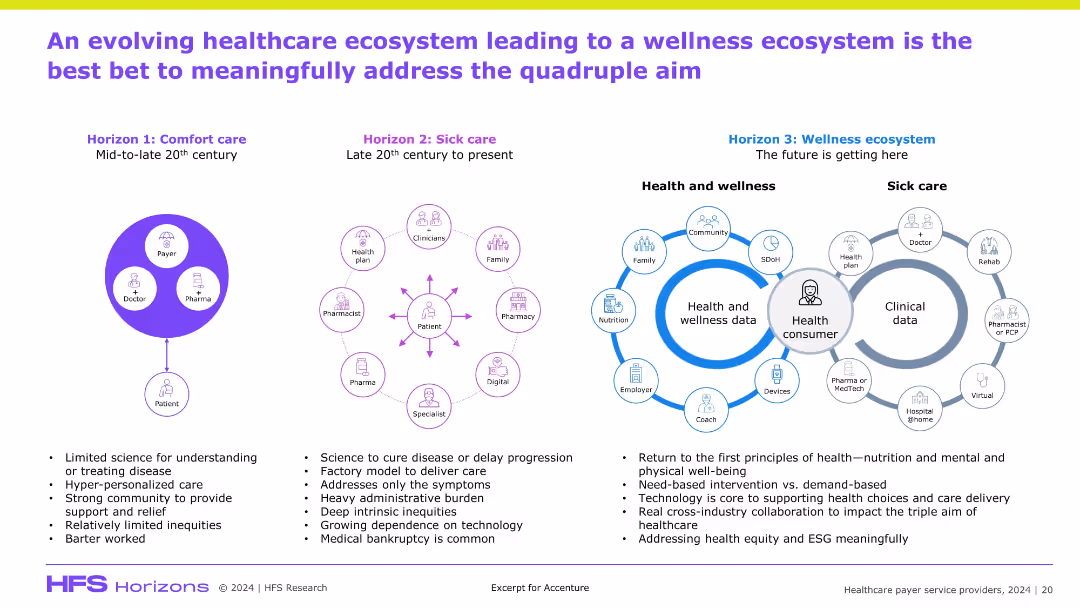
This slide outlines the evolution of healthcare delivery from comfort care to a future-focused wellness ecosystem. It emphasizes consumer-centric care, technology enablement, and cross-industry collaboration as the means to achieve the quadruple aim. Wellness data and prevention-oriented care models are the future direction of transformation.
wellness ecosystem, evolution, health consumer, prevention, digital health, collaboration
false
Technology and Digital Transformation
Healthcare & Pharmaceuticals
Header Horizontal
Accenture
Add to my slides
Remove from favorites
This slide contains a hexagonal diagram with 'Wellness' at the center, surrounded by key drivers such as demographics, healthcare industry, consumer goods, and the environment.
Strategic Planning
Healthcare & Pharmaceuticals
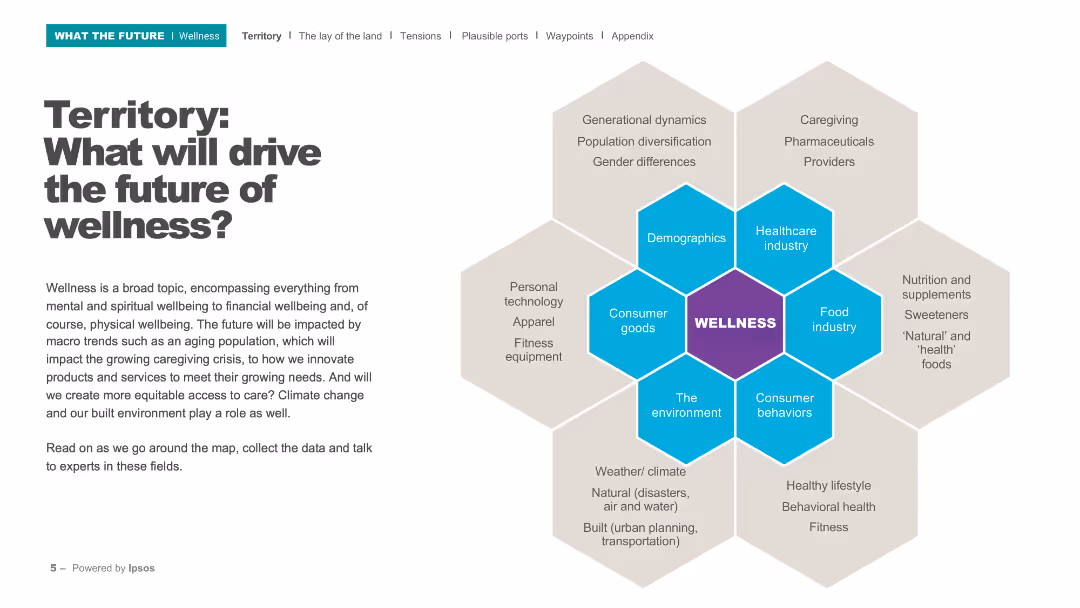
The slide outlines the various factors that will shape the future of wellness, including demographic shifts, technological advancements, and environmental factors. It sets the stage for a discussion on wellness trends.
Wellness, future trends, demographics, healthcare, environment
false
Strategic Planning
Healthcare & Pharmaceuticals
Diagram
IPSOS
Add to my slides
Remove from favorites
The slide contains a title in a red banner, multiple text boxes with detailed content, and a column chart displaying population without access to universal health coverage over time. The layout is dense with information.
Human Resources and Talent Management
Healthcare & Pharmaceuticals
The slide discusses the importance of wellness initiatives, support programs, and health education in improving employee access to healthcare. It highlights the challenges faced in keeping healthcare sufficiently funded and the role employers can play.
wellness, healthcare, employee support, health education, funding
false
Human Resources and Talent Management
Healthcare & Pharmaceuticals
Mixed Chart
PwC/Strategy&
Add to my slides
Remove from favorites
Two side-by-side bar charts comparing worry levels across countries; light vs. dark shades represent developed vs. emerging markets.
Market Analysis and Trends
Healthcare & Pharmaceuticals
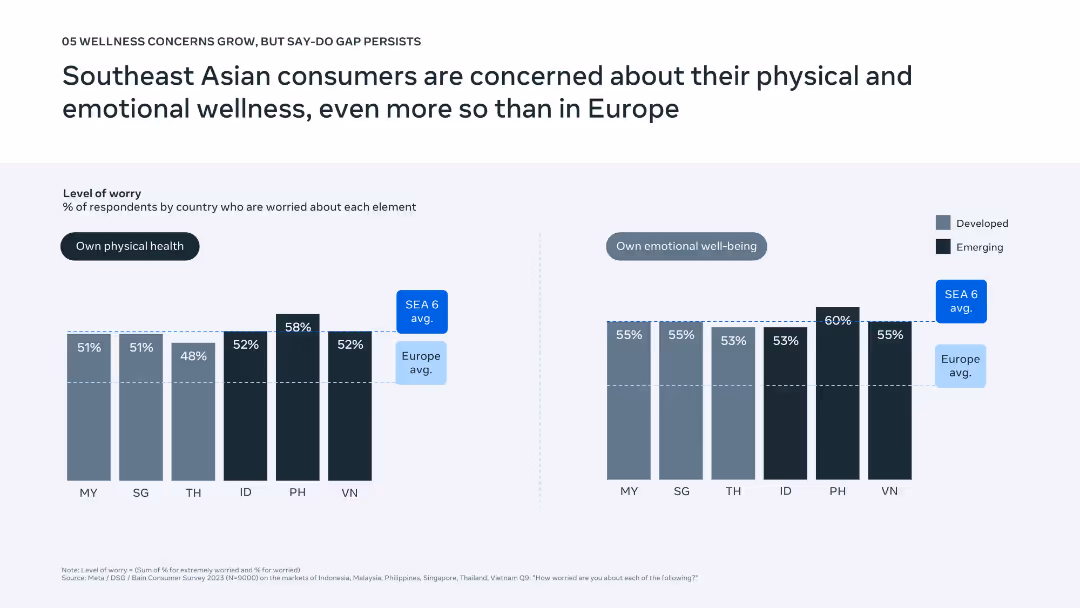
The slide presents consumer concern levels for physical and emotional wellness across Southeast Asian countries and contrasts them with Europe. It highlights greater concern in SEA, particularly in emerging markets like the Philippines and Indonesia, revealing strong consumer interest in wellness despite economic limitations.
wellness, mental health, physical health, SEA, consumer concern
false
Market Analysis and Trends
Healthcare & Pharmaceuticals
Multiple Chart
Bain
Add to my slides
Remove from favorites
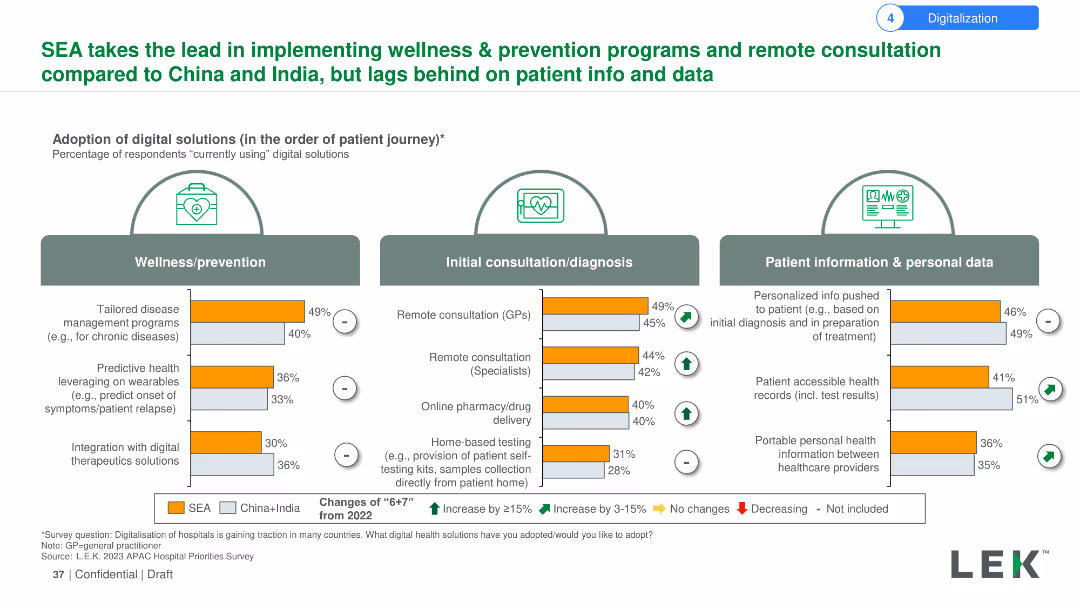
The slide uses a combination of bar charts and icons to show the adoption rates of digital solutions in wellness/prevention, initial consultation/diagnosis, and patient information/personal data. Changes from 2022 are indicated with arrows and symbols.
Market Analysis and Trends
Healthcare & Pharmaceuticals
The slide showcases SEA's leadership in adopting wellness and prevention programs and remote consultations compared to China and India. It highlights the percentage changes in digital solutions adoption rates from 2022 for different stages of the patient journey.
Wellness, prevention, remote consultation, digital solutions, SEA, China, India, adoption, patient journey, comparison
false
Market Analysis and Trends
Healthcare & Pharmaceuticals
Multiple Chart
LEK
Add to my slides
Remove from favorites
Column chart showing the adoption of digital health solutions in wellness and prevention, initial consultation/diagnosis, and patient info & personal data.
Technology and Digital Transformation
Healthcare & Pharmaceuticals
This slide compares the adoption of digital health solutions in SEA, China, and India, focusing on wellness programs, consultations, and patient data.
Wellness programs, digital health, SEA, China, India, patient data
false
Technology and Digital Transformation
Healthcare & Pharmaceuticals
Multiple Chart
LEK
Add to my slides
Remove from favorites
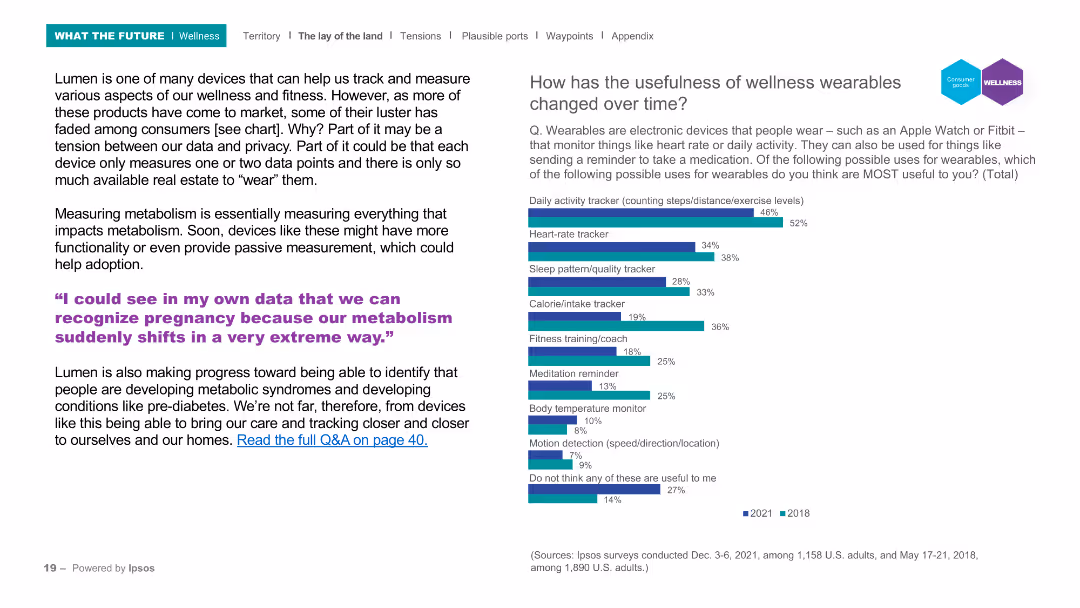
The slide includes a header, a background image, and two main sections: a text block on the left and a column chart on the right. The column chart compares the perceived usefulness of various wellness wearable features from 2018 and 2021, with a focus on features like activity tracking and heart rate monitoring.
Product and Service Analysis
Healthcare & Pharmaceuticals
Discusses the evolution and adoption of wellness wearables, highlighting their increasing functionality and the balance between data privacy and usefulness. The column chart illustrates changes in the perceived usefulness of wellness wearables over time, focusing on features such as activity tracking and heart rate monitoring.
Wellness, wearables, activity tracking, heart rate, survey
false
Product and Service Analysis
Healthcare & Pharmaceuticals
Mixed Chart
IPSOS
Add to my slides
Remove from favorites
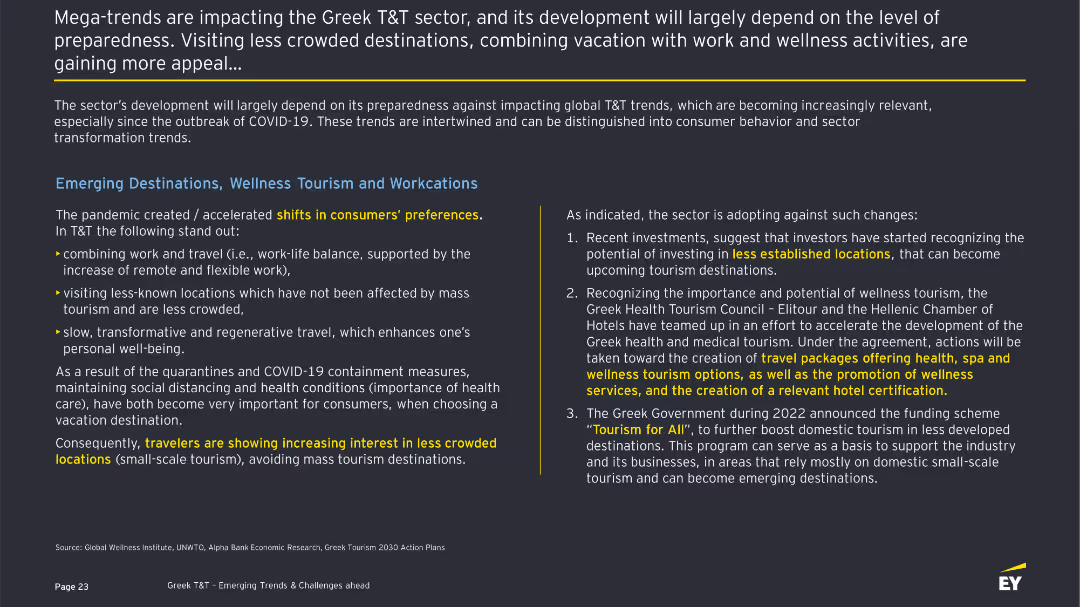
The slide discusses mega-trends impacting the Greek T&T sector, highlighting shifts in consumer preferences towards less crowded destinations, wellness tourism, and workcations. It includes bullet points and a summary of sector preparedness.
Strategic Planning
Hospitality & Tourism
Describes the impact of COVID-19 on consumer preferences in the T&T sector, with a focus on wellness tourism and workcations. It outlines key trends such as remote work, less crowded destinations, and the importance of health and safety measures.
Wellness, Workcations, Tourism, COVID-19, Trends
false
Strategic Planning
Hospitality & Tourism
Header Horizontal
EY
Add to my slides
Remove from favorites
The slide discusses mega-trends impacting the Greek T&T sector, highlighting shifts in consumer preferences towards less crowded destinations, wellness tourism, and workcations. It includes bullet points and a summary of sector preparedness.
Strategic Planning
Hospitality & Tourism
Describes the impact of COVID-19 on consumer preferences in the T&T sector, with a focus on wellness tourism and workcations. It outlines key trends such as remote work, less crowded destinations, and the importance of health and safety measures.
Wellness, Workcations, Tourism, COVID-19, Trends
false
Strategic Planning
Hospitality & Tourism
Mixed Chart
EY
Add to my slides
Remove from favorites
Column chart of wheat export and consumption volumes by state, with accompanying text explaining export trends and domestic consumption patterns.
Market Analysis and Trends
Agriculture & Food Production
The slide examines Australian wheat export trends, noting that WA is the largest exporter, and explains the balance between domestic demand and export volumes.
wheat export, domestic demand, WA, export trends, consumption patterns
false
Market Analysis and Trends
Agriculture & Food Production
Mixed Chart
LEK
Add to my slides
Remove from favorites
The slide contains a line chart comparing the volume of wheat exports from Canada, Australia, and Ukraine from 1999 to 2018. It also includes key data points and CAGR.
Market Analysis and Trends
Agriculture & Food Production
The slide illustrates the significant growth in wheat exports from Ukraine compared to Canada and Australia, with data highlighting Ukraine's competitive edge in recent years.
Wheat exports, Canada, Australia, Ukraine, CAGR, market trends, export volume, agriculture, food production, growth rate
false
Market Analysis and Trends
Agriculture & Food Production
Mixed Chart
LEK
Add to my slides
Remove from favorites
Column chart showing average annual wheat exports by destination region for Australia, Canada, and Ukraine, with text discussing competition in key export markets.
Competitive Landscape
Agriculture & Food Production
The slide analyzes competition in wheat export markets, comparing Australia's export destinations to those of Canada and Ukraine and highlighting competitive pressures.
wheat exports, competition, Australia, Canada, Ukraine
false
Competitive Landscape
Agriculture & Food Production
Mixed Chart
LEK
Add to my slides
Remove from favorites
This slide includes a map of Australia showing grain production regions and a list of major crops with percentages of total production.
Industry Overview
Agriculture & Food Production
The slide provides an overview of grain production in Australia, emphasizing that wheat is the predominant crop and detailing the production regions and other major crops.
Wheat, Grain, Production, Australia, Crops
false
Industry Overview
Agriculture & Food Production
Graphic
LEK
Add to my slides
Remove from favorites
The slide features a line chart showing wheat production volumes for Canada, Australia, and Ukraine, with annotations explaining the volatility and growth rates.
Market Analysis and Trends
Agriculture & Food Production
The slide explains the volatility in Australian wheat production compared to Canada and Ukraine, emphasizing the factors contributing to slower growth in Australia.
Wheat production, volatility, Australia, Canada, Ukraine, growth rate, agriculture, food production, market trends
false
Market Analysis and Trends
Agriculture & Food Production
Mixed Chart
LEK
Add to my slides
Remove from favorites
Column chart showing Australian wheat production by state over years. Text on the side explains factors affecting production, such as weather and drought conditions.
Market Analysis and Trends
Agriculture & Food Production
The slide analyzes the volatility of wheat production in Australia, highlighting the impact of weather conditions and drought on annual production volumes.
wheat production, volatility, Australia, weather conditions, drought
false
Market Analysis and Trends
Agriculture & Food Production
Mixed Chart
LEK
Add to my slides
Remove from favorites
A multi-colored bubble chart for top wheat and soybean producers in 2015, plus a bar chart for corn usage. It also has commentary boxes.
Market Analysis and Trends
Agriculture & Food Production
This slide compares production capabilities of different countries, emphasizing the potential of emerging markets and technology adoption.
wheat, soybeans, corn, production capabilities, emerging markets, technology adoption
false
Market Analysis and Trends
Agriculture & Food Production
Multiple Chart
EY
Add to my slides
Remove from favorites
The slide features a column chart comparing the components of delivered cost of wheat into Indonesia from different states and countries, with percentages.
Market Analysis and Trends
Transportation & Logistics
This slide presents a column chart showing the breakdown of wheat delivery costs into Indonesia, comparing Australia with other countries like Ukraine and Canada.
Wheat, Transport, Costs, Indonesia, Comparison
false
Market Analysis and Trends
Transportation & Logistics
Single Chart
LEK
Add to my slides
Remove from favorites
Visuals include a flowchart of the whistleblowing process and a pie chart with data on types of cases reported. There is emphasis on the roles and numbers related to the whistleblowing cases.
Risk Assessment and Management
Financial Services
Overview of the whistleblowing process at Barclays, highlighting the pathway for raising concerns and the breakdown of cases in 2023. This aids in assessing internal risk management and corporate governance practices.
whistleblowing, risk management, governance
false
Risk Assessment and Management
Financial Services
Multiple Chart
Barclays
Add to my slides
Remove from favorites
A detailed diagram illustrating the process of whitelisting wallets for tokenized assets, including steps like KYC/AML checks, engagement with regulators, and the role of tokenization providers, custodians, and exchanges.
Regulatory and Compliance
Financial Services
Describes an interim solution for enhancing secondary market liquidity by whitelisting wallets, detailing the process and regulatory compliance required to ensure secure and efficient trading of tokenized assets.
whitelisting, wallets, tokenization, KYC/AML, secondary market
false
Regulatory and Compliance
Financial Services
Diagram
EY
Add to my slides
Remove from favorites
Bar graph showing total sales by segment, monochromatic color scheme, and source citation.
Market Analysis and Trends
Financial Services
Demonstrates the size and sector opportunities within the US wholesale distribution market.
Wholesale, Distribution, Market Size, Sales, Sectors, Opportunities
false
Market Analysis and Trends
Financial Services
Single Chart
EY
Add to my slides
Remove from favorites
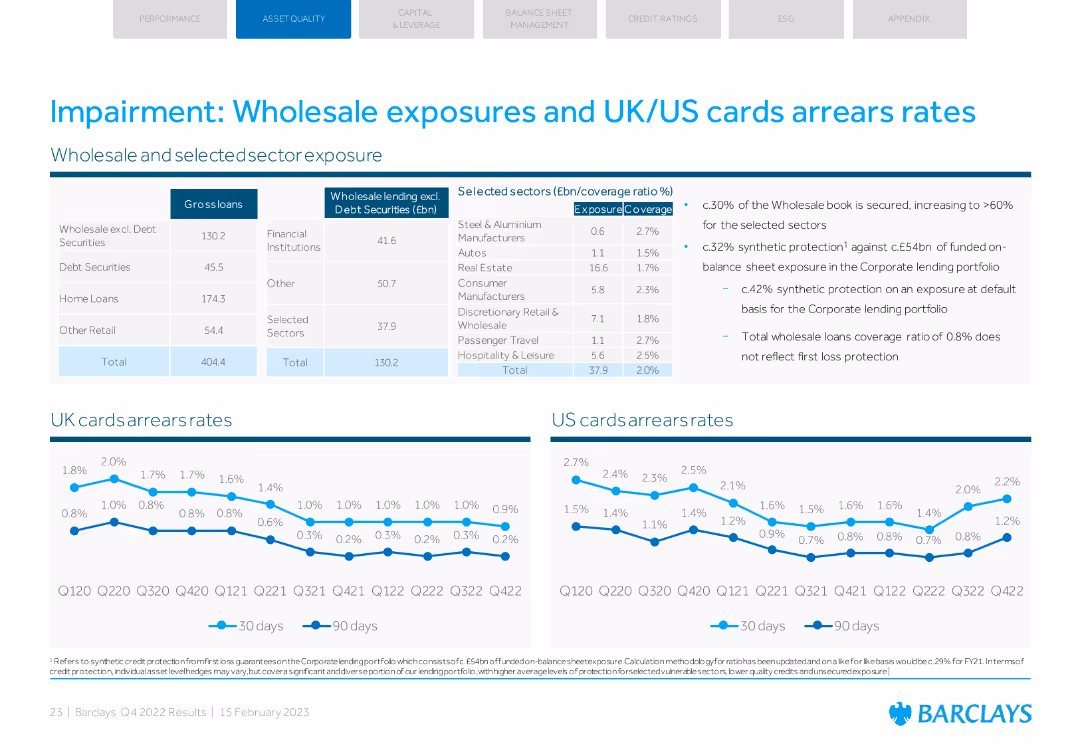
Tables and line charts showing gross loans, lending by sector, and arrears rates for UK and US cards.
Risk Assessment and Management
Financial Services
Detailed analysis of wholesale exposures and arrears rates for UK and US cards, with sector-specific data.
wholesale exposure, arrears rates, UK cards, US cards, sector exposure
false
Risk Assessment and Management
Financial Services
Multiple Chart
Barclays
Add to my slides
Remove from favorites
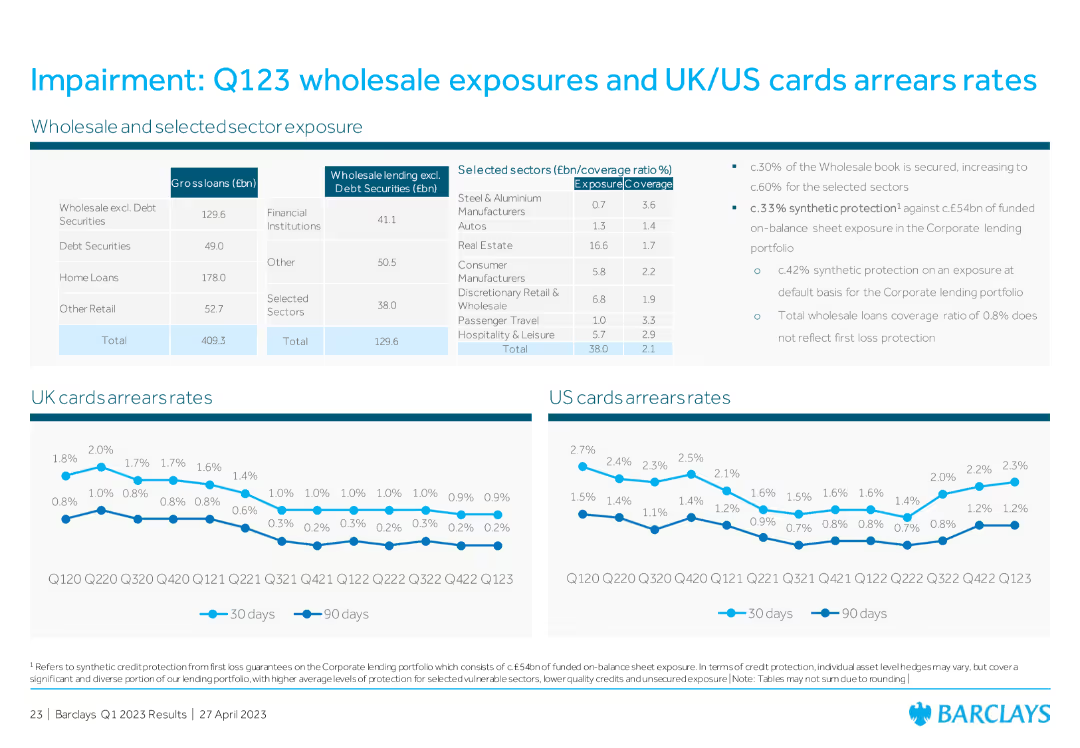
Table showing wholesale lending and selected sector exposure, with line graphs for UK and US cards arrears rates. Includes bullet points summarizing key exposure data.
Risk Assessment and Management
Financial Services
The slide details Q1 2023 wholesale exposures and arrears rates for UK and US cards, providing a comprehensive overview of financial exposures and credit risk assessments.
wholesale exposures, UK cards, US cards, arrears rates, credit risk assessment
false
Risk Assessment and Management
Financial Services
Multiple Chart
Barclays
Add to my slides
Remove from favorites
The slide features three donut charts showing the diversification of UBS's wholesale funding by source, maturity, and currency for 2Q23, providing a visual representation of funding distribution.
Financial Performance
Financial Services
The slide explains UBS's wholesale funding diversification, highlighting the distribution of funding by source, maturity, and currency for the second quarter of 2023, to showcase the bank's funding strategy and risk management.
wholesale funding, diversification, source, maturity, currency
false
Financial Performance
Financial Services
Multiple Chart
UBS
Add to my slides
Remove from favorites
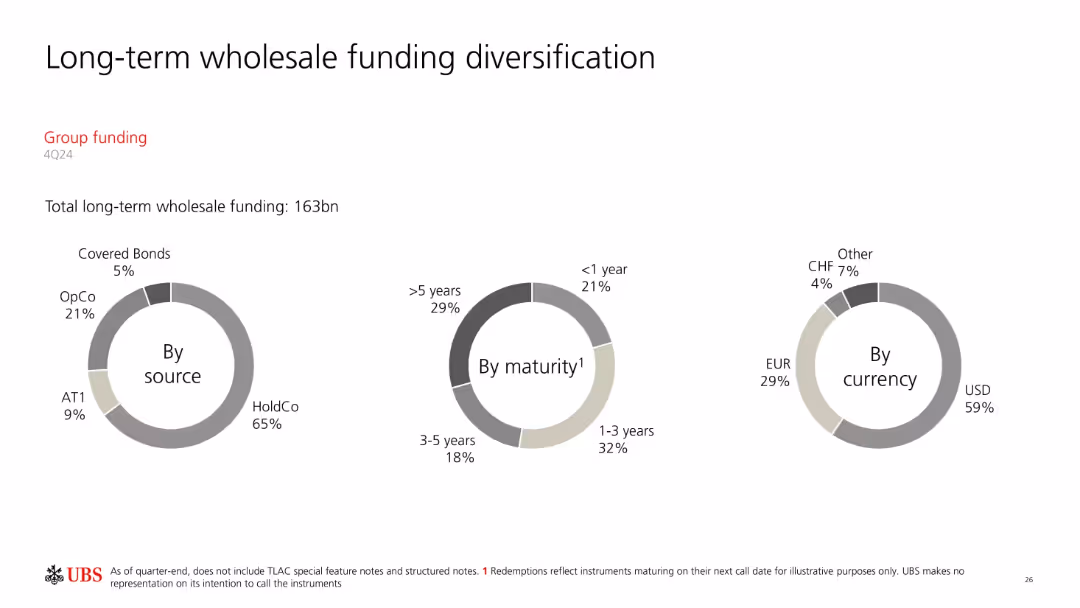
Three donut charts categorizing long-term funding (163bn) by source, maturity, and currency. Minimalist, data-centered layout.
Corporate Finance and Valuation
Financial Services
Visualizes the diversification of UBS’s long-term wholesale funding, identifying concentration by issuer type (e.g., HoldCo, OpCo), maturity horizon, and currency distribution. Highlights dependency on USD and long-term maturities.
wholesale funding, long-term debt, maturity, currency, HoldCo, UBS
false
Corporate Finance and Valuation
Financial Services
Single Chart
UBS
Add to my slides
Remove from favorites
Features diagrams and a pie chart comparing the role of the physical wholesale channel in the luxury market from 2019 to 2025F.
Market Analysis and Trends
Retail & E-commerce
Analyzes trends affecting the wholesale distribution of luxury goods, noting a significant contraction and shift towards increased control by brands.
wholesale, luxury, market, 2025, trends
false
Market Analysis and Trends
Retail & E-commerce
Mixed Chart
Bain
Add to my slides
Remove from favorites
A circular diagram in the center with categories of wholesale payment services, text to the left, and a list of client types segmented into 'Corporates' and 'Financial Institutions' to the right.
Industry Overview
Financial Services
The slide shows the range of wholesale payment services offered and the diversity of clients served, useful for illustrating company capabilities in financial services.
Wholesale Payments, Clients, Corporates, Financial Institutions, Commercial Card, Treasury, Trade Finance
false
Industry Overview
Financial Services
Linear Flow
JP Morgan
Add to my slides
Remove from favorites
The slide uses a comparative layout with icons representing different business sectors across the top and a horizontal bar chart below showing product opportunities. The color scheme is blue, complementing the corporate branding.
Market Analysis and Trends
Financial Services
It explains how the wholesale payments business can capitalize on growth opportunities in various sectors like SMBs and healthcare, highlighting core advantages and product opportunities, making it suitable for strategic planning discussions.
wholesale payments, growth opportunities, SMBs, healthcare, corporates, E-commerce, financial institutions, strategy
false
Market Analysis and Trends
Financial Services
Pillar
JP Morgan
Add to my slides
Remove from favorites
Slide features a column chart showing the growth in wholesale payments revenue from 2016 to 2018, and lists the key services included in this sector.
Financial Performance
Financial Services
Highlights the significant revenue growth in JP Morgan's Wholesale Payments sector, emphasizing its scale and service diversity.
wholesale payments, revenue growth, financial services
false
Financial Performance
Financial Services
Mixed Chart
JP Morgan
Add to my slides
Remove from favorites
Central diagram showing wholesale payments and related business areas, with text boxes for client benefits and infrastructure.
Operational Efficiency
Financial Services
Explains the wholesale payments business, client payment facilitation, and the support of a shared infrastructure.
Wholesale Payments, Treasury Services, Merchant Acquiring, Trade Finance, Digital Infrastructure
false
Operational Efficiency
Financial Services
Framework
JP Morgan
Add to my slides
Remove from favorites
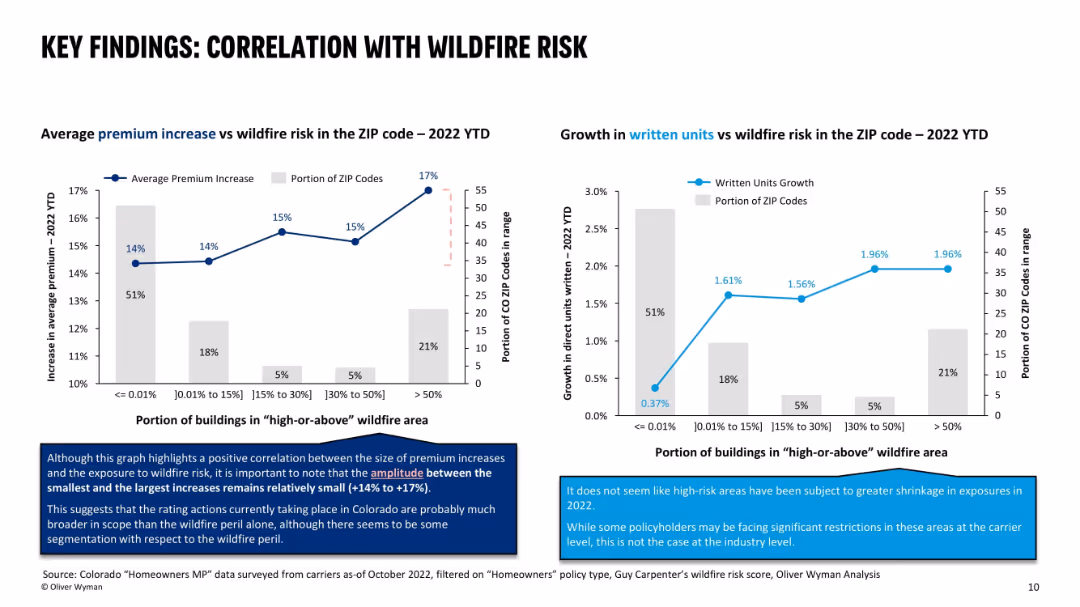
Two side-by-side graphs: left shows premium increase vs wildfire exposure; right shows written unit growth vs wildfire exposure; both use bar and line combinations; includes blue and grey callout boxes explaining correlation insights.
Risk Assessment and Management
Financial Services
This slide examines the correlation between wildfire exposure and both premium increases and policy growth. Premiums rise more sharply in high-risk ZIP codes, but written unit growth is not disproportionately impacted, suggesting broad rating actions not limited to wildfire exposure. Carrier responses vary but overall market exposure remains.
wildfire correlation, premium changes, policy growth, ZIP code risk, insurance pricing, Colorado, exposure segmentation, rating strategy
false
Risk Assessment and Management
Financial Services
Multiple Chart
Oliver Wyman
Add to my slides
Remove from favorites
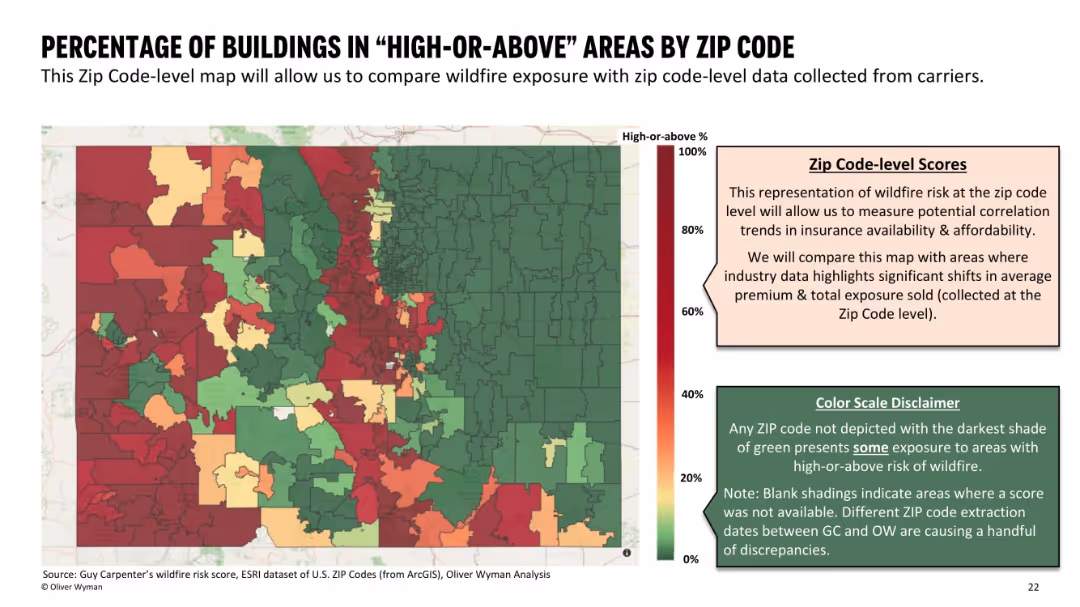
Color-coded map segmented by ZIP code, with gradient scale and side notes explaining methodology and limitations.
Risk Assessment and Management
Environmental Services & Sustainability
A ZIP code-level map depicting the percentage of buildings located in "High-or-Above" wildfire risk areas. The slide enables comparisons for insurance availability and affordability, with disclaimers on data accuracy.
wildfire exposure, ZIP code, building risk, high risk, insurance data
false
Risk Assessment and Management
Environmental Services & Sustainability
Mixed Chart
Oliver Wyman
Add to my slides
Remove from favorites
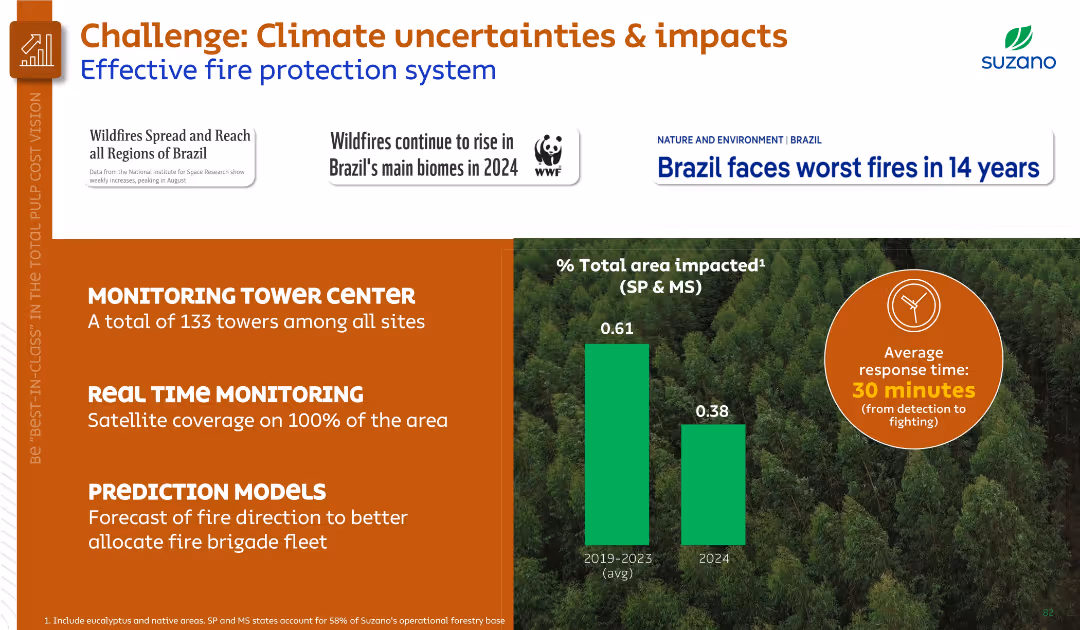
Left-aligned text sections and infographic visuals on right. Orange and green theme. Includes area impact bar chart and average response time icon.
Risk Assessment and Management
Environmental Services & Sustainability
Discusses wildfire risks and outlines Suzano’s fire protection system, including monitoring towers, real-time satellite coverage, and predictive models. Compares fire-impacted area and emphasizes rapid response.
wildfire, fire protection, monitoring, climate risk, Suzano, environment, prediction
false
Risk Assessment and Management
Environmental Services & Sustainability
Mixed Chart
Goldman Sachs
Add to my slides
Remove from favorites
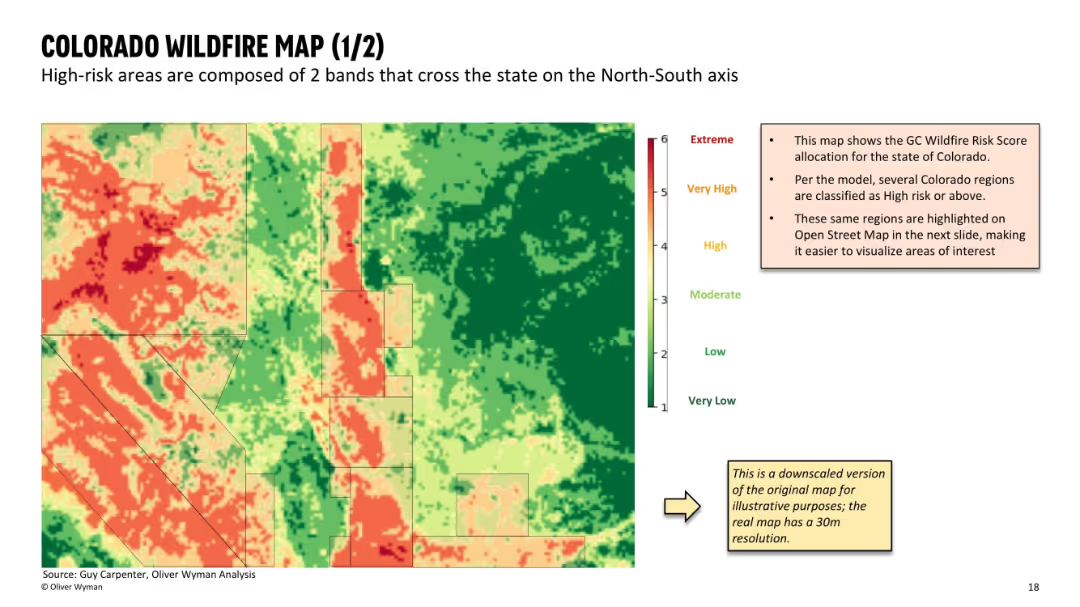
Full-screen heat map of wildfire risk zones using gradient from green (low) to red (extreme); includes a small annotation panel explaining data origin and purpose; clean, map-focused layout with minimal text.
Risk Assessment and Management
Financial Services
This slide shows a detailed wildfire risk map of Colorado, based on GC Wildfire Risk Scores. Two prominent high-risk bands are visible running north-south. The slide helps visualize geographic exposure for insurers and supports analysis of ZIP-level underwriting decisions.
wildfire risk, Colorado map, geographic exposure, heat map, GC score, insurance risk, spatial analysis, underwriting map, high-risk zones
false
Risk Assessment and Management
Financial Services
Mixed Chart
Oliver Wyman
Add to my slides
Remove from favorites
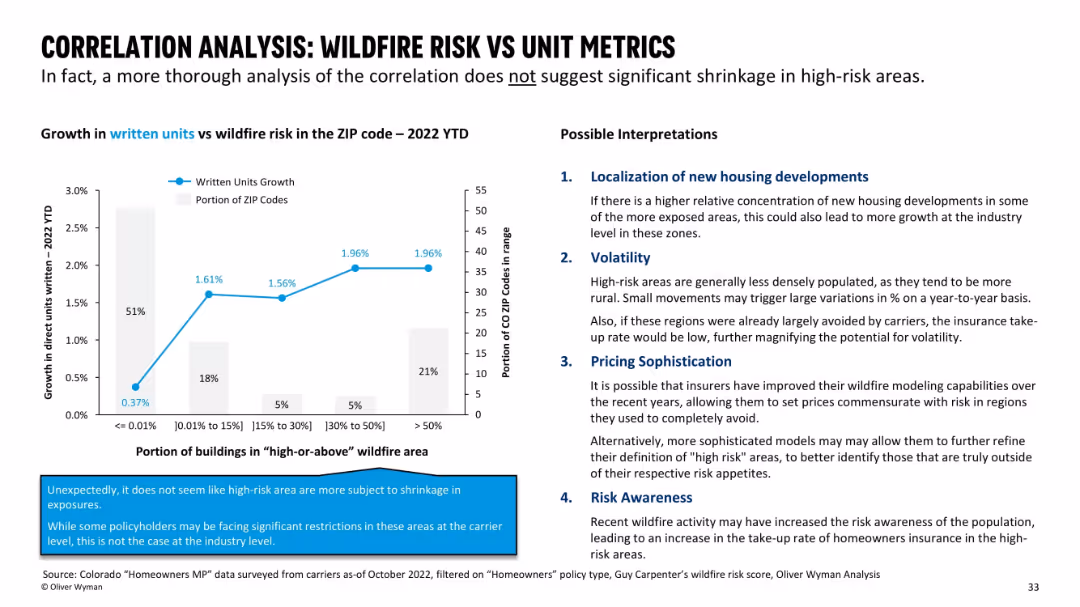
Split-slide format with a line graph on the left and a bulleted interpretation section on the right; blue and grey color palette with bolded headers and emphasized data points.
Risk Assessment and Management
Financial Services
The slide analyzes how wildfire risk correlates with written insurance unit growth by ZIP code for 2022. It reveals that there is no significant shrinkage in high-risk zones, and outlines four possible interpretations: new housing development, volatility, pricing sophistication, and risk awareness.
wildfire, risk, insurance, unit growth, ZIP code, volatility, pricing, awareness, correlation, interpretation
false
Risk Assessment and Management
Financial Services
Mixed Chart
Oliver Wyman
Add to my slides
Remove from favorites
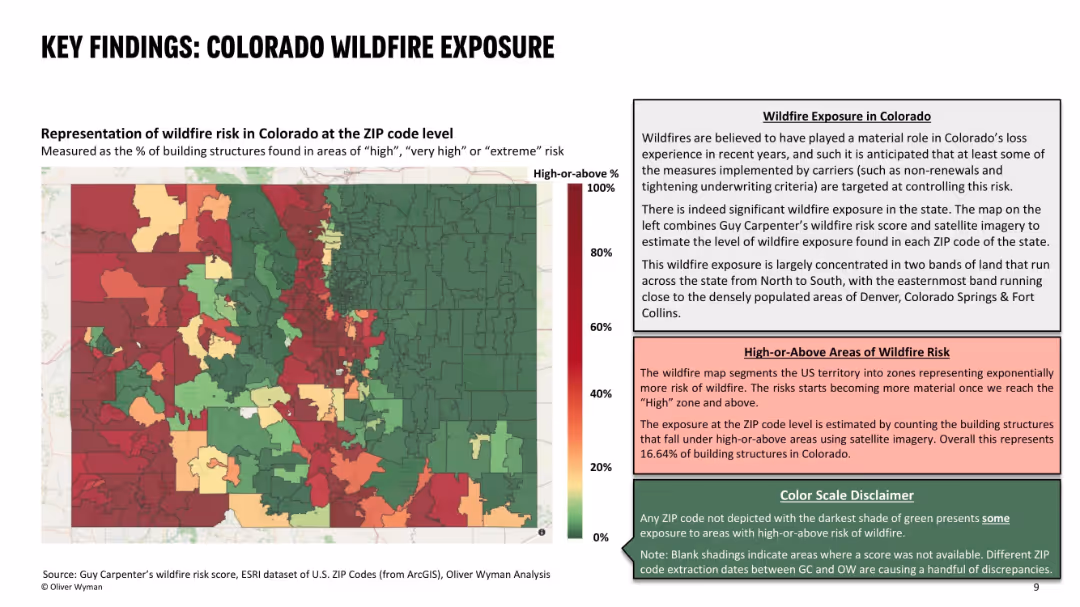
Left side features a color-coded ZIP code heat map of wildfire risk; right side contains descriptive text explaining the data and risk interpretation; uses red-green gradient with three text boxes for context and definitions.
Risk Assessment and Management
Environmental Services & Sustainability
This slide presents the wildfire exposure in Colorado at ZIP code level, identifying areas with high percentages of structures at significant wildfire risk. It highlights concentrated wildfire zones and their correlation with recent underwriting actions by insurers. About 16.6% of Colorado structures are in high-risk zones, influencing carrier decisions.
wildfire risk, ZIP code, building exposure, insurance, risk zones, high-risk areas, Colorado, wildfire impact, underwriting decisions
false
Risk Assessment and Management
Environmental Services & Sustainability
Mixed Chart
Oliver Wyman
Add to my slides
Remove from favorites
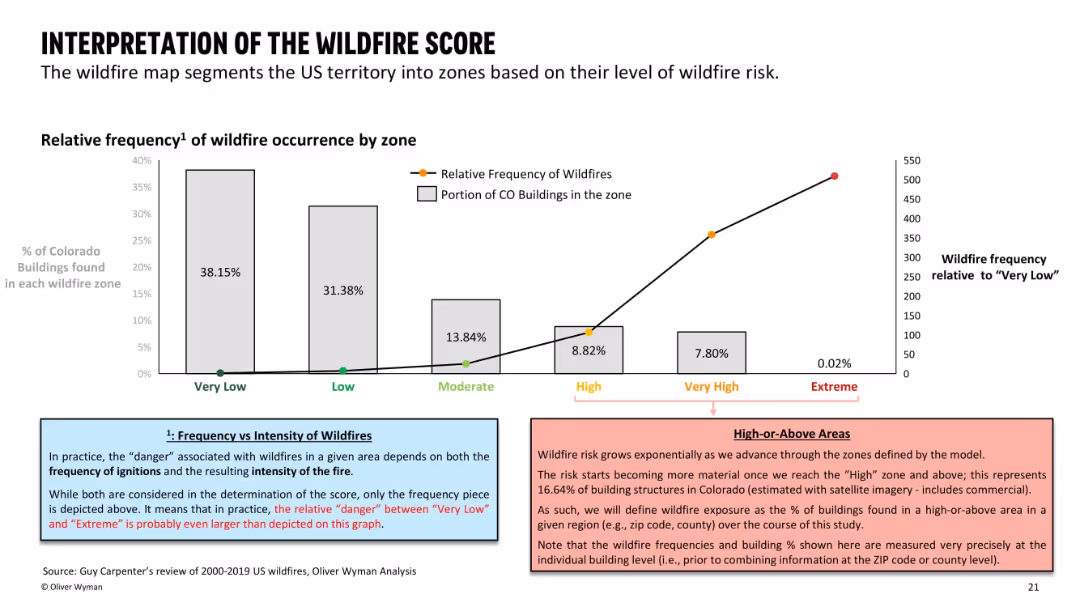
Bar and line chart with supporting colored text boxes; dual-axis graph shows wildfire frequency and building distribution across risk zones.
Risk Assessment and Management
Environmental Services & Sustainability
Analyzes the relative frequency of wildfires by zone and links it to the distribution of Colorado buildings. The slide distinguishes frequency from intensity, noting that risk escalates sharply from "High" to "Extreme" zones.
wildfire zones, frequency, intensity, building distribution, risk levels
false
Risk Assessment and Management
Environmental Services & Sustainability
Mixed Chart
Oliver Wyman
Add to my slides
Remove from favorites
The slide features a column chart comparing the median willingness to pay for connected car services among consumers in Germany, the US, and China, with detailed pricing points for maximum, optimal, and minimum prices.
Market Analysis and Trends
Consumer Goods
This slide explores the willingness of consumers in Germany, the US, and China to pay for connected car services, showing variations in median price points and consumer expectations in each country.
willingness to pay, connected services, consumer analysis, Germany, US, China, pricing, column chart
false
Market Analysis and Trends
Consumer Goods
Mixed Chart
PwC/Strategy&
Add to my slides
Remove from favorites
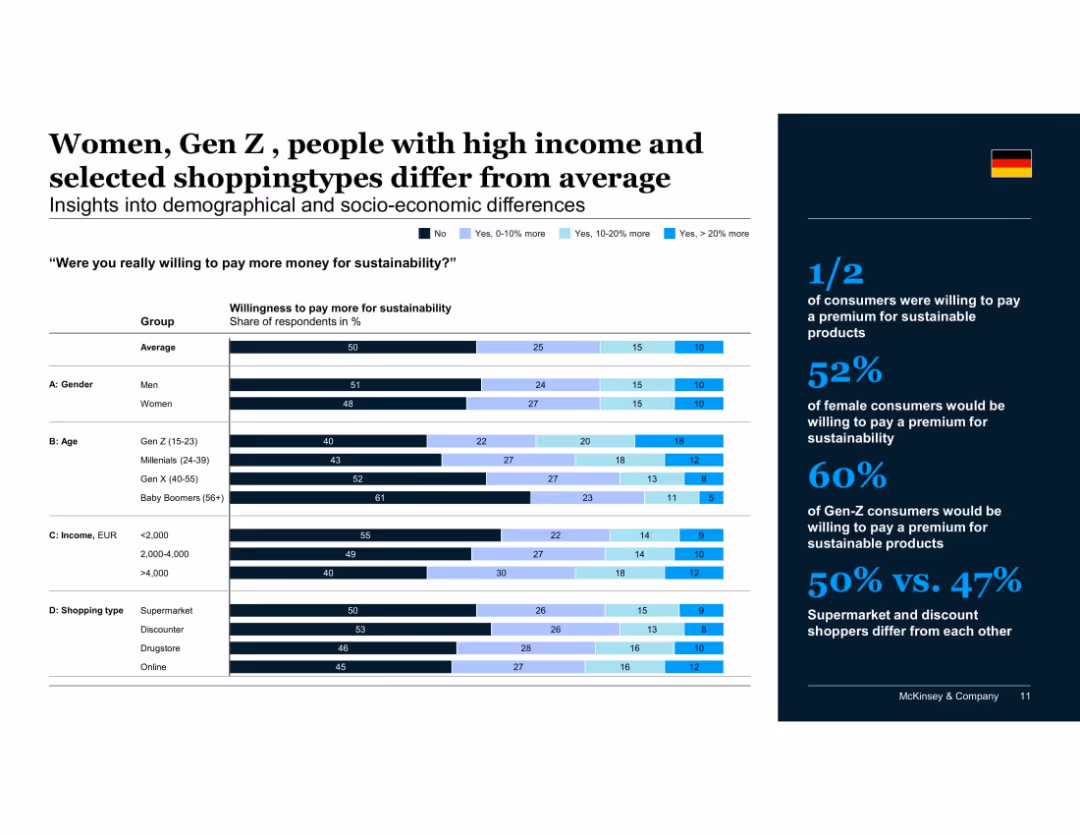
Horizontal stacked bar chart showing willingness to pay more for sustainability by demographics and shopping types
Customer and Market Segmentation
Consumer Goods
Half of consumers are willing to pay a premium for sustainable goods. Gen Z, women, and high-income earners are more likely to pay more, as are drugstore and discount shoppers, indicating clear segmentation by demographic and behavior.
willingness to pay, Gen Z, women, income, sustainability, demographic differences, shopping behavior, price sensitivity, McKinsey
false
Customer and Market Segmentation
Consumer Goods
Mixed Chart
McKinsey
Add to my slides
Remove from favorites
Contains bar charts showing willingness to travel for business post-COVID-19 by generation, area, sector, and job level.
Market Analysis and Trends
Professional Services
Explores the willingness of employees to travel for business across different demographics, including generation, geographical area, sector, and job level.
Willingness to travel, Generation, Area, Sector, Job level
false
Market Analysis and Trends
Professional Services
Multiple Chart
EY
Add to my slides
Remove from favorites
This slide contains two pie charts and two column charts displaying various percentages of employee characteristics related to willingness to travel post-COVID-19.
Market Analysis and Trends
Professional Services
Highlights employee willingness to travel for business post-COVID-19, focusing on productivity measurement, job satisfaction, gender differences, and leadership roles.
Willingness to travel, Job satisfaction, Productivity, Gender differences, Leadership roles
false
Market Analysis and Trends
Professional Services
Multiple Chart
EY
Add to my slides
Remove from favorites
Detailed analysis and graphics representing offshore and onshore wind energy opportunities, with emphasis on geographical and financial aspects.
Investment Analysis
Energy & Utilities
Analysis of offshore wind project development opportunities, highlighting geographical benefits and expected returns.
wind energy, offshore, investment opportunities, SEA, project returns
false
Investment Analysis
Energy & Utilities
Table
Bain
Add to my slides
Remove from favorites
Timeline and bar chart showing the expected period for commercialization of various offshore wind technology innovations from 2015 to 2045.
Technology and Digital Transformation
Energy & Utilities
This slide details innovations in offshore wind technology, highlighting the potential for next-generation turbines and floating foundations to drive growth in the wind energy sector. It outlines the timeline for commercialization of various technological advancements in wind energy.
Wind Energy, Offshore Technology, Turbines
false
Technology and Digital Transformation
Energy & Utilities
Mixed Chart
Roland Berger
Add to my slides
Remove from favorites
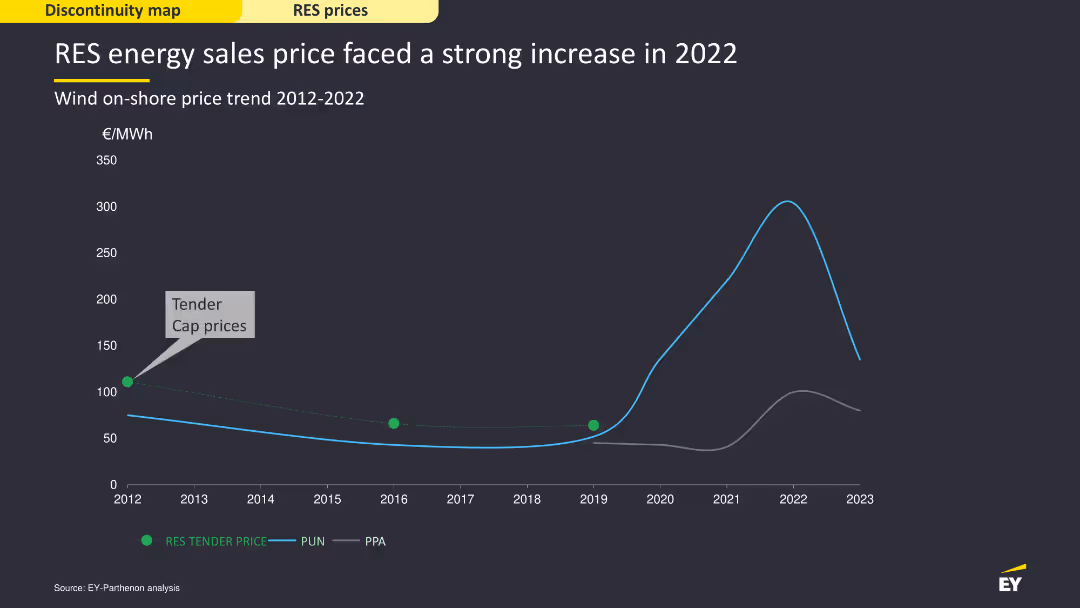
This slide contains a line chart depicting the wind on-shore price trend from 2012 to 2022, with data points marked for tender and cap prices. The chart uses a dark background with green and blue lines, offering a clear visual of the price increase trend over time. The layout is straightforward, emphasizing the sharp increase in 2022.
Market Analysis and Trends
Energy & Utilities
The slide shows the trend of wind on-shore energy prices over a decade, highlighting a significant price increase in 2022. It provides a visual analysis of the price trends and benchmarks like tender and cap prices, underlining the economic changes in the renewable energy sector.
wind energy, price trend, 2022, renewable, increase
false
Market Analysis and Trends
Energy & Utilities
Single Chart
EY
Add to my slides
Remove from favorites
Includes a mix of text and tables detailing investment opportunities in wind energy, with icons for different types of capital investors.
Investment Analysis
Energy & Utilities
Discusses investment opportunities in wind energy project development in SEA, focusing on types of projects and stages of development.
wind energy, SEA, investment opportunities, project development, energy transition
false
Investment Analysis
Energy & Utilities
Header Vertical
Bain
Add to my slides
Remove from favorites
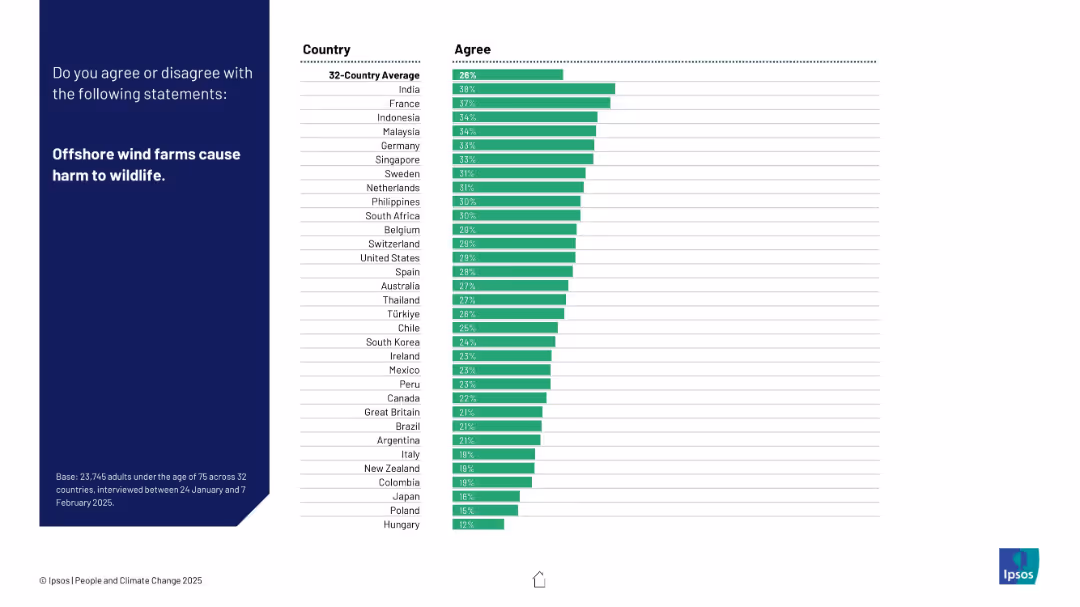
Left panel has a bold survey question; right side shows green bar chart by country agreement.
Risk Assessment and Management
Environmental Services & Sustainability
This slide examines public perception of environmental risks from offshore wind farms. India and France show high agreement that they harm wildlife.
wind energy, wildlife impact, offshore wind, environmental risk, public opinion, Ipsos, country response, renewable energy, green technology, biodiversity
false
Risk Assessment and Management
Environmental Services & Sustainability
Mixed Chart
IPSOS
Add to my slides
Remove from favorites
Shows a dual-layered area chart projecting cumulative GW installations for offshore wind farms from 2018 to 2030, differentiated between Europe and the rest of the world, underlining significant growth.
Market Analysis and Trends
Energy & Utilities
Highlights the growth trajectory of offshore wind installations globally, emphasizing the company's experience and capabilities in this rapidly expanding sector, which is pertinent for stakeholders interested in sustainable energy solutions.
wind farms, growth, projections, sustainability, global
false
Market Analysis and Trends
Energy & Utilities
Mixed Chart
Barclays
Add to my slides
Remove from favorites
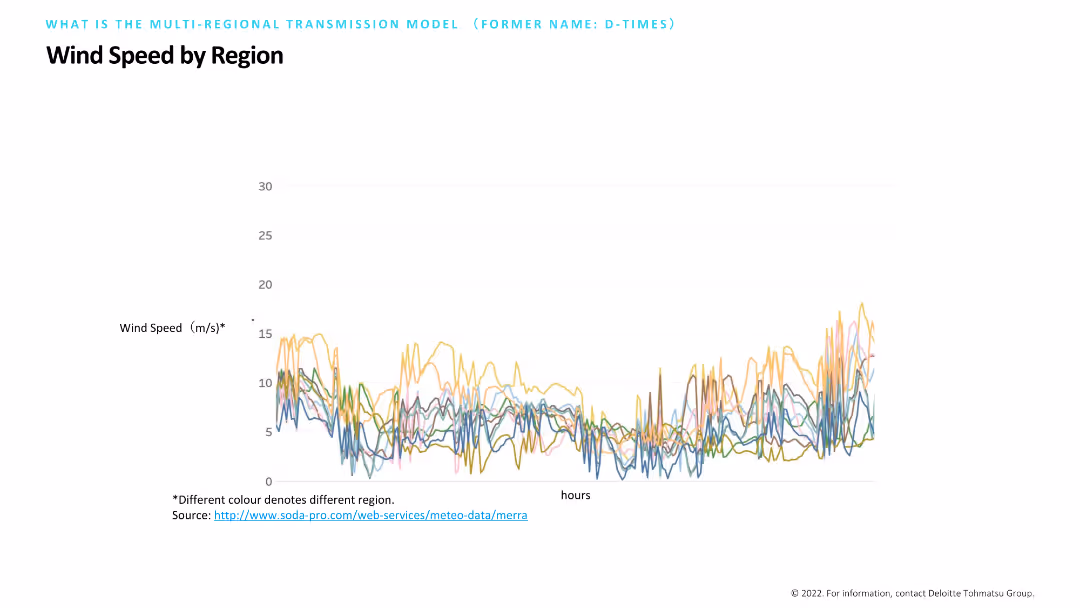
Contains a line chart with multiple colored lines representing wind speed variations across different regions over time. The chart is labeled with wind speed on the Y-axis and hours on the X-axis, with a note indicating the source of data.
Market Analysis and Trends
Environmental Services & Sustainability
Illustrates wind speed variations by region, using a line chart to track changes over time. This data visualization helps in analyzing regional wind patterns, essential for renewable energy planning and assessing the viability of wind power projects.
Wind Speed, Region, Data, Renewable, Analysis
false
Market Analysis and Trends
Environmental Services & Sustainability
Single Chart
Deloitte
Add to my slides
Remove from favorites
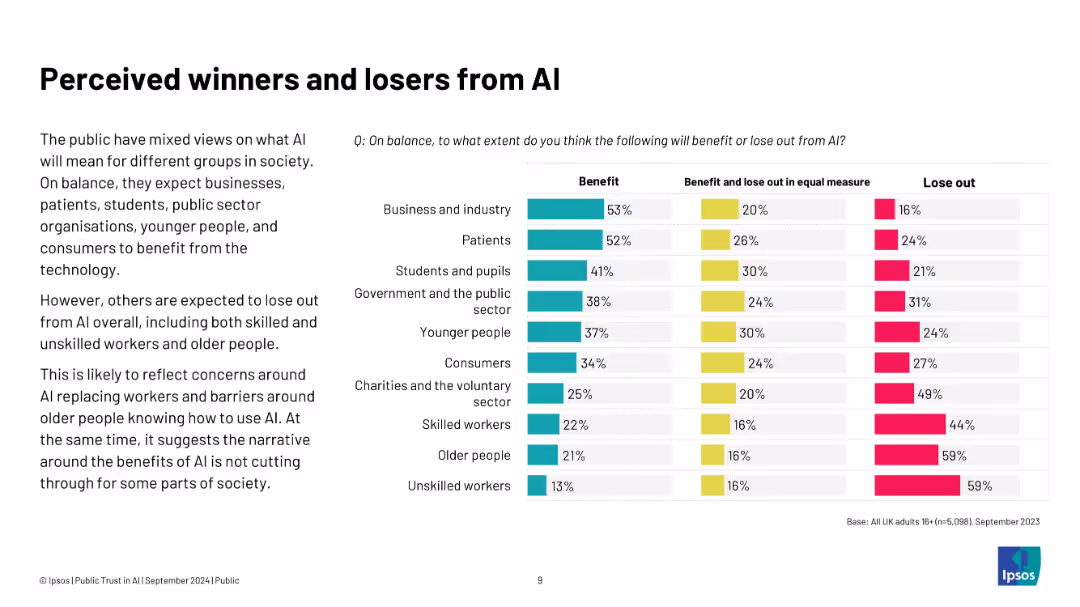
Left: summary paragraph; right: bar chart ranking groups by perceived AI benefit or loss
Strategic Planning
Artificial Intelligence
The public perceives businesses, patients, and younger people as AI beneficiaries, while older and unskilled workers are seen as most likely to lose out. This suggests uneven expected impact of AI across different societal segments and underlines inclusion risks.
winners and losers, AI impact, demographics, jobs, society, Ipsos, perception, inequality
false
Strategic Planning
Artificial Intelligence
Mixed Chart
IPSOS
Add to my slides
Remove from favorites
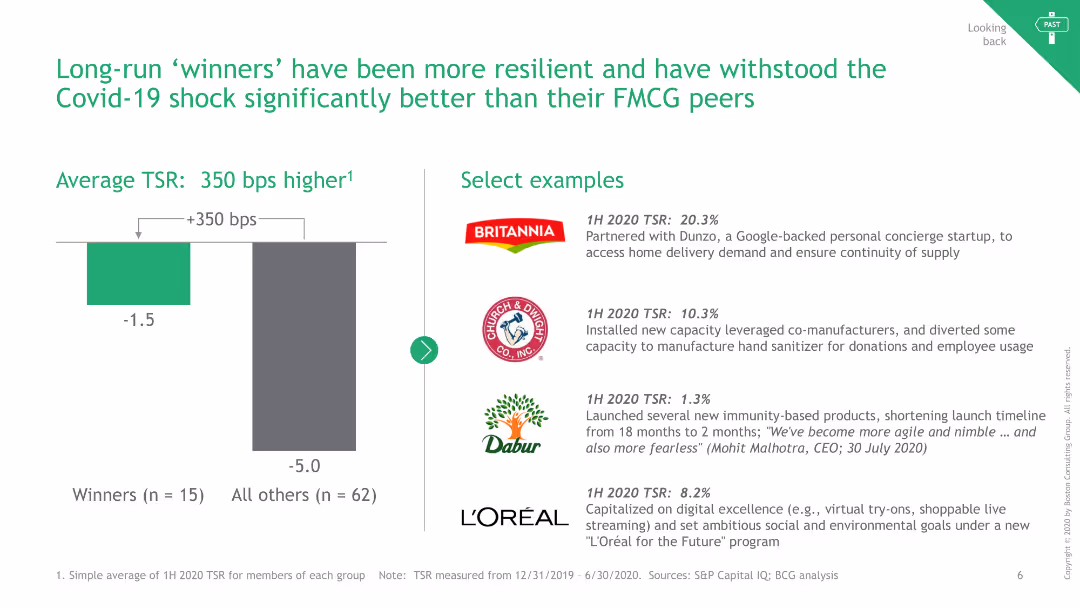
The slide includes a bar chart comparing TSR of winners vs. others and lists select examples of resilient companies.
Strategic Planning
Consumer Goods
It shows how long-run winners have outperformed others during the Covid-19 shock, with examples from different companies.
Winners, TSR, Resilience, Covid-19, Examples
false
Strategic Planning
Consumer Goods
Mixed Chart
BCG
Add to my slides
Remove from favorites
The slide includes text blocks detailing four key characteristics of winning companies, supported by icons and brief descriptions.
Strategic Planning
Healthcare & Pharmaceuticals
This slide outlines the four main characteristics that define winning pharma companies, emphasizing strategic coherence and execution ability.
winning companies, key characteristics, strategic coherence, execution ability, pharma industry
false
Strategic Planning
Healthcare & Pharmaceuticals
Multiple Chart
Roland Berger
Add to my slides
Remove from favorites
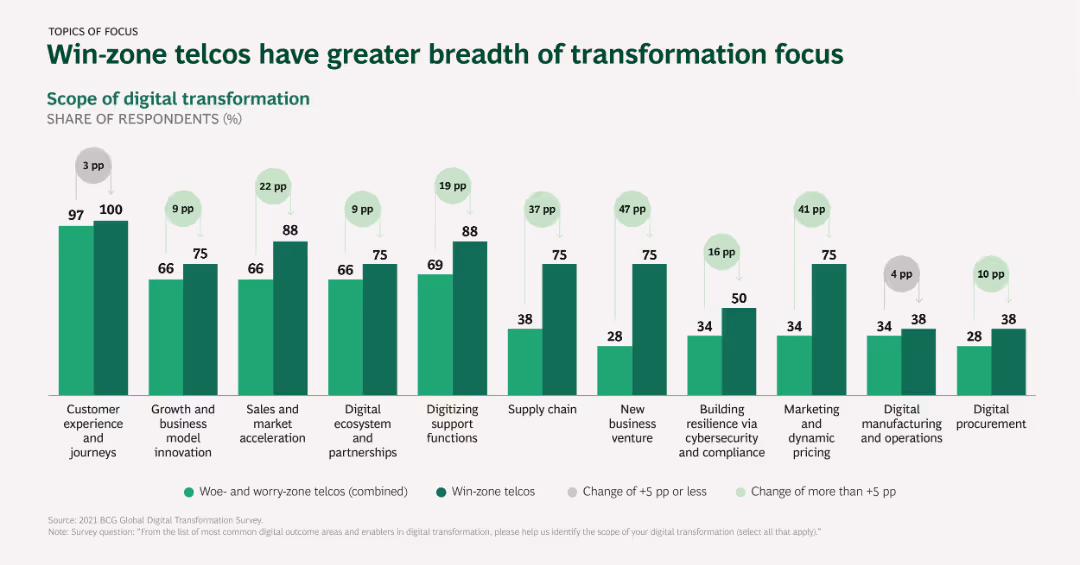
The slide presents a column chart comparing the breadth of digital transformation focus areas between win-zone and woe/worry-zone telcos, with significant differences highlighted.
Market Analysis and Trends
Telecommunications
This slide compares the scope of digital transformation initiatives between win-zone telcos and those in the worry/woe zones, indicating broader transformation focus among win-zone telcos.
Win-zone telcos, Transformation focus, Digital initiatives, Comparative analysis
false
Market Analysis and Trends
Telecommunications
Single Chart
BCG
Add to my slides
Remove from favorites
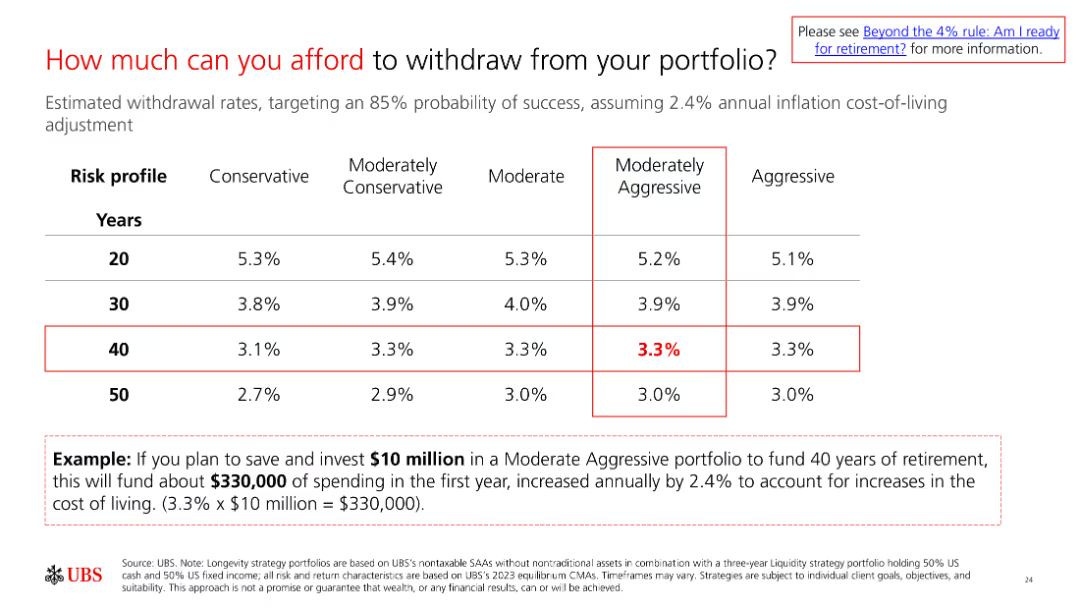
A slide with a table showing withdrawal rates for different risk profiles and time horizons. The example at the bottom illustrates how to apply the rates to determine affordable withdrawals.
Financial Performance
Financial Services
The slide explains how much individuals can afford to withdraw from their portfolios based on their risk profile and time horizon, with an example for clarity.
withdrawal rates, portfolio management, retirement planning, financial strategy, risk management
false
Financial Performance
Financial Services
Table
UBS
Add to my slides
Remove from favorites
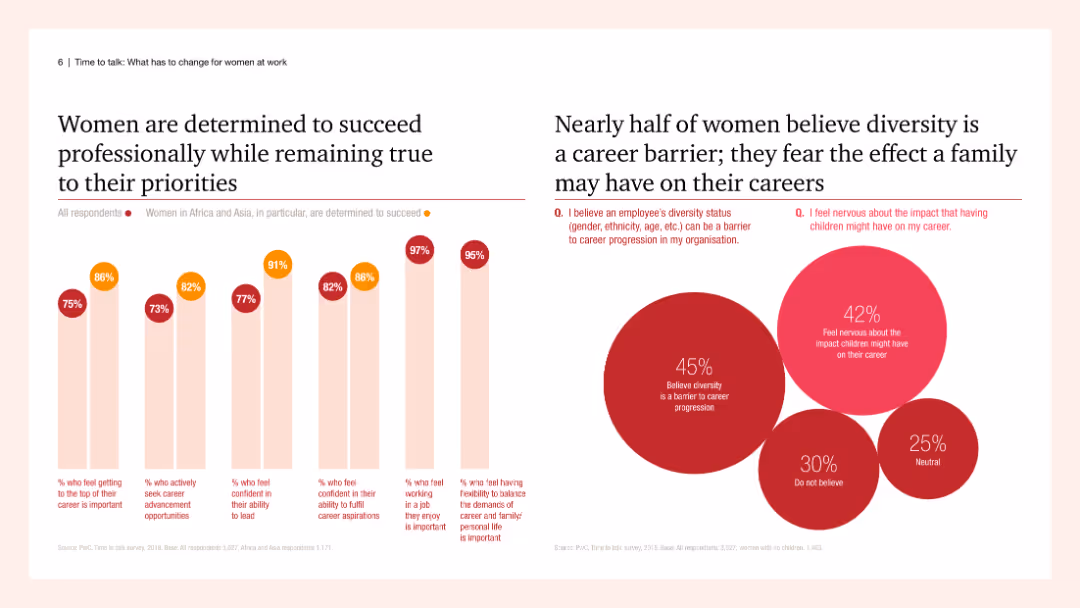
Two column charts showing statistics on women's determination to succeed professionally and diversity as a career barrier. Text provides detailed insights into women's perspectives on career and family balance.
Human Resources and Talent Management
Professional Services
The slide highlights women's determination to succeed in their careers while balancing personal priorities and discusses perceived barriers like diversity and family impact on career progression.
women, career, diversity, priorities, balance
false
Human Resources and Talent Management
Professional Services
Multiple Chart
PwC/Strategy&
Add to my slides
Remove from favorites
Column chart showing percentage of startups created in 2022 per industry, broken down by women-only, men-only, and mixed founding teams.
Market Analysis and Trends
Professional Services
The slide illustrates that women tend to start businesses in specific industries like fashion and wellness more than in other sectors.
women entrepreneurs, industry concentration, startups
false
Market Analysis and Trends
Professional Services
Mixed Chart
BCG
Add to my slides
Remove from favorites
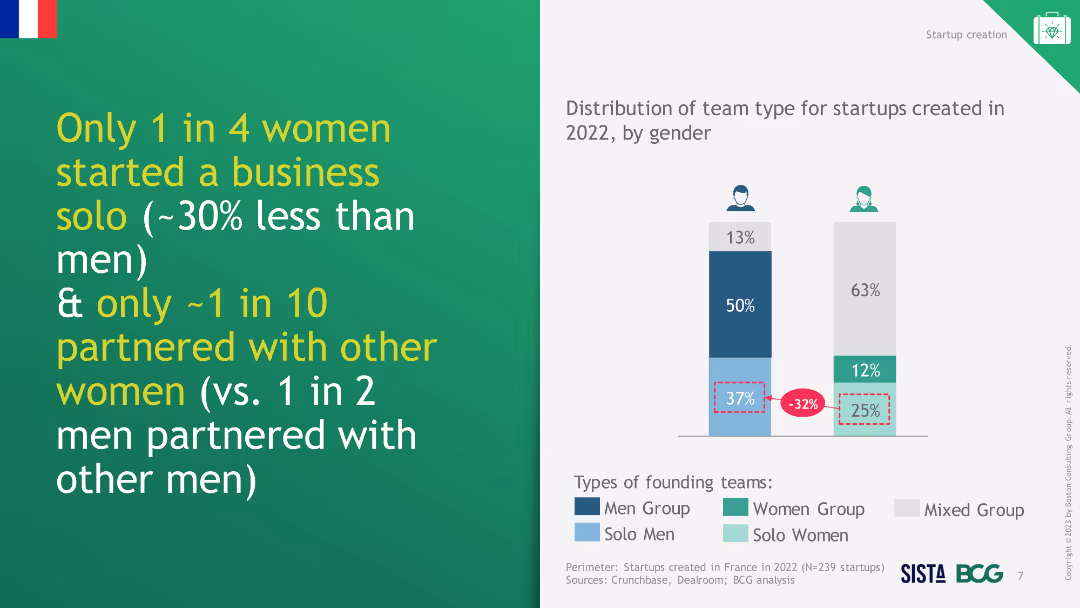
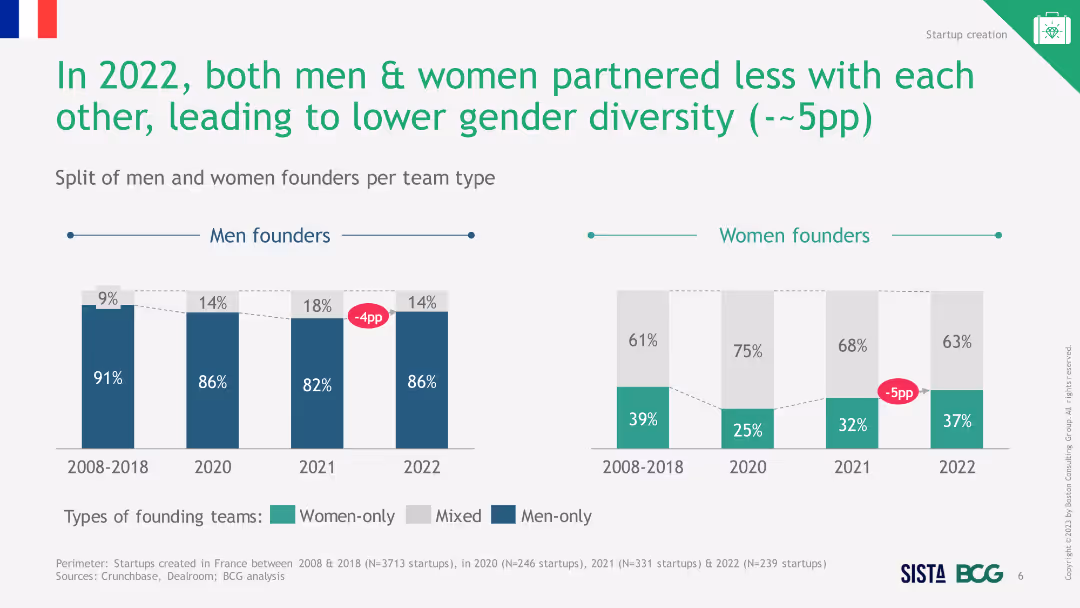
Text and column chart showing the distribution of team types for startups by gender in 2022, highlighting solo and group startups for men and women.
Market Analysis and Trends
Professional Services
The slide indicates that fewer women start businesses solo compared to men and highlights the disparity in partnership types by gender.
women entrepreneurs, solo business, gender disparity
false
Market Analysis and Trends
Professional Services
Multiple Chart
BCG
Add to my slides
Remove from favorites
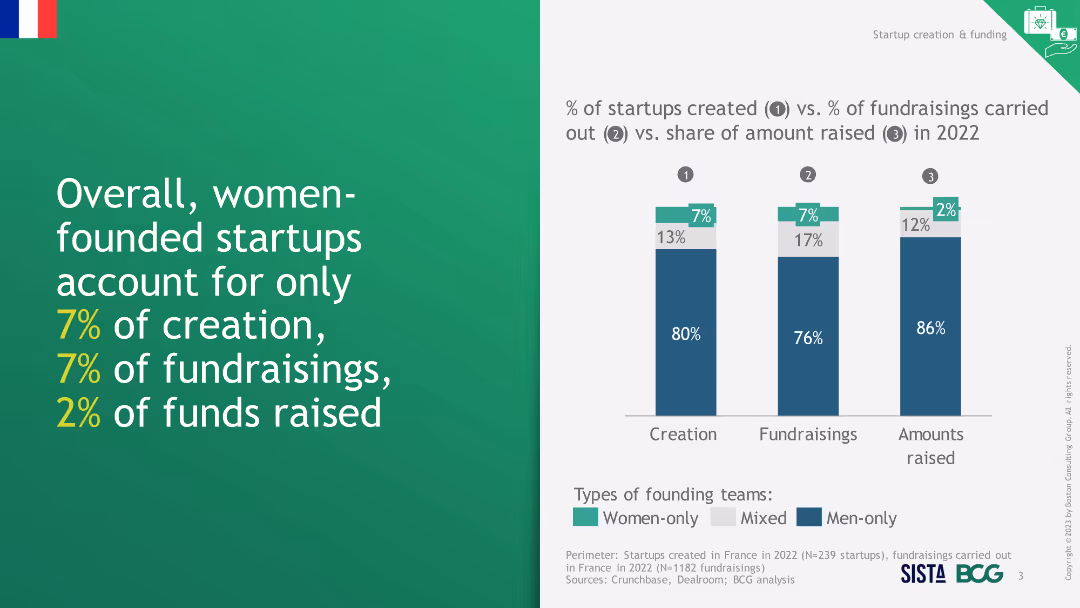
This slide presents a column chart comparing percentages of startup creation, fundraisings, and funds raised by women-only, mixed, and men-only teams.
Investment Analysis
Financial Services
The slide highlights the low representation and funding of women-founded startups in terms of creation, fundraisings, and funds raised in 2022.
women-founded startups, creation, fundraisings, funds raised, representation
false
Investment Analysis
Financial Services
Mixed Chart
BCG
Add to my slides
Remove from favorites
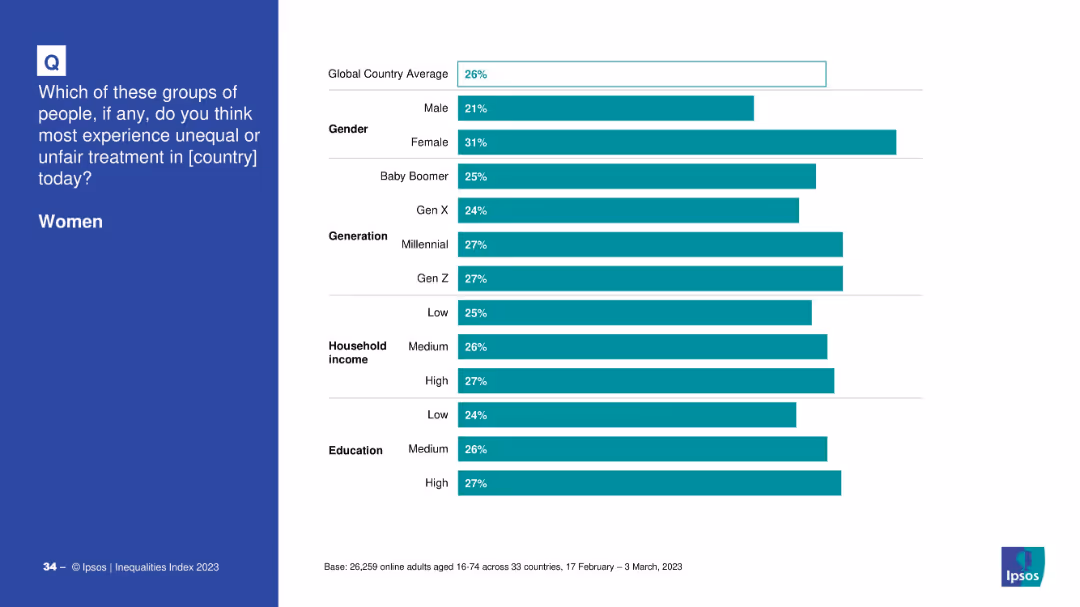
Demographic breakdown of perceptions about women experiencing unequal treatment.
Customer and Market Segmentation
Government & Public Sector
This slide analyzes perceptions of unequal treatment of women across gender, generation, income, and education groups. Female respondents and younger generations are more likely to view women as experiencing unfair treatment.
women, inequality, perception, demographics, gender bias, generational differences
false
Customer and Market Segmentation
Government & Public Sector
Mixed Chart
IPSOS
Add to my slides
Remove from favorites
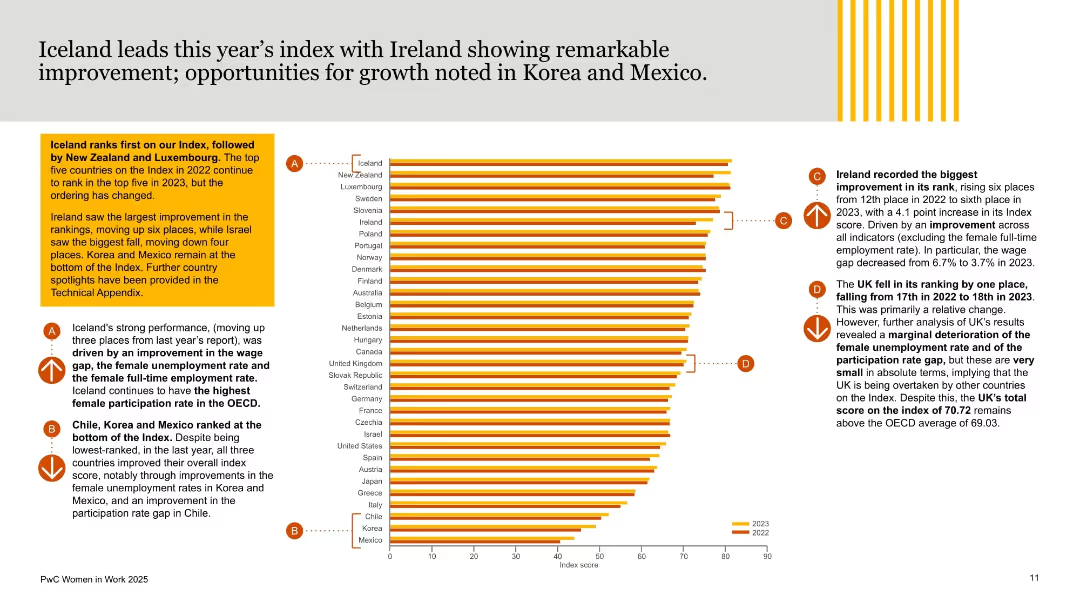
Horizontal bar chart ranked by country on the right; supporting analysis and callouts on the left; uses orange-yellow styling and comparative year-over-year visuals.
Industry Overview
Government & Public Sector
This slide ranks countries by their performance on the Women in Work Index, highlighting Iceland as a top performer and Ireland’s significant rise. It provides commentary on movements in rank, particularly improvements and setbacks, with regional insights including UK and bottom performers like Korea and Mexico.
women in work, gender equality, OECD countries, rankings, Iceland, Ireland, index score, workplace inclusion, PwC, gender performance
false
Industry Overview
Government & Public Sector
Mixed Chart
PwC/Strategy&
Add to my slides
Remove from favorites
This slide features two columns with text and three circular infographic elements on the right. The infographics display percentages and icons relevant to gender gaps in various sectors.
Industry Overview
Government & Public Sector
The slide presents data on women in leadership roles, highlighting government initiatives and the impact of COVID-19 on working women. It includes statistics on the global gender gap index.
women, leadership, COVID-19, gender gap, initiatives
false
Industry Overview
Government & Public Sector
Header Horizontal
Deloitte
Add to my slides
Remove from favorites
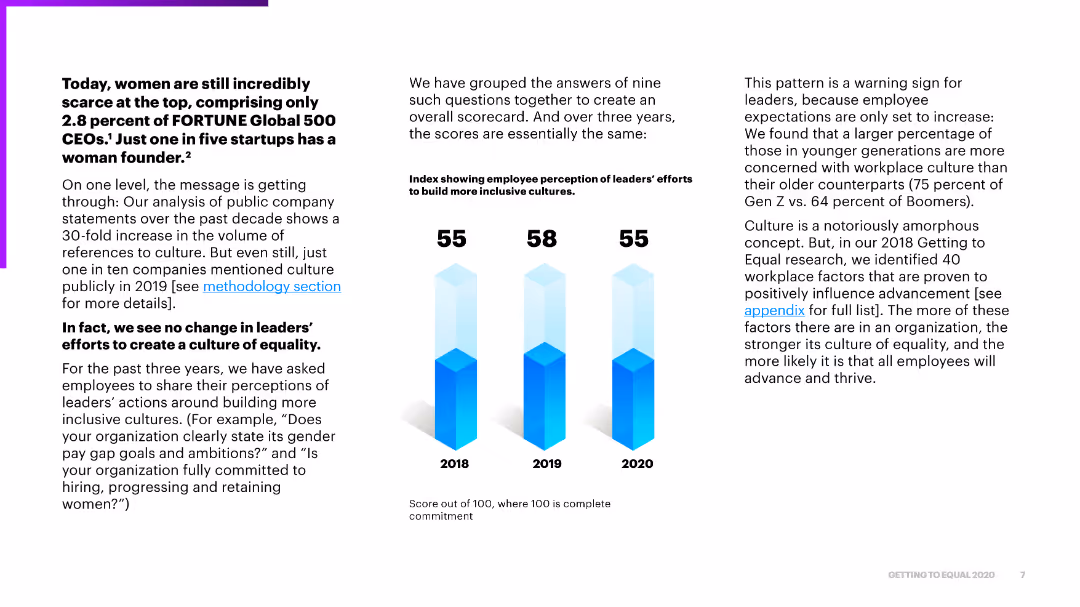
The slide features text on the left discussing the scarcity of women in leadership, with a bar chart on the right showing index scores on inclusivity efforts over three years.
Regulatory and Compliance
Government & Public Sector
The slide discusses the ongoing scarcity of women in top leadership positions and highlights the stagnant progress in leaders' efforts to build inclusive cultures over three years.
women, leadership, inclusivity, progress, analysis
false
Regulatory and Compliance
Government & Public Sector
Mixed Chart
Accenture
Add to my slides
Remove from favorites
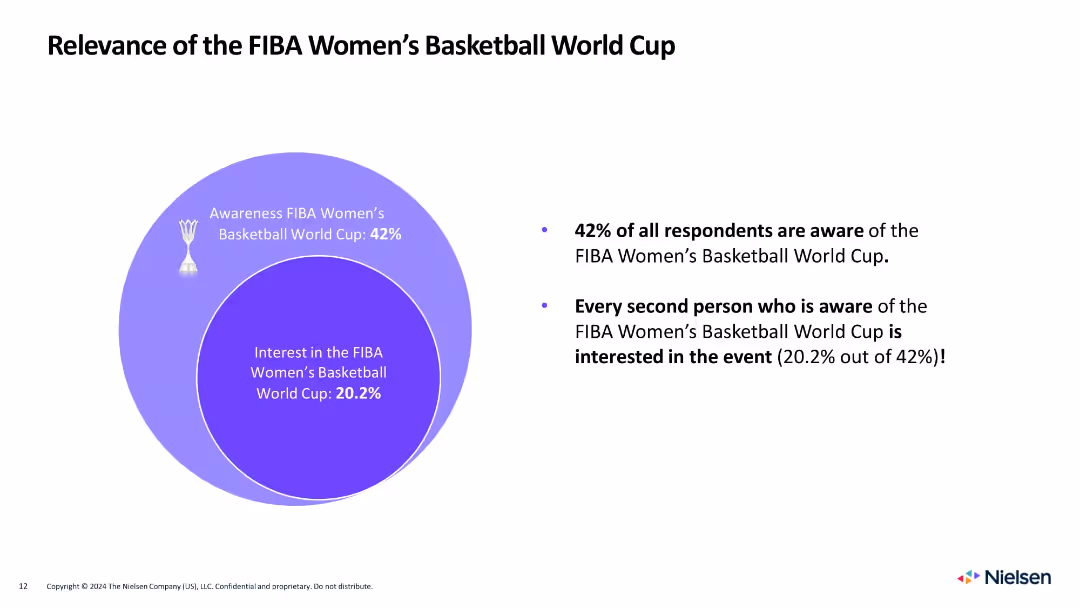
Circle diagram on left showing awareness and interest, with bulleted summary on the right
Market Analysis and Trends
Media & Entertainment
Shows that 42% are aware of the Women's World Cup, and 20.2% are interested, with half of those aware expressing engagement.
women's basketball, awareness, interest, FIBA, gender, sports engagement, fan behavior, Venn diagram, Nielsen
false
Market Analysis and Trends
Media & Entertainment
Mixed Chart
Nielsen
Add to my slides
Remove from favorites
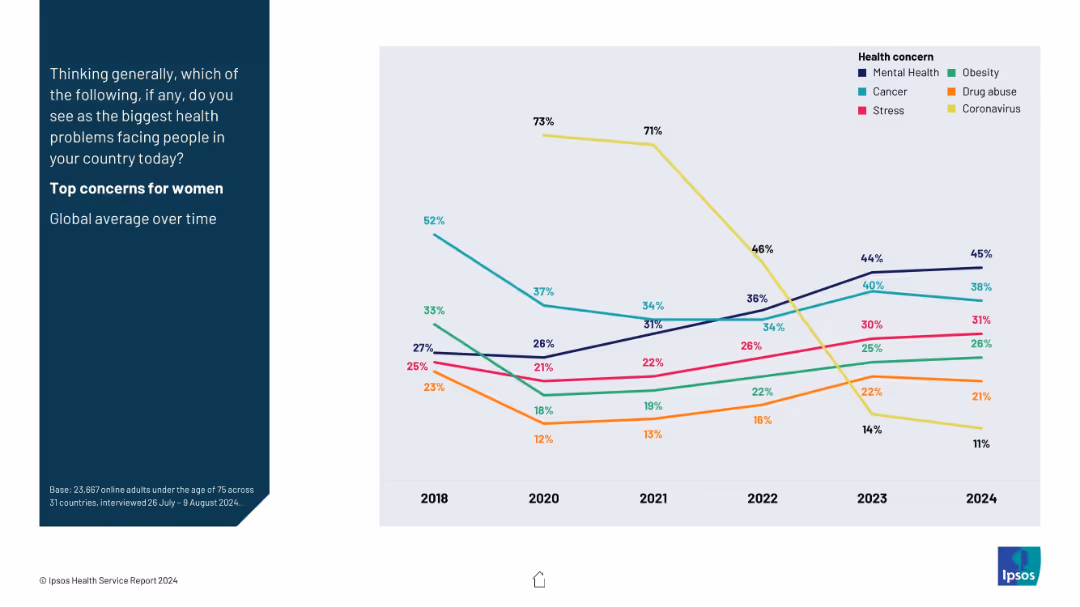
Multi-line chart showing trends in top health concerns for women from 2018 to 2024; each line represents a health issue.
Market Analysis and Trends
Healthcare & Pharmaceuticals
This slide tracks the changing health concerns for women globally, with mental health and cancer rising over time, while concern about COVID-19 has declined since 2020. It illustrates shifting public focus in women’s health.
women’s health, trend analysis, mental health, COVID decline, public opinion, health data
false
Market Analysis and Trends
Healthcare & Pharmaceuticals
Mixed Chart
IPSOS
Add to my slides
Remove from favorites
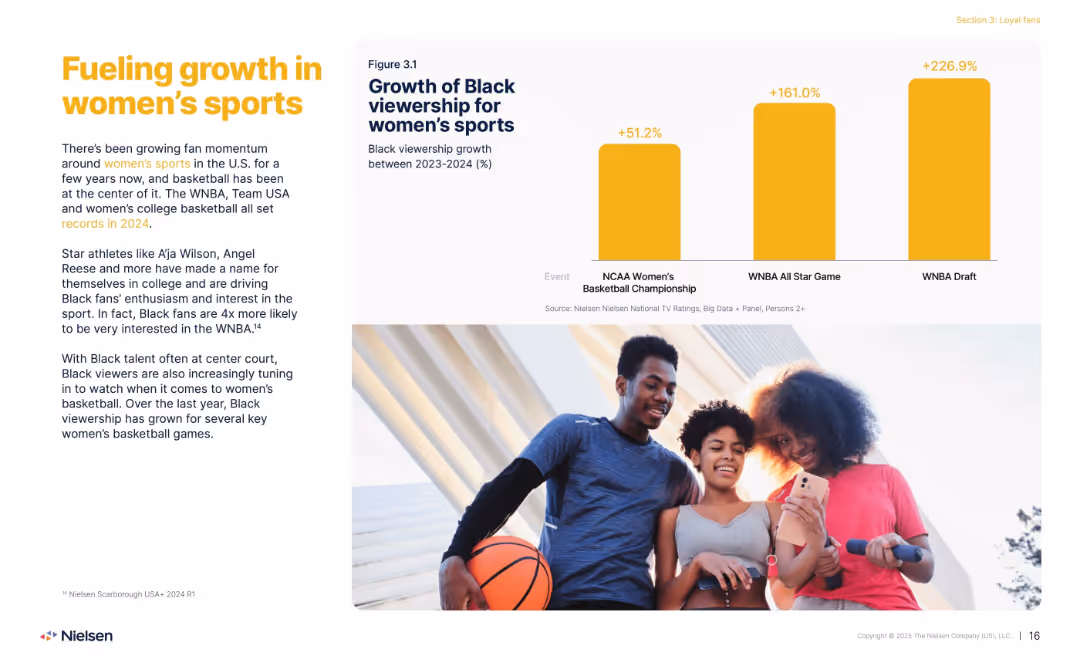
Left: text narrative; right: bar chart on Black viewership growth; bottom: sports-themed photo.
Market Analysis and Trends
Media & Entertainment
Discusses the rising interest in women’s basketball among Black viewers, citing major growth in viewership for NCAA, WNBA All-Star, and WNBA Draft events. Highlights the role of star athletes and increased visibility of Black talent in driving engagement and sports enthusiasm.
women’s sports, Black viewers, WNBA, growth, basketball
false
Market Analysis and Trends
Media & Entertainment
Mixed Chart
Nielsen
Add to my slides
Remove from favorites
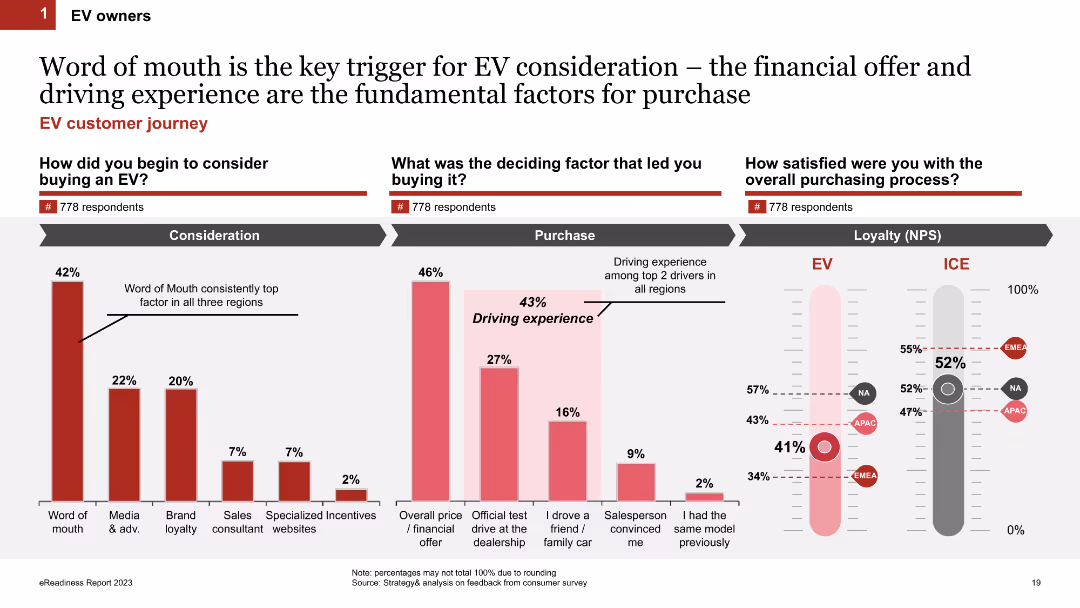
Three sections: column charts on factors triggering EV consideration, deciding factors, and satisfaction levels (NPS) comparing EV to ICE vehicle owners.
Market Analysis and Trends
Transportation & Logistics
Discusses the influence of word-of-mouth on EV purchase consideration, key decision factors, and loyalty (NPS) differences between EV and ICE vehicle owners.
word of mouth, purchase consideration, loyalty, NPS, EV owners
false
Market Analysis and Trends
Transportation & Logistics
Multiple Chart
PwC/Strategy&
Add to my slides
Remove from favorites
Image of a person using a smartphone, accompanied by text and infographics.
Customer and Market Segmentation
Retail & E-commerce
Discusses how 'word of mouth' and social media are influential during the evaluation stage of shopping.
word of mouth, social media, consumer influence, retail, shopping
false
Customer and Market Segmentation
Retail & E-commerce
Boxed
Bain
Add to my slides
Remove from favorites
Slide has multiple blocks and stacks of colored squares, each representing different aspects of work. This is complemented by text describing work architecture and optimization.
Technology and Digital Transformation
Professional Services
Outlines an analytical approach to work architecture in the context of talent optimization. Can be used for discussions on role analysis and organizational design.
Work Architecture, Talent Optimization, Analysis
false
Technology and Digital Transformation
Professional Services
Header Horizontal
Deloitte
Add to my slides
Remove from favorites
Previous
Next
You don't have any favorites yet.
Please wait loading your favorites slides...
Create a FREE account to continue browsing
Receive Instant Access to 1,000+ slides from companies like McKinsey, Google, and Goldman Sachs
First Name
Last Name
Email
Password
I agree to all
Terms & Privacy Policy
Thank you! Your submission has been received!
Oops! Something went wrong while submitting the form.
Have an account?
Sign in
Upgrade to PRO to Save slides
Advanced Search and Filters
Access to 15,000+ slides
Access to Category Pages
Save/Bookmark Slides
PowerPoint Template Library
Pick a Plan
MONTHLY
$12/month
Billed every month, Cancel anytime.
YEARLY
$9/year
Billed $108 annually, Cancel anytime.
Checkout for $12/month
Checkout for $108/yr
Secured by Stripe | AES-256 bit encryption