My Account
My Slides
Search by Category
Pricing
Templates
View All Templates
Download Template Slides
✦ AI Search
Feedback
Login
Logout
Get Started
Browse all Slides
Browse all Slides
Create a FREE Account
Instant access to 1,000+ real slides from top companies like McKinsey, BCG, Goldman Sachs, Google and many more!
First Name
Last Name
Email
Password
I agree to all
Terms & Privacy Policy
Thank you! Your submission has been received!
Oops! Something went wrong while submitting the form.
Have an account?
Sign in
Saved Slides
Total No. of slides saved
0
↻ Refresh
✖ Clear all
Text dominant layout with small pie charts in red and grey tones. There's a distinct contrast between the 'Orange World' text section and statistical data side.
Strategic Planning
Professional Services
The slide explores the move towards a more autonomous, fragmented network of operations, highlighting changes in employment structures and the rise of freelance work.
Work, Autonomy, Freelance, Employment, Opportunities
false
Strategic Planning
Professional Services
Mixed Chart
PwC/Strategy&
Add to my slides
Remove from favorites
Diagram of three interlocking circles labeled as 'The Orange World', 'The Green World', and 'The Blue World', with adjacent text descriptions.
Industry Overview
Professional Services
Showcasing three possible future scenarios of work culture: 'The Orange World' focusing on flexibility, 'The Green World' on social responsibility, and 'The Blue World' on big corporation dominance. Suited for discussions on corporate culture.
work culture, future scenarios, social responsibility, corporate dominance, flexibility, collectivism, individualism
false
Industry Overview
Professional Services
Framework
PwC/Strategy&
Add to my slides
Remove from favorites
Features a diverse group of workers holding placards, set against a simplistic backdrop with large statistics on organizational readiness and worker agency.
Human Resources and Talent Management
Professional Services
Emphasizes the importance of worker agency in organizational success and the readiness of companies to adapt to this trend.
worker agency, organizational success, readiness, diversity, adaptation, worker alignment
false
Human Resources and Talent Management
Professional Services
Multiple Chart
Deloitte
Add to my slides
Remove from favorites
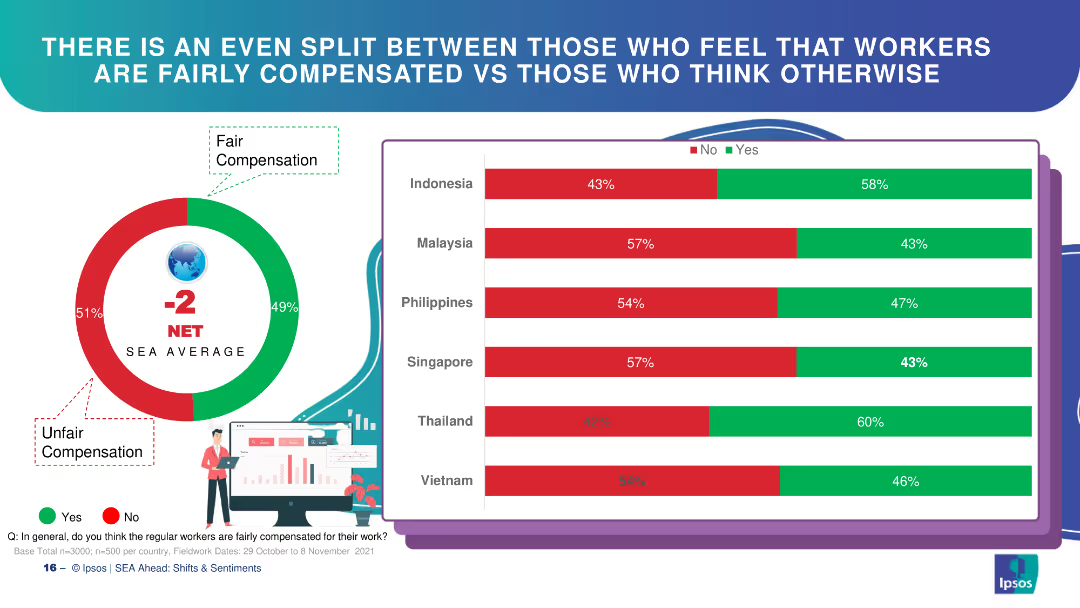
Circle chart and bar charts depicting perceptions of worker compensation fairness in SEA countries.
Market Analysis and Trends
Financial Services
The slide indicates a split perception among respondents regarding the fairness of worker compensation in SEA countries.
worker compensation, fairness, SEA, bar chart, perceptions
false
Market Analysis and Trends
Financial Services
Multiple Chart
IPSOS
Add to my slides
Remove from favorites
Circle chart and bar charts showing worker satisfaction levels across different SEA countries.
Market Analysis and Trends
Financial Services
This slide presents the levels of worker satisfaction in various SEA countries, indicating a significant portion of dissatisfaction.
worker satisfaction, SEA, circle chart, bar chart, survey
false
Market Analysis and Trends
Financial Services
Multiple Chart
IPSOS
Add to my slides
Remove from favorites
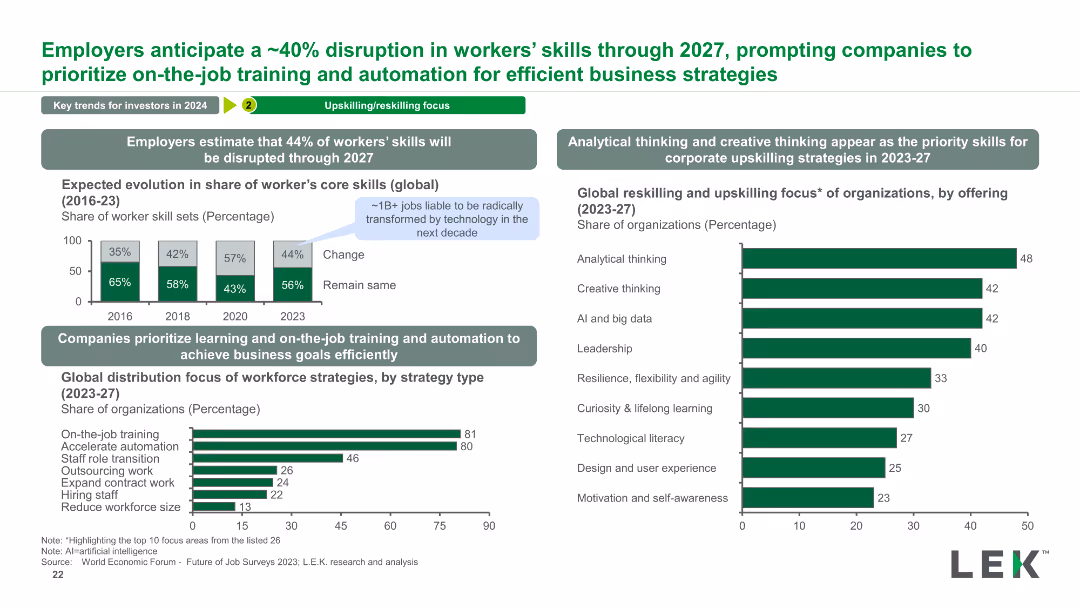
The slide contains two column charts depicting the evolution of worker skills and global reskilling focus, with detailed statistics and textual explanations.
Operational Efficiency
Education & Training
This slide shows the expected disruption in workers' skills by 2027 and emphasizes the need for on-the-job training and automation, supported by statistical data.
worker skills, disruption, reskilling, on-the-job training, automation, business strategies, global focus, workforce evolution
false
Operational Efficiency
Education & Training
Multiple Chart
LEK
Add to my slides
Remove from favorites
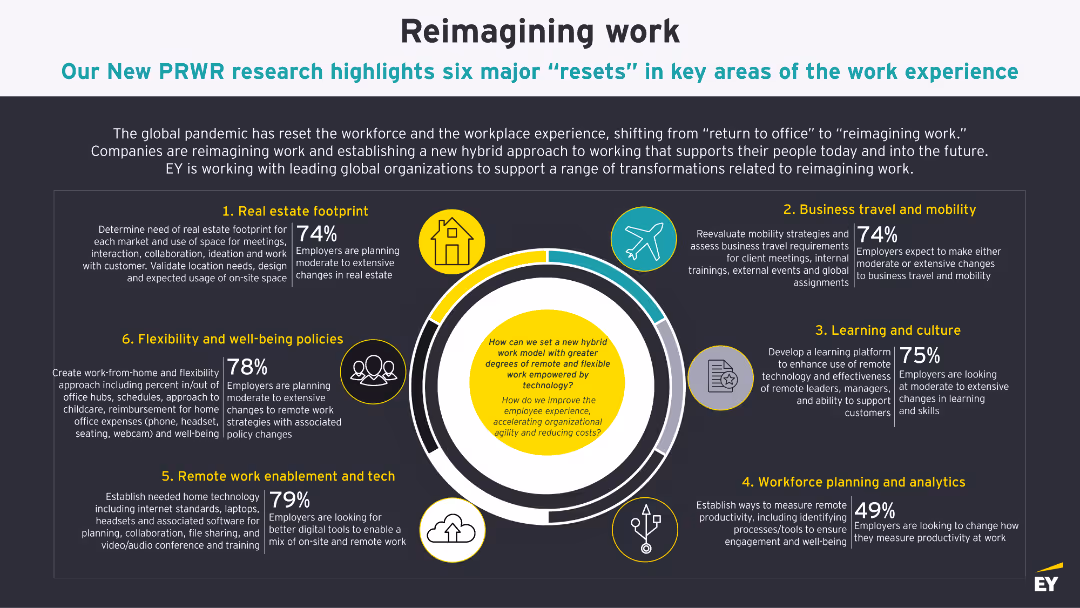
The slide presents a detailed diagram with six major resets in key areas of the work experience. Each area is illustrated with icons and supported by percentage data highlighting employer plans.
Market Analysis and Trends
Professional Services
The slide highlights six areas where employers are planning significant changes post-COVID-19, including real estate, travel, flexibility, tech enablement, learning, and workforce planning.
work, experience, resets, flexibility, planning
false
Market Analysis and Trends
Professional Services
Framework
EY
Add to my slides
Remove from favorites
This slide features a balance graphic, a donut chart, and a column chart. The left side presents preferences for work flexibility, and the right lists desired work options.
Human Resources and Talent Management
Professional Services
Explores employee preferences for flexibility in work location and hours, including preferred employer-provided work options, based on survey data.
work flexibility, employee preferences, work options, survey, employer choices
false
Human Resources and Talent Management
Professional Services
Mixed Chart
EY
Add to my slides
Remove from favorites
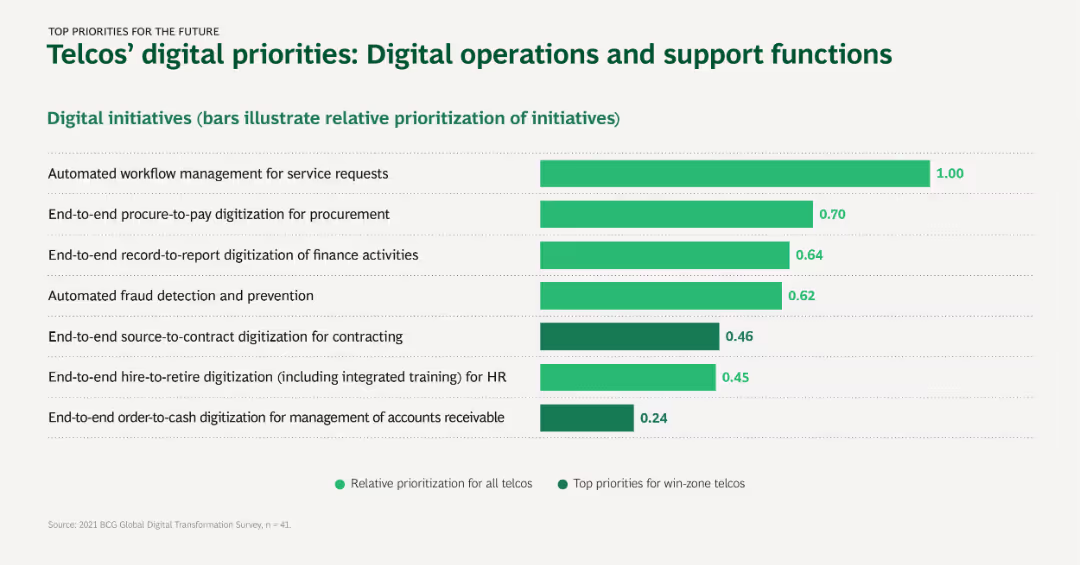
Horizontal bar chart depicting digital initiatives for improving operations and support functions, with bars showing relative prioritization and top priorities.
Operational Efficiency
Telecommunications
This slide showcases the key digital initiatives for telcos in enhancing operational efficiency and support functions, such as workflow management and fraud detection.
Workflow management, Procurement, Fraud detection, Digitization, Operational efficiency
false
Operational Efficiency
Telecommunications
Single Chart
BCG
Add to my slides
Remove from favorites
Complex slide with a flow diagram indicating the direction of decision-making across teams in a 'Nerve Center'.
Strategic Planning
Professional Services
Details the workflow and decision-making structure within a 'Nerve Center' and its application in crisis management.
workflow, strategic moves, workforce protection, supply chain, customer support, financial stabilization, decision-making
false
Strategic Planning
Professional Services
Diagram
McKinsey
Add to my slides
Remove from favorites
This slide shows two technicians at work, reflecting the use of technology in workforce agility. It includes column charts comparing today's and future states of workforce flexibility and skills management.
Human Resources and Talent Management
Industrial & Manufacturing
Discusses the role of technology in enhancing workforce agility and managing skills during disruptive events, highlighting trends in flexible contracts and skillset adaptations.
workforce agility, skills management, technology use, flexible contracts, skillset adaptation, disruption management, Accenture Research
false
Human Resources and Talent Management
Industrial & Manufacturing
Multiple Chart
Accenture
Add to my slides
Remove from favorites
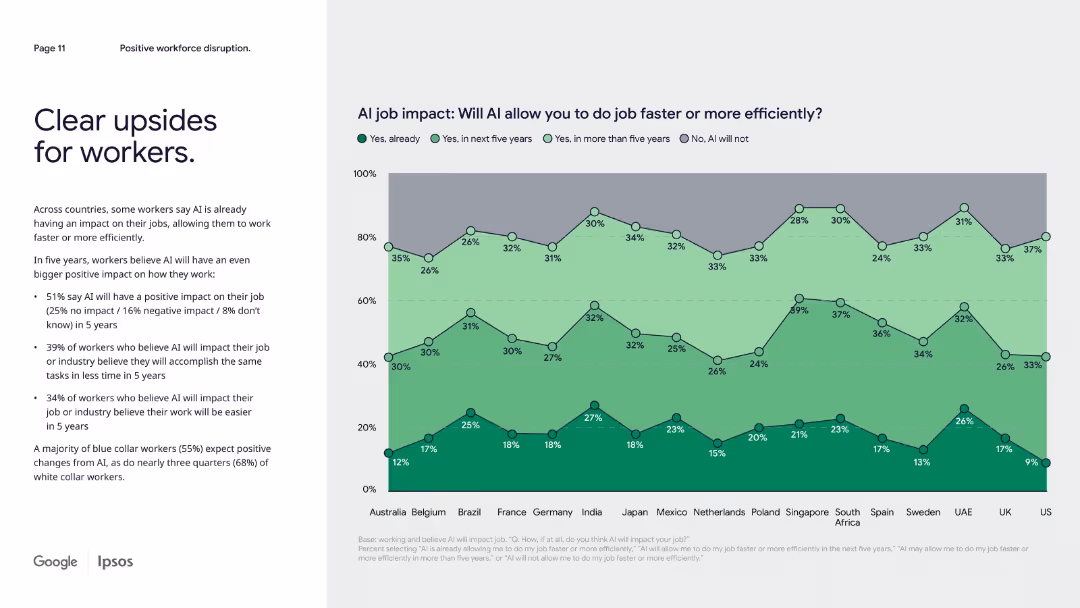
Left-aligned paragraph text with a multi-line area chart showing AI job impact predictions by country.
Operational Efficiency
Artificial Intelligence
Focused on workforce expectations, this slide shows that a majority of workers anticipate AI helping them work faster or more efficiently, particularly in the next five years. Regional breakdowns show varied levels of optimism about AI’s job impact.
workforce AI, productivity, job impact, regional trends, efficiency, optimism
false
Operational Efficiency
Artificial Intelligence
Mixed Chart
IPSOS
Add to my slides
Remove from favorites
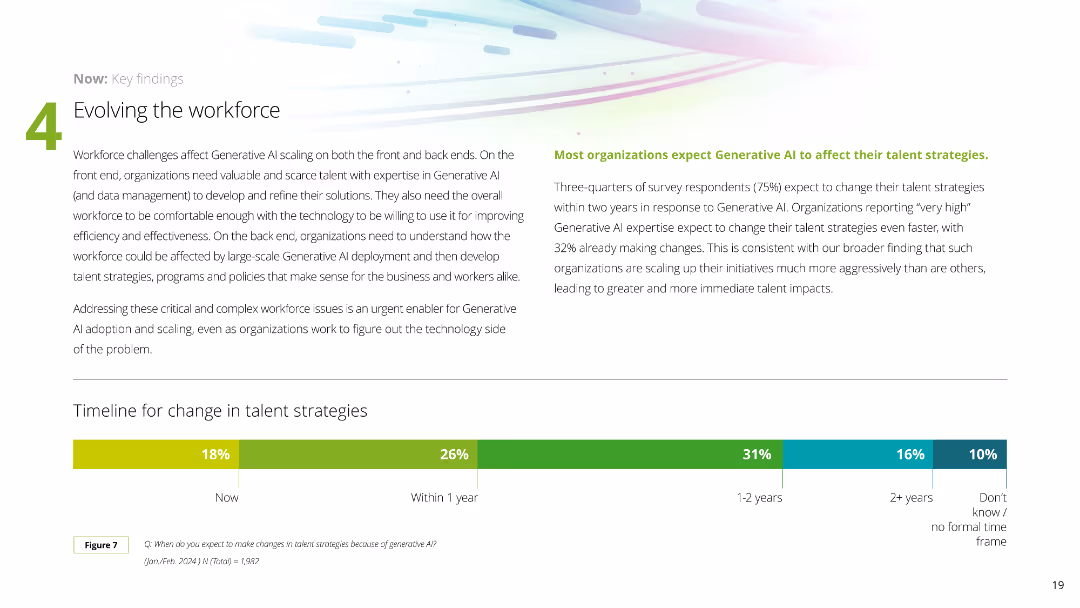
This slide features a timeline chart and supporting text to explain how workforce strategies are evolving in response to Generative AI. The design uses a clean layout with color-coded sections to indicate time frames for changes.
Human Resources and Talent Management
Technology & Software
It discusses how organizations are evolving their workforce strategies to address the challenges posed by Generative AI adoption, highlighting expected changes in talent strategies within various time frames.
workforce, AI, strategy, evolution, timeline
false
Human Resources and Talent Management
Technology & Software
Mixed Chart
Deloitte
Add to my slides
Remove from favorites
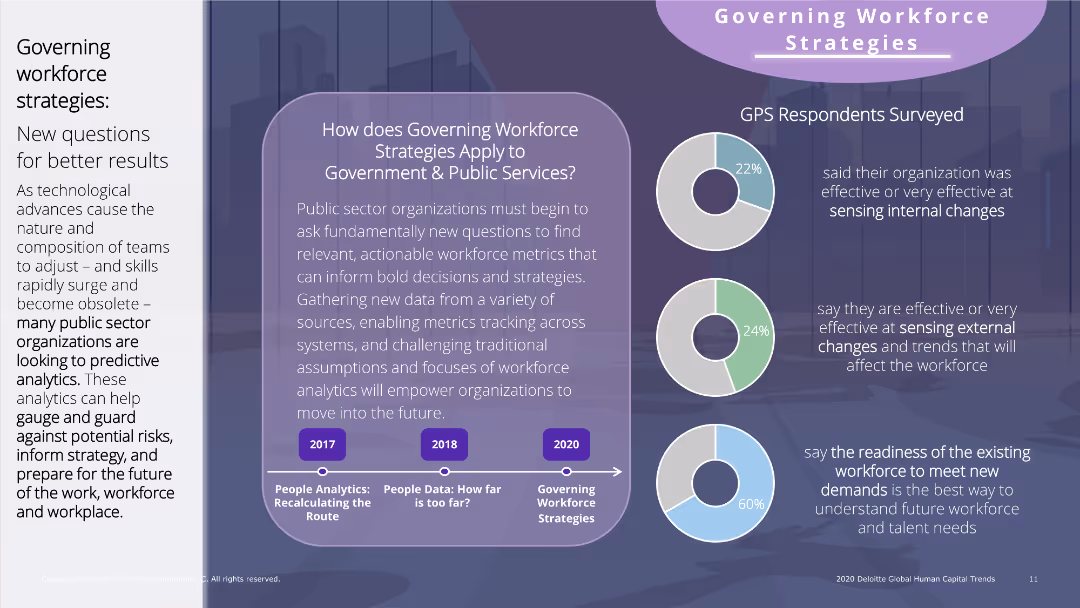
The slide uses a combination of text and pie charts, with a focus on survey results. It is moderately dense, featuring textual analysis on the left and charts on the right.
Human Resources and Talent Management
Government & Public Sector
Discusses how governing workforce strategies apply to public services, emphasizing the need for new questions to leverage predictive analytics for decision-making.
workforce, analytics, public sector, strategy, decision-making, survey results, internal changes, external changes
false
Human Resources and Talent Management
Government & Public Sector
Multiple Chart
Deloitte
Add to my slides
Remove from favorites
Slide presents a series of column charts comparing 'nuisances' and 'inducers' for France as an attractive work environment, highlighting factors like quality of life, healthcare, and taxation.
Human Resources and Talent Management
Professional Services
Discusses various factors that influence France's attractiveness for employing a foreign workforce, focusing on quality of life, healthcare access, and administrative procedures.
workforce, attractiveness, France, healthcare, quality of life
false
Human Resources and Talent Management
Professional Services
Single Chart
Bain
Add to my slides
Remove from favorites
The slide includes a set of column chart comparing the percentage of workers needing to switch occupations by 2030 across five countries: Japan, Australia, United States, Germany, and New Zealand. Each country's bar is divided into segments for additional shifts due to different adoption scenarios.
Human Resources and Talent Management
Industrial & Manufacturing
This slide provides an international perspective on the workforce shifts necessary under an early automation adoption scenario. It quantifies the proportion of the workforce that might need to transition to different occupations, serving as a basis for discussions on global labor market resilience and the need for comprehensive retraining programs.
workforce, automation, global, transition, occupations
false
Human Resources and Talent Management
Industrial & Manufacturing
Single Chart
McKinsey
Add to my slides
Remove from favorites
An organizational chart with categories like 'Retail sales-people' and 'Food and beverage service workers', alongside icons representing different workplace activities.
Strategic Planning
Technology & Software
Maps out the automation potential in various job roles, focusing on activities that can be automated and the capabilities required for each, such as social and cognitive skills.
Workforce, Automation, Job Roles, Capabilities, Skills
false
Strategic Planning
Technology & Software
Table
McKinsey
Add to my slides
Remove from favorites
This slide displays a purple bar chart comparing the share of tasks that can be reinvented by technology across various industries. The layout is split into two columns, with the left showing the percentage of tasks and the right depicting the share of worked hours in 2021.
Strategic Planning
Professional Services
It analyzes the potential for technology-driven job reinvention across industries, presenting augmentation and automation prospects. This slide could be used to discuss workforce transformation trends and the impact of technology on employment across different sectors.
Workforce, Automation, Technology, Job Reinvention, Industry Comparison, Augmentation, Employment Trends, 2021, US Workers, Technology Impact
false
Strategic Planning
Professional Services
Single Chart
Accenture
Add to my slides
Remove from favorites
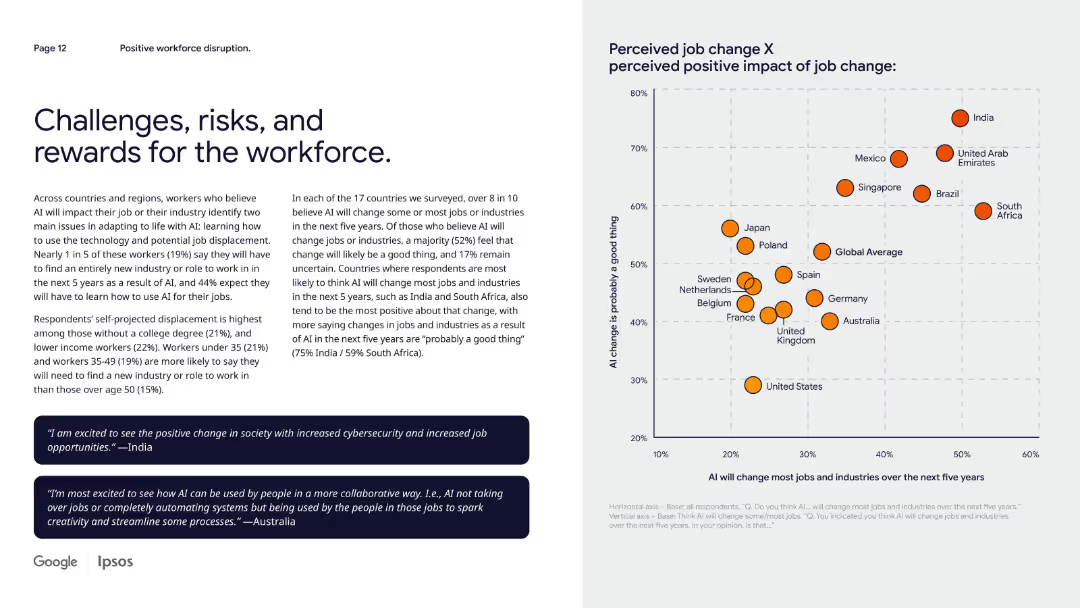
Left-side narrative with two quote boxes and a scatter plot on right mapping perceived job changes vs benefits.
Risk Assessment and Management
Artificial Intelligence
The slide examines perceived job displacement risks due to AI and contrasts it with perceived opportunity. While many expect change, responses vary on whether it’s good. Countries like India and South Africa are most optimistic about AI-driven workforce changes.
workforce change, AI displacement, job opportunity, global perception, future risk
false
Risk Assessment and Management
Artificial Intelligence
Mixed Chart
IPSOS
Add to my slides
Remove from favorites
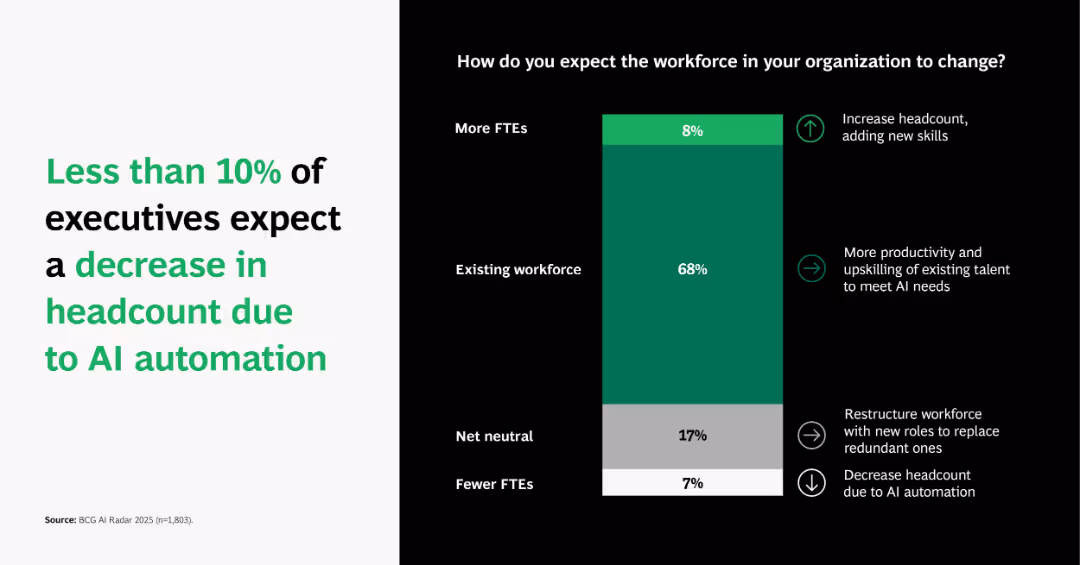
Vertical stacked bar showing workforce impact expectations (more, same, fewer FTEs) and reasons (e.g., upskilling, restructuring).
Human Resources and Talent Management
Artificial Intelligence
Depicts that most executives anticipate productivity gains and upskilling from AI rather than job losses. Only 7% foresee reduced headcount, indicating confidence in AI’s augmentative role in workforce transformation.
workforce change, AI impact, employment trends, upskilling, FTE
false
Human Resources and Talent Management
Artificial Intelligence
Single Chart
BCG
Add to my slides
Remove from favorites
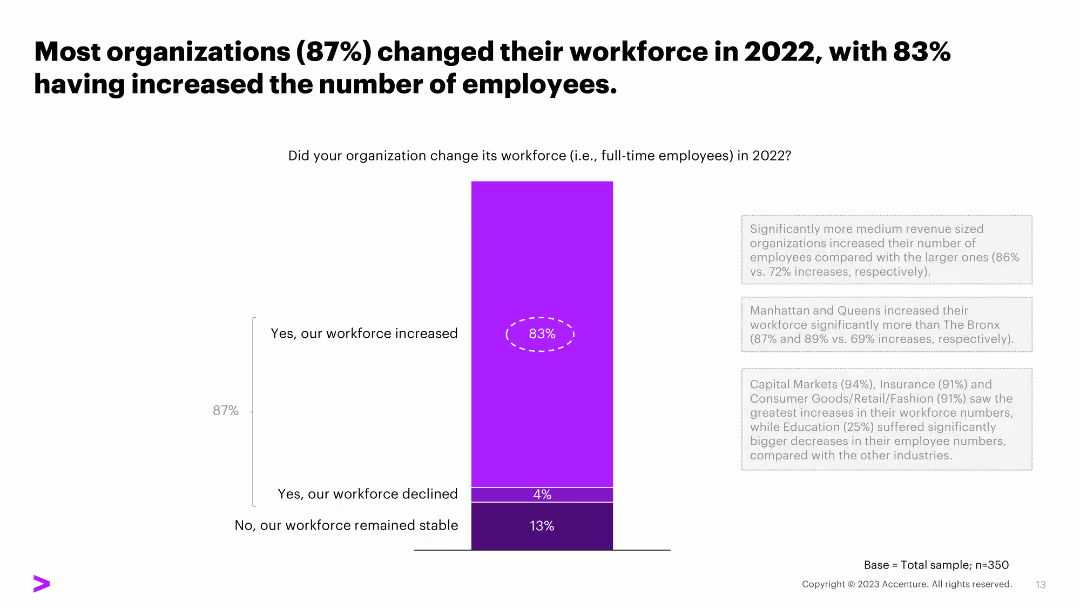
The slide features a column chart showing the percentage of organizations that changed their workforce in 2022. The layout includes text and visual elements in a dense format.
Human Resources and Talent Management
Professional Services
Details the percentage of organizations that increased, decreased, or maintained their workforce in 2022.
workforce, changes, employees, increase, decrease, stability
false
Human Resources and Talent Management
Professional Services
Mixed Chart
Accenture
Add to my slides
Remove from favorites
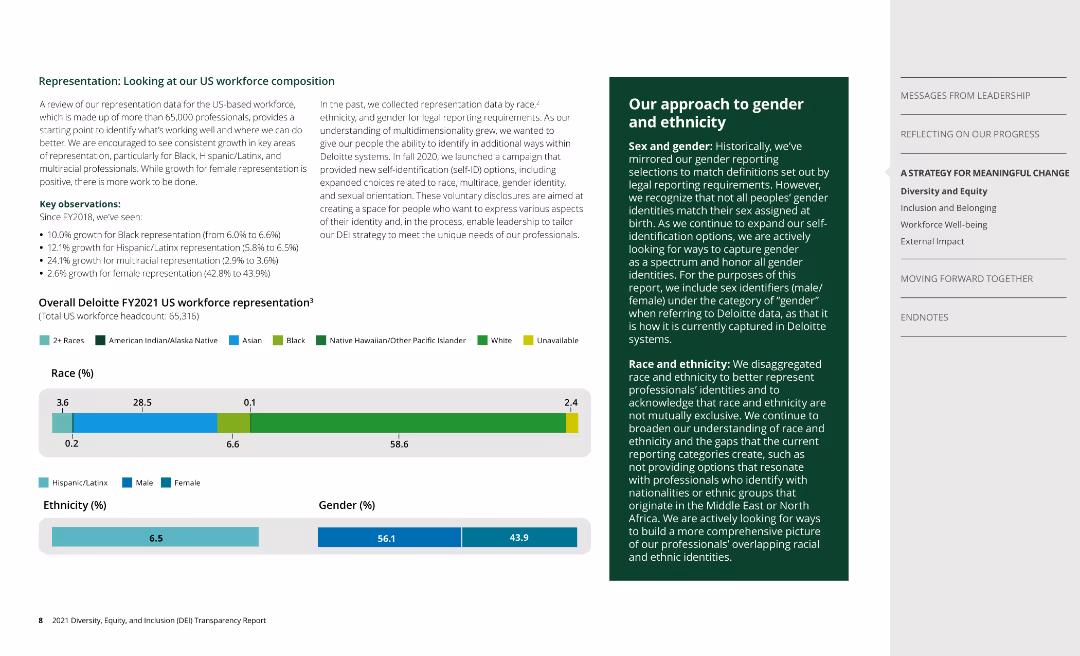
This slide includes bar charts depicting the racial, ethnic, and gender composition of the US workforce, with additional text explaining key observations and the company's approach to gender and ethnicity.
Human Resources and Talent Management
Professional Services
The slide analyzes the representation of various demographics within the US workforce, detailing racial, ethnic, and gender distribution, and outlines the company's efforts to broaden understanding and inclusivity through expanded self-ID options.
Workforce composition, diversity, gender, ethnicity, representation
false
Human Resources and Talent Management
Professional Services
Multiple Chart
Deloitte
Add to my slides
Remove from favorites
The slide features pie charts on global gender data and U.S. race/ethnicity, with captions and percentages. It is clean with a balanced mix of text and visuals.
Human Resources and Talent Management
Financial Services
Details the gender and racial composition of the workforce, providing insights into the diversity and inclusion efforts of the company.
Workforce Composition, Gender Data, Race/Ethnicity, Diversity, Inclusion
false
Human Resources and Talent Management
Financial Services
Multiple Chart
JP Morgan
Add to my slides
Remove from favorites
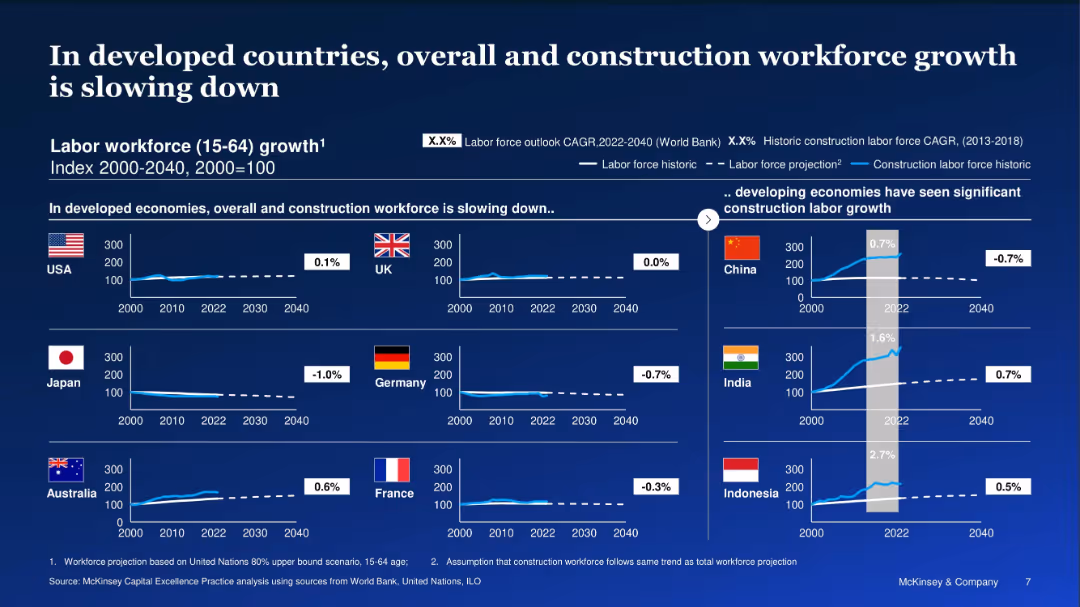
Small charts for each country, segmented into developed and developing economies
Human Resources and Talent Management
Real Estate & Construction
Labor force projections show stagnation or decline in developed economies’ construction workforce, while developing economies like India and Indonesia show growth. The slide emphasizes demographic and regional labor force trends.
workforce, construction, labor growth, developed vs. developing, CAGR
false
Human Resources and Talent Management
Real Estate & Construction
Multiple Chart
McKinsey
Add to my slides
Remove from favorites
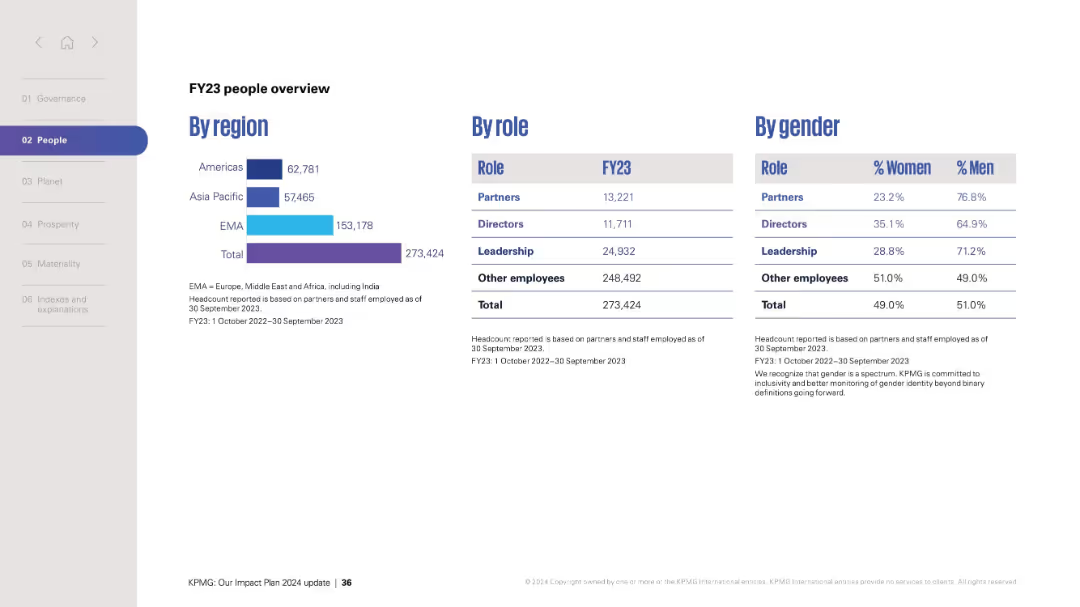
Split layout: left has bar chart by region, center table by role, right table by gender. Light grey and blue palette, clean presentation.
Human Resources and Talent Management
Professional Services
Provides headcount data by region, role, and gender for FY23, highlighting gender representation and workforce distribution across global KPMG operations.
workforce data, FY23, gender diversity, headcount, region, roles
false
Human Resources and Talent Management
Professional Services
Mixed Chart
KPMG
Add to my slides
Remove from favorites
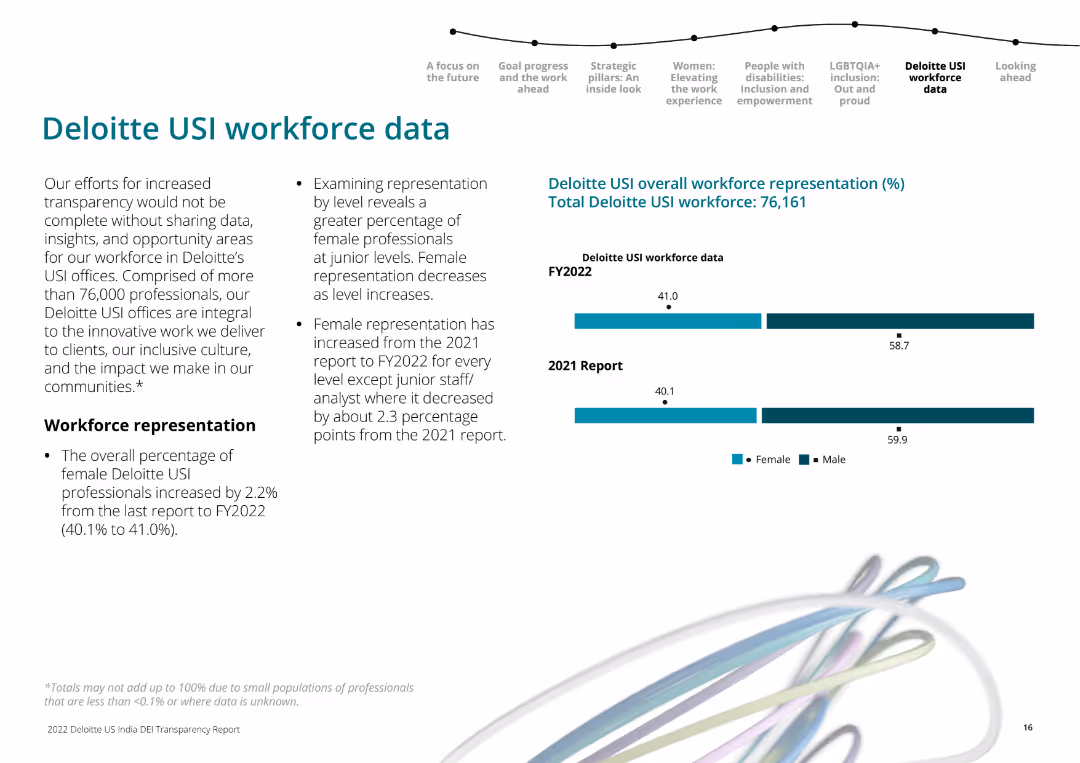
The slide includes textual information on the left about Deloitte USI workforce representation. On the right, there are horizontal bar charts comparing female and male workforce representation in 2021 and 2022.
Human Resources and Talent Management
Professional Services
Presents Deloitte USI’s workforce representation data, emphasizing the increase in female representation across most levels from 2021 to 2022.
workforce data, gender representation, Deloitte USI, 2022, 2021
false
Human Resources and Talent Management
Professional Services
Mixed Chart
Deloitte
Add to my slides
Remove from favorites
Includes detailed demographic data of the survey respondents, presented in a series of charts and graphs that cover aspects such as gender distribution, age groups, and industry sectors.
Industry Overview
Government & Public Sector
Summarizes the demographic characteristics of participants in the PwC survey, providing insights into the composition of the workforce across various industries and demographic groups. This data is essential for understanding the context of the survey results and tailoring future policies and practices to these diverse groups.
workforce demographics, industry distribution, age groups, gender ratio
false
Industry Overview
Government & Public Sector
Multiple Chart
PwC/Strategy&
Add to my slides
Remove from favorites
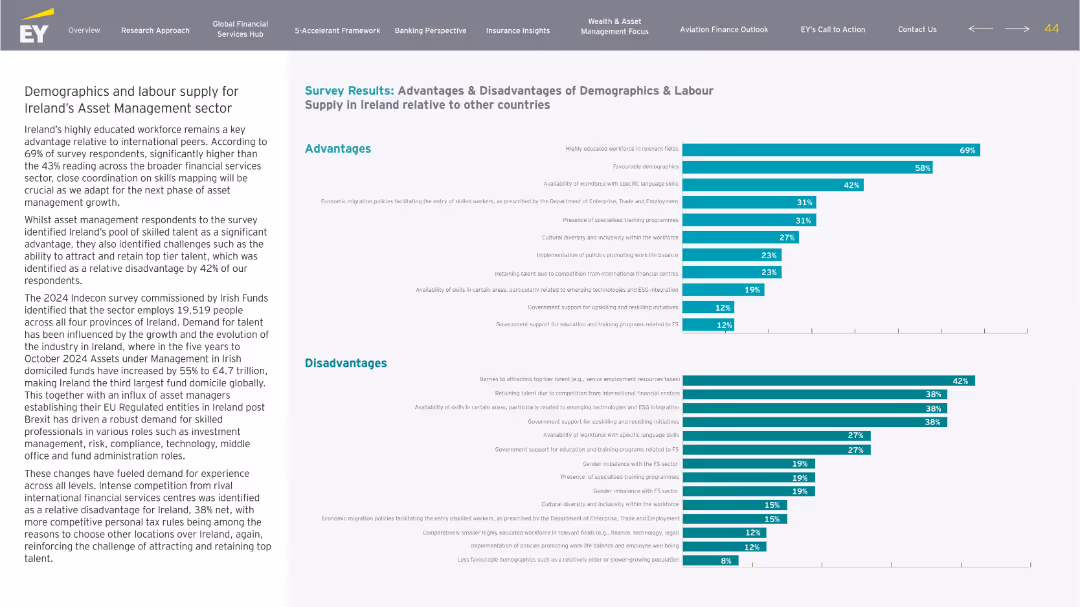
Bar charts for advantages and disadvantages, accompanied by detailed narrative on the left. Clear layout with teal and grey palette.
Market Analysis and Trends
Financial Services
This slide focuses on Ireland’s labor market advantages (educated workforce, demographics) and disadvantages (retaining talent, competition), supported by survey data and commentary on employment trends and policy.
workforce, demographics, Ireland, labour supply, employment, asset management
false
Market Analysis and Trends
Financial Services
Multiple Chart
EY
Add to my slides
Remove from favorites
Features multiple bar charts representing demographics of a workforce survey, including employment status, age, and education levels.
Industry Overview
Professional Services
Presents demographic data of a large survey of highly skilled workers across three regions, useful for HR and market analysis.
workforce demographics, survey data, skilled workers, employment status, education level, age distribution, HR analytics
false
Industry Overview
Professional Services
Multiple Chart
Accenture
Add to my slides
Remove from favorites
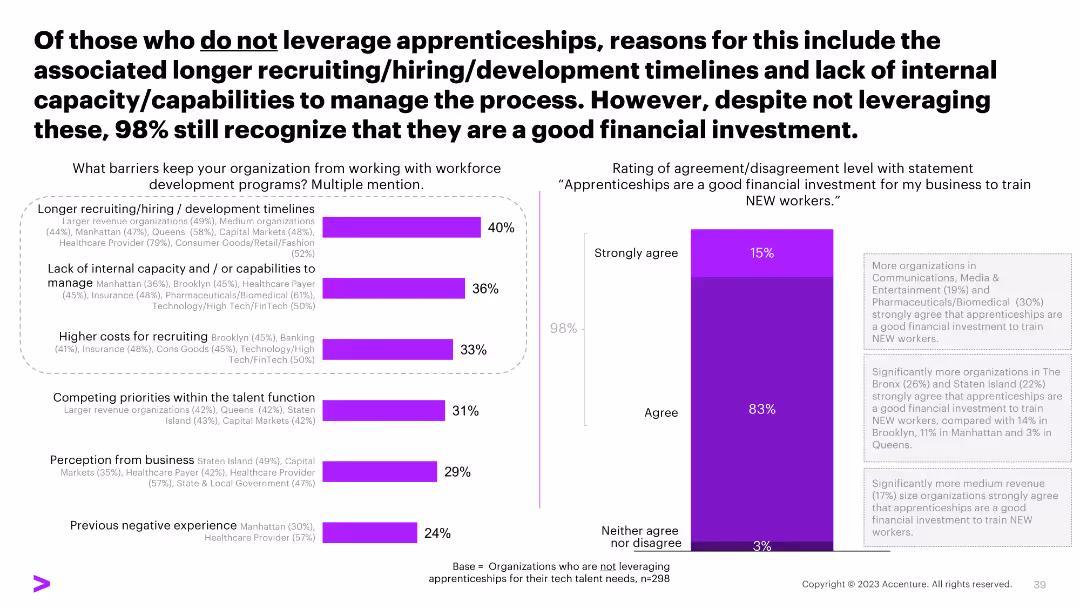
The slide features a horizontal bar chart listing the barriers to workforce development, including longer recruiting timelines and higher recruiting costs. Another vertical column chart indicates the level of agreement with the financial value of apprenticeships.
Human Resources and Talent Management
Professional Services
The slide identifies major barriers to workforce development such as longer recruiting timelines and higher costs. Despite these challenges, a high percentage of organizations recognize the financial value of apprenticeships.
workforce development, barriers, recruiting, costs, financial value
false
Human Resources and Talent Management
Professional Services
Multiple Chart
Accenture
Add to my slides
Remove from favorites
Slide depicts individuals in various activities, signifying diverse employment models. Includes circular statistics and is colored in warm red and orange tones.
Strategic Planning
Professional Services
Discusses the shift towards flexible employment models and the readiness of businesses to lead an inclusive workforce.
workforce ecosystem, employment models, business readiness, workforce inclusivity, leadership
false
Strategic Planning
Professional Services
Multiple Chart
Deloitte
Add to my slides
Remove from favorites
The slide includes bar charts and lists. Charts compare the top drivers for optimizing the workforce ecosystem, types of workers used by organizations, and key outcomes from implementing these strategies. The colors differentiate data between Ukraine and Global.
Human Resources and Talent Management
Professional Services
This slide analyzes the drivers and outcomes of optimizing the workforce ecosystem. It compares traditional employment structures to more flexible, skill-based arrangements, discussing the prevalence of freelancers, contractors, and outsourced teams, especially contrasting usage rates in Ukraine versus globally. It also discusses the resultant business outcomes like increased retention.
Workforce, Ecosystem, Flexibility, Skills, Global
false
Human Resources and Talent Management
Professional Services
Mixed Chart
Deloitte
Add to my slides
Remove from favorites
Includes a bar graph comparing employment roles in "FIGURE 4", bulleted text, and detailed analysis on the right side concerning work roles in the US.
Market Analysis and Trends
Technology & Software
The slide examines the redistribution of work roles in the United States from 2017 to 2028, highlighting the major increase in workers required in 'Empathy and Support' roles over the next 10 years.
Workforce, Empathy, Support, USA, Redistribution
false
Market Analysis and Trends
Technology & Software
Mixed Chart
Accenture
Add to my slides
Remove from favorites
The slide contains several data blocks with statistics on employer and workforce sentiments regarding returning to work post-pandemic. It includes bar charts and text descriptions to explain the trends.
Market Analysis and Trends
Professional Services
The slide examines trends in workforce and employer sentiments about returning to work after the pandemic. It highlights key statistics, such as the percentage of CEOs expecting remote work to continue and workers' preferences for remote work. This data is critical for planning future workplace strategies and policies.
Workforce, Employer Sentiment, Remote Work, Trends, Statistics
false
Market Analysis and Trends
Professional Services
Mixed Chart
Deloitte
Add to my slides
Remove from favorites
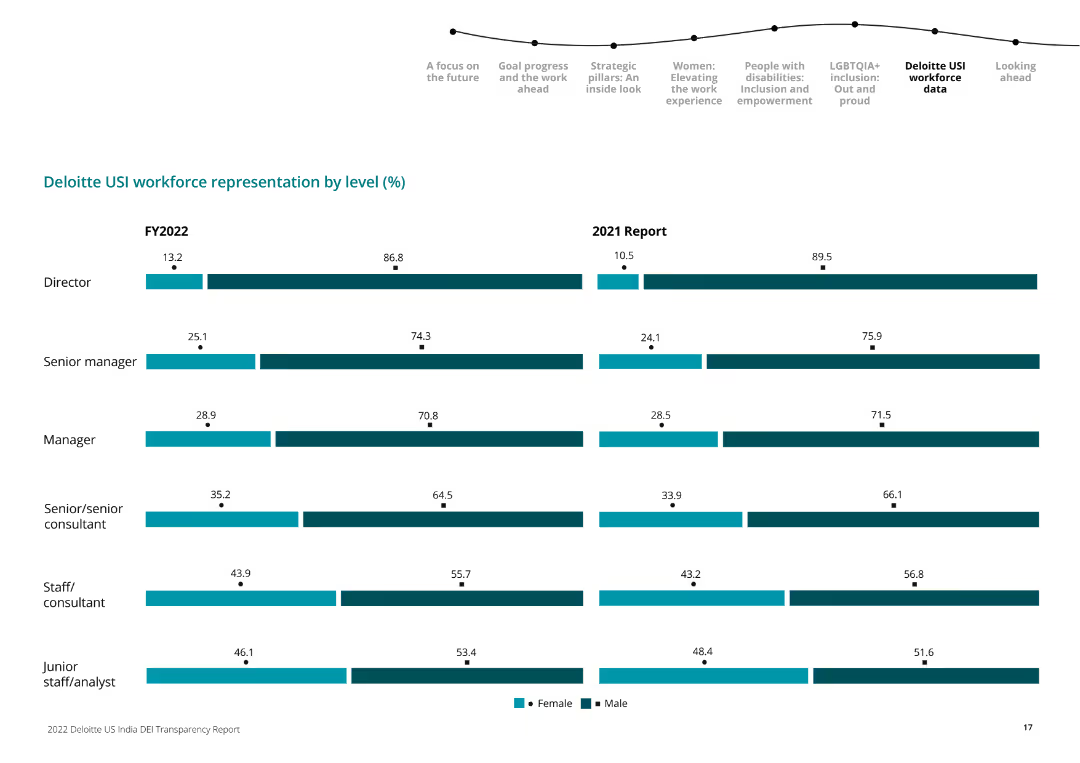
The slide features horizontal bar charts showing male and female workforce representation at various levels for FY2022 and 2021.
Human Resources and Talent Management
Professional Services
This slide compares the gender distribution of Deloitte USI's workforce across different levels from junior staff to director between FY2022 and 2021.
workforce, gender representation, Deloitte, levels, comparison, FY2022, FY2021, bar chart
false
Human Resources and Talent Management
Professional Services
Multiple Chart
Deloitte
Add to my slides
Remove from favorites
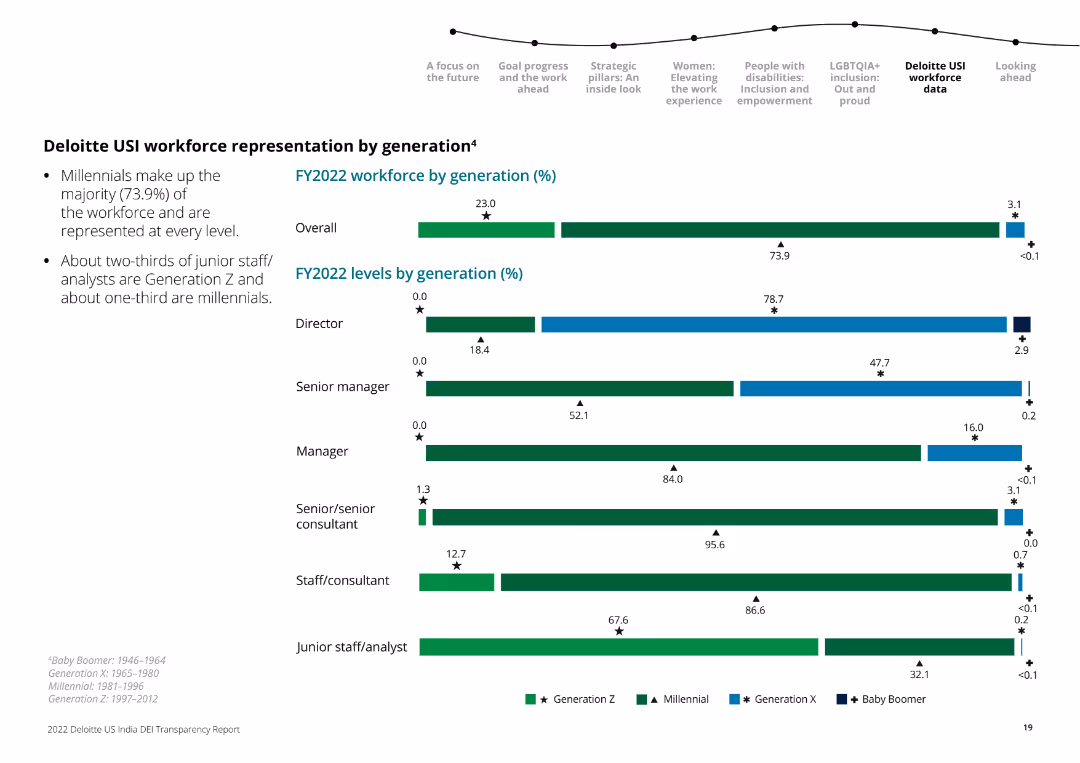
The slide presents horizontal bar charts depicting workforce distribution across generations (Gen Z, Millennials, Gen X, Baby Boomers) in FY2022.
Human Resources and Talent Management
Professional Services
The slide details the generational composition of Deloitte USI's workforce at various organizational levels in FY2022.
workforce, generation, Deloitte, distribution, FY2022, generational analysis, bar chart
false
Human Resources and Talent Management
Professional Services
Multiple Chart
Deloitte
Add to my slides
Remove from favorites
The slide includes a horizontal bar chart showing the percentage of workforce with access to approved Generative AI tools. The bars are color-coded by levels of expertise, ranging from little to very high expertise.
Human Resources and Talent Management
Technology & Software
It examines the extent to which organizations are providing their workforce with access to approved Generative AI tools, highlighting disparities based on expertise levels and workforce penetration rates.
workforce, Generative AI, access, expertise, tools
false
Human Resources and Talent Management
Technology & Software
Mixed Chart
Deloitte
Add to my slides
Remove from favorites
This slide features a series of column charts comparing challenges faced by German and Global organizations in preparing their workforce for Industry 4.0. The graphs illustrate disparities in skillset mismatches, attraction and retention of skilled talent, and the lack of necessary training programs.
Human Resources and Talent Management
Education & Training
Analyzes challenges in workforce development for Industry 4.0, showing German executives' perspectives versus global trends in skill mismatches, talent attraction, retention, and training initiatives.
Workforce, Industry 4.0, Talent, Training, Skills, Germany, Global, Challenges
false
Human Resources and Talent Management
Education & Training
Multiple Chart
Deloitte
Add to my slides
Remove from favorites
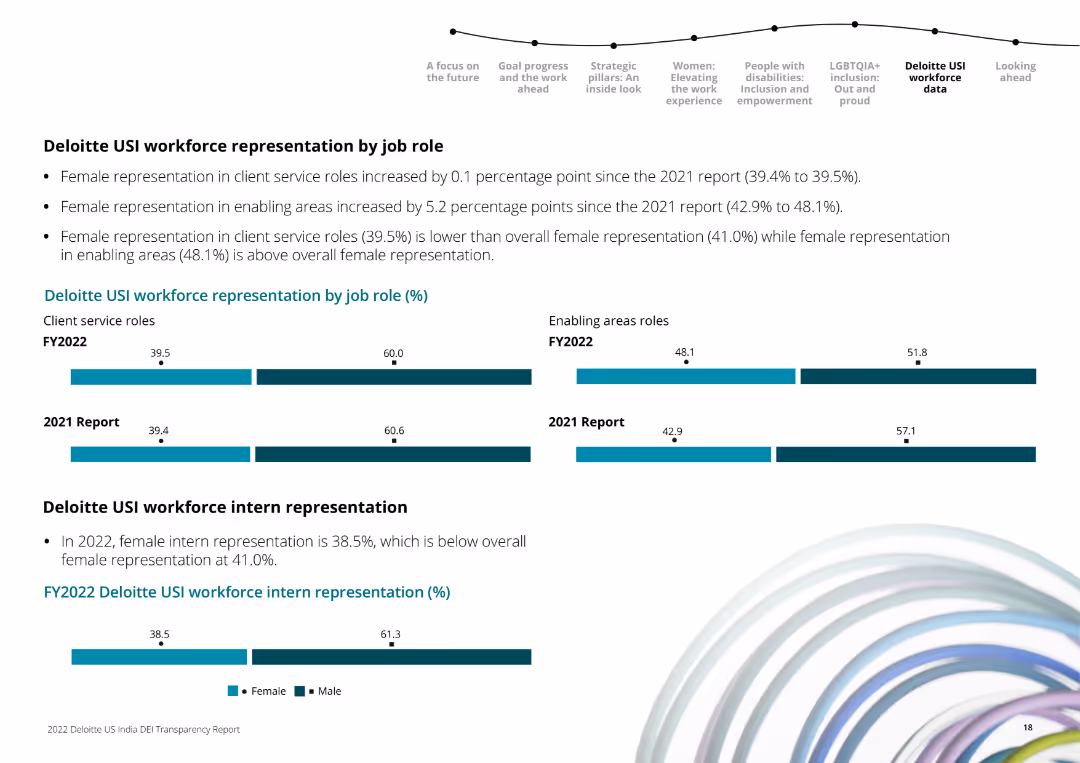
Horizontal bar charts comparing male and female workforce representation in client service and enabling roles for FY2022 and 2021.
Human Resources and Talent Management
Professional Services
It shows the percentage of female and male employees in different job roles and highlights changes in representation from the previous year.
workforce, job roles, gender, Deloitte, comparison, FY2022, FY2021, bar chart
false
Human Resources and Talent Management
Professional Services
Multiple Chart
Deloitte
Add to my slides
Remove from favorites
Contains tables, bar graphs, and a flowchart to discuss dynamic workforce adjustments, visually representing demand versus supply of staff functions over time with color-coded bars.
Human Resources and Talent Management
Professional Services
Analyzes workforce management strategies, managing capacity gaps, and adjusting capacity through measures like vacations, furloughs, or automation, with emphasis on proactive management.
Workforce management, Staff planning, Surplus management, Automation
false
Human Resources and Talent Management
Professional Services
Header Vertical
BCG
Add to my slides
Remove from favorites
The slide presents three columns of bullet points with corresponding icons and a pie chart representing geographic distribution of employees. Each column has a different green header highlighting workforce, daily operations, and operational excellence, with a mix of bar charts and infographics.
Operational Efficiency
Financial Services
This slide outlines the IT landscape of Northern Trust, emphasizing the global workforce, daily operations like payments processed and security events, and the achievements in operational excellence including reliability and management of hardware and software. Designed to provide a snapshot of the company's technological capabilities and operational metrics.
Workforce, Payments, Security, Reliability, Management
false
Operational Efficiency
Financial Services
Mixed Chart
Morgan Stanley
Add to my slides
Remove from favorites
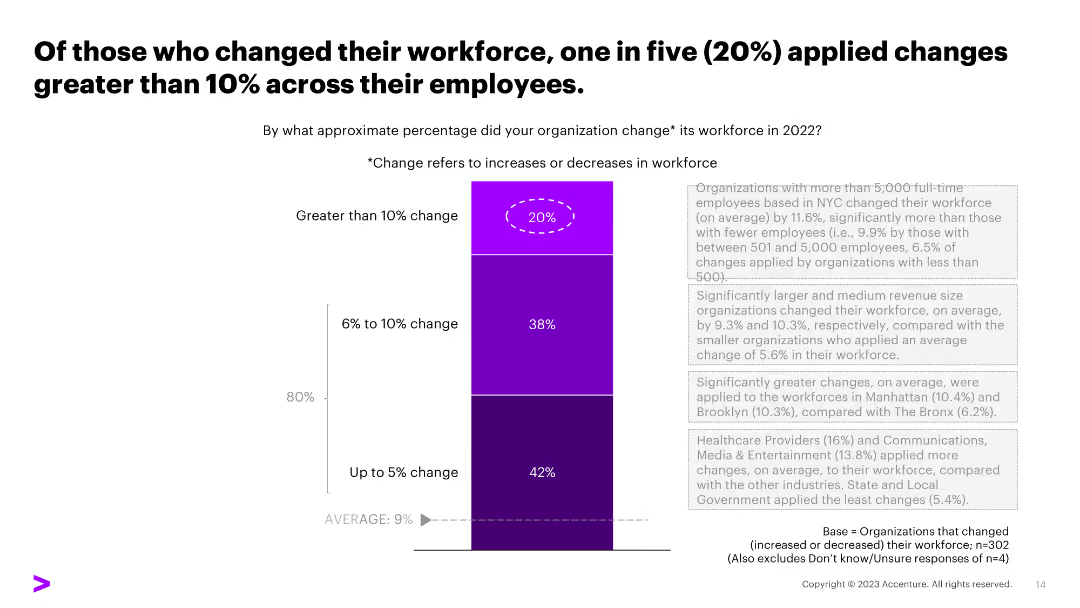
The slide contains a stacked column chart indicating percentage changes in workforce across organizations. The design is moderately dense with text and visual elements.
Human Resources and Talent Management
Professional Services
Analyzes the extent of workforce changes in 2022, highlighting those with greater than 10% changes.
workforce, percentage change, employees, increase, decrease, stability
false
Human Resources and Talent Management
Professional Services
Mixed Chart
Accenture
Add to my slides
Remove from favorites
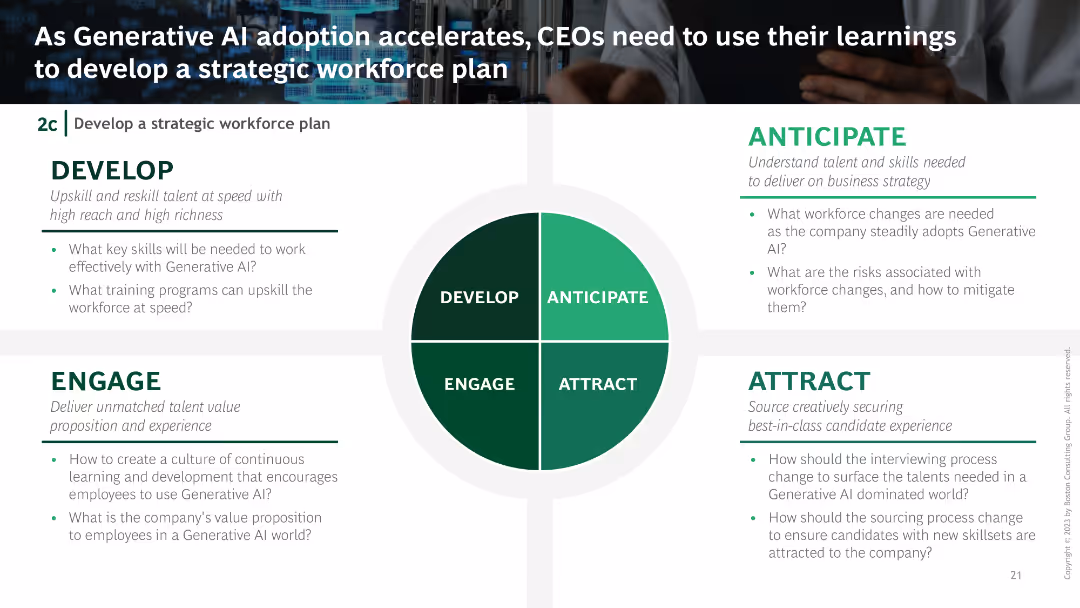
A circular diagram in the center dividing the process into four quadrants: Develop, Engage, Anticipate, and Attract, with descriptive text around the circle.
Strategic Planning
Technology & Software
Provides a strategic workforce plan framework for CEOs to follow as they integrate generative AI into their companies, focusing on development, engagement, anticipation, and attraction.
workforce planning, AI integration, strategic planning, CEO, engagement
false
Strategic Planning
Technology & Software
Framework
BCG
Add to my slides
Remove from favorites
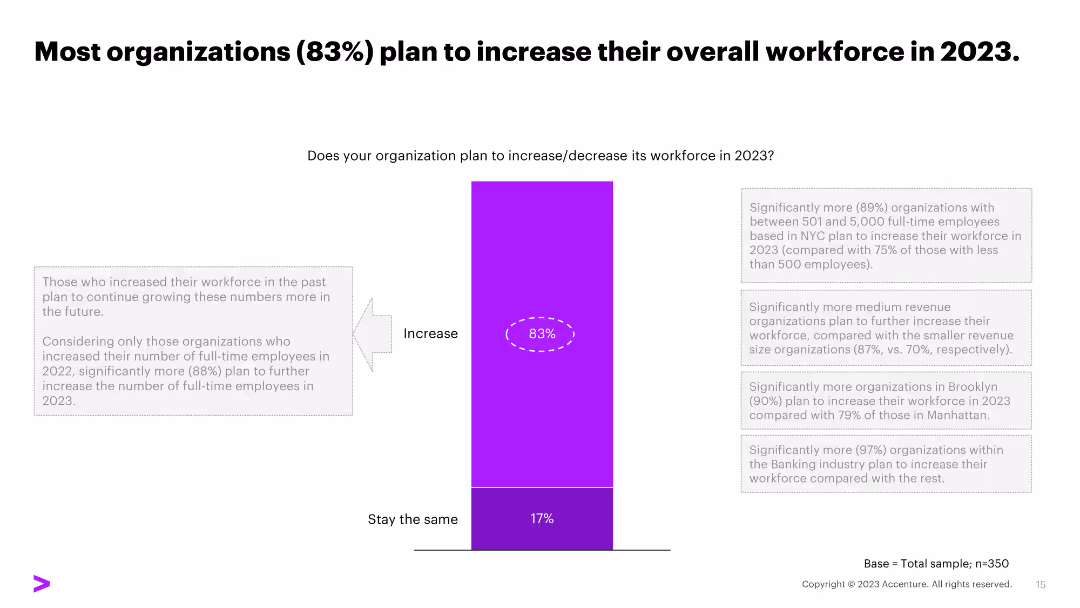
A slide with a title and a column chart showing the percentage of organizations planning to increase, decrease, or maintain their workforce in 2023.
Strategic Planning
Professional Services
Most organizations (83%) plan to increase their workforce in 2023, with insights into the trends among organizations with varying employee sizes and revenue.
workforce, plans, 2023, increase, organizations
false
Strategic Planning
Professional Services
Mixed Chart
Accenture
Add to my slides
Remove from favorites
This slide has three bar charts illustrating the expected impact of Generative AI on workforce productivity, cost savings, and productivity enhancements across front and back office functions. Additional details are provided below the charts.
Operational Efficiency
Financial Services
The slide discusses the expected workforce impacts and productivity enhancements from GenAI implementation. It presents data on front and back office impacts, including productivity gains and cost savings.
workforce, productivity, cost savings, GenAI, front office, back office, survey, financial services
false
Operational Efficiency
Financial Services
Multiple Chart
EY
Add to my slides
Remove from favorites
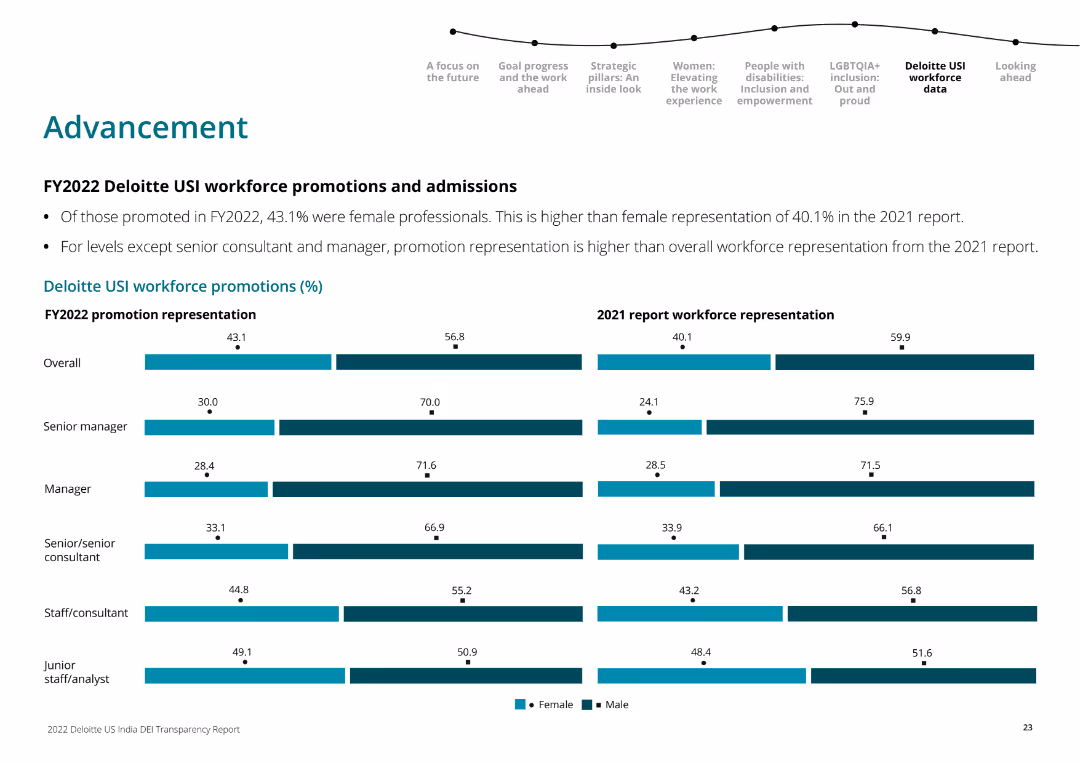
Horizontal bar charts comparing workforce promotion representation by gender across different levels for FY2022 and 2021.
Human Resources and Talent Management
Professional Services
This slide compares gender distribution in promotions at Deloitte USI for various organizational levels between FY2022 and the 2021 report.
workforce, promotions, gender, Deloitte, comparison, FY2022, FY2021, bar chart
false
Human Resources and Talent Management
Professional Services
Multiple Chart
Deloitte
Add to my slides
Remove from favorites
Contains column charts showcasing France's strengths and weaknesses in workforce qualification and cost compared to other European countries.
Operational Efficiency
Professional Services
Analyzes how France stands in terms of workforce qualifications and cost efficiency, aiding companies in strategic workforce planning.
Workforce Qualification, Cost Efficiency, European Comparison, Strategic Planning
false
Operational Efficiency
Professional Services
Single Chart
Bain
Add to my slides
Remove from favorites
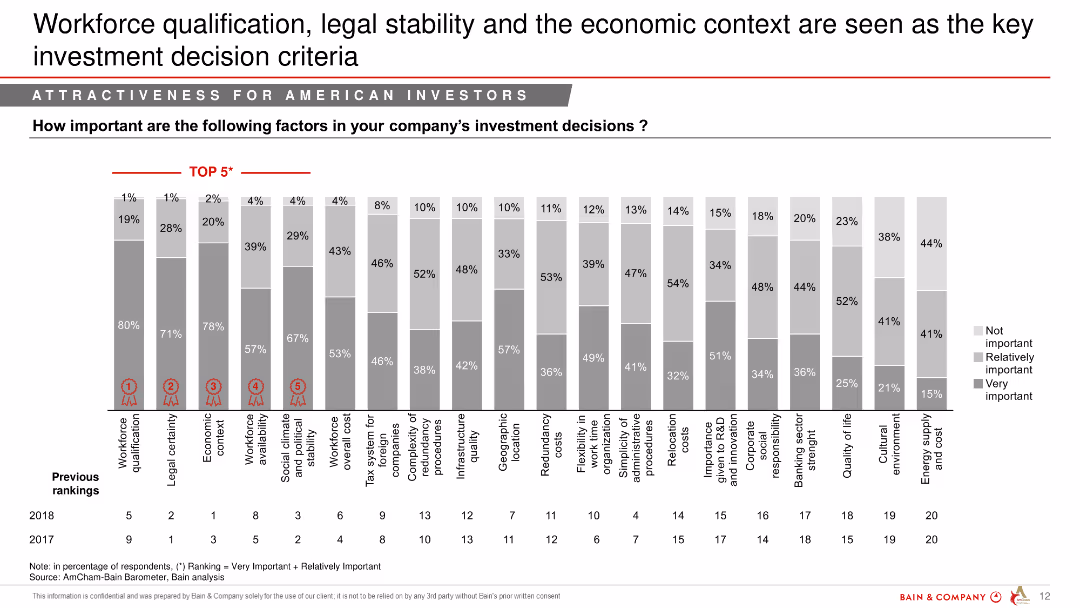
Column chart illustrating the importance of various factors in investment decisions for American investors in 2018 and 2017, with "Top 5" factors highlighted.
Market Analysis and Trends
Professional Services
This slide discusses key factors influencing investment decisions by American investors, highlighting workforce qualification, legal stability, and economic context.
workforce qualification, investment, decision criteria, American investors, key factors
false
Market Analysis and Trends
Professional Services
Single Chart
Bain
Add to my slides
Remove from favorites
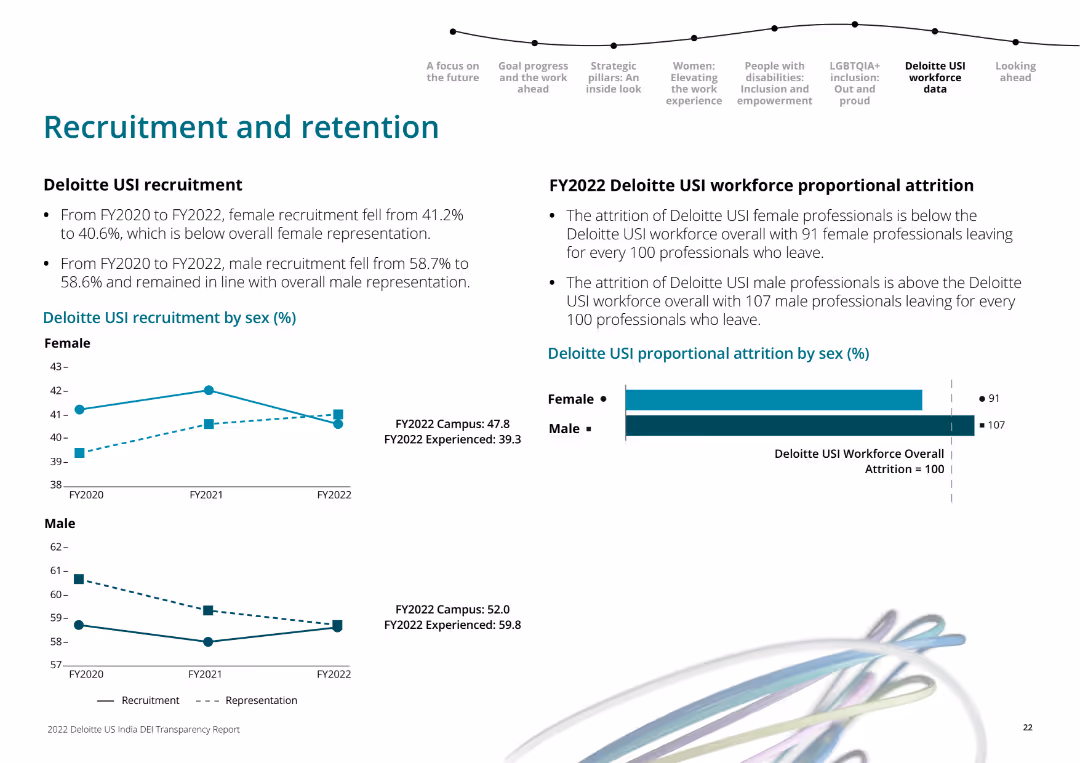
Line charts showing recruitment trends by sex over FY2020 to FY2022, and horizontal bar chart for proportional attrition by sex in FY2022.
Human Resources and Talent Management
Professional Services
It examines Deloitte USI's recruitment and retention trends over three fiscal years, highlighting gender differences in attrition rates.
workforce, recruitment, retention, Deloitte, gender, FY2022, line chart, bar chart
false
Human Resources and Talent Management
Professional Services
Multiple Chart
Deloitte
Add to my slides
Remove from favorites
Three-column layout with a pie chart of total workforce distribution, bar charts for technology and operations, and text descriptions of workforce distribution and reinvestment opportunities.
Human Resources and Talent Management
Professional Services
The slide presents an analysis of workforce distribution and opportunities for reinvestment, emphasizing the mix of employees and externals in technology and operations.
workforce, reinvestment, distribution, technology, operations
false
Human Resources and Talent Management
Professional Services
Multiple Chart
Credit Suisse
Add to my slides
Remove from favorites
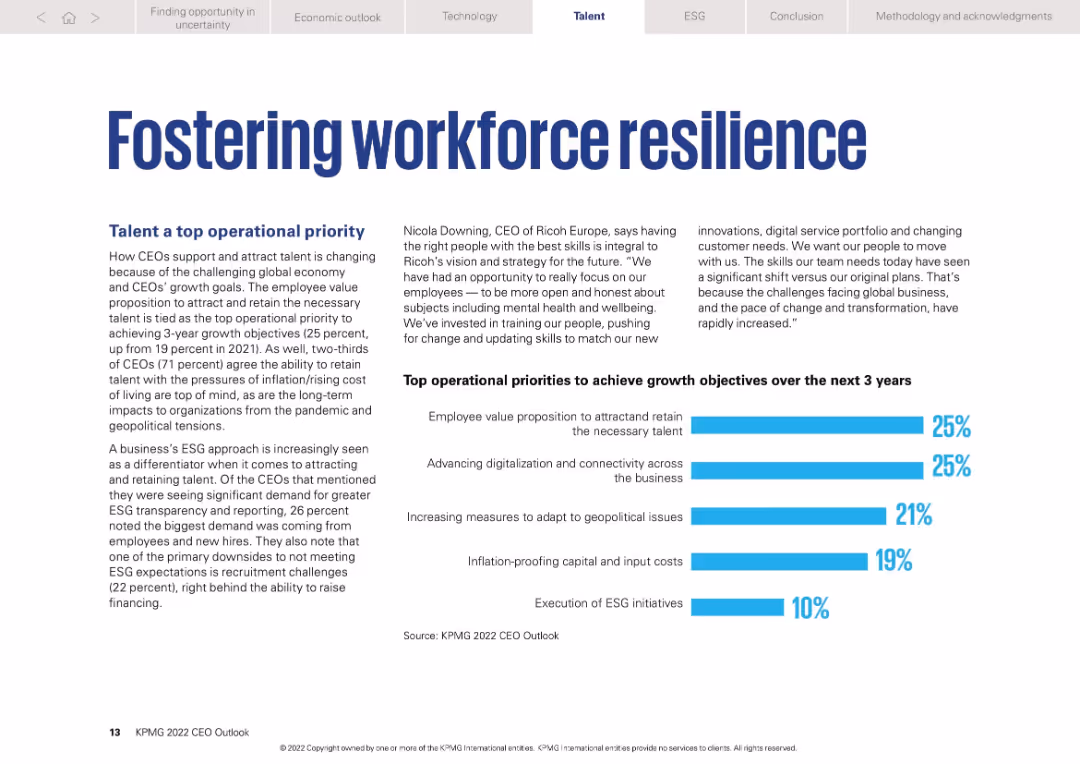
Bold headline, narrative text, CEO quote, and horizontal bar chart of operational priorities
Human Resources and Talent Management
Professional Services
Highlights talent attraction and retention as top CEO priorities. Charts show workforce-related goals (25%) and advancing digitalization (25%) are equally emphasized. Also touches on inflation, ESG, and geopolitics as relevant focus areas.
Workforce resilience, talent strategy, ESG, inflation, CEO priorities
false
Human Resources and Talent Management
Professional Services
Mixed Chart
KPMG
Add to my slides
Remove from favorites
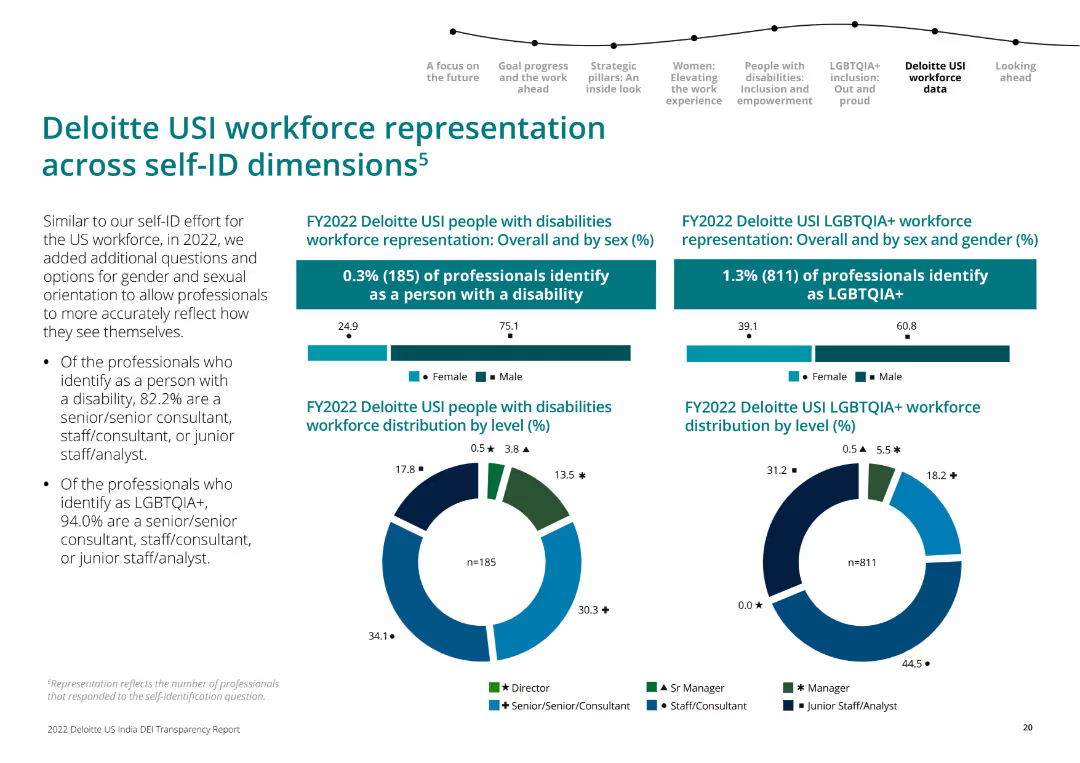
Various horizontal bar charts and pie charts illustrating workforce representation by self-identified disabilities and LGBTQIA+ status.
Human Resources and Talent Management
Professional Services
The slide covers the distribution of Deloitte USI's workforce by disabilities and LGBTQIA+ status, including gender and level distribution in FY2022.
workforce, self-identification, disabilities, LGBTQIA+, Deloitte, diversity, FY2022, bar chart, pie chart
false
Human Resources and Talent Management
Professional Services
Multiple Chart
Deloitte
Add to my slides
Remove from favorites
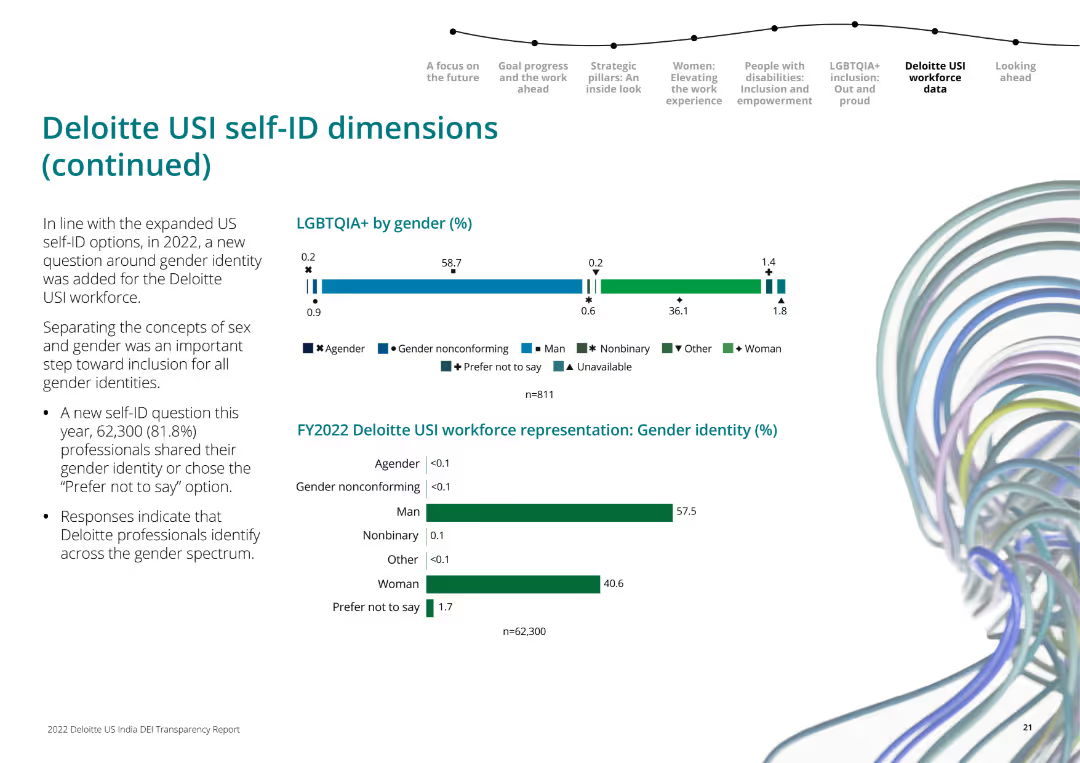
Horizontal bar charts showing the distribution of gender identities among LGBTQIA+ individuals and overall workforce representation by gender in FY2022.
Human Resources and Talent Management
Professional Services
It details the gender identity composition of Deloitte USI's workforce, including agender, nonconforming, male, female, and others.
workforce, self-identification, gender identity, Deloitte, diversity, FY2022, bar chart
false
Human Resources and Talent Management
Professional Services
Multiple Chart
Deloitte
Add to my slides
Remove from favorites
A map highlighting Central American countries with icons indicating their roles in the semiconductor production value chain, such as assembly and test or manufacturing equipment.
Human Resources and Talent Management
Education & Training
The slide identifies Central American countries with skilled workforces capable of participating in the semiconductor production value chain, emphasizing roles in assembly, testing, and manufacturing.
Workforce, semiconductor, Central America, skills, map
false
Human Resources and Talent Management
Education & Training
Graphic
Deloitte
Add to my slides
Remove from favorites
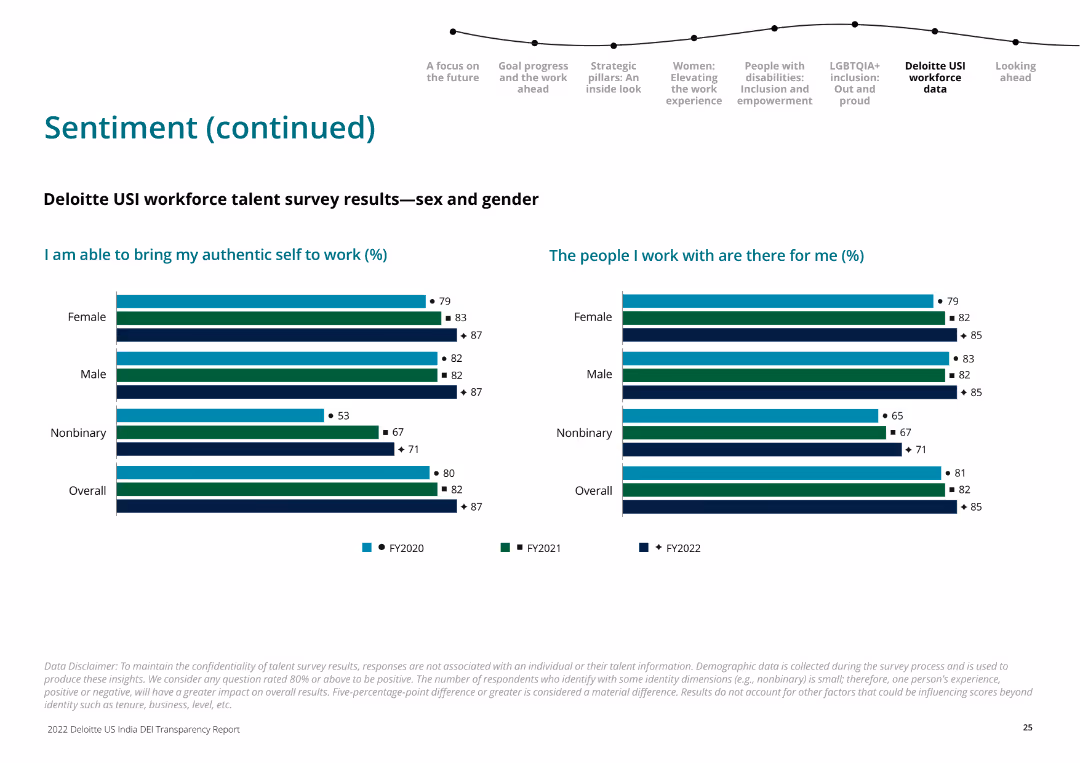
Horizontal bar charts showing talent survey results for male, female, and nonbinary professionals on authenticity at work and colleague support.
Human Resources and Talent Management
Professional Services
It continues the sentiment analysis from the previous slide, detailing the ability to bring authentic selves to work and perceived colleague support.
workforce, sentiment, survey, Deloitte, gender, FY2022, authenticity, colleague support, bar chart
false
Human Resources and Talent Management
Professional Services
Multiple Chart
Deloitte
Add to my slides
Remove from favorites
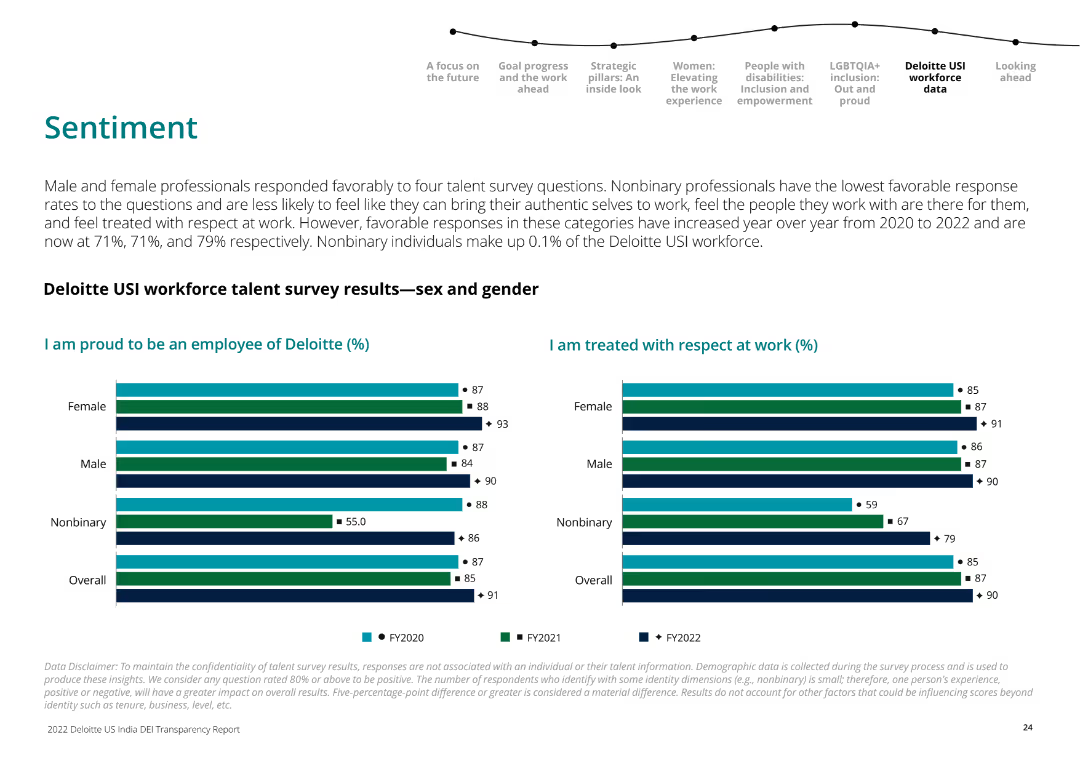
Horizontal bar charts showing talent survey results for male, female, and nonbinary professionals on pride in employment and respect at work.
Human Resources and Talent Management
Professional Services
The slide presents survey results indicating the sentiments of Deloitte USI employees regarding their pride and respect at work by gender over FY2020 to FY2022.
workforce, sentiment, survey, Deloitte, gender, FY2022, pride, respect, bar chart
false
Human Resources and Talent Management
Professional Services
Multiple Chart
Deloitte
Add to my slides
Remove from favorites
Slide features a vertical bar chart showing percentages of anticipated workforce shortages in various operational areas such as retail, supply chain, and IT.
Human Resources and Talent Management
Retail & E-commerce
This slide predicts significant workforce shortages in retail operations and supply chain, highlighting urgent areas for strategic human resource planning in the industry.
workforce, shortage, retail, supply chain, operations, human resources, strategic planning, anticipates
false
Human Resources and Talent Management
Retail & E-commerce
Single Chart
Deloitte
Add to my slides
Remove from favorites
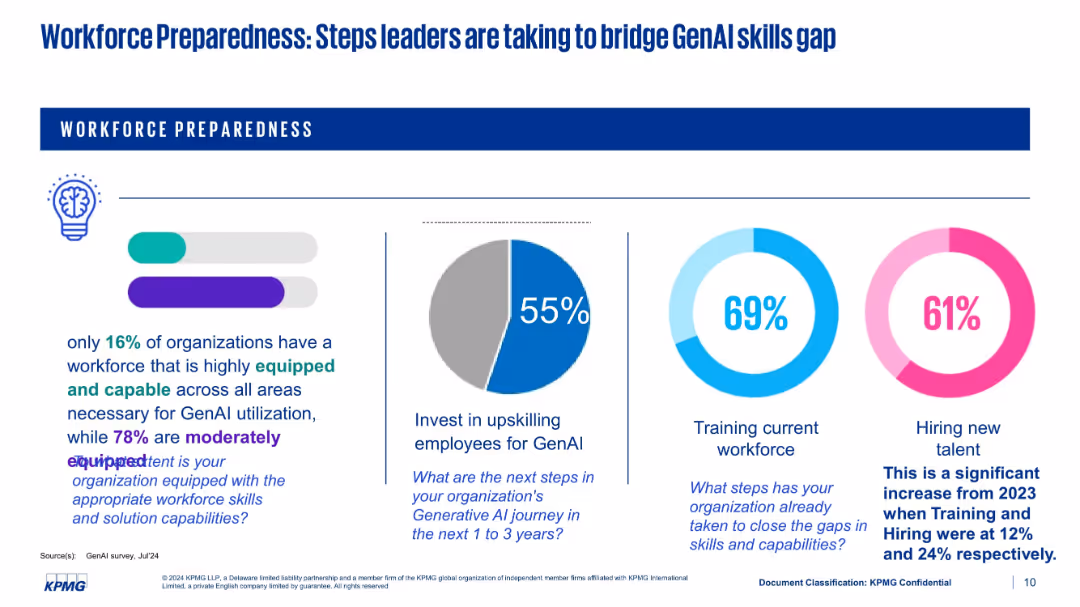
Combination of bar and donut charts; includes stats on training, hiring, and organizational readiness
Human Resources and Talent Management
Artificial Intelligence
This slide discusses how organizations are addressing the GenAI skills gap. While only 16% feel highly equipped, 69% are training their workforce and 61% are hiring new talent. Comparisons to 2023 statistics show significant progress.
workforce, skills gap, GenAI training, hiring, upskilling, readiness
false
Human Resources and Talent Management
Artificial Intelligence
Multiple Chart
KPMG
Add to my slides
Remove from favorites
Circular layout representing a continuous process cycle.
Technology and Digital Transformation
Professional Services
Highlights Deloitte's approach to addressing workforce challenges with a three-part process: imagine, compose, activate.
Workforce, Solutions, Imagine, Compose, Activate
false
Technology and Digital Transformation
Professional Services
Diagram
Deloitte
Add to my slides
Remove from favorites
Includes a column chart depicting workforce trends over recent years, accompanied by quotes from sector leaders.
Human Resources and Talent Management
Professional Services
Discusses the stability and growth projections of workforces across industries, aiding HR planning and workforce development strategies.
Workforce Stability, Sector Growth, Temporary Workers, HR Planning
false
Human Resources and Talent Management
Professional Services
Mixed Chart
Bain
Add to my slides
Remove from favorites
This slide has a three-column format with headings 'Business issues', 'Approach', and 'Impact'. Each column has bullet points and icons in a distinct color. There's a pie chart, two informal group images, and a line graph labeled 'WORKFORCE MIX'. The design is professional with a clear structure.
Strategic Planning
Financial Services
The slide details Deloitte's collaboration with a financial institution to define their workforce strategy. It includes business issues such as mandated FTE reduction, the approach including methodology and assessment, and the impact like understanding disruption and workforce strategy over the next few years.
workforce, strategy, Deloitte, financial, FTE, performance, future success
false
Strategic Planning
Financial Services
Header Horizontal
Deloitte
Add to my slides
Remove from favorites
This slide presents a large, centered image of a diverse group of professionals in front of a building with a combat aircraft. Below the image is a title describing the economic contribution of the Tempest programme.
Industry Overview
Industrial & Manufacturing
The image is intended to humanize the economic contributions discussed in the report, likely representing the workforce behind the Tempest programme and their role in economic development.
workforce, Tempest programme, economic development, combat air, professionals, diversity
false
Industry Overview
Industrial & Manufacturing
Title
PwC/Strategy&
Add to my slides
Remove from favorites
Contains a central text block with three surrounding icons representing Work, Workforce, and Workplace. Each icon is connected with a line to the central text, suggesting a relationship between the three dimensions.
Strategic Planning
Professional Services
Slide explores the deeply integrated dimensions of workforce transformation, addressing the work, workforce, and workplace. Useful for discussions on the integration of these elements in strategic business planning.
Workforce, Transformation, Strategy, Integration
false
Strategic Planning
Professional Services
Diagram
Deloitte
Add to my slides
Remove from favorites
Slide contains two sections: one with a green semi-transparent overlay with text, and another with icons representing various types of workers spiraling towards the word 'DISRUPTED'.
Market Analysis and Trends
Professional Services
Illustrates the transformation and disruption in the workforce with traditional employee roles compared to new forms of work like freelancers and robots. Useful for analyzing the evolving talent landscape.
Workforce, Transformation, Talent, Disruption
false
Market Analysis and Trends
Professional Services
Pillar
Deloitte
Add to my slides
Remove from favorites
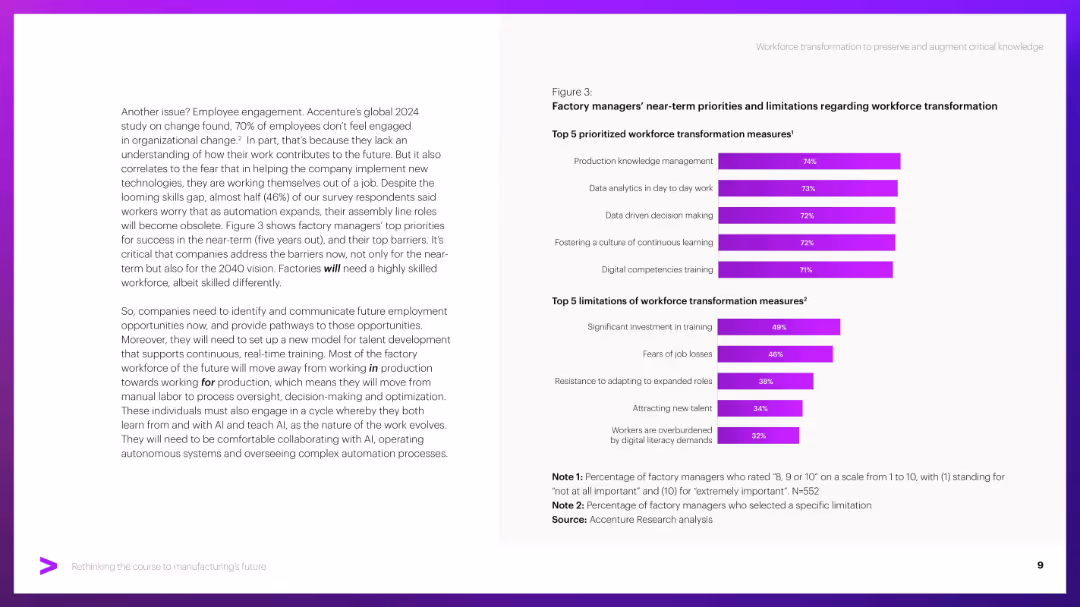
Two bar charts on the right, paragraph text on the left. Purple bars indicate percentages.
Human Resources and Talent Management
Industrial & Manufacturing
Discusses workforce transformation needs including skills training, data literacy, and knowledge management. Highlights barriers like cost, job fears, and adaptation resistance through factory manager survey results.
Workforce, transformation, upskilling, barriers, training, AI adaptation
false
Human Resources and Talent Management
Industrial & Manufacturing
Mixed Chart
Accenture
Add to my slides
Remove from favorites
Features a stacked column chart displaying changes in employment requirements by industry from 2011 to 2030.
Operational Efficiency
Industrial & Manufacturing
Illustrates fluctuations in workforce needs over two decades, highlighting industry responses to technological and market changes.
Workforce Trends, 2030, Industry Changes, Employment Fluctuations, Technological Impact, Market Response, Operational Efficiency
false
Operational Efficiency
Industrial & Manufacturing
Single Chart
BCG
Add to my slides
Remove from favorites
Contains lists and icons to depict workforce trends on the left and their implications on the right, with emphasis on career length, generational shifts, and skill relevancy.
Technology and Digital Transformation
Professional Services
Explores future workforce trends, including the predominance of millennials and changing skill requirements, and the subsequent implications for organizations.
workforce trends, millennials, skill requirements, organizational implications, future planning
false
Technology and Digital Transformation
Professional Services
Framework
Deloitte
Add to my slides
Remove from favorites
Filled with pie charts and graphs, depicts salary expectations and job satisfaction levels across various sectors.
Human Resources and Talent Management
Professional Services
Discusses evolving workforce expectations regarding pay, crucial for financial planning and HR strategies in businesses.
Workforce Trends, Pay Dynamics, Salary Expectations, Job Satisfaction, HR Strategy
false
Human Resources and Talent Management
Professional Services
Multiple Chart
PwC/Strategy&
Add to my slides
Remove from favorites
Two sets of column charts depict changes over three years in requests for work from home and its perceived impact on company performance. Executives' quotes regarding the benefits and challenges of hybrid work models are included.
Operational Efficiency
Professional Services
Analyzes trends in work from home requests among companies and the impact of hybrid work models on operational efficiency and company culture from 2021 to 2023.
work from home, hybrid work, company performance, operational efficiency, remote work, company culture, business model, employee satisfaction, cost savings
false
Operational Efficiency
Professional Services
Multiple Chart
Bain
Add to my slides
Remove from favorites
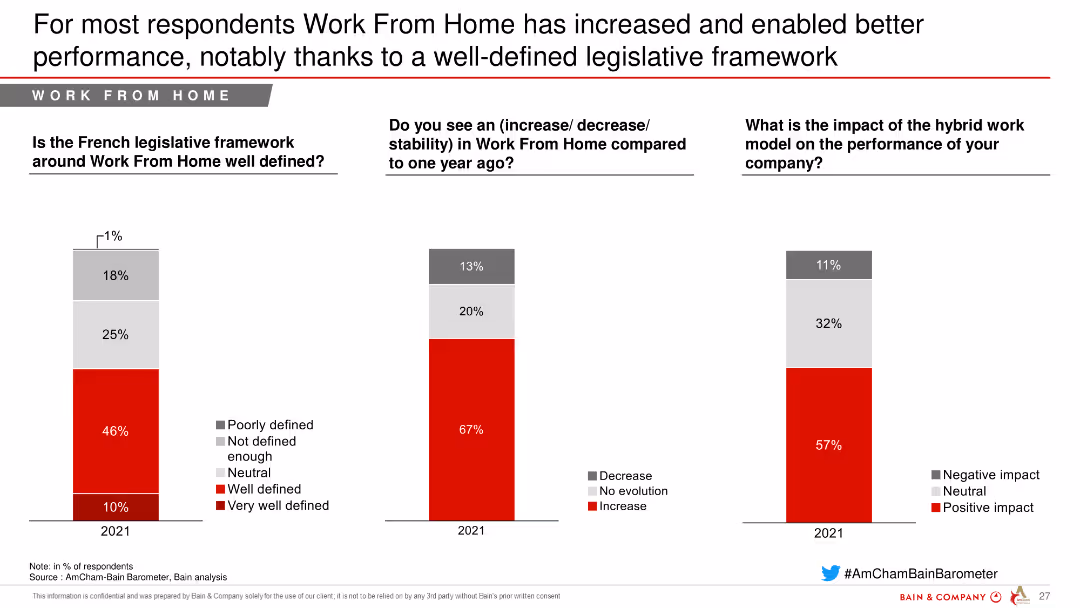
This slide presents column charts showing respondents' views on the legislative framework for work from home, the increase in work from home, and its impact on company performance.
Operational Efficiency
Professional Services
The slide evaluates the impact of work from home on performance, legislative framework clarity, and changes in work from home practices over the past year.
work from home, performance, legislative framework, increase, impact, professional services, operational efficiency
false
Operational Efficiency
Professional Services
Multiple Chart
Bain
Add to my slides
Remove from favorites
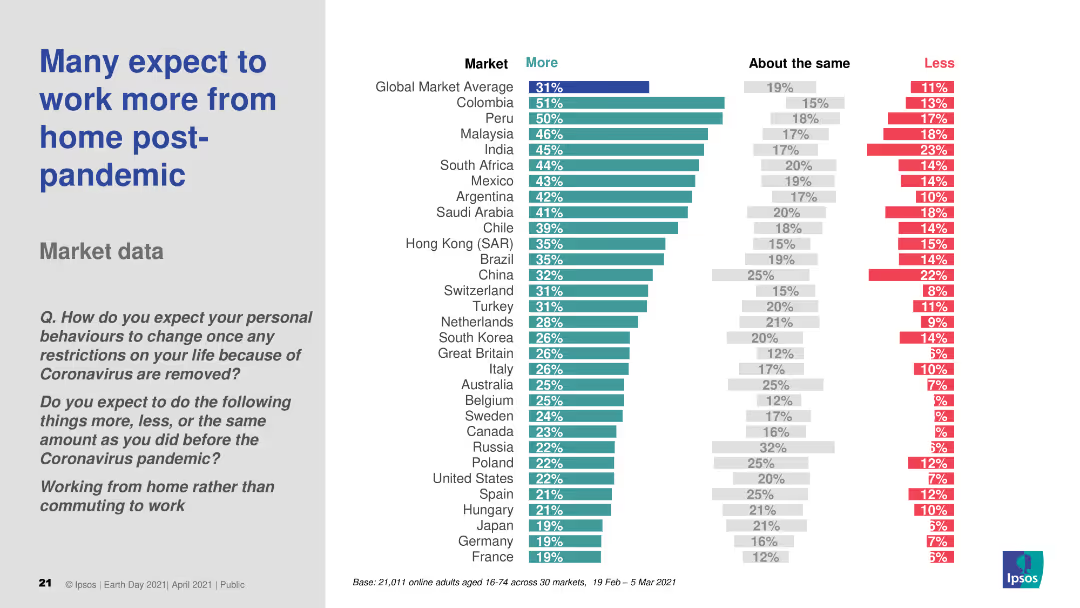
The slide features a column chart illustrating expected changes in work-from-home behavior across various markets post-pandemic. It uses three color bars for "More," "About the same," and "Less." The text includes a question and survey details.
Market Analysis and Trends
Professional Services
The slide shows survey results on the expected increase in work-from-home practices after pandemic restrictions are lifted, comparing responses across different global markets.
work-from-home, post-pandemic, market data, survey, behavior change
false
Market Analysis and Trends
Professional Services
Multiple Chart
IPSOS
Add to my slides
Remove from favorites
The slide contains a column chart showing the importance of various aspects like family, work, hobbies, and exercise to Gen Zs and Millennials. It uses a clear layout with balanced text and visual elements.
Human Resources and Talent Management
Professional Services
This slide emphasizes the importance of work in the identity of Gen Zs and Millennials while highlighting the paramount importance of achieving work/life balance. It presents data on what aspects are most important to their sense of identity.
Work identity, balance, Gen Z, Millennials, importance
false
Human Resources and Talent Management
Professional Services
Mixed Chart
Deloitte
Add to my slides
Remove from favorites
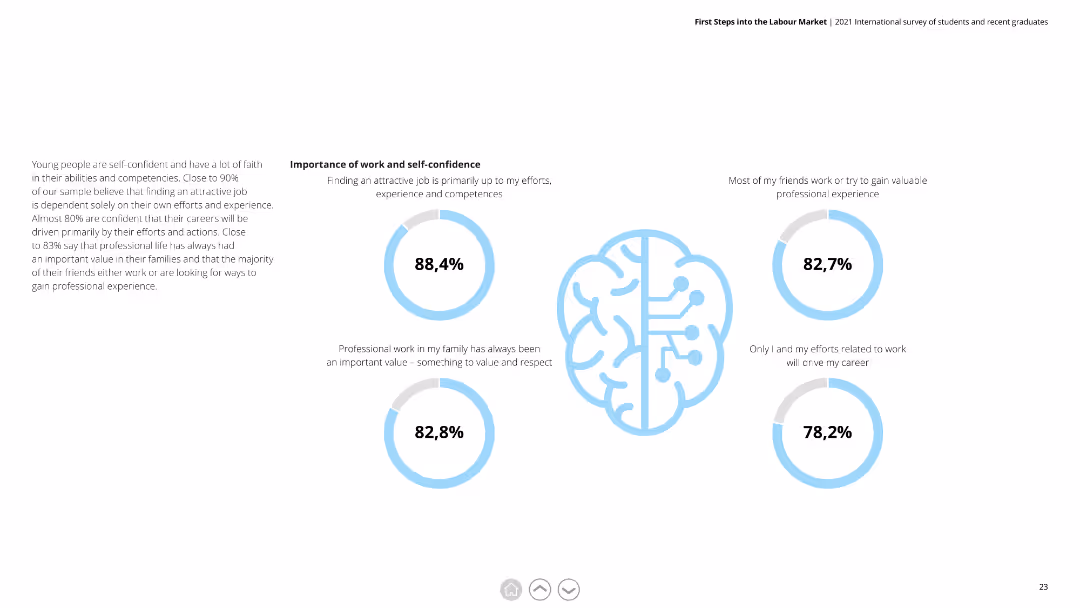
Circular diagrams showing percentages related to the importance of work and self-confidence among respondents.
Market Analysis and Trends
Professional Services
Illustrates the high level of confidence respondents have in their ability to find attractive jobs and the value they place on professional work.
Work Importance, Self-Confidence, Professional Work, Jobs, Respondents
false
Market Analysis and Trends
Professional Services
Multiple Chart
Deloitte
Add to my slides
Remove from favorites
The slide features a column chart showing the estimated change in working-age population from 2024 to 2033 by region, and a bar chart comparing average hourly wages by country for 2023.
Market Analysis and Trends
Financial Services
This slide analyzes changes in the working-age population and compares average hourly wages across countries, providing insights into labor market trends and economic productivity.
Working Age Population, Wages, Labor Market, Economic Productivity, Demographics
false
Market Analysis and Trends
Financial Services
Multiple Chart
JP Morgan
Add to my slides
Remove from favorites
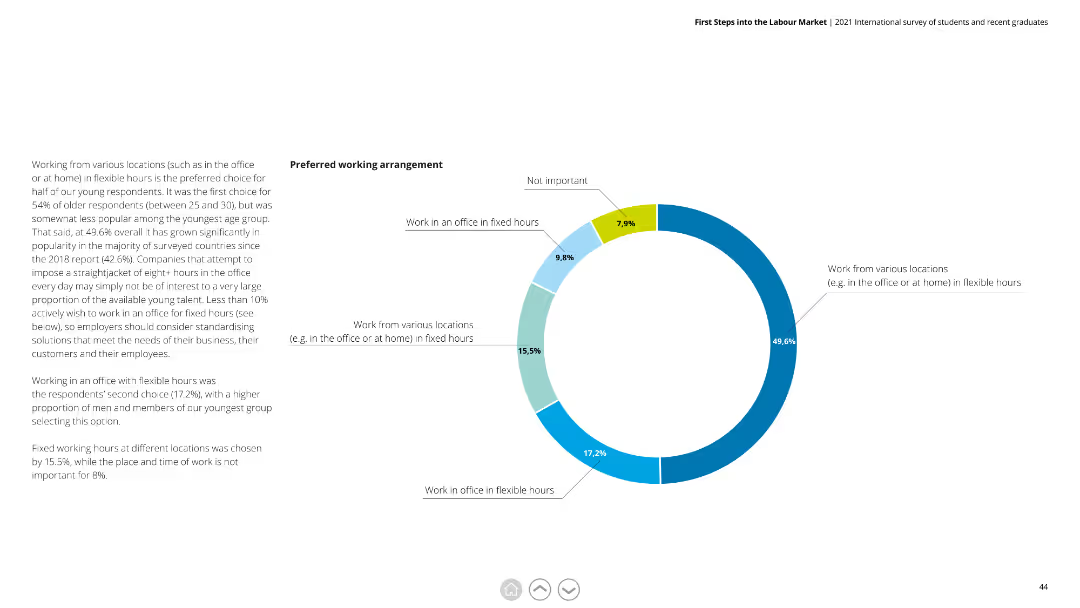
The slide includes a pie chart with blue and green segments. The text is split into two columns, offering context and detailed explanations of respondents' preferences for working arrangements.
Human Resources and Talent Management
Professional Services
Discusses preferred working arrangements, including office hours and flexible working options. Highlights trends in preferences among different age groups.
working arrangements, office hours, flexible, preferences, trends, age groups, respondents
false
Human Resources and Talent Management
Professional Services
Mixed Chart
Deloitte
Add to my slides
Remove from favorites
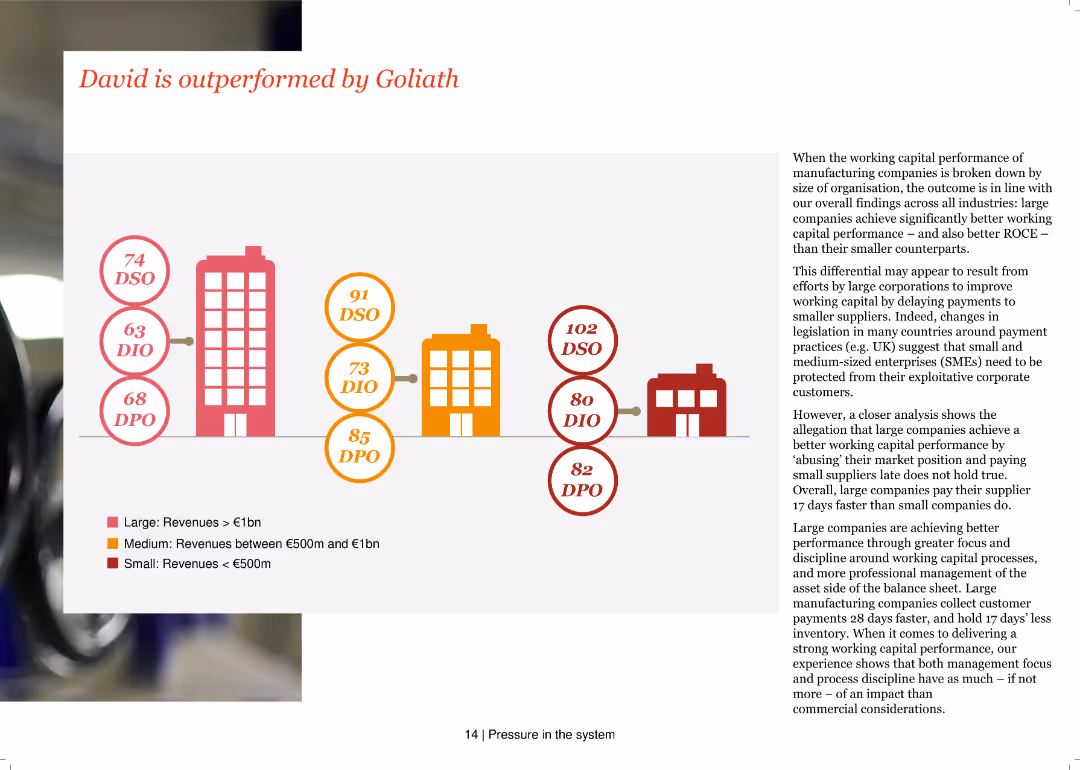
The slide compares the working capital performance of large, medium, and small manufacturing companies using a comparative layout. Text discusses the differences in performance and payment practices.
Competitive Landscape
Industrial & Manufacturing
It compares the working capital performance of manufacturing companies by size, highlighting that large companies achieve better results than small and medium-sized enterprises, possibly due to better management practices and faster customer payment collection.
working capital, comparative analysis, manufacturing, company size, performance, competitive landscape, large companies, SMEs, payment practices
false
Competitive Landscape
Industrial & Manufacturing
Mixed Chart
PwC/Strategy&
Add to my slides
Remove from favorites
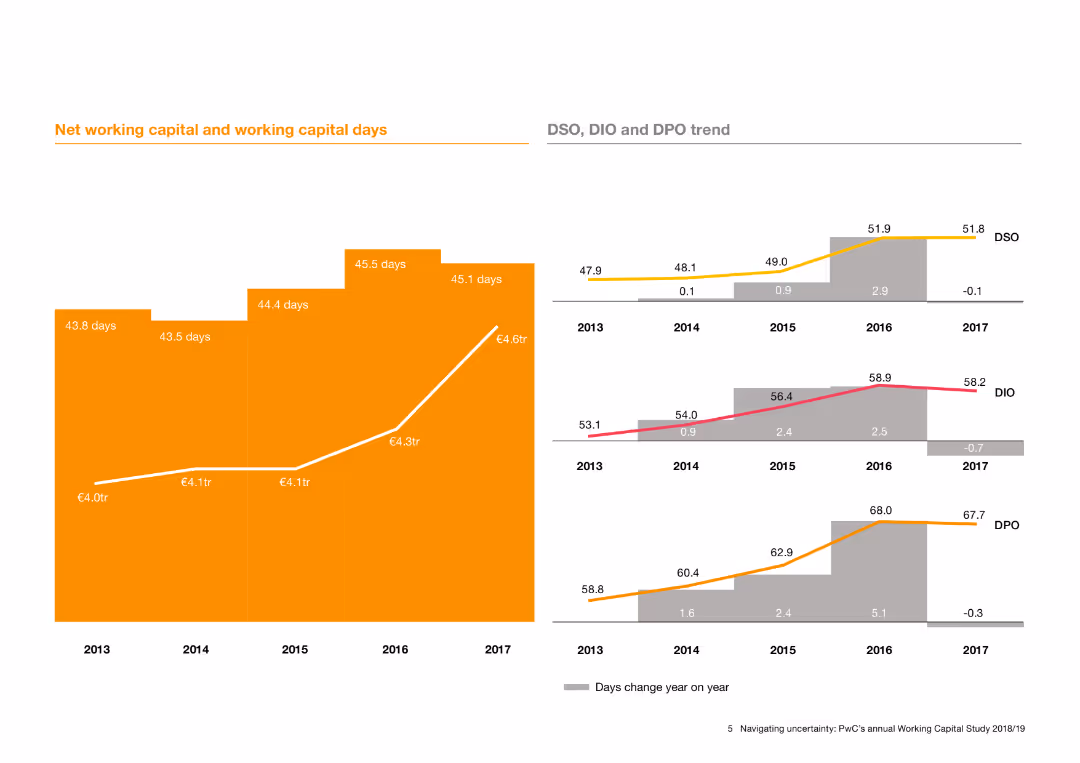
Includes column charts displaying net working capital trends and days change year on year for DSO, DIO, and DPO from 2013 to 2017.
Financial Performance
Financial Services
Analyzes trends in working capital management, focusing on changes in DSO, DIO, and DPO over several years to assess financial health.
working capital, DSO, DIO, DPO, financial trends, net capital
false
Financial Performance
Financial Services
Multiple Chart
PwC/Strategy&
Add to my slides
Remove from favorites
The slide features bar charts detailing different levers in working capital management with activity levels and trends.
Financial Performance
Financial Services
Highlights levers in working capital management, such as inventory optimization and accounts receivable, showing trends for 2019.
Working Capital, Inventory, Accounts Receivable, Trends
false
Financial Performance
Financial Services
Single Chart
Roland Berger
Add to my slides
Remove from favorites
Features two sections: a column chart illustrating invoices by month and a dashboard categorizing receivables. The design is straightforward with a dominant green color scheme, which aligns with the theme of financial visibility and transparency.
Technology and Digital Transformation
Technology & Software
This slide is centered on the use of live dashboards to enhance working capital management. It displays monthly invoicing trends and a segmentation of receivables, suggesting how real-time data transparency can lead to better financial decision-making.
working capital, invoices, receivables, financial transparency, dashboards
false
Technology and Digital Transformation
Technology & Software
Boxed
Deloitte
Add to my slides
Remove from favorites
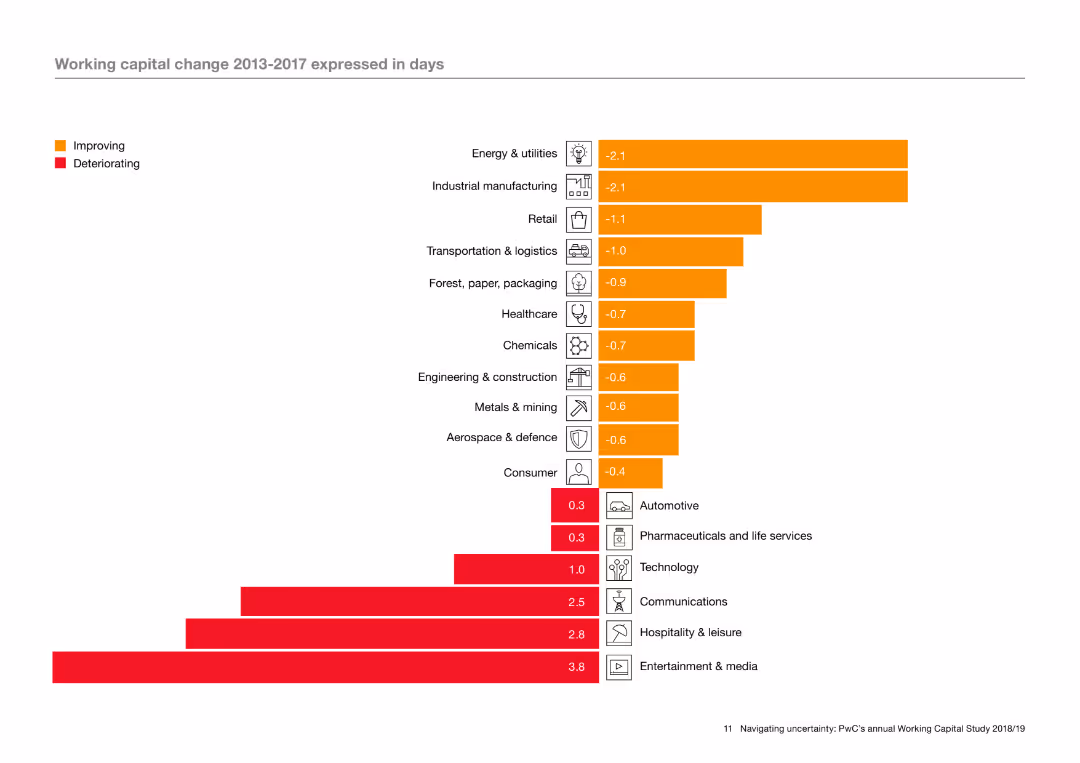
The slide features a column chart with horizontal bars indicating working capital change in various industries from 2013 to 2017. The bars are color-coded to show improving and deteriorating metrics. Icons representing different industries are aligned on the left of the chart.
Operational Efficiency
Industrial & Manufacturing
The slide analyzes working capital changes across different industries over a five-year period, using a column chart to illustrate which industries have seen improvements or deteriorations. The analysis highlights trends in operational efficiency within these sectors.
Working capital, operational efficiency, industry trends, improvement, deterioration, column chart
false
Operational Efficiency
Industrial & Manufacturing
Single Chart
PwC/Strategy&
Add to my slides
Remove from favorites
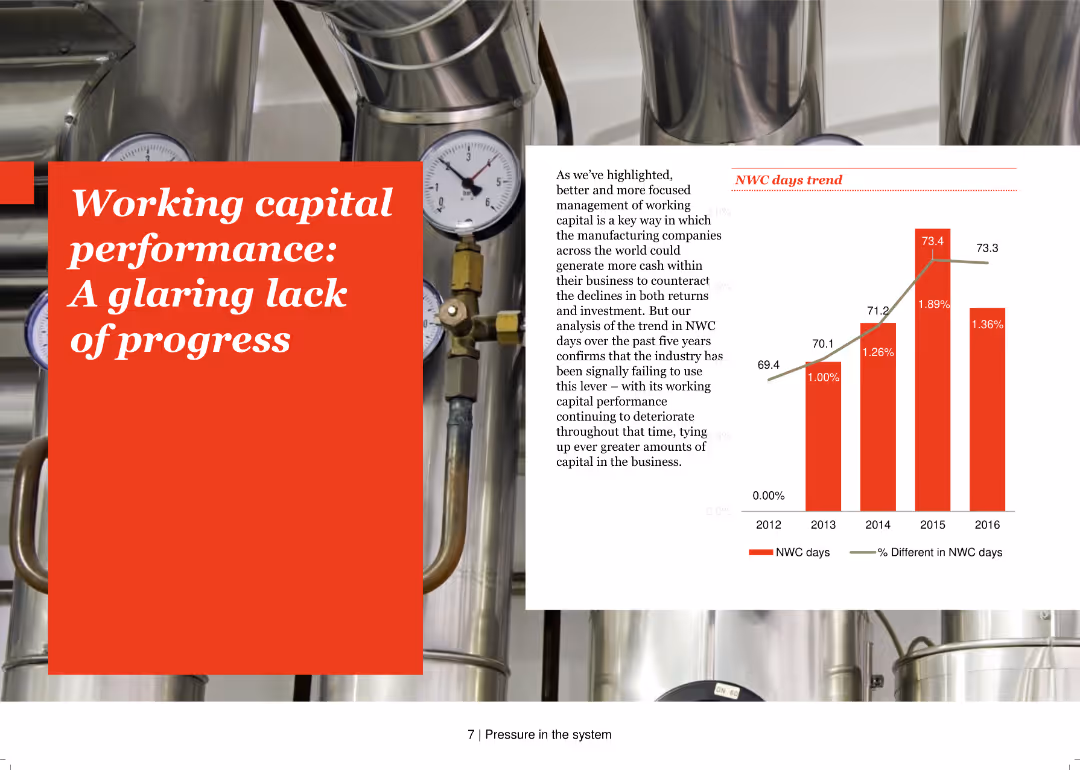
The slide contains a column chart showing the trend in NWC days from 2012-2016. Text discusses the ongoing issues in working capital performance in the manufacturing industry.
Operational Efficiency
Industrial & Manufacturing
It highlights the lack of progress in improving working capital performance in the manufacturing industry over the past five years, suggesting a need for better management practices to counter declining returns and investment.
working capital, performance, NWC days, manufacturing, operational efficiency, column chart, trend analysis
false
Operational Efficiency
Industrial & Manufacturing
Mixed Chart
PwC/Strategy&
Add to my slides
Remove from favorites
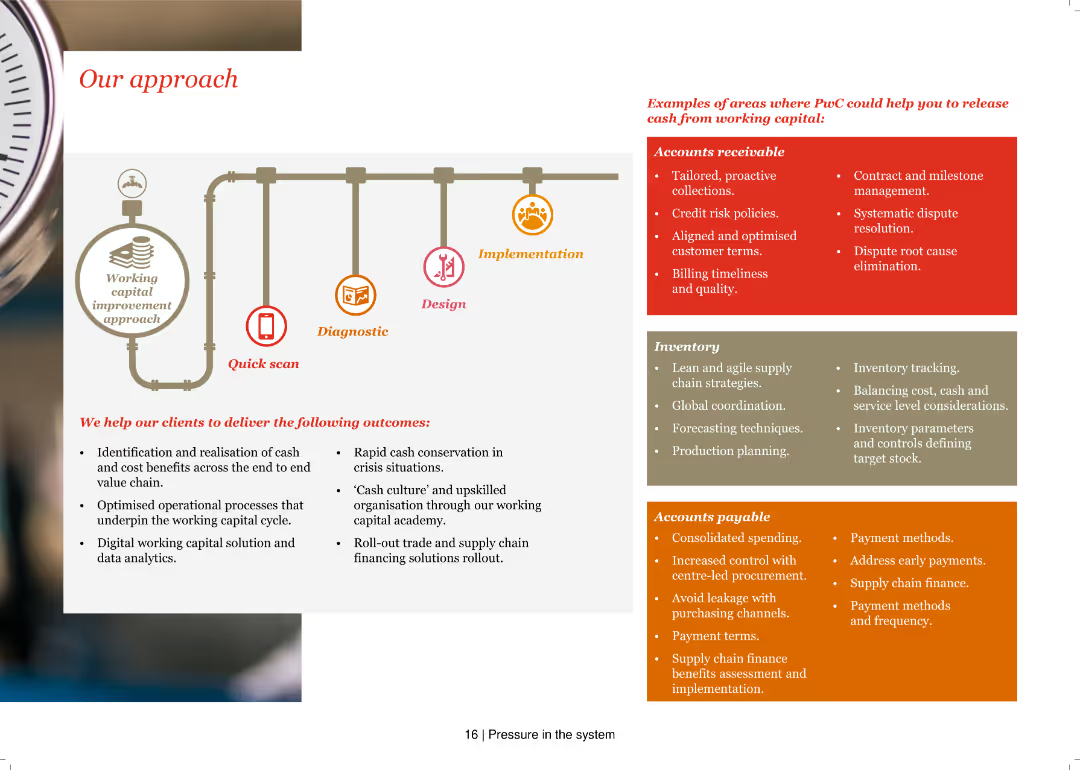
A pipeline diagram illustrating a working capital improvement approach with phases: Quick scan, Diagnostic, Design, and Implementation, accompanied by lists of specific actions and outcomes.
Operational Efficiency
Financial Services
The slide explains PwC's approach to improving working capital, detailing steps and examples in accounts receivable, inventory, and accounts payable.
Working capital, Quick scan, Diagnostic, Design, Implementation, Accounts receivable, Inventory, Accounts payable, Outcomes, Efficiency
false
Operational Efficiency
Financial Services
Header Vertical
PwC/Strategy&
Add to my slides
Remove from favorites
The slide has a title at the top, text in the middle, and a column chart at the bottom depicting changes in working situations or hours due to the pandemic.
Operational Efficiency
Professional Services
Provides data on changes in working situations due to the pandemic, with 43% reporting changes. Details include working from home, decrease/increase in hours, and furlough.
Working Situation, Pandemic, Survey, Work, Data
false
Operational Efficiency
Professional Services
Mixed Chart
IPSOS
Add to my slides
Remove from favorites
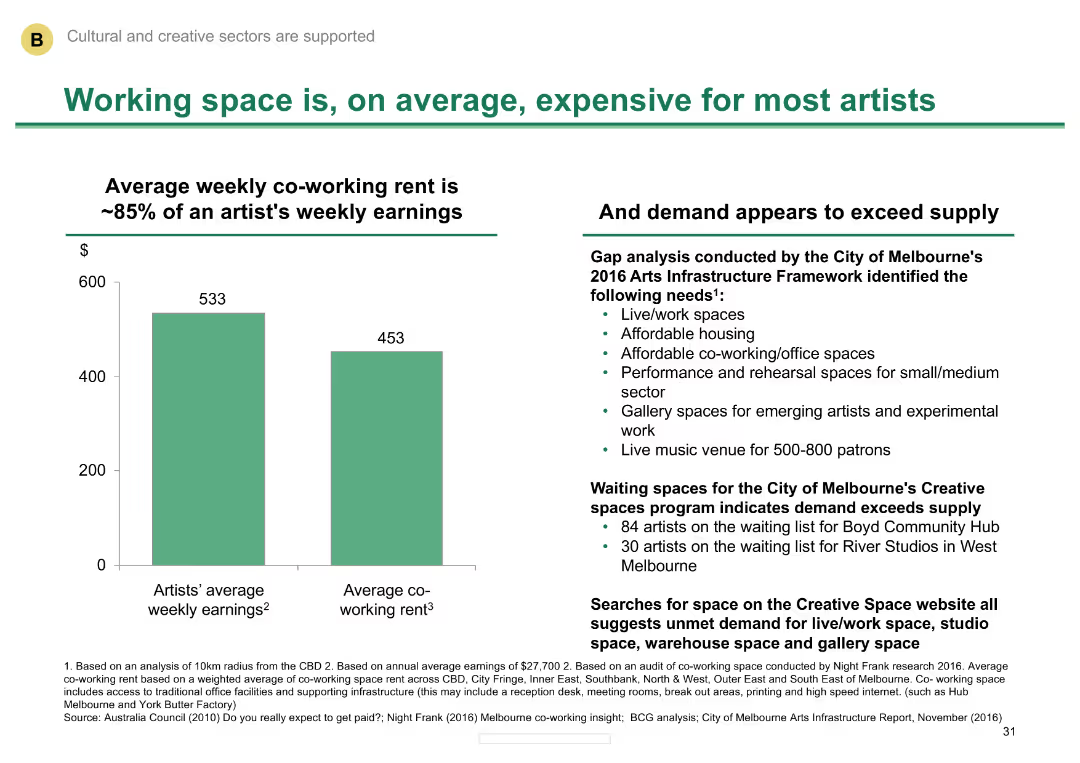
Column chart comparing average weekly earnings of artists with co-working rent
Market Analysis and Trends
Media & Entertainment
Illustrates the high cost of working space for artists in Melbourne and the demand exceeding supply.
Working space, cost, artists, Melbourne, demand
false
Market Analysis and Trends
Media & Entertainment
Mixed Chart
BCG
Add to my slides
Remove from favorites
This slide contrasts the perception of work/life balance over two years using pie charts and text descriptions, effectively depicting changes over time. The design is clean, with high contrast for readability.
Regulatory and Compliance
Professional Services
Focused on the perceived impacts of flexible working on career advancement, this slide offers insights into employee retention factors and can guide discussions on company policies to support work/life balance.
work/life balance, career, flexibility, women
false
Regulatory and Compliance
Professional Services
Mixed Chart
Deloitte
Add to my slides
Remove from favorites
This slide features two columns: one with bullet points listing organizational focus areas and another with a column chart showing factors preventing flexible work.
Operational Efficiency
Professional Services
The slide discusses the rising popularity of condensed work weeks and part-time jobs, listing areas organizations should focus on and concerns about flexible work.
work-life balance, flexible hours, Gen Z, millennials, part-time jobs, job sharing, career advancement
false
Operational Efficiency
Professional Services
Mixed Chart
Deloitte
Add to my slides
Remove from favorites
The slide displays a series of column charts comparing preferences of Gen Z and Millennials regarding work-life balance strategies. It includes percentage labels and is visually segmented for clarity.
Market Analysis and Trends
Professional Services
Analyzes preferred organizational strategies for enhancing work-life balance among Gen Z and Millennials, highlighting the differences in preferences for flexible work options.
work-life balance, Gen Z, Millennials, organizational strategies, flexible work, preferences
false
Market Analysis and Trends
Professional Services
Mixed Chart
Deloitte
Add to my slides
Remove from favorites
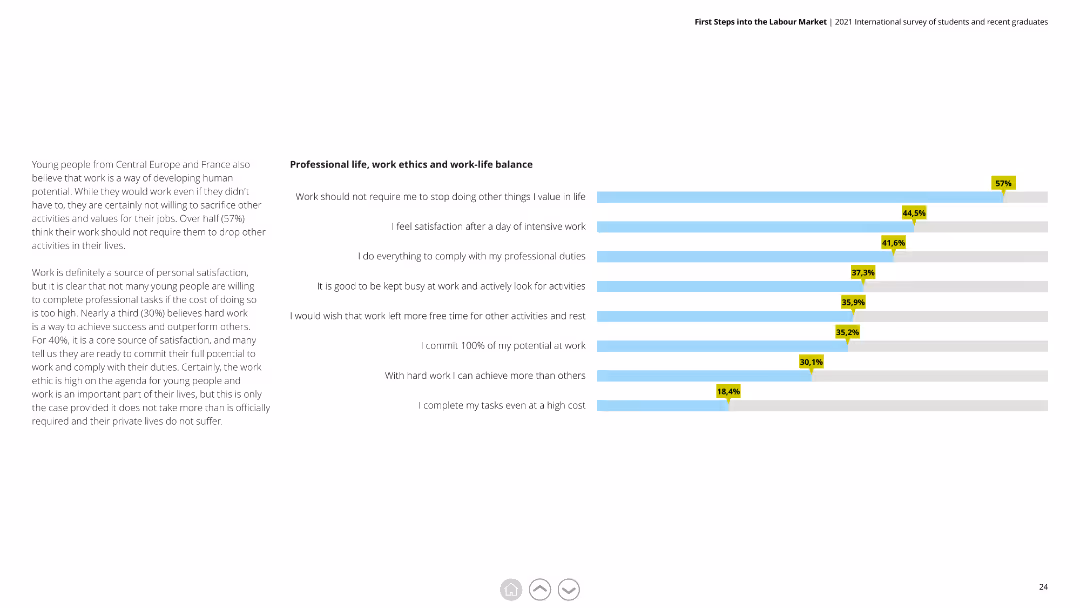
Horizontal bar chart showing various statements about work-life balance with corresponding percentages, accompanied by a detailed text explanation on the left.
Human Resources and Talent Management
Education & Training
This slide explores young people's perspectives on work-life balance, including the importance of balancing work with personal life and the levels of satisfaction.
work-life balance, satisfaction, professional duties, young people, work ethic
false
Human Resources and Talent Management
Education & Training
Mixed Chart
Deloitte
Add to my slides
Remove from favorites
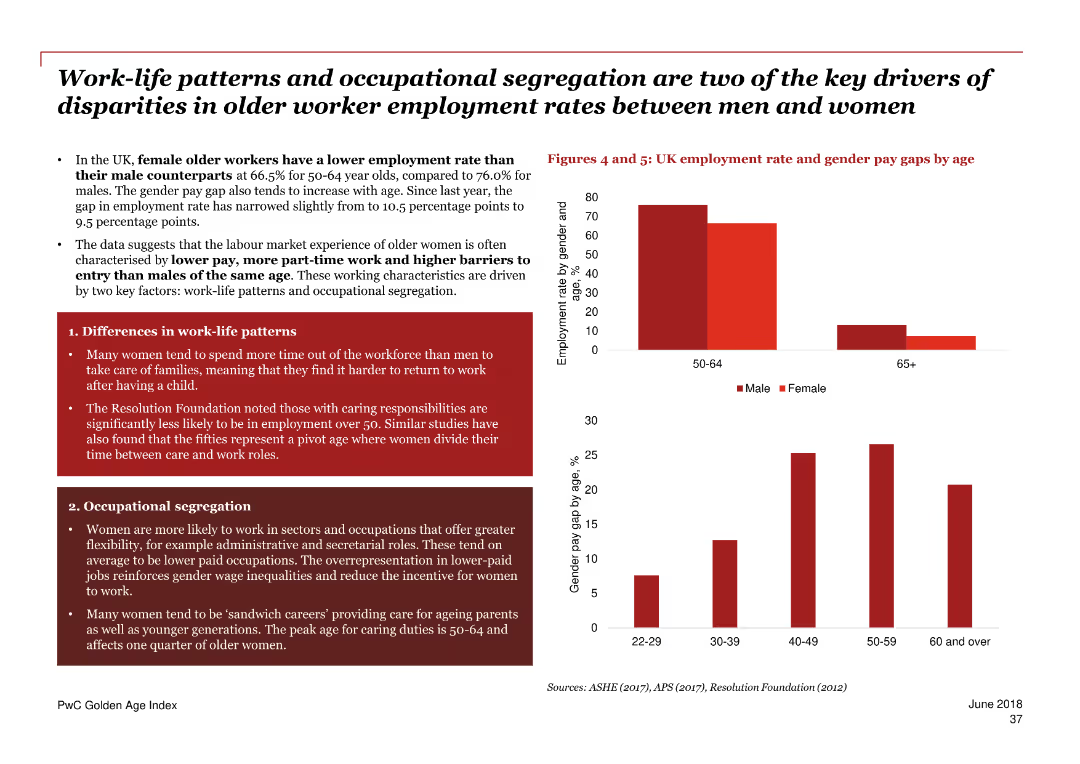
The slide contains two bar charts comparing employment rates and gender pay gaps by age group. It also includes text sections explaining the impact of work-life patterns and occupational segregation on older women’s employment.
Human Resources and Talent Management
Government & Public Sector
This slide examines the factors affecting employment rates and pay gaps for older women in the UK, focusing on work-life patterns and occupational segregation. It discusses the challenges and barriers faced by older female workers.
work-life patterns, occupational segregation, older women, UK, employment rates, gender pay gap, challenges, barriers
false
Human Resources and Talent Management
Government & Public Sector
Multiple Chart
PwC/Strategy&
Add to my slides
Remove from favorites
The slide includes column charts in purple, analyzing workload impacts on underwriters across different business lines.
Human Resources and Talent Management
Financial Services
Analyzes the impact of technology on underwriters' workload by business line and account size, using historical data.
workload, technology, underwriters, business line, data
false
Human Resources and Talent Management
Financial Services
Multiple Chart
Accenture
Add to my slides
Remove from favorites
Slide features a historical comparison using column chart in gray and purple, showing the workload impact of technology on underwriters.
Human Resources and Talent Management
Financial Services
Shows the trend of technology impact on underwriters' workload from 2008 to 2021, with comparative analysis.
workload, trends, technology, underwriters, comparison
false
Human Resources and Talent Management
Financial Services
Mixed Chart
Accenture
Add to my slides
Remove from favorites
The slide showcases a bar graph with strategies being adopted post-pandemic, ranging from enclosed to open workspaces. Darker bars indicate a greater number of spaces, lighter bars represent fewer spaces, and a yellow line signifies uncertainty.
Strategic Planning
Professional Services
Strategic workplace adaptations are outlined, suggesting a focus on collaboration and flexibility. The chart reflects corporate strategic planning in response to changing work patterns.
Work Models, Strategic Planning, Collaboration, Workplace Design, Pandemic Response
false
Strategic Planning
Professional Services
Single Chart
EY
Add to my slides
Remove from favorites
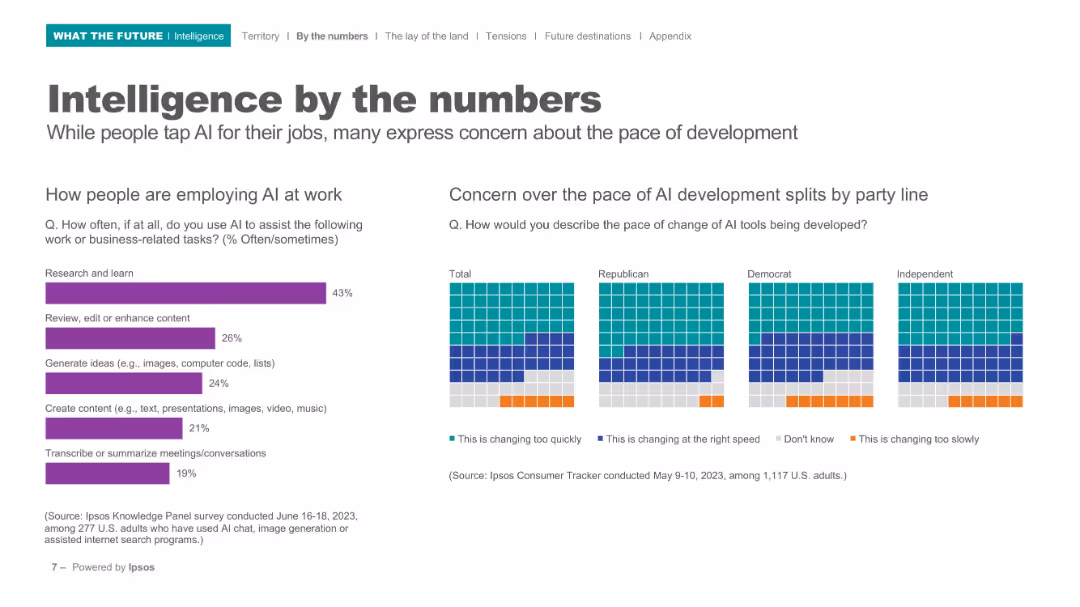
Left bar chart for work-related AI usage, right grid matrix for political view comparison; minimalistic layout.
Operational Efficiency
Artificial Intelligence
Demonstrates how people are using AI at work (e.g., research, content editing, summarizing). Also shows concern levels over AI’s development pace, broken down by political affiliation.
workplace AI, political views, research, productivity, AI development, Ipsos, pace of change
false
Operational Efficiency
Artificial Intelligence
Multiple Chart
IPSOS
Add to my slides
Remove from favorites
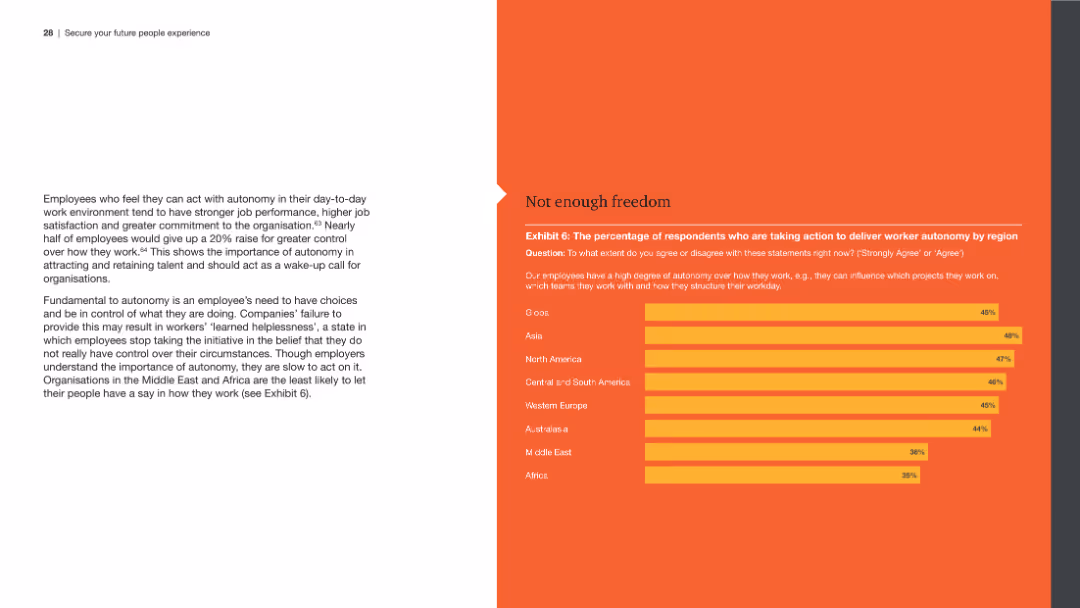
The slide features a left panel with text about autonomy at work and a right panel with a horizontal bar chart depicting regional differences in providing autonomy to employees.
Human Resources and Talent Management
Professional Services
The slide discusses the importance of workplace autonomy, highlighting survey data on regional disparities in how much freedom employees are given to control their work and make decisions.
Workplace autonomy, employee freedom, regional disparities, survey data, control
false
Human Resources and Talent Management
Professional Services
Mixed Chart
PwC/Strategy&
Add to my slides
Remove from favorites
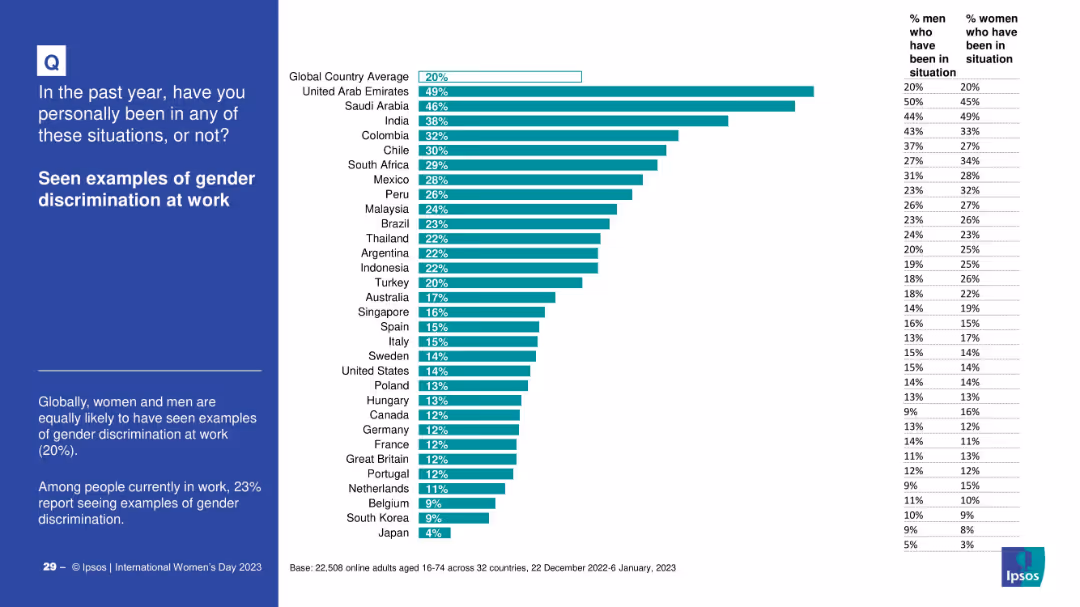
Bar chart showing reported workplace gender discrimination across countries. Gender-specific stats are included in tabular form.
Risk Assessment and Management
Government & Public Sector
This slide focuses on perceptions and experiences of gender discrimination in the workplace. The UAE and Saudi Arabia show the highest incidence, with men and women reporting equal likelihood globally.
workplace bias, gender discrimination, international comparison, employment issues, equal opportunity
false
Risk Assessment and Management
Government & Public Sector
Mixed Chart
IPSOS
Add to my slides
Remove from favorites
The slide features a black background with a large orange header. It contains a text block and three bar charts displaying the percentage of employees discussing political and social issues at work, segmented by different groups.
Organizational Structure and Change
Government & Public Sector
Discusses the frequency and impact of political and social discussions at work. It examines the positive and negative outcomes of these discussions across various demographic groups, revealing that such interactions can have both beneficial and detrimental effects on workplace dynamics.
workplace discussions, political issues, social issues, demographics
false
Organizational Structure and Change
Government & Public Sector
Multiple Chart
PwC/Strategy&
Add to my slides
Remove from favorites
The slide includes various charts and graphs depicting changes in workplace dynamics, such as remote work percentages and engagement metrics.
Organizational Structure and Change
Professional Services
It discusses changes in the strategic procurement team's working environment, engagement, retention, diversity, and gender balance.
Workplace dynamics, remote work, engagement, retention, diversity, gender balance, procurement
false
Organizational Structure and Change
Professional Services
Multiple Chart
Kearney
Add to my slides
Remove from favorites
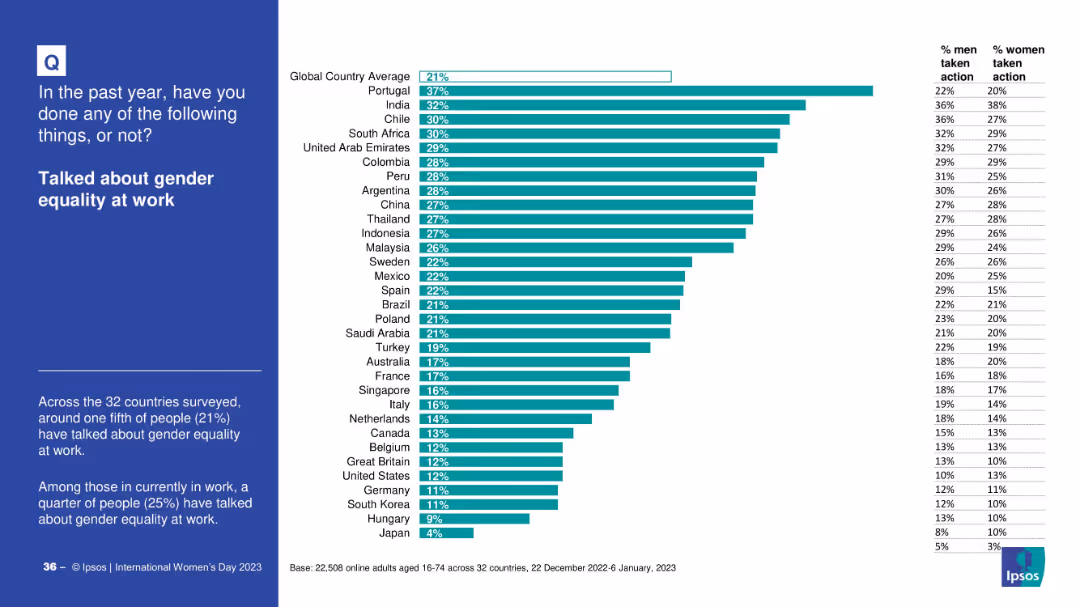
Similar format: blue text box left, horizontal bar chart right; includes gender breakdown by country
Organizational Structure and Change
Government & Public Sector
This slide presents data on the proportion of people who discussed gender equality at work in the past year. It compares country-level responses and provides gender-specific response rates.
workplace, gender equality, employee behavior, gender discussion, countries, Ipsos, workplace culture
false
Organizational Structure and Change
Government & Public Sector
Mixed Chart
IPSOS
Add to my slides
Remove from favorites
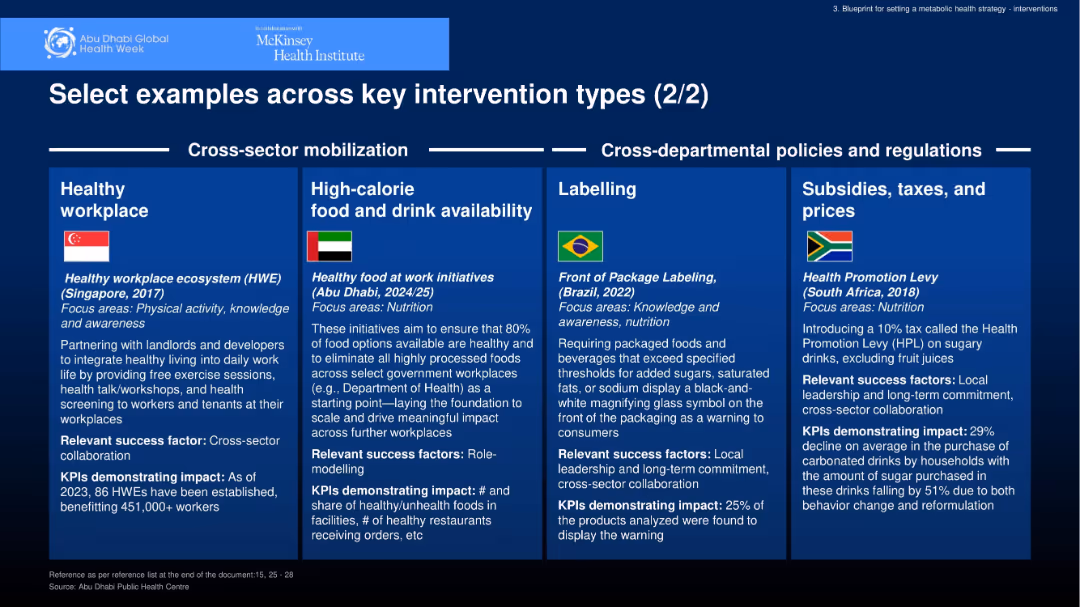
Continuation of boxed multi-panel design under new headers “Cross-sector mobilization” and “Cross-departmental policies.” Each panel contains a country example with metrics and success factors.
Strategic Planning
Healthcare & Pharmaceuticals
Provides more global examples of metabolic health interventions: Singapore’s healthy workplace, Abu Dhabi’s food initiatives, Brazil’s labeling regulations, and South Africa’s sugar tax. Emphasis is on regulation, labeling, access, and workplace health.
workplace health, labeling, taxation, regulation, nutrition
false
Strategic Planning
Healthcare & Pharmaceuticals
Pillar
McKinsey
Add to my slides
Remove from favorites
Previous
Next
You don't have any favorites yet.
Please wait loading your favorites slides...
Create a FREE account to continue browsing
Receive Instant Access to 1,000+ slides from companies like McKinsey, Google, and Goldman Sachs
First Name
Last Name
Email
Password
I agree to all
Terms & Privacy Policy
Thank you! Your submission has been received!
Oops! Something went wrong while submitting the form.
Have an account?
Sign in
Upgrade to PRO to Save slides
Advanced Search and Filters
Access to 15,000+ slides
Access to Category Pages
Save/Bookmark Slides
PowerPoint Template Library
Pick a Plan
MONTHLY
$12/month
Billed every month, Cancel anytime.
YEARLY
$9/year
Billed $108 annually, Cancel anytime.
Checkout for $12/month
Checkout for $108/yr
Secured by Stripe | AES-256 bit encryption