My Account
My Slides
Search by Category
Pricing
Templates
View All Templates
Download Template Slides
✦ AI Search
Feedback
Login
Logout
Get Started
Browse all Slides
Browse all Slides
Create a FREE Account
Instant access to 1,000+ real slides from top companies like McKinsey, BCG, Goldman Sachs, Google and many more!
First Name
Last Name
Email
Password
I agree to all
Terms & Privacy Policy
Thank you! Your submission has been received!
Oops! Something went wrong while submitting the form.
Have an account?
Sign in
Saved Slides
Total No. of slides saved
0
↻ Refresh
✖ Clear all
The slide has a professional layout with dense texts showcasing survey data on workplace mental health across Gen Z and Millennials. It features a clean design with text annotations and color-coded elements for clarity.
Market Analysis and Trends
Professional Services
This slide presents data from a 2023 survey on Gen Z and Millennials' perspectives on workplace mental health. It compares the utilization of mental health resources and the perceived effectiveness of workplace policies.
workplace health, mental health, Gen Z, Millennials, resources, utilization, survey, policies
false
Market Analysis and Trends
Professional Services
Mixed Chart
Deloitte
Add to my slides
Remove from favorites
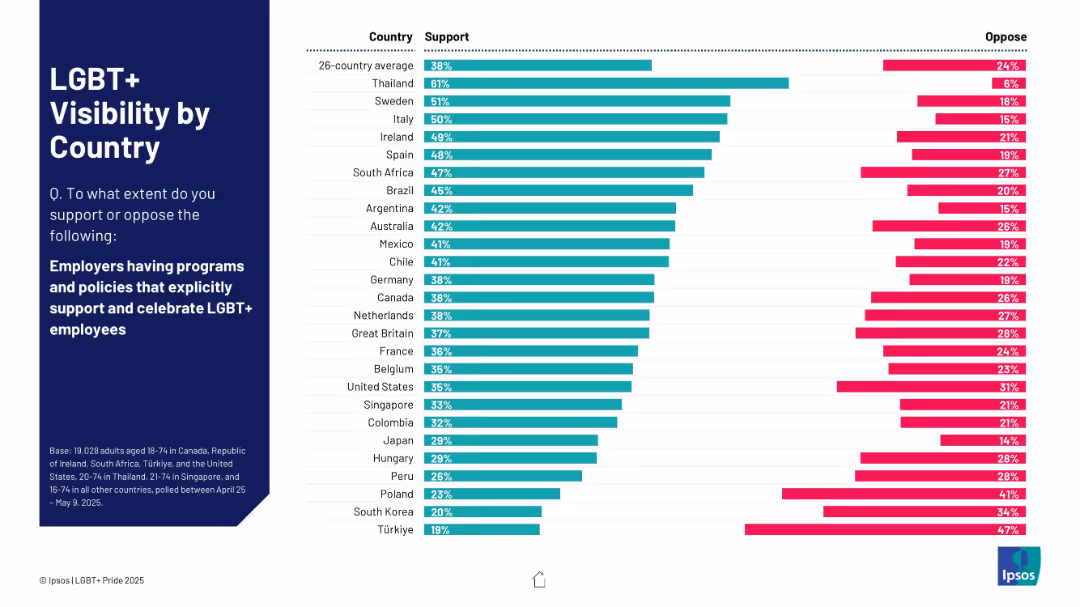
Horizontal bar chart showing support/oppose split for employer LGBT+ programs; countries listed vertically.
Market Analysis and Trends
Government & Public Sector
The chart shows public support for employers having LGBT+ inclusive policies. Thailand ranks highest at 61%, while Türkiye shows the lowest at 19%. Comparative trends are also included.
workplace, LGBT+, support, employers, policies, inclusion, countries
false
Market Analysis and Trends
Government & Public Sector
Mixed Chart
IPSOS
Add to my slides
Remove from favorites
Text and visual indicators (percentage gaps, agreement bars) showing divergence in views between employees and employers on work preferences.
Human Resources and Talent Management
Professional Services
This slide highlights the differences in perceptions between employees and employers regarding new work preferences, including hybrid work, flexibility, travel, and productivity.
Work preferences, divergence, employee, employer, hybrid work, flexibility, percentage gaps
false
Human Resources and Talent Management
Professional Services
Multiple Chart
EY
Add to my slides
Remove from favorites
Balanced layout with visuals and bullet points detailing the workshop experience.
Technology and Digital Transformation
Professional Services
This slide is an invitation to Deloitte's lab experience, offering insights into future work trends and strategic workforce planning.
Workshop, Future of Work, Trends, Planning, Strategy
false
Technology and Digital Transformation
Professional Services
Header Horizontal
Deloitte
Add to my slides
Remove from favorites
Three-column layout with text on the left and a column chart on the right, with bold red bars showing survey percentages.
Market Analysis and Trends
Professional Services
Discussing major forces reshaping the work environment and listing future work trends as predicted by a global survey. The chart presents technological breakthroughs as the highest factor.
work trends, future, technology, survey, economic shifts, demographics, rapid urbanization, resource scarcity, climate change, market structure
false
Market Analysis and Trends
Professional Services
Mixed Chart
PwC/Strategy&
Add to my slides
Remove from favorites
Image-focused slide with a professional woman holding a tablet, with smaller pie chart graphics indicating statistical data on employment trends.
Strategic Planning
Professional Services
A visual narrative reflecting modern work trends, emphasizing the shift towards portfolio careers and diversified employment strategies as predicted by HR professionals.
Work Trends, Mobility, Careers, HR, Diversification
false
Strategic Planning
Professional Services
Mixed Chart
PwC/Strategy&
Add to my slides
Remove from favorites
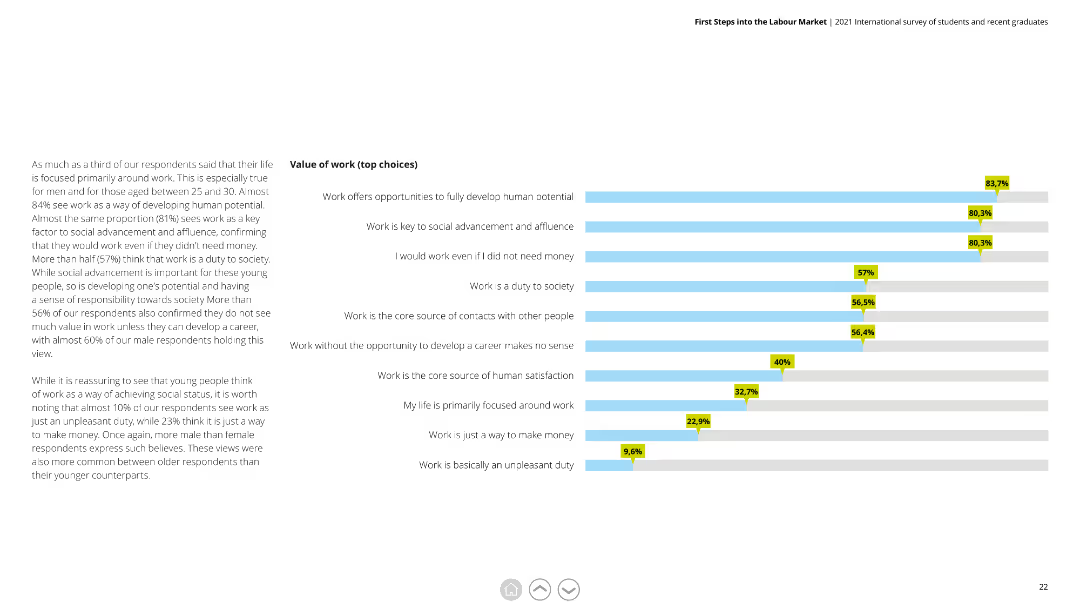
A horizontal bar chart (bar chart) showing top choices for the value of work, with bars for each option and percentage labels.
Market Analysis and Trends
Professional Services
Analyzes what respondents value most about work, highlighting aspects like human potential development and social advancement.
Work Value, Choices, Human Potential, Social Advancement, Respondents
false
Market Analysis and Trends
Professional Services
Mixed Chart
Deloitte
Add to my slides
Remove from favorites
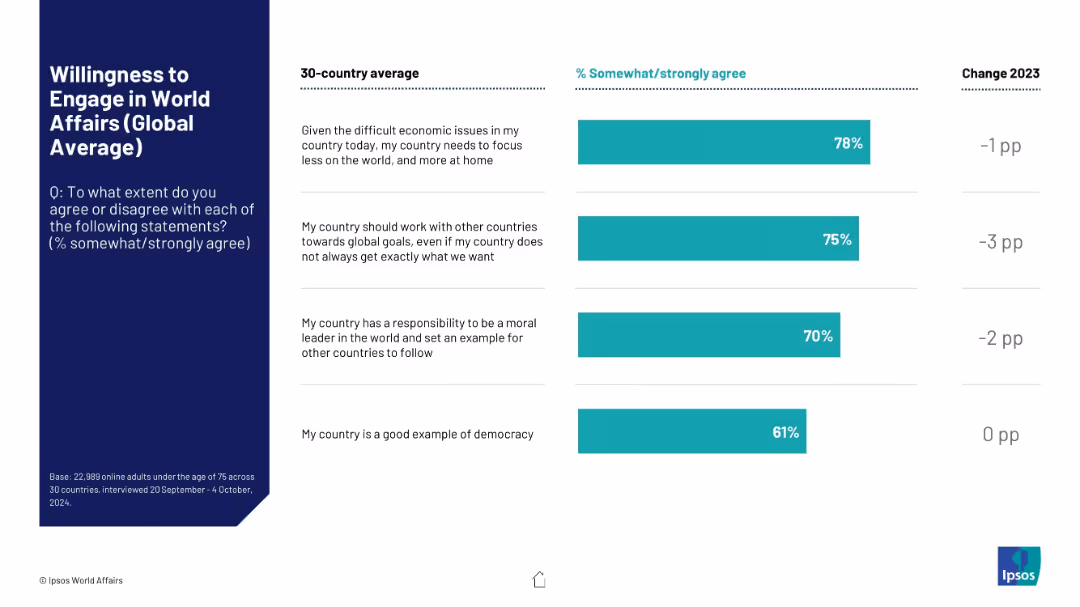
Split format with list-style layout on right showing 4 statements and their global average agreement levels as vertical bars; includes yearly changes.
Market Analysis and Trends
Government & Public Sector
The slide shows average global agreement with four statements about countries’ roles in world affairs, including economic focus, global cooperation, moral leadership, and democratic values. Year-over-year changes are also listed.
world affairs, international cooperation, public opinion, global survey, governance, moral leadership, democracy, foreign policy, Ipsos
false
Market Analysis and Trends
Government & Public Sector
Mixed Chart
IPSOS
Add to my slides
Remove from favorites
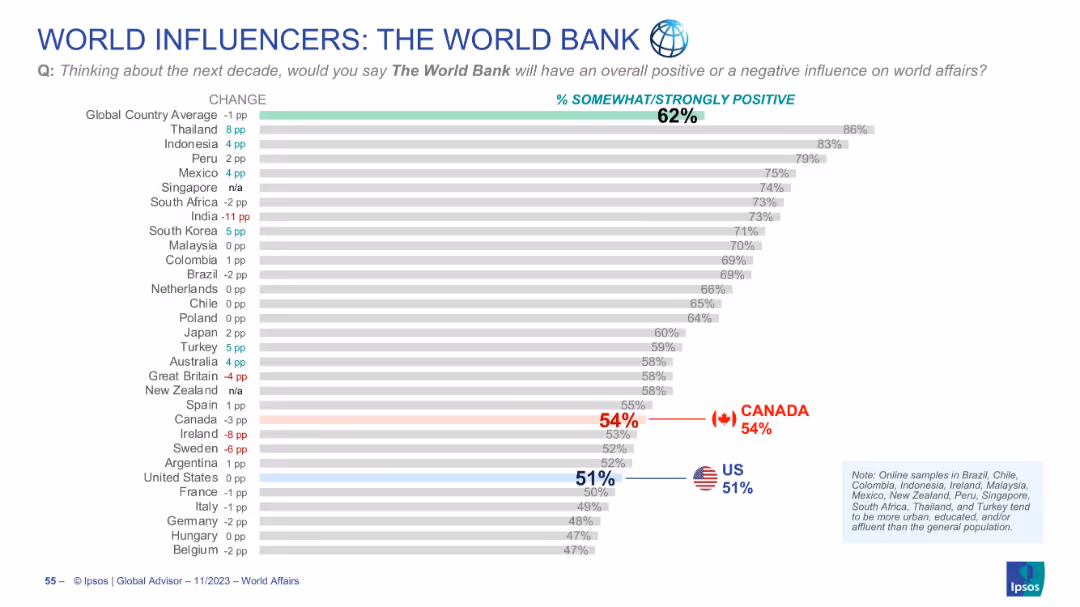
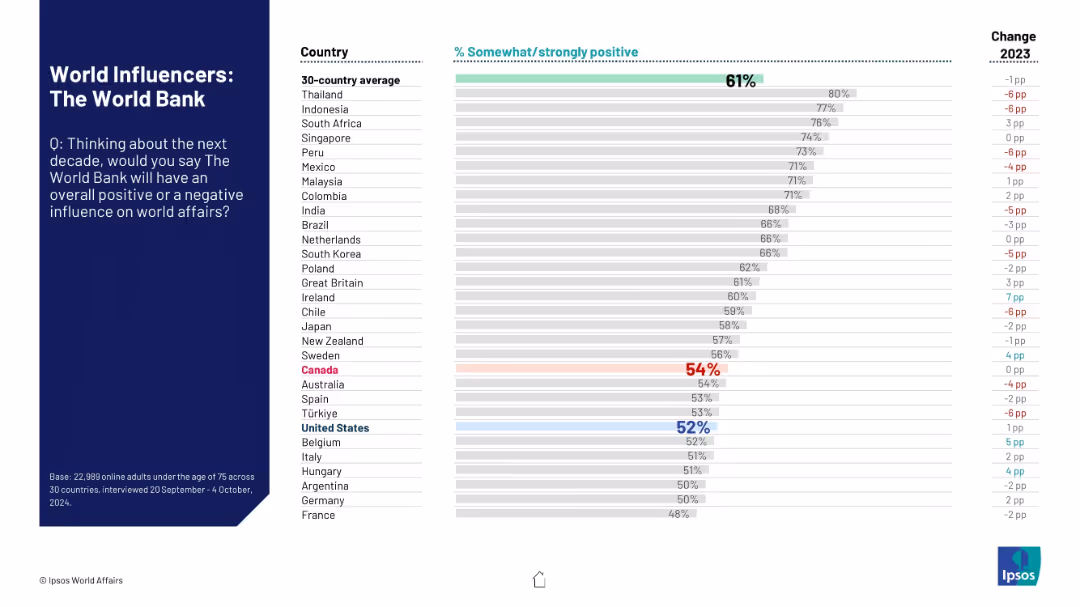
Horizontal bar graph showing opinions on The World Bank’s future global influence
Market Analysis and Trends
Government & Public Sector
Displays perceptions of The World Bank’s role in future global affairs. Canada scores 54%, slightly above the U.S. (51%), both under the global average of 62%. Trends vs last year are noted.
World Bank, global influence, development finance, Ipsos, perception, Canada, US, public opinion, world affairs, bar chart
false
Market Analysis and Trends
Government & Public Sector
Single Chart
IPSOS
Add to my slides
Remove from favorites
Consistent design with left panel for context and question; right side shows bar chart of public sentiment by country.
Market Analysis and Trends
Financial Services
The slide presents perceptions of the World Bank’s influence over the coming decade. Each country's positive sentiment is listed alongside change from the previous year, showing declining confidence in many regions.
World Bank, global perception, development finance, influence, Ipsos, sentiment analysis, country ranking, positive rating, 2024, trend
false
Market Analysis and Trends
Financial Services
Mixed Chart
IPSOS
Add to my slides
Remove from favorites
The slide features a column chart showing world bioenergy consumption by sector (energy, transport, industry, buildings) from 2018 to 2040 under a stated policies scenario. It includes detailed data on the growth of bioenergy use in power, heat, car, truck, shipping, aviation, industry, and residential sectors.
Market Analysis and Trends
Energy & Utilities
This slide projects the growth of world bioenergy consumption across various sectors until 2040, with a focus on the significant contributions from the power and transport sectors to the overall increase in bioenergy demand.
world bioenergy consumption, sector, 2018-2040, power, heat, transport, industry, buildings, growth forecast
false
Market Analysis and Trends
Energy & Utilities
Single Chart
Kearney
Add to my slides
Remove from favorites
The slide features a column chart comparing world biofuel demand by fuel type (solid biofuels, liquid biofuels, CHP from waste, biogases) for 2017. It highlights the dominance of traditional biofuels and the distribution of advanced biofuels.
Market Analysis and Trends
Energy & Utilities
This slide provides an overview of world biofuel demand by different fuel types, emphasizing the overwhelming dominance of traditional biofuels and the distribution of advanced biofuels across various categories.
world biofuel demand, fuel type, traditional biofuels, advanced biofuels, 2017, solid biofuels, liquid biofuels, CHP from waste, biogases
false
Market Analysis and Trends
Energy & Utilities
Single Chart
Kearney
Add to my slides
Remove from favorites
A comparative bar chart showing top concerns among Millennials and Gen Z before and after the pandemic, with categories like climate change and health care.
Market Analysis and Trends
Professional Services
This slide compares the primary concerns of Millennials and Gen Z before and after the pandemic, focusing on issues like climate change and health care.
World challenges, pandemic, Millennials, Gen Z, concerns, climate change, health care, comparison, global issues
false
Market Analysis and Trends
Professional Services
Multiple Chart
Deloitte
Add to my slides
Remove from favorites
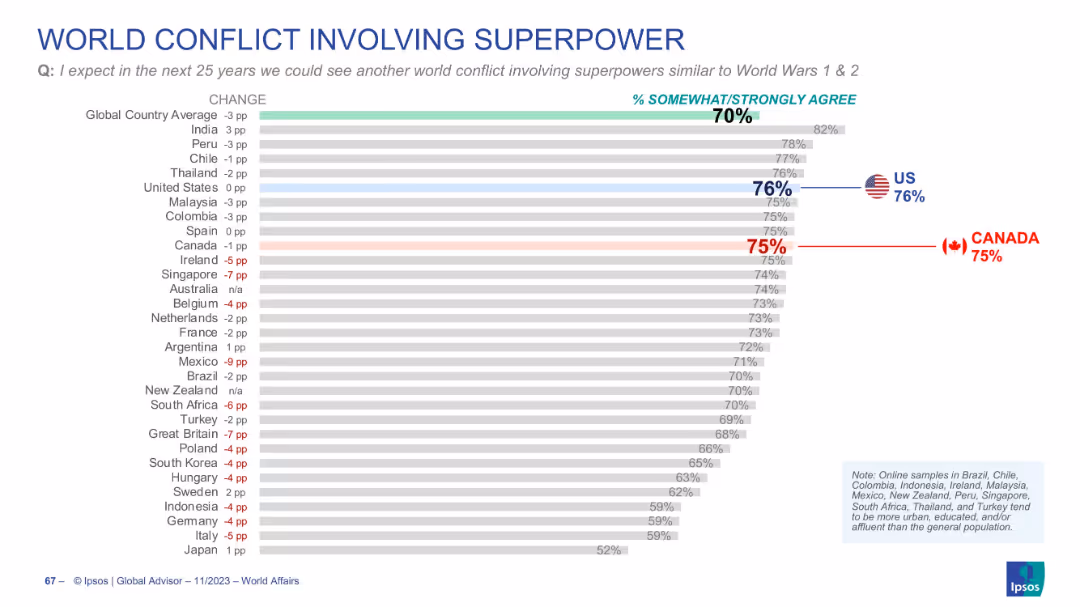
Horizontal bar chart comparing countries’ agreement levels; includes percentage changes; U.S. and Canada highlighted; clean layout with bold headers.
Market Analysis and Trends
Government & Public Sector
This slide presents survey results on the expectation of a future world conflict involving superpowers, similar to WWI/WWII. It shows percentage agreement by country, highlighting that 70% globally agree, with the US and Canada both around 75–76%. Change over time is also displayed.
world conflict, superpowers, global opinion, Canada, US, survey, Ipsos
false
Market Analysis and Trends
Government & Public Sector
Single Chart
IPSOS
Add to my slides
Remove from favorites
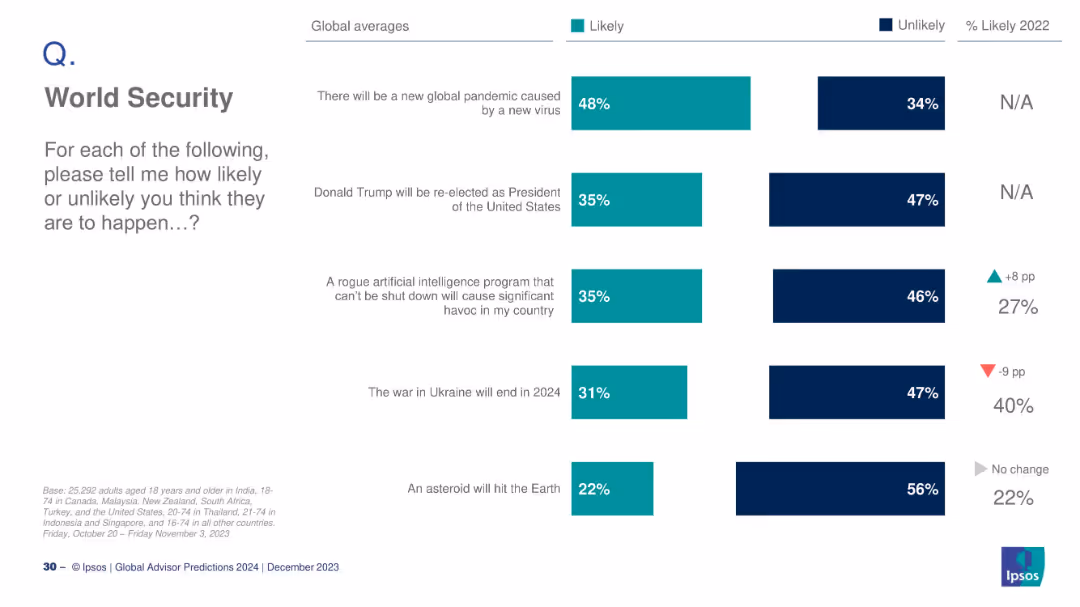
Vertical bar chart with teal and navy bars showing global averages of likelihood; minimalistic layout.
Strategic Planning
Government & Public Sector
This slide summarizes global perceptions on the likelihood of several world security events happening, such as a new pandemic, AI risks, war resolution, and asteroid impact. Percentages reflect perceived likelihoods across categories, with some showing year-over-year change indicators.
world security, predictions, AI, pandemic, Ukraine war, asteroid, Trump, global risk, Ipsos, 2024 survey
false
Strategic Planning
Government & Public Sector
Mixed Chart
IPSOS
Add to my slides
Remove from favorites
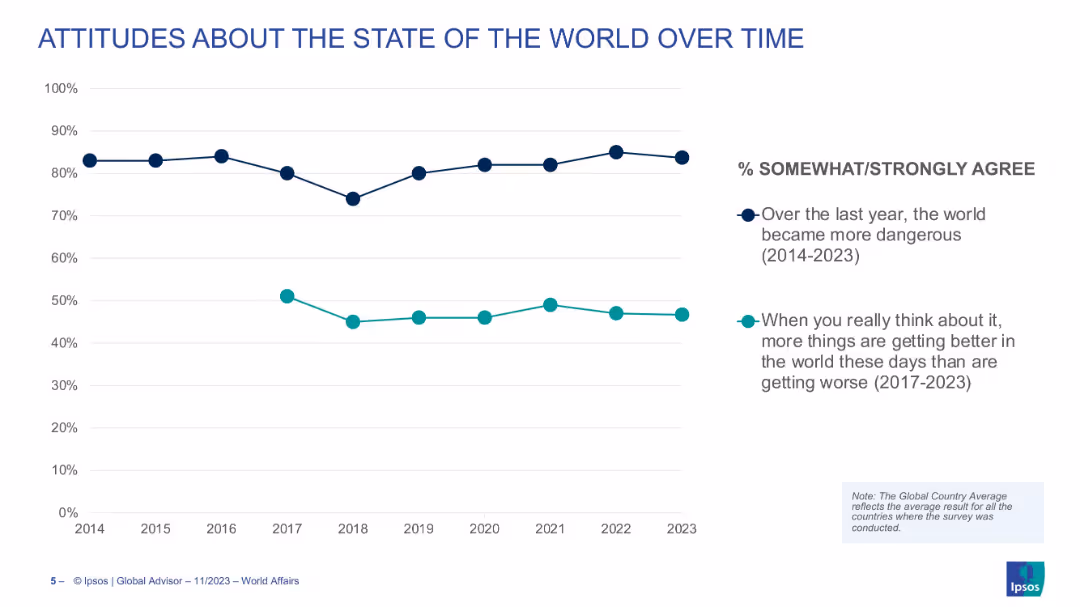
Line graph showing two trendlines over time (2014–2023): one for belief the world is more dangerous, and another for belief that more things are getting better.
Market Analysis and Trends
Media & Entertainment
The slide tracks global attitudes toward danger and optimism over nearly a decade, showing consistent concern about safety and a more fluctuating view on global progress.
world views, optimism, danger, global trends, perceptions, time-series, sentiment
false
Market Analysis and Trends
Media & Entertainment
Single Chart
IPSOS
Add to my slides
Remove from favorites
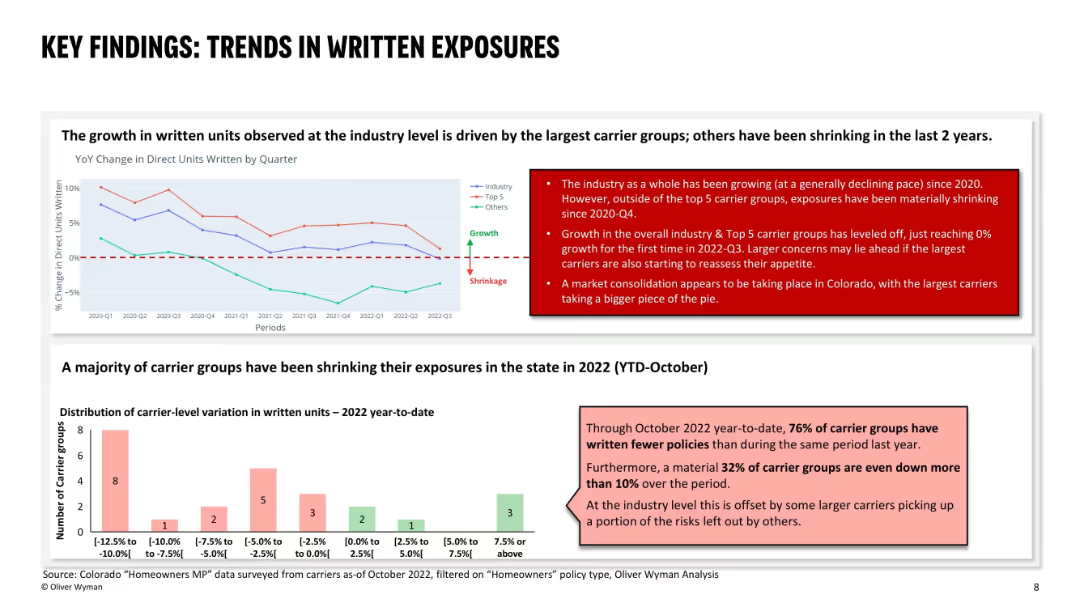
Two main graphs: upper section shows YoY % change in written units by quarter; lower section is a bar chart showing distribution of changes in carrier activity; red text boxes call out key messages; uses line graphs to compare industry, top 5, and others.
Customer and Market Segmentation
Financial Services
The slide identifies shrinking exposures by most carriers in Colorado, despite slight overall industry growth driven by the top 5 groups. Since late 2020, non-top carriers have notably reduced exposure, suggesting market consolidation. 76% of carrier groups wrote fewer policies in 2022 than in 2021.
written exposures, carrier groups, policy volume, segmentation, Colorado, market shrinkage, insurance, homeowners, consolidation
false
Customer and Market Segmentation
Financial Services
Multiple Chart
Oliver Wyman
Add to my slides
Remove from favorites
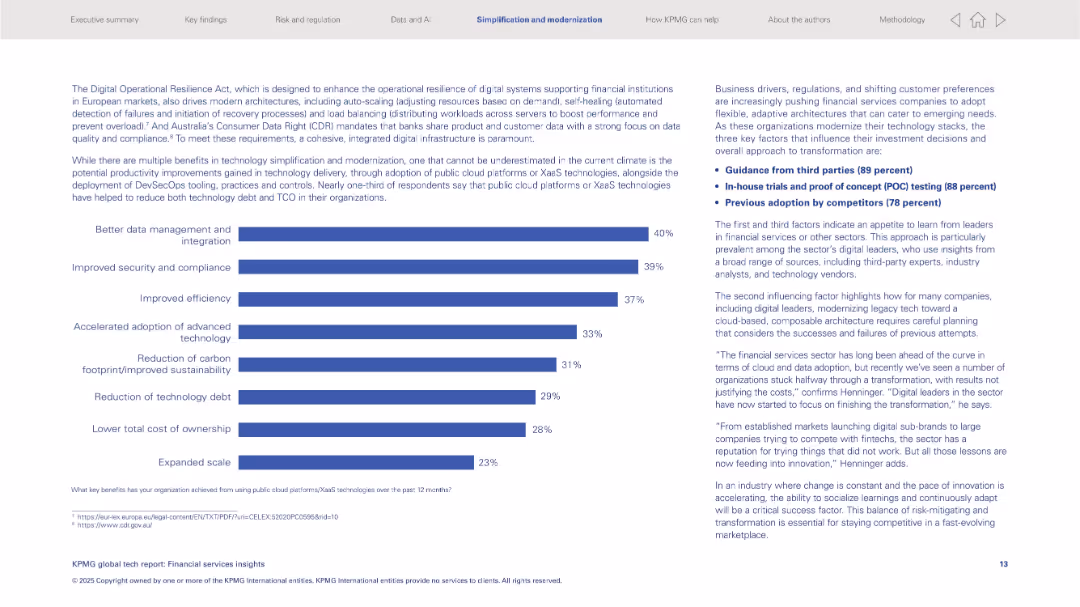
Left: horizontal bar graph listing tech benefits; right: text insights and key influencing factors.
Operational Efficiency
Financial Services
Discusses benefits from public cloud/XaaS like better data integration and security. Key transformation drivers include third-party guidance, in-house testing, and competitor adoption. Also addresses modernization of legacy tech stacks.
XaaS, cloud platforms, modernization, security, integration, third-party advice, financial sector
false
Operational Efficiency
Financial Services
Mixed Chart
KPMG
Add to my slides
Remove from favorites
Left side explains improvement across tech categories; right side features a vertical progress bar chart. Far right has a bold statistic highlight.
Technology and Digital Transformation
Technology & Software
Organizations are maturing across tech categories, especially XaaS and data/analytics. Chart shows progress from 2023 to 2024 in four key tech areas. Notes ASPAC is leading in proactive implementation. Calls out 86% prioritizing XaaS for agility and cost savings.
XaaS, cloud, strategy evolution, tech maturity, AI, cybersecurity
false
Technology and Digital Transformation
Technology & Software
Mixed Chart
KPMG
Add to my slides
Remove from favorites
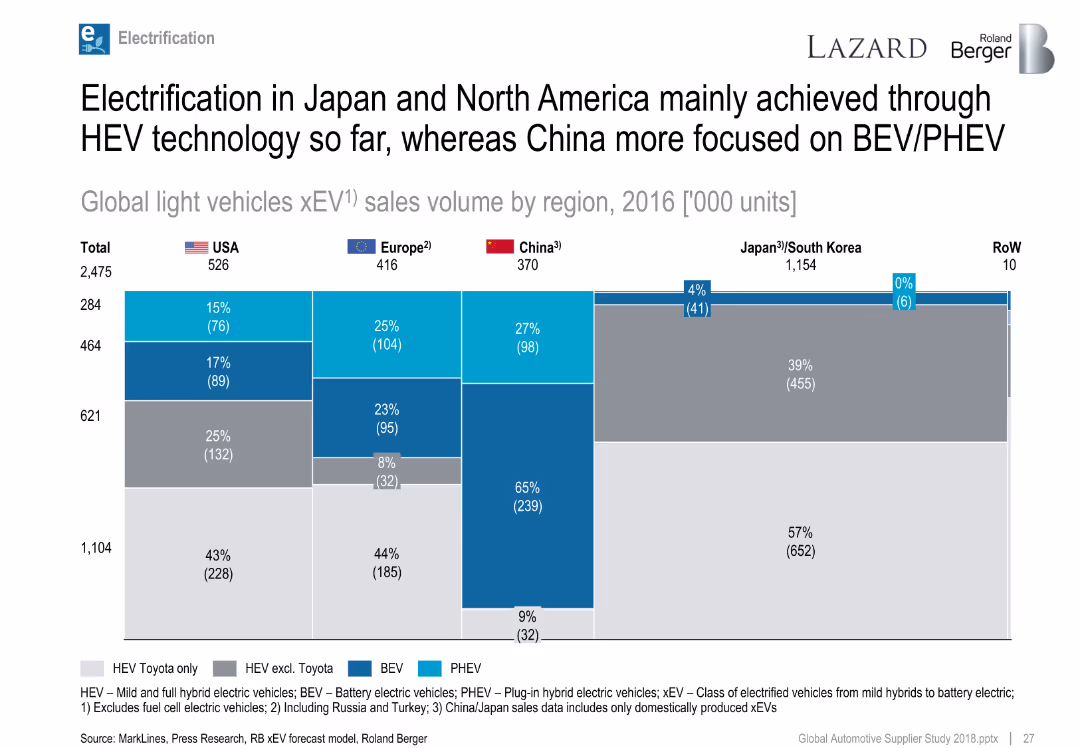
Stacked bar chart by region, with labels, legend, and region flags. Lazard & Roland Berger branding.
Market Analysis and Trends
Industrial & Manufacturing
The slide compares global xEV sales volumes by region in 2016, showing the dominance of HEVs in Japan and the US and higher BEV/PHEV focus in China.
xEV, HEV, BEV, PHEV, regional comparison, electrification, automotive
false
Market Analysis and Trends
Industrial & Manufacturing
Single Chart
Roland Berger
Add to my slides
Remove from favorites
The slide features a complex, data-driven layout with multiple column charts comparing the 2020 and 2027 market sizes of different xEV segments (HEV, PHEV, BEV). It also includes text boxes with key insights, and a map representation of segment growth. Colors are used to differentiate segments.
Market Analysis and Trends
Transportation & Logistics
This slide analyzes the electric vehicle market, highlighting the growth projections for different sub-segments like HEV, PHEV, and BEV by 2027. It emphasizes BEVs as having the highest potential growth, supported by changes in regulations and advancements in technology.
xEV, market growth, HEV, PHEV, BEV, 2027 projections, environmental regulations, technology advancement
false
Market Analysis and Trends
Transportation & Logistics
Mixed Chart
PwC/Strategy&
Add to my slides
Remove from favorites
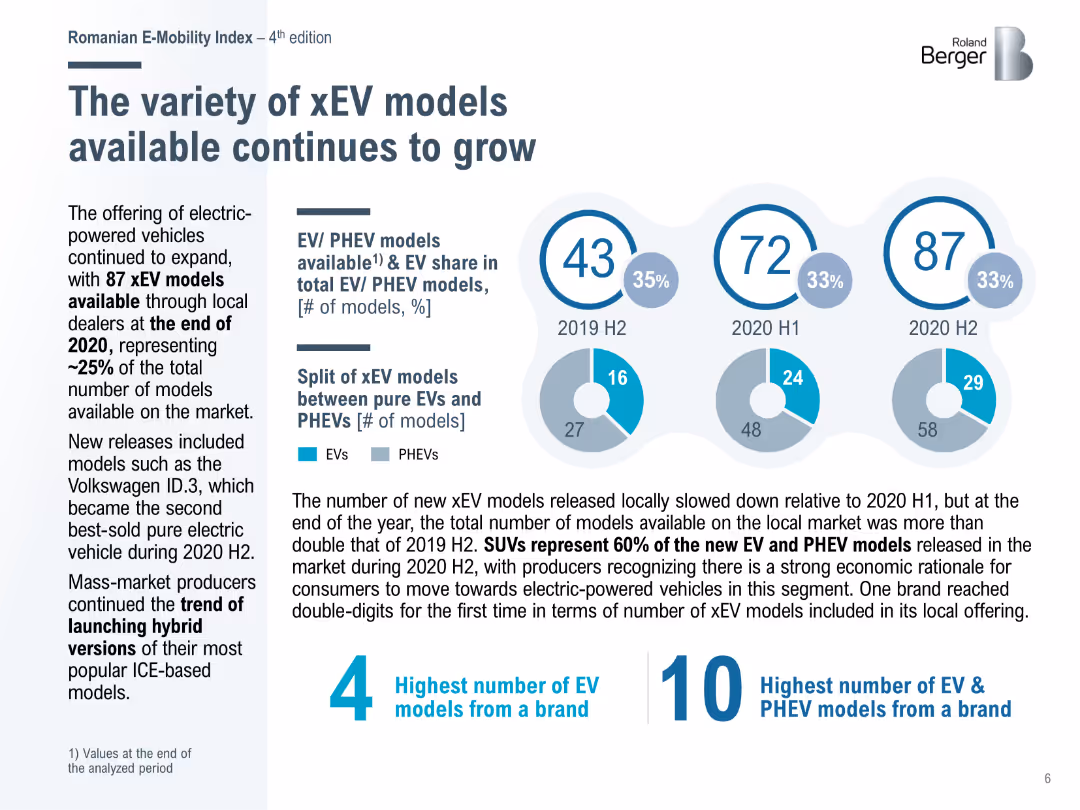
Pie charts showing the growth in the number of EV and PHEV models available in Romania from 2019 to 2020, with a focus on the increasing variety of electric vehicles.
Product and Service Analysis
Transportation & Logistics
Discusses the expanding variety of xEV models available in the Romanian market, emphasizing the growth in model offerings and the increasing consumer choice for electric vehicles.
xEV models, EV variety, Romania, market growth, 2020
false
Product and Service Analysis
Transportation & Logistics
Mixed Chart
Roland Berger
Add to my slides
Remove from favorites
Shows global xEV sales data through column charts and a pie chart detailing the share of xEV types in 2020.
Market Analysis and Trends
Transportation & Logistics
Analyzes the rise of xEVs globally, detailing sales trends and market penetration from 2010 to projections for 2021+. Ideal for stakeholders in automotive sectors.
xEVs, market trends, automotive industry, global sales, electric vehicles, market penetration
false
Market Analysis and Trends
Transportation & Logistics
Multiple Chart
BCG
Add to my slides
Remove from favorites
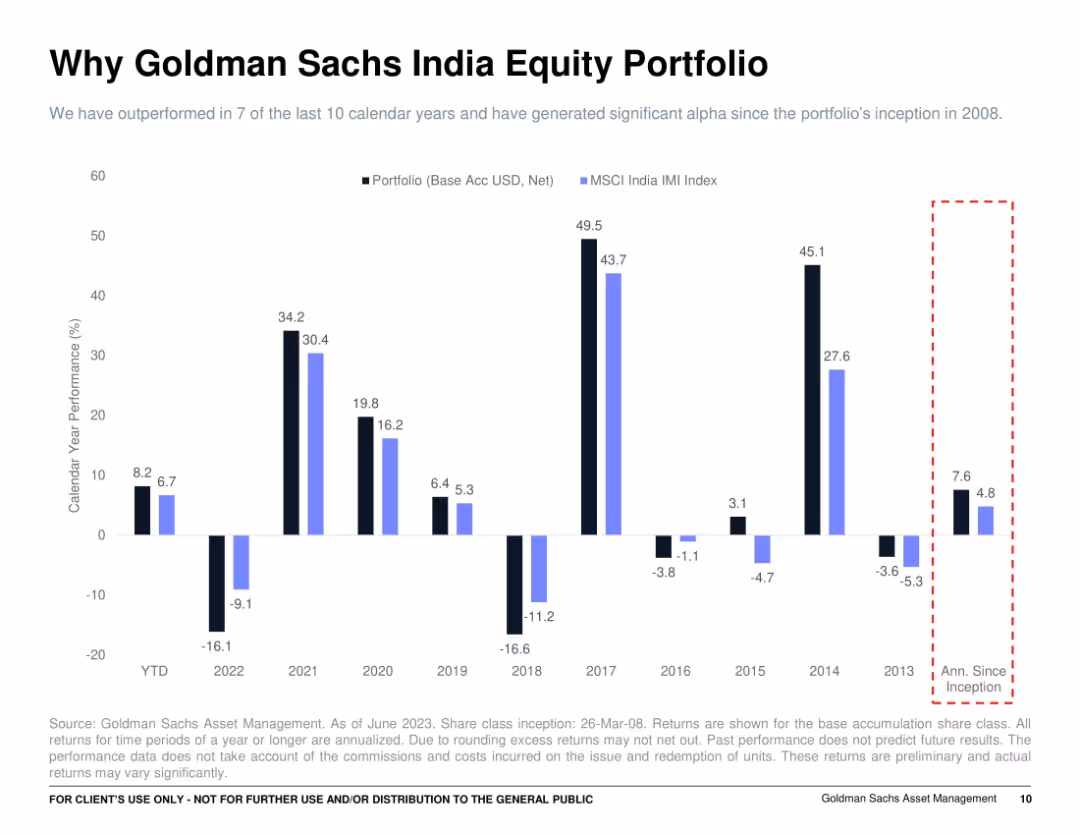
Bar chart of calendar year returns (2013–2023 YTD) with black and blue bars for portfolio vs. MSCI India IMI Index; right-side red dashed box showing annualized return since inception.
Financial Performance
Financial Services
Illustrates year-by-year net performance of Goldman Sachs India Equity Portfolio compared to the MSCI India IMI Index. The slide shows the portfolio outperforming in most years, highlighting consistency and resilience, and an annualized return since inception that beats the benchmark.
yearly performance, equity returns, MSCI India, alpha generation, GS portfolio, outperformance
false
Financial Performance
Financial Services
Single Chart
Goldman Sachs
Add to my slides
Remove from favorites
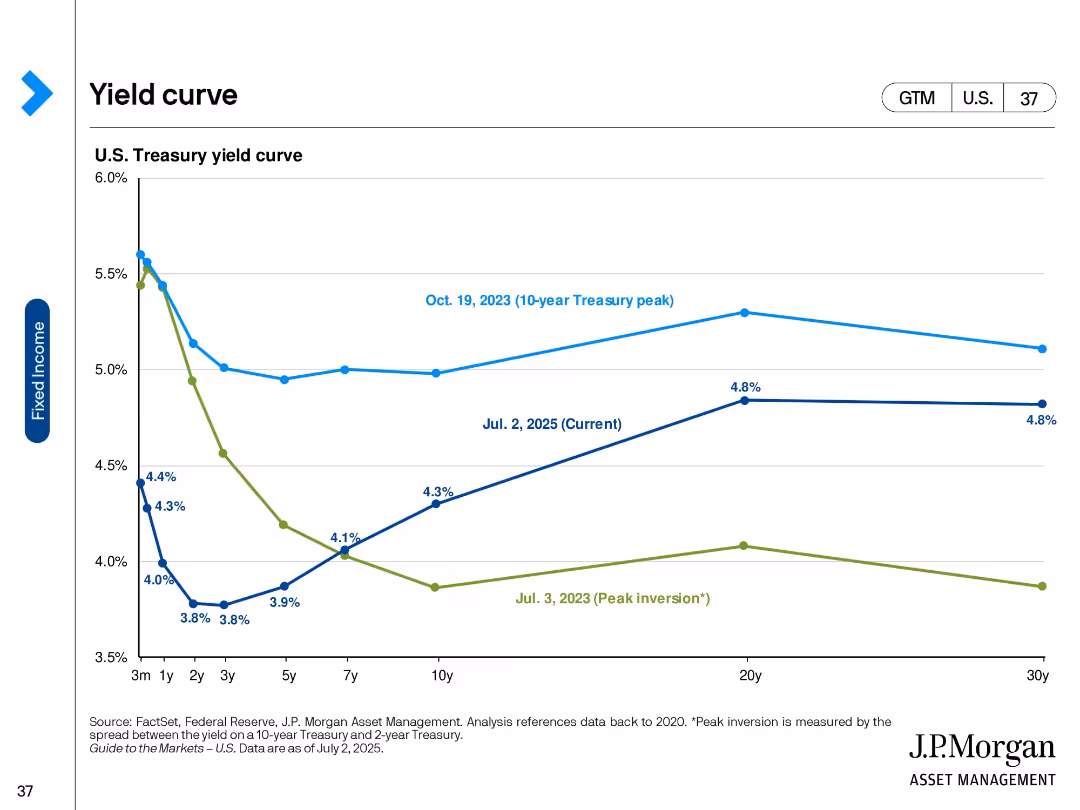
Line chart comparing U.S. Treasury yield curves across three dates with labeled peaks and inversions.
Market Analysis and Trends
Financial Services
This slide compares U.S. Treasury yield curves at three points: July 2, 2025, October 19, 2023 (10-year peak), and July 3, 2023 (peak inversion). It highlights changes in short- and long-term interest rates, showing trends in fixed income expectations.
Yield curve, Treasury rates, interest rates, peak inversion, bond market, fixed income, economic outlook, J.P. Morgan, U.S. yields, duration
false
Market Analysis and Trends
Financial Services
Single Chart
JP Morgan
Add to my slides
Remove from favorites
A scatter plot showing yield/duration for various loans and credit types, alongside a column chart comparing 10-year correlation with U.S. Treasuries.
Investment Analysis
Financial Services
This slide analyzes the yield and duration of various loans and credit securities, along with their correlation to U.S. Treasuries, providing insight into rate risk and credit exposure strategies.
yield, duration, credit exposure, U.S. Treasuries, rate risk
false
Investment Analysis
Financial Services
Multiple Chart
Morgan Stanley
Add to my slides
Remove from favorites
The slide features two sections; the left side has a scatter plot titled 'Yield/Duration' with various investment types plotted. The right side shows a column chart titled '10-Year Correlation with U.S. Treasuries' indicating correlation values. The design is professional, with a color scheme of purple and blue, and the graphs are clearly labeled.
Risk Assessment and Management
Financial Services
The left graph compares the yield to duration of various loans and securities. The right bar chart displays the 10-year correlation of different investment types with U.S. Treasuries, providing insight into interest rate risk and investment strategy.
Yield, Duration, Rate Risk, Credit Exposure, Correlation, U.S. Treasuries, Investment, Floating-Rate Loan, High-Yield Corp, EM Sovereign
false
Risk Assessment and Management
Financial Services
Multiple Chart
Morgan Stanley
Add to my slides
Remove from favorites
A dual-chart layout, one depicting yield/duration for various financial instruments and the other showing correlation with U.S. Treasuries, to compare rate risks and credit exposure.
Risk Assessment and Management
Financial Services
The slide contrasts the yield/duration metrics of different investment vehicles with their correlation to U.S. Treasuries, useful in risk management and investment strategy formulation.
yield, duration, rate risk, credit exposure, investment vehicles, correlation, US Treasuries, strategy
false
Risk Assessment and Management
Financial Services
Multiple Chart
Morgan Stanley
Add to my slides
Remove from favorites
Features two line charts: 'AAA Muni-to-Treasury Yield Ratios' and 'Credit Quality Spreads vs. AAA'. Both charts include timelines from 2014 to 2024, color differentiation for clarity, and a data table for current and historical metrics in a clean and organized manner.
Market Analysis and Trends
Financial Services
This slide offers an update on the municipal bond market, focusing on yield ratios and credit quality spreads. Aimed at investors or analysts, it provides a clear visual representation of the market's condition, comparing municipal bonds to treasury yields and assessing credit quality differences, crucial for strategic financial planning or market forecasting.
Yield Ratios, Credit Spreads, Municipal Bonds, Treasury, AAA
false
Market Analysis and Trends
Financial Services
Multiple Chart
Morgan Stanley
Add to my slides
Remove from favorites
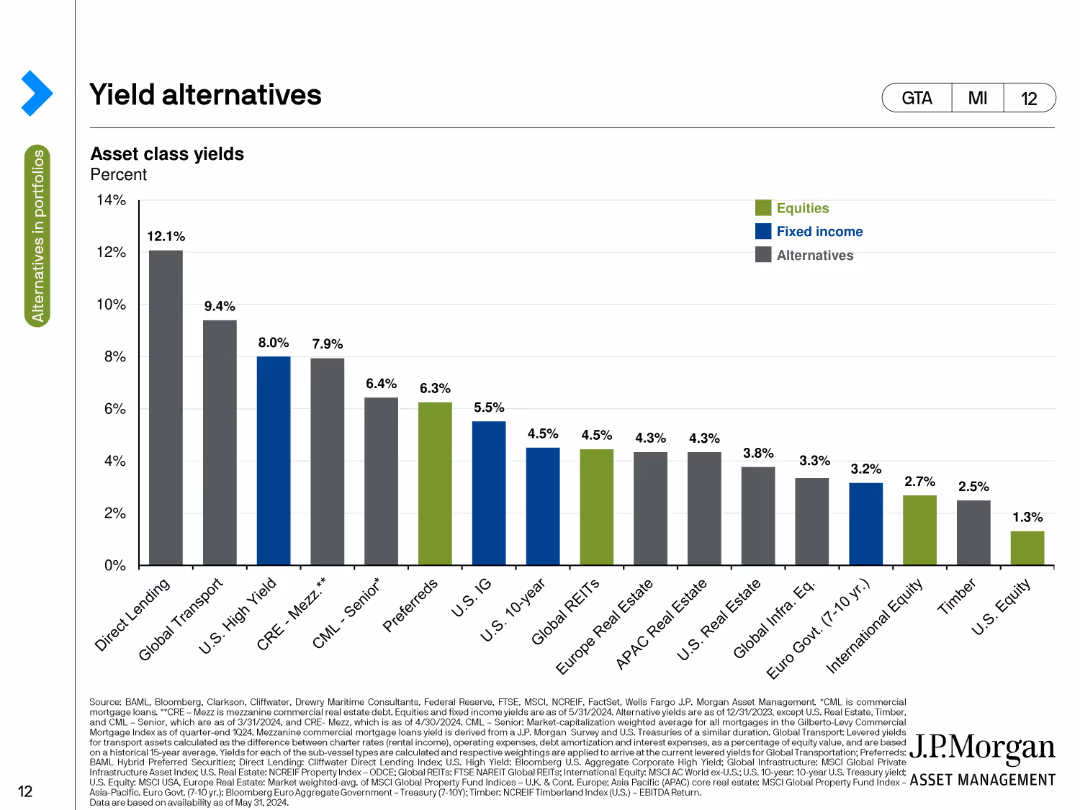
The slide displays a column chart of asset class yields in percentage terms. Different colors represent equities, fixed income, and alternatives, with the highest yields shown for direct lending and global transport.
Investment Analysis
Financial Services
This slide compares asset class yields, highlighting the percentage yields for different investment types such as equities, fixed income, and alternatives, with a focus on the highest yielding options available as of the current date.
Yields, Asset Classes, Equities, Fixed Income, Alternatives
false
Investment Analysis
Financial Services
Single Chart
JP Morgan
Add to my slides
Remove from favorites
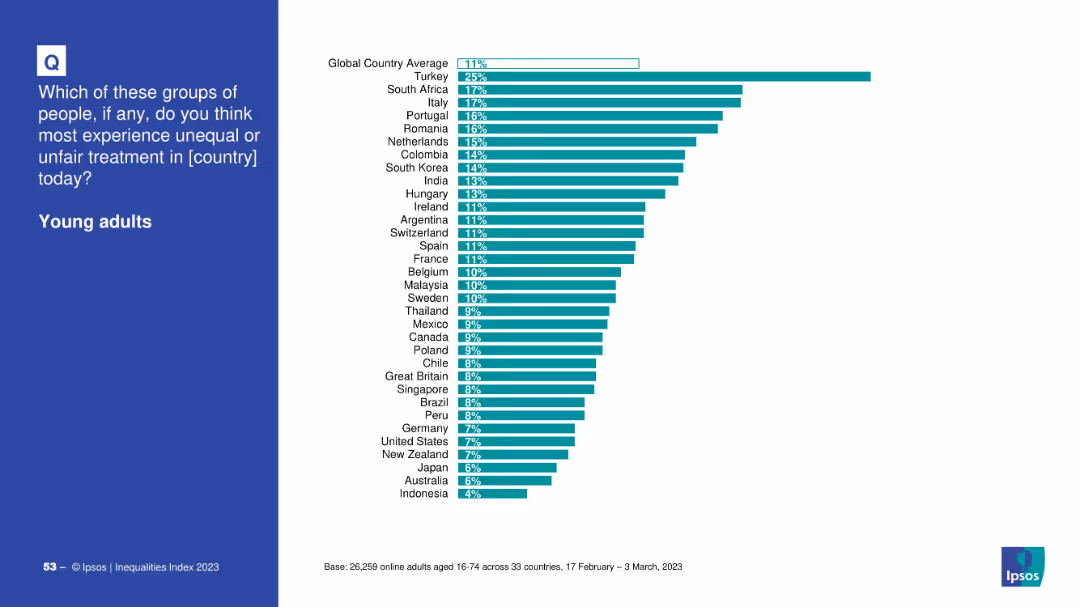
Global bar chart by country with emphasis on countries like Turkey and South Africa
Market Analysis and Trends
Government & Public Sector
This slide focuses on perceived unfair treatment of young adults. Turkey and South Africa show the highest levels of concern, while Indonesia and Australia rank lowest. The overall global average is 11%.
young adults, age bias, inequality, Ipsos, survey results, country ranking, public perception
false
Market Analysis and Trends
Government & Public Sector
Mixed Chart
IPSOS
Add to my slides
Remove from favorites
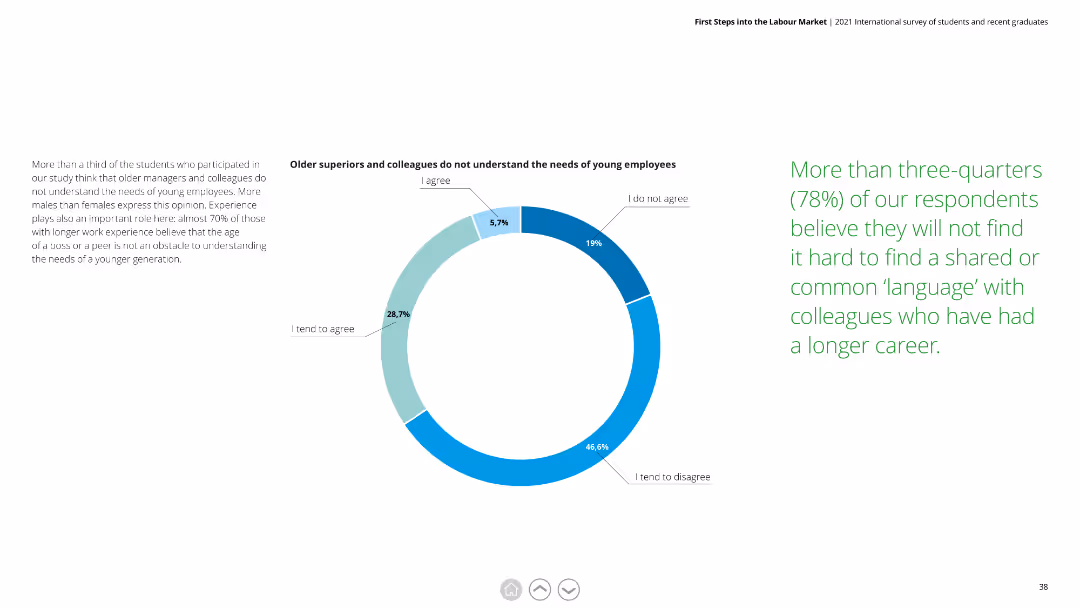
This slide features a pie chart with blue and green segments. Text is divided into three columns, explaining the findings. There is minimal graphical clutter, making the data easy to interpret.
Human Resources and Talent Management
Professional Services
Analyzes the perception that older managers do not understand the needs of young employees. Highlights gender differences and the importance of experience.
young employees, older managers, needs, perception, gender differences, experience
false
Human Resources and Talent Management
Professional Services
Mixed Chart
Deloitte
Add to my slides
Remove from favorites
The slide includes pie charts showing the development of self-confidence, presentation skills, and business networking skills among participants.
Strategic Planning
Education & Training
The slide describes the Your Future program, focusing on supporting young people in transitioning from school to work through training and coaching.
Your Future, self-confidence, training, coaching
false
Strategic Planning
Education & Training
Multiple Chart
EY
Add to my slides
Remove from favorites
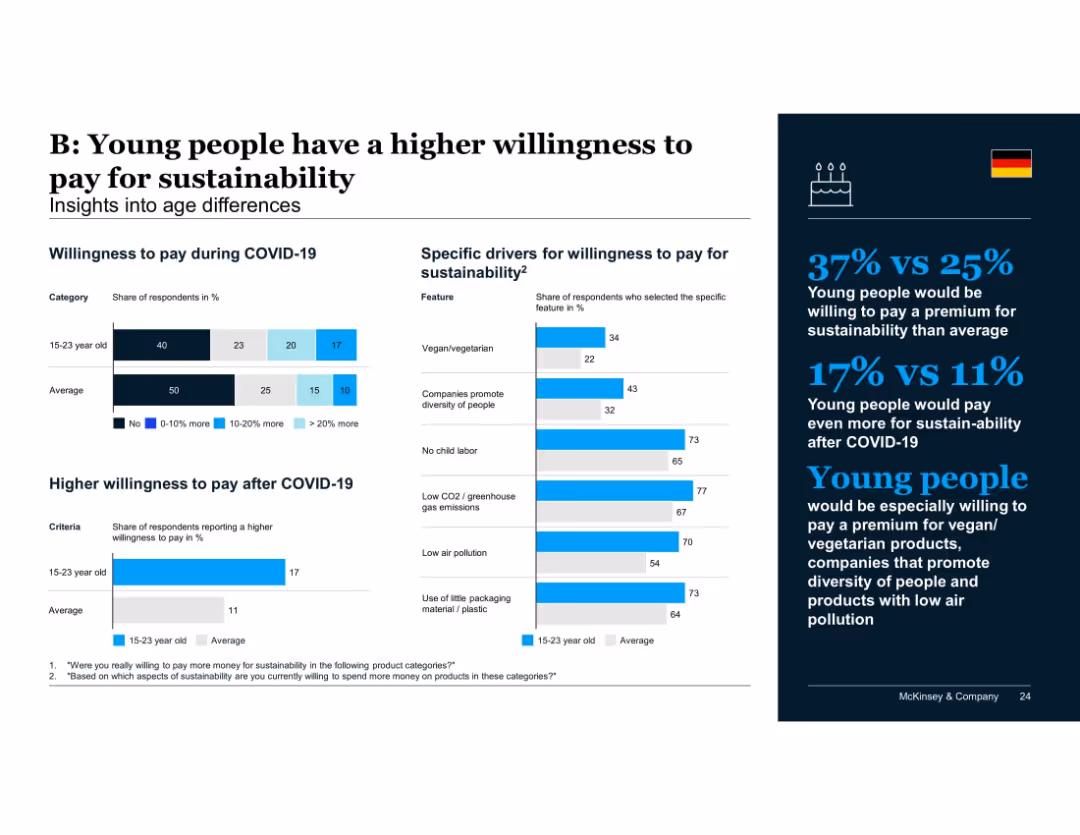
Age comparison layout: bar charts highlighting 15–23 year olds vs. average in willingness to pay and driver preferences; text insights in blue on right.
Customer and Market Segmentation
Consumer Goods
Young consumers show the highest willingness to pay for sustainability, both during and after COVID-19. They are especially responsive to ethical and environmental criteria such as vegan options, diversity, and low emissions.
youth, sustainability, age demographics, ethical consumption, diversity, willingness to pay, consumer behavior
false
Customer and Market Segmentation
Consumer Goods
Multiple Chart
McKinsey
Add to my slides
Remove from favorites
Three sets of column charts displaying agreement percentages by age group on trusting business leaders, career fulfillment, and wealth disparity.
Market Analysis and Trends
Government & Public Sector
It examines how younger people compare to older cohorts regarding trust in business leaders, career goals, and views on income inequality.
youth, trust, career focus, wealth disparity, business leaders, column chart, age groups
false
Market Analysis and Trends
Government & Public Sector
Multiple Chart
IPSOS
Add to my slides
Remove from favorites
This slide has a colorful and dynamic layout with pie charts, icons, and significant percentages displayed, highlighting year-over-year growth in YouTube watch time, with a particular emphasis on mobile device usage.
Market Analysis and Trends
Technology & Software
The slide details the three main factors contributing to the increase in YouTube watch time: non-English content, local language searches, and mobile-first content. It showcases the impact of these forces with the aid of visual data representations.
YouTube, growth, mobile, local language, watch time
false
Market Analysis and Trends
Technology & Software
Linear Flow
BCG
Add to my slides
Remove from favorites
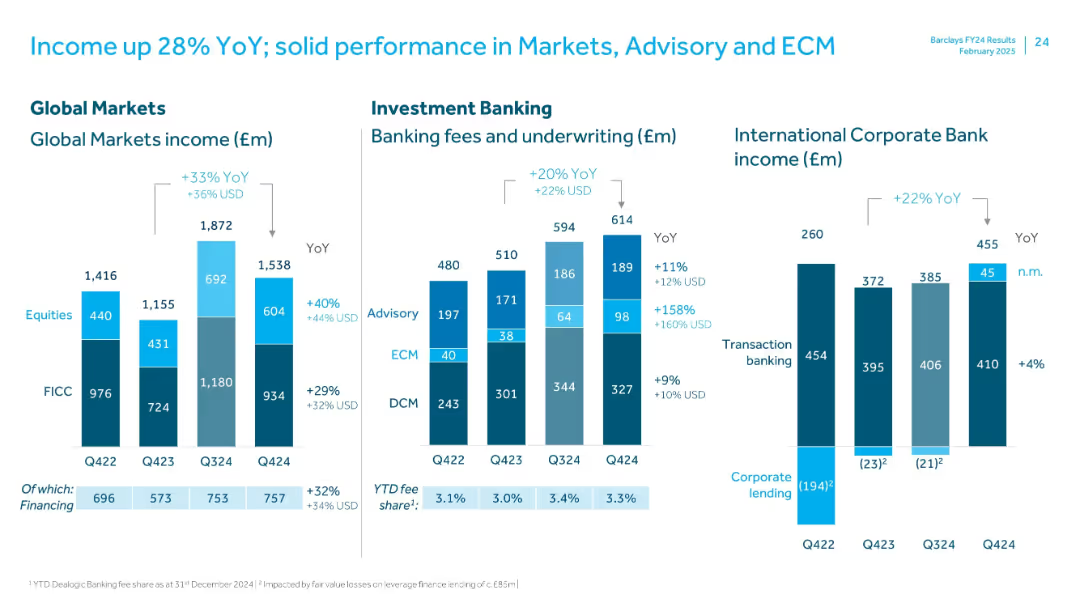
Three-panel bar chart layout with segmented color-coded bars; includes YoY comparisons, labeled categories (Global Markets, Investment Banking, Corporate Bank), and numeric callouts; clean white background with blue accents.
Financial Performance
Financial Services
The slide presents income performance for Q4 2024, showing YoY growth across Global Markets (+33%), Investment Banking (+20%), and International Corporate Bank (+22%). Equities, FICC, and fees are broken out, highlighting strong Equities and Advisory growth.
YoY growth, equities, FICC, advisory, ECM, corporate bank, income, Q4 2024
false
Financial Performance
Financial Services
Multiple Chart
Barclays
Add to my slides
Remove from favorites
Similar to the previous slide, this one also has multiple column charts but focuses on year-to-date (YTD) performance for the same metrics.
Market Analysis and Trends
Financial Services
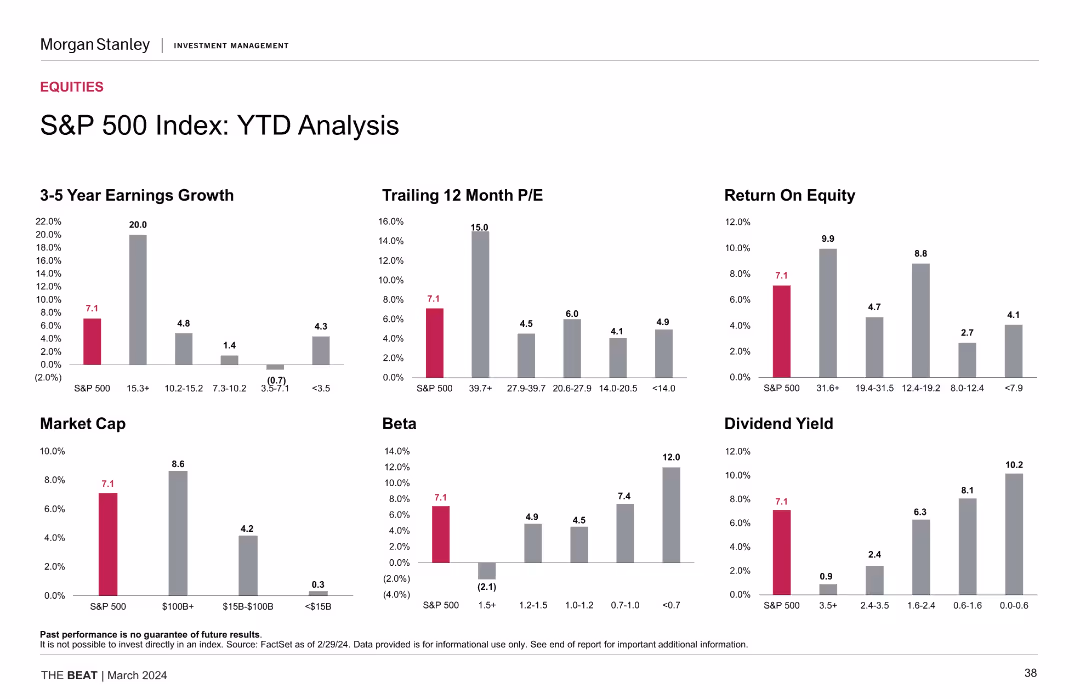
The slide provides a year-to-date performance analysis of the S&P 500 index, including earnings growth, P/E ratios, ROE, market cap, beta, and dividend yield metrics.
YTD analysis, financial metrics, S&P 500, performance
false
Market Analysis and Trends
Financial Services
Multiple Chart
Morgan Stanley
Add to my slides
Remove from favorites
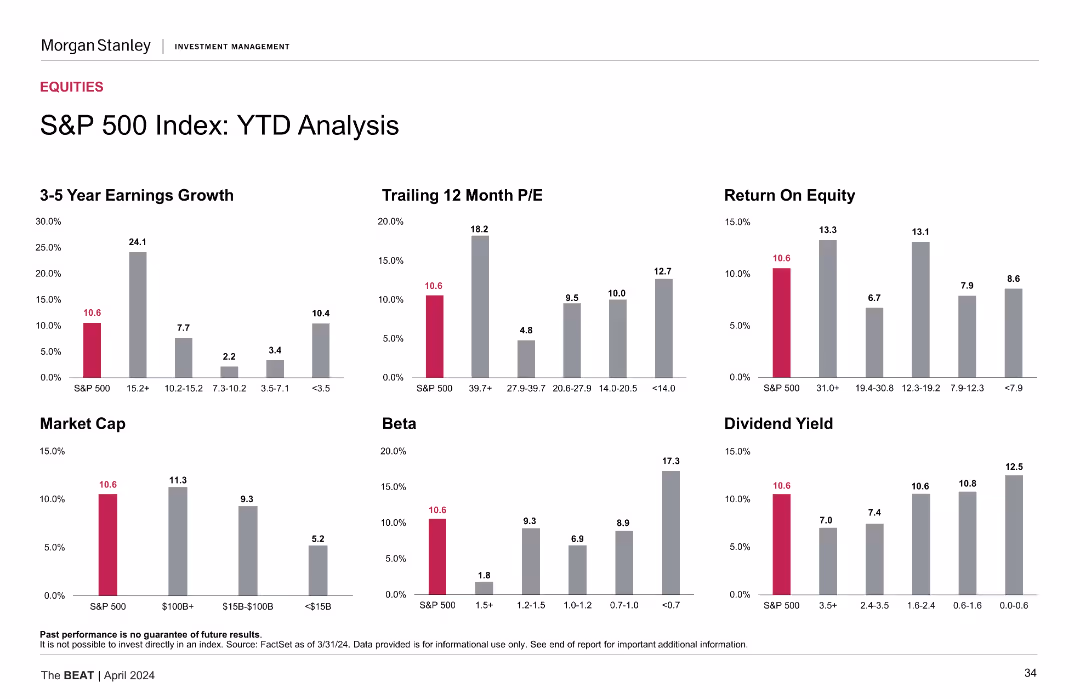
The slide includes multiple column charts that analyze the S&P 500 Index's year-to-date (YTD) performance. Metrics such as earnings growth, trailing 12-month P/E, return on equity, market cap, beta, and dividend yield are displayed in distinct colors.
Financial Performance
Financial Services
This slide details the YTD performance of the S&P 500 Index, presenting various financial metrics such as earnings growth, P/E ratio, return on equity, market cap, beta, and dividend yield to provide a comprehensive performance overview.
YTD analysis, S&P 500, financial metrics, earnings growth, market cap, P/E ratio, beta, dividend yield, return on equity
false
Financial Performance
Financial Services
Multiple Chart
Morgan Stanley
Add to my slides
Remove from favorites
Similar grid to the previous slide but focuses on YTD data; includes earnings growth, ROE, and dividend yield trends.
Performance Metrics and KPIs
Financial Services
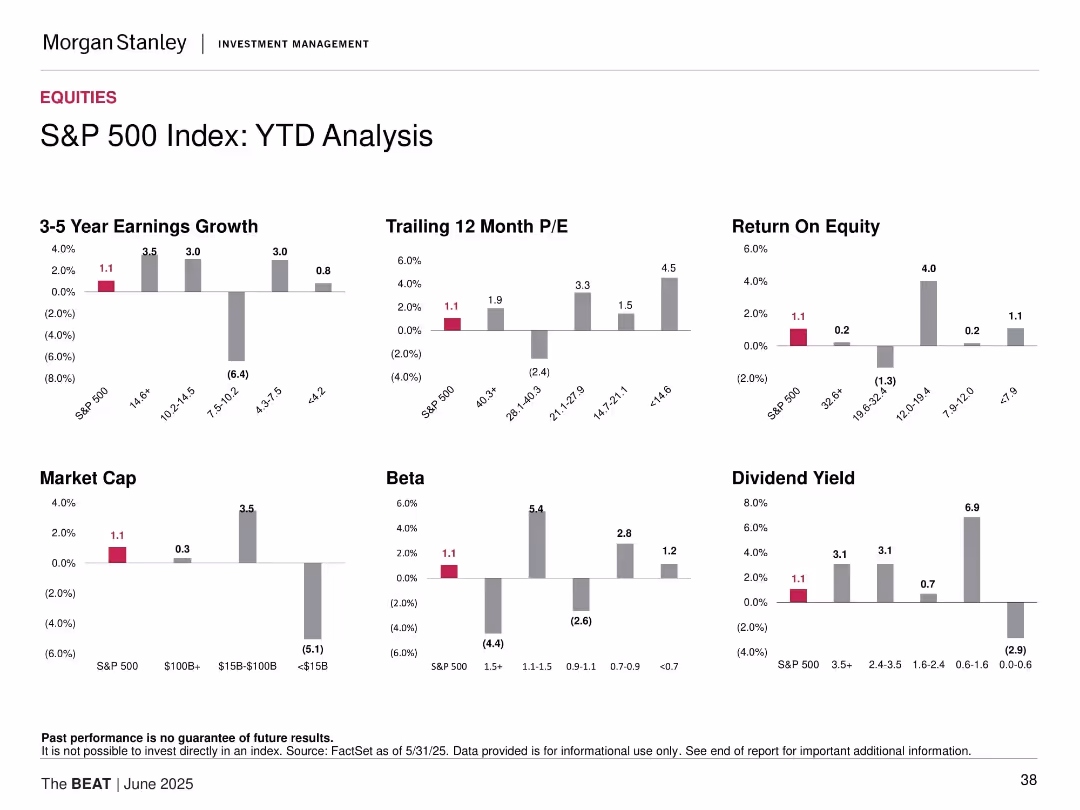
The slide examines year-to-date (YTD) performance across various factors, highlighting trends in earnings growth, valuation, and return on equity. It reveals weaker overall metrics compared to the 1-month analysis, with negative returns in several cohorts such as small cap and high beta stocks.
YTD performance, return analysis, ROE, valuation, beta groups, earnings trend, sector underperformance
false
Performance Metrics and KPIs
Financial Services
Multiple Chart
Morgan Stanley
Add to my slides
Remove from favorites
Split dual-column layout with horizontal bar charts showing Total Return (left) and Risk-Adjusted Return (Sharpe Ratio, right). Each bar represents a market sector or asset class. Color is used for emphasis, and returns are plotted numerically on the horizontal axis.
Financial Performance
Financial Services
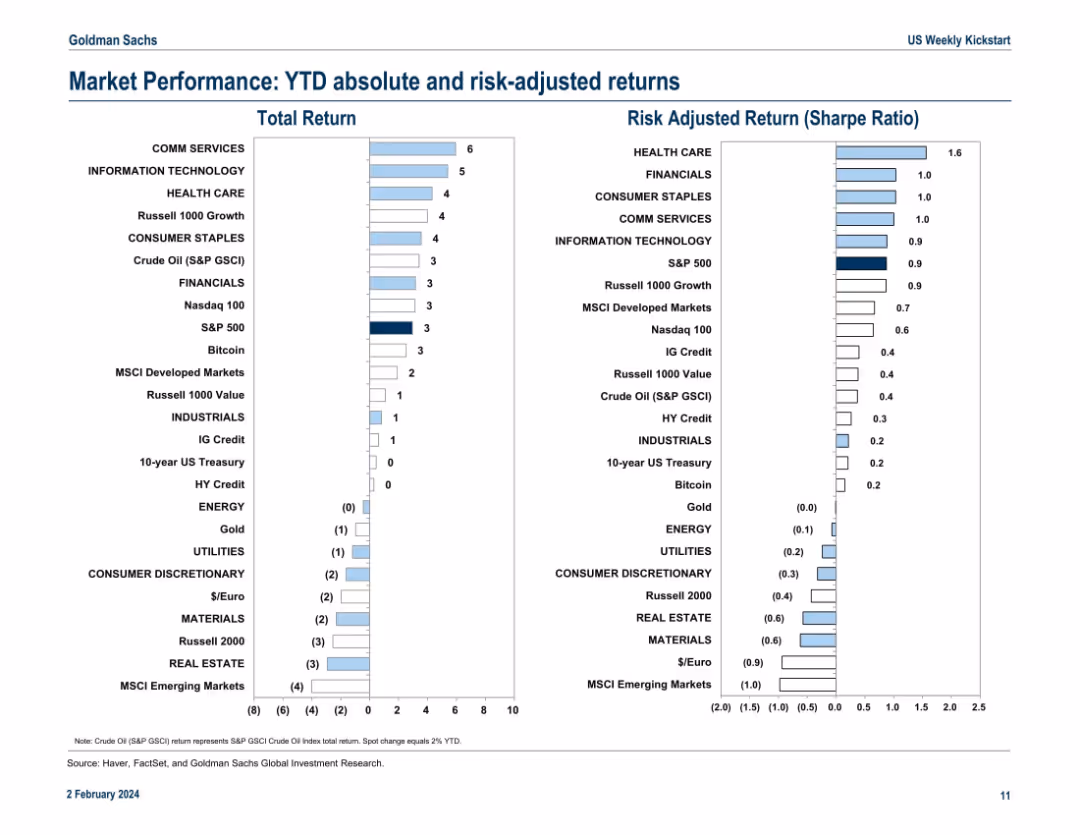
This slide compares year-to-date absolute returns and Sharpe Ratios for various asset classes and sectors. Communication Services and Information Technology lead in total returns, while Health Care shows the highest Sharpe Ratio. MSCI Emerging Markets underperform in both metrics. The slide highlights which investments offer better return-to-risk tradeoffs.
YTD returns, Sharpe Ratio, market sectors, asset performance, volatility, risk-adjusted return, MSCI, S&P 500, Crude Oil, Bitcoin
false
Financial Performance
Financial Services
Multiple Chart
Goldman Sachs
Add to my slides
Remove from favorites
Dual bar chart layout comparing total and risk-adjusted returns for various assets and sectors; simple, color-coded format
Performance Metrics and KPIs
Financial Services
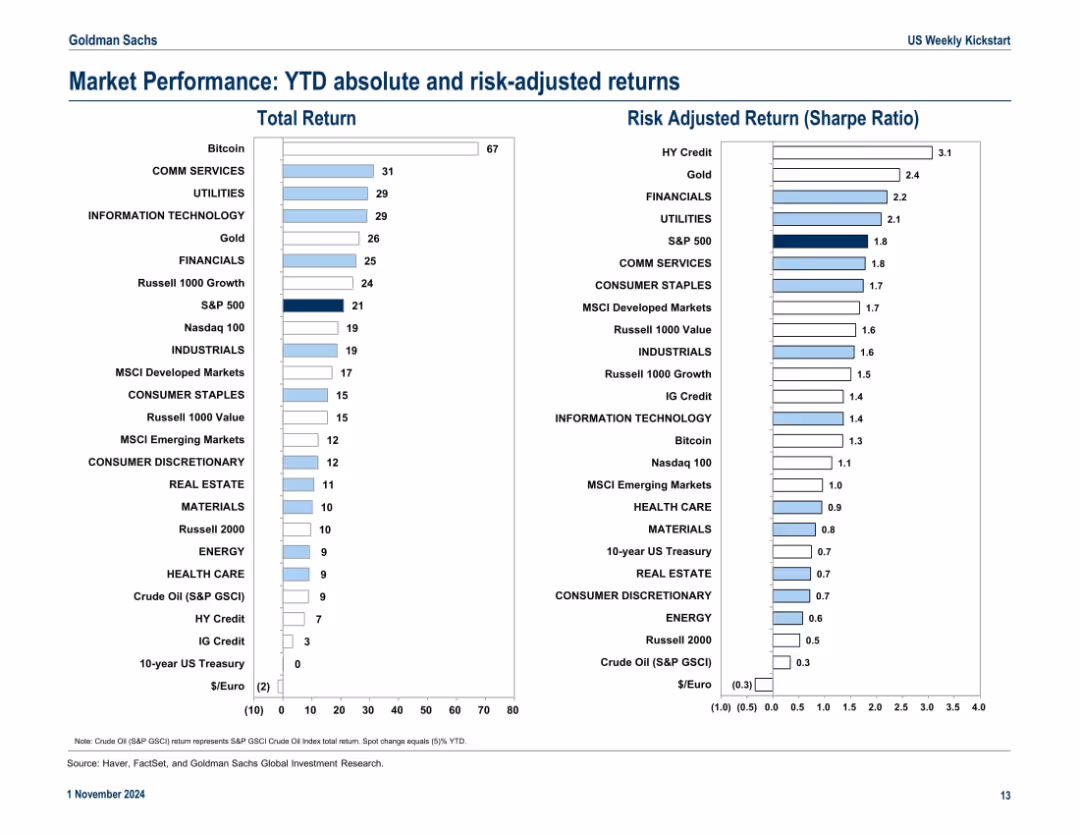
The slide ranks year-to-date (YTD) total and Sharpe ratio (risk-adjusted) returns across major sectors and asset classes. Bitcoin and Communication Services lead in total returns, while HY Credit and Gold top risk-adjusted performance.
YTD returns, Sharpe ratio, sector performance, asset classes, risk-adjusted return, Bitcoin
false
Performance Metrics and KPIs
Financial Services
Multiple Chart
Goldman Sachs
Add to my slides
Remove from favorites
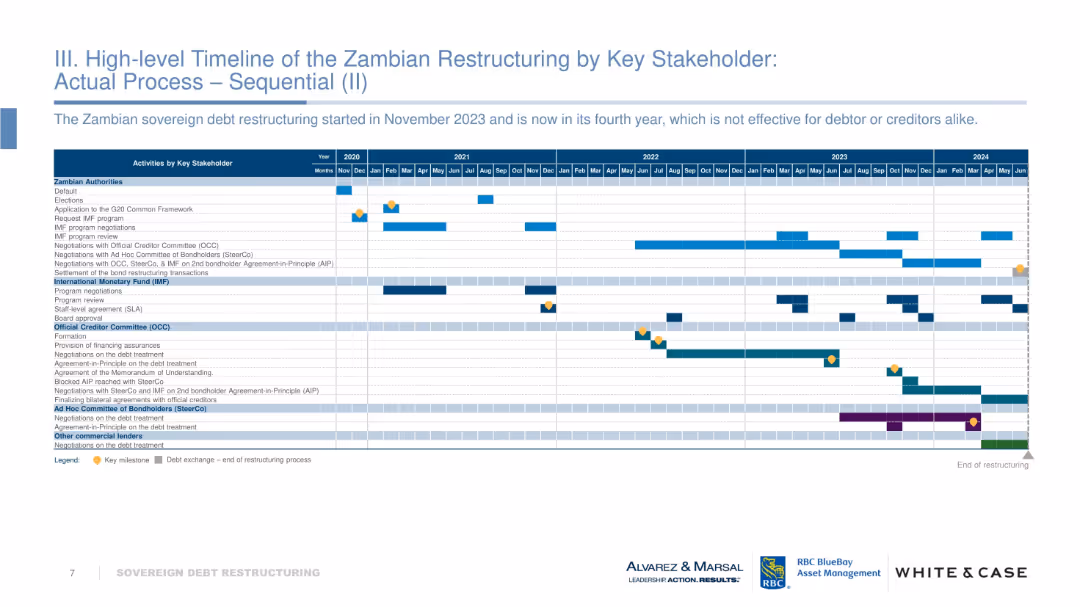
Gantt-style timeline tracking actions by Zambian authorities, IMF, OCC, bondholders, etc., from 2020–2024. Includes milestones and activity bars.
Regulatory and Compliance
Government & Public Sector
Outlines the chronological sequence of Zambia’s sovereign debt restructuring process. Highlights prolonged negotiations and inefficiencies. Visual tracks progress across multiple stakeholders. Notes the lack of effective resolution four years into the process.
Zambia, debt restructuring, IMF, OCC, timeline, sovereign debt, negotiation delays
false
Regulatory and Compliance
Government & Public Sector
Table
Alvarez & Marsal
Add to my slides
Remove from favorites
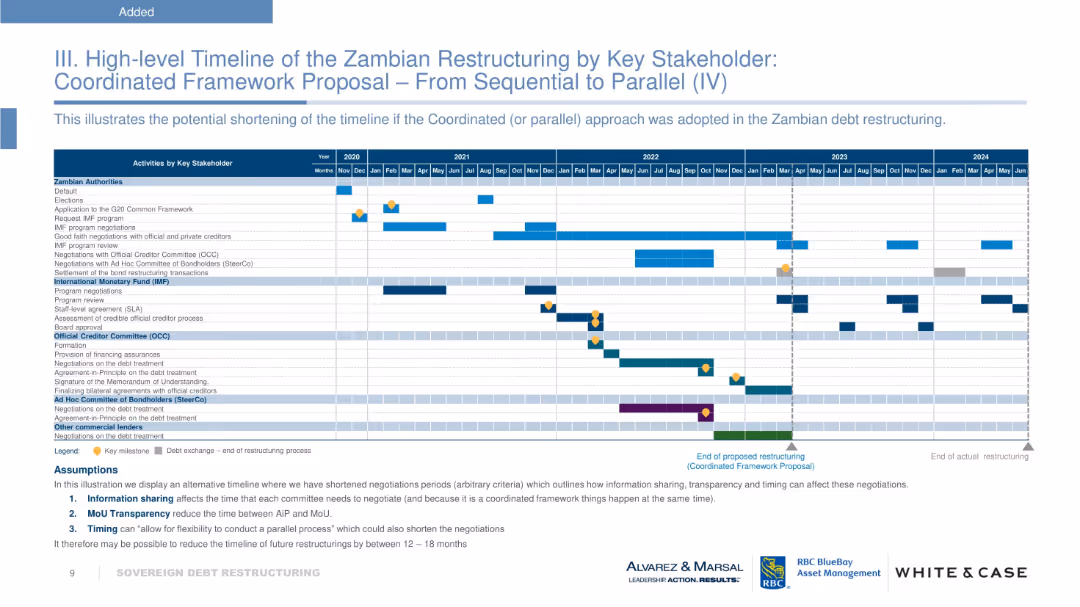
Gantt chart layout with horizontal bars, milestones, and color coding per stakeholder. Uses a calendar grid from 2020 to 2024. Bottom section includes a legend and bullet-pointed assumptions. Corporate branding along the bottom.
Strategic Planning
Financial Services
The slide provides a high-level timeline showing the restructuring process of Zambia's sovereign debt under a coordinated framework. It compares sequential vs. parallel negotiation phases involving multiple stakeholders like IMF, bondholders, and official creditors. The aim is to demonstrate potential time savings of 12–18 months.
Zambia, sovereign debt, restructuring, IMF, bondholders, coordinated framework, timeline, milestones, assumptions
false
Strategic Planning
Financial Services
Table
Alvarez & Marsal
Add to my slides
Remove from favorites
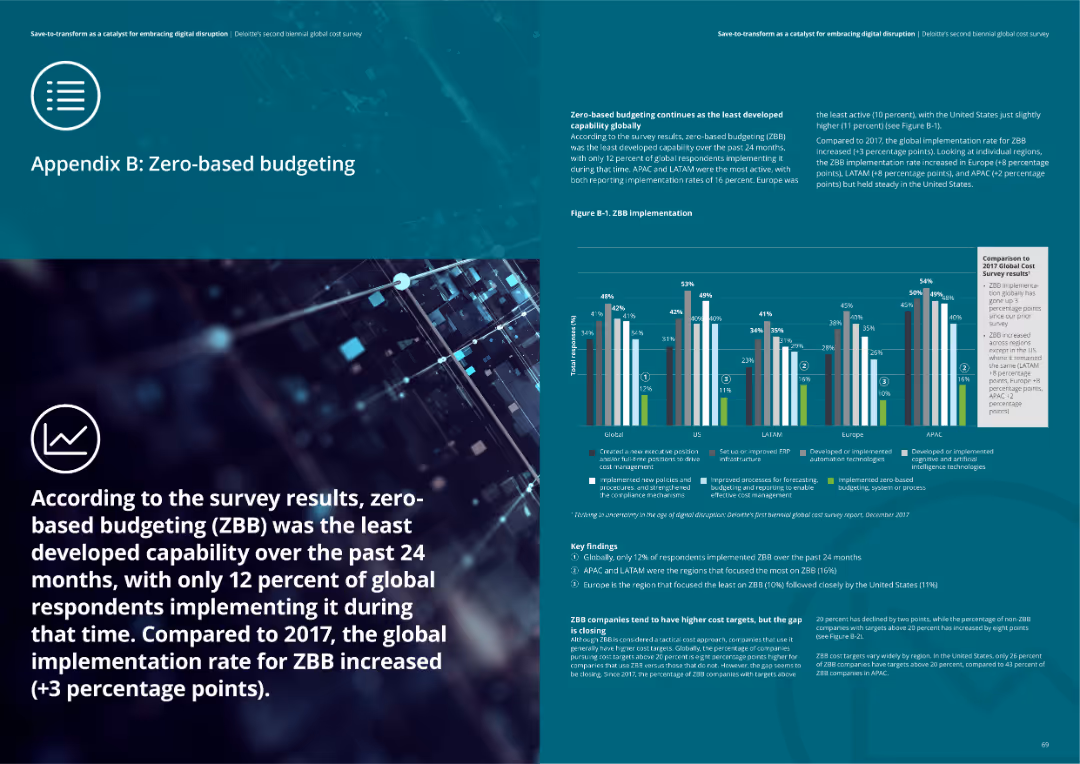
The slide includes a column chart showing ZBB implementation rates globally and by region, with key findings and insights related to ZBB practices.
Strategic Planning
Financial Services
Overview of Zero-based budgeting (ZBB) implementation and key findings from the survey. Highlights the least developed capability globally and its growth.
ZBB, budgeting, financial planning, implementation, insights
false
Strategic Planning
Financial Services
Mixed Chart
Deloitte
Add to my slides
Remove from favorites
A slide with diagrams contrasting traditional and zero-trust architectures and their benefits.
Technology and Digital Transformation
Technology & Software
Examines the shift from traditional security measures to zero-trust architecture and the associated benefits for organizations.
zero-trust architecture, cybersecurity, technology transition, data protection
false
Technology and Digital Transformation
Technology & Software
Diagram
McKinsey
Add to my slides
Remove from favorites
Features two columns with examples of companies that have implemented digital identity measures effectively.
Technology and Digital Transformation
Telecommunications
Presents case studies of successful implementation of zero-trust architecture and digital identity across different sectors.
zero-trust architecture, digital identity, case studies, self-sovereign identity, passwordless identity
false
Technology and Digital Transformation
Telecommunications
Header Vertical
McKinsey
Add to my slides
Remove from favorites
Text-heavy slide with bullet points and icons explaining four high-growth technologies in the trust and identity domain.
Technology and Digital Transformation
Technology & Software
Describes zero-trust architecture, digital identity, privacy engineering, and explainable AI, their functions, and relevance to digital trust.
zero-trust, digital identity, privacy engineering, explainable AI, cybersecurity
false
Technology and Digital Transformation
Technology & Software
Header Horizontal
McKinsey
Add to my slides
Remove from favorites
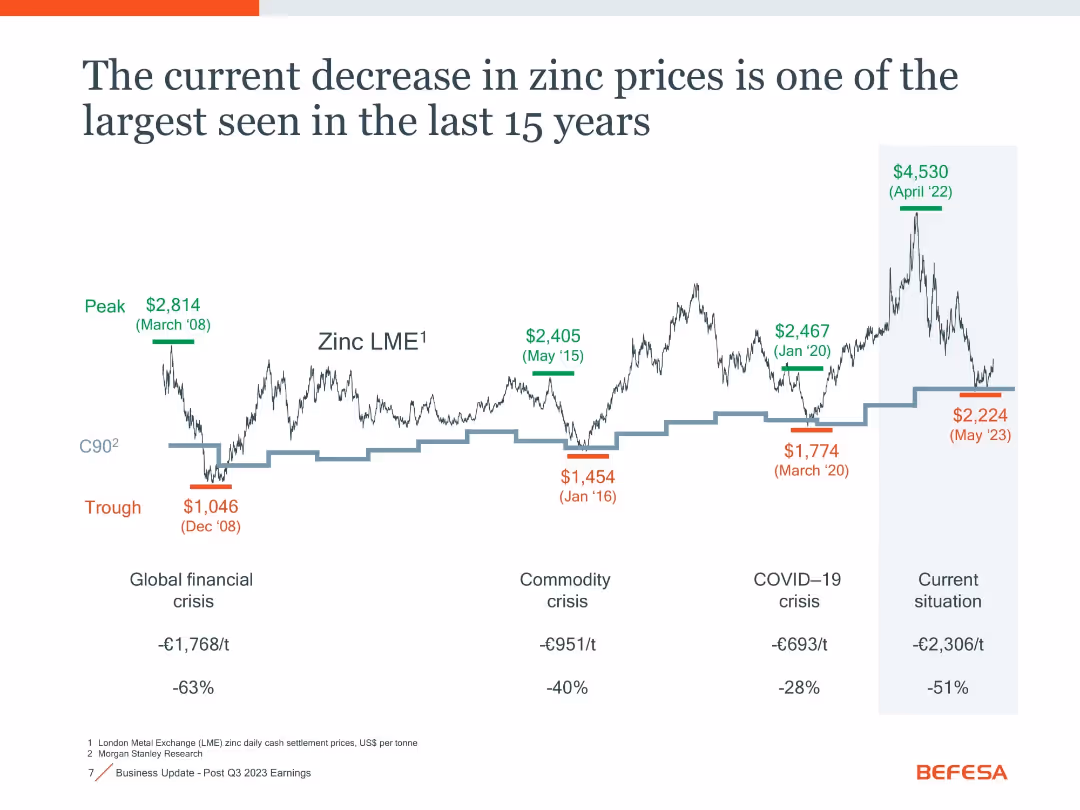
Historical line chart with key zinc price peaks and troughs labeled across major crises
Market Analysis and Trends
Industrial & Manufacturing
Highlights zinc price volatility over 15 years, emphasizing a sharp drop to $2,224/t in May 2023, marking a 51% decline from peak in 2022. Historical context includes previous financial, commodity, and COVID crises.
zinc LME, commodity crisis, price trend, financial crisis, volatility
false
Market Analysis and Trends
Industrial & Manufacturing
Single Chart
Goldman Sachs
Add to my slides
Remove from favorites
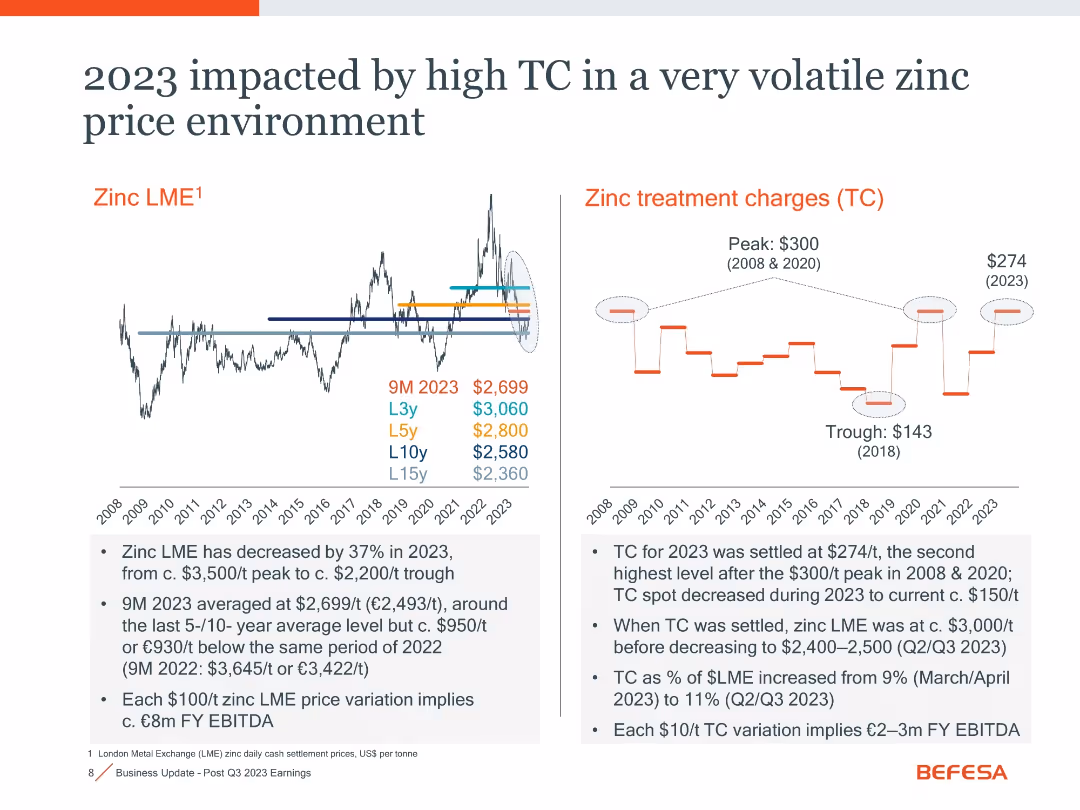
Dual-panel layout showing historical zinc LME trend and treatment charges (TC)
Risk Assessment and Management
Industrial & Manufacturing
Details the high treatment charges (TC) in 2023 alongside falling zinc prices. Notes that TC was settled at $274/t, second only to peak years. This combination negatively affects EBITDA.
zinc LME, treatment charge, volatility, risk, EBITDA impact
false
Risk Assessment and Management
Industrial & Manufacturing
Multiple Chart
Goldman Sachs
Add to my slides
Remove from favorites
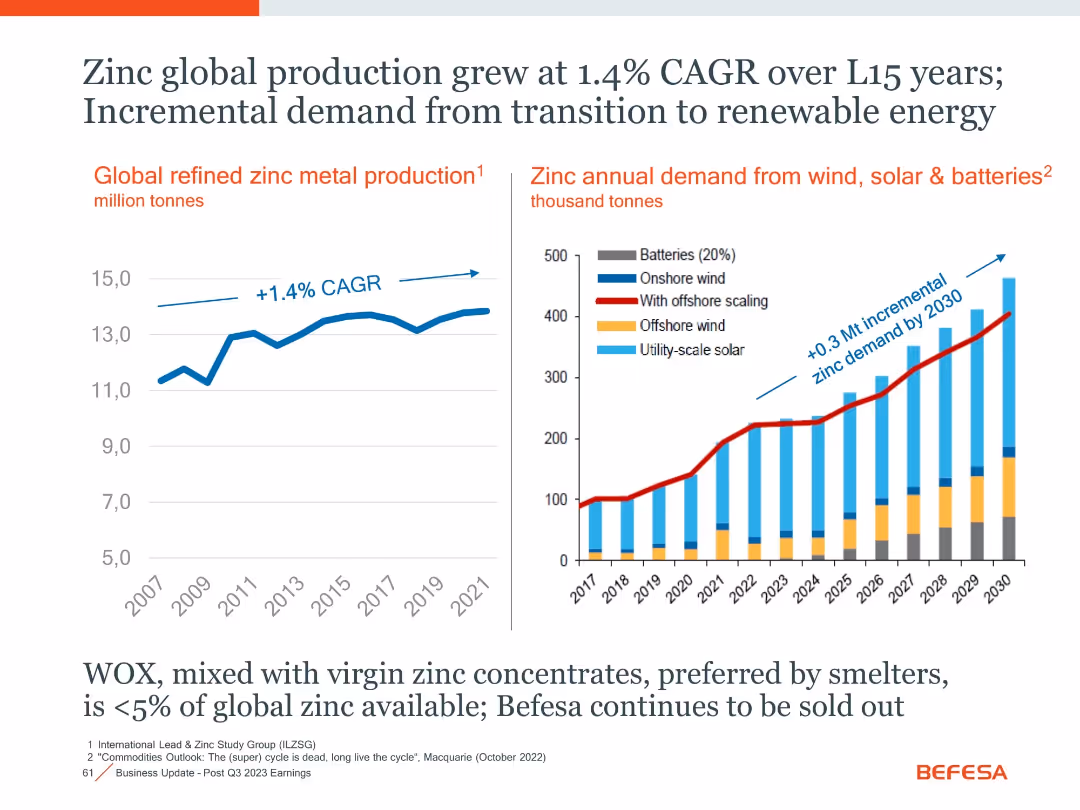
Two-panel layout with line and stacked bar charts, annotated CAGR and projections
Market Analysis and Trends
Industrial & Manufacturing
The slide presents historical and projected data on zinc production and its growing demand, especially from renewable energy sectors like wind, solar, and batteries.
Zinc, Renewable Energy, CAGR, Demand Growth, Batteries, Solar, Wind
false
Market Analysis and Trends
Industrial & Manufacturing
Multiple Chart
Goldman Sachs
Add to my slides
Remove from favorites
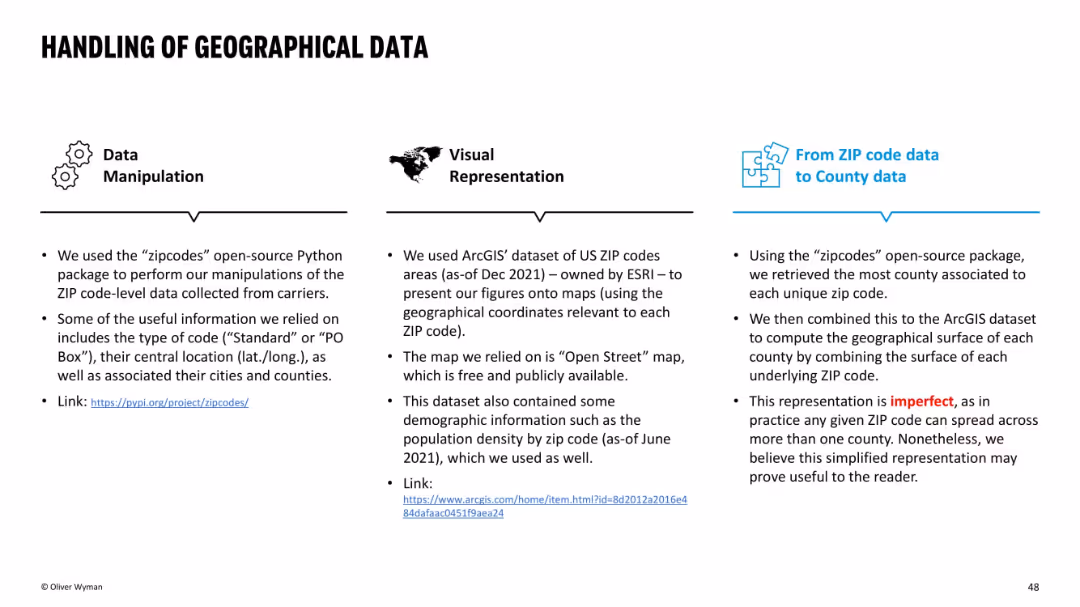
Three-column layout with icons atop each section: Data Manipulation, Visual Representation, and ZIP-to-County mapping. Mostly textual with clean blue and black design.
Regulatory and Compliance
Environmental Services & Sustainability
This slide explains the methodology used to convert ZIP-level insurance data to county-level insights using open-source tools and ESRI datasets. It acknowledges imperfections in geographic mapping due to ZIP codes spanning multiple counties, yet supports the simplified structure as useful for analysis.
ZIP code, county, data handling, mapping, ArcGIS, open-source, methodology, insurance, limitations
false
Regulatory and Compliance
Environmental Services & Sustainability
Pillar
Oliver Wyman
Add to my slides
Remove from favorites
Previous
You don't have any favorites yet.
Please wait loading your favorites slides...
Create a FREE account to continue browsing
Receive Instant Access to 1,000+ slides from companies like McKinsey, Google, and Goldman Sachs
First Name
Last Name
Email
Password
I agree to all
Terms & Privacy Policy
Thank you! Your submission has been received!
Oops! Something went wrong while submitting the form.
Have an account?
Sign in
Upgrade to PRO to Save slides
Advanced Search and Filters
Access to 15,000+ slides
Access to Category Pages
Save/Bookmark Slides
PowerPoint Template Library
Pick a Plan
MONTHLY
$12/month
Billed every month, Cancel anytime.
YEARLY
$9/year
Billed $108 annually, Cancel anytime.
Checkout for $12/month
Checkout for $108/yr
Secured by Stripe | AES-256 bit encryption