My Account
My Slides
Search by Category
Pricing
Templates
View All Templates
Download Template Slides
✦ AI Search
Feedback
Login
Logout
Get Started
Browse all Slides
Browse all Slides
Create a FREE Account
Instant access to 1,000+ real slides from top companies like McKinsey, BCG, Goldman Sachs, Google and many more!
First Name
Last Name
Email
Password
I agree to all
Terms & Privacy Policy
Thank you! Your submission has been received!
Oops! Something went wrong while submitting the form.
Have an account?
Sign in
Saved Slides
Total No. of slides saved
0
↻ Refresh
✖ Clear all
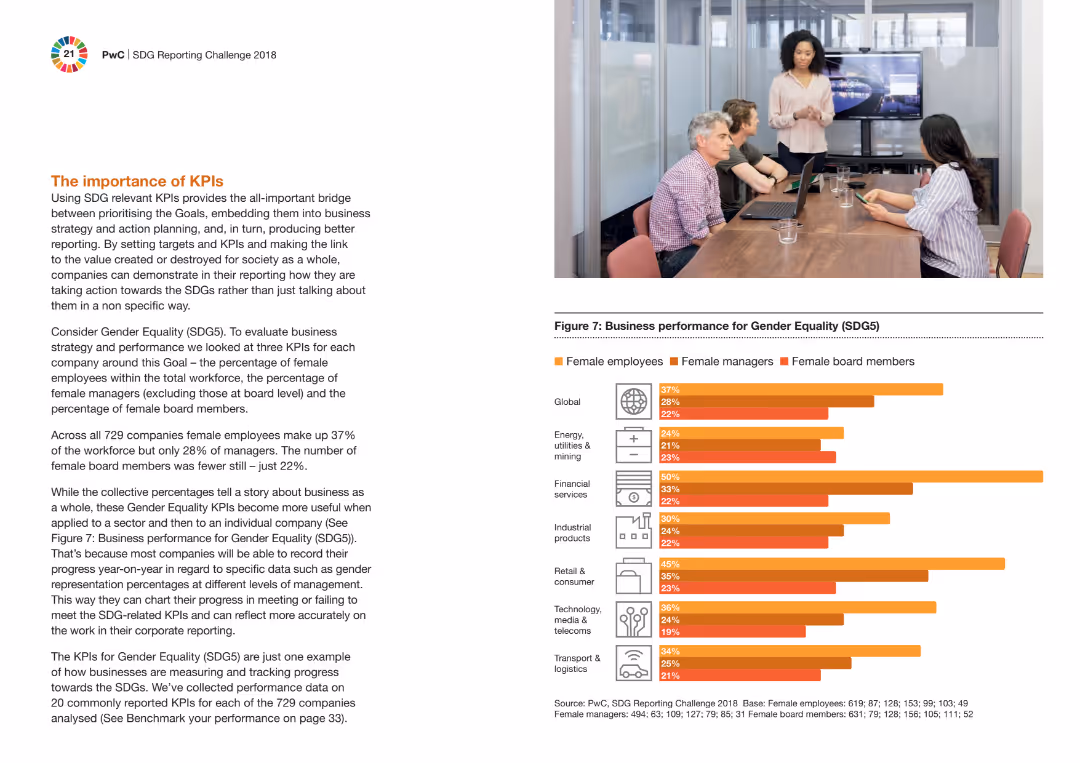
The slide features a column chart comparing the performance on gender equality (SDG5) across different industries. It includes a picture of a meeting with four people, one presenting, and text explaining the importance of KPIs.
Performance Metrics and KPIs
Professional Services
The slide explains the significance of using SDG-related KPIs to bridge business strategy and societal value creation. It highlights gender equality KPIs, showing the percentage of female employees, managers, and board members in various industries.
KPIs, gender equality, SDG5, performance, business strategy, industries, professional services, column chart, meeting
false
Performance Metrics and KPIs
Professional Services
Mixed Chart
PwC/Strategy&
Add to my slides
Remove from favorites
The slide features a table listing key performance indicators (KPIs) for each stage of the grain supply chain, including cost, emissions, and utilization metrics.
Performance Metrics and KPIs
Agriculture & Food Production
The slide outlines the KPIs used to evaluate the competitiveness of the grain supply chain, providing benchmarks for cost efficiency, emissions, and other operational metrics.
KPIs, grain supply chain, performance metrics, cost efficiency, emissions, utilization, benchmarking, agriculture, food production
false
Performance Metrics and KPIs
Agriculture & Food Production
Table
LEK
Add to my slides
Remove from favorites
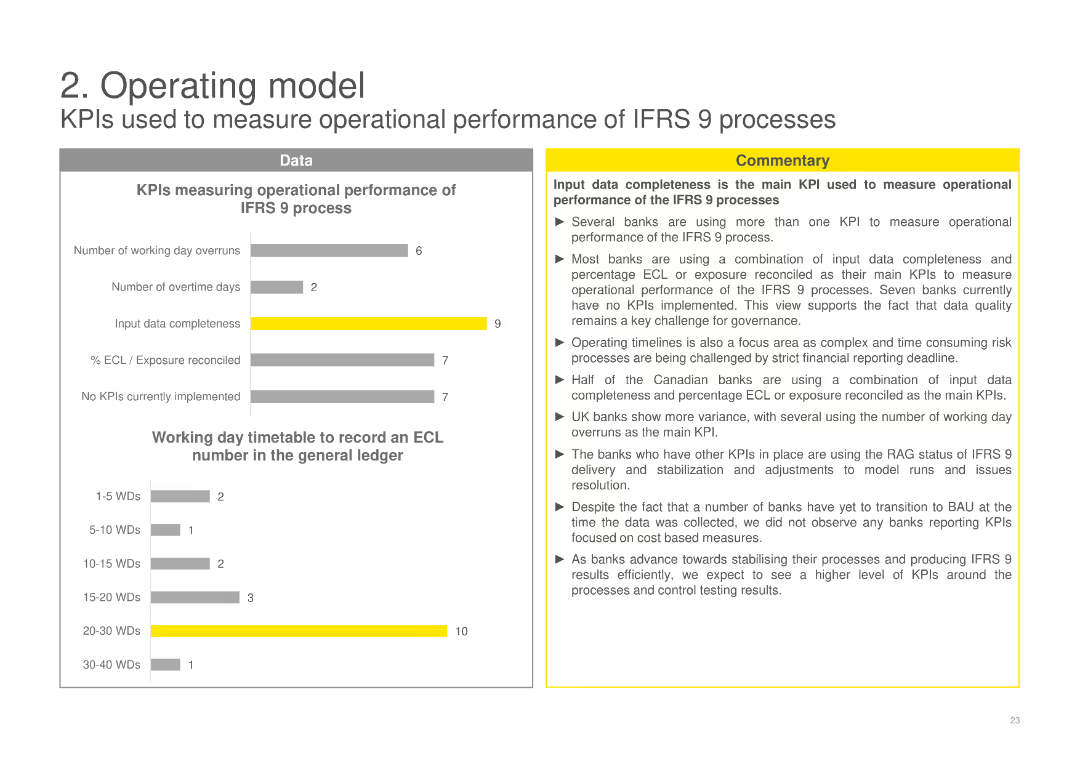
Displays column charts measuring operational performance of IFRS 9 processes using KPIs such as input data completeness and working day timetable, with a commentary discussing the main KPIs and their impact on operational performance.
Operational Efficiency
Financial Services
Evaluates the operational performance of IFRS 9 processes using various KPIs, emphasizing the importance of data completeness and timelines, and analyzing the effectiveness of current KPIs in measuring performance.
KPIs, operational performance, IFRS 9, data completeness, working day timetable
false
Operational Efficiency
Financial Services
Multiple Chart
EY
Add to my slides
Remove from favorites
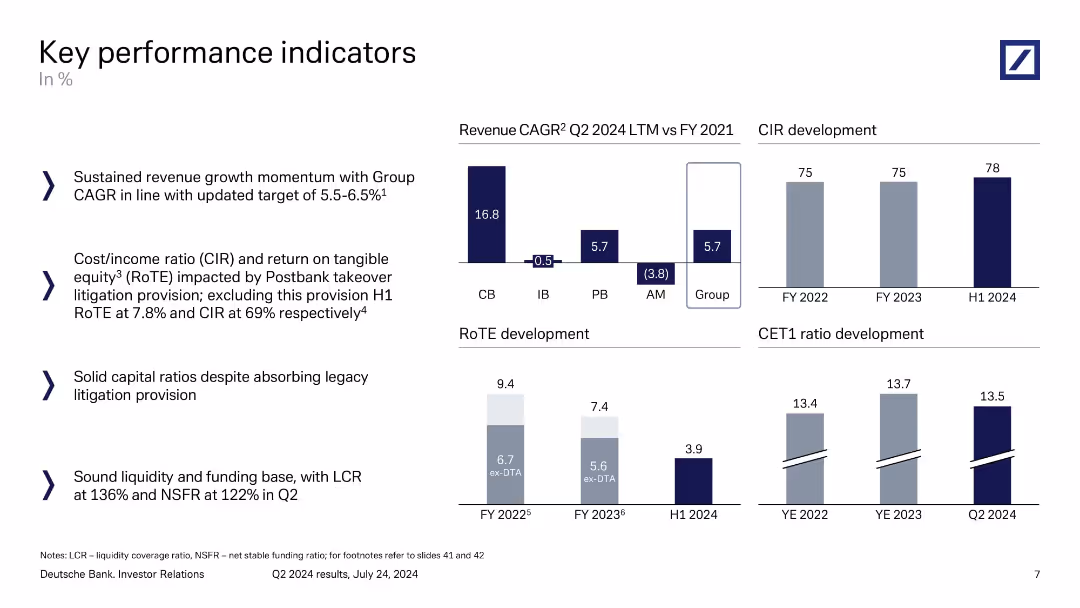
Four-panel layout: revenue CAGR, CIR, RoTE, and CET1 ratio development, alongside explanatory bullet points.
Performance Metrics and KPIs
Financial Services
A summary of Deutsche Bank’s key performance indicators including revenue growth (CAGR), cost-income ratio, return on tangible equity, and CET1 ratios. Commentary highlights sustained momentum, capital strength, and sound liquidity metrics, despite litigation provisions.
KPIs, revenue growth, CIR, RoTE, CET1 ratio, liquidity, Deutsche Bank
false
Performance Metrics and KPIs
Financial Services
Multiple Chart
Deutsche Bank
Add to my slides
Remove from favorites
Slide is text-heavy, divided into several sections, detailing firmwide initiatives and KPIs with a complex structure, using a mixture of blue, teal, and black font colors.
Financial Performance
Financial Services
Detailing performance targets and KPI progress across various business divisions, this slide aims to communicate achievements and goals to stakeholders. It highlights strategic initiatives, efficiency ratios, and capital management metrics.
KPIs, targets, firmwide initiatives, performance, progress
false
Financial Performance
Financial Services
Table
Goldman Sachs
Add to my slides
Remove from favorites
Performance-gap chart comparing Central Asia's rail freight with benchmarks; detailed improvement areas listed.
Performance Metrics and KPIs
Transportation & Logistics
The slide evaluates current vs. target performance of rail freight in Central Asia, focusing on key dimensions such as transport time, availability, price, and ease of use. It highlights needed improvements to meet development goals and become competitive with the North Corridor and sea freight.
KPIs, transport time, pricing, performance, service development, Central Asia, rail gaps
false
Performance Metrics and KPIs
Transportation & Logistics
Mixed Chart
Roland Berger
Add to my slides
Remove from favorites
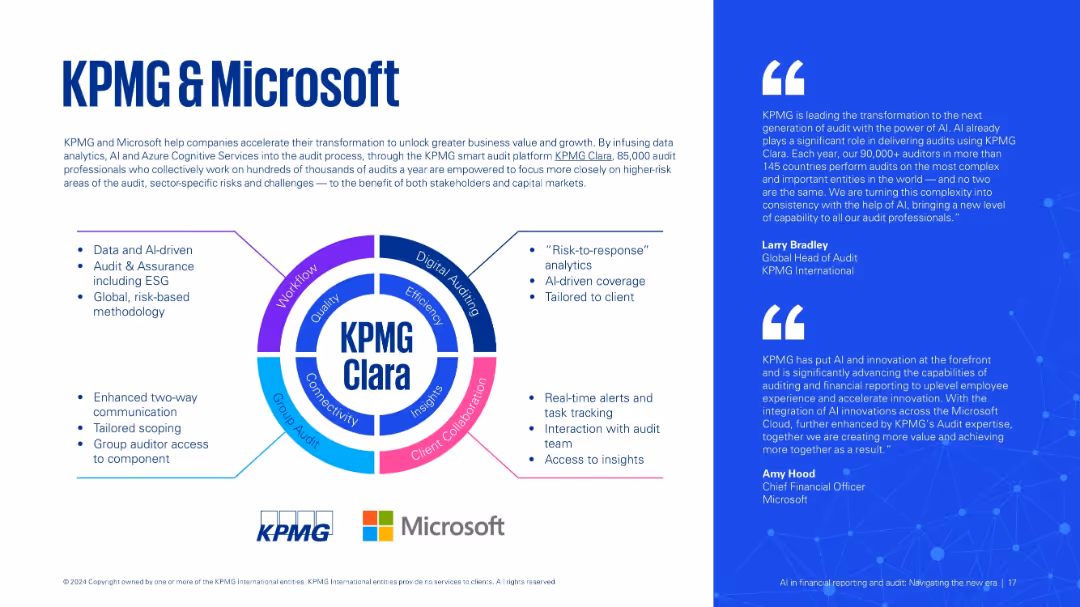
Three-part layout: left with bullet points, center circular infographic labeled "KPMG Clara", right with testimonials. Bright and engaging design.
Strategic Planning
Technology & Software
Describes the KPMG-Microsoft collaboration for AI-powered auditing via the KPMG Clara platform. Focuses on AI-driven insights, real-time tracking, and enhanced communication in audits.
KPMG Clara, Microsoft, audit technology, AI platform, collaboration, data insights
false
Strategic Planning
Technology & Software
Boxed
KPMG
Add to my slides
Remove from favorites
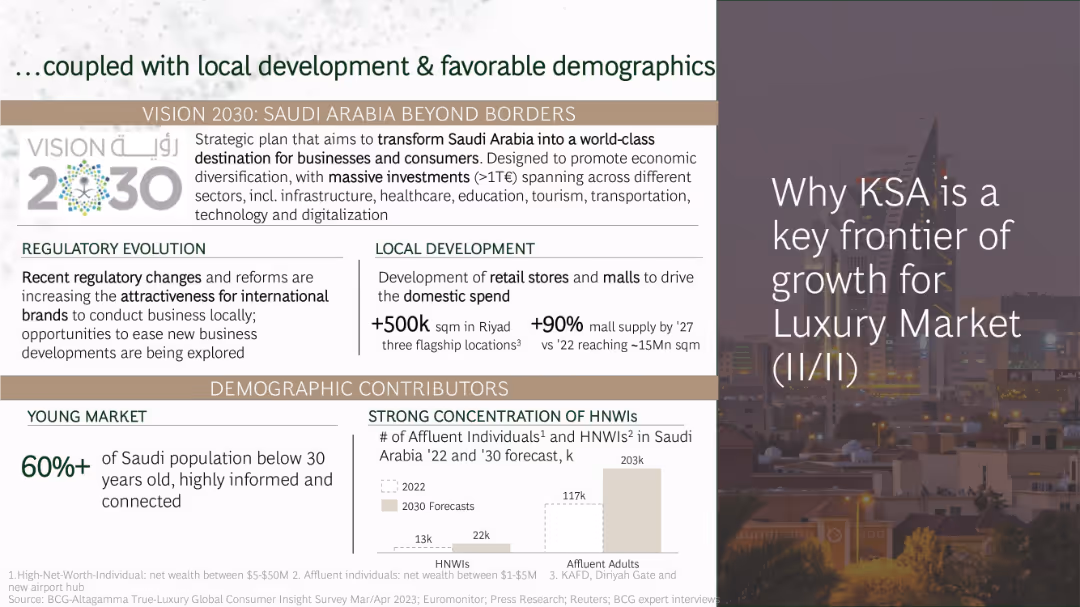
Layered layout with Vision 2030 branding, multiple data callouts, and demographic graphs
Strategic Planning
Consumer Goods
KSA's luxury growth is further supported by regulatory changes, infrastructure development, and favorable demographics. Vision 2030 includes large-scale investments in malls and retail. Over 60% of the population is under 30, and affluent individuals are expected to nearly double by 2030.
KSA, Vision 2030, demographics, affluent consumers, retail development, regulation, malls
false
Strategic Planning
Consumer Goods
Mixed Chart
BCG
Add to my slides
Remove from favorites
Two-section layout: left half with title overlaying image; right half with text blocks, stats, and a bar chart about tourism growth
Strategic Planning
Consumer Goods
KSA’s luxury market growth is driven by internal demand and high-end tourism. Despite current low luxury retail penetration (7% vs. 26% in Western Europe), consumer spending outlook is strong (47% vs. 39% average). High-end tourism is projected to expand significantly by 2030.
KSA, luxury retail, tourism, spending outlook, penetration, high-end travel, giga-projects
false
Strategic Planning
Consumer Goods
Mixed Chart
BCG
Add to my slides
Remove from favorites
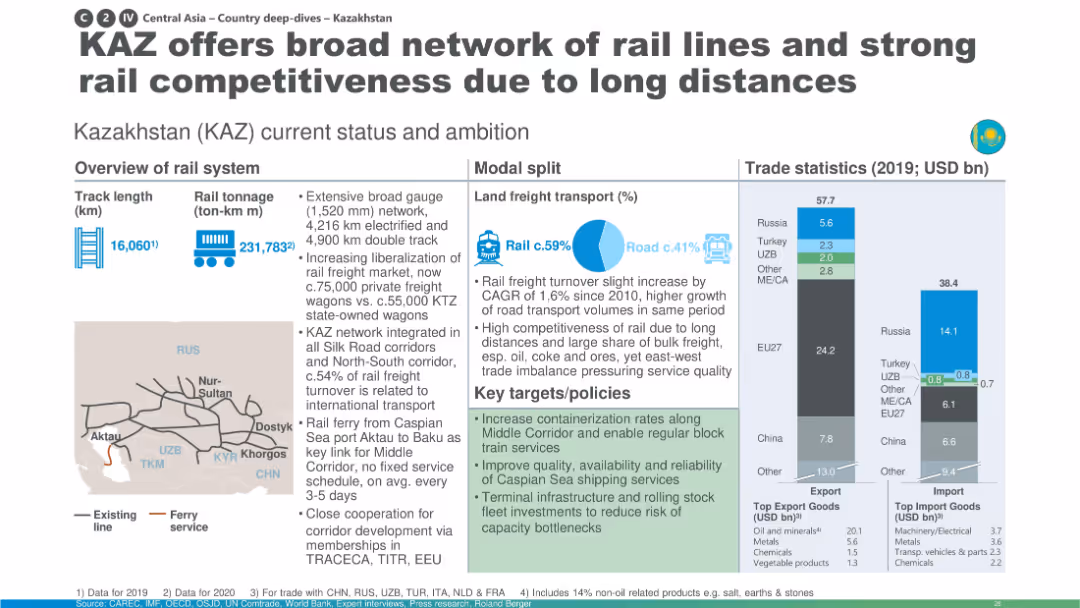
Map-heavy layout with large pie chart for modal share; emphasis on long-distance transport and containerization.
Industry Overview
Transportation & Logistics
Kazakhstan is presented as a key player in rail freight across Central Asia due to its extensive network, liberalized market, and integration into multiple corridors. The slide focuses on capacity enhancements and future development goals to maintain competitiveness.
Kazakhstan, containerization, rail freight, Caspian ferry, competitiveness, infrastructure
false
Industry Overview
Transportation & Logistics
Multiple Chart
Roland Berger
Add to my slides
Remove from favorites
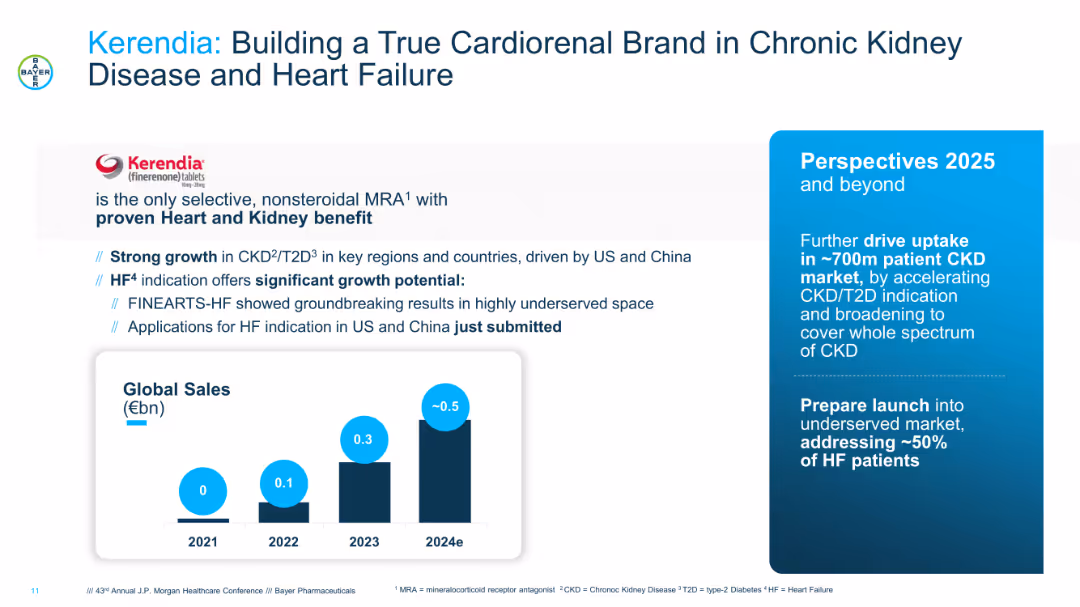
Product-focused layout with brand positioning, global sales bar chart, and future growth perspectives. Text-heavy with bullets outlining clinical strength and market opportunity. Uses blue tones and brand color.
Product and Service Analysis
Healthcare & Pharmaceuticals
Highlights Kerendia’s role in treating CKD and heart failure, emphasizing clinical differentiation and market potential. Sales growth is driven by indications in underpenetrated markets, with plans to expand into broader CKD spectrum and heart failure populations, particularly in China and the US.
Kerendia, CKD, heart failure, T2D, pharma launch, clinical growth, Bayer
false
Product and Service Analysis
Healthcare & Pharmaceuticals
Mixed Chart
JP Morgan
Add to my slides
Remove from favorites
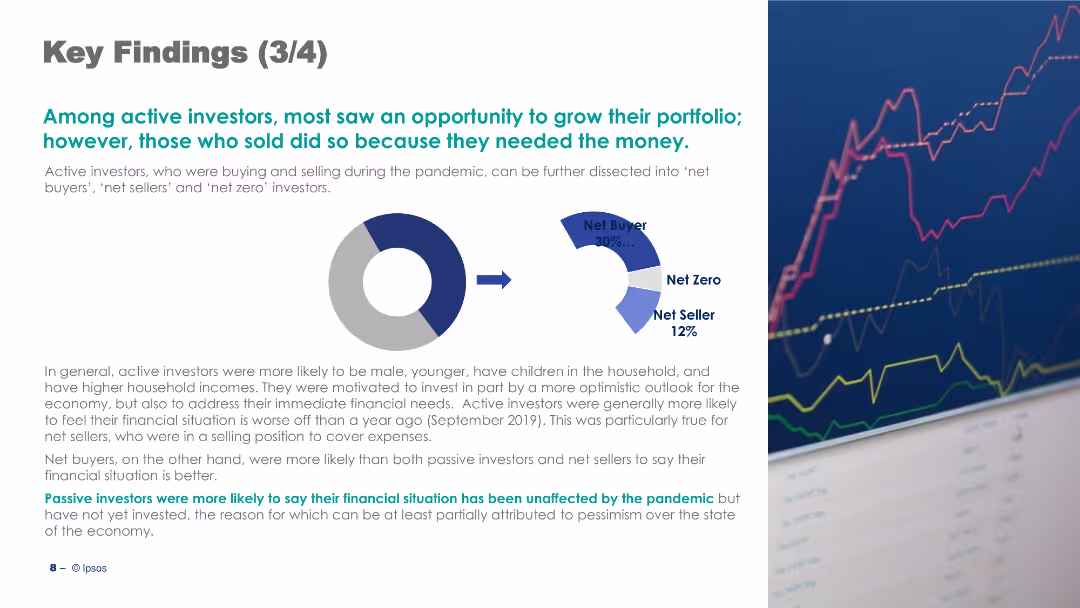
The slide features a pie chart and text, discussing active investors' behaviors during the pandemic with key statistics.
Strategic Planning
Financial Services
It summarizes the behaviors of active investors during the pandemic, highlighting motivations and financial impacts.
Key Findings, Active Investors, Pandemic, Behavior, Financial, Investment, Pie Chart, Text, Image, Strategic Planning
false
Strategic Planning
Financial Services
Mixed Chart
IPSOS
Add to my slides
Remove from favorites
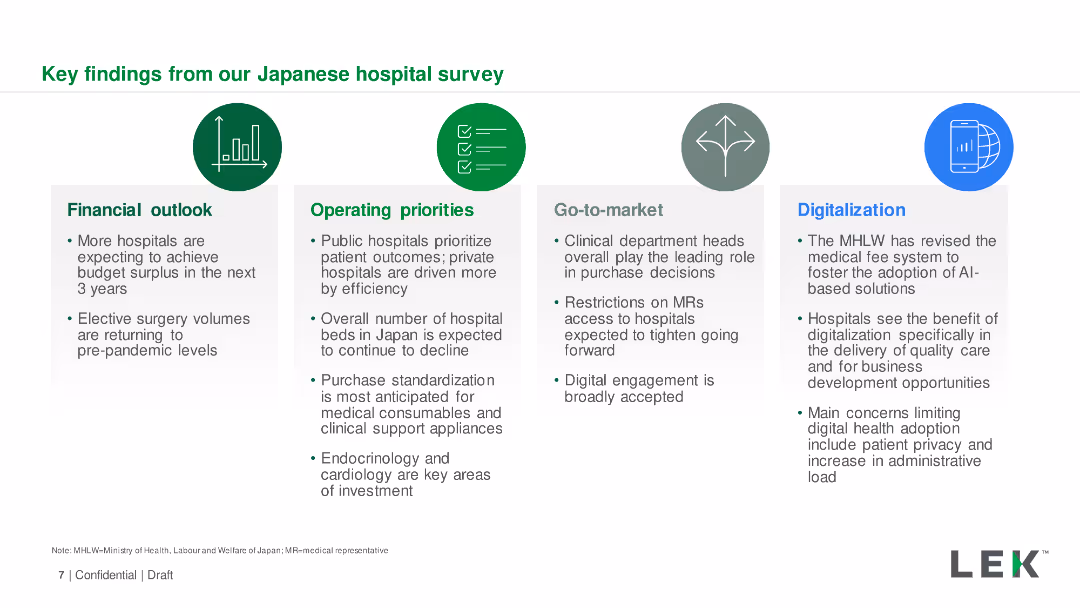
Icons and text boxes summarizing key survey findings in four categories: Financial outlook, Operating priorities, Go-to-market, Digitalization.
Market Analysis and Trends
Healthcare & Pharmaceuticals
Summary of key insights from the Japanese hospital survey, covering financial outlook, operating priorities, market strategies, and digitalization efforts.
Key Findings, Hospital Survey, Japan, Digitalization, Financial Outlook
false
Market Analysis and Trends
Healthcare & Pharmaceuticals
Pillar
LEK
Add to my slides
Remove from favorites
This is a bullet point list slide outlining the key tasks for the second half of 2019 and 2020. It utilizes green circles as bullet points to emphasize each task, arranged in a vertical flow for easy reading.
Strategic Planning
Financial Services
The slide lists strategic tasks set for the near future, focusing on platform delivery, acquisitions, optimisation, and capital return strategies. It can be used for strategic briefings and setting priorities.
Key Tasks, Strategy, Priorities, Platform Delivery, Capital Return
false
Strategic Planning
Financial Services
Vertical Flow
Morgan Stanley
Add to my slides
Remove from favorites
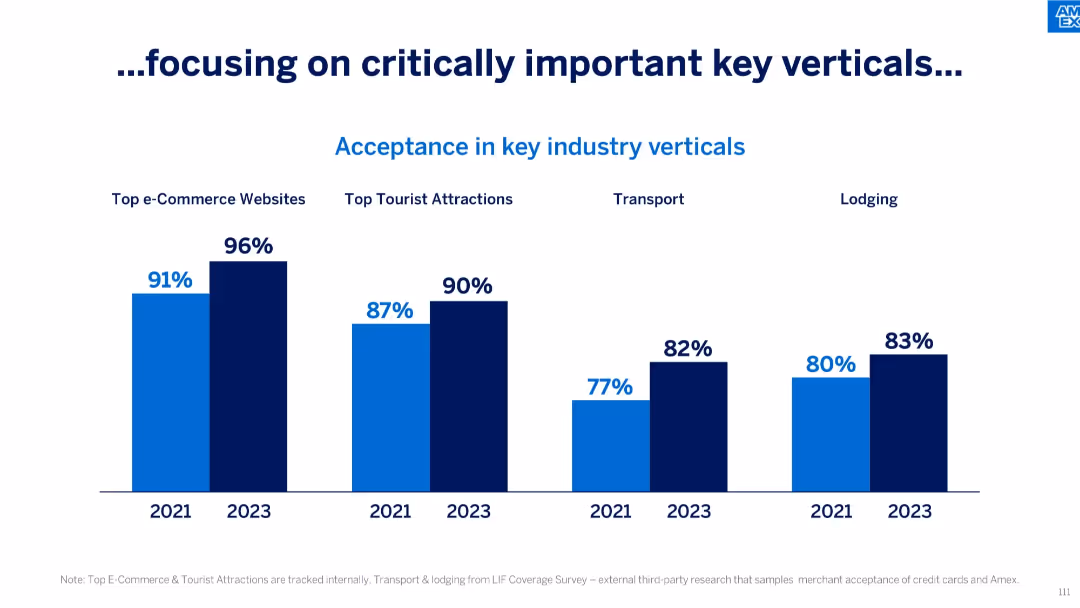
Four grouped bar comparisons between 2021 and 2023 across industry verticals: e-commerce, tourist attractions, transport, and lodging.
Competitive Landscape
Financial Services
This slide presents improvement in Amex acceptance across key verticals, showing growth in top e-commerce sites, tourist attractions, transport, and lodging between 2021 and 2023, reinforcing strategic focus areas.
Key Verticals, Industry Acceptance, E-commerce, Lodging, Tourist Attractions, Transport, Growth
false
Competitive Landscape
Financial Services
Single Chart
McKinsey
Add to my slides
Remove from favorites
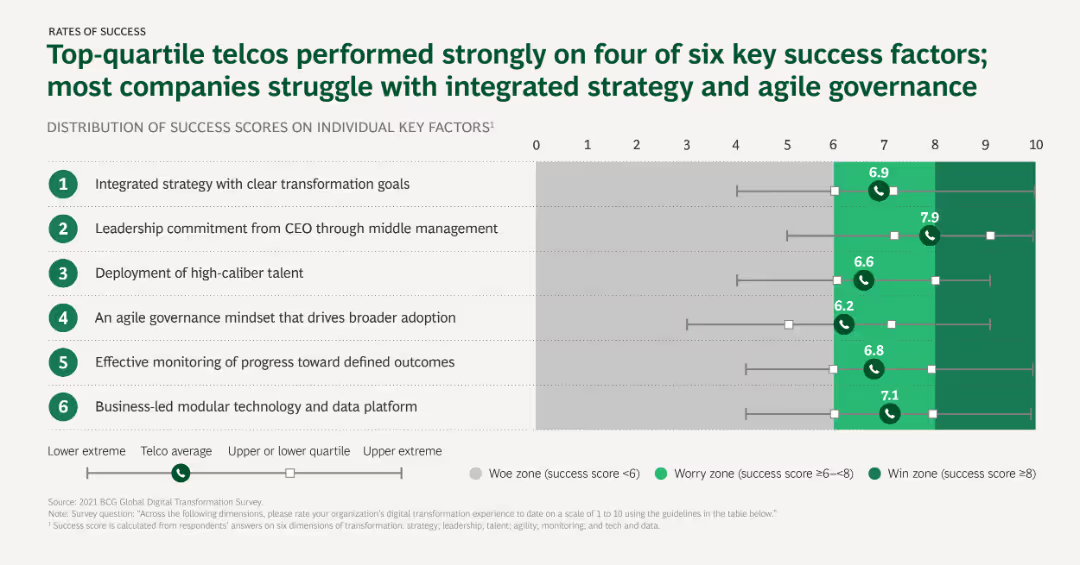
The slide uses horizontal bar charts to depict the distribution of success scores on individual key factors for digital transformation, with a focus on strategy, leadership, and talent.
Performance Metrics and KPIs
Telecommunications
This slide analyzes the key success factors for digital transformation in the telco sector, showing how top-quartile telcos perform better on specific factors compared to the average.
Key success factors, Digital transformation, Telcos, Strategy, Leadership, Talent
false
Performance Metrics and KPIs
Telecommunications
Mixed Chart
BCG
Add to my slides
Remove from favorites
The slide lists key themes in three sections: revenue initiatives, cost discipline and operating leverage, and prudent risk management, with a central diagram for risk.
Strategic Planning
Financial Services
This slide outlines the strategic themes for 2020, focusing on revenue initiatives, cost discipline, operating leverage, and risk management within the Swiss Universal Bank.
Key themes, 2020, strategic planning, revenue initiatives, risk management
false
Strategic Planning
Financial Services
Diagram
Credit Suisse
Add to my slides
Remove from favorites
Various pie charts illustrating Knorr's global sales, profitability, and market segments. Includes a pie chart for market distribution and column charts for financial metrics.
Product and Service Analysis
Consumer Goods
Provides an in-depth analysis of Knorr’s performance across different market segments, emphasizing its profitability and widespread market presence. Discusses strategic positioning and product diversity.
Knorr, Global Sales, Profitability, Market Segments, Product Diversity
false
Product and Service Analysis
Consumer Goods
Multiple Chart
Deutsche Bank
Add to my slides
Remove from favorites
Text with a quote and a map of Europe, highlighting the reliability and speed of Ipsos surveys. Three numbered points describing the benefits of knowledge panel expansion.
Product and Service Analysis
Professional Services
Describes the expansion of Ipsos' knowledge panels and their benefits, including brand recognition, market revenue gains, and EU market presence. Emphasizes the reliability of data.
Knowledge Panels, Expansion, Reliability, EU Market, Surveys
false
Product and Service Analysis
Professional Services
Boxed
IPSOS
Add to my slides
Remove from favorites
The slide shows a column chart indicating the average crypto asset knowledge score and the number of correct answers participants provided on a knowledge quiz.
Technology and Digital Transformation
Financial Services
This slide measures the average knowledge score of participants regarding crypto assets, based on a series of quiz questions.
Knowledge, crypto assets, quiz, score, participants
false
Technology and Digital Transformation
Financial Services
Mixed Chart
IPSOS
Add to my slides
Remove from favorites
The slide features a column chart representing the participants' responses to true or false statements about crypto assets, with correct answers highlighted.
Market Analysis and Trends
Financial Services
This slide evaluates the general knowledge of participants about crypto assets through true/false statements and indicates the percentage of correct answers.
Knowledge, crypto assets, survey, true/false, general knowledge
false
Market Analysis and Trends
Financial Services
Mixed Chart
IPSOS
Add to my slides
Remove from favorites
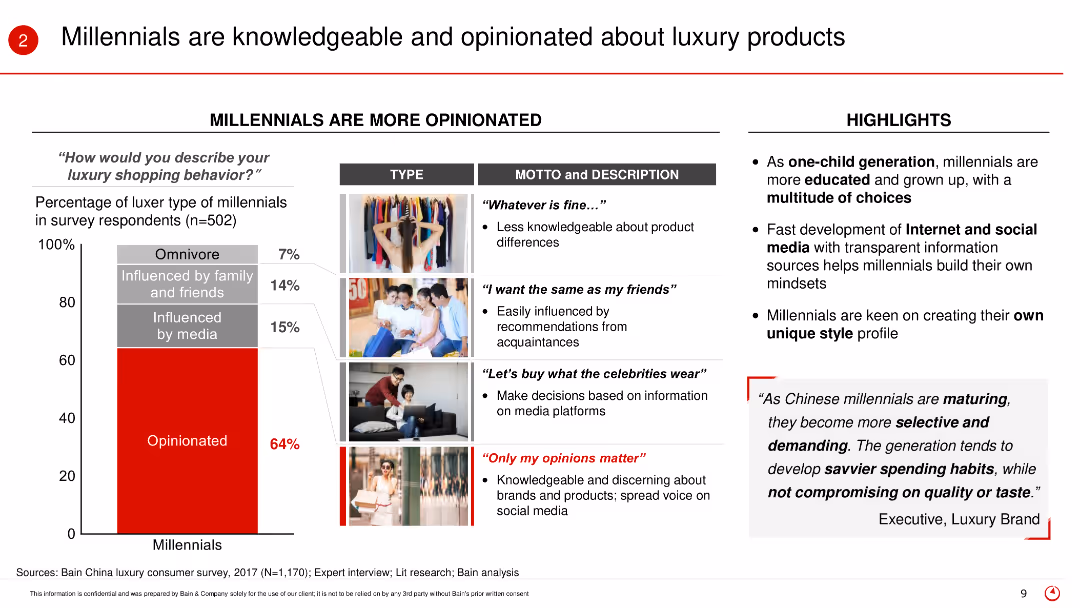
The slide features a vertical bar (column) chart and images to describe the luxury shopping behavior of Millennials. It highlights the different types of Millennials and their shopping mottos, along with key highlights about their opinions and behaviors.
Market Analysis and Trends
Retail & E-commerce
The slide examines the knowledge and opinions of Millennials regarding luxury products. It categorizes Millennials based on their shopping behavior and describes their tendencies to be influenced by media, friends, or personal opinions. The highlights emphasize their education, digital literacy, and selective shopping habits.
Knowledgeable consumers, Millennials, luxury products, shopping behavior, media influence, consumer opinions, digital literacy, selective habits
false
Market Analysis and Trends
Retail & E-commerce
Mixed Chart
Bain
Add to my slides
Remove from favorites
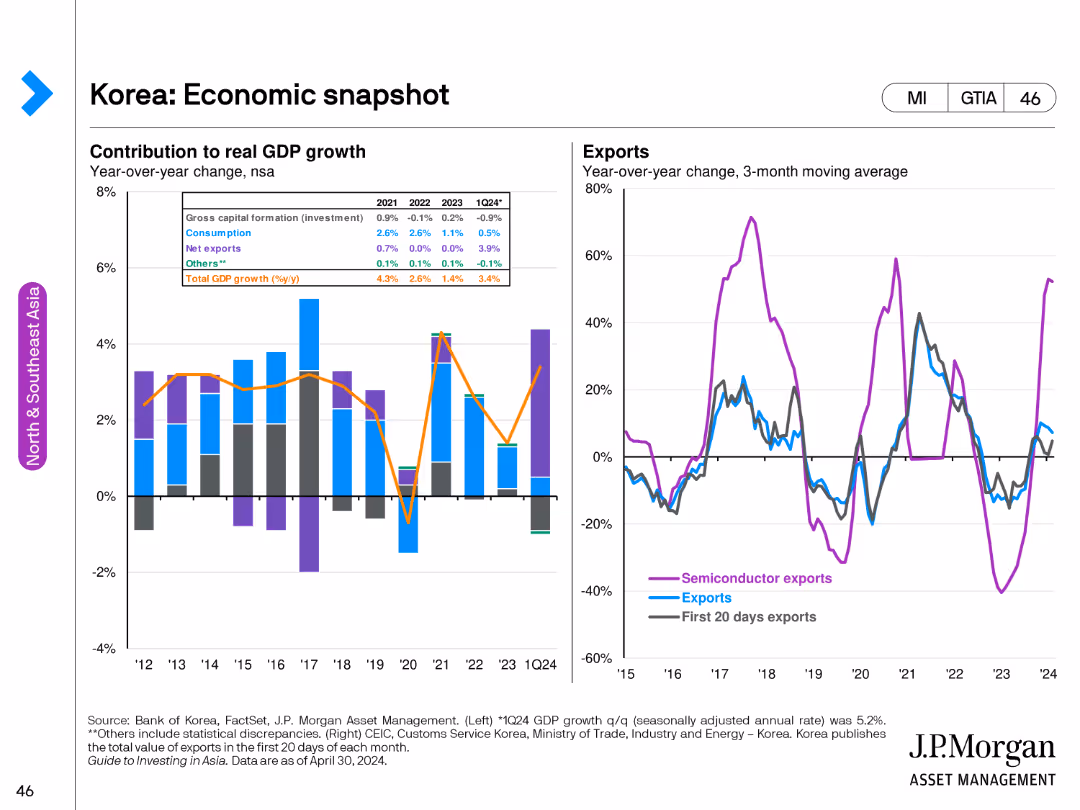
The slide has a stacked column chart on the left showing the contribution to GDP growth by various factors from 2012 to Q1 2024. The right side features line charts for semiconductor exports and total exports' year-over-year change.
Market Analysis and Trends
Financial Services
This slide offers a comprehensive view of Korea's economy, focusing on GDP growth contributions and export trends, including a specific focus on semiconductor exports.
Korea, GDP growth, economic snapshot, semiconductor exports, total exports
false
Market Analysis and Trends
Financial Services
Multiple Chart
JP Morgan
Add to my slides
Remove from favorites
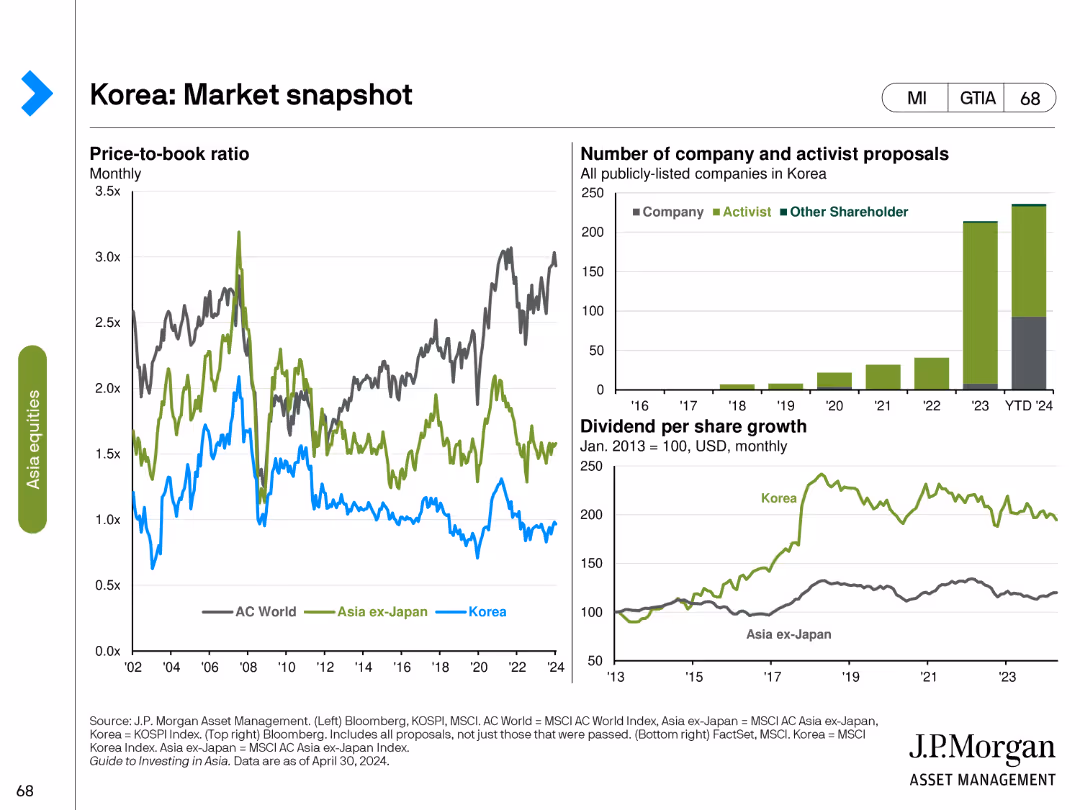
This slide contains three charts: a line chart on the price-to-book ratio, a bar chart on the number of company and activist proposals, and a line chart showing dividend per share growth.
Market Analysis and Trends
Financial Services
The slide offers a snapshot of the Korean market, highlighting trends in price-to-book ratios, shareholder activism, and dividend growth, providing a comprehensive view of market dynamics and investment opportunities.
Korea, market snapshot, price-to-book ratio, activist proposals, dividend growth, shareholder activism, market dynamics, investment opportunities, financial analysis
false
Market Analysis and Trends
Financial Services
Multiple Chart
JP Morgan
Add to my slides
Remove from favorites
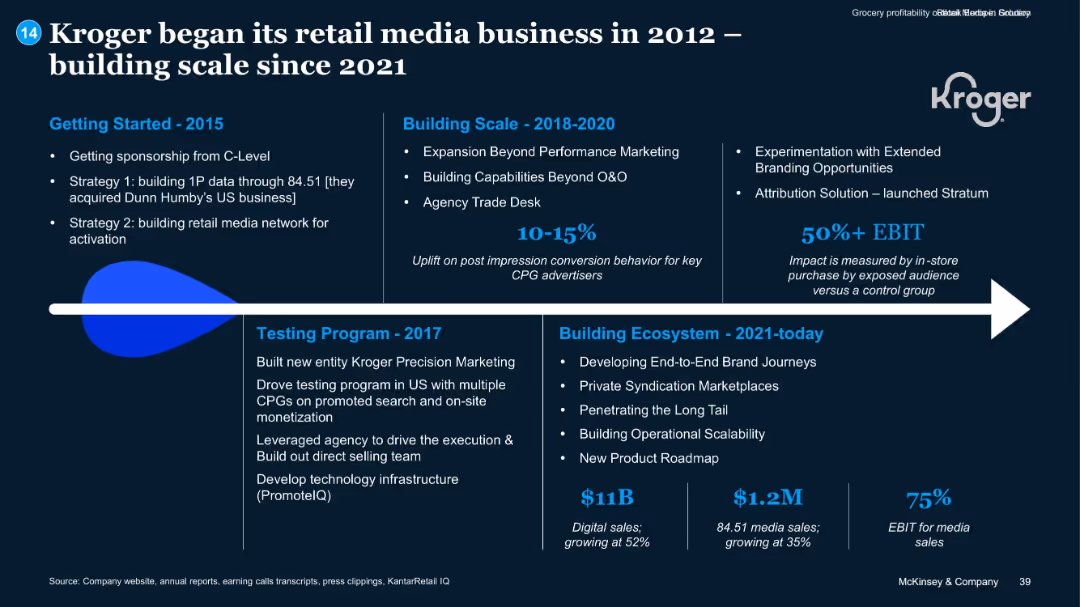
Timeline format; segmented into years with supporting text blocks; highlights and metrics in blue
Client Case Studies
Retail & E-commerce
The slide traces Kroger’s retail media journey from 2012, emphasizing milestones such as 1P data acquisition, performance marketing, attribution solutions, and recent scale. It showcases strategic investments and results like EBIT impact, digital/media sales, and growth figures.
Kroger, Retail Media, Digital Sales, EBIT, 1P Data, Strategy
false
Client Case Studies
Retail & E-commerce
Linear Flow
McKinsey
Add to my slides
Remove from favorites
The slide presents a structured layout with four sections, each containing logos of brands categorized under Professional products, Consumer products, L'Oréal Luxe, and Active cosmetics.
Market Analysis and Trends
Consumer Goods
This slide displays L'Oréal's diverse brand portfolio, segmented into various product categories with associated market share percentages, demonstrating the company's market positioning.
L'Oréal, brand portfolio, market share, consumer products, professional products
false
Market Analysis and Trends
Consumer Goods
Table
Deutsche Bank
Add to my slides
Remove from favorites
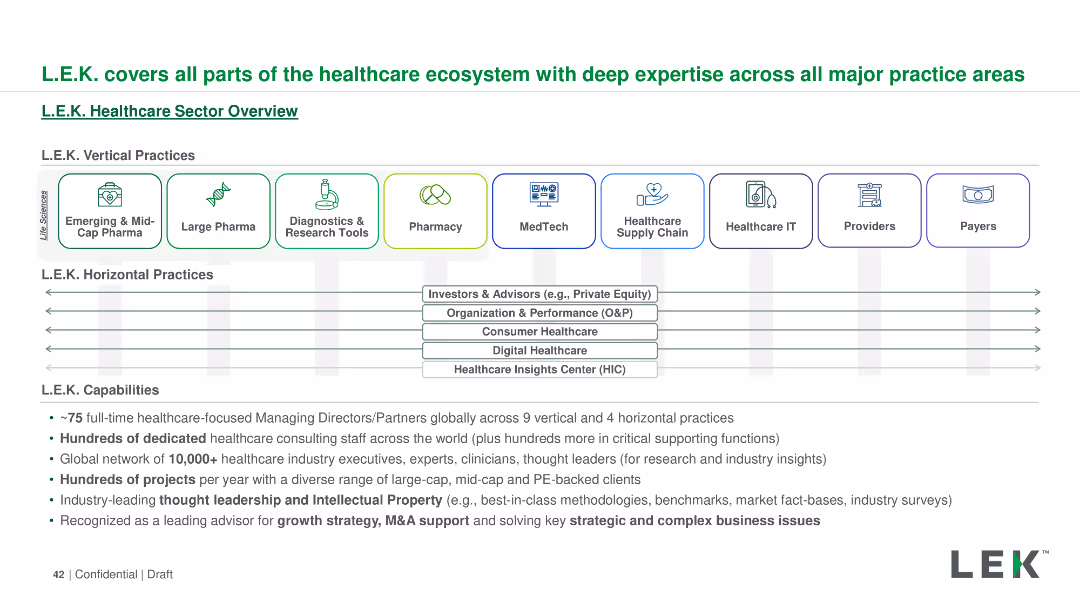
The slide outlines L.E.K.'s healthcare sector capabilities using a horizontal layout. It includes icons and text boxes to detail vertical and horizontal practices, capabilities, and global reach. Colors and icons are used for visual categorization.
Industry Overview
Professional Services
The slide provides an overview of L.E.K.'s comprehensive involvement in the healthcare ecosystem, covering vertical and horizontal practices, capabilities, and their global network. It highlights their expertise and range of services in the healthcare sector.
L.E.K., healthcare, ecosystem, vertical practices, horizontal practices, capabilities, global reach, services
false
Industry Overview
Professional Services
Diagram
LEK
Add to my slides
Remove from favorites
The slide is split into two main sections, with a red theme. On the left, bullet points are aligned vertically, detailing the SASB standard. On the right, bullet points explain the TCFD standard, alongside their respective logos.
Financial Performance
Industrial & Manufacturing
This slide explains LANXESS’s improvement in reporting standards according to SASB and TCFD, outlining key performance indicators and acknowledging the need for better climate-related financial disclosures.
LANXESS, SASB, TCFD, sustainability, reporting standards, climate-related disclosures, KPIs, financial information, environmental, governance
false
Financial Performance
Industrial & Manufacturing
Table
Morgan Stanley
Add to my slides
Remove from favorites
The slide features two bar charts titled "Total LBO loans issued declined across regions" and "Meanwhile, direct lending has been growing". The left chart shows a decline with a red arrow pointing to a 50% reduction. The right chart shows increasing trends in red for the year 22. Both have a y-axis with monetary values.
Market Analysis and Trends
Financial Services
This slide compares traditional bank lending trends with the rise of direct lending, highlighting a significant decline in leveraged buyout loans and the growth of alternative funding. It's used to analyze the shifts in financial strategies and impacts on large deals financing.
LBO, Financing, Direct Lending, Market Trends, Decline, Growth, Alternative Funding, Comparison
false
Market Analysis and Trends
Financial Services
Single Chart
Bain
Add to my slides
Remove from favorites
This slide presents a horizontal bar chart detailing the high-end levelized cost components for various renewable and conventional energy technologies, including capital, fixed O&M, variable O&M, and fuel costs.
Operational Efficiency
Energy & Utilities
The slide analyzes the high-end levelized cost components for different energy sources, emphasizing the cost structures and potential areas for reducing overall costs in renewable and conventional energy generation.
LCOE Components, High-End Cost, Energy Efficiency, Cost Breakdown, Renewable Energy
false
Operational Efficiency
Energy & Utilities
Single Chart
Roland Berger
Add to my slides
Remove from favorites
This slide shows a horizontal bar chart detailing the low-end levelized cost components for various renewable and conventional energy technologies, including capital, fixed O&M, variable O&M, and fuel costs.
Operational Efficiency
Energy & Utilities
The slide breaks down the low-end levelized cost components for different energy sources, highlighting the factors contributing to overall cost efficiency and competitiveness of renewable vs. conventional energy.
LCOE Components, Low-End Cost, Energy Efficiency, Cost Breakdown, Renewable Energy
false
Operational Efficiency
Energy & Utilities
Single Chart
Roland Berger
Add to my slides
Remove from favorites
Horizontal bar chart decomposing LCOE for various renewable and conventional energy types at the low-cost end.
Performance Metrics and KPIs
Energy & Utilities
Shows the capital and operating cost breakdowns for renewable and conventional energy technologies at the low end of the cost spectrum. Highlights how some renewables are now cost-competitive or cheaper than fossil-based power generation.
LCOE, capital cost, fixed O&M, variable O&M, fuel cost, renewable energy, cost structure
false
Performance Metrics and KPIs
Energy & Utilities
Single Chart
Roland Berger
Add to my slides
Remove from favorites
Line chart showing how LCOE varies with cost of capital for each energy source; each line represents one technology.
Investment Analysis
Financial Services
Explores how variations in the cost of capital influence the LCOE of different energy technologies, illustrating that renewables tend to have lower risk and better cost stability under financial fluctuations.
LCOE, cost of capital, IRR, equity, debt, investment, energy financing, WACC
false
Investment Analysis
Financial Services
Single Chart
Roland Berger
Add to my slides
Remove from favorites
The slide displays a column chart showing the Levelized Cost of Electricity (LCOE) for different fossil and low carbon energy sources in $/MWh for 2019. The chart compares costs across various energy sources such as coal, gas, nuclear, wind, and biomass.
Market Analysis and Trends
Energy & Utilities
The slide compares the LCOE of different energy sources, indicating that gas combined with CCUS falls within the range of other low carbon electricity sources and has the advantage of being dispatchable. It suggests that lower estimates for LCOE can cover a drop in these costs.
LCOE, electricity, energy sources, CCUS
false
Market Analysis and Trends
Energy & Utilities
Single Chart
Kearney
Add to my slides
Remove from favorites
Horizontal bar chart comparing LCOE for various renewable and conventional energy sources; categorized into two vertical sections with color-coded bars.
Market Analysis and Trends
Energy & Utilities
This slide compares the Levelized Cost of Energy (LCOE) across energy sources, highlighting the cost competitiveness of renewables vs. fossil fuels under typical assumptions.
LCOE, renewable, solar, wind, nuclear, coal, gas, comparison, $/MWh, energy costs
false
Market Analysis and Trends
Energy & Utilities
Single Chart
Roland Berger
Add to my slides
Remove from favorites
Two side-by-side line charts comparing LCOE ranges and averages for Wind—Onshore and Solar PV—Utility from 2009–2024.
Market Analysis and Trends
Energy & Utilities
The slide illustrates historical trends in the Levelized Cost of Energy (LCOE) for onshore wind and utility-scale solar PV. While prices dropped significantly from 2009 to 2020, recent years show slight increases and a narrowing range, reflecting market and supply chain dynamics.
LCOE, wind energy, solar PV, renewable energy, historical trends, pricing, market, CAGR
false
Market Analysis and Trends
Energy & Utilities
Multiple Chart
Roland Berger
Add to my slides
Remove from favorites
The slide includes a column chart depicting the estimated levelized cost of hydrogen (LCOH) per production technology, with data points for Brown, Blue, Green hydrogen, and an average line. It shows costs in $ per kg for various technologies like SMR, Coal Gasification, and Alkaline Electrolysis.
Financial Performance
Energy & Utilities
The slide compares the estimated LCOH for different hydrogen production technologies, highlighting the cost differences between brown, blue, and green hydrogen sources. It provides a financial analysis of hydrogen production costs.
LCOH, Hydrogen, Cost, Production, Technology
false
Financial Performance
Energy & Utilities
Single Chart
Kearney
Add to my slides
Remove from favorites
The slide features a column chart showing the breakdown of LCOH for the SMR example, including segments for Capex, startup costs, fuel, water, catalysts, labor and overhead, maintenance, insurance, and electricity selling. Each segment's percentage of total LCOH is displayed.
Financial Performance
Energy & Utilities
This slide provides a detailed breakdown of the LCOH for SMR, illustrating the contributions of various cost factors like Capex, fuel, and maintenance to the overall cost. It offers a financial analysis of hydrogen production using SMR.
LCOH, SMR, Cost Breakdown, Hydrogen, Financial Analysis
false
Financial Performance
Energy & Utilities
Single Chart
Kearney
Add to my slides
Remove from favorites
The slide features a line graph showing the relationship between capex and LCOH across various utilization rates, highlighting significant cost increases at low utilization.
Market Analysis and Trends
Energy & Utilities
The slide explains that while high load factors offset capex weight, LCOH can spike dramatically at low utilization rates, supported by the graph.
LCOH, capex, utilization rate, cost analysis, load factor
false
Market Analysis and Trends
Energy & Utilities
Single Chart
Kearney
Add to my slides
Remove from favorites
This slide features two bar charts showing the costs of conversion and reconversion for different hydrogen storage methods, emphasizing compression costs.
Market Analysis and Trends
Energy & Utilities
The slide explains that conversion and reconversion processes increase LCOH, with compression being the cheapest yet lowest energy-dense option, supported by the charts.
LCOH, conversion, reconversion, compression, storage costs
false
Market Analysis and Trends
Energy & Utilities
Multiple Chart
Kearney
Add to my slides
Remove from favorites
This slide contains two graphs: one showing the impact of capex on electrolysis costs and another depicting the effect of electricity prices and utilization rates.
Market Analysis and Trends
Energy & Utilities
The slide details how reducing capex and optimizing electricity prices and load factor can improve the LCOH for electrolysis, using visual data to support the points.
LCOH, electrolysis, capex, electricity price, load factor
false
Market Analysis and Trends
Energy & Utilities
Multiple Chart
Kearney
Add to my slides
Remove from favorites
This slide presents a column chart that breaks down the LCOH for a PEM electrolyzer, with electricity being the largest cost component.
Market Analysis and Trends
Energy & Utilities
The slide shows the breakdown of LCOH costs for a PEM electrolyzer, emphasizing the significant impact of electricity costs on overall expenses.
LCOH, electrolyzer, PEM, electricity costs, capex
false
Market Analysis and Trends
Energy & Utilities
Single Chart
Kearney
Add to my slides
Remove from favorites
The slide includes multiple column charts comparing the Levelized Cost of Hydrogen (LCOH) from different power sources over time (2019, 2025, 2030). Each chart shows cost variations for wind, solar, grid wind, and grid solar.
Market Analysis and Trends
Energy & Utilities
The slide analyzes the competitiveness of hydrogen production using electrolyzers powered by renewables versus grid-connected systems. It projects cost reductions over time and highlights the economic potential of renewable-powered electrolyzers.
LCOH, electrolyzer, renewable energy, hydrogen production, cost analysis
false
Market Analysis and Trends
Energy & Utilities
Multiple Chart
Kearney
Add to my slides
Remove from favorites
The slide features three sets of bar charts comparing LCOH reductions under different power control scenarios (positive, negative, combined). Each set shows cost comparisons for grid-only and with power control.
Risk Assessment and Management
Energy & Utilities
This slide examines how grid servicing by electrolyzers can significantly reduce the Levelized Cost of Hydrogen (LCOH). It presents various scenarios and quantifies potential cost savings through effective power control management.
LCOH, grid servicing, electrolyzers, power control, cost reduction
false
Risk Assessment and Management
Energy & Utilities
Multiple Chart
Kearney
Add to my slides
Remove from favorites
The slide features two graphs: one showing electricity spot prices over time and another depicting LCOH per load factor, highlighting optimal load factor ranges.
Market Analysis and Trends
Energy & Utilities
The slide analyzes the relationship between load factors and LCOH, noting that optimal LCOH is achieved between 70-90% load factors, with limited impact from spot prices.
LCOH, load factors, electricity spot price, utilization rate, cost analysis
false
Market Analysis and Trends
Energy & Utilities
Multiple Chart
Kearney
Add to my slides
Remove from favorites
This slide includes a line graph showing LCOH as a function of electricity price, along with a column chart comparing LCOH breakdown at different electricity prices.
Market Analysis and Trends
Energy & Utilities
The slide emphasizes the importance of securing favorable power purchase agreements (PPA) to reduce LCOH, demonstrated by the graphs.
LCOH, power price, PPA, electricity costs, market trends
false
Market Analysis and Trends
Energy & Utilities
Multiple Chart
Kearney
Add to my slides
Remove from favorites
This slide includes two line graphs showing the transmission and distribution LCOH for different hydrogen carriers over various distances.
Market Analysis and Trends
Energy & Utilities
The slide analyzes how transportation costs vary based on hydrogen form, carrier, and distance traveled, with data visualized in the line graphs.
LCOH, transportation costs, hydrogen carriers, distance, cost analysis
false
Market Analysis and Trends
Energy & Utilities
Multiple Chart
Kearney
Add to my slides
Remove from favorites
The slide includes column charts comparing the levelized cost of mobility per passenger for ICE buses, fuel cell buses, and BEV buses in 2030 under different scenarios.
Market Analysis and Trends
Energy & Utilities
The slide discusses the potential competitiveness of fuel cell electric buses compared to battery electric and internal combustion engine buses, highlighting cost projections and trends.
LCOM, FCEV buses, BEV, ICE, competitiveness
false
Market Analysis and Trends
Energy & Utilities
Mixed Chart
Kearney
Add to my slides
Remove from favorites
The slide features a scatter plot comparing levelized cost of mobility (LCOM) and range for various car models, including FCEV and BEV.
Financial Performance
Energy & Utilities
The slide highlights the comparison of hydrogen cars and battery electric vehicles in terms of range and levelized cost of mobility, noting the higher TCO for mid-end BEVs.
LCOM, FCEV, BEV, range, TCO, comparison
false
Financial Performance
Energy & Utilities
Single Chart
Kearney
Add to my slides
Remove from favorites
The slide includes column charts comparing the levelized cost of mobility per passenger for ICE buses, fuel cell buses, and BEV buses under different scenarios.
Operational Efficiency
Energy & Utilities
The slide compares the levelized cost of mobility per passenger for internal combustion engine buses, fuel cell buses, and battery electric buses, noting the higher cost for H2 buses.
LCOM, H2 buses, BEV, cost, passenger
false
Operational Efficiency
Energy & Utilities
Mixed Chart
Kearney
Add to my slides
Remove from favorites
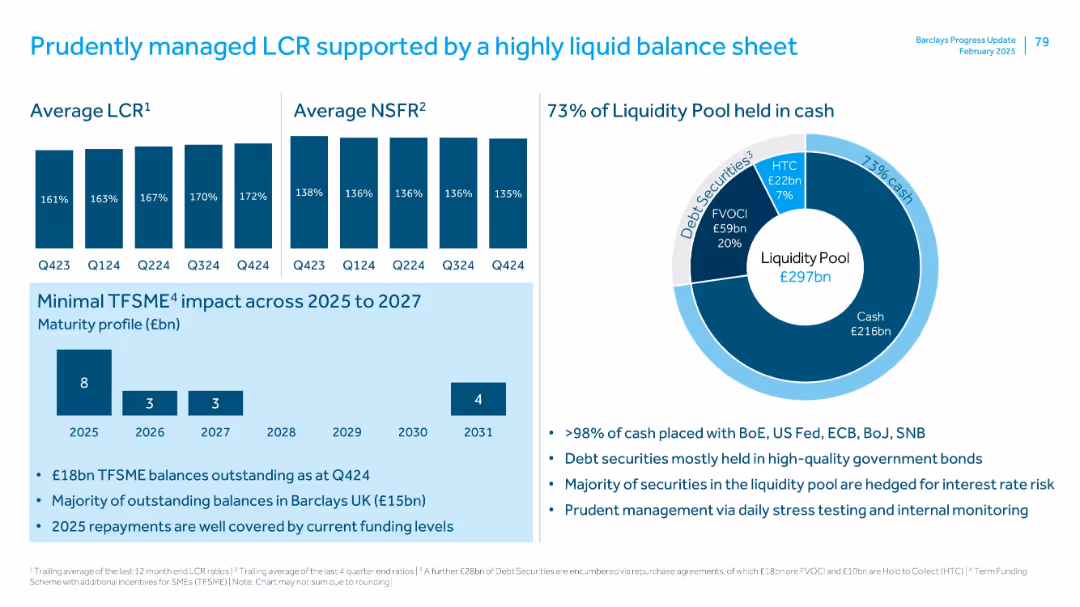
Split into four sections: two bar charts (LCR and NSFR), one pie chart (liquidity pool), and one maturity profile bar chart with bullet points below. Uses consistent blue branding and typography.
Financial Performance
Financial Services
Highlights Barclays’ liquidity coverage and funding stability in Q1 2025, including strong LCR and NSFR ratios, liquidity pool composition (74% in cash), and low TFSME refinancing risk through 2027. Emphasizes prudent liquidity management and high-quality asset backing.
LCR, NSFR, liquidity pool, TFSME, funding profile, Q1 2025, Barclays, cash reserves, financial stability
false
Financial Performance
Financial Services
Multiple Chart
Barclays
Add to my slides
Remove from favorites
Left section contains LCR/NSFR bar charts. Right section includes a donut chart on liquidity pool composition. Bottom segment outlines TFSME maturity.
Risk Assessment and Management
Financial Services
Emphasizes strong liquidity ratios (LCR and NSFR) and £297bn liquidity pool, 73% in cash. Details maturity profile of TFSME, indicating low near-term refinancing risk. Highlights prudent portfolio and interest rate hedging strategy.
LCR, NSFR, liquidity pool, cash, debt securities, TFSME, stress testing
false
Risk Assessment and Management
Financial Services
Multiple Chart
Barclays
Add to my slides
Remove from favorites
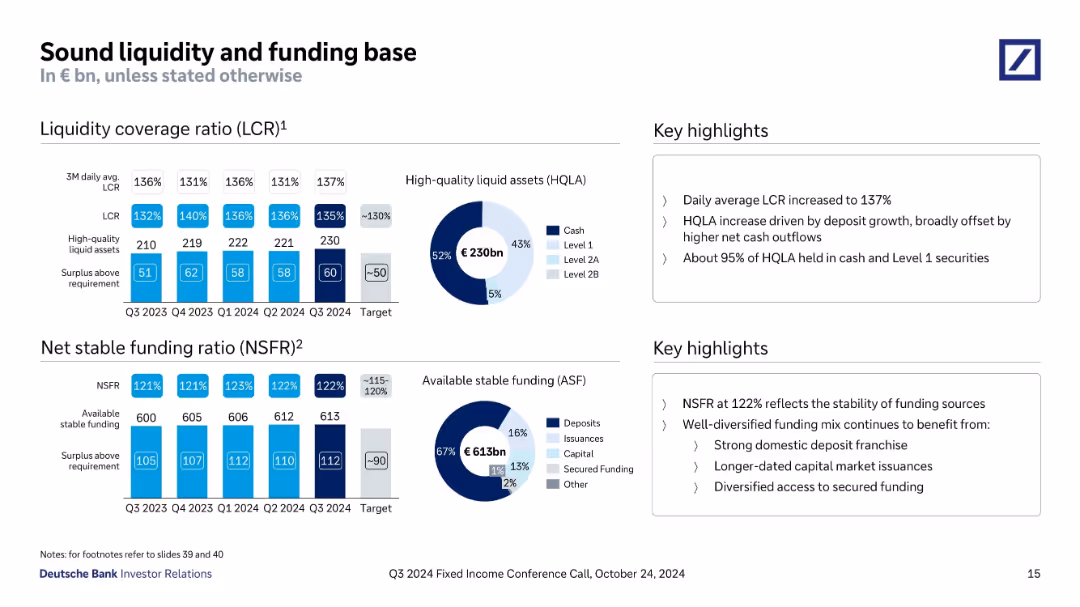
Dual sections with bar and donut charts showing liquidity coverage ratio (LCR), net stable funding ratio (NSFR), and breakdown of funding sources.
Risk Assessment and Management
Financial Services
The slide demonstrates robust liquidity and funding through LCR of 137% and NSFR of 122% in Q3 2024, supported by €230bn in HQLA and €613bn available stable funding. The bank emphasizes stability and diversified funding, with key metrics exceeding regulatory targets.
LCR, NSFR, liquidity, funding, HQLA, ASF, Deutsche Bank, Q3 2024, stability
false
Risk Assessment and Management
Financial Services
Multiple Chart
Deutsche Bank
Add to my slides
Remove from favorites
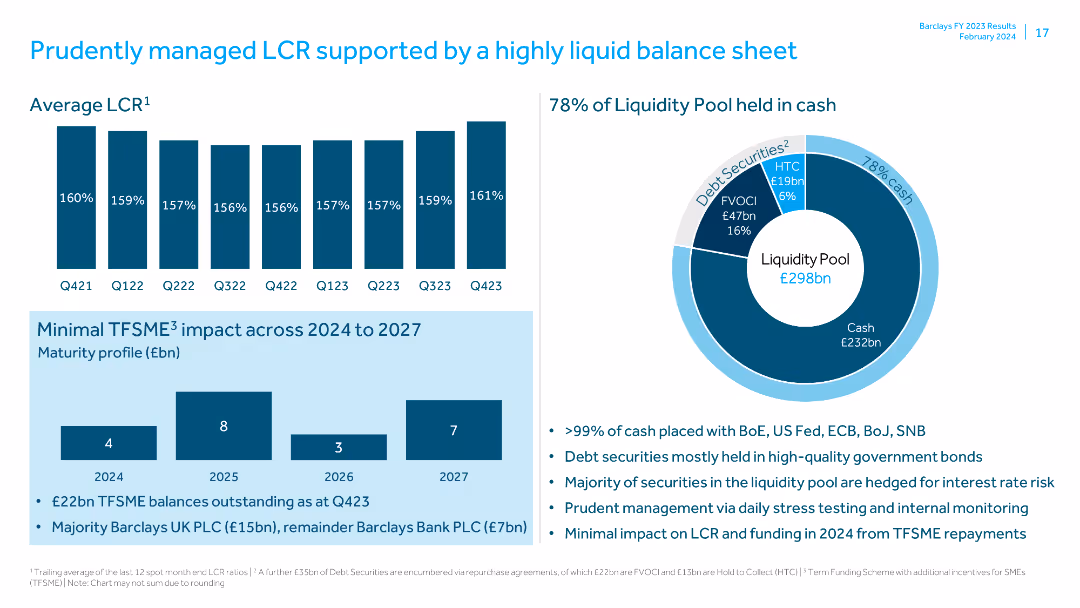
Features bar charts for average LCR over quarters and a pie chart showing the composition of the liquidity pool. Also includes text on TFSME impact.
Risk Assessment and Management
Financial Services
Discusses the management of Liquidity Coverage Ratio (LCR) and the composition of the liquidity pool, along with the impact of TFS balances over 2024-2027.
LCR, liquidity pool, TFSME, risk management, balance sheet, cash holdings, government bonds, stress testing, interest rate risk, FX
false
Risk Assessment and Management
Financial Services
Multiple Chart
Barclays
Add to my slides
Remove from favorites
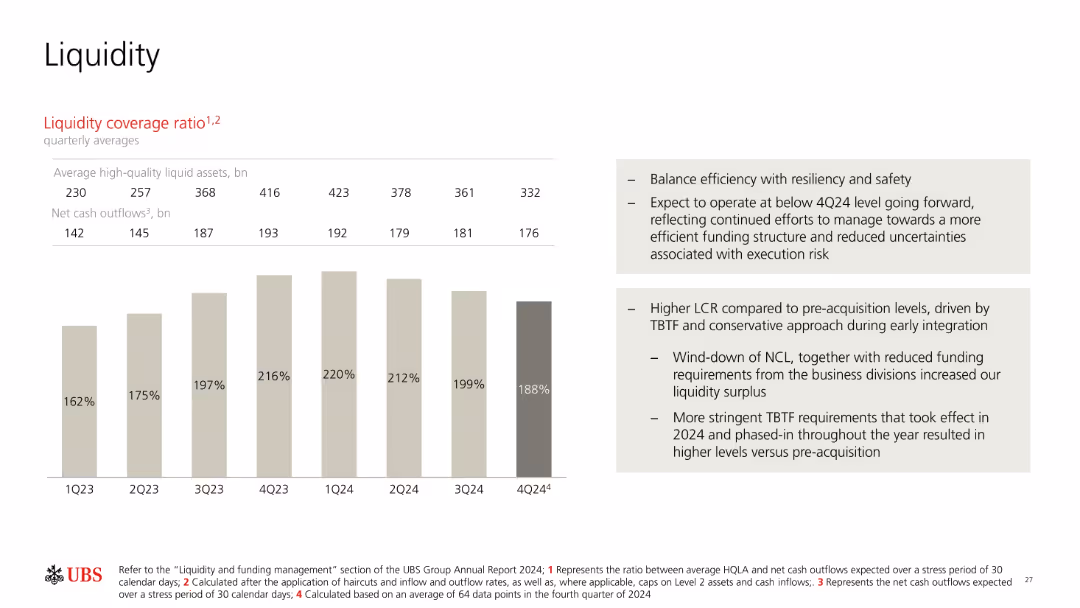
Bar chart showing liquidity coverage ratio (LCR) over 8 quarters; includes two text blocks explaining context and future expectations. Neutral color palette.
Risk Assessment and Management
Financial Services
Tracks UBS’s LCR over time from 1Q23 to 4Q24, noting shifts in liquid assets and net cash outflows. Provides interpretation regarding resilience, funding structure optimization, and higher post-acquisition LCRs due to regulatory requirements and risk management priorities.
LCR, liquidity, cash outflows, risk, funding structure, resilience
false
Risk Assessment and Management
Financial Services
Mixed Chart
UBS
Add to my slides
Remove from favorites
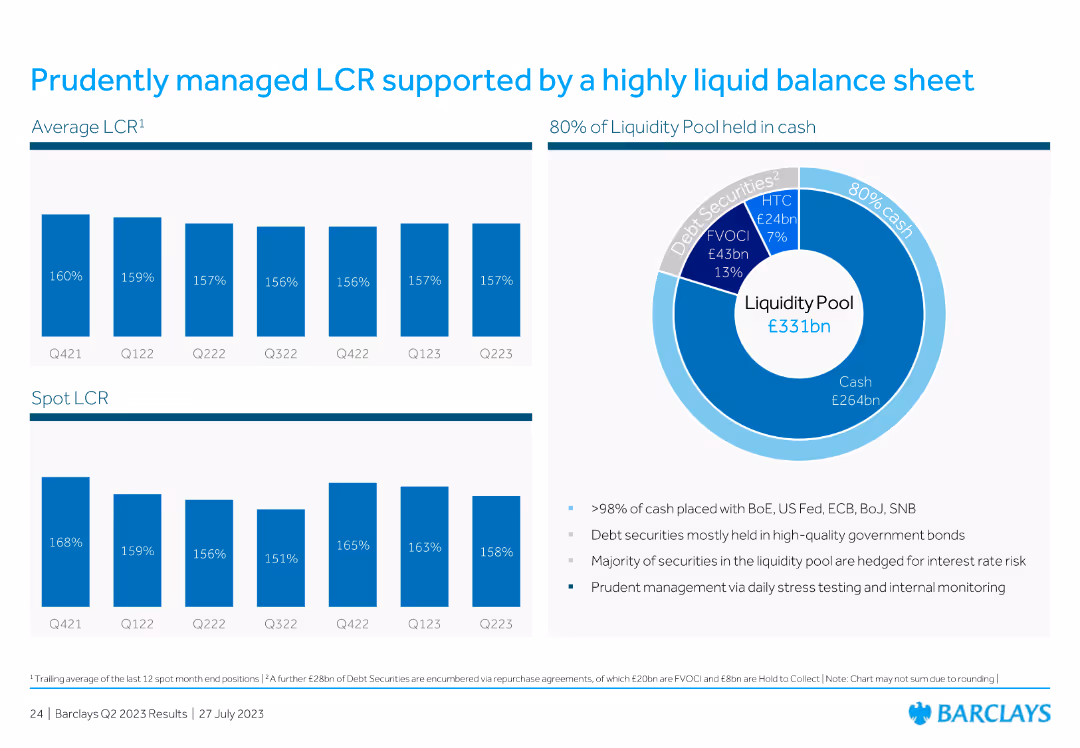
Includes bar charts and a pie chart showing liquidity coverage ratio (LCR) and the composition of the liquidity pool.
Financial Performance
Financial Services
Discusses prudent management of LCR with a highly liquid balance sheet, detailing the liquidity pool composition.
LCR, liquidity, management, balance sheet, pool
false
Financial Performance
Financial Services
Multiple Chart
Barclays
Add to my slides
Remove from favorites
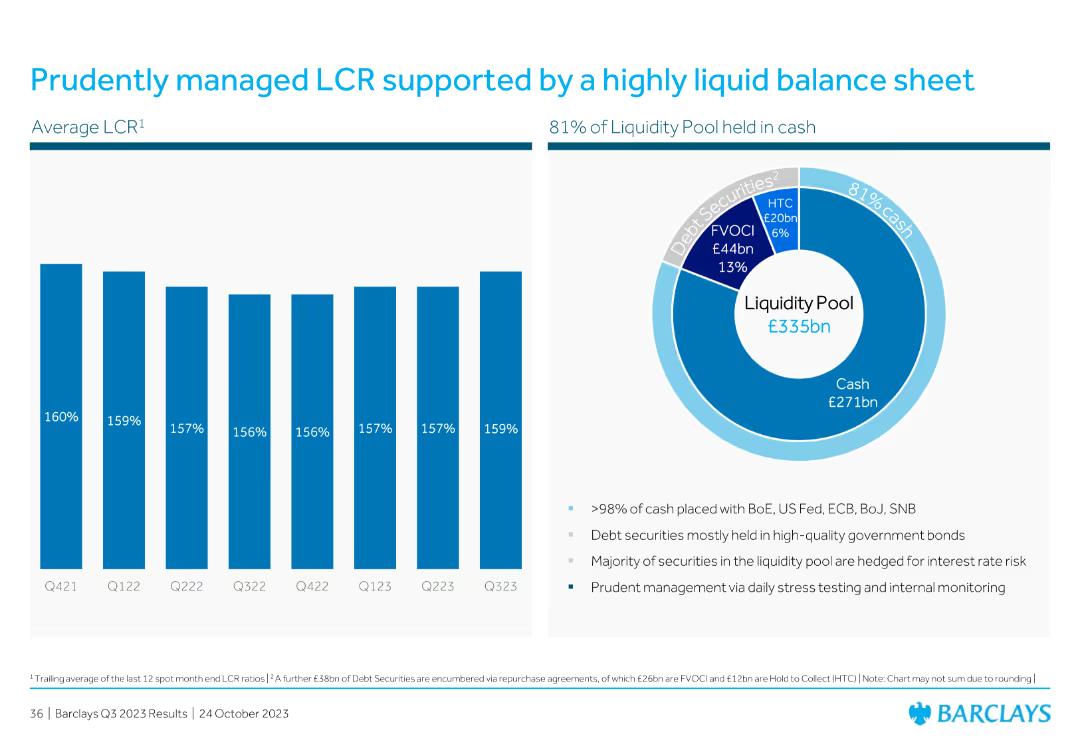
Left side features a bar chart showing quarterly average LCR ratios. Right side includes a pie chart breaking down the liquidity pool composition.
Risk Assessment and Management
Financial Services
Discusses Barclays' liquidity coverage ratio (LCR) management and the composition of its liquidity pool, highlighting prudent financial management practices.
LCR, liquidity, management, financial, Barclays, balance sheet, quarterly, ratio, pool
false
Risk Assessment and Management
Financial Services
Multiple Chart
Barclays
Add to my slides
Remove from favorites
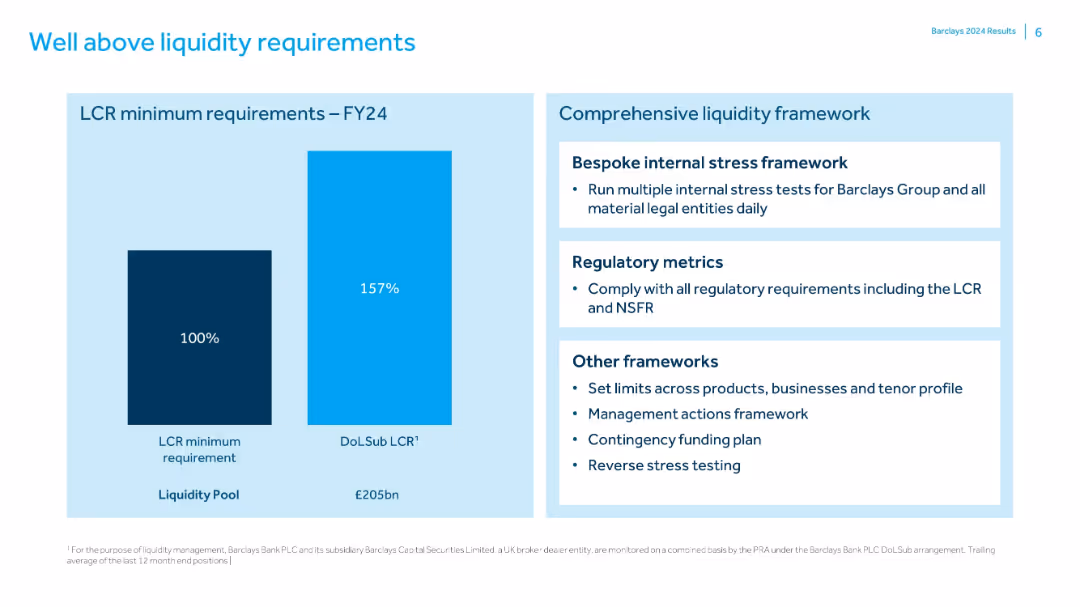
Bar chart comparing LCR requirement to Barclays’ actual liquidity coverage ratio; text box outlines liquidity frameworks and practices.
Regulatory and Compliance
Financial Services
Demonstrates that Barclays maintains a 157% LCR, significantly above the 100% minimum. Accompanied by a breakdown of liquidity management practices including stress testing, regulatory compliance, and contingency planning.
LCR, liquidity, stress testing, Barclays, compliance, NSFR, funding
false
Regulatory and Compliance
Financial Services
Mixed Chart
Barclays
Add to my slides
Remove from favorites
The slide features a column chart comparing the levelized cost of energy (LCoE) by renewable energy source (solar, wind, geothermal, hydro, biomass) from 2010 to 2019. It highlights the improvements in feedstock economics and infrastructure compatibility.
Technology and Digital Transformation
Energy & Utilities
This slide presents the comparative costs of various renewable energy sources over time, emphasizing the competitive position of biomass and the potential for further cost reductions through improvements in feedstock and process economics.
LCoE, renewable energy, solar, wind, geothermal, hydro, biomass, feedstock economics, infrastructure compatibility
false
Technology and Digital Transformation
Energy & Utilities
Mixed Chart
Kearney
Add to my slides
Remove from favorites
Column chart comparing the levelized cost of energy for large-scale LDES technologies, showing costs with and without subsidies for electrochemical, mechanical, and thermal systems.
Financial Performance
Energy & Utilities
The slide compares the costs of various long-duration energy storage technologies, highlighting differences in costs under subsidized and unsubsidized conditions.
LDES, Cost analysis, Energy storage, Subsidies, Technology comparison
false
Financial Performance
Energy & Utilities
Single Chart
Roland Berger
Add to my slides
Remove from favorites
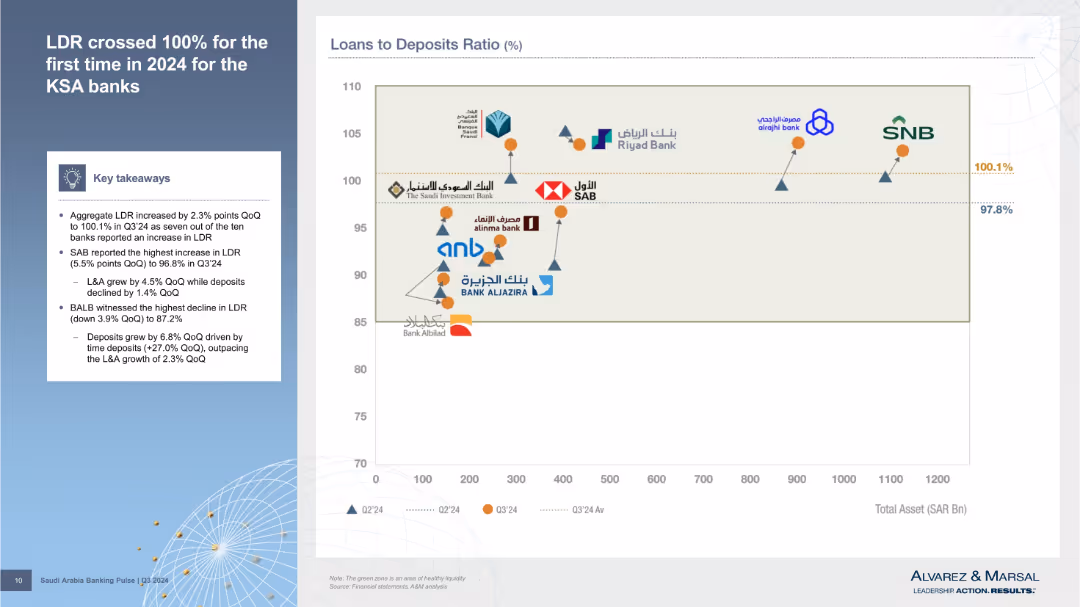
Left column outlines findings; right is a scatter plot comparing total assets vs. loan-to-deposit ratio for banks, with performance markers.
Risk Assessment and Management
Financial Services
Details Q3’24 increase in Loan-to-Deposit Ratio (LDR), crossing 100%. Visual comparison of banks’ asset sizes and LDR positions shows liquidity strength or risk exposure.
LDR, liquidity risk, total assets, Q3’24, KSA banks, deposit ratio, financial stress, risk indicators, balance sheet
false
Risk Assessment and Management
Financial Services
Mixed Chart
Alvarez & Marsal
Add to my slides
Remove from favorites
Features a column chart comparing the relative sales ROI performance across digital average, SFVC, and LFVC, with LFVC showing double the performance.
Performance Metrics and KPIs
Media & Entertainment
Highlights the unexpectedly low media spend on LFVC despite its high performance, suggesting a misalignment in investment priorities.
LFVC, media spend, ROI, performance analysis, investment misalignment
false
Performance Metrics and KPIs
Media & Entertainment
Single Chart
Accenture
Add to my slides
Remove from favorites
Contains two pie charts showing the growth rates of LFVC viewership and ad spend, highlighting a 12% market disconnect between the two.
Market Analysis and Trends
Media & Entertainment
Examines the disparity in growth rates between LFVC viewership and advertising spend, illustrating a potential misalignment in market investment.
LFVC, viewership growth, ad spend, CAGR, market disconnect
false
Market Analysis and Trends
Media & Entertainment
Multiple Chart
Accenture
Add to my slides
Remove from favorites
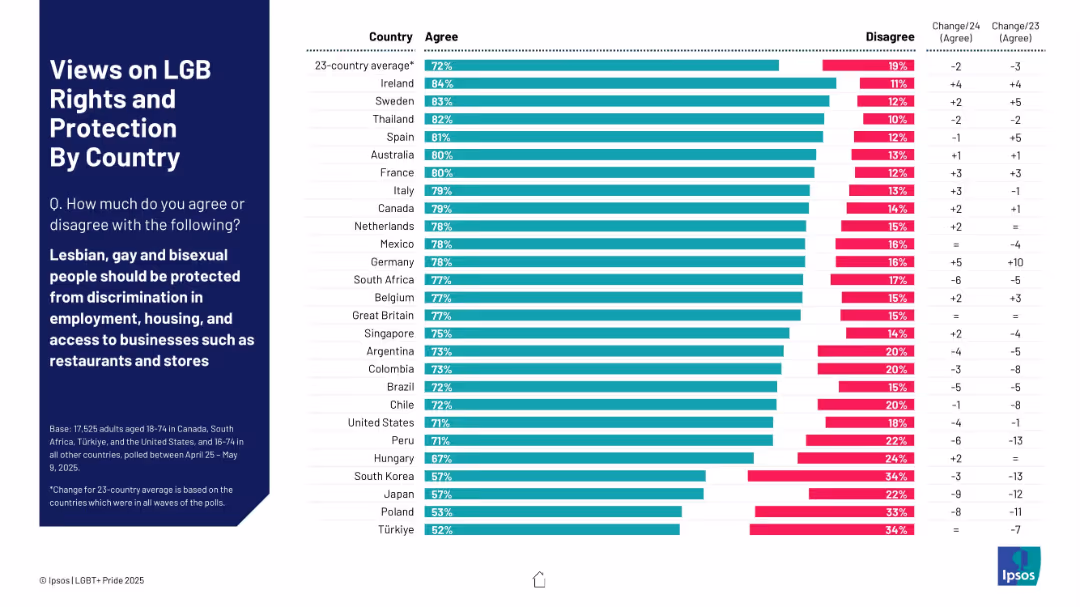
Horizontal bar chart comparing agreement/disagreement across countries
Market Analysis and Trends
Government & Public Sector
This slide gauges agreement with protecting LGB people from discrimination in employment, housing, and business access. Ireland, Sweden, and Thailand show high levels of agreement (80%+). Notable increases in agreement are seen in countries like Germany and Canada.
LGB, discrimination, agreement levels, protection, global attitudes, Ipsos, policy, social inclusion
false
Market Analysis and Trends
Government & Public Sector
Mixed Chart
IPSOS
Add to my slides
Remove from favorites
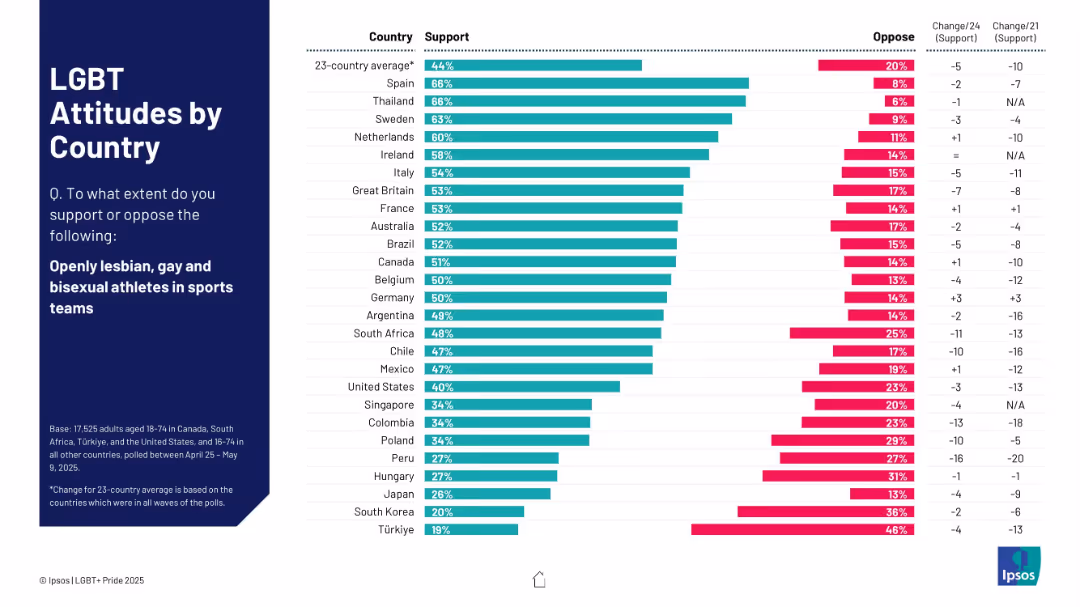
Horizontal bar chart ranking countries by support for openly LGBT athletes. Includes oppose levels and changes over time.
Market Analysis and Trends
Government & Public Sector
Assesses international support for openly LGBT athletes. Spain and Thailand show high acceptance; Great Britain moderately supportive. Includes data on shifts from 2021 and 2024 polls.
LGBT athletes, sports inclusivity, international survey, Ipsos, public attitudes
false
Market Analysis and Trends
Government & Public Sector
Mixed Chart
IPSOS
Add to my slides
Remove from favorites
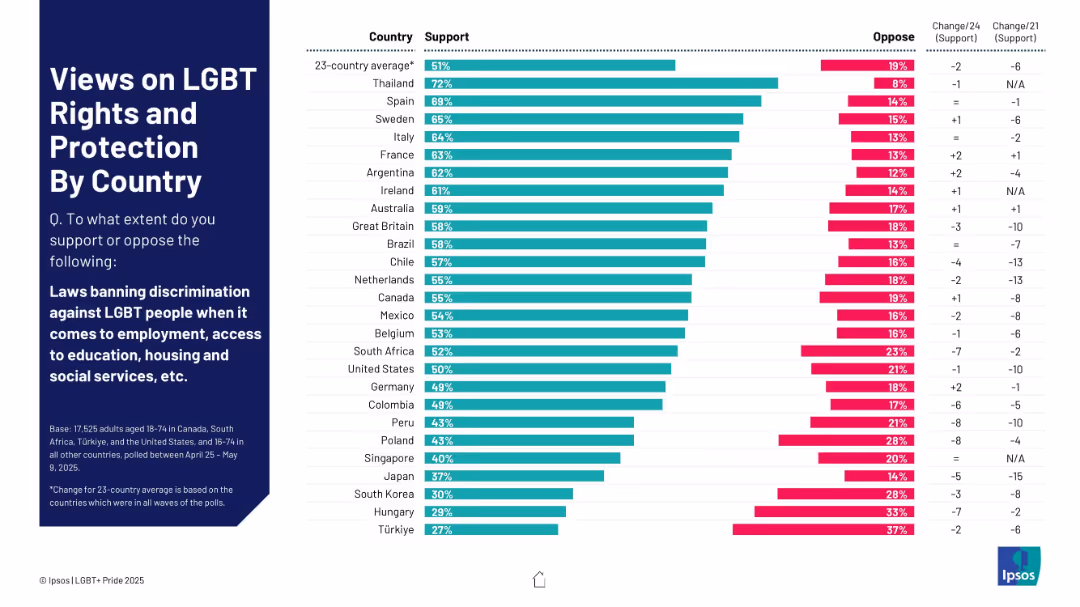
Horizontal bar chart showing levels of support/opposition to anti-discrimination laws by country
Regulatory and Compliance
Government & Public Sector
The slide measures support for laws banning LGBT discrimination in employment, education, housing, and social services across 23 countries. Thailand leads in support (72%), while Türkiye ranks lowest (27%). Change indicators over time highlight sociopolitical trends.
LGBT rights, anti-discrimination, support levels, employment, legislation, opinion data, countries
false
Regulatory and Compliance
Government & Public Sector
Mixed Chart
IPSOS
Add to my slides
Remove from favorites
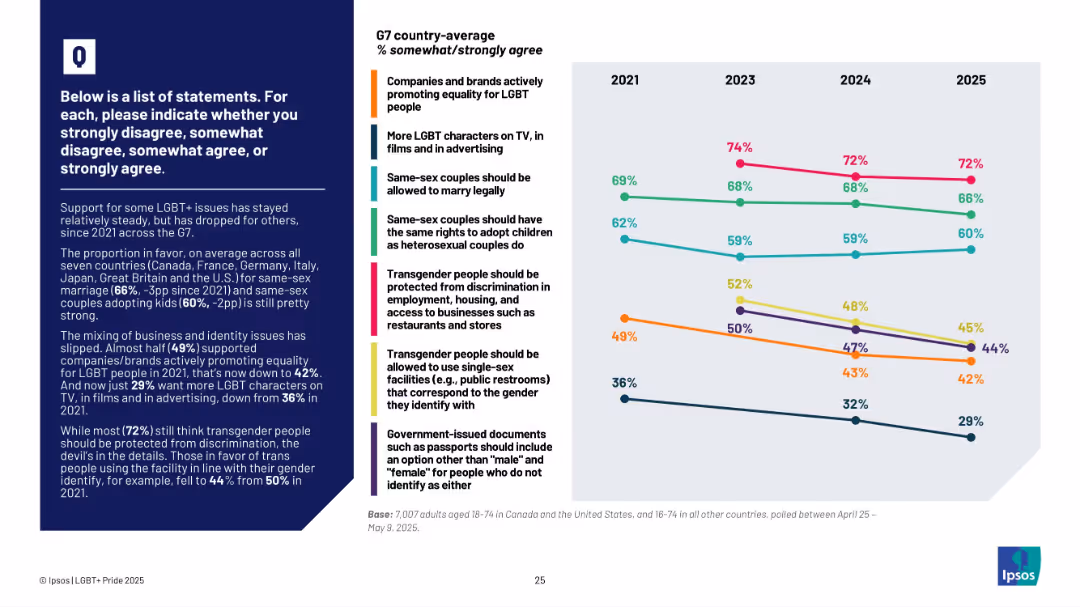
Line graph showing trends from 2021–2025 by issue; text box at left with summary insights
Market Analysis and Trends
Government & Public Sector
This slide tracks changes in public support for LGBT+ rights among G7 countries. It shows declining support in areas like brand promotion of LGBT causes and transgender rights, with the most consistent support for same-sex marriage and anti-discrimination protections.
LGBT+, G7, support trends, policy opinions, transgender, marriage, adoption, brand support, Ipsos
false
Market Analysis and Trends
Government & Public Sector
Mixed Chart
IPSOS
Add to my slides
Remove from favorites
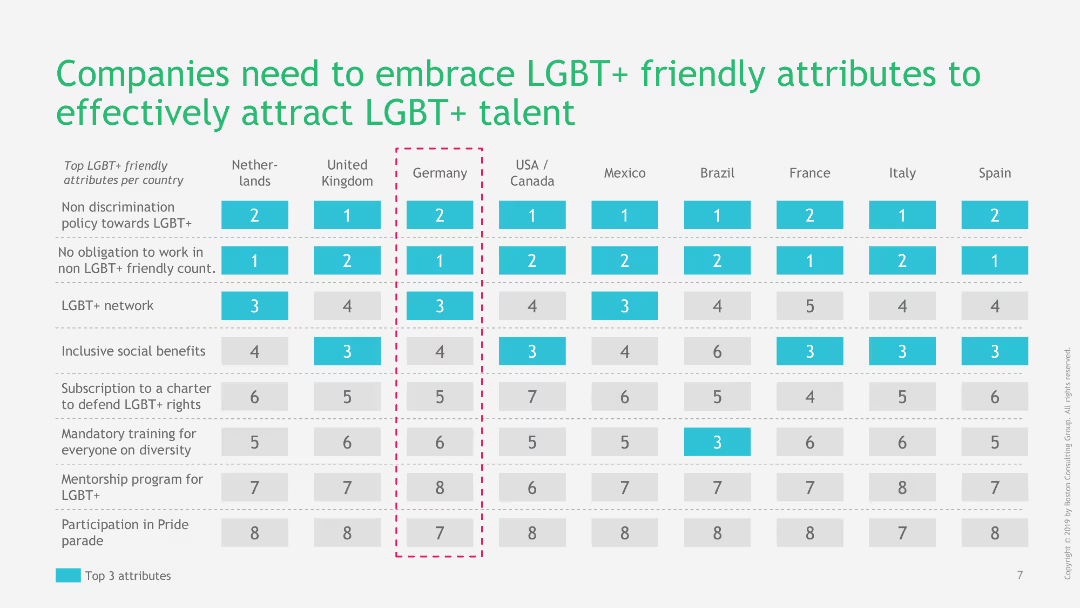
Table ranking top criteria for choosing a company across various countries, with color-coded highlights for top three criteria and LGBT+ related factors.
Regulatory and Compliance
Professional Services
This slide details the top criteria LGBT+ talents consider when choosing a company, with LGBT+ friendly culture being the top factor in Germany.
LGBT+, Germany, workplace, company choice, diversity
false
Regulatory and Compliance
Professional Services
Table
BCG
Add to my slides
Remove from favorites
Column chart displaying percentage of LGBT+ talents out at work in various countries. Green, gray, and red bars indicate different levels of openness. Minimalist design.
Regulatory and Compliance
Professional Services
The slide compares the percentage of LGBT+ talents who are out at work across multiple countries, highlighting that Germany has a lower percentage of openly out employees compared to other nations.
LGBT+, Germany, workplace, diversity, inclusion
false
Regulatory and Compliance
Professional Services
Single Chart
BCG
Add to my slides
Remove from favorites
Column chart showing percentages of LGBT+ talents' opinions on how being out would affect their work life. Green, gray, and red bars represent different impacts.
Regulatory and Compliance
Professional Services
The slide presents data on the perceived impact of being openly out at work among LGBT+ talents, with a focus on Germany where 38% feel it would improve their life.
LGBT+, Germany, workplace, diversity, life impact
false
Regulatory and Compliance
Professional Services
Single Chart
BCG
Add to my slides
Remove from favorites
Column chart illustrating the willingness of LGBT+ talents to work in hostile countries and to lie about their partner. Green and dark green bars show different scenarios.
Regulatory and Compliance
Professional Services
The slide illustrates Germany's position where LGBT+ talents are least likely to accept work in hostile countries, and their tendency to lie about their partners when asked by managers.
LGBT+, Germany, workplace, hostile countries, diversity
false
Regulatory and Compliance
Professional Services
Single Chart
BCG
Add to my slides
Remove from favorites
Table listing LGBT+ friendly attributes by country with rankings and highlights for top attributes.
Regulatory and Compliance
Professional Services
The slide shows which LGBT+ friendly attributes are most valued by talents in different countries, emphasizing the importance of non-discrimination policies and inclusive benefits.
LGBT+, Germany, workplace, talent attraction, diversity
false
Regulatory and Compliance
Professional Services
Table
BCG
Add to my slides
Remove from favorites
Includes column charts showing LGBT+ comfort levels in business environments across countries.
Human Resources and Talent Management
Professional Services
Discusses LGBT+ individuals' readiness to disclose their sexual orientation in professional settings.
LGBT+, business environment, disclosure, professional setting
false
Human Resources and Talent Management
Professional Services
Single Chart
BCG
Add to my slides
Remove from favorites
A table outlines the top criteria LGBT+ talents consider when choosing an employer in various countries.
Human Resources and Talent Management
Professional Services
Prioritizes the aspects most important to LGBT+ talents in their employment decisions.
LGBT+, employment criteria, employer choice, top criteria
false
Human Resources and Talent Management
Professional Services
Table
BCG
Add to my slides
Remove from favorites
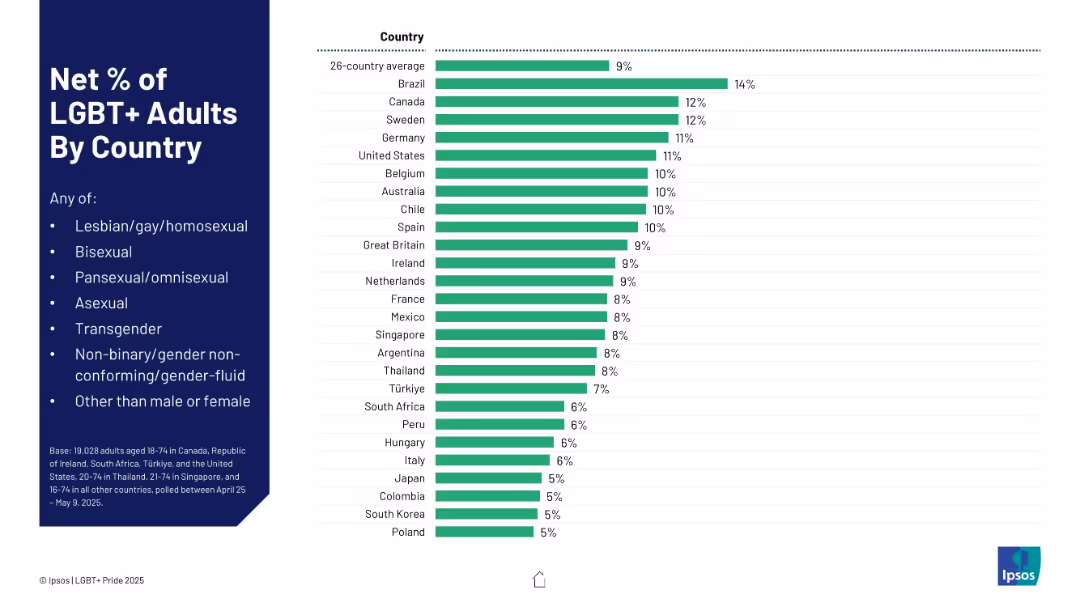
Horizontal bar chart ranking countries by percentage. Left-aligned legend and title; right-aligned bars.
Market Analysis and Trends
Government & Public Sector
This slide visualizes the net percentage of LGBT+ adults in 26 countries, showing Brazil, Canada, and Sweden at the top, with a global average of 9%. Categories include various sexual and gender identities.
LGBT+, global comparison, demographics, country stats, sexuality, identity
false
Market Analysis and Trends
Government & Public Sector
Mixed Chart
IPSOS
Add to my slides
Remove from favorites
Features column charts on attitudes towards working in countries hostile to LGBT+.
Risk Assessment and Management
Professional Services
Evaluates the willingness of LGBT+ talents to work in countries with unfavorable attitudes towards LGBT+.
LGBT+, international work, hostility, willingness
false
Risk Assessment and Management
Professional Services
Single Chart
BCG
Add to my slides
Remove from favorites
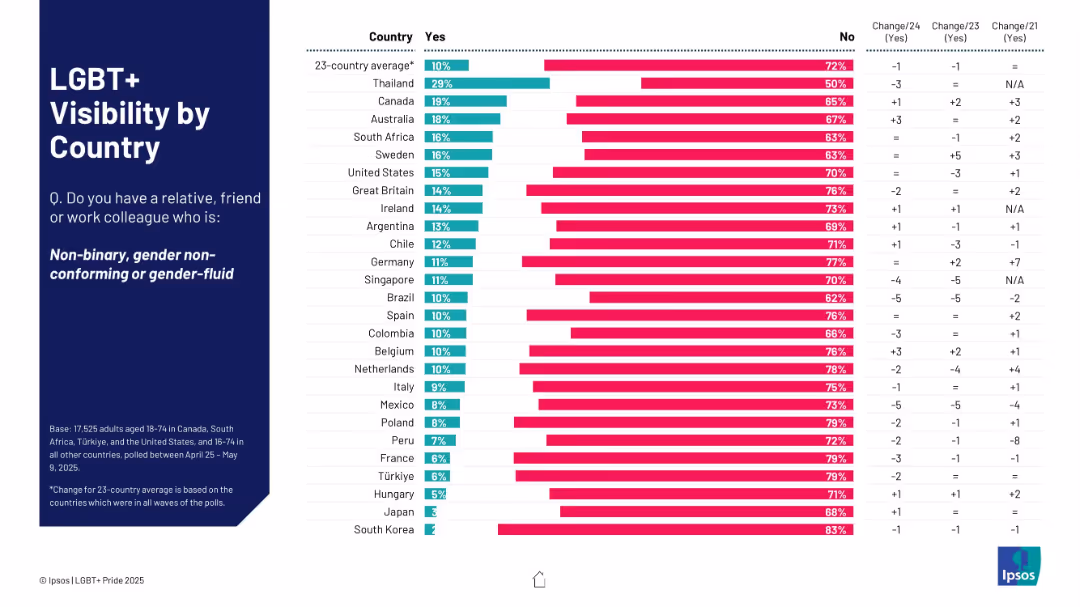
Bar chart with country-wise comparisons (Yes/No) on having non-binary, gender non-conforming, or gender-fluid contacts
Market Analysis and Trends
Government & Public Sector
The slide displays the visibility of non-binary or gender non-conforming individuals globally. It compares 23 countries on the percentage of respondents who know someone from the LGBT+ spectrum. Thailand ranks highest in visibility. Trend data over three years is also included.
LGBT+, visibility, countries, gender-fluid, awareness, trends, Ipsos, data, bar chart, diversity
false
Market Analysis and Trends
Government & Public Sector
Mixed Chart
IPSOS
Add to my slides
Remove from favorites
Features four images, each depicting different workplace experiences of LGBT+ individuals, with quotes.
Organizational Structure and Change
Professional Services
Examines various experiences of LGBT+ employees in the workplace, highlighting differing levels of comfort and openness.
LGBT+, workplace, employee experience, diversity, inclusion
false
Organizational Structure and Change
Professional Services
Header Horizontal
BCG
Add to my slides
Remove from favorites
Column charts show perceptions of life improvement by being openly LGBT+ at work in various countries.
Human Resources and Talent Management
Professional Services
Assesses how being openly LGBT+ at work impacts individuals' professional and personal lives.
LGBT+, workplace, life improvement, personal impact
false
Human Resources and Talent Management
Professional Services
Single Chart
BCG
Add to my slides
Remove from favorites
Displays column charts comparing LGBT+ openness at work across several countries.
Organizational Structure and Change
Professional Services
Explores the level of openness about sexual orientation among LGBT+ employees in different countries.
LGBT+, workplace, openness, international comparison
false
Organizational Structure and Change
Professional Services
Single Chart
BCG
Add to my slides
Remove from favorites
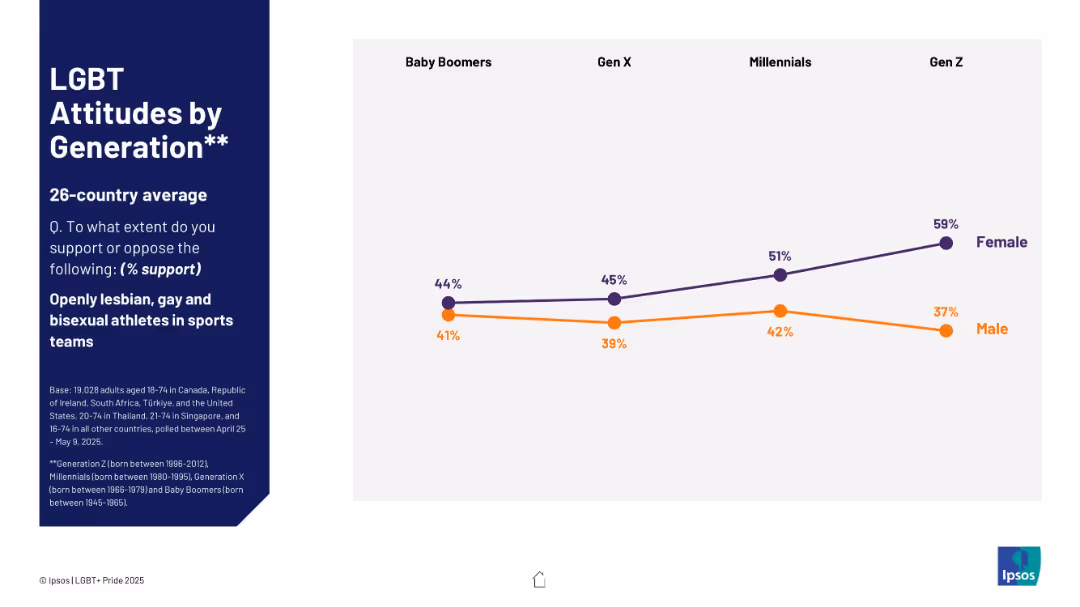
Split-screen layout; left section has text on a dark blue background; right side shows a dual-line chart.
Market Analysis and Trends
Government & Public Sector
This slide compares generational support for openly LGB athletes in sports teams across four generations. It highlights a consistent gender gap, with women showing higher support across all groups.
LGBT, generation, sports, gender, support, Baby Boomers, Gen X, Millennials, Gen Z, attitudes
false
Market Analysis and Trends
Government & Public Sector
Mixed Chart
IPSOS
Add to my slides
Remove from favorites
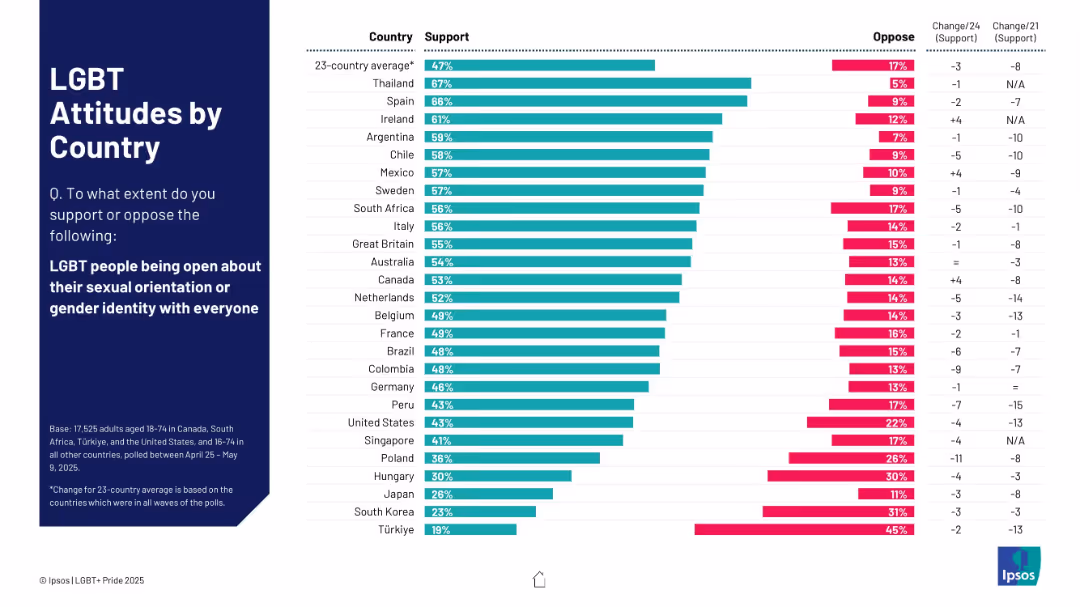
Horizontal bar chart with countries ranked by LGBT support. Bars show support/oppose rates and % change over time.
Market Analysis and Trends
Government & Public Sector
Global comparison of support for LGBT people being open about their identity. Shows wide variation between countries; Great Britain ranks mid-high. Includes historical trend change (2021–2024).
LGBT, global attitudes, openness, Ipsos, support levels, identity
false
Market Analysis and Trends
Government & Public Sector
Mixed Chart
IPSOS
Add to my slides
Remove from favorites
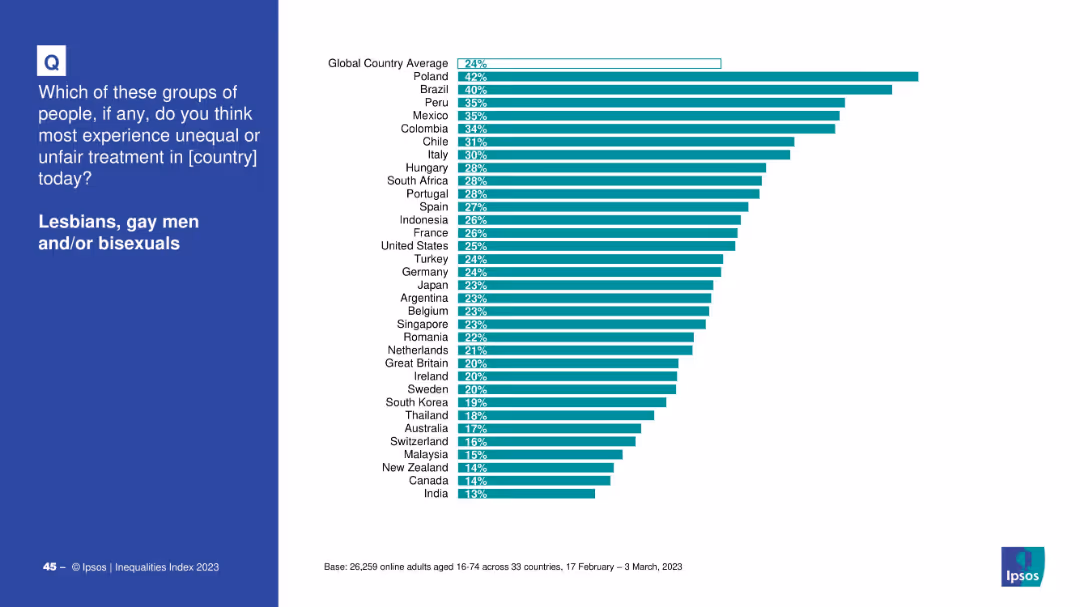
Bar chart with teal bars on white background showing percentage by country, blue panel on left side
Market Analysis and Trends
Government & Public Sector
This slide presents a country-wise breakdown of perceptions regarding unequal treatment faced by lesbians, gay men, and/or bisexuals. It compares responses from 33 countries, showing where the perception of unfairness is highest, with Poland, Brazil, and Peru at the top.
LGBT, inequality, global survey, country comparison, Ipsos, discrimination, public opinion, bar chart, fairness, 2023
false
Market Analysis and Trends
Government & Public Sector
Mixed Chart
IPSOS
Add to my slides
Remove from favorites
Contains multiple bar graphs showing the status of LGBTQI+ laws in 2020 by country, split into categories like LGBT discrimination, homosexual activity, and marriage rights. Each graph uses horizontal bars colored differently.
Market Analysis and Trends
Government & Public Sector
This slide presents an overview of the global status of LGBTQI+ laws as of 2020. It categorizes data into areas like discrimination protections, legality of homosexual activities, same-sex marriage rights, and legal gender change rights, illustrating global variations.
LGBT, laws, global, discrimination, rights
false
Market Analysis and Trends
Government & Public Sector
Multiple Chart
Roland Berger
Add to my slides
Remove from favorites
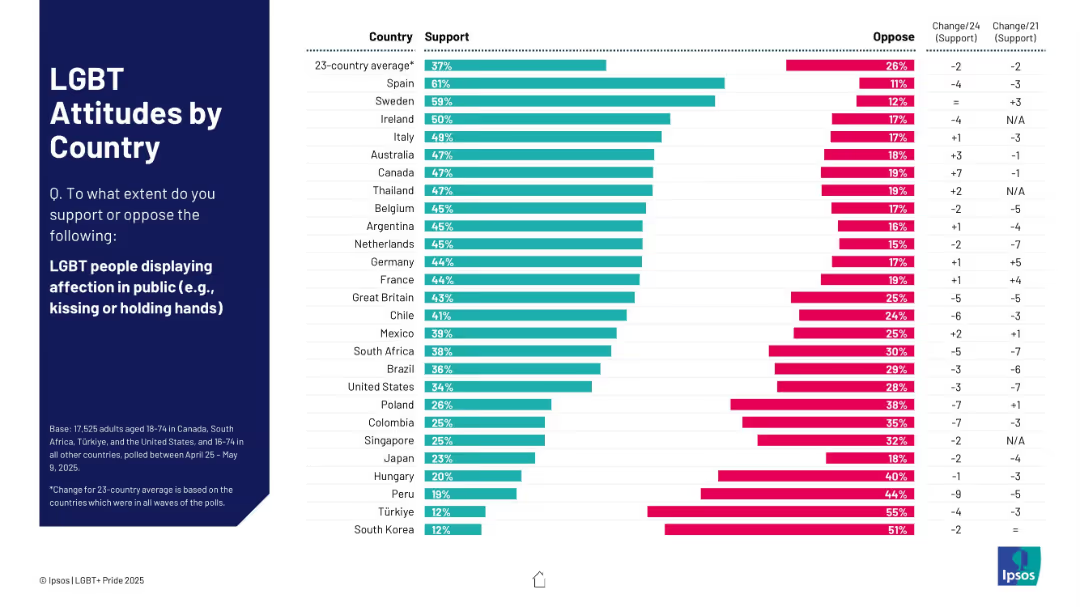
Similar to 19718 but focused on support for LGBT people displaying affection in public. Countries ranked by support with trend columns.
Market Analysis and Trends
Government & Public Sector
Compares support for public LGBT affection across 23 countries. Spain and Sweden lead; UK ranks mid-range. Notable opposition in South Korea and Türkiye. Trend data shows shifting attitudes since 2021.
LGBT, public affection, country comparison, trend analysis, Ipsos
false
Market Analysis and Trends
Government & Public Sector
Mixed Chart
IPSOS
Add to my slides
Remove from favorites
This slide contains a series of horizontal bar charts comparing responses between LGBTQIA+ employees and the overall employee population at Deloitte on various aspects like pride in the company, respect at work, authenticity, and support.
Human Resources and Talent Management
Professional Services
The slide presents survey results showing differences in feelings of authenticity and support at work between LGBTQIA+ professionals and their peers at Deloitte, highlighting a testimonial and the company's commitment to LGBTQIA+ inclusivity.
LGBTQIA+, survey, Deloitte, inclusion, authenticity, support, testimonial, commitment
false
Human Resources and Talent Management
Professional Services
Mixed Chart
Deloitte
Add to my slides
Remove from favorites
The layout is text-focused with a section for bullet points on the left and a pie chart on the right that shows 'Outstanding Vanilla Debt and Preferred Shares Referencing USD LIBOR as of 1Q20'. The text addresses the firm’s strategy and commitments related to the LIBOR transition.
Regulatory and Compliance
Financial Services
Addresses the upcoming LIBOR transition, outlining the company's preparedness and strategic plans, which is critical for stakeholders monitoring regulatory shifts and risk exposure.
LIBOR transition, regulatory compliance, risk management, pie chart, financial strategy, debt management, preferred shares, corporate strategy, market adaptation, stakeholder assurance
false
Regulatory and Compliance
Financial Services
Mixed Chart
Goldman Sachs
Add to my slides
Remove from favorites
The slide includes a line chart displaying the 3-month London Interbank Offered Rate (LIBOR) from 2002 to 2040 with forecasts.
Financial Performance
Financial Services
This slide analyzes the historical and projected trends of borrowing costs using LIBOR rates, indicating expected future increases.
LIBOR, borrowing costs, interest rates, financial forecast, historical trends
false
Financial Performance
Financial Services
Single Chart
UBS
Add to my slides
Remove from favorites
This slide has a blue and green color scheme with a pie chart showing outstanding debt and preferred shares. It contains bullet points with checkmarks and three text sections on the left side. The slide is marked as number 7.
Regulatory and Compliance
Financial Services
The slide presents actions taken for a seamless LIBOR transition, including leadership roles, meeting investor needs, and managing LIBOR exposure. It uses a pie chart to show the composition of outstanding debt and shares, and bullet points for structured information.
LIBOR, transition, debt, shares, derivatives, risk management
false
Regulatory and Compliance
Financial Services
Mixed Chart
Goldman Sachs
Add to my slides
Remove from favorites
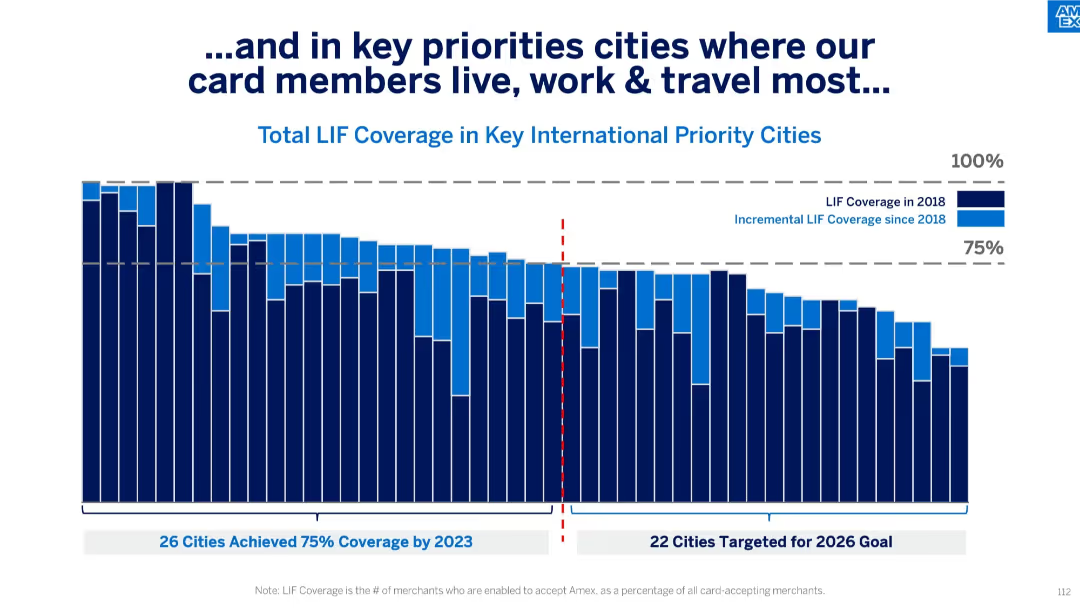
Vertical stacked bar chart split by year (2018 and incremental growth), segmented by 75% threshold and future target cities; uses bold blue tones and annotations.
Performance Metrics and KPIs
Financial Services
The slide illustrates LIF (Locations in Force) coverage across international cities where card members are most active. It differentiates between coverage levels as of 2018 and the progress made since then, showing how many cities have surpassed the 75% target and setting goals for 2026.
LIF coverage, cities, card members, merchant acceptance, 2023 goal, 2026 target, incremental growth, Amex, bar chart
false
Performance Metrics and KPIs
Financial Services
Single Chart
McKinsey
Add to my slides
Remove from favorites
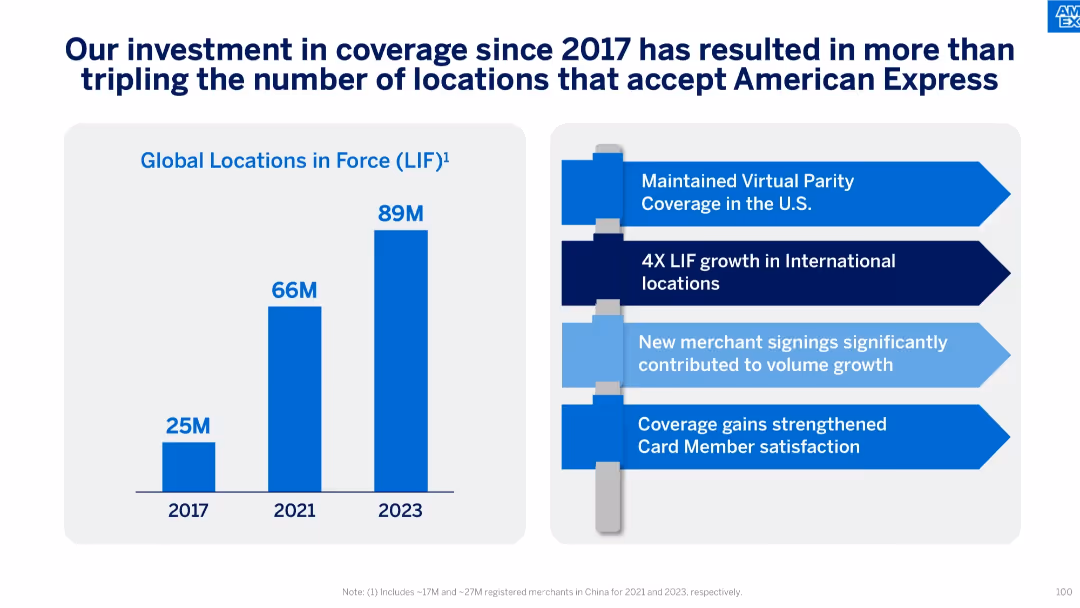
Bar chart (left) showing global LIF growth and a bullet list (right) with strategic initiatives and outcomes.
Operational Efficiency
Financial Services
This slide emphasizes the expansion in Global Locations in Force (LIF) from 25M in 2017 to 89M in 2023. It outlines strategic outcomes like virtual parity in the U.S., 4x growth internationally, and improved cardholder satisfaction.
LIF, Global Locations, Coverage, Strategy, Virtual Parity, International Growth, Merchant Signings
false
Operational Efficiency
Financial Services
Mixed Chart
McKinsey
Add to my slides
Remove from favorites
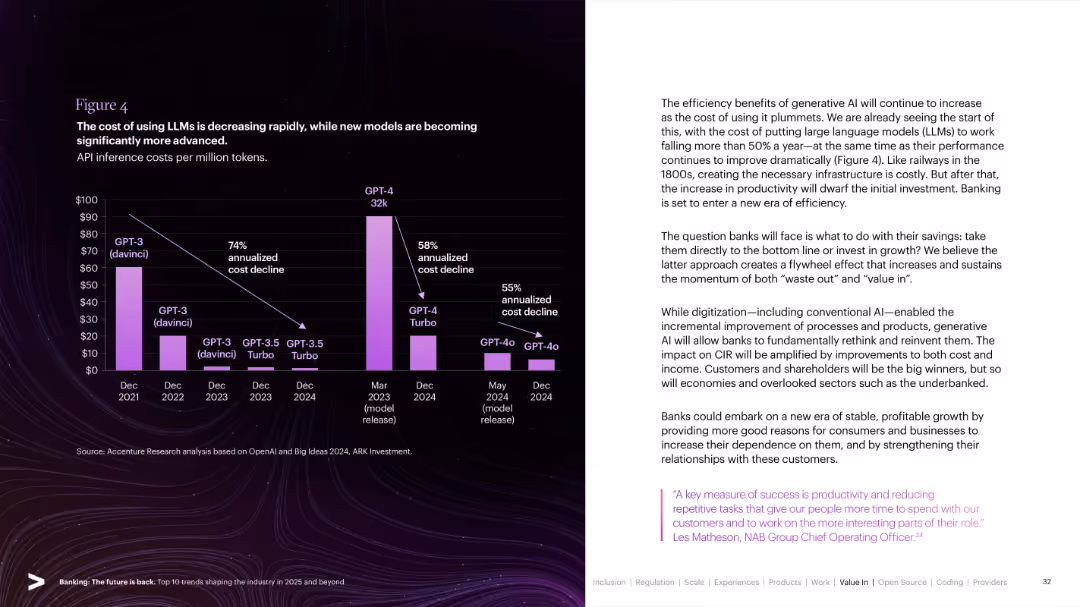
Bar chart over a dark background showing API cost decline of various LLMs (GPT-3, GPT-4 etc.). Explanatory text on the right.
Technology and Digital Transformation
Artificial Intelligence
Depicts the rapid reduction in API inference costs of large language models (LLMs) from 2021–2024, alongside advancements in model performance. Discusses how this cost efficiency drives productivity in banking and beyond.
LLM, GPT-4, Inference Cost, AI Efficiency, API Costs, AI Adoption, Banking Innovation, Digital Transformation
false
Technology and Digital Transformation
Artificial Intelligence
Mixed Chart
Accenture
Add to my slides
Remove from favorites
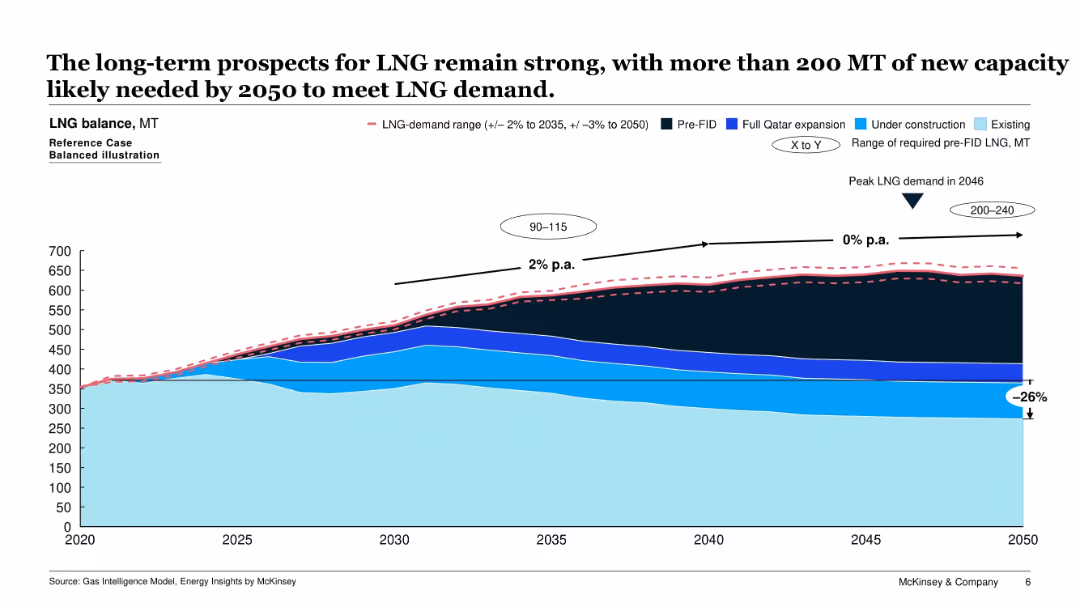
Area chart depicting LNG supply and demand balance from 2020 to 2050, including existing and future capacities (e.g., under construction, pre-FID). A demand range is overlaid.
Strategic Planning
Energy & Utilities
This slide forecasts LNG demand and required capacity growth up to 2050, indicating peak demand in 2046. It highlights the gap to be filled by new (pre-FID) projects and shows growth rates and investment needs.
LNG demand, capacity planning, energy forecast, gas supply, energy strategy, infrastructure, FID
false
Strategic Planning
Energy & Utilities
Single Chart
McKinsey
Add to my slides
Remove from favorites
Contains bullet points and iconography. It features a high-level summary of Western Australia's LNG industry, economic contributions, and impact metrics like $220 billion added and 57,000 workers.
Industry Overview
Energy & Utilities
Highlights Western Australia's significant role in the LNG industry, mentioning major projects, economic contributions, and employment impact over the last decade.
LNG, Economic Impact, Western Australia, Energy Industry, Employment, Major Projects, Investment, Tax Revenue
false
Industry Overview
Energy & Utilities
Header Horizontal
EY
Add to my slides
Remove from favorites
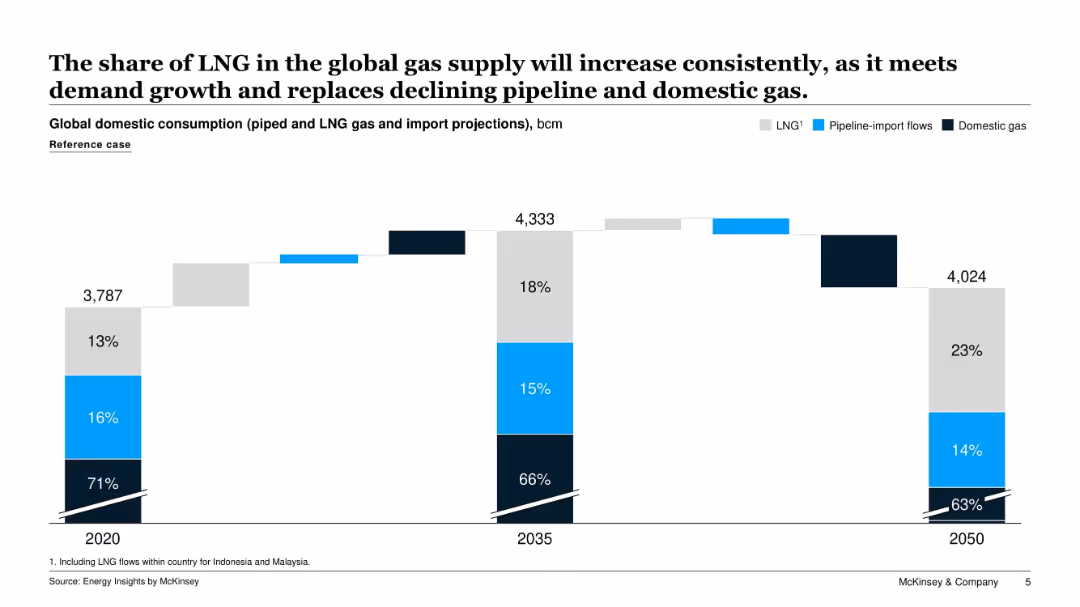
Stacked bar chart comparing global domestic gas consumption (LNG, pipeline-import flows, domestic gas) for 2020, 2035, and 2050. Percentages are labeled by source.
Market Analysis and Trends
Energy & Utilities
The slide illustrates the projected shift in the composition of global gas supply through 2050, with LNG increasing its share as domestic and pipeline gas sources decline. It shows changes in volume and percentage contribution across three key years.
LNG, domestic gas, pipeline, gas supply, energy transition, consumption trends, 2035, 2050
false
Market Analysis and Trends
Energy & Utilities
Single Chart
McKinsey
Add to my slides
Remove from favorites
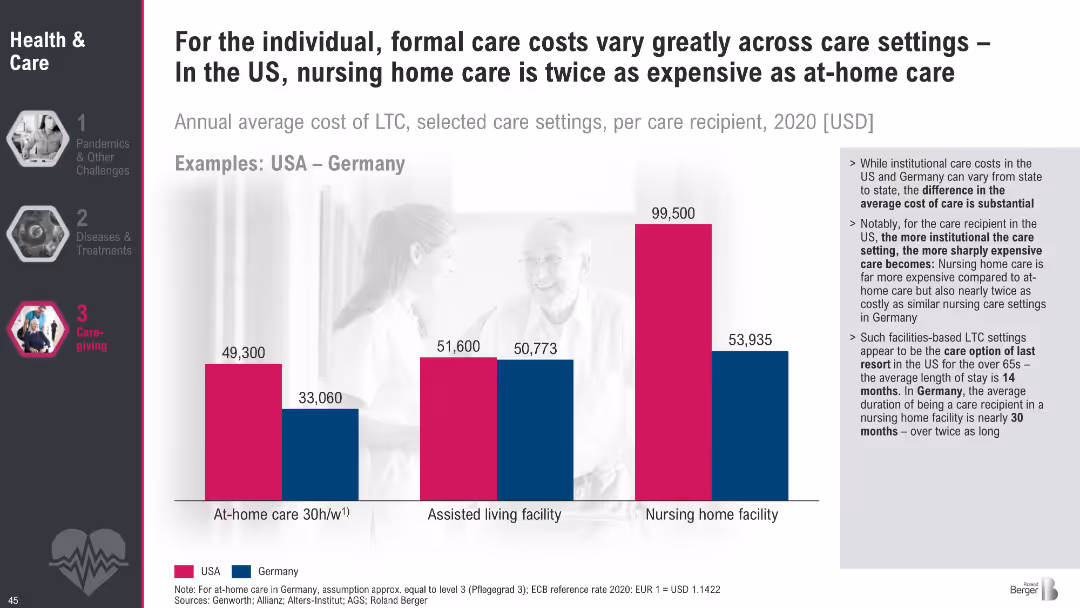
Bar chart comparing LTC costs for at-home, assisted living, and nursing homes between USA and Germany; text outlines implications of institutional vs. home care.
Pricing Strategies
Healthcare & Pharmaceuticals
The slide compares LTC costs in different settings and highlights stark cost differences between the US and Germany. It emphasizes that more institutionalized care leads to higher expenses, particularly in the US, with policy implications for affordability and planning.
LTC cost, nursing homes, assisted living, at-home care, USA vs. Germany, eldercare expenses, care settings
false
Pricing Strategies
Healthcare & Pharmaceuticals
Mixed Chart
Roland Berger
Add to my slides
Remove from favorites
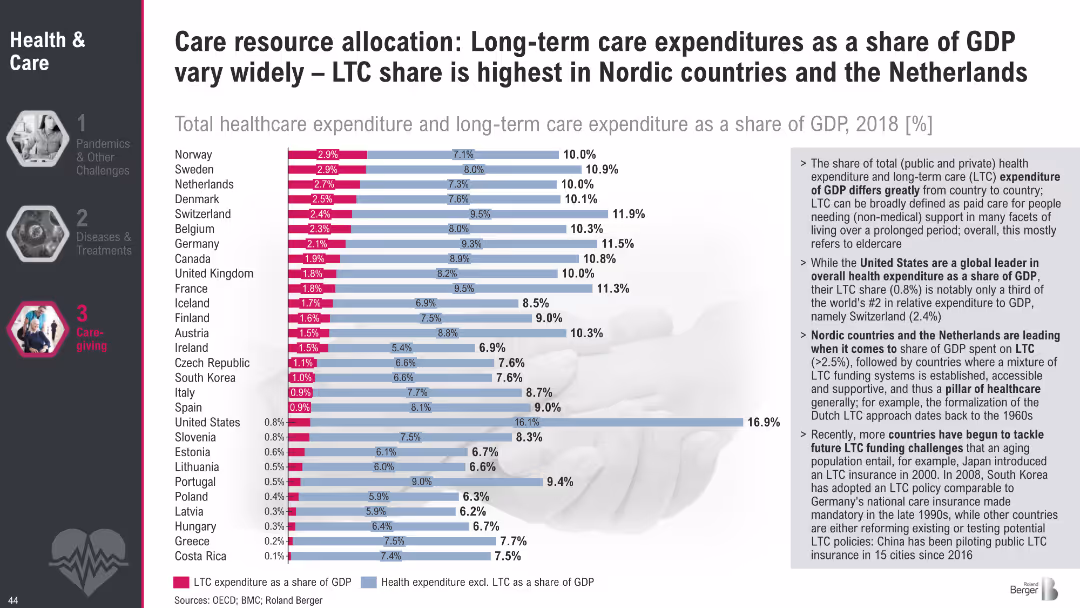
Horizontal bar chart comparing total healthcare and LTC spending (% of GDP) across countries; text highlights key takeaways on system structures and funding.
Financial Performance
Healthcare & Pharmaceuticals
This slide compares national LTC spending as a share of GDP, showing major differences in resource allocation. Nordic countries lead in LTC expenditure, reflecting strong public systems. Insights include challenges faced by countries like the US with lower LTC shares but higher total health costs.
LTC spending, GDP share, healthcare financing, eldercare, international comparison, Nordic model, public health funding
false
Financial Performance
Healthcare & Pharmaceuticals
Mixed Chart
Roland Berger
Add to my slides
Remove from favorites
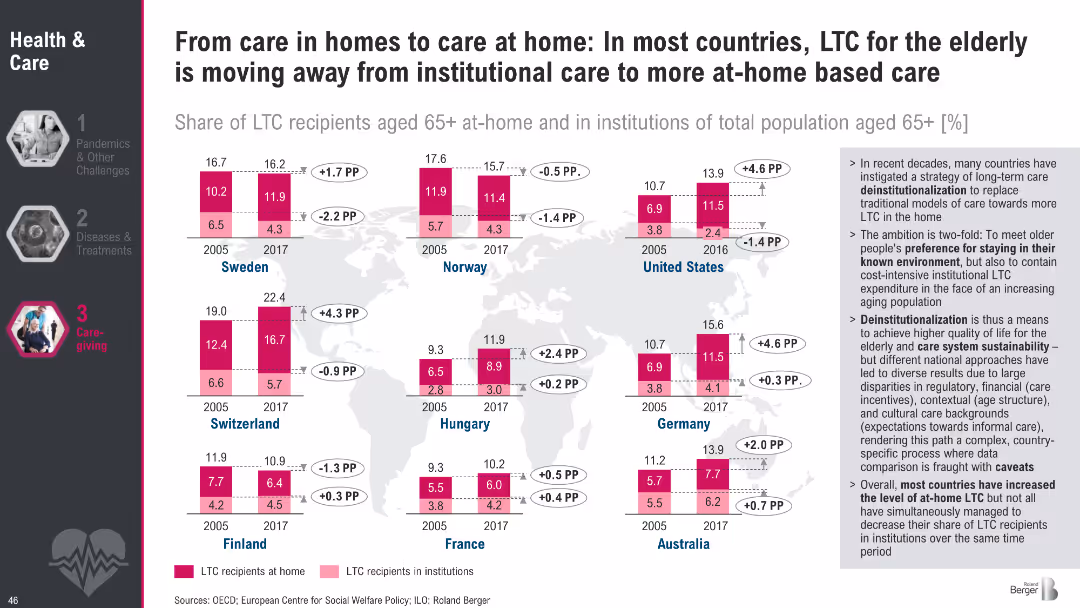
World map with bar graphs showing LTC recipients (home vs. institutions) across countries in 2005 vs. 2017; explanatory sidebar discusses trends.
Strategic Planning
Healthcare & Pharmaceuticals
This slide presents the global trend toward de-institutionalization of elderly care, with most countries increasing the share of LTC recipients being cared for at home. It shows a shift in policy focus to improve quality of life and reduce institutional costs.
LTC trends, deinstitutionalization, eldercare, home care, policy shift, international comparison, aging population
false
Strategic Planning
Healthcare & Pharmaceuticals
Multiple Chart
Roland Berger
Add to my slides
Remove from favorites
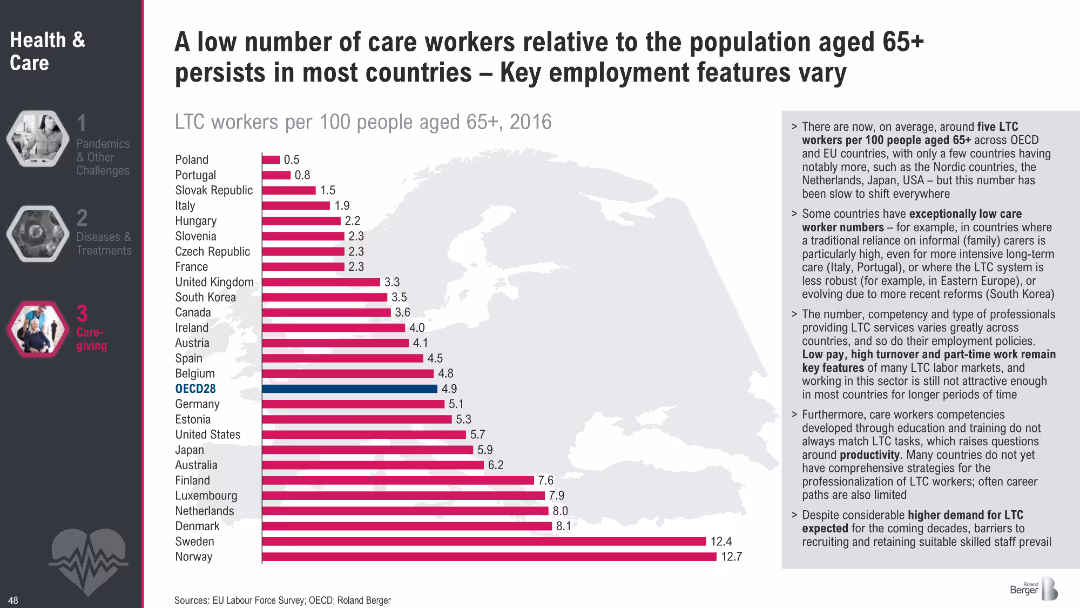
Bar chart ranking countries by LTC workers per 100 people aged 65+; side text outlines causes for variation and key challenges in care employment.
Human Resources and Talent Management
Healthcare & Pharmaceuticals
This slide highlights the low number of LTC workers relative to aging populations in most countries, with wide variations. It points to systemic employment challenges, including low pay, high turnover, and insufficient professional training.
LTC workforce shortage, care worker density, aging population, eldercare employment, international comparison, labor market
false
Human Resources and Talent Management
Healthcare & Pharmaceuticals
Mixed Chart
Roland Berger
Add to my slides
Remove from favorites
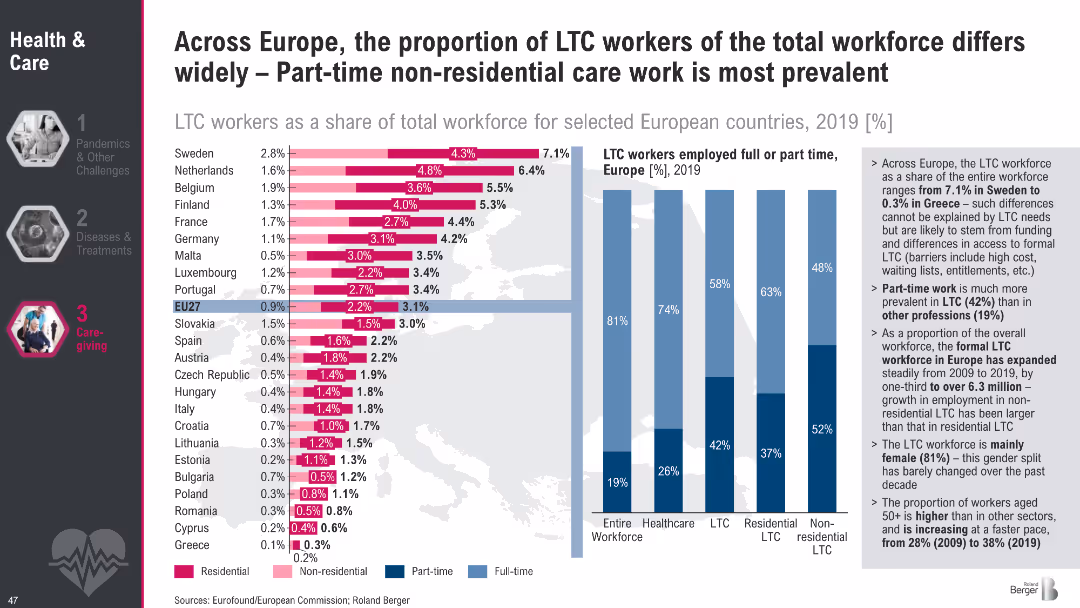
Bar chart of LTC workers as % of total workforce across countries, segmented by residential/non-residential care; vertical bars show part-time/full-time ratios.
Human Resources and Talent Management
Healthcare & Pharmaceuticals
The slide examines employment trends in the LTC workforce across Europe, highlighting variation in workforce size, part-time prevalence, and the distinction between residential and non-residential care. It also underscores gender imbalance and the aging workforce.
LTC workforce, part-time care, non-residential care, employment trends, Europe, healthcare labor, care sector
false
Human Resources and Talent Management
Healthcare & Pharmaceuticals
Multiple Chart
Roland Berger
Add to my slides
Remove from favorites
Previous
Next
You don't have any favorites yet.
Please wait loading your favorites slides...
Create a FREE account to continue browsing
Receive Instant Access to 1,000+ slides from companies like McKinsey, Google, and Goldman Sachs
First Name
Last Name
Email
Password
I agree to all
Terms & Privacy Policy
Thank you! Your submission has been received!
Oops! Something went wrong while submitting the form.
Have an account?
Sign in
Upgrade to PRO to Save slides
Advanced Search and Filters
Access to 15,000+ slides
Access to Category Pages
Save/Bookmark Slides
PowerPoint Template Library
Pick a Plan
MONTHLY
$12/month
Billed every month, Cancel anytime.
YEARLY
$9/year
Billed $108 annually, Cancel anytime.
Checkout for $12/month
Checkout for $108/yr
Secured by Stripe | AES-256 bit encryption