My Account
My Slides
Search by Category
Pricing
Templates
View All Templates
Download Template Slides
✦ AI Search
Feedback
Login
Logout
Get Started
Browse all Slides
Browse all Slides
Create a FREE Account
Instant access to 1,000+ real slides from top companies like McKinsey, BCG, Goldman Sachs, Google and many more!
First Name
Last Name
Email
Password
I agree to all
Terms & Privacy Policy
Thank you! Your submission has been received!
Oops! Something went wrong while submitting the form.
Have an account?
Sign in
Saved Slides
Total No. of slides saved
0
↻ Refresh
✖ Clear all
A table on the left shows M&A league table rankings by industry and region. The right side features a vertical breakdown of various sectors within the Tech, Media, and Telecom industry.
Competitive Landscape
Financial Services
The slide conveys the company's dominant position in M&A activities, with league table rankings reflecting its top-tier status across regions and industries. It also highlights the potential for growth in the tech, media, and telecom sectors, suggesting room for further market share expansion despite current leadership.
M&A, League Table, Ranking, Tech, Media, Telecom, Market Share, Growth
false
Competitive Landscape
Financial Services
Single Chart
Goldman Sachs
Add to my slides
Remove from favorites
Text with a bar chart showing Middle East M&A deal volumes by deal size and category for fiscal years 2021 to 2023.
Mergers and Acquisitions
Financial Services
Examines M&A deal volumes in the Middle East, highlighting trends in deal sizes and the impact of economic conditions.
M&A, Middle East, deal size, volumes, fiscal, years, economic, trends, analysis
false
Mergers and Acquisitions
Financial Services
Mixed Chart
PwC/Strategy&
Add to my slides
Remove from favorites
Text with two bar charts showing Middle East M&A deal volumes by fiscal year and by deal size category.
Mergers and Acquisitions
Financial Services
Analyzes the Middle East M&A market's mixed performance in 2023, with data on deal volumes and the impact of economic factors.
M&A, Middle East, deals, volumes, fiscal, year, market, analysis, economic
false
Mergers and Acquisitions
Financial Services
Mixed Chart
PwC/Strategy&
Add to my slides
Remove from favorites
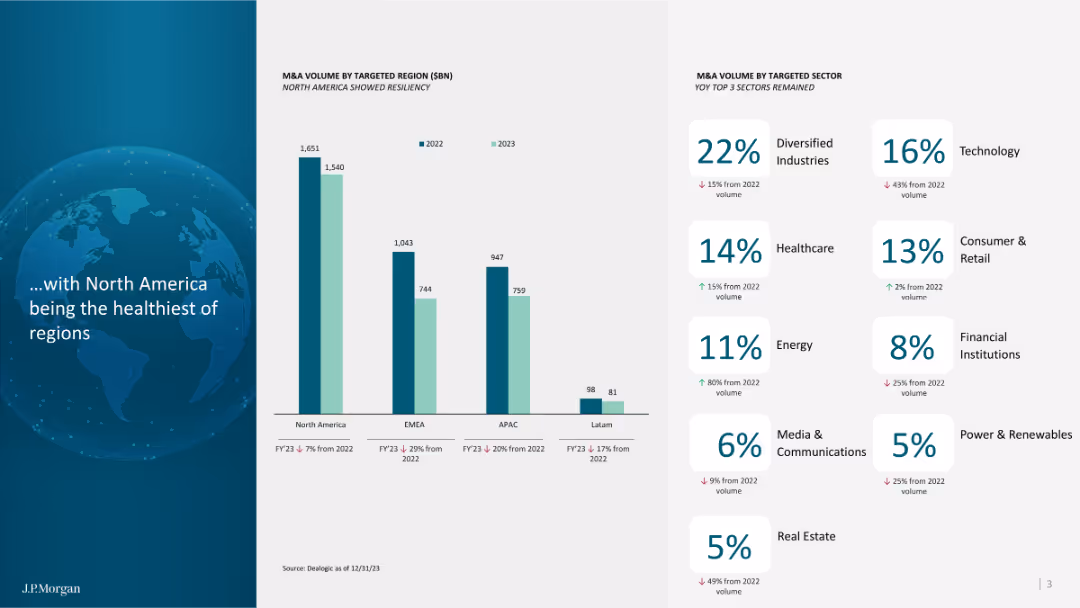
Column charts showing M&A volume by region and sector, highlighting trends in North America and other regions.
Market Analysis and Trends
Financial Services
Analyzes M&A trends by region and sector, emphasizing North America's performance and sectoral trends.
M&A, North America, regions, sectors, trends, analysis, performance, volume, 2023
false
Market Analysis and Trends
Financial Services
Mixed Chart
JP Morgan
Add to my slides
Remove from favorites
Contains multiple bar graphs and textual analysis. Utilizes a clean, professional layout focusing on M&A trends in the Philippines, including top bidders and deal values.
Mergers and Acquisitions
Financial Services
Provides a detailed analysis of domestic and inbound M&A in the Philippines, including major deals and sector breakdown for top bidders from 2018 to 2020.
M&A, Philippines, domestic, inbound, deal analysis, sectors, bidders
false
Mergers and Acquisitions
Financial Services
Mixed Chart
Deloitte
Add to my slides
Remove from favorites
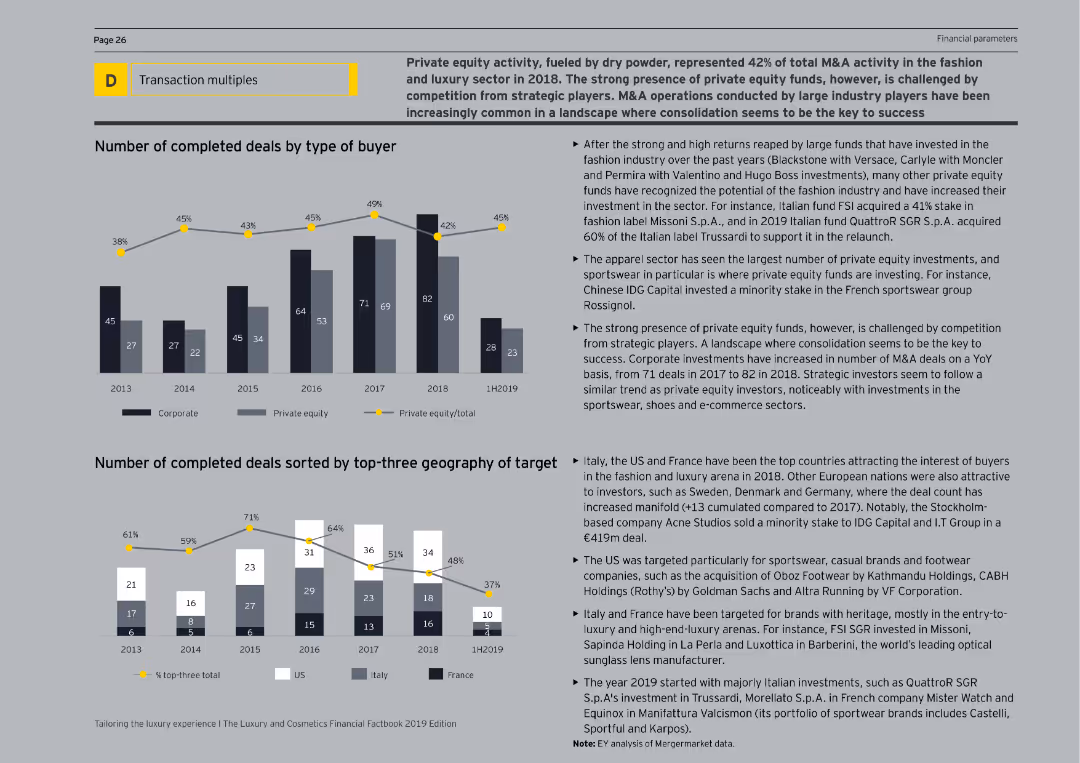
The slide features column charts illustrating the number of completed deals by type of buyer and top-three geography of targets from 2013 to 1H2019. The visual complexity is moderate, with clear segmentation of data by corporate and private equity.
Mergers and Acquisitions
Consumer Goods
The slide analyzes the significant role of private equity in M&A activity within the fashion and luxury sectors, showing the number of deals by buyer type and geographical targets. It provides insights into trends, such as the increasing interest from private equity funds and their strategic motivations.
M&A, Private Equity, Fashion, Luxury, Deals
false
Mergers and Acquisitions
Consumer Goods
Multiple Chart
EY
Add to my slides
Remove from favorites
Displays a detailed flowchart illustrating the end-to-end M&A process from strategy development to post-merger integration. It includes phases like target screening, due diligence, transaction execution, and integration steps highlighted in green.
Mergers and Acquisitions
Professional Services
Details the comprehensive steps involved in M&A transactions, providing a roadmap for successful execution from initial strategy to final integration, emphasizing the importance of each phase in the process.
M&A, Process, Strategy, Due Diligence, Integration, Execution, Roadmap
false
Mergers and Acquisitions
Professional Services
Linear Flow
Deloitte
Add to my slides
Remove from favorites
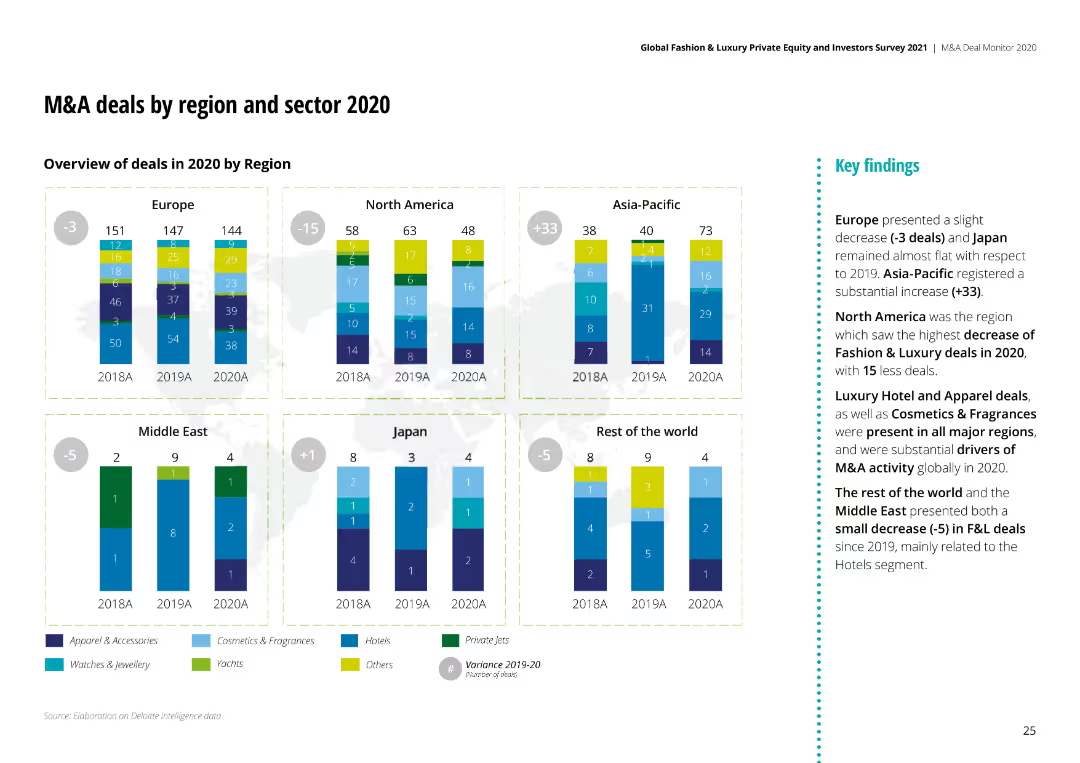
The slide shows column charts for M&A deals in 2020 by region, comparing different sectors like Apparel, Cosmetics, and Hotels.
Market Analysis and Trends
Consumer Goods
It analyzes M&A deals across different regions and sectors, showing the number of deals and the key findings from the data.
M&A, Region, Sector, 2020, Analysis, Apparel, Cosmetics
false
Market Analysis and Trends
Consumer Goods
Multiple Chart
Deloitte
Add to my slides
Remove from favorites
Multiple column charts showing M&A activities with Russian involvement by sector and deal type.
Mergers and Acquisitions
Transportation & Logistics
Focuses on Russian involvement in global M&A activities, especially in the transportation and logistics sectors.
M&A, Russia, Transportation, Logistics, Global, Activities, Involvement, Sector
false
Mergers and Acquisitions
Transportation & Logistics
Multiple Chart
PwC/Strategy&
Add to my slides
Remove from favorites
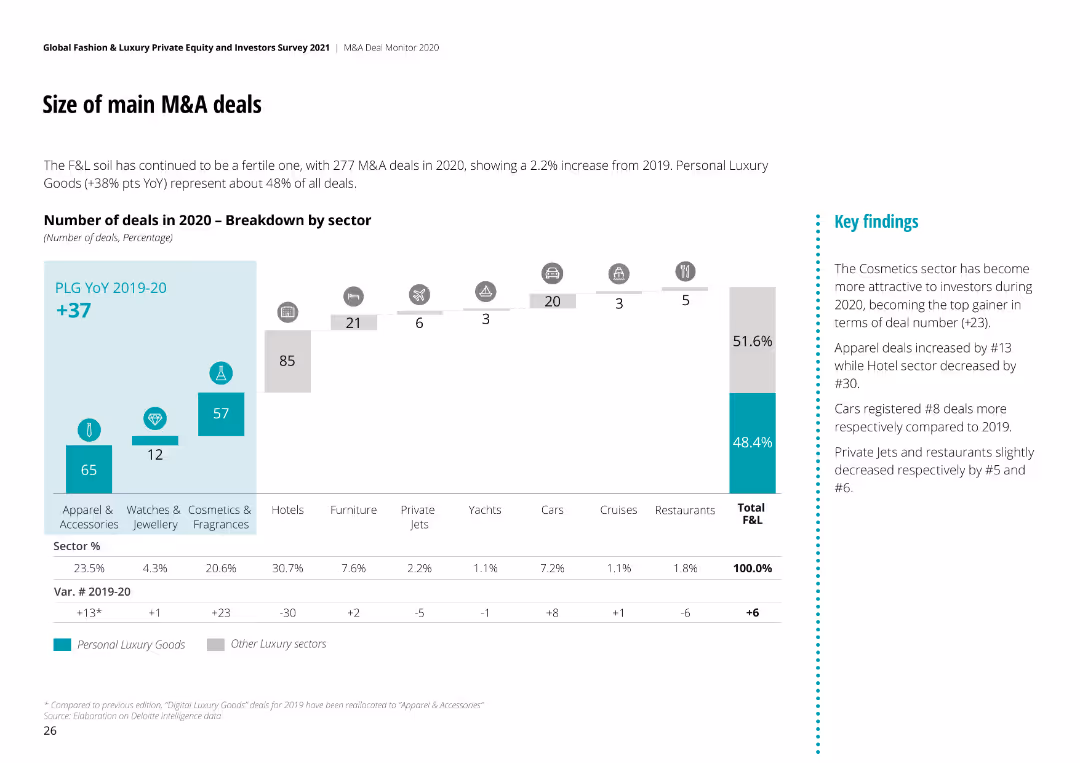
The slide has a bar chart showing the number of M&A deals in 2020 by sector, with a breakdown for Personal Luxury Goods and other sectors.
Market Analysis and Trends
Consumer Goods
It highlights the size of M&A deals in 2020, with a focus on personal luxury goods and other luxury sectors.
M&A, Size, Deals, 2020, Personal Luxury, Sectors
false
Market Analysis and Trends
Consumer Goods
Mixed Chart
Deloitte
Add to my slides
Remove from favorites
This slide uses text blocks and icons to depict strategies for using M&A to improve core business functions, move into adjacent markets, and create new business segments. It features logos of notable companies to illustrate examples of each strategy.
Strategic Planning
Financial Services
Outlines how M&A is strategically used to enhance company offerings, enter new markets, and create innovative business models. It emphasizes the role of M&A in corporate strategy with practical examples from well-known companies.
M&A, Strategy, Business Improvement, New Markets, Innovation, Companies
false
Strategic Planning
Financial Services
Diagram
Deloitte
Add to my slides
Remove from favorites
Presents a textual and graphical analysis on a gray and green background, illustrating various strategic options within M&A transactions, categorized into improving core business, moving into adjacent markets, and creating new business opportunities.
Mergers and Acquisitions
Financial Services
Describes the strategic use of M&A as a mechanism for corporate growth and innovation, detailing different approaches like enhancing core operations, entering adjacent markets, and launching new ventures.
M&A, Strategy, Growth, Innovation, Markets, Business, Opportunities
false
Mergers and Acquisitions
Financial Services
Table
Deloitte
Add to my slides
Remove from favorites
The slide displays a segmented circular diagram (pie chart) breaking down the components deemed crucial for successful M&A deals as identified by 1,000 executives, such as effective integration and proper target identification.
Mergers and Acquisitions
Financial Services
Illustrates the key factors identified by executives that contribute to the success of M&A deals, emphasizing effective integration and accurate target valuation.
M&A, Success, Factors, Integration, Target Identification, Executives
false
Mergers and Acquisitions
Financial Services
Single Chart
Deloitte
Add to my slides
Remove from favorites
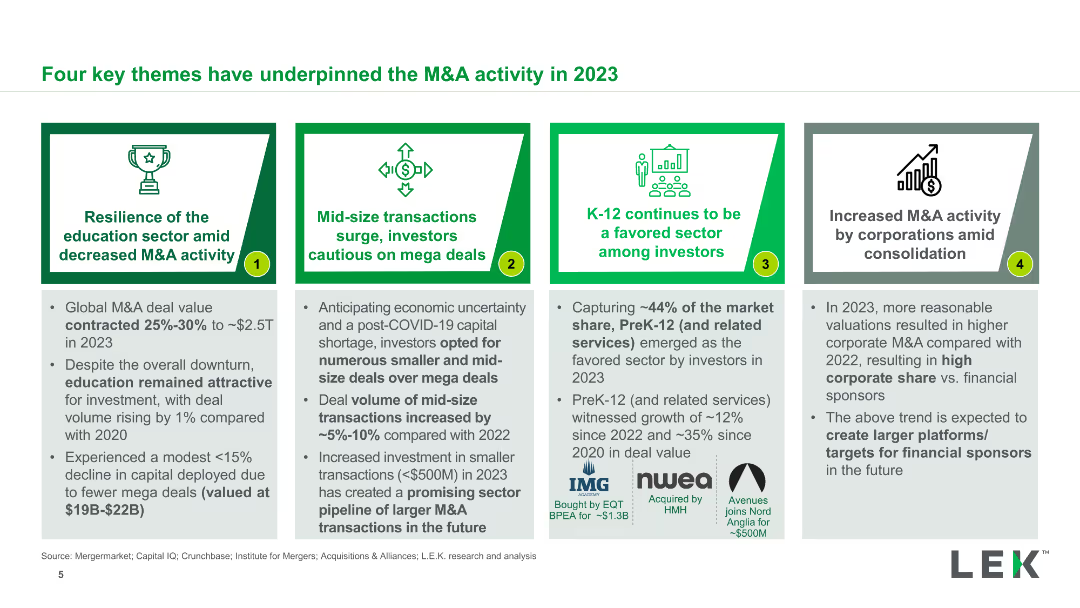
Four comparative boxes each detailing a key theme influencing M&A activity in 2023, such as resilience of the education sector, mid-size transaction surge, etc.
Strategic Planning
Financial Services
This slide outlines four major themes that influenced M&A activities in 2023, including sector resilience, the surge in mid-size transactions, and investor caution on mega deals.
M&A, Themes, 2023, Education, Mid-size Transactions, Strategic Planning
false
Strategic Planning
Financial Services
Pillar
LEK
Add to my slides
Remove from favorites
Column charts displaying median deal valuations in T&L subsectors over several years, with a focus on recent trends.
Mergers and Acquisitions
Transportation & Logistics
Reviews valuation trends in T&L M&A, highlighting how economic conditions affect deal evaluations.
M&A, Transportation, Logistics, Valuation, Deals, Trends, Economic, Subsectors
false
Mergers and Acquisitions
Transportation & Logistics
Multiple Chart
PwC/Strategy&
Add to my slides
Remove from favorites
Features a column chart showing the trends in global M&A volumes from 2002-2018 and a circular diagram depicting the expectations of organizations regarding the number of deals in the next 12 months, split by 2018 and 2019 data.
Mergers and Acquisitions
Financial Services
Summarizes global M&A trends, highlighting the increase in transaction volumes over time and the anticipations for future deals. It provides a historical context to understand the growing significance of M&A activities.
M&A, Trends, Global, Future, Deals, Volumes, Growth, Expectations
false
Mergers and Acquisitions
Financial Services
Multiple Chart
Deloitte
Add to my slides
Remove from favorites
Features green-colored blocks outlining the rationale and questions to consider for creating value through M&A. It emphasizes traditional and forward-looking synergies like revenue and cost efficiencies, risk mitigation, and knowledge generation.
Strategic Planning
Financial Services
Provides a strategic framework for evaluating M&A opportunities, focusing on identifying synergies, assessing risks, and understanding cost benefits to maximize deal value.
M&A, Value Creation, Synergies, Strategy, Risk Mitigation, Cost Efficiency
false
Strategic Planning
Financial Services
Table
Deloitte
Add to my slides
Remove from favorites
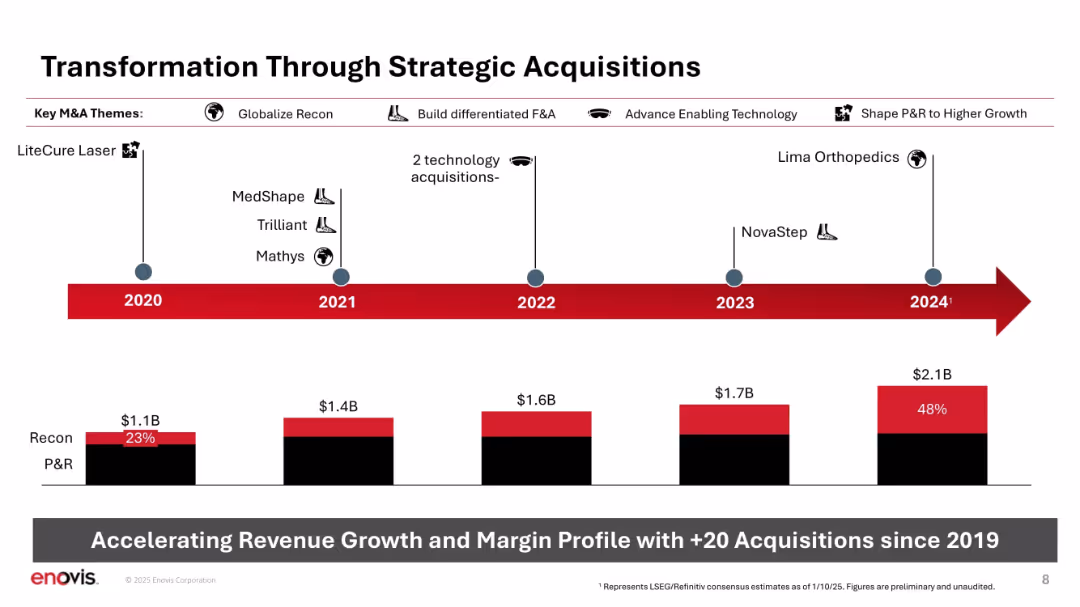
Horizontal timeline with icons and acquisition names; bar chart at bottom showing Recon vs. P&R growth.
Strategic Planning
Healthcare & Pharmaceuticals
Depicts Enovis’s strategic acquisitions since 2020, categorized by theme (e.g., globalize Recon, enabling tech). Shows revenue growth over time and increase in Recon's share of sales. Emphasizes +20 acquisitions as a key driver of transformation.
M&A, acquisitions, Recon, P&R, strategy, timeline, revenue growth, expansion
false
Strategic Planning
Healthcare & Pharmaceuticals
Mixed Chart
JP Morgan
Add to my slides
Remove from favorites
Similar to the previous slide, it outlines a case study with opportunity, client, need, offered solutions, and a timeline showing the progression over years.
Client Case Studies
Financial Services
This case study covers an M&A transaction as a product multiplier, detailing the client's needs, offered solutions, and outcomes over an eight-year timeline.
M&A, case study, client solutions, investment realization, product multiplier
false
Client Case Studies
Financial Services
Linear Flow
Credit Suisse
Add to my slides
Remove from favorites
The slide features a column chart showing global M&A volume by deal type from 2017 to 2023, and a line chart depicting S&P 500 cash/assets from 2007 to Q3 2023. The layout is moderately complex with well-structured visual elements.
Financial Performance
Financial Services
The slide analyzes the trend in global M&A volumes and the cash position of corporates over time, highlighting their financial resilience and strategic positioning.
M&A, cash position, S&P 500, financial trend
false
Financial Performance
Financial Services
Multiple Chart
JP Morgan
Add to my slides
Remove from favorites
Text with three column charts showing cross-border deal volumes (outbound, inbound, and Middle East) from fiscal years 2021 to 2023.
Mergers and Acquisitions
Financial Services
Provides data on cross-border M&A deal volumes, showing outbound, inbound, and regional trends, and emphasizing the resilience of the Middle East market.
M&A, cross-border, deal volume, outbound, inbound, Middle East, fiscal, years, market
false
Mergers and Acquisitions
Financial Services
Mixed Chart
PwC/Strategy&
Add to my slides
Remove from favorites
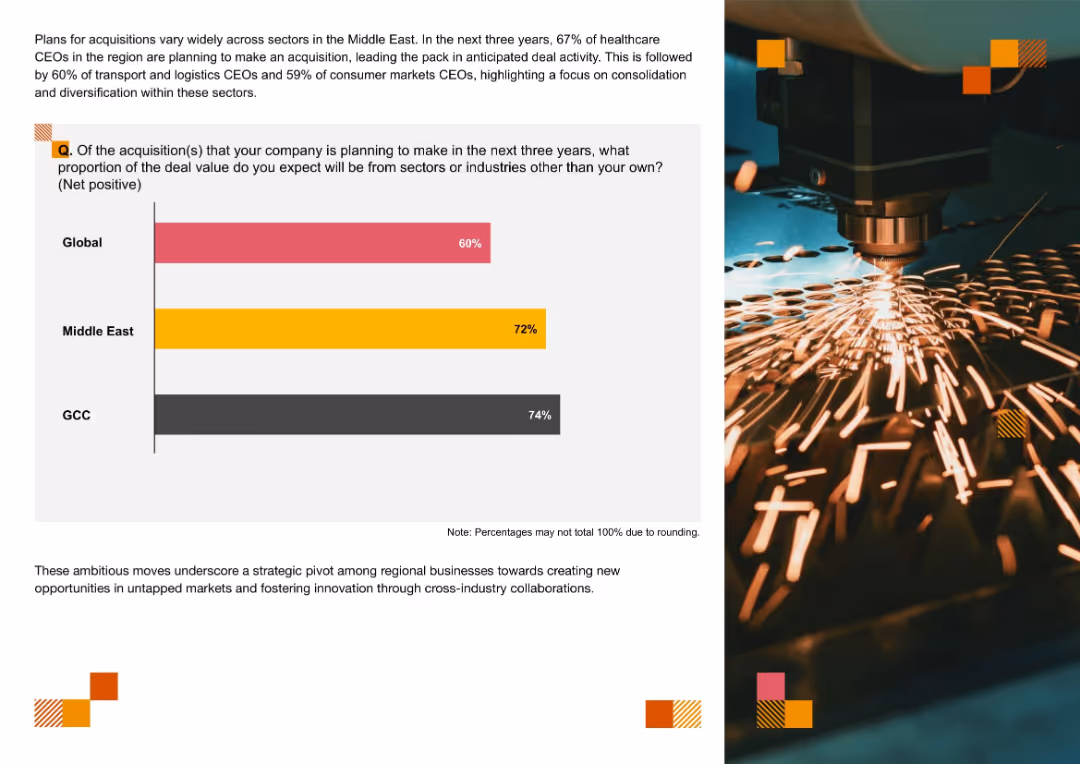
Bar chart on the left comparing anticipated cross-industry acquisition percentages globally, in the Middle East, and the GCC; right side features an image of industrial machinery and thematic visual accents.
Mergers and Acquisitions
Professional Services
The slide compares the anticipated share of cross-industry M&A deals over the next three years, with the GCC leading (74%), followed by the Middle East (72%) and Global (60%). It emphasizes a regional trend toward cross-industry diversification and innovation-driven acquisitions, especially in healthcare, logistics, and consumer markets.
M&A, cross-industry, diversification, GCC, Middle East, deal value, strategic pivot, innovation, new markets, acquisition planning
false
Mergers and Acquisitions
Professional Services
Mixed Chart
PwC/Strategy&
Add to my slides
Remove from favorites
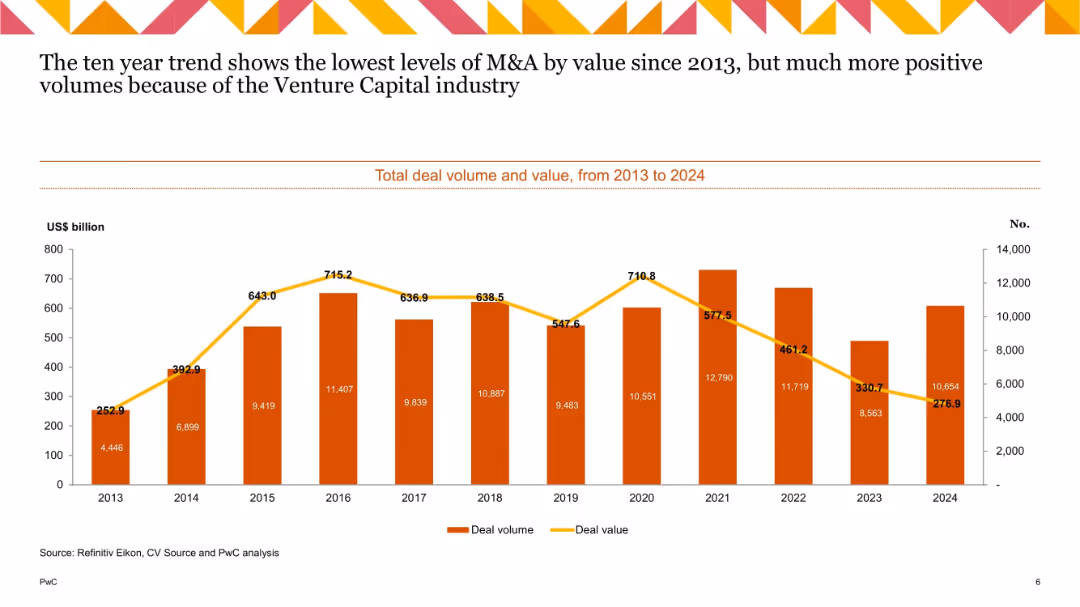
Bar and line chart with orange bars (deal volume) and a yellow line (deal value) across years; dual-axis layout; geometric border top.
Market Analysis and Trends
Financial Services
Presents a decade-long view of M&A trends, showing a steep decline in deal value despite some recovery in volumes due to venture capital activity. Highlights 2021 as a peak year and 2023–24 as low points in value.
M&A, deal volume, deal value, venture capital, trend analysis, 2024
false
Market Analysis and Trends
Financial Services
Single Chart
PwC/Strategy&
Add to my slides
Remove from favorites
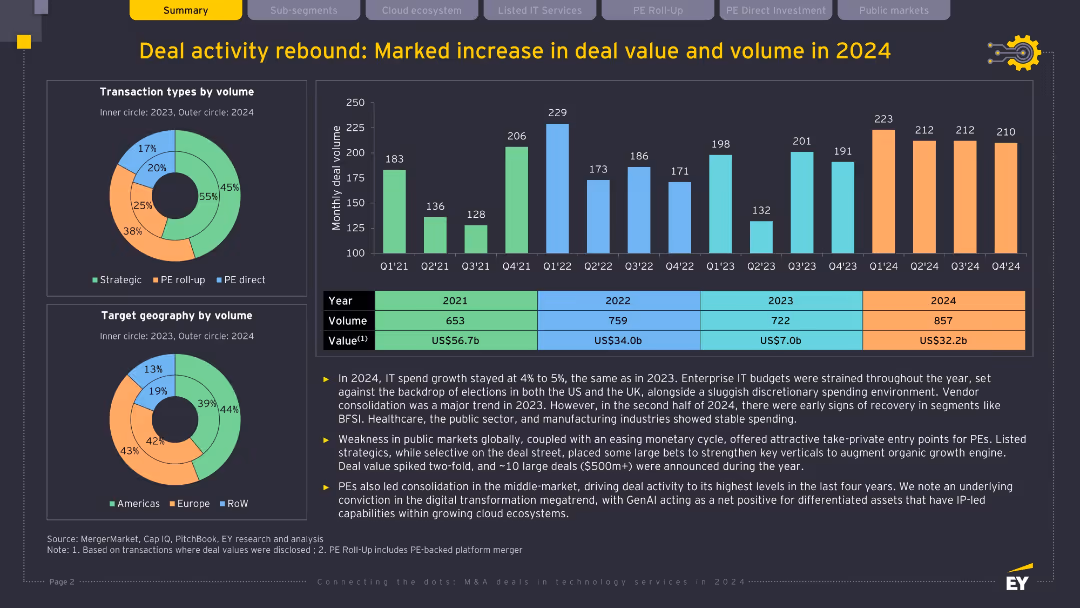
Dark background, multiple charts and tables (bar chart, donut charts, data table); yellow and turquoise highlights; visually dense with transactional and volume data.
Mergers and Acquisitions
Technology & Software
This slide details the resurgence in IT deal activity in 2024, with increases in volume and value. It attributes growth to digital transformation, GenAI-driven differentiation, and private equity-led consolidation. It presents data by deal type, geography, and monthly trends, highlighting strategic investor behavior.
M&A, deal volume, private equity, GenAI, digital transformation, IT services
false
Mergers and Acquisitions
Technology & Software
Multiple Chart
EY
Add to my slides
Remove from favorites
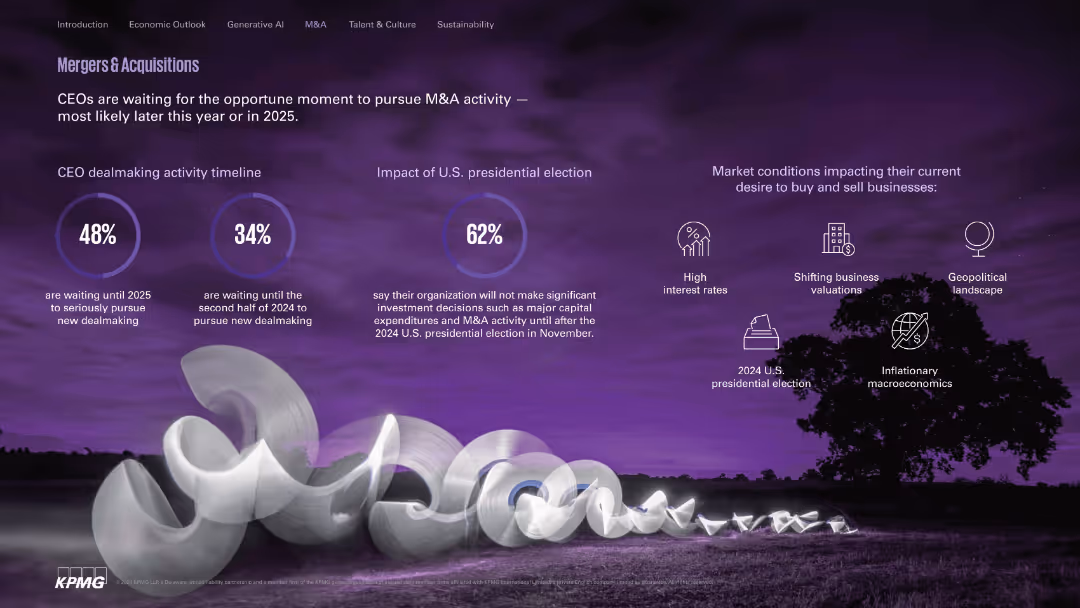
Visually dramatic layout with circular stats and icons on dark purple landscape image.
Mergers and Acquisitions
Financial Services
Outlines CEO timing for dealmaking, showing hesitancy until after the 2024 U.S. election. Identifies external factors like high interest rates and geopolitical tensions impacting M&A appetite.
M&A, dealmaking, investment timing, election, interest rates, valuations
false
Mergers and Acquisitions
Financial Services
Mixed Chart
KPMG
Add to my slides
Remove from favorites
Slide with column charts detailing defensive M&A strategies by industry, focusing on aspects like cash flow and rapid turnaround situations.
Strategic Planning
Financial Services
Highlights survey results on defensive M&A strategies, showing the importance of liquidity, turnaround situations, and synergies from recent acquisitions.
M&A, defensive strategies, industry, cash flow, turnaround, synergies, survey, column chart
false
Strategic Planning
Financial Services
Multiple Chart
Deloitte
Add to my slides
Remove from favorites
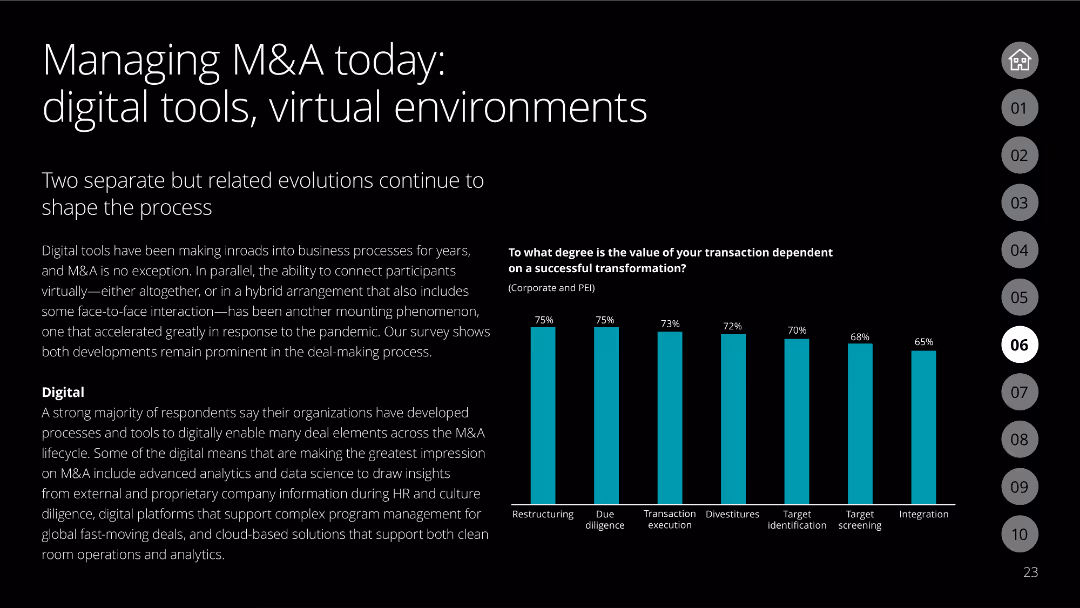
The slide contains a black background with white text, two separate sections with text and a column chart showing degrees of value dependence on successful transformation.
Mergers and Acquisitions
Financial Services
Discusses the evolution of M&A processes with the integration of digital tools and virtual environments, supported by survey data on the importance of digital and virtual interaction.
M&A, digital tools, virtual environments, survey data, transformation
false
Mergers and Acquisitions
Financial Services
Mixed Chart
Deloitte
Add to my slides
Remove from favorites
Features a comparative line graph analyzing the performance of M&A deals during weak and strong economic conditions.
Mergers and Acquisitions
Financial Services
Compares the outcomes of mergers and acquisitions during different economic conditions, highlighting the superior performance of deals made during economic downturns.
M&A, economic conditions, downturns, performance, comparative analysis
false
Mergers and Acquisitions
Financial Services
Single Chart
BCG
Add to my slides
Remove from favorites
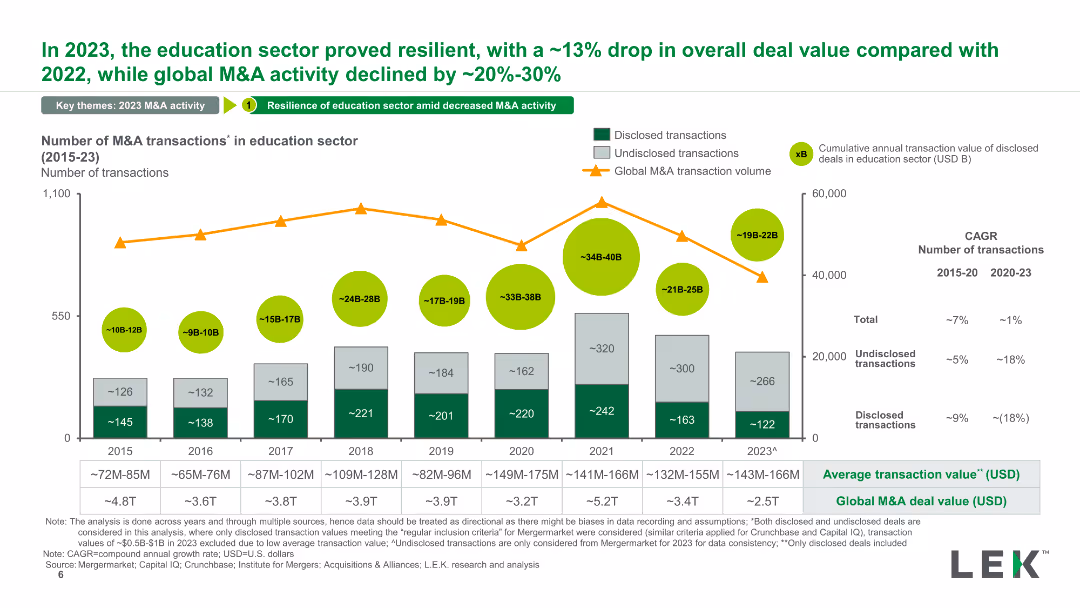
A column chart depicting the number of M&A transactions in the education sector from 2015 to 2023. It includes disclosed and undisclosed transactions and an overlay of global M&A transaction volume trends. Color-coded sections highlight values.
Mergers and Acquisitions
Education & Training
The slide analyzes the trend in M&A transactions within the education sector, showing resilience in 2023 compared to the global decline. It highlights transaction values and provides cumulative annual transaction data for disclosed deals.
M&A, education sector, transactions, disclosed, global trend
false
Mergers and Acquisitions
Education & Training
Mixed Chart
LEK
Add to my slides
Remove from favorites
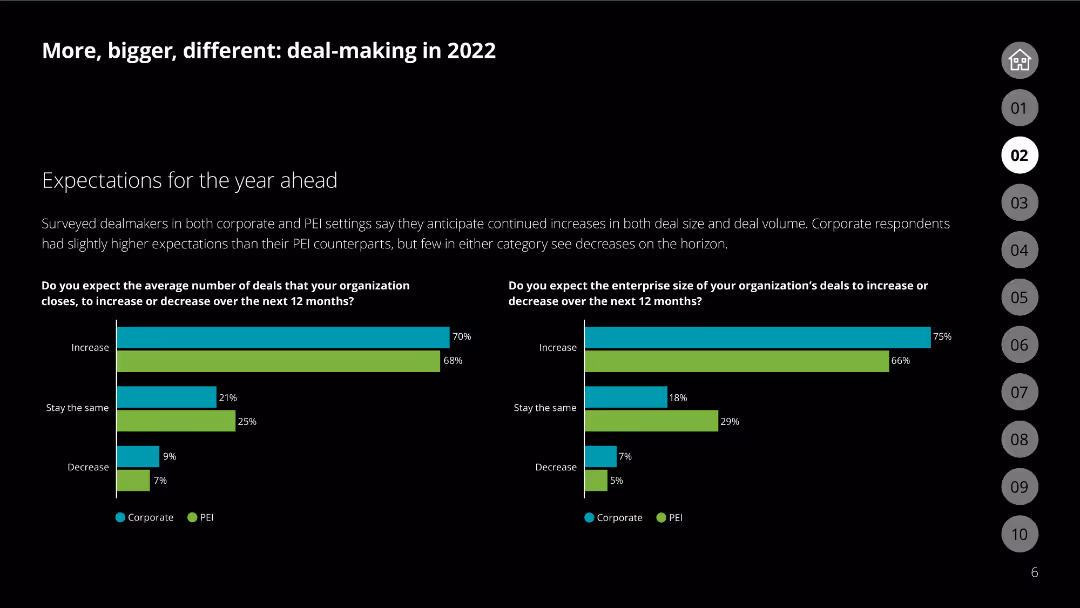
Column charts comparing corporate and PEI settings on expected number and size of deals
Mergers and Acquisitions
Financial Services
Forecasts increased deal activity and enterprise size in the coming year, based on expectations from corporate and PEI respondents.
M&A, expectations, deals, corporate, PEI
false
Mergers and Acquisitions
Financial Services
Multiple Chart
Deloitte
Add to my slides
Remove from favorites
A combination of text and column charts showing global M&A volume, control premium, and deal statistics for 2023.
Financial Performance
Financial Services
Summarizes key statistics of global M&A activity in 2023, highlighting volumes, premiums, and major deals.
M&A, global highlights, key stats, 2023, volume, control premium, deals, statistics, summary
false
Financial Performance
Financial Services
Multiple Chart
JP Morgan
Add to my slides
Remove from favorites
Multiple bar charts depicting transaction types, number of deals, and M&A trends over recent years.
Mergers and Acquisitions
Financial Services
Analyzes trends in investment and M&A activity within the warehouse automation sector, highlighting key areas of interest.
M&A, investment, warehouse automation, deals, trends
false
Mergers and Acquisitions
Financial Services
Multiple Chart
LEK
Add to my slides
Remove from favorites
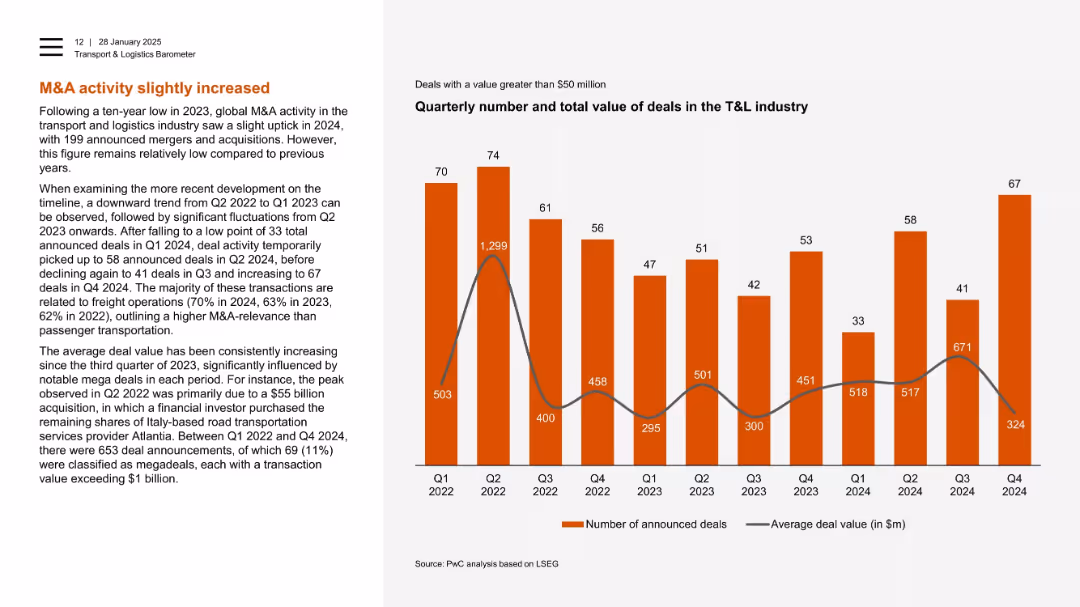
Left-text with a bar chart on the right showing deal count and value trends from Q1 2022 to Q4 2024.
Mergers and Acquisitions
Transportation & Logistics
M&A activity in transport and logistics rose slightly in 2024 after a long decline. The slide breaks down quarterly deal counts and highlights mega-deals, including significant acquisitions in freight operations, which dominate deal activity in this industry.
M&A, logistics, freight operations, deal value, mega deals, quarterly trends, investment
false
Mergers and Acquisitions
Transportation & Logistics
Mixed Chart
PwC/Strategy&
Add to my slides
Remove from favorites
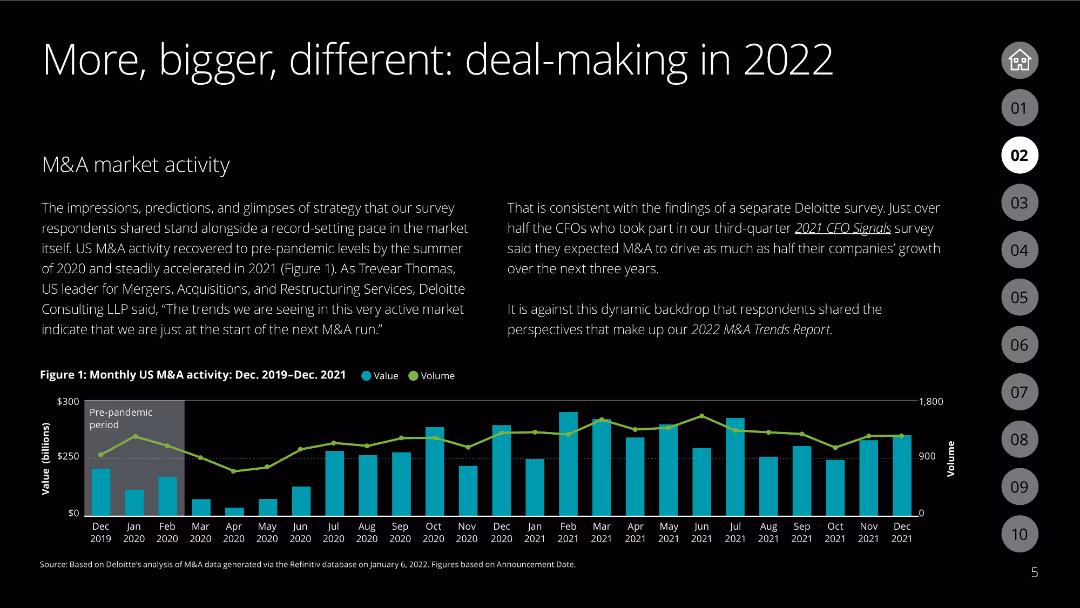
Line chart showing monthly US M&A activity (value and volume) from Dec 2019 to Dec 2021
Mergers and Acquisitions
Financial Services
Analyzes the recovery and growth of US M&A market activity, highlighting trends and expectations for future growth.
M&A, market activity, trends, value, volume
false
Mergers and Acquisitions
Financial Services
Mixed Chart
Deloitte
Add to my slides
Remove from favorites
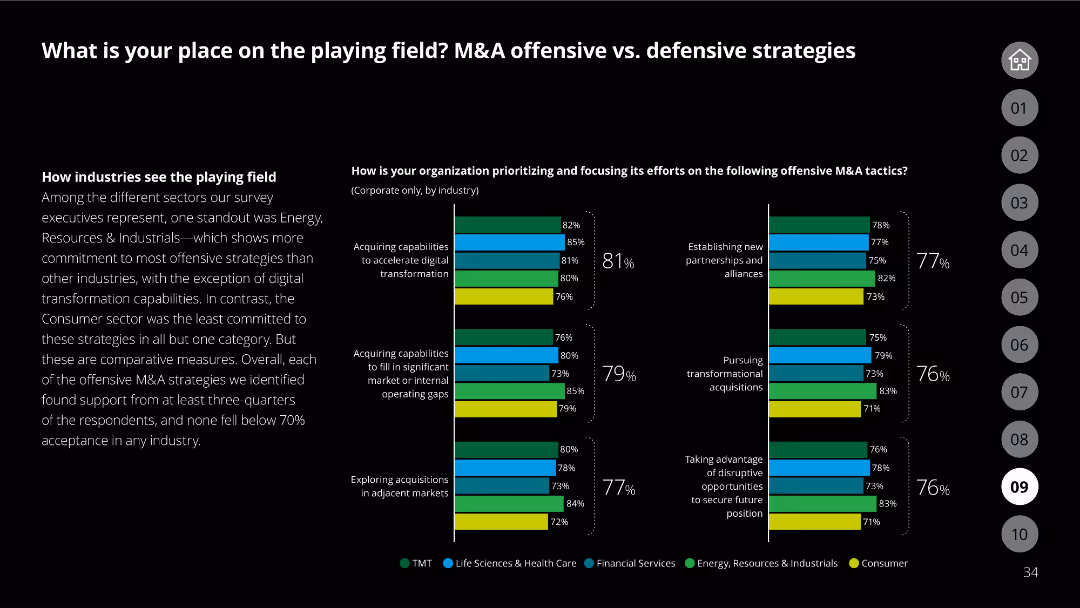
Slide with column charts comparing offensive and defensive M&A strategies by industry, showing the adoption rates of various tactics.
Strategic Planning
Financial Services
Compares offensive and defensive M&A strategies across different industries, illustrating which tactics are prioritized and the level of adoption.
M&A, offensive strategies, defensive strategies, industry, adoption rates, tactics, column chart
false
Strategic Planning
Financial Services
Mixed Chart
Deloitte
Add to my slides
Remove from favorites
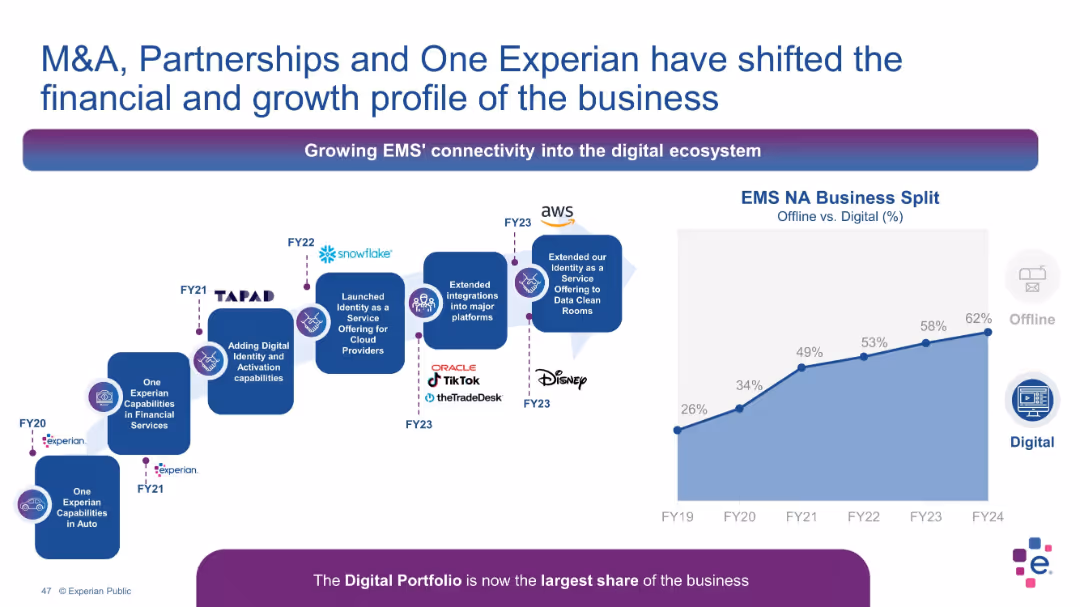
Flowchart timeline with M&A and partnership logos on left; area chart on right
Mergers and Acquisitions
Technology & Software
The slide showcases Experian’s digital transformation through M&A and partnerships, emphasizing digital portfolio growth. Logos from AWS, TikTok, Disney, and Oracle are included. The area chart shows an increasing shift toward digital revenue share.
M&A, partnerships, Experian, digital transformation, cloud, EMS, growth
false
Mergers and Acquisitions
Technology & Software
Mixed Chart
Barclays
Add to my slides
Remove from favorites
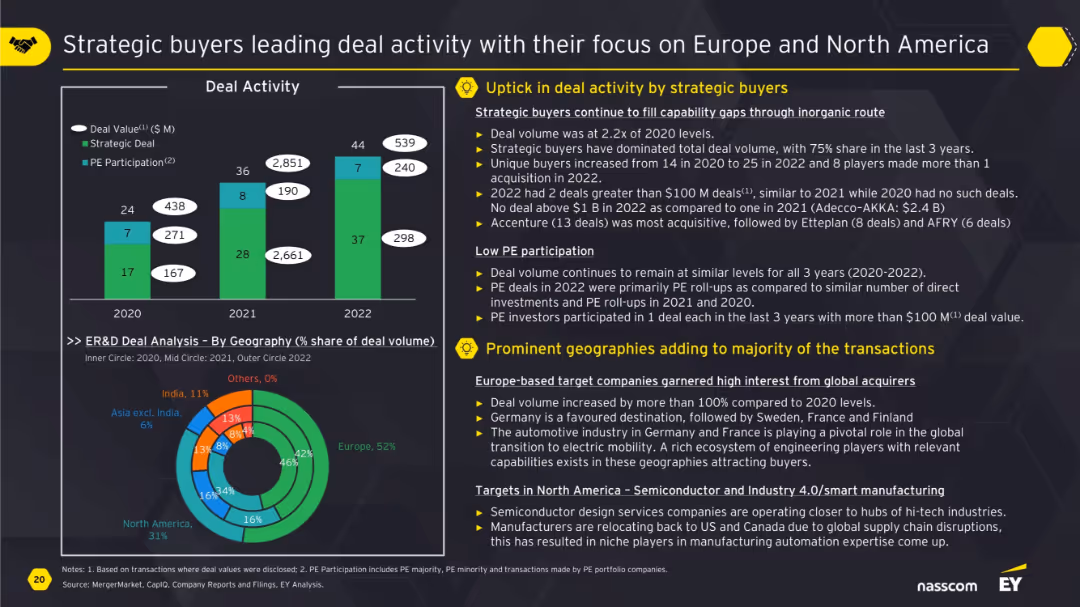
Vertical bar chart on deal activity with strategic vs PE split, pie chart by geography, and supporting text explanations.
Mergers and Acquisitions
Professional Services
This slide shows strategic buyers dominating deal activity over PE firms, particularly in Europe and North America. It discusses deal value growth, unique buyer activity, and key regions. Europe-based targets are increasingly attractive due to capability gaps, while PE participation remains low and focused.
M&A, strategic buyers, deal activity, Europe, North America, PE participation, ER&D
false
Mergers and Acquisitions
Professional Services
Multiple Chart
EY
Add to my slides
Remove from favorites
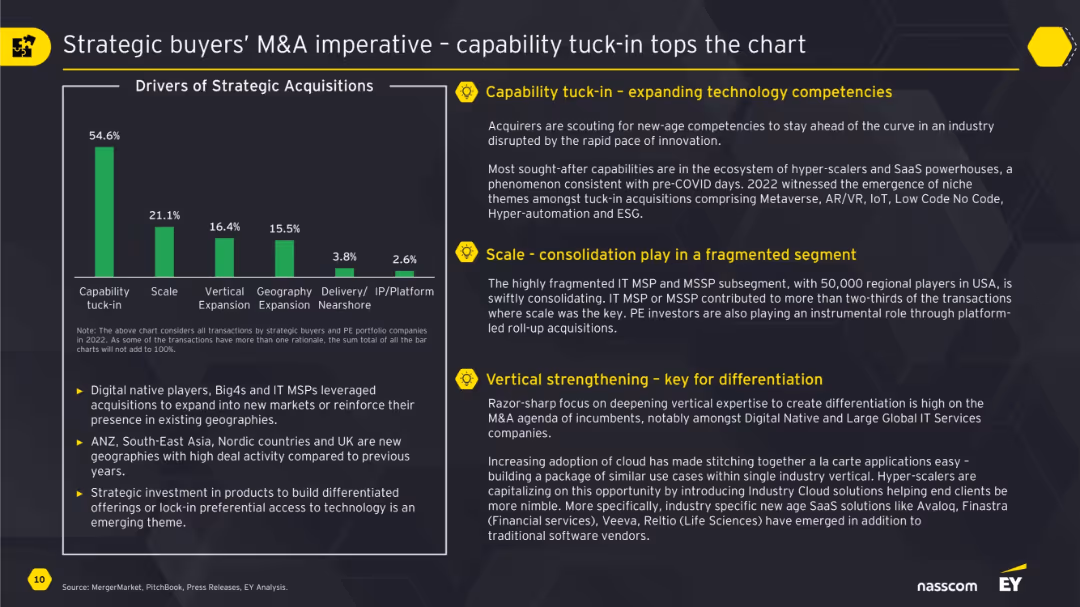
Bar chart on left visualizes strategic acquisition drivers; three yellow-highlighted text boxes explain capability tuck-in, scale, and vertical strengthening strategies.
Mergers and Acquisitions
Technology & Software
The slide explains the strategic rationale behind acquisitions, with “capability tuck-in” emerging as the most common driver (54.6%). It outlines how companies aim to expand tech competencies and consolidate fragmented segments. The commentary further details vertical integration strategies and the importance of innovation through M&A, especially in tech-related areas.
M&A, strategic buyers, tuck-in, vertical, acquisitions, tech strategy
false
Mergers and Acquisitions
Technology & Software
Mixed Chart
EY
Add to my slides
Remove from favorites
This slide presents a complex layout with a mix of text boxes, icons, and background images, highlighting key mergers and acquisitions (M&A) activities and their strategic importance. It includes timeline elements and bullet-point lists to describe major deals and steps within the company's strategy. The slide has the Michelin logo and uses the company's color scheme.
Strategic Planning
Industrial & Manufacturing
This slide reviews major M&A activities and strategic steps taken by Michelin, focusing on enhancing its portfolio in line with the "Michelin in Motion 2030 strategy." It is likely used in strategic business meetings or investor relations presentations to discuss company growth and strategic direction.
M&A, strategy, Michelin, portfolio, deals, innovation, acquisition, growth, planning, management
false
Strategic Planning
Industrial & Manufacturing
Pillar
Morgan Stanley
Add to my slides
Remove from favorites
The slide includes column charts showing the number of take-private transactions and the level of tech corporate divestitures from 2019 to 2023, and a commentary section.
Mergers and Acquisitions
Financial Services
The slide discusses the expected rebound in M&A transactions, driven by opportunities in take-private transactions, carve-outs, and add-on acquisitions, supported by a stable interest rate outlook.
M&A, take-private, interest rates, carve-outs, acquisitions
false
Mergers and Acquisitions
Financial Services
Multiple Chart
Accenture
Add to my slides
Remove from favorites
Features two tables with top M&A deals over three years, alongside bar graphs comparing investment sectors in the Philippines.
Investment Analysis
Financial Services
Summarizes the top M&A deals in the Philippines from 2018 to 2020, focusing on deal value and key players, alongside sector investments.
M&A, top deals, Philippines, investment, sectors, deal value
false
Investment Analysis
Financial Services
Mixed Chart
Deloitte
Add to my slides
Remove from favorites
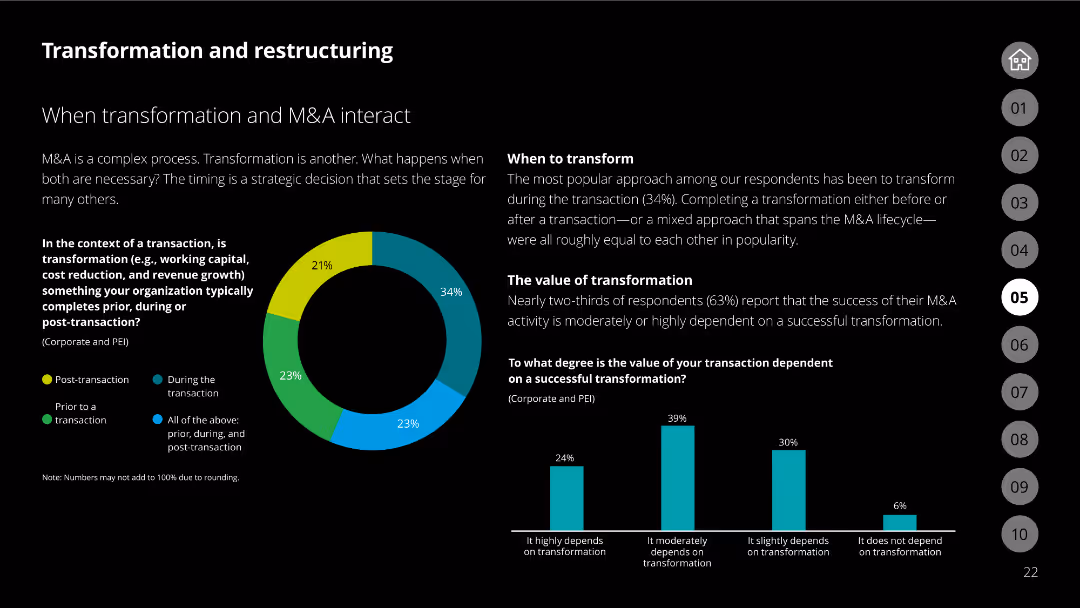
Slide with a pie chart and column charts, detailing the interaction between transformation and M&A. Highlights approaches and dependency on successful transformation.
Mergers and Acquisitions
Financial Services
This slide explores the relationship between transformation and M&A, presenting data on timing, transformation dependency, and the value placed on successful transactions.
M&A, transformation, interaction, timing, value, dependency, charts, pie chart, column chart
false
Mergers and Acquisitions
Financial Services
Multiple Chart
Deloitte
Add to my slides
Remove from favorites
Column chart detailing merger and acquisition trends in the Philippines, against a background image of power lines at sunset.
Mergers and Acquisitions
Financial Services
Discusses trends in M&A activity from 2018 to 2020, highlighting a decrease in deal volume and value, with focus on high-value transactions.
M&A, trends, Philippines, deal volume, high-value, pandemic impact, financial services
false
Mergers and Acquisitions
Financial Services
Mixed Chart
Deloitte
Add to my slides
Remove from favorites
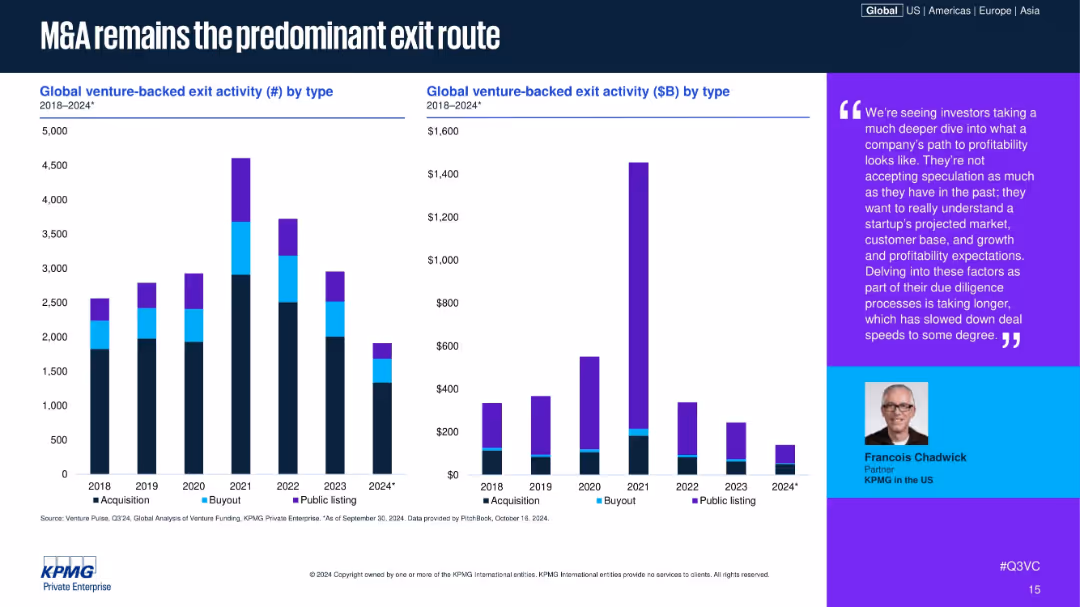
Bar charts showing exit activity by type (count & $ value), 2018–2024; color-coded by exit type (Acquisition, Buyout, Public); includes expert quote on right side.
Mergers and Acquisitions
Financial Services
The slide shows that M&A continues to be the dominant form of venture-backed exits, with public listings and buyouts significantly declining. An analyst quote underscores the increased scrutiny in due diligence, leading to slower deal speeds and more cautious exits.
M&A, venture exits, IPO, buyouts, exit strategy, acquisition trends, investor caution, startup exit, due diligence, Q3 2024
false
Mergers and Acquisitions
Financial Services
Multiple Chart
KPMG
Add to my slides
Remove from favorites
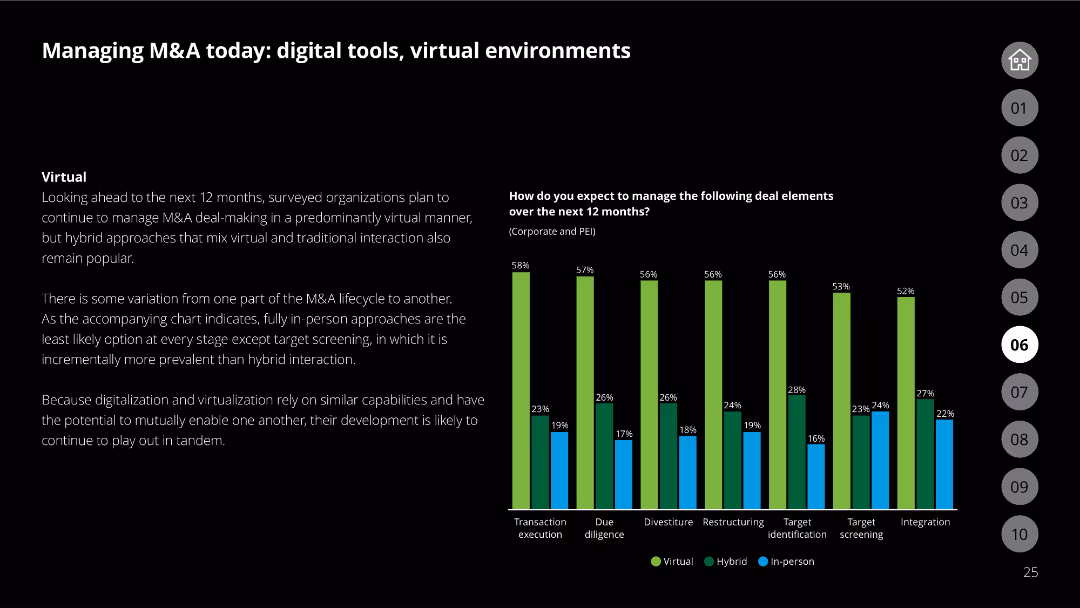
The slide has a black background, text discussing virtual management of M&A, and a column chart comparing deal element management methods (virtual, hybrid, in-person) for the next 12 months.
Mergers and Acquisitions
Financial Services
Covers how organizations plan to manage M&A deals in the next year, highlighting the use of virtual and hybrid approaches for different deal elements based on survey results.
M&A, virtual management, deal elements, survey results, hybrid approach
false
Mergers and Acquisitions
Financial Services
Mixed Chart
Deloitte
Add to my slides
Remove from favorites
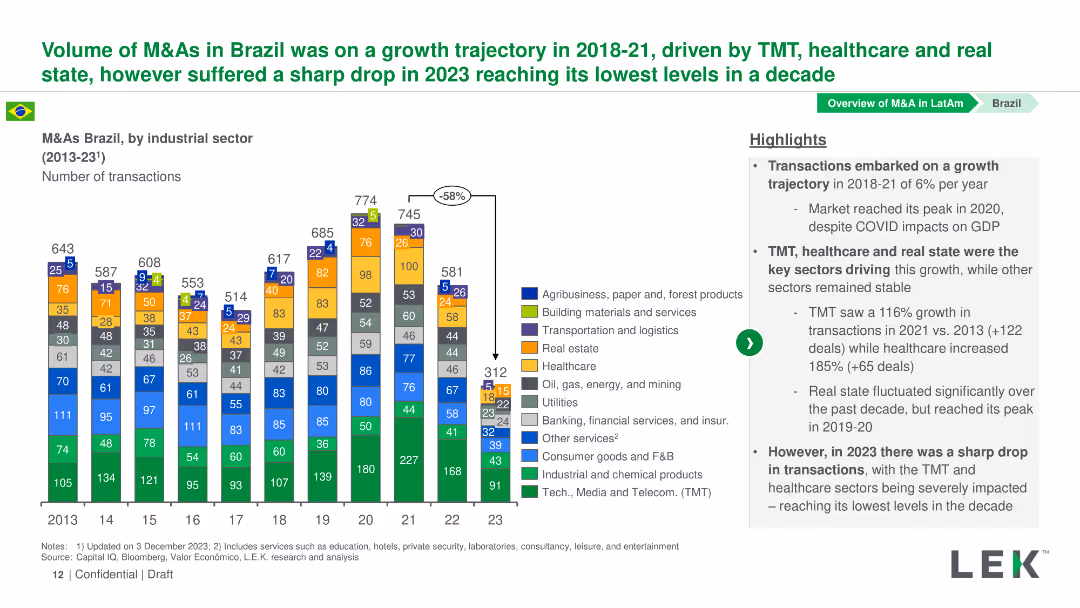
Column chart showing M&A transaction volumes by industrial sector in Brazil from 2013 to 2023, with highlights on growth and significant declines, especially in 2023.
Market Analysis and Trends
Financial Services
Details the growth trajectory of M&As in Brazil from 2018-2021, driven by TMT and healthcare, followed by a sharp decline in 2023, reaching the lowest levels in a decade.
M&As, Brazil, TMT, healthcare, transaction volumes
false
Market Analysis and Trends
Financial Services
Mixed Chart
LEK
Add to my slides
Remove from favorites
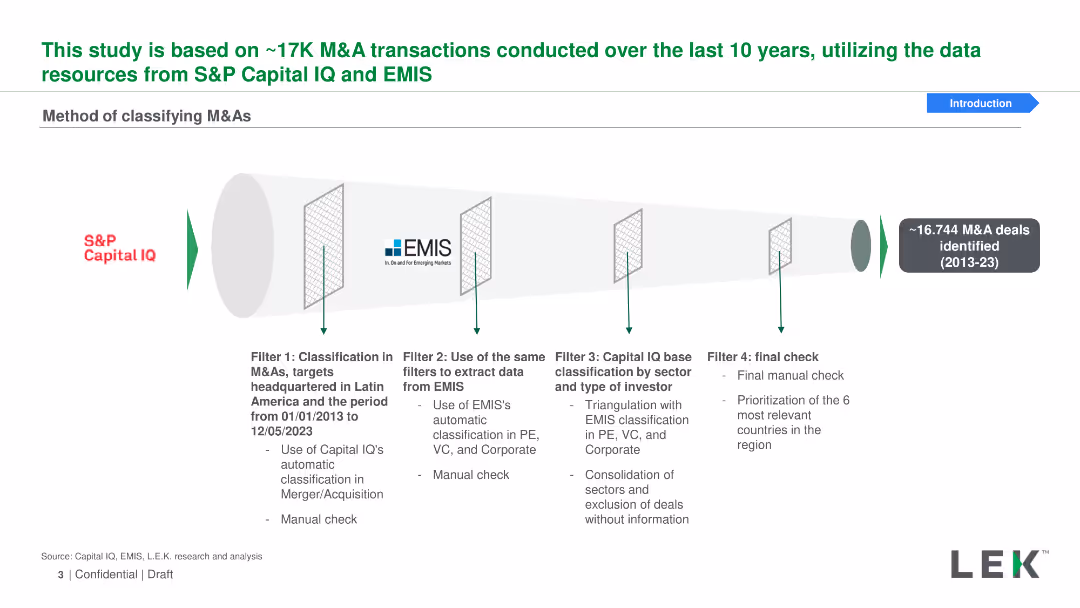
Funnel diagram with four filters for classifying M&As using data from S&P Capital IQ and EMIS, representing various stages of data filtration and classification.
Mergers and Acquisitions
Financial Services
Explains the method of classifying M&A transactions using data from S&P Capital IQ and EMIS, including filtering by region, investor type, and manual checks for accuracy.
M&As, classification, S&P Capital IQ, EMIS, filtering
false
Mergers and Acquisitions
Financial Services
Linear Flow
LEK
Add to my slides
Remove from favorites
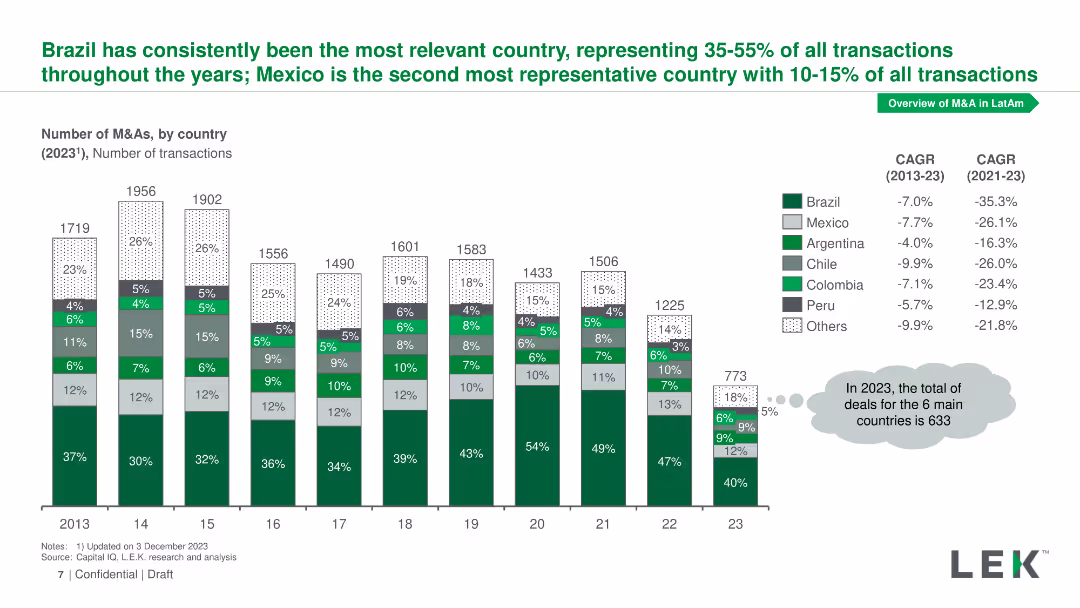
Column chart representing the number of M&As by country from 2013 to 2023, with percentages indicating each country's share of total transactions.
Market Analysis and Trends
Financial Services
Illustrates the distribution of M&A transactions by country, highlighting Brazil and Mexico as leading countries, with CAGR values for 2013-2023 and 2021-2023.
M&As, country distribution, Brazil, Mexico, CAGR
false
Market Analysis and Trends
Financial Services
Mixed Chart
LEK
Add to my slides
Remove from favorites
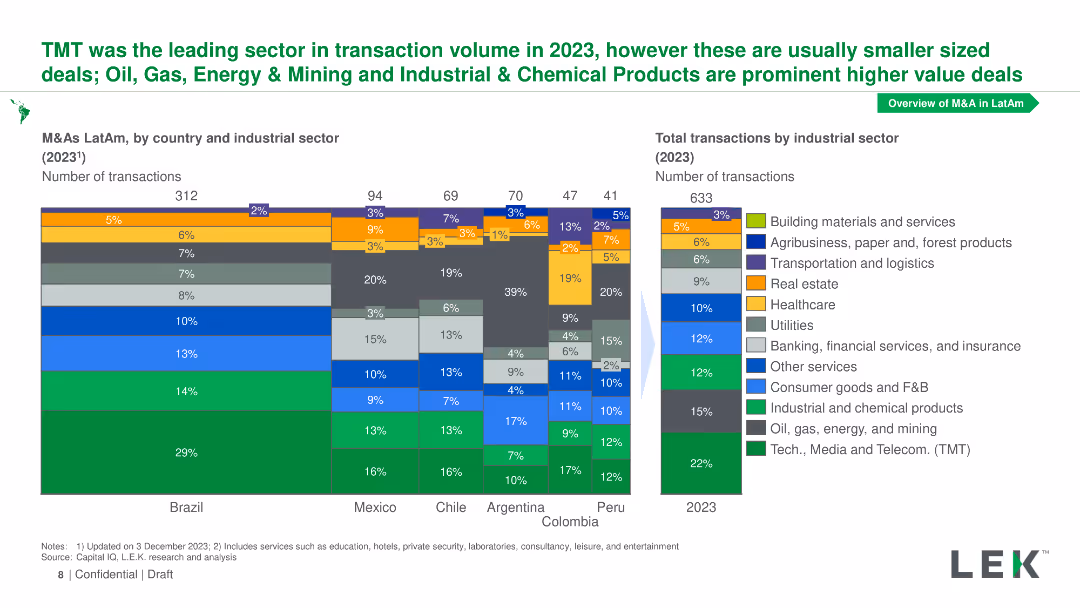
Stacked bar chart showing M&As by industrial sector for several Latin American countries in 2023, with a breakdown of sectors per country and total transactions.
Market Analysis and Trends
Financial Services
Shows M&A transaction volumes by industrial sector for Brazil, Mexico, Chile, Argentina, Peru, and Colombia, highlighting TMT as the leading sector in 2023.
M&As, industrial sector, Latin America, TMT, transaction volumes
false
Market Analysis and Trends
Financial Services
Multiple Chart
LEK
Add to my slides
Remove from favorites
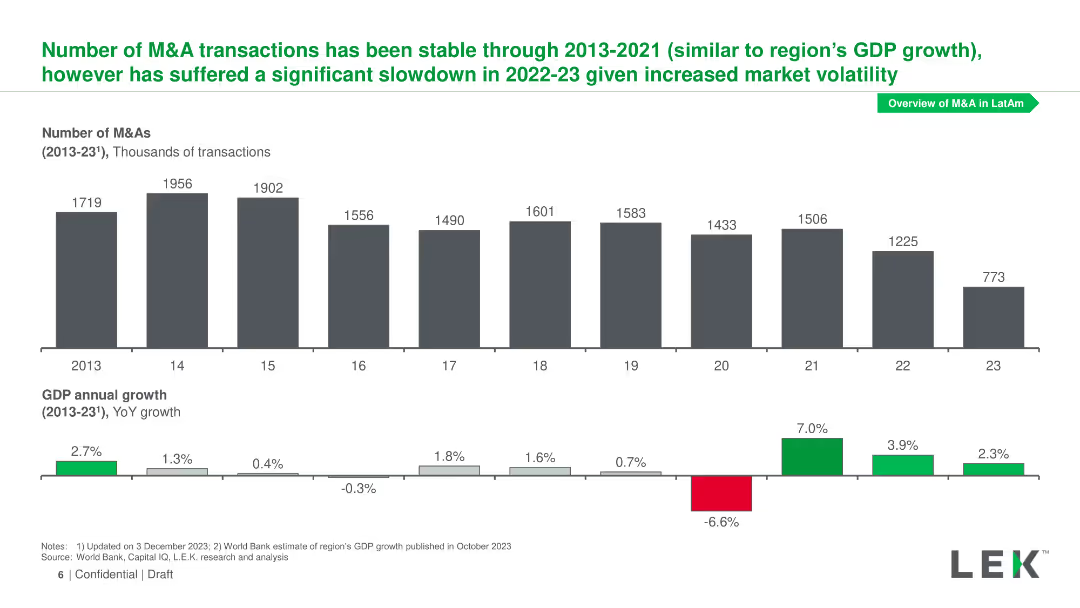
Column chart showing the number of M&A transactions from 2013 to 2023 and line chart displaying GDP annual growth over the same period.
Market Analysis and Trends
Financial Services
The slide displays M&A transaction trends from 2013-2023 alongside GDP growth rates, noting a significant slowdown in 2022-23 due to market volatility.
M&As, transaction trends, GDP growth, market volatility
false
Market Analysis and Trends
Financial Services
Multiple Chart
LEK
Add to my slides
Remove from favorites
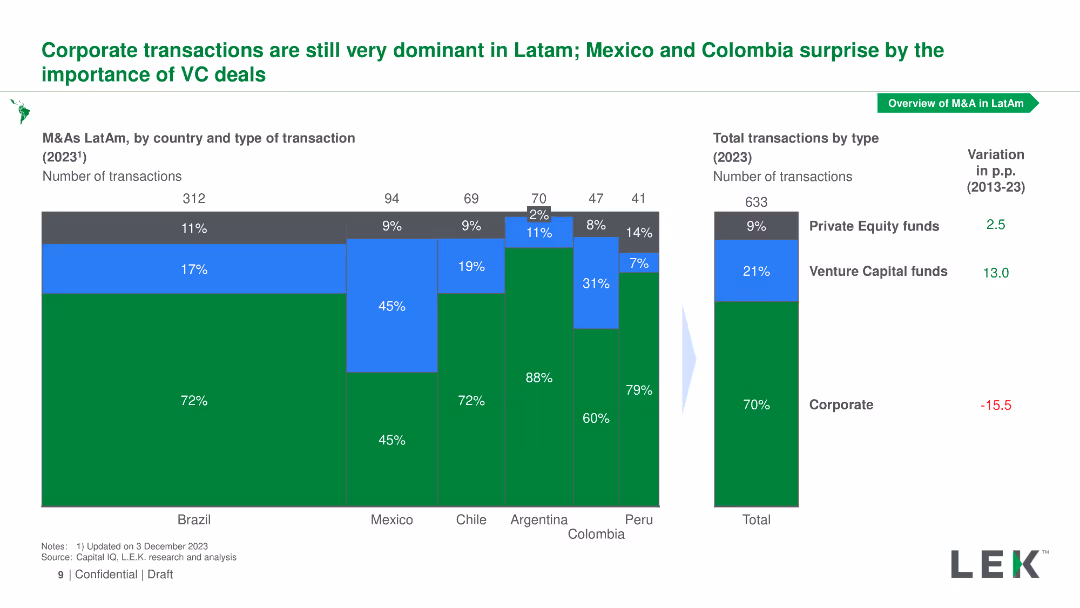
Stacked bar chart displaying M&A transaction types (corporate, private equity, venture capital) for Latin American countries in 2023, with total transactions and variation.
Market Analysis and Trends
Financial Services
Highlights the dominance of corporate transactions in Latin America, with notable VC activity in Mexico and Colombia, and presents total transactions by type for 2023.
M&As, transaction types, Latin America, VC activity, corporate transactions
false
Market Analysis and Trends
Financial Services
Multiple Chart
LEK
Add to my slides
Remove from favorites
A multi-bar column chart shows the percentage of mortgages in forbearance by type, with a time series comparison from 2020 to 2023.
Risk Assessment and Management
Financial Services
Assesses mortgage-backed securities (MBS) risk by highlighting the sharp reduction in forbearance rates since the pandemic, valuable for financial risk managers.
MBS, forbearance, mortgages, pandemic, risk, reduction, securities, financial, management
false
Risk Assessment and Management
Financial Services
Single Chart
Morgan Stanley
Add to my slides
Remove from favorites
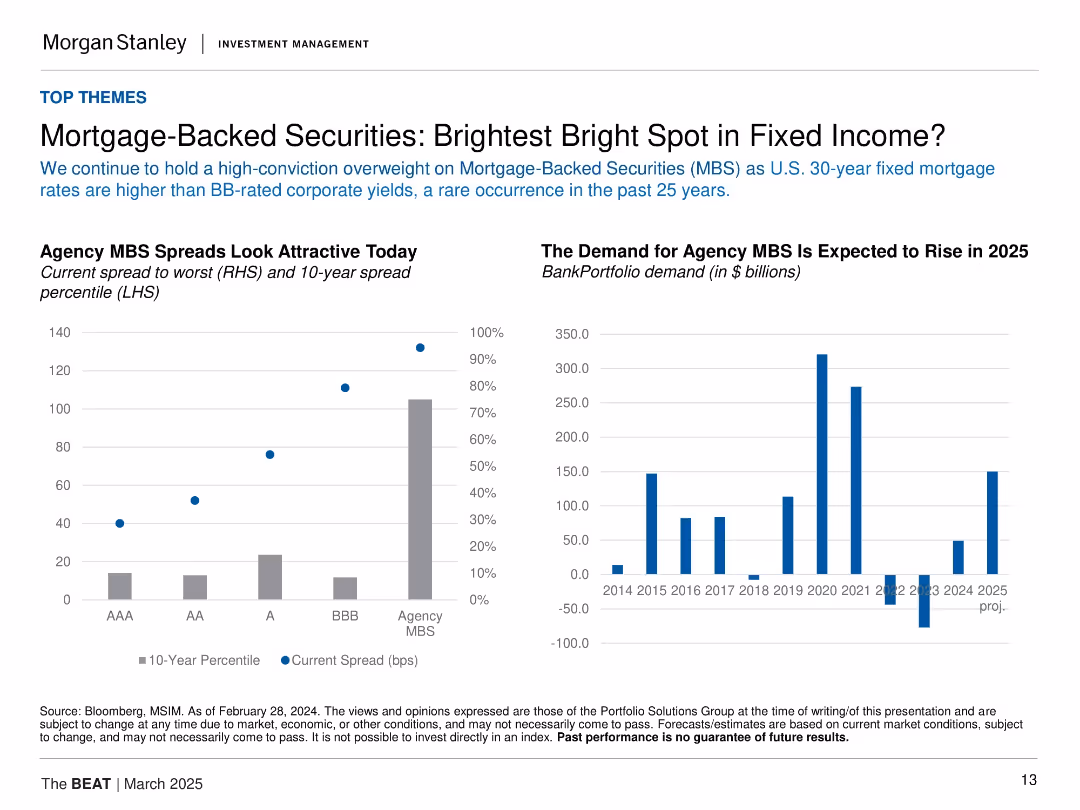
Two charts: left bar/point combo showing spreads and percentiles; right bar chart of bank demand. Light background, data-focused layout.
Investment Analysis
Financial Services
Highlights the attractiveness of agency MBS, with higher spreads than BB-rated corporates and strong historical percentile positioning. Demand is projected to rise significantly in 2025 after recent declines, signaling renewed institutional interest.
MBS, spreads, fixed income, mortgage rates, bank demand, agency bonds, yield, investment opportunity
false
Investment Analysis
Financial Services
Multiple Chart
Morgan Stanley
Add to my slides
Remove from favorites
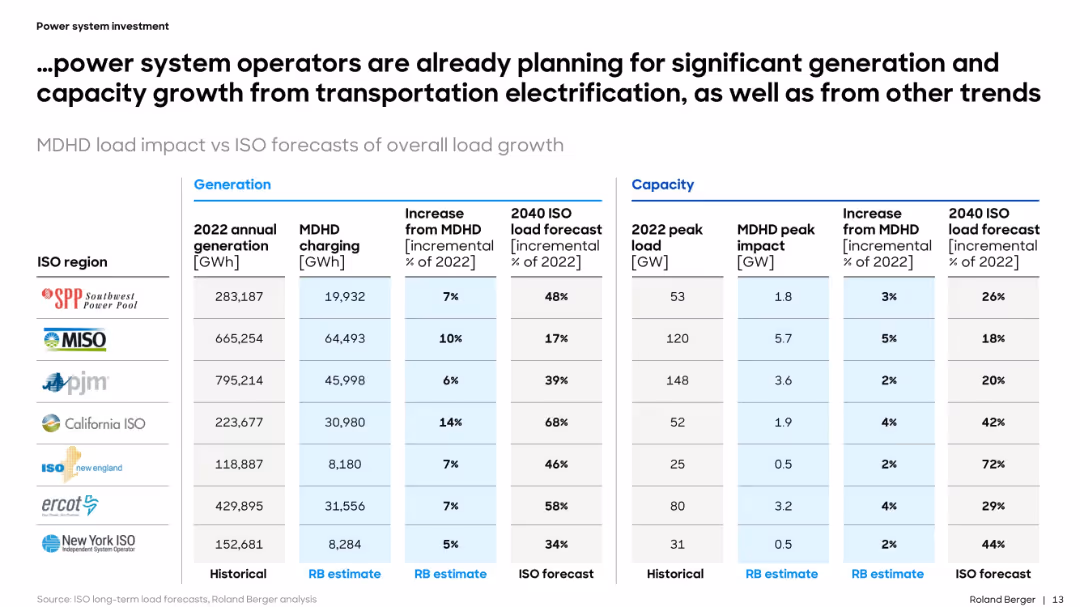
Tabular comparison of power generation, load forecast, and MDHD impact across ISO regions. Organized and data-heavy format.
Performance Metrics and KPIs
Energy & Utilities
The slide provides a detailed forecast of how MDHD vehicle electrification will impact generation and peak load in major U.S. ISO regions. It quantifies incremental demand and contextualizes it within broader electricity system planning.
MDHD, power, ISO, forecast, generation, load, electrification, capacity, utilities, metrics
false
Performance Metrics and KPIs
Energy & Utilities
Table
Roland Berger
Add to my slides
Remove from favorites
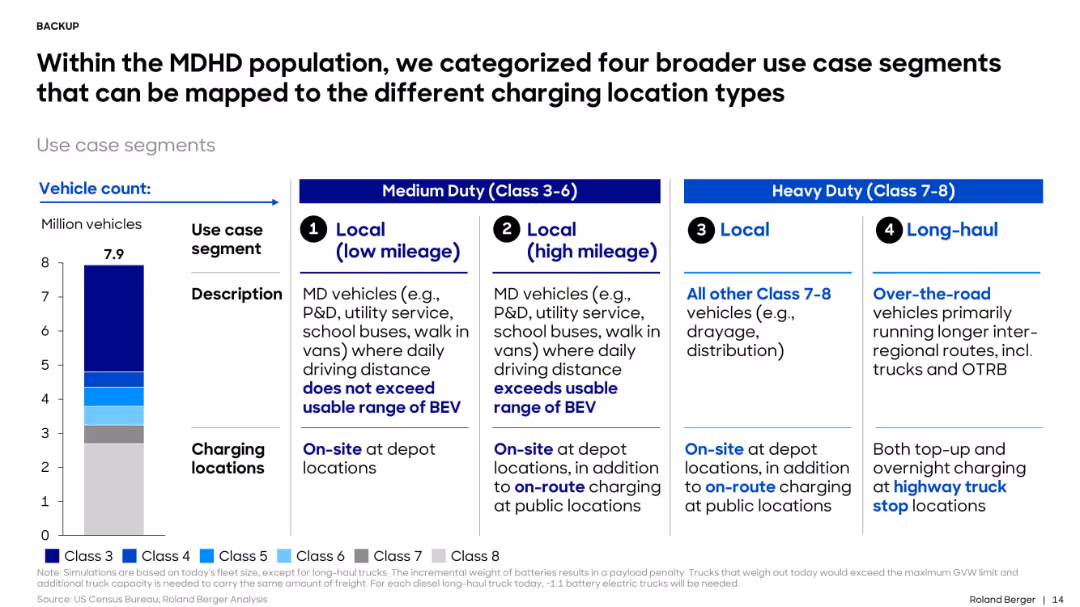
4-column layout; left shows a bar chart of vehicle counts by class; right side displays four categorized use cases in separate text boxes, separated by bolded titles.
Customer and Market Segmentation
Transportation & Logistics
The slide categorizes medium and heavy-duty vehicles into four charging location use cases: local low mileage, local high mileage, local heavy-duty, and long-haul. Each segment includes description and applicable charging locations.
MDHD, use case, charging, vehicle class, long-haul, local, BEV, depot, on-route, fleet
false
Customer and Market Segmentation
Transportation & Logistics
Mixed Chart
Roland Berger
Add to my slides
Remove from favorites
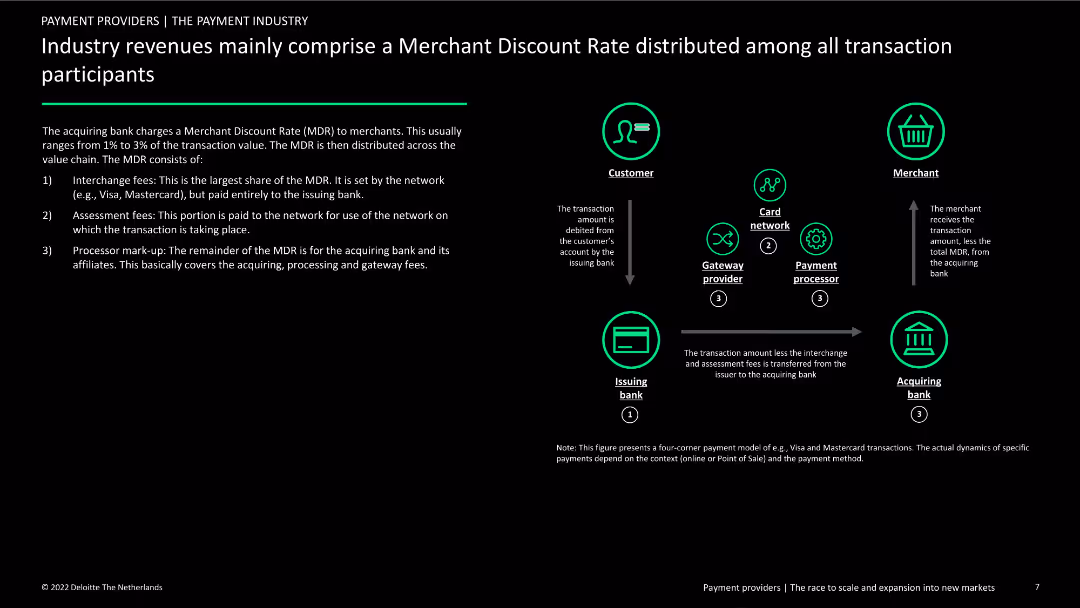
The slide describes the components of the Merchant Discount Rate (MDR) with a flow diagram showing how MDR is distributed among participants. Text details the breakdown of fees and the roles of different entities in the payment process.
Financial Performance
Financial Services
This slide provides an overview of the Merchant Discount Rate (MDR) in the payment industry, explaining how fees are distributed among banks, networks, and processors, and highlighting the financial implications for merchants and other stakeholders.
MDR, payment industry, fees, revenue distribution, roles
false
Financial Performance
Financial Services
Diagram
Deloitte
Add to my slides
Remove from favorites
The slide includes a line chart showing the performance of various MENA equity indices throughout 2022. The chart uses multiple colored lines to represent different indices. The bottom section includes a detailed narrative of market performance.
Market Analysis and Trends
Financial Services
This slide depicts the performance of MENA equity markets in 2022, with a line chart tracking various equity indices. It also provides a narrative analysis of market trends, key events, and economic factors influencing the equity performance over the year.
MENA equity markets, financial services, market trends, equity indices, market performance, financial data, year analysis, investment
false
Market Analysis and Trends
Financial Services
Mixed Chart
EY
Add to my slides
Remove from favorites
Includes column charts, tables, and text boxes showing the impact of geopolitical situations on IPO numbers and proceeds.
Risk Assessment and Management
Financial Services
It analyzes the decline in IPOs and proceeds in EMEIA, highlighting the rise in MENA IPO proceeds due to two major IPOs.
MENA, EMEIA, IPOs, geopolitical, mega IPOs
false
Risk Assessment and Management
Financial Services
Multiple Chart
EY
Add to my slides
Remove from favorites
Features three charts: a column chart for y/y real GDP (2021-2025F), a line chart for interest rates (2005-2025F), and a line chart for y/y CPI (2005-2025F).
Market Analysis and Trends
Financial Services
Discusses economic growth prospects in the MENA region, focusing on GDP, interest rates, and inflation trends.
MENA, GDP, Inflation, Interest Rates, 2024
false
Market Analysis and Trends
Financial Services
Multiple Chart
EY
Add to my slides
Remove from favorites
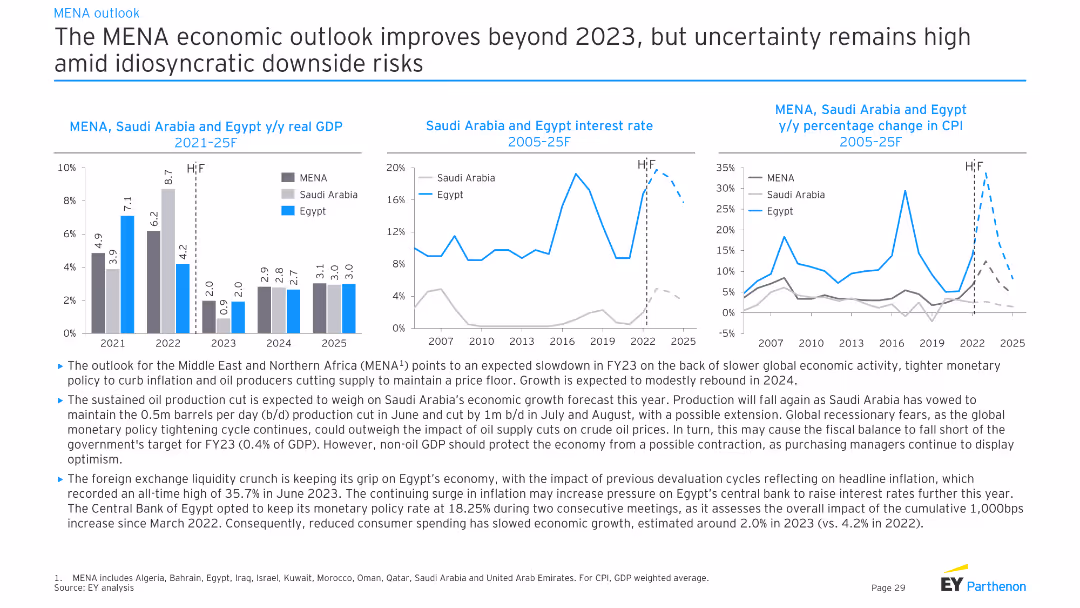
Three charts showing MENA, Saudi Arabia, and Egypt's y/y real GDP, interest rates, and y/y percentage change in CPI from 2021-25F. Moderate complexity, presenting detailed economic trends and projections for the region.
Market Analysis and Trends
Financial Services
This slide analyzes the MENA economic outlook, highlighting GDP growth, interest rates, and inflation trends for Saudi Arabia and Egypt. It discusses the impacts of oil production cuts, monetary policy, and global economic conditions.
MENA, GDP, interest rate, CPI, economy
false
Market Analysis and Trends
Financial Services
Multiple Chart
EY
Add to my slides
Remove from favorites
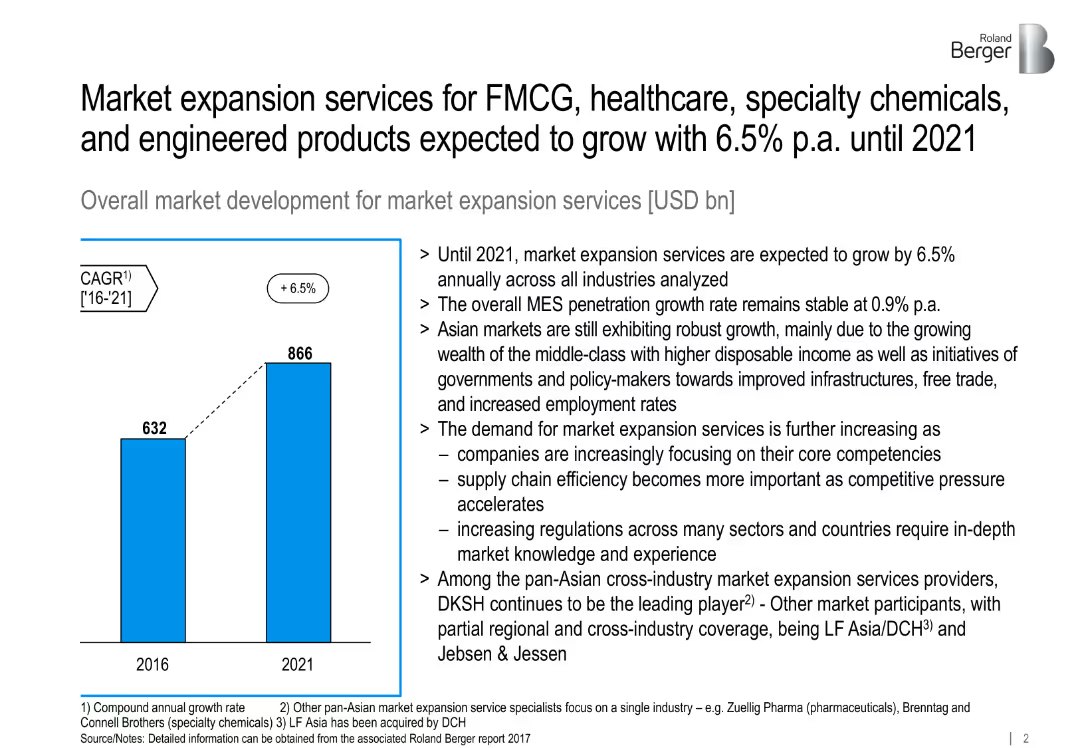
Bar chart comparing 2016 vs 2021 global MES volume; bullet points explaining drivers.
Market Analysis and Trends
Professional Services
Projects global MES (market expansion services) growth to reach $866B by 2021, citing demand, Asian market drivers, and increased efficiency focus across sectors.
MES, CAGR, global growth, Asia, FMCG, infrastructure, outsourcing
false
Market Analysis and Trends
Professional Services
Mixed Chart
Roland Berger
Add to my slides
Remove from favorites
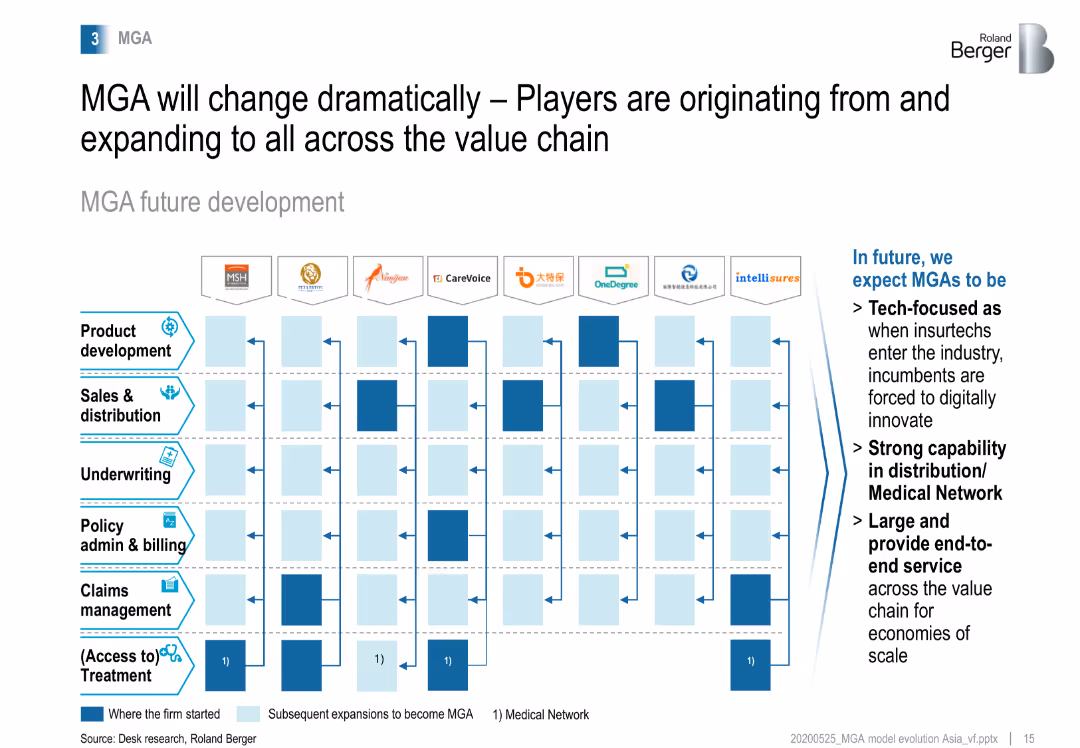
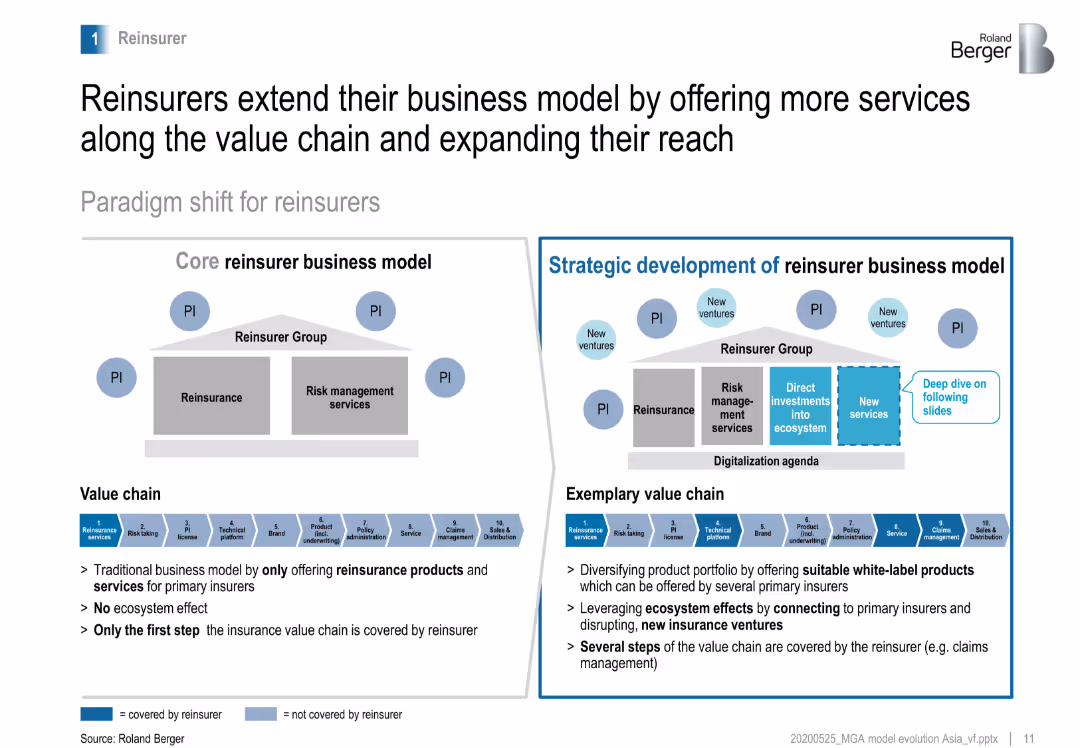
Matrix showing the future development of MGAs, highlighting the expansion across the value chain from product development to claims management, with a focus on tech and distribution.
Strategic Planning
Financial Services
Examines the future development of MGAs, emphasizing their expansion across the value chain and the integration of technology and strong distribution capabilities.
MGA development, value chain, technology, distribution
false
Strategic Planning
Financial Services
Table
Roland Berger
Add to my slides
Remove from favorites
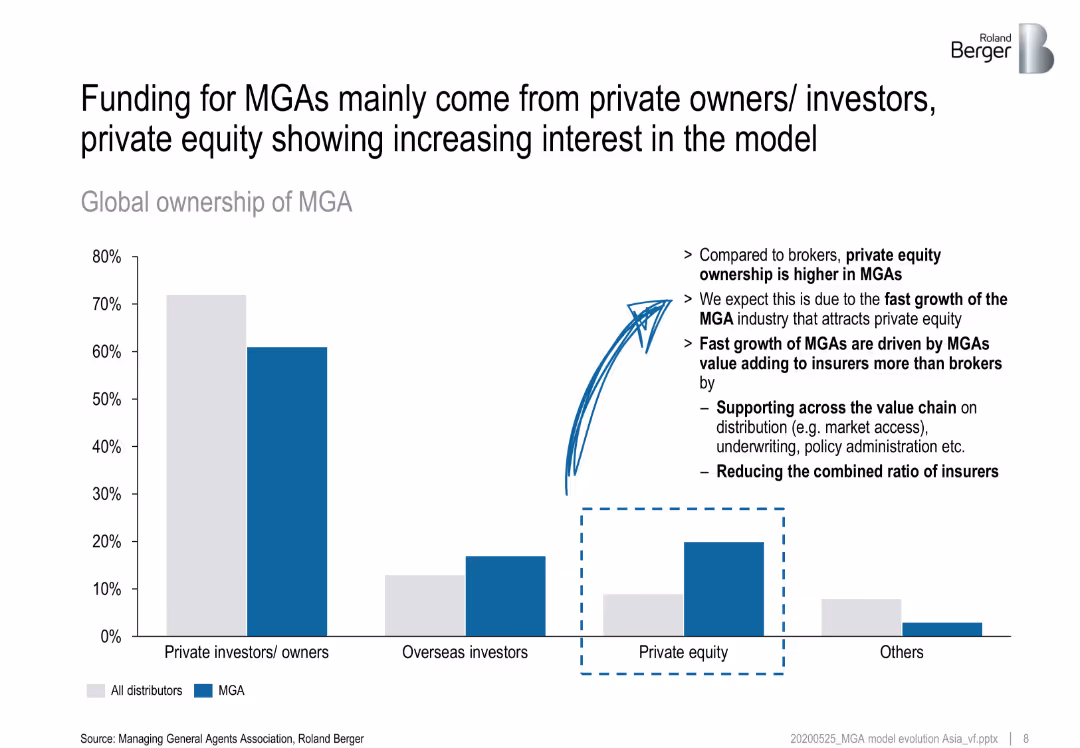
Bar chart comparing the sources of funding for MGAs, showing a higher proportion of private equity ownership compared to brokers, and the increasing interest from private equity.
Investment Analysis
Financial Services
Analyzes the funding sources for MGAs, emphasizing the significant role of private equity and the fast growth of MGAs due to their value-adding services to insurers.
MGA funding, private equity, investment, brokers, growth
false
Investment Analysis
Financial Services
Header Horizontal
Roland Berger
Add to my slides
Remove from favorites
Bar chart showing the growth of MGAs relative to brokers in the UK from 2010 to 2019, highlighting a significant increase in the number of MGAs over the period.
Market Analysis and Trends
Financial Services
Examines the growth trends of Managing General Agents (MGAs) compared to brokers in the UK, showing a 41% increase in MGAs from 2010 to 2019.
MGA growth, brokers, UK, market trends, 2019
false
Market Analysis and Trends
Financial Services
Multiple Chart
Roland Berger
Add to my slides
Remove from favorites
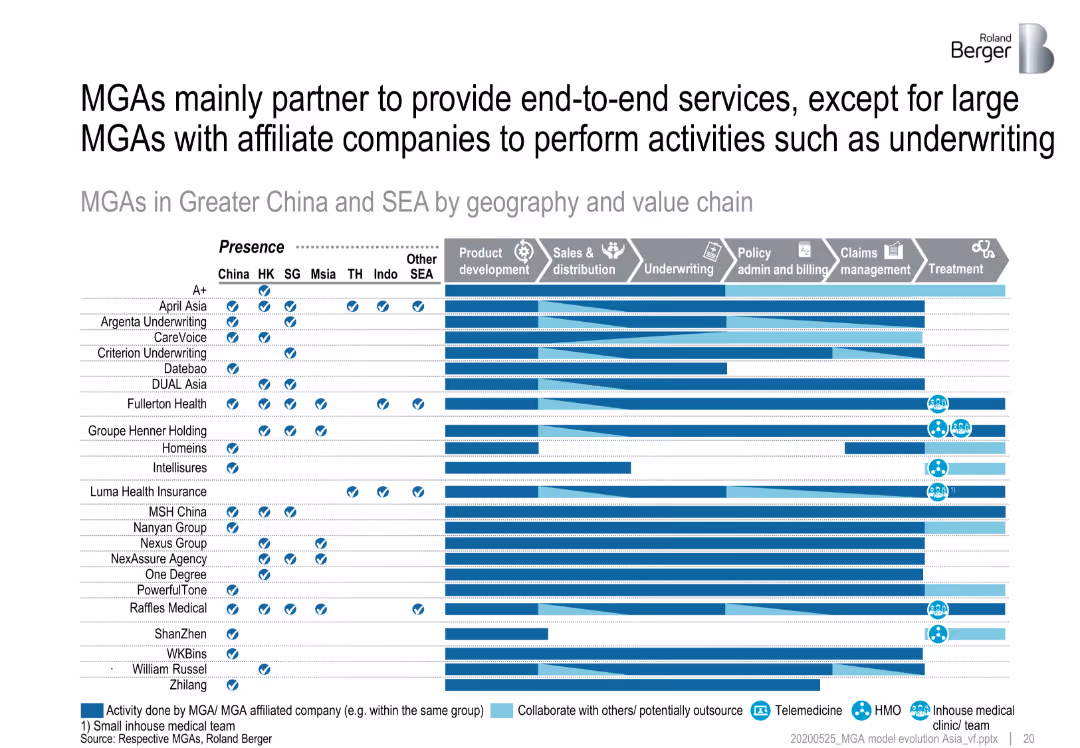
Matrix showing MGAs in Greater China and SEA by geography and value chain activities, emphasizing their partnerships to provide end-to-end services.
Strategic Planning
Financial Services
Analyzes how MGAs in Greater China and Southeast Asia partner with other companies to offer comprehensive services across the value chain, focusing on end-to-end service provision.
MGA partnerships, end-to-end services, Greater China, SEA
false
Strategic Planning
Financial Services
Table
Roland Berger
Add to my slides
Remove from favorites
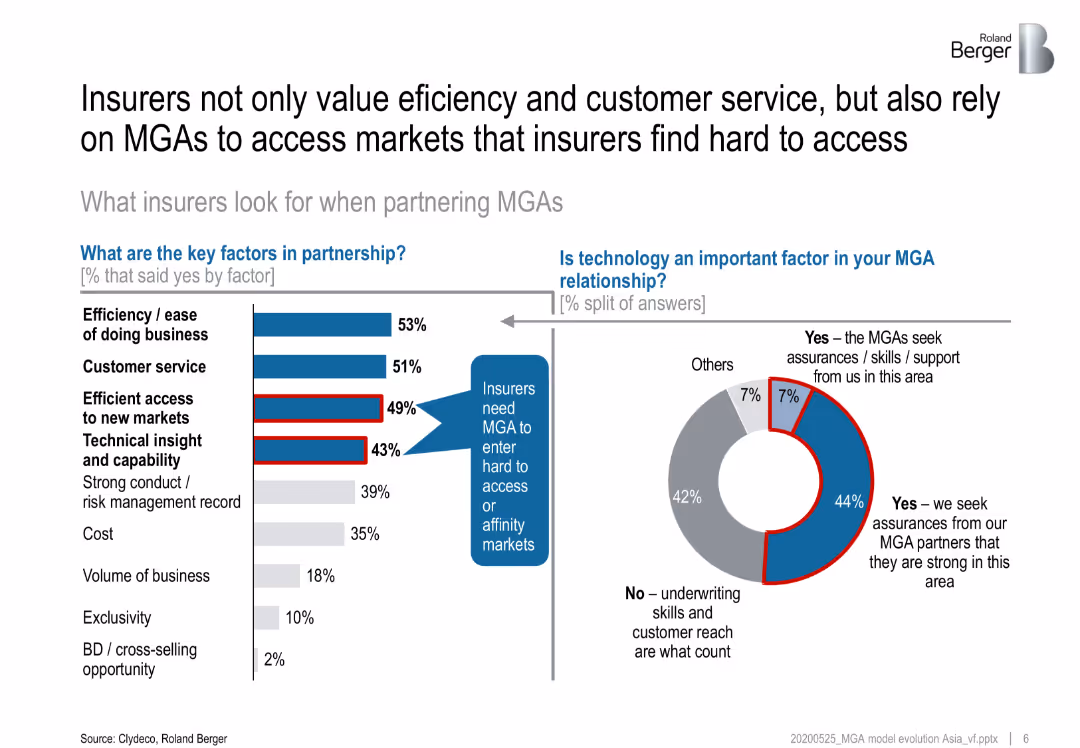
Bar chart and pie chart showing the key factors insurers consider when partnering with MGAs and the importance of technology in these partnerships.
Strategic Planning
Financial Services
Discusses the key factors insurers value when partnering with MGAs, including efficiency, customer service, and market access, and the role of technology in these partnerships.
MGAs, insurers, partnerships, key factors, technology
false
Strategic Planning
Financial Services
Multiple Chart
Roland Berger
Add to my slides
Remove from favorites
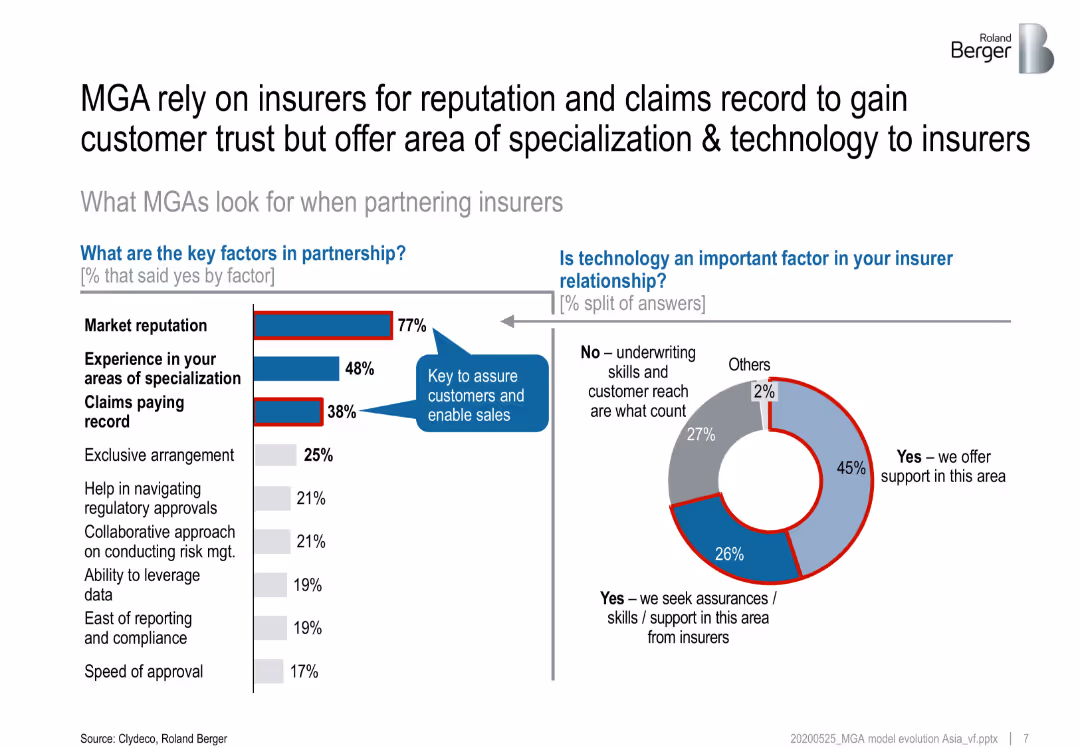
Bar chart and pie chart showing the key factors MGAs consider when partnering with insurers and the importance of technology in these relationships.
Strategic Planning
Financial Services
Highlights the key factors MGAs look for in insurer partnerships, such as market reputation and claims record, and the role of technology in enhancing these relationships.
MGAs, insurers, partnerships, key factors, technology
false
Strategic Planning
Financial Services
Mixed Chart
Roland Berger
Add to my slides
Remove from favorites
The slide features a column chart showing changes in assets under management over time, with callout boxes indicating specific factors contributing to the increases or decreases, and an annotation explaining equity movements. The chart uses shades of blue and gray for visual differentiation.
Financial Performance
Financial Services
This slide presents the movements in Macquarie Infrastructure and Real Assets (MIRA) Equity Under Management (EUM), highlighting the impact of new equity raised, listed security price movements, and foreign exchange movements, suitable for financial analysis and investor presentations.
MIRA, EUM, equity, investment, financial analysis, Macquarie, bar graph, performance, capital, foreign exchange
false
Financial Performance
Financial Services
Single Chart
Goldman Sachs
Add to my slides
Remove from favorites
The slide features a mixed chart with column chart and a line graph illustrating MIRA's historical income, base fees, and EUM over fiscal years.
Financial Performance
Financial Services
Presents the historical income of MIRA, comparing performance fees, base fees, and end-of-period EUM, aimed at evaluating past financial performance and informing investment decisions.
MIRA, income, performance fees, base fees, EUM, historical, financial analysis
false
Financial Performance
Financial Services
Single Chart
Goldman Sachs
Add to my slides
Remove from favorites
Pie chart displaying the distribution of approaches to ML governance among various firms.
Regulatory and Compliance
Technology & Software
Provides an overview of how different organizations are handling ML governance and framework adaptation.
ML governance, framework, adaptation, distribution
false
Regulatory and Compliance
Technology & Software
Single Chart
PwC/Strategy&
Add to my slides
Remove from favorites
Diagram of ML workflow, future progression circular graphic, and side notes explaining the model deployment into production.
Technology and Digital Transformation
Technology & Software
Explanation of machine learning workflows, the process of bringing AI and ML into production, and future progression with scalable deployment.
ML workflow, AI, production, scalability, future progression
false
Technology and Digital Transformation
Technology & Software
Linear Flow
McKinsey
Add to my slides
Remove from favorites
Outlines ML sub-processes and examples of technology solutions within each stage of the ML workflow.
Technology and Digital Transformation
Technology & Software
Details the noteworthy software solutions that facilitate each stage of the ML workflow from data management to live-model operations.
ML workflow, data management, model development, operations
false
Technology and Digital Transformation
Technology & Software
Linear Flow
McKinsey
Add to my slides
Remove from favorites
Two columns addressing debates: 'Impact of ML industrialization' and 'Selection criteria for solutions that industrialize ML'.
Technology and Digital Transformation
Technology & Software
Covers various debate topics about the impact of ML industrialization on organizations and the criteria for selecting solutions to industrialize ML.
ML, debate, industrialization, selection criteria, organizational impact
false
Technology and Digital Transformation
Technology & Software
Header Vertical
McKinsey
Add to my slides
Remove from favorites
Continuation of the previous slide, with value levers on the left and impact potential within 1 year on the right.
Technology and Digital Transformation
Technology & Software
Discusses the impact of industrializing ML across all industries by detailing specific value levers and expected impact within a year.
ML, impact, value, performance, risk, productivity
false
Technology and Digital Transformation
Technology & Software
Header Vertical
McKinsey
Add to my slides
Remove from favorites
Describes the expected impact of ML industrialization across various sectors, with representative icons for each.
Technology and Digital Transformation
Technology & Software
Explores the potential impact of ML industrialization across a variety of industries and how it could offer competitive advantages.
ML, industries, impact, tech trend, competitive advantage
false
Technology and Digital Transformation
Technology & Software
Header Vertical
McKinsey
Add to my slides
Remove from favorites
Split design detailing the benefits of engaging with ML on the left, and the risks and uncertainties on the right.
Technology and Digital Transformation
Technology & Software
Discusses the advantages and risks involved in ML industrialization, aiming to guide leadership in their strategic decisions.
ML, leadership, benefits, risks, AI adoption
false
Technology and Digital Transformation
Technology & Software
Boxed
McKinsey
Add to my slides
Remove from favorites
Comparison of outdated ML workflow elements on the left ("From") with the new approach on the right ("To").
Technology and Digital Transformation
Technology & Software
Describes the move toward simplicity, scalability, and interoperability in ML workflows, comparing the old and new methods.
ML, technologies, simplicity, scalability, interoperability
false
Technology and Digital Transformation
Technology & Software
Vertical Flow
McKinsey
Add to my slides
Remove from favorites
Two bar charts displaying MMIS spend and cost savings opportunities over fiscal years, with detailed explanatory text boxes. Dense layout.
Regulatory and Compliance
Government & Public Sector
Review of MMIS contract costs and potential cost savings for the state, emphasizing shifting enhancement costs to vendors in future MMIS contracts.
MMIS, Costs, Savings, Fiscal Year, Contract
false
Regulatory and Compliance
Government & Public Sector
Multiple Chart
Alvarez & Marsal
Add to my slides
Remove from favorites
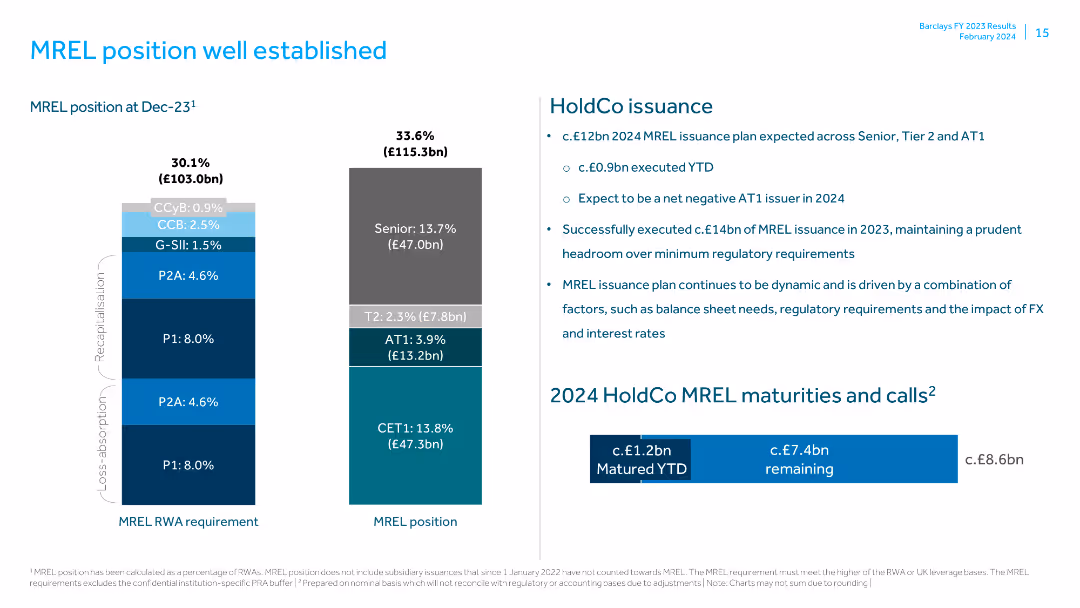
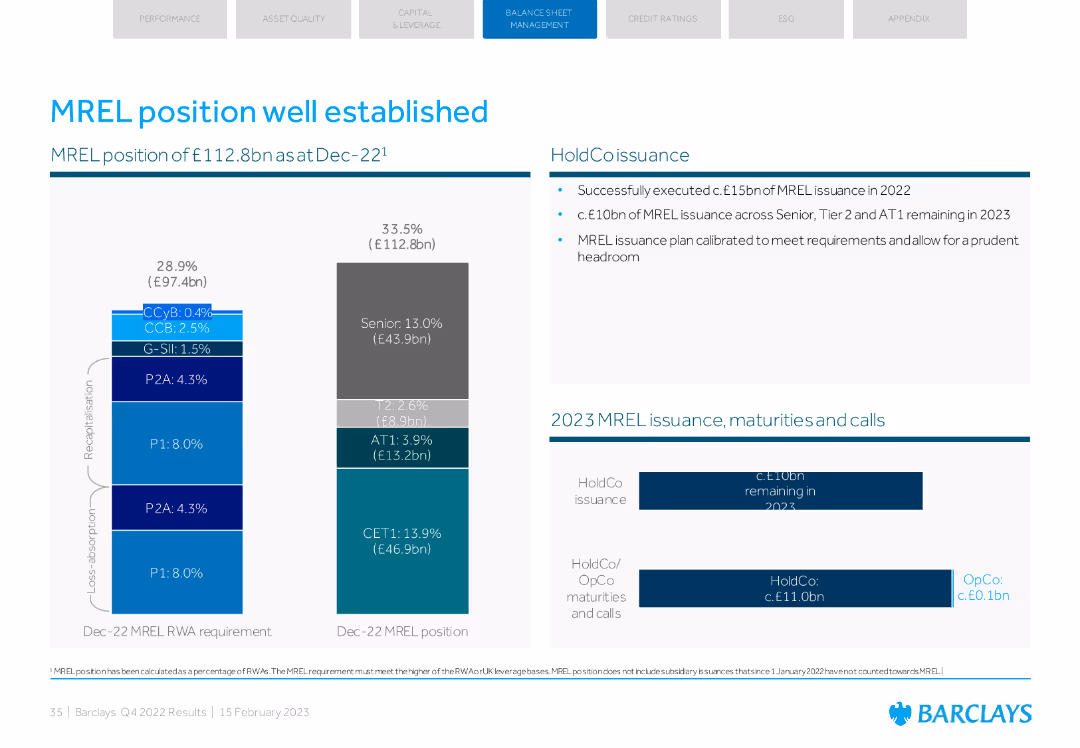
Features a column chart displaying MREL position at Dec-23 and MREL RWA requirement, along with text boxes for HoldCo issuance details.
Risk Assessment and Management
Financial Services
Explains the MREL position and issuance plans, highlighting the successful execution of MREL issuance and its impact on regulatory requirements.
MREL position, HoldCo issuance, regulatory requirements, MREL RWA, senior issuance, Tier 2, AT1, CET1, balance sheet, FX impact
false
Risk Assessment and Management
Financial Services
Multiple Chart
Barclays
Add to my slides
Remove from favorites
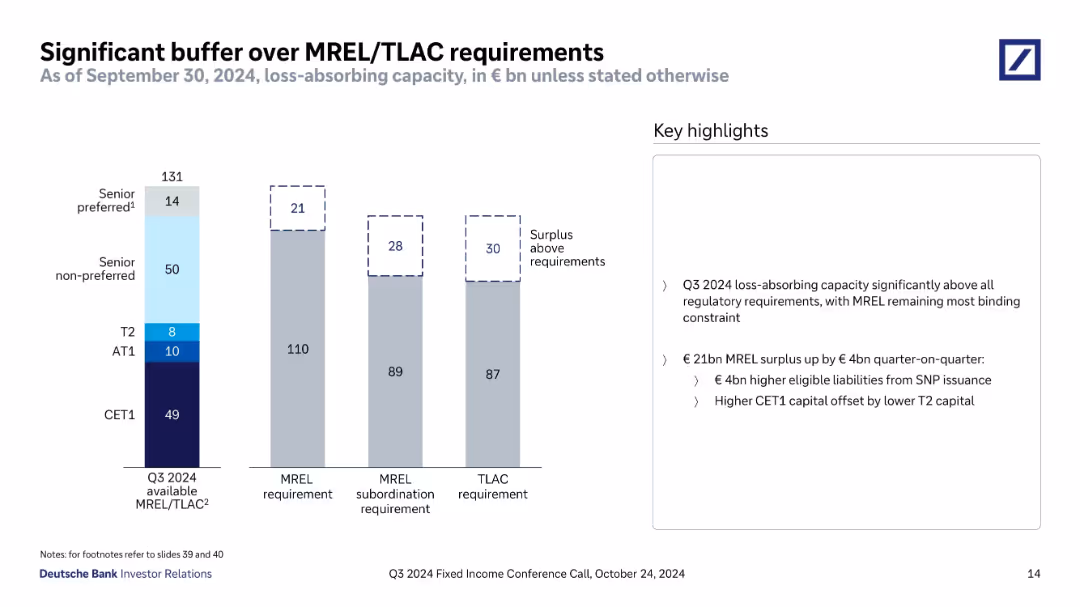
Vertical bar chart comparing Q3 2024 available MREL/TLAC with MREL, subordination, and TLAC requirements; key highlights in a text box to the right.
Regulatory and Compliance
Financial Services
The slide shows Deutsche Bank's substantial capital buffer exceeding MREL and TLAC regulatory requirements as of Q3 2024, highlighting €21bn, €28bn, and €30bn surpluses. It attributes the MREL surplus increase to €4bn from senior non-preferred issuance and offsetting capital shifts.
MREL, TLAC, capital buffer, CET1, regulatory, surplus, Deutsche Bank, Q3 2024
false
Regulatory and Compliance
Financial Services
Mixed Chart
Deutsche Bank
Add to my slides
Remove from favorites
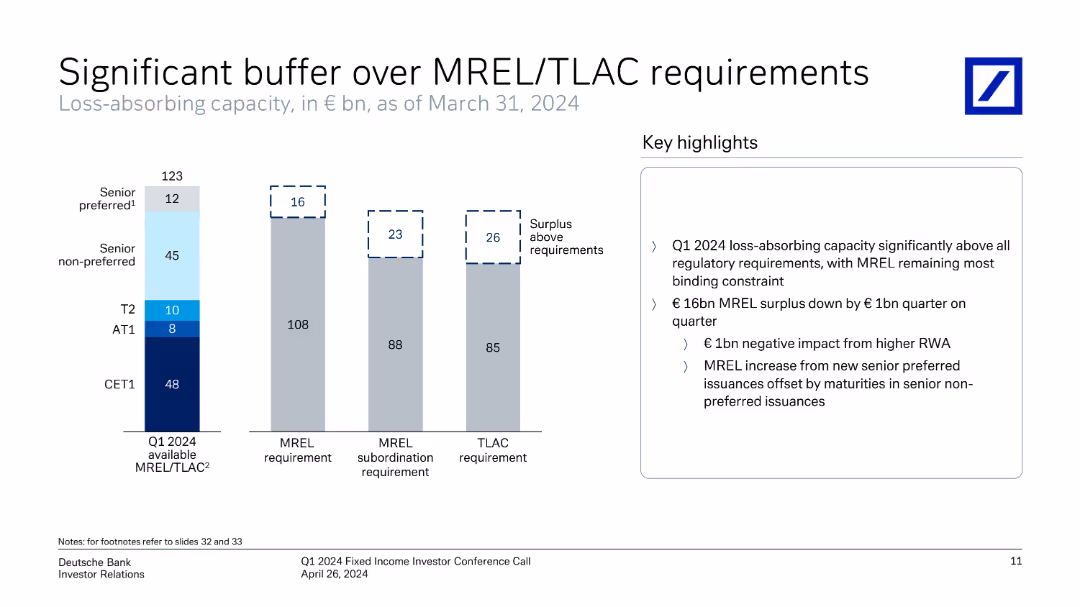
Column chart showing MREL/TLAC requirements vs. available capacity, with key highlights on the right.
Risk Assessment and Management
Financial Services
Shows the loss-absorbing capacity against MREL/TLAC requirements and highlights the surplus above regulatory requirements.
MREL, TLAC, financial regulation, loss-absorbing, capacity, surplus, requirements
false
Risk Assessment and Management
Financial Services
Mixed Chart
Deutsche Bank
Add to my slides
Remove from favorites
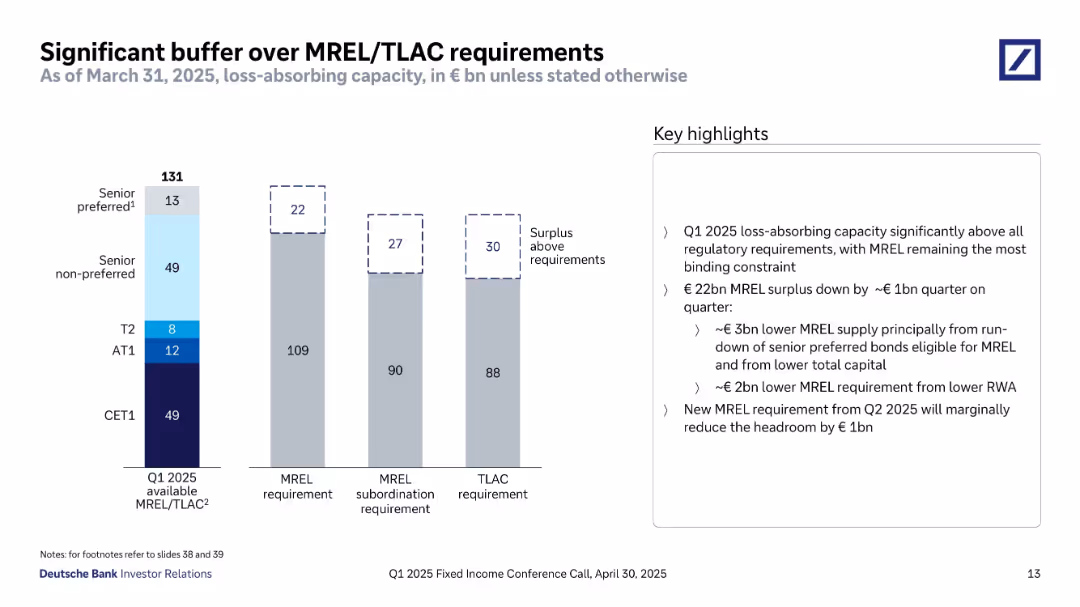
Vertical stacked bar charts compare MREL/TLAC capacity vs requirements. Components include CET1, AT1, T2, senior non-preferred and preferred. Surplus bars are dashed outlines. Key highlights are on the right.
Regulatory and Compliance
Financial Services
This slide emphasizes that Deutsche Bank's MREL and TLAC buffers exceed regulatory requirements by €22–30bn. It breaks down the components of MREL capital and explains the surplus. The highlights cite a €1bn drop in surplus driven by reduced senior preferred supply and lower capital, partly offset by lower requirements. It also previews a potential marginal reduction in headroom due to Q2 2025 changes.
MREL, TLAC, loss-absorbing capacity, capital surplus, CET1, AT1, regulatory buffer, senior debt
false
Regulatory and Compliance
Financial Services
Mixed Chart
Deutsche Bank
Add to my slides
Remove from favorites
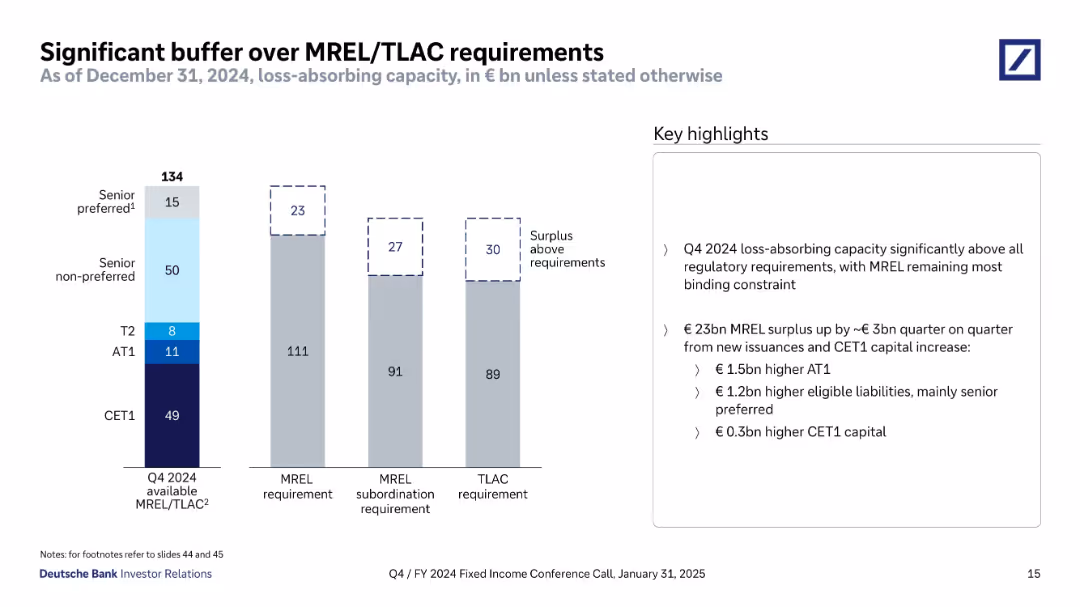
Vertical stacked bar chart comparing available vs. required capital buffers. Uses color-coded segments for different debt instruments. Key highlights are listed on the right in a text box.
Regulatory and Compliance
Financial Services
This slide highlights Deutsche Bank's strong capital position at the end of Q4 2024, with available MREL/TLAC significantly exceeding regulatory requirements. The €23bn surplus results from AT1 and senior preferred issuances. Requirements and subordination buffers are visualized to show surplus against thresholds.
MREL, TLAC, surplus, AT1, CET1, senior preferred, regulatory buffer, Q4 2024, capital instruments
false
Regulatory and Compliance
Financial Services
Mixed Chart
Deutsche Bank
Add to my slides
Remove from favorites
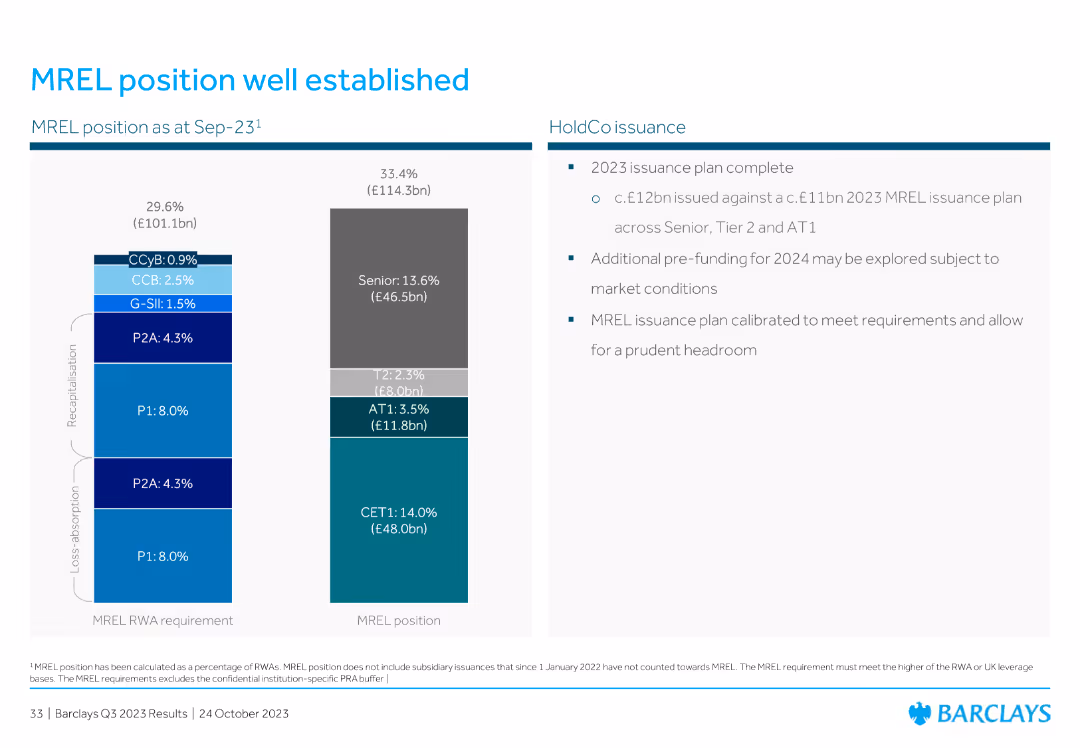
The slide is divided into two sections. The left section has a stacked column chart showing MREL positions with color-coded segments. The right section lists bullet points.
Risk Assessment and Management
Financial Services
This slide explains Barclays' MREL position as of Sep-23, breaking down various capital components and issuance plans for 2023 to ensure compliance with regulatory requirements.
MREL, capital, Barclays, issuance, compliance, regulatory, financial, risk, management
false
Risk Assessment and Management
Financial Services
Multiple Chart
Barclays
Add to my slides
Remove from favorites
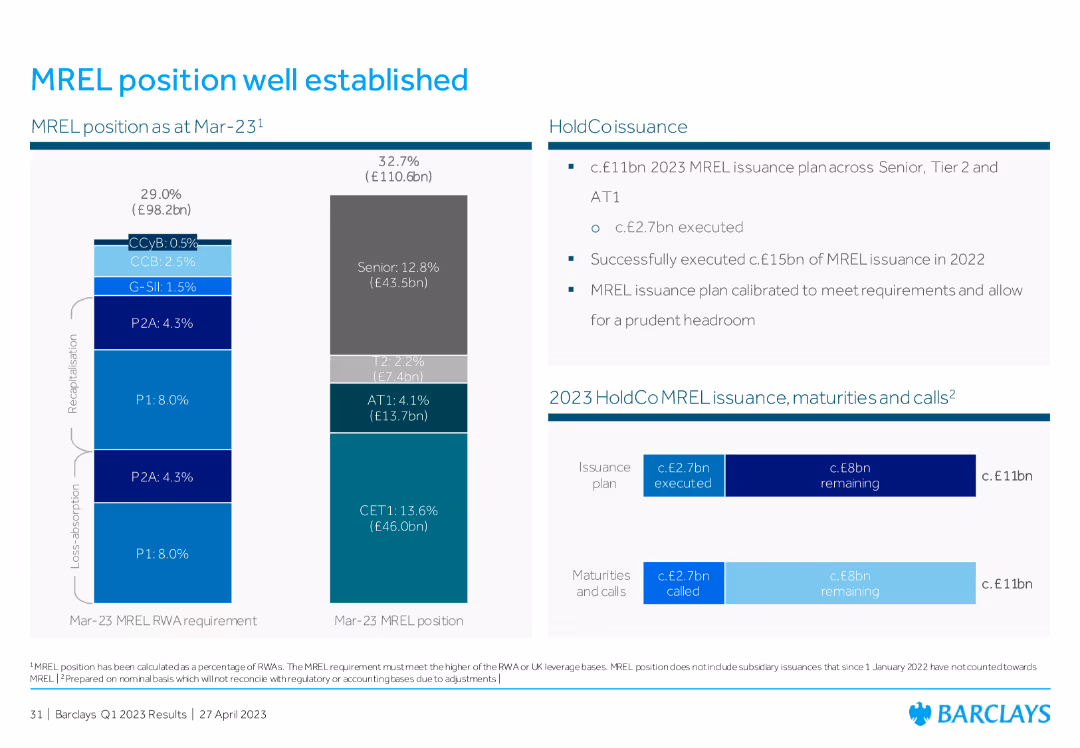
The slide features a bar chart on the left showing the MREL position and requirements, and a table on the right detailing issuance plans, maturities, and calls.
Risk Assessment and Management
Financial Services
This slide outlines the MREL (Minimum Requirement for own funds and Eligible Liabilities) position as of March 2023, highlighting the capital issuance plan and the status of MREL compliance.
MREL, issuance, compliance, risk management, capital
false
Risk Assessment and Management
Financial Services
Multiple Chart
Barclays
Add to my slides
Remove from favorites
Column charts showing MREL RWA requirement and MREL position, along with text on issuance and maturities.
Risk Assessment and Management
Financial Services
Explains the MREL position and requirements, including the issuance plan for 2023. Highlights senior, Tier 2, and AT1 components.
MREL, position, issuance, Tier 2, AT1
false
Risk Assessment and Management
Financial Services
Multiple Chart
Barclays
Add to my slides
Remove from favorites
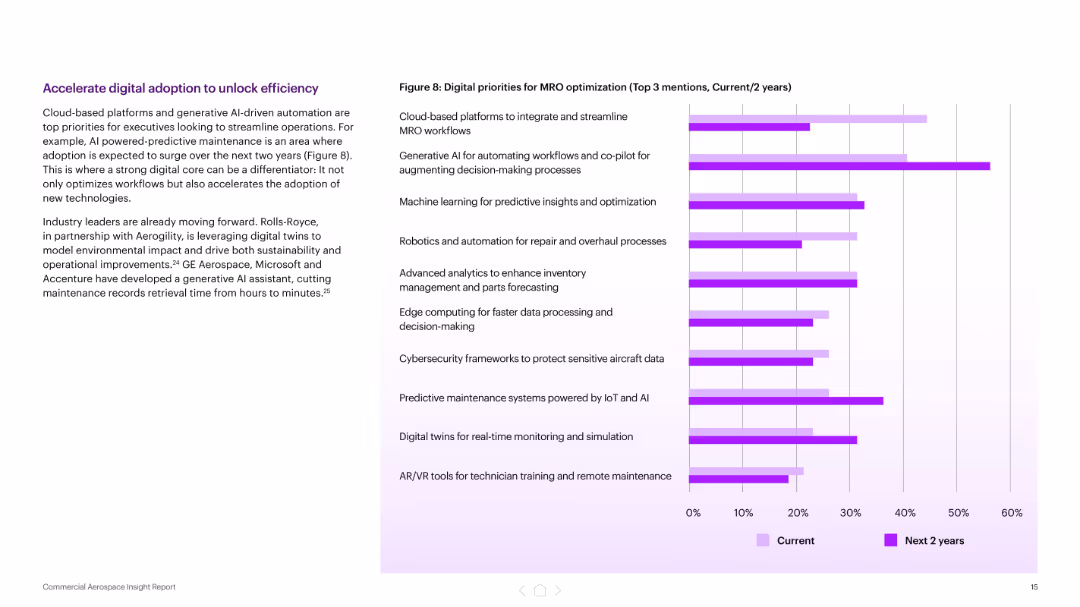
Left-aligned text block with a title and paragraph, right side features a horizontal bar chart comparing current vs. 2-year digital priorities for MRO. Purple theme with gradient bars.
Technology and Digital Transformation
Industrial & Manufacturing
The slide outlines top digital priorities for MRO optimization, emphasizing cloud platforms, AI, and predictive technologies. It highlights the shift toward generative AI and automation to streamline operations, with examples from Rolls-Royce, GE Aerospace, Microsoft, and Accenture.
MRO, digital adoption, AI, predictive maintenance, cloud platforms, generative AI, workflow automation, aerospace, digital transformation
false
Technology and Digital Transformation
Industrial & Manufacturing
Mixed Chart
Accenture
Add to my slides
Remove from favorites
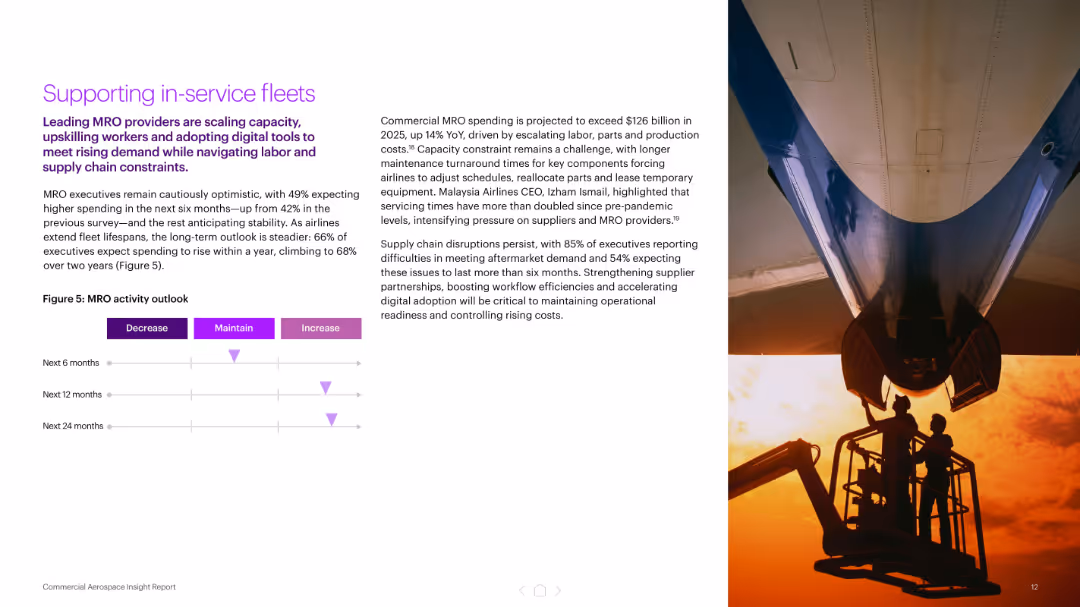
Split layout: left text with MRO forecast chart; right has photo of aircraft being serviced
Operational Efficiency
Industrial & Manufacturing
This slide outlines the challenges and expected increase in MRO (maintenance, repair, overhaul) spending, projecting a 14% YoY rise in 2025. It highlights executive expectations, supply chain constraints, and the need for digital tools and workforce expansion to maintain fleet readiness.
MRO, maintenance, spending, supply chain, capacity, aircraft, workforce, digital tools
false
Operational Efficiency
Industrial & Manufacturing
Mixed Chart
Accenture
Add to my slides
Remove from favorites
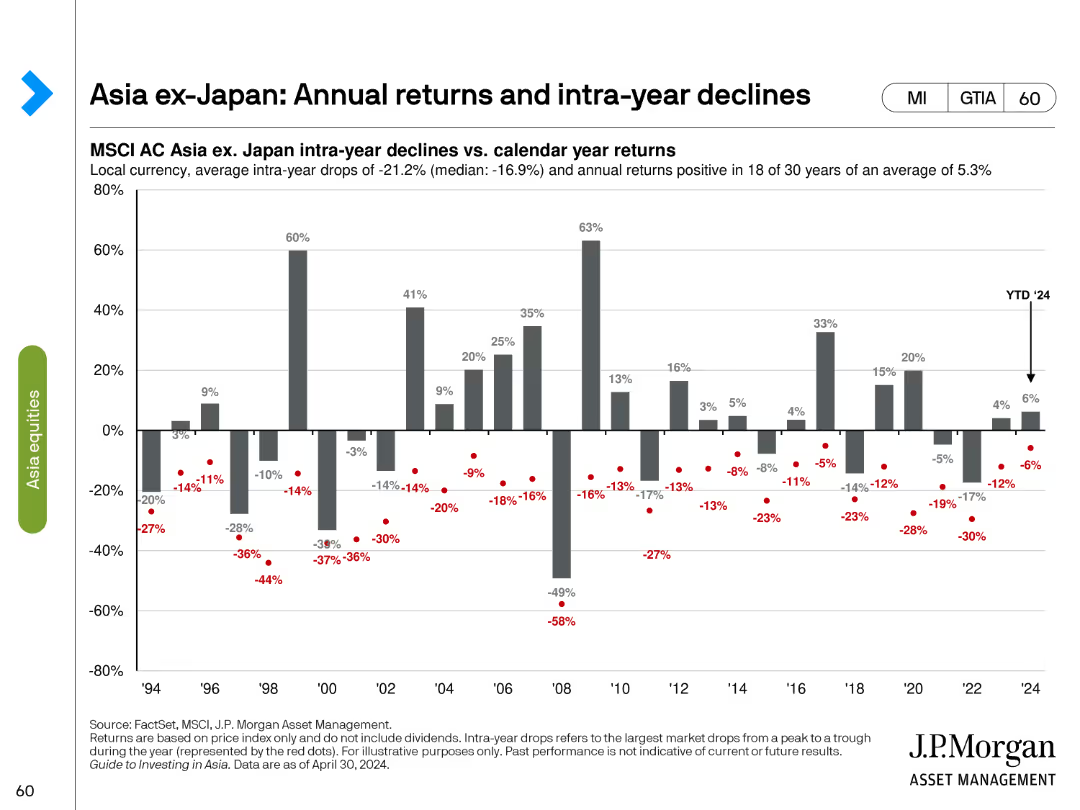
This slide contains a column chart showing annual returns and intra-year declines for MSCI AC Asia ex-Japan index. The bars represent annual returns while red dots show the intra-year declines.
Market Analysis and Trends
Financial Services
The slide illustrates the annual performance of the MSCI AC Asia ex-Japan index from 1994 to 2024, highlighting the average intra-year drops and annual returns to provide a historical perspective of market volatility and recovery trends.
MSCI AC Asia, annual returns, intra-year, financial services, market analysis, volatility, recovery, historical trends, 1994-2024, investment analysis
false
Market Analysis and Trends
Financial Services
Single Chart
JP Morgan
Add to my slides
Remove from favorites
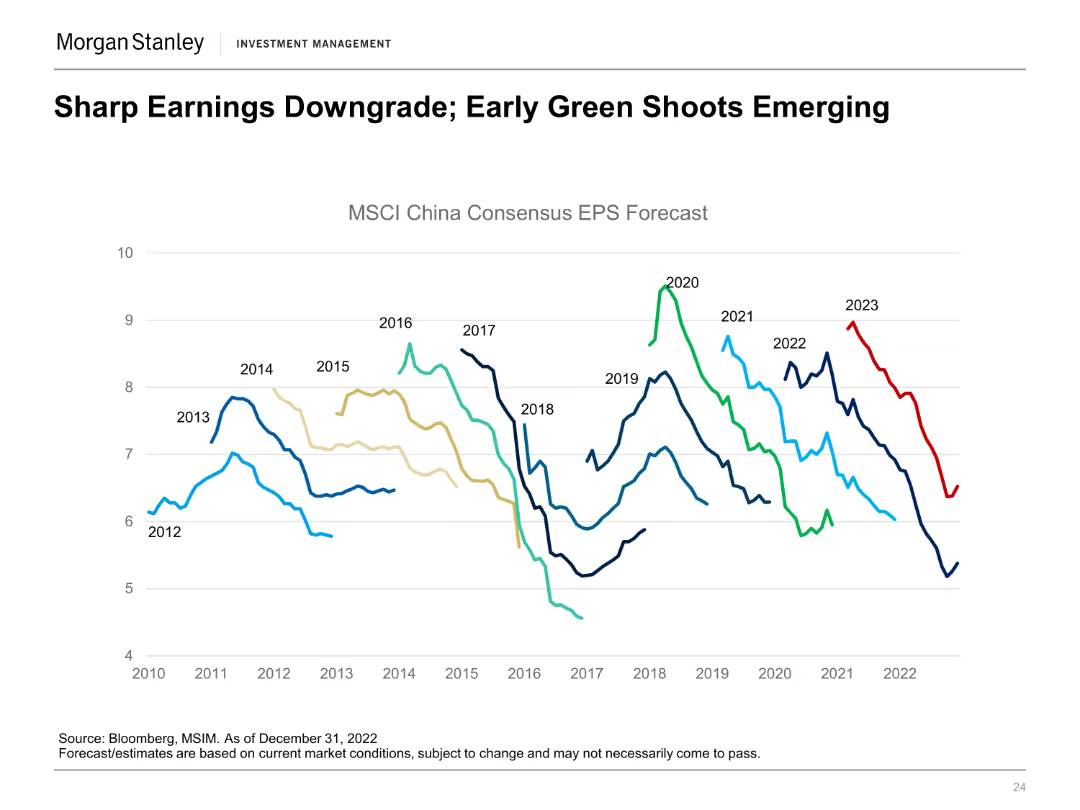
A line chart showing the MSCI China Consensus EPS Forecast from 2012 to 2023 with different colored lines representing each year's forecast.
Market Analysis and Trends
Financial Services
The slide highlights the downgrading of earnings forecasts for MSCI China while identifying early signs of recovery, projecting future trends.
MSCI China, EPS Forecast, Earnings, Downgrade, Recovery
false
Market Analysis and Trends
Financial Services
Single Chart
Morgan Stanley
Add to my slides
Remove from favorites
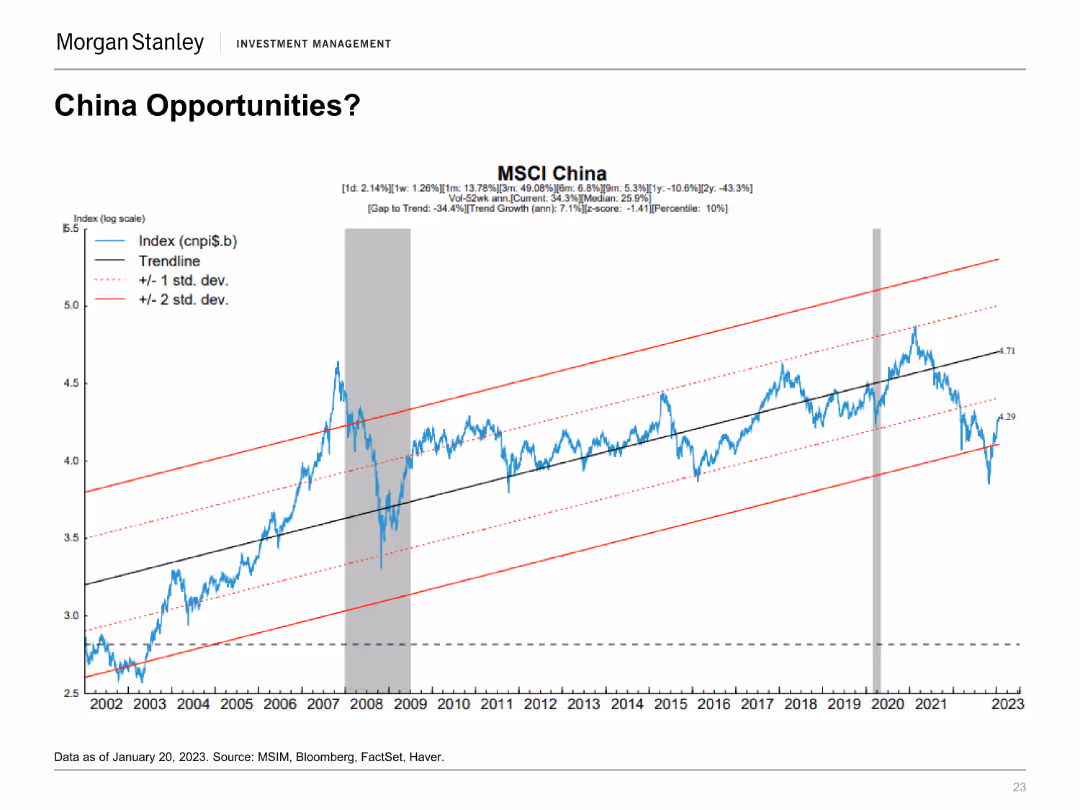
A line chart on a log scale showing the MSCI China Index with trendlines and standard deviation bands from 2002 to 2023.
Market Analysis and Trends
Financial Services
The slide examines investment opportunities in China by analyzing the MSCI China Index's performance and potential trend growth, indicating investment prospects.
MSCI China, Investment, Trends, Opportunities, Index
false
Market Analysis and Trends
Financial Services
Single Chart
Morgan Stanley
Add to my slides
Remove from favorites
The slide includes two visual elements: the left chart shows MSCI Europe ex-UK earnings and performance, and the right chart shows earnings per share growth across various metrics.
Financial Performance
Financial Services
The slide examines European earnings by analyzing the performance of MSCI Europe ex-UK and tracking earnings per share growth in different regions.
MSCI Europe, earnings, performance, Europe ex-UK, earnings growth, financial performance
false
Financial Performance
Financial Services
Multiple Chart
JP Morgan
Add to my slides
Remove from favorites
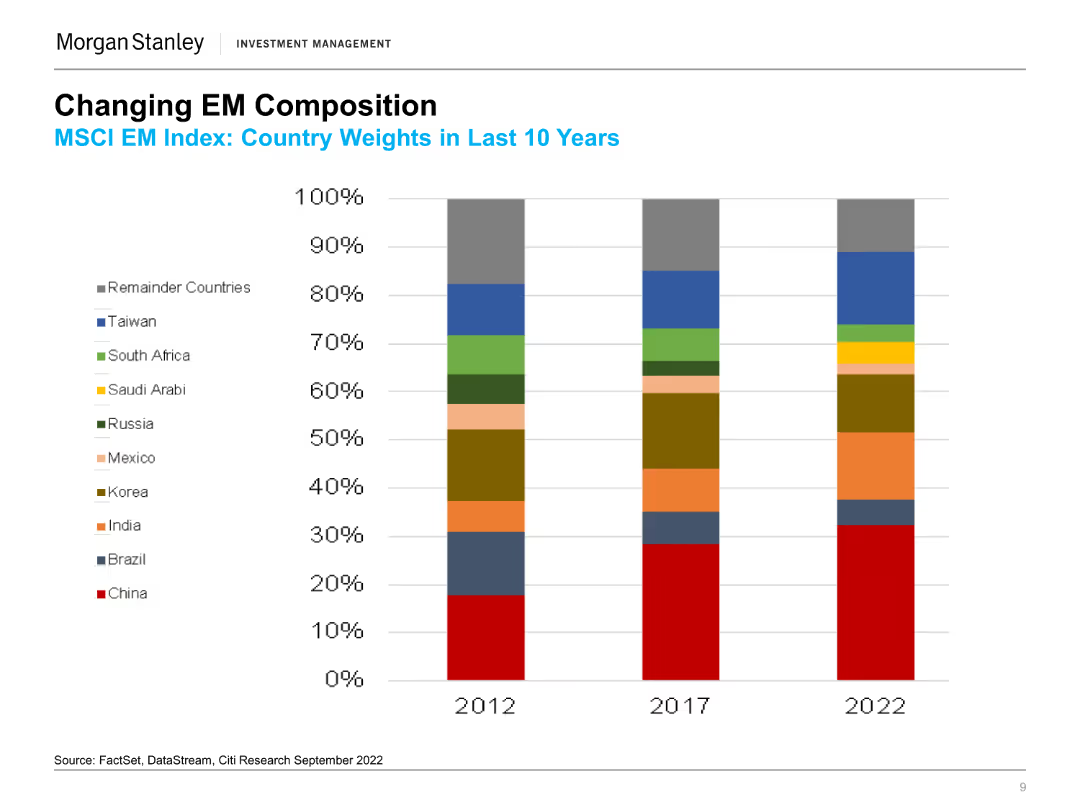
The slide features a stacked column chart comparing the country weights in the MSCI EM Index for the years 2012, 2017, and 2022, with various colors representing different countries.
Market Analysis and Trends
Financial Services
This slide examines how the country weights in the MSCI EM Index have evolved over the last 10 years, focusing on the proportion of different emerging markets.
MSCI, EM Index, Country Weights, China, India, Brazil, Market Trends, Country Comparison, Emerging Markets, Weight Distribution, Regional Analysis
false
Market Analysis and Trends
Financial Services
Single Chart
Morgan Stanley
Add to my slides
Remove from favorites
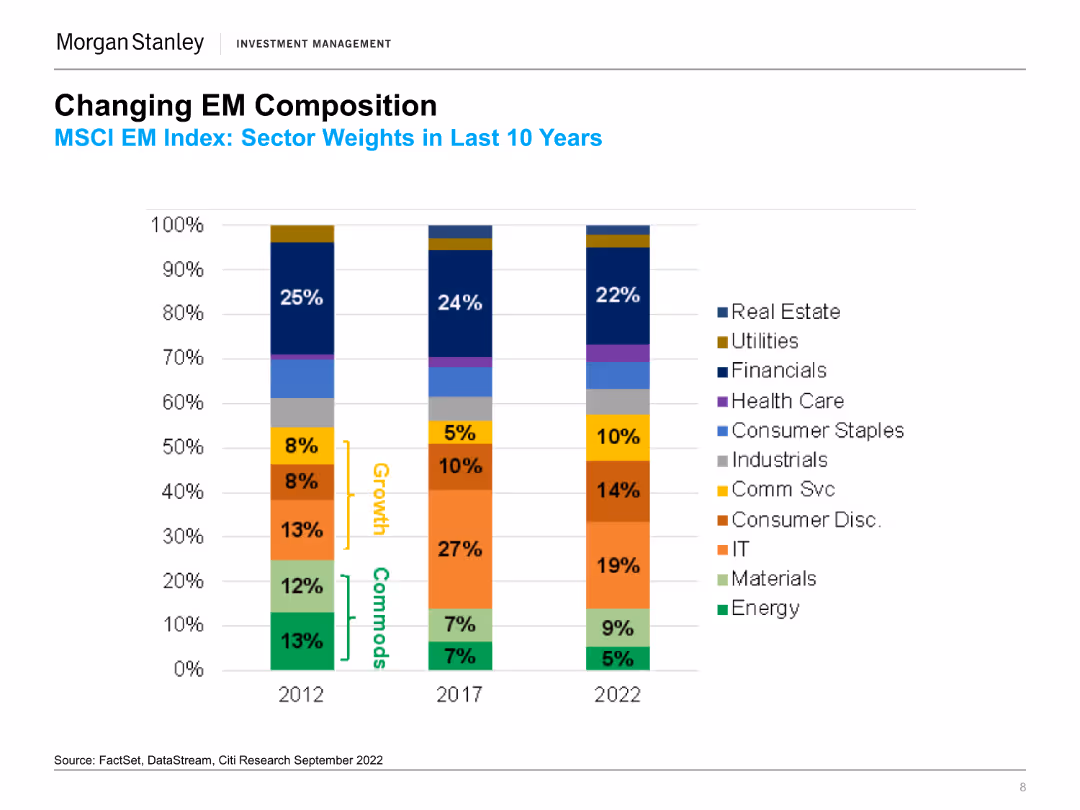
The slide presents a column chart displaying the MSCI EM Index sector weights over the last 10 years (2012, 2017, 2022). Each column is color-coded to represent different sectors.
Market Analysis and Trends
Financial Services
This slide shows the changes in sector weights within the MSCI EM Index over a decade, highlighting shifts in sectors like Financials, IT, and Consumer sectors.
MSCI, EM Index, Sector Weights, Financials, IT, Consumer Staples, Market Trends, Sector Growth, Commodities, Sector Comparison, Equity Returns
false
Market Analysis and Trends
Financial Services
Single Chart
Morgan Stanley
Add to my slides
Remove from favorites
The slide contains four column charts comparing MSCI World and Net IRR across different investment types: Corporate Equity, Corporate Credit, Real Estate, and Open Architecture Private Assets. Each chart has two vertical bars with percentages, against a white and blue background.
Financial Performance
Financial Services
The slide presents a performance comparison of various investment types, highlighting their long-term track record and returns. This can be used for illustrating investment opportunities and analyzing alternative asset management strategies.
MSCI, IRR, Corporate Equity, Real Estate, Performance
false
Financial Performance
Financial Services
Multiple Chart
Goldman Sachs
Add to my slides
Remove from favorites
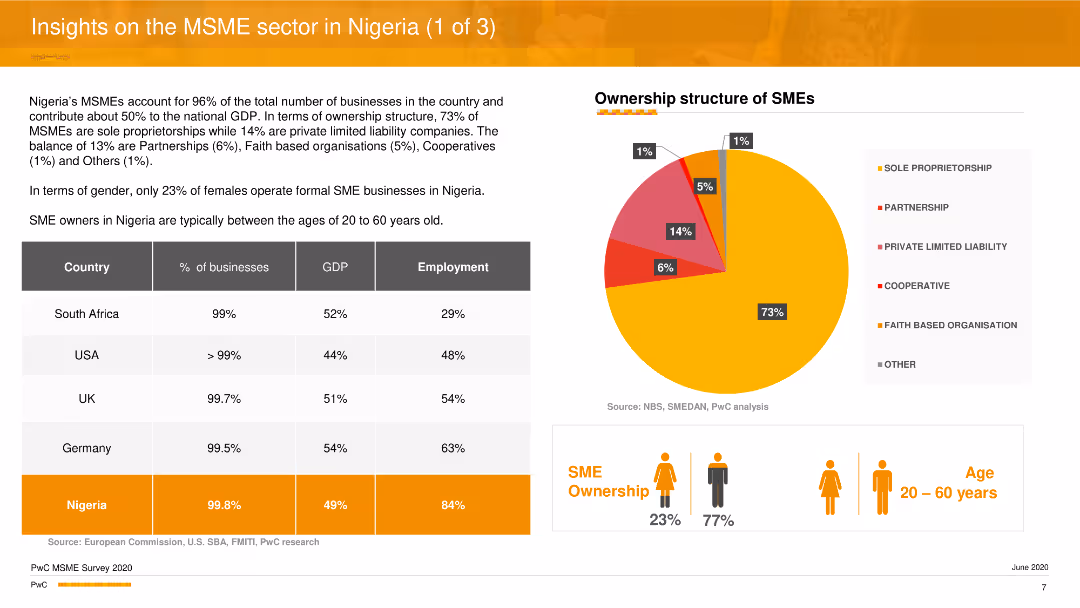
The slide features a pie chart showing the ownership structure of MSMEs in Nigeria, and a comparative table listing statistics on MSMEs in Nigeria versus other countries. Additional icons and text summarize key insights about gender distribution and age demographics of SME owners.
Industry Overview
Professional Services
The slide provides an overview of the MSME sector in Nigeria, highlighting the ownership structure, gender distribution, and age demographics of SME owners. It compares Nigerian MSMEs with those in other countries and discusses their contribution to the economy in terms of GDP and employment.
MSME sector, Nigeria, ownership structure, gender distribution, economic contribution
false
Industry Overview
Professional Services
Mixed Chart
PwC/Strategy&
Add to my slides
Remove from favorites
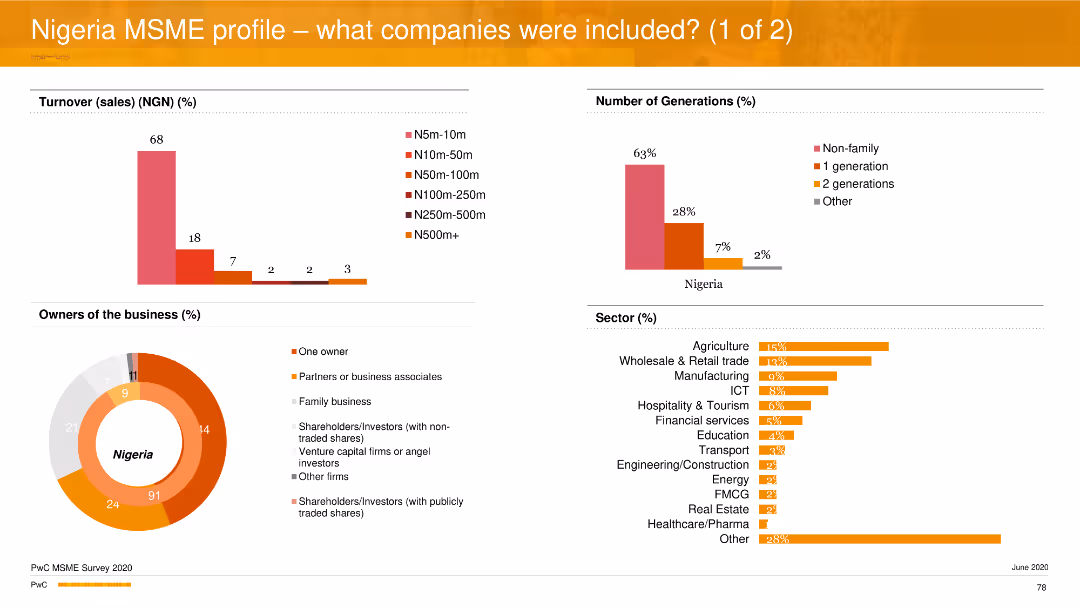
The slide contains multiple column charts and a pie chart to represent various data points about MSMEs in Nigeria. The color scheme is orange, red, and gray, with minimal text.
Market Analysis and Trends
Financial Services
The slide provides an analysis of the Nigerian MSME sector, including turnover, ownership, generations involved in business, and sector distribution.
MSME, Nigeria, turnover, ownership, sectors
false
Market Analysis and Trends
Financial Services
Multiple Chart
PwC/Strategy&
Add to my slides
Remove from favorites
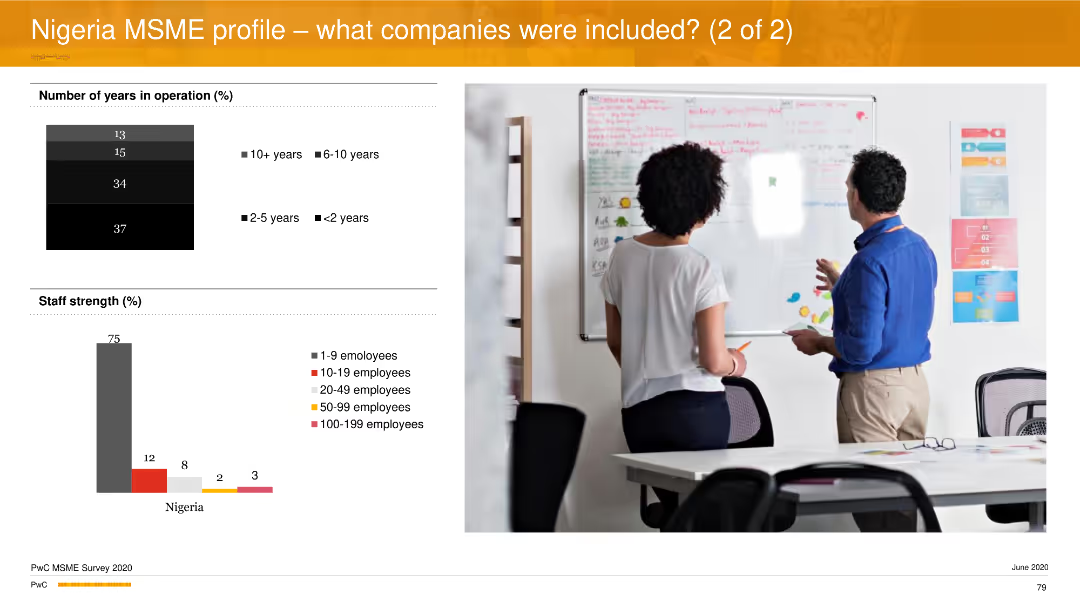
The slide includes a column chart and a pictorial image. The column chart shows the number of years in operation and staff strength percentages. The image depicts two people working on a whiteboard.
Market Analysis and Trends
Financial Services
This slide gives further insights into the Nigerian MSME sector, focusing on the number of years in operation and the distribution of staff strength across different sizes of businesses.
MSME, Nigeria, years in operation, staff strength, businesses
false
Market Analysis and Trends
Financial Services
Multiple Chart
PwC/Strategy&
Add to my slides
Remove from favorites
This comparative slide features a bar chart that contrasts active and passive business activities among Indonesian MSMEs.
Operational Efficiency
Financial Services
The slide compares active versus passive business activity levels among MSMEs, suggesting underutilization of potential in the Indonesian market. It could serve to examine strategies to activate MSMEs' full capabilities and encourage more dynamic engagement in business practices.
MSMEs, Business Activities, Market Potential, Engagement Strategy, Indonesia
false
Operational Efficiency
Financial Services
Single Chart
Kearney
Add to my slides
Remove from favorites
Slide displays doughnut charts representing the adoption of online business activities by MSMEs, with percentages and a descriptive sidebar.
Operational Efficiency
Financial Services
The slide quantifies the adoption of online methods in business practices among MSMEs, indicating minimal digital engagement even among active businesses. The visual data supports discussion on the need for digital onboarding to enhance operational efficiency within the sector.
MSMEs, Digital Adoption, Online Activities, Business Practices, Efficiency, Engagement
false
Operational Efficiency
Financial Services
Multiple Chart
Kearney
Add to my slides
Remove from favorites
Previous
Next
You don't have any favorites yet.
Please wait loading your favorites slides...
Create a FREE account to continue browsing
Receive Instant Access to 1,000+ slides from companies like McKinsey, Google, and Goldman Sachs
First Name
Last Name
Email
Password
I agree to all
Terms & Privacy Policy
Thank you! Your submission has been received!
Oops! Something went wrong while submitting the form.
Have an account?
Sign in
Upgrade to PRO to Save slides
Advanced Search and Filters
Access to 15,000+ slides
Access to Category Pages
Save/Bookmark Slides
PowerPoint Template Library
Pick a Plan
MONTHLY
$12/month
Billed every month, Cancel anytime.
YEARLY
$9/year
Billed $108 annually, Cancel anytime.
Checkout for $12/month
Checkout for $108/yr
Secured by Stripe | AES-256 bit encryption