My Account
My Slides
Search by Category
Pricing
Templates
View All Templates
Download Template Slides
✦ AI Search
Feedback
Login
Logout
Get Started
Browse all Slides
Browse all Slides
Create a FREE Account
Instant access to 1,000+ real slides from top companies like McKinsey, BCG, Goldman Sachs, Google and many more!
First Name
Last Name
Email
Password
I agree to all
Terms & Privacy Policy
Thank you! Your submission has been received!
Oops! Something went wrong while submitting the form.
Have an account?
Sign in
Saved Slides
Total No. of slides saved
0
↻ Refresh
✖ Clear all
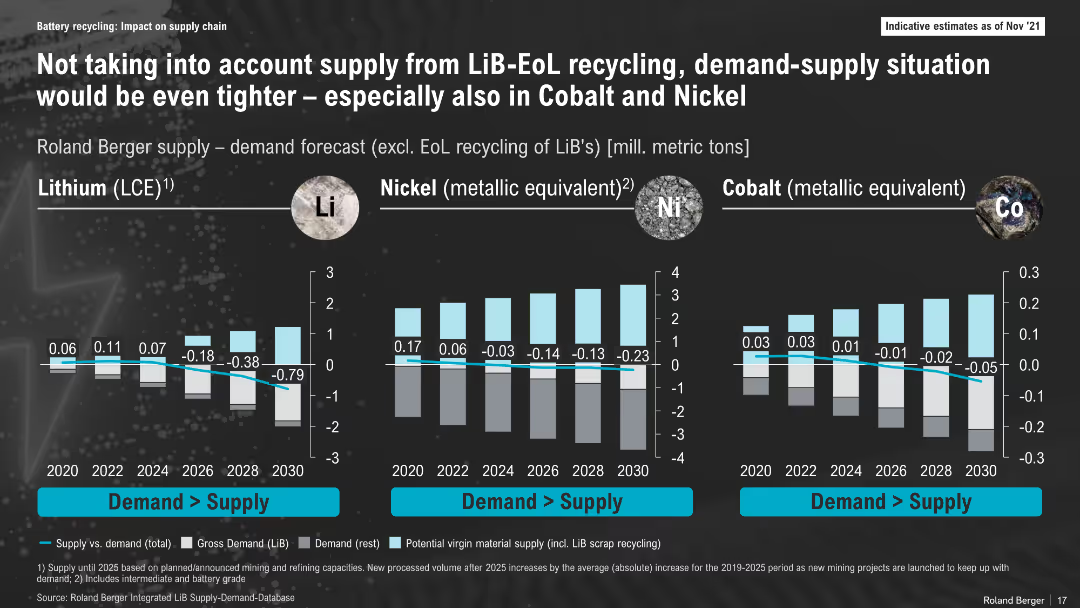
Bar chart layout comparing lithium, nickel, and cobalt supply-demand gaps over time (2020–2030); dark background, labeled vertical axes, colored bars and annotations for deficits
Risk Assessment and Management
Energy & Utilities
This slide illustrates projected shortfalls in lithium, nickel, and cobalt supply versus demand, excluding End-of-Life (EoL) recycling. It highlights a worsening deficit, particularly for lithium, emphasizing the importance of integrating recycling into future supply models.
Lithium, Nickel, Cobalt, Supply Gap, Forecast, Battery Materials, 2030, Mining, Recycling, Shortfall
false
Risk Assessment and Management
Energy & Utilities
Multiple Chart
Roland Berger
Add to my slides
Remove from favorites
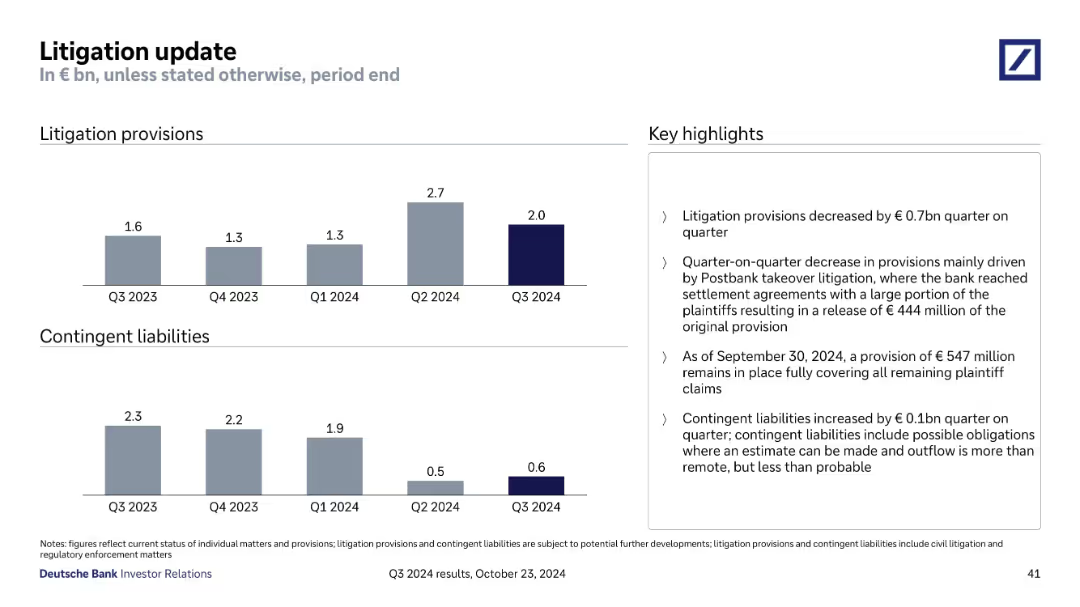
Two bar charts showing litigation provisions and contingent liabilities over time, with highlights explaining changes.
Regulatory and Compliance
Financial Services
Tracks litigation provisions and contingent liabilities from Q3 2023 to Q3 2024. Notes Q2 2024 spike and Q3 reduction driven by Postbank litigation settlement. Indicates €547m provision remains for outstanding claims and slight increase in contingent liabilities.
Litigation, Provisions, Contingent Liabilities, Postbank, Legal Risk
false
Regulatory and Compliance
Financial Services
Multiple Chart
Deutsche Bank
Add to my slides
Remove from favorites
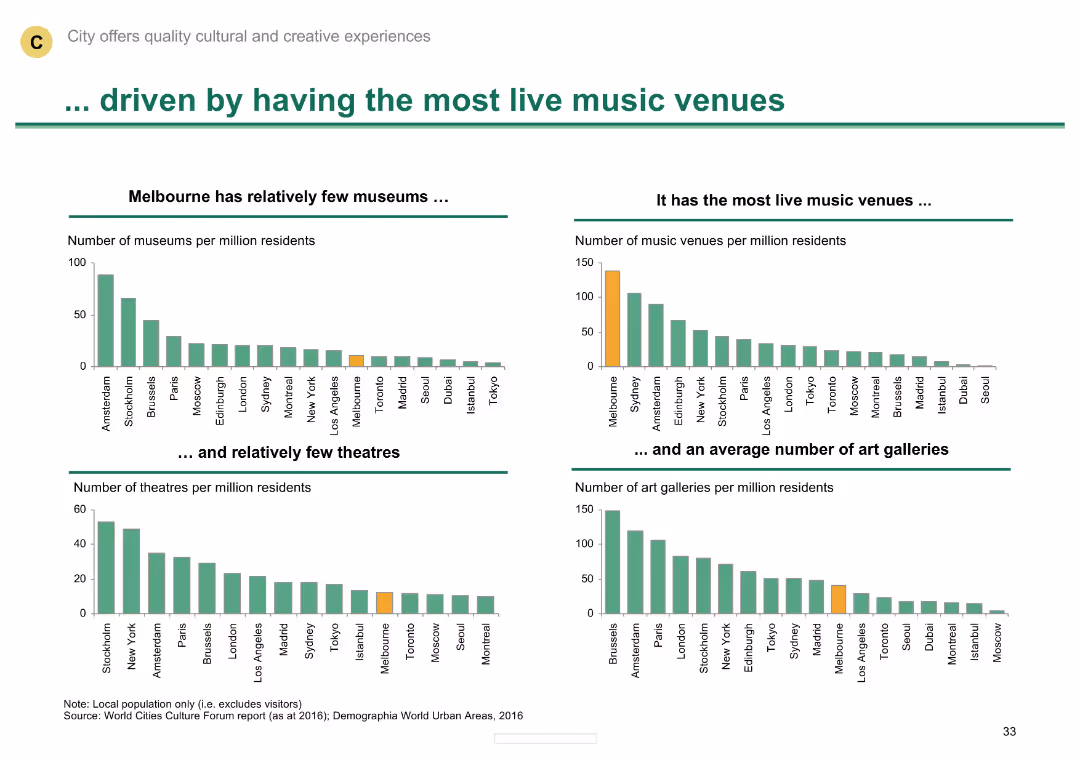
Multiple column charts comparing the number of museums, music venues, theatres, and art galleries
Market Analysis and Trends
Media & Entertainment
Shows Melbourne's leadership in live music venues and its relatively average number of theatres and galleries.
Live music venues, museums, theatres, art galleries, Melbourne
false
Market Analysis and Trends
Media & Entertainment
Multiple Chart
BCG
Add to my slides
Remove from favorites
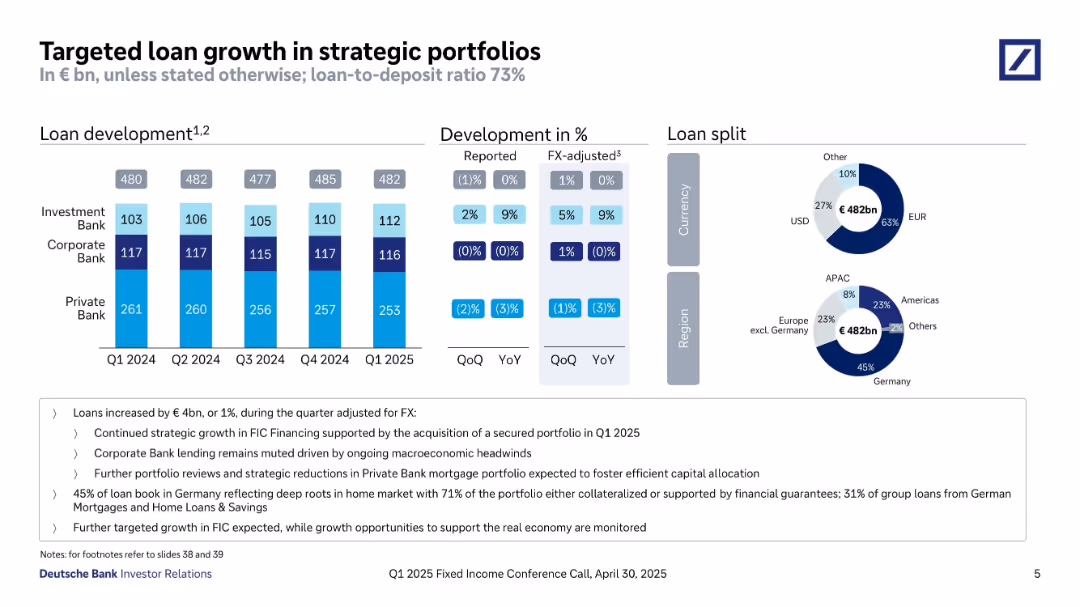
Stacked bar chart for loan development, side tables for % change, donut charts showing loan split by currency and region, and bullet point text.
Strategic Planning
Financial Services
Focuses on loan portfolio growth to €482bn in Q1 2025, with regional and currency split insights. Highlights growth in Investment Bank lending and regional concentration in Germany. Strategy emphasizes capital allocation and risk-adjusted growth.
Loan Growth, Strategic Portfolios, Currency Split, Regional Allocation, Investment Bank, FX-adjusted, Q1 2025
false
Strategic Planning
Financial Services
Multiple Chart
Deutsche Bank
Add to my slides
Remove from favorites
Uses a pie chart to display the composition of a loan book across different banking divisions and sectors.
Investment Analysis
Financial Services
Presenting a comprehensive view of the loan book composition, this slide is instrumental for investors and financial analysts. It breaks down the portfolio by sectors such as residential mortgages and corporate banking, providing insights into risk diversification, loan exposure, and strategic investment opportunities within the banking industry.
Loan Portfolio, Banking, Investment Analysis, Risk Diversification, Sector Breakdown
false
Investment Analysis
Financial Services
Mixed Chart
Deutsche Bank
Add to my slides
Remove from favorites
This slide contains four pie charts displaying loan portfolio characteristics and a section titled 'High Quality Private Education Loan Portfolio' with a descriptive text box.
Financial Performance
Financial Services
The slide presents characteristics of a private education loan portfolio, highlighting credit quality and payment types. It's useful for investors and analysts assessing loan portfolio health and risk profile.
Loan Portfolio, Education, Financial Quality, FICO Scores, Interest Rates, Payment Types, Credit
false
Financial Performance
Financial Services
Multiple Chart
Morgan Stanley
Add to my slides
Remove from favorites
This slide presents two column charts, one for average commercial and industrial loans and the other for average commercial real estate loans, with supporting text below. The design is straightforward and data-centric.
Financial Performance
Financial Services
Highlighting the quality and growth of loan portfolios, the slide presents data on commercial and industrial loans and commercial real estate loans, indicating a conservative approach to credit and a leadership position in the middle market lending space.
Loan portfolio, credit quality, market lending, commercial real estate
false
Financial Performance
Financial Services
Multiple Chart
JP Morgan
Add to my slides
Remove from favorites
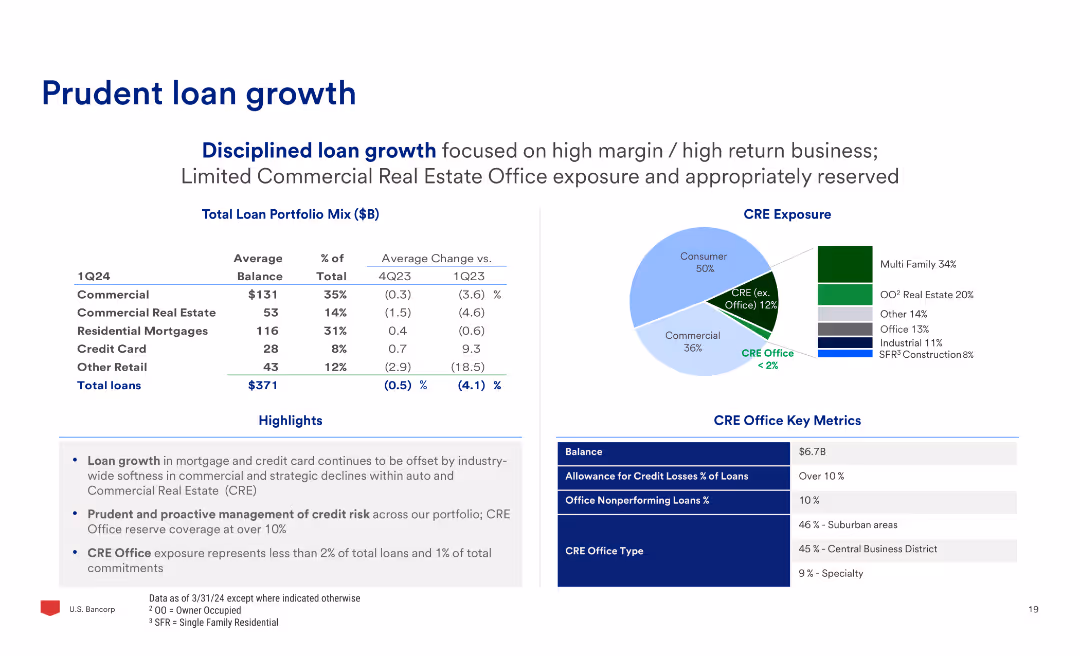
The slide features a table with loan portfolio mix and average changes, a pie chart of CRE exposure, and text highlights on loan growth and credit risk management.
Financial Performance
Financial Services
The slide discusses prudent loan growth, focusing on high-margin business, limited CRE office exposure, and proactive credit risk management, with detailed data on loan portfolio changes.
Loan, Growth, Portfolio, CRE, Risk, Management
false
Financial Performance
Financial Services
Multiple Chart
Barclays
Add to my slides
Remove from favorites
The slide contains a combination of column charts and text blocks. It shows the distribution of loans and advances to customers, both on and off-balance sheet.
Financial Performance
Financial Services
This slide provides a detailed breakdown of loans and advances to customers, including mortgages, Lombard loans, and corporate loans, essential for analyzing loan portfolio quality.
Loans, Advances, Customers, Mortgages, Lombard
false
Financial Performance
Financial Services
Multiple Chart
UBS
Add to my slides
Remove from favorites
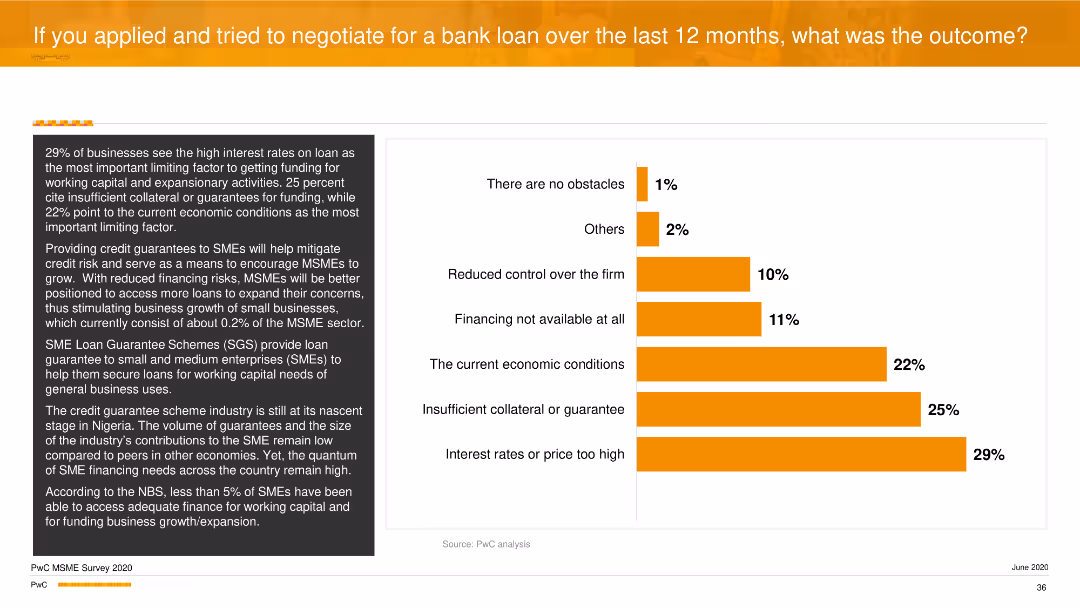
A vertical column chart detailing limiting factors in obtaining loans, such as high interest rates and insufficient collateral. Text on the left elaborates these factors.
Risk Assessment and Management
Financial Services
The slide focuses on the barriers to securing bank loans, emphasizing high interest rates and insufficient collateral as major obstacles. It discusses the potential impact of credit guarantee schemes on improving access to finance for SMEs.
Loans, Barriers, Financing, SMEs, PwC
false
Risk Assessment and Management
Financial Services
Mixed Chart
PwC/Strategy&
Add to my slides
Remove from favorites
Contains column charts and tables showing trends in loan and deposit figures over several quarters.
Financial Performance
Financial Services
This slide tracks the development of loans and deposits across various banking divisions, highlighting trends and changes. It is crucial for financial strategists and banking executives to assess liquidity management, lending practices, and deposit accumulation, enabling data-driven decision-making for operational and strategic initiatives in the banking sector.
Loans, Deposits, Banking Trends, Financial Analysis, Liquidity Management
false
Financial Performance
Financial Services
Multiple Chart
Deutsche Bank
Add to my slides
Remove from favorites
Large column charts comparing the trends in average loans and retail deposits over several quarters.
Financial Performance
Financial Services
Analyzes the growth trends in loans and deposits, emphasizing their impact on financial stability and funding strategies.
Loans, Deposits, Growth, Finance
false
Financial Performance
Financial Services
Multiple Chart
Barclays
Add to my slides
Remove from favorites
This slide presents multiple column charts and tables detailing loans by segment and type, with a key highlights section on the right. The design is moderate, with clear visual divisions between sections.
Financial Performance
Financial Services
Provides a breakdown of loans and net interest income across business segments. Typically used in risk assessments, financial analysis, and investor briefings to illustrate credit distribution and interest income dynamics.
Loans, Net Interest Income, Global Banking, Asset Management
false
Financial Performance
Financial Services
Multiple Chart
Goldman Sachs
Add to my slides
Remove from favorites
Slide displays column charts for 'Loans by Segment' and 'Net Interest Income by Segment', as well as a table detailing loan types with corresponding metrics.
Financial Performance
Financial Services
This slide examines the distribution and performance of loans across different segments, including the net interest income, to provide insights on the financial health and lending effectiveness of the organization.
Loans, Net Interest Income, Segment Distribution, Corporate Lending, Securities-based Lending, Loan Performance, Interest Metrics
false
Financial Performance
Financial Services
Multiple Chart
Goldman Sachs
Add to my slides
Remove from favorites
Slide contains two column charts, two detailed tables, and accompanying explanatory text.
Financial Performance
Financial Services
Details loans and net interest income across business segments, used for financial analysis or to inform investment decisions.
Loans, Net Interest, Income Analysis, Banking
false
Financial Performance
Financial Services
Multiple Chart
Goldman Sachs
Add to my slides
Remove from favorites
Donut chart showing the breakdown of loans and advances by type, with details on mortgages, lombard, corporates, and other categories.
Financial Performance
Financial Services
Overview of UBS's loan portfolio quality, detailing various loan categories and highlighting the composition and collateral.
Loans, portfolio, mortgages, lombard, corporates
false
Financial Performance
Financial Services
Mixed Chart
UBS
Add to my slides
Remove from favorites
A column chart comparing revenue growth of local versus multinational companies from 2012 to 2021.
Competitive Landscape
Professional Services
Discusses the rising market share of local companies in various industries and their competitive strategies against multinationals.
Local competition, market share, industry growth, competitive strategies
false
Competitive Landscape
Professional Services
Mixed Chart
Accenture
Add to my slides
Remove from favorites
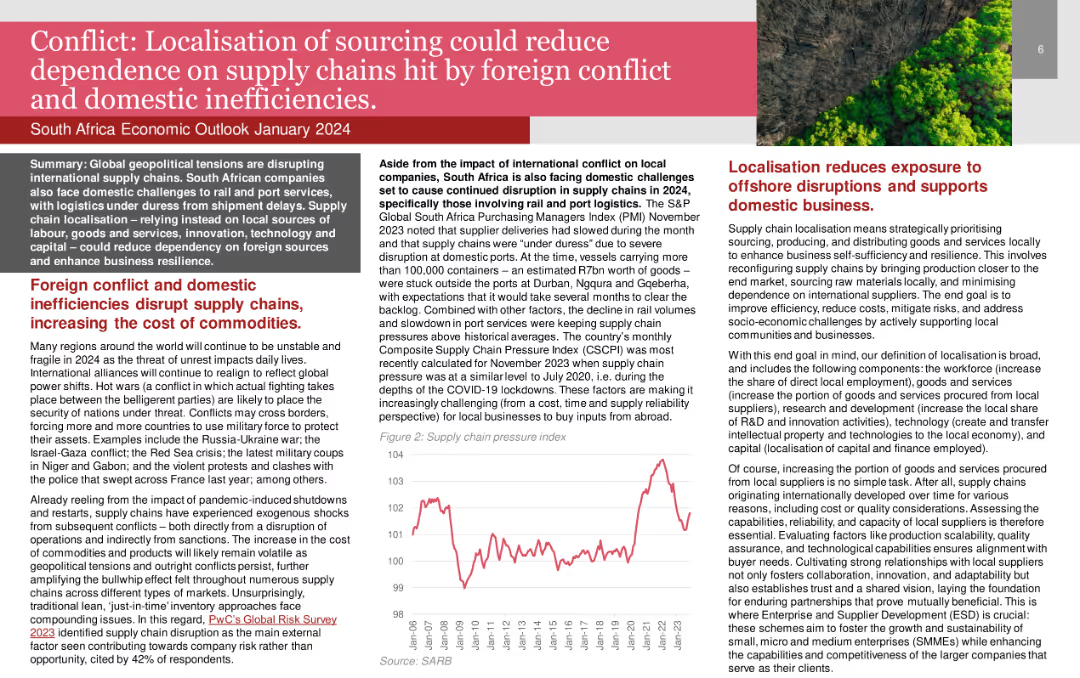
Line chart showing the Supply Chain Pressure Index over time.
Risk Assessment and Management
Transportation & Logistics
Highlights the benefits of localizing sourcing in South Africa to reduce reliance on disrupted international supply chains.
Localisation, Supply Chains, Conflict, Domestic Inefficiencies, South Africa
false
Risk Assessment and Management
Transportation & Logistics
Mixed Chart
PwC/Strategy&
Add to my slides
Remove from favorites
Comparative scatter plots examining the relationship between lockdown speed, strictness, and the length of the COVID-19 outbreak.
Risk Assessment and Management
Government & Public Sector
Evaluates the effectiveness of early and strict lockdown measures in controlling the COVID-19 outbreak.
Lockdown Effectiveness, COVID-19, Outbreak Control, Government Policy
true
Risk Assessment and Management
Government & Public Sector
Multiple Chart
BCG
Add to my slides
Remove from favorites
The slide is structured with a column chart and a line graph, where the column chart represents the portfolio occupancy percentages and the line graph tracks rent reversion percentage. The color scheme used is uniform for the columns, with a clear legend and time period indicators. It also includes an explanatory footnote about the data comparison.
Market Analysis and Trends
Real Estate & Construction
Analyzes the high occupancy levels and tenant retention rates within the light industrial/logistics portfolio, indicating effective management and market demand.
Logistics Portfolio, Occupancy Rates, Tenant Retention, Rent Reversion, Asset Management, Market Demand
false
Market Analysis and Trends
Real Estate & Construction
Single Chart
Morgan Stanley
Add to my slides
Remove from favorites
Features bubble charts and a linear scale to showcase the digital transformation's potential in logistics, including positive and negative value impacts.
Operational Efficiency
Transportation & Logistics
Analyzes how digital transformation could unlock $4 trillion in value for the logistics industry, emphasizing innovations like drones and shared transport capacity.
Logistics, Digital Transformation, Societal Impact, Industry Value, Innovation
false
Operational Efficiency
Transportation & Logistics
Mixed Chart
Accenture
Add to my slides
Remove from favorites
Column and pie charts with a timeline of portfolio value, clearly demarcated sections for acquisitions, divestments, and asset class distribution.
Strategic Planning
Real Estate & Construction
Used for strategic planning, showing the transition to logistics-focused assets with financial details and portfolio composition. It’s a strategic tool for presentations on investment shifts, asset management, and portfolio optimization within the logistics and real estate sectors.
Logistics, Strategy, Real Estate, Investments, Assets
false
Strategic Planning
Real Estate & Construction
Multiple Chart
Morgan Stanley
Add to my slides
Remove from favorites
The slide includes bar charts showing different levers in logistics with corresponding activity levels and trends over time.
Operational Efficiency
Transportation & Logistics
Discusses the declining relevance of logistics topics, focusing on supply chain management and transportation cost optimization.
Logistics, Supply Chain, Transportation, Trends
false
Operational Efficiency
Transportation & Logistics
Single Chart
Roland Berger
Add to my slides
Remove from favorites
Includes pie charts and icons, showing market share and activities of the London Market, a major global commercial and specialty risk market.
Market Analysis and Trends
Financial Services
Explains the role and scale of the London Market in global insurance, emphasizing its influence in various sectors such as aviation and energy.
London Market, global insurance, market share, commercial risk, specialty risk, financial services
false
Market Analysis and Trends
Financial Services
Multiple Chart
PwC/Strategy&
Add to my slides
Remove from favorites
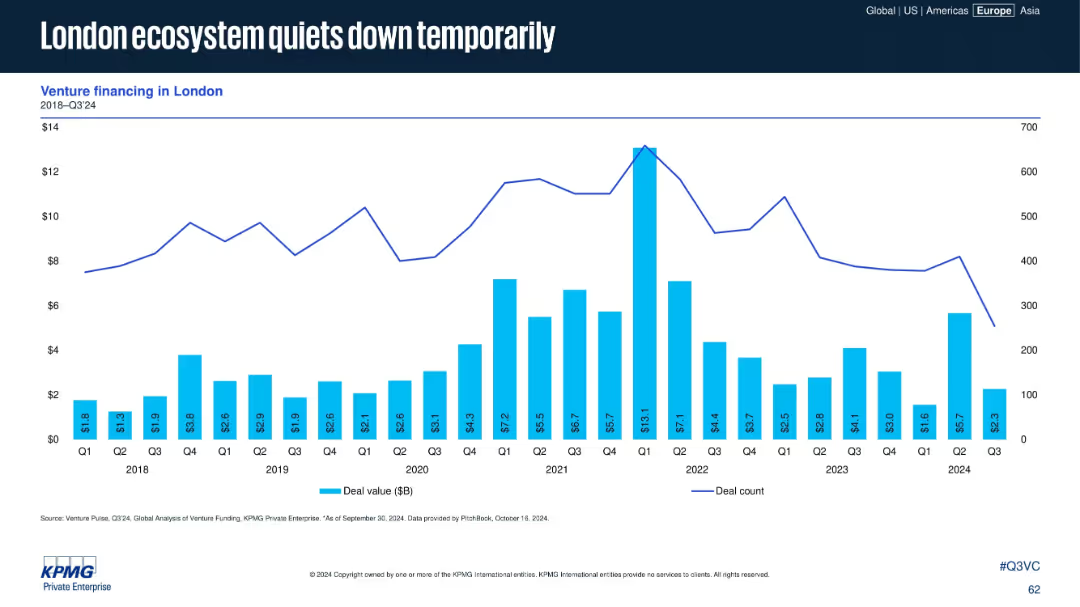
Similar to the previous slide but focused on London. Bar chart and line graph display quarterly venture deal value and count from 2018 to Q3 2024.
Market Analysis and Trends
Financial Services
Venture activity in London has declined in Q3 2024, following a peak in 2021. The chart suggests temporary cooling, possibly cyclical or linked to broader UK macro trends. The layout emphasizes historical data comparisons.
London, VC activity, deal count, quarterly trend, ecosystem, venture financing, 2024, capital flows, UK tech scene
false
Market Analysis and Trends
Financial Services
Single Chart
KPMG
Add to my slides
Remove from favorites
The slide has a title at the top, text in the middle, and a column chart at the bottom showing issues faced during self-isolation, such as loneliness and difficulties accessing food/medicine.
Risk Assessment and Management
Healthcare & Pharmaceuticals
Highlights issues faced by self-isolated individuals, with 30% experiencing loneliness. Other issues include difficulties accessing food/medicine and loss of income from work.
Loneliness, Self-Isolation, Survey, Health, Data
false
Risk Assessment and Management
Healthcare & Pharmaceuticals
Single Chart
IPSOS
Add to my slides
Remove from favorites
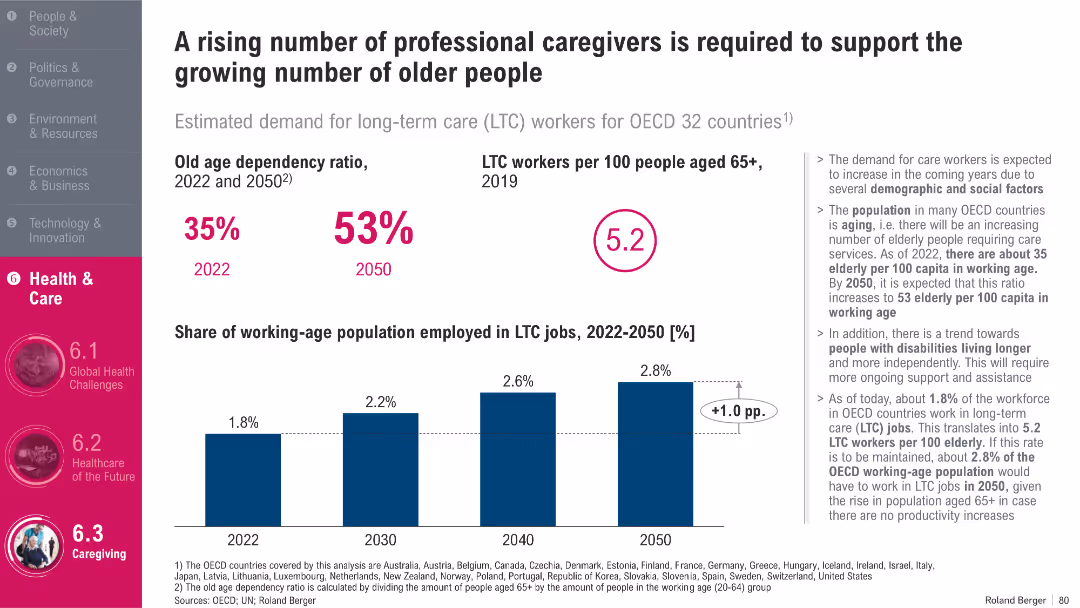
Bar charts on caregiver ratios and employment trends; summary stats and annotations; OECD focus
Human Resources and Talent Management
Healthcare & Pharmaceuticals
The slide analyzes the growing need for long-term care (LTC) workers across OECD countries. It forecasts an increase in the old-age dependency ratio and a slight rise in the share of the working population in LTC jobs. The data stresses the urgency for workforce expansion to meet the rising demand for elderly care.
Long-Term Care, Elderly, Workforce, OECD, Health Jobs, Dependency Ratio
false
Human Resources and Talent Management
Healthcare & Pharmaceuticals
Mixed Chart
Roland Berger
Add to my slides
Remove from favorites
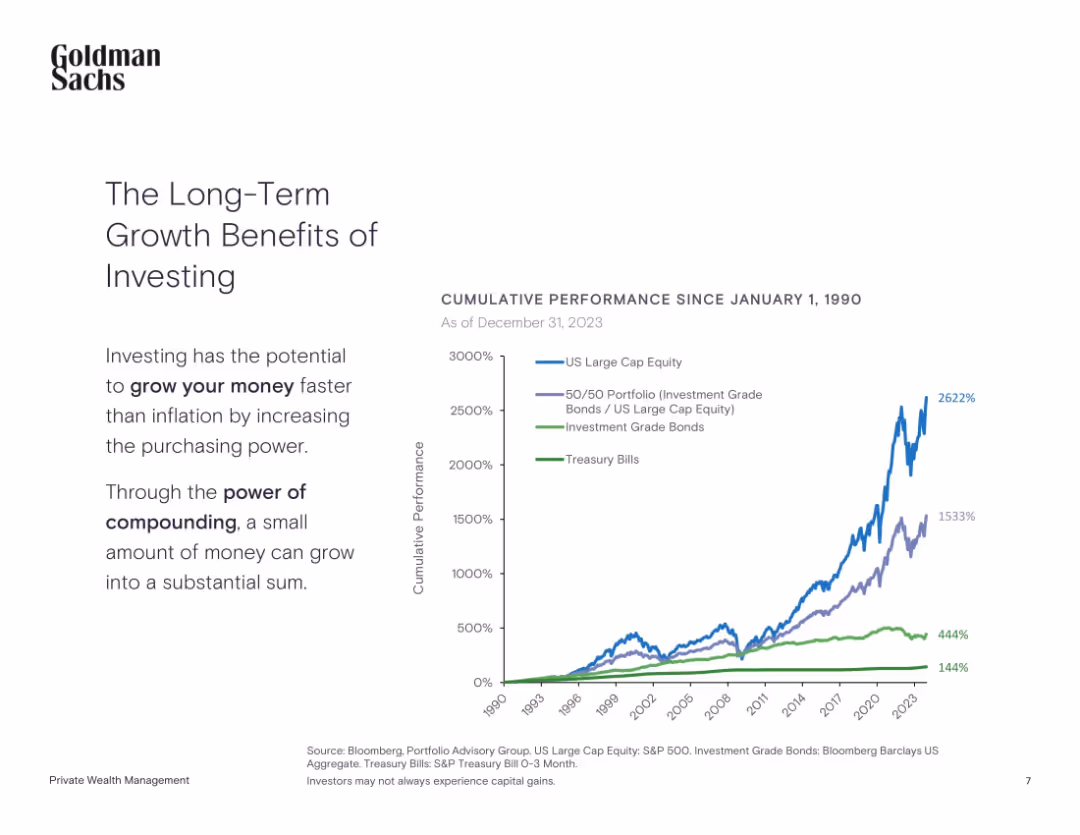
Left-aligned text with a line chart showing cumulative performance since 1990
Investment Analysis
Financial Services
The slide highlights the power of long-term investing by comparing cumulative returns from equities, bonds, and treasury bills since 1990.
Long-Term Investing, Compounding, Equities, Bonds, Treasury, Performance
false
Investment Analysis
Financial Services
Mixed Chart
Goldman Sachs
Add to my slides
Remove from favorites
The slide includes a series of bullet points with accompanying icons, outlining the areas of investment such as 'Digital experience and innovation' and 'Branch expansion'.
Investment Analysis
Financial Services
Outlines JP Morgan's investment portfolio expected to yield long-term efficiency and innovation results, detailing various strategic areas from marketing to regulatory compliance. It serves to inform investors and stakeholders about the company’s future-focused financial decisions.
Long-Term Investments, Digital Innovation, Branch Expansion, Efficiency
false
Investment Analysis
Financial Services
Table
JP Morgan
Add to my slides
Remove from favorites
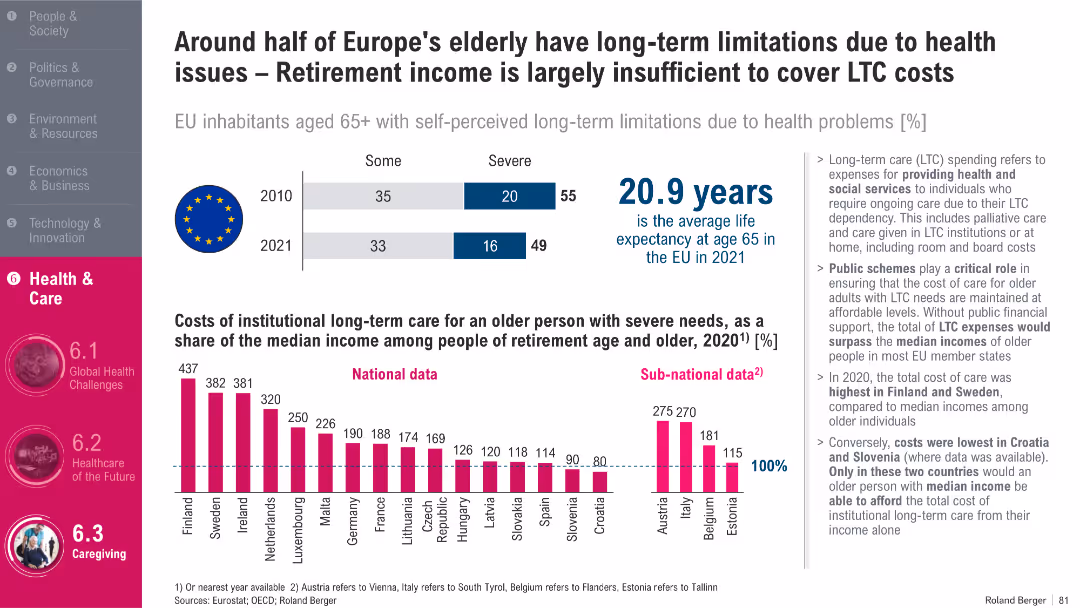
Split layout with bar chart, EU flag, bold heading, infographic on costs, and detailed bullet points on the right; prominent magenta vertical sidebar
Market Analysis and Trends
Healthcare & Pharmaceuticals
This slide highlights the financial challenges of long-term care (LTC) for Europe’s elderly, showing that LTC costs can exceed median retirement incomes in many EU countries. It includes statistics on elderly limitations due to health issues and life expectancy, and emphasizes the critical role of public support in managing LTC affordability.
Long-term care, aging population, Europe, healthcare costs, public schemes, life expectancy, EU, retirement income, health limitations, LTC dependency
false
Market Analysis and Trends
Healthcare & Pharmaceuticals
Multiple Chart
Roland Berger
Add to my slides
Remove from favorites
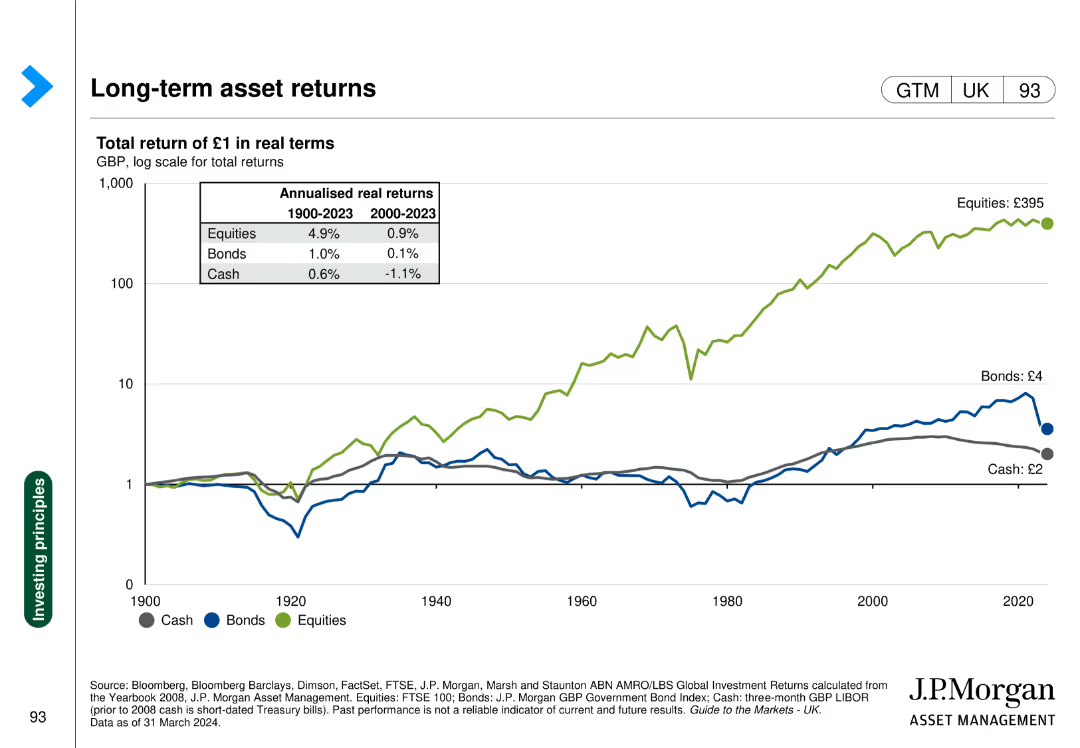
Line chart showing the real returns of cash, bonds, and equities over time.
Investment Analysis
Financial Services
Presents the historical real returns of different asset classes, aiding in long-term investment decisions.
Long-term returns, asset classes, real returns, cash, bonds, equities
false
Investment Analysis
Financial Services
Single Chart
JP Morgan
Add to my slides
Remove from favorites
The slide is divided into two areas. The top has a statement on business management with icons, and the bottom shows six boxes with different focus areas. Each box contains a short text description with corresponding icons, laid out on a blue background.
Strategic Planning
Financial Services
Aimed at strategic communication, this slide details the company's long-term business management approach, highlighting key areas like current outlook, benefits, customer relationships, diversification, operational discipline, and investment strategies. It underscores a commitment to sustainability through cycles with a forward-looking ROE guidance.
Long-term strategy, Business cycles, Operational discipline, Customer relationships, ROE guidance, Investment
false
Strategic Planning
Financial Services
Header Vertical
JP Morgan
Add to my slides
Remove from favorites
Displays column chart showing MREL and TLAC requirements versus actual levels, with additional metrics on senior preferred and non-preferred statuses.
Risk Assessment and Management
Financial Services
Highlights the bank's Q4 2023 capacity to absorb losses, staying significantly above regulatory requirements. It focuses on the MREL framework, illustrating how the bank maintains a buffer and provides flexibility in financial planning and risk management.
Loss Absorption, MREL, TLAC, Regulatory Compliance, Risk Management
false
Risk Assessment and Management
Financial Services
Mixed Chart
Deutsche Bank
Add to my slides
Remove from favorites
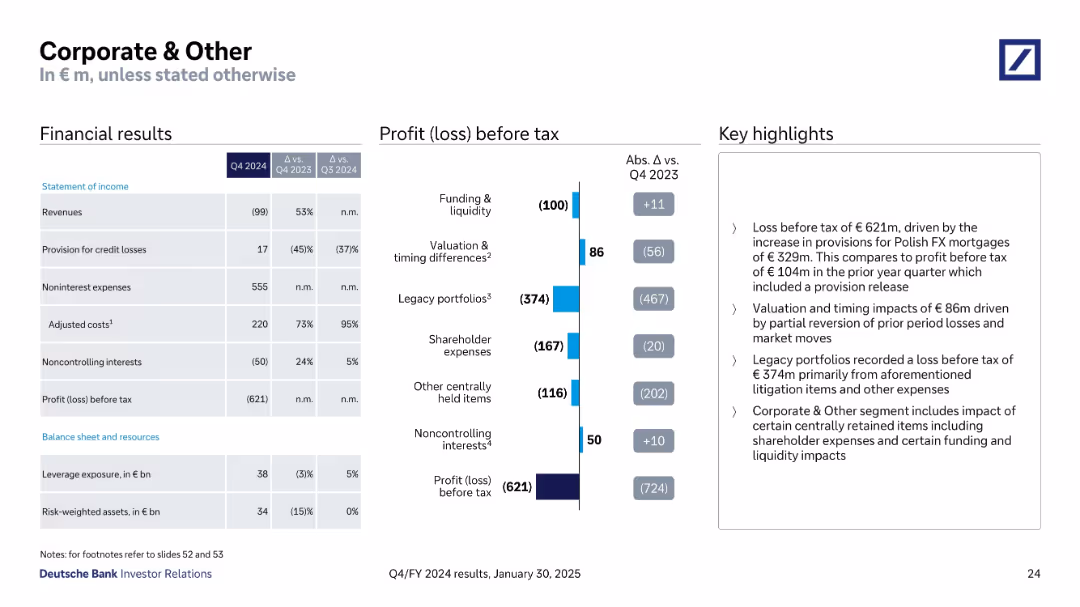
Split view with financial summary, waterfall-style loss breakdown, and concise highlight bullets
Financial Performance
Financial Services
This slide reports a loss before tax of €621m for the Corporate & Other segment, attributed mainly to increased provisions for Polish FX mortgages and legacy portfolio impacts. It also highlights valuation/timing differences and shareholder-related expenses.
Loss, Provisions, Legacy Portfolios, FX Mortgages, Shareholder Expenses
false
Financial Performance
Financial Services
Mixed Chart
Deutsche Bank
Add to my slides
Remove from favorites
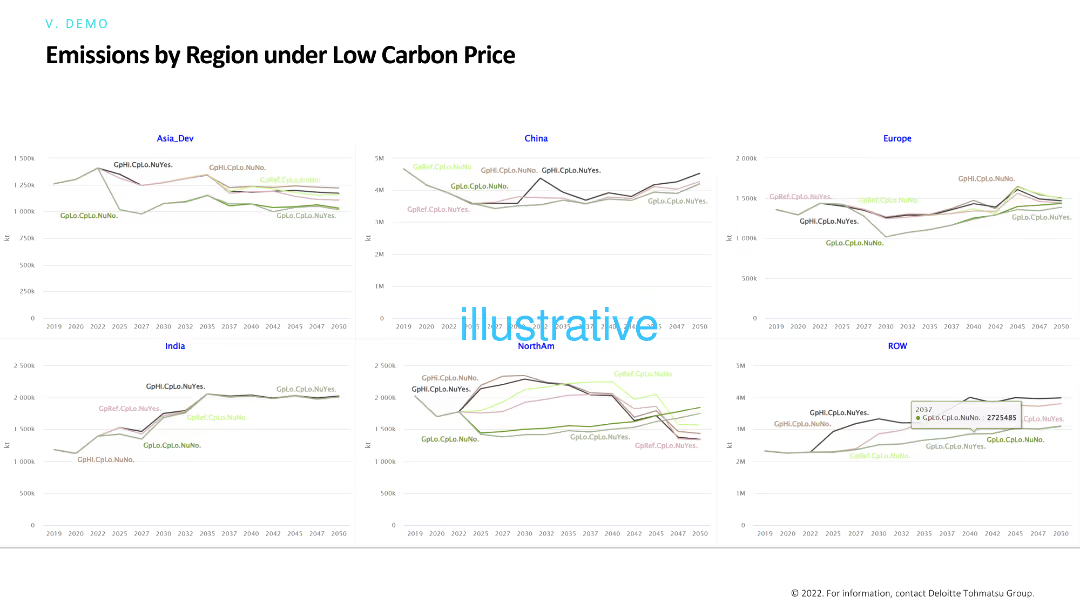
This slide features line charts comparing emissions by region under low carbon price scenarios. It highlights differences in emissions trends across regions and how low carbon pricing affects these trends over time.
Risk Assessment and Management
Environmental Services & Sustainability
The slide examines the effects of low carbon pricing on regional emissions, providing insights into how minimal carbon costs influence environmental outcomes and policy effectiveness in various regions.
Low carbon price, emissions, regions, policy impact, carbon pricing
false
Risk Assessment and Management
Environmental Services & Sustainability
Multiple Chart
Deloitte
Add to my slides
Remove from favorites
The slide includes a bar chart showing global low-CO2 flat steel demand projections from 2021 to 2040, with growth rates and percentage shares of total demand.
Market Analysis and Trends
Environmental Services & Sustainability
This slide projects an exponential increase in global demand for low-CO2 steel by 2040, indicating significant growth rates and market share changes, driven by environmental initiatives.
Low-CO2 steel, demand, projections, 2040, environmental, sustainability, market analysis, growth, global trends
false
Market Analysis and Trends
Environmental Services & Sustainability
Single Chart
BCG
Add to my slides
Remove from favorites
Column chart showing projected global capital expenditure by low-carbon technology in US$ from 2025 to 2050.
Investment Analysis
Energy & Utilities
This slide discusses how investment in low-carbon technology will increase, emphasizing the need for annual investments to scale up financial resources.
Low-carbon, technology, investment, capital, expenditure, energy systems, global, growth, infrastructure, renewable
false
Investment Analysis
Energy & Utilities
Mixed Chart
EY
Add to my slides
Remove from favorites
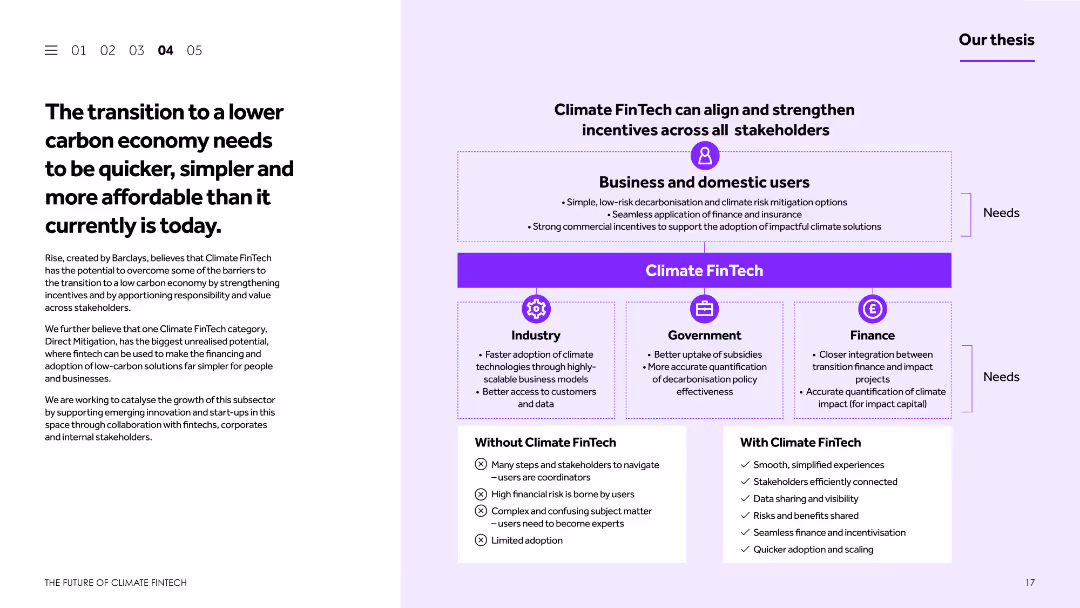
This slide features a balanced layout with text and a diagram. The text discusses the transition to a lower carbon economy and the barriers to achieving this. The diagram illustrates how Climate FinTech can align incentives across different stakeholders.
Strategic Planning
Financial Services
The slide discusses the challenges and necessity of transitioning to a lower carbon economy, emphasizing the role of Climate FinTech in simplifying and accelerating this process. It includes a diagram showing the alignment of incentives across various stakeholders to support this transition.
Lower carbon economy, Climate FinTech, transition, incentives, stakeholders
false
Strategic Planning
Financial Services
Boxed
Barclays
Add to my slides
Remove from favorites
Graphical elements and text boxes detail the loyalty program structures and impacts on a Japanese e-commerce and media company's market growth.
Customer and Market Segmentation
Retail & E-commerce
This slide showcases the success of a loyalty program in retaining market leadership and expanding market share, highlighting the incentives and rewards that encourage repeat customer engagement in a Japanese e-commerce context.
Loyalty programs, e-commerce, Japan, market growth
false
Customer and Market Segmentation
Retail & E-commerce
Framework
BCG
Add to my slides
Remove from favorites
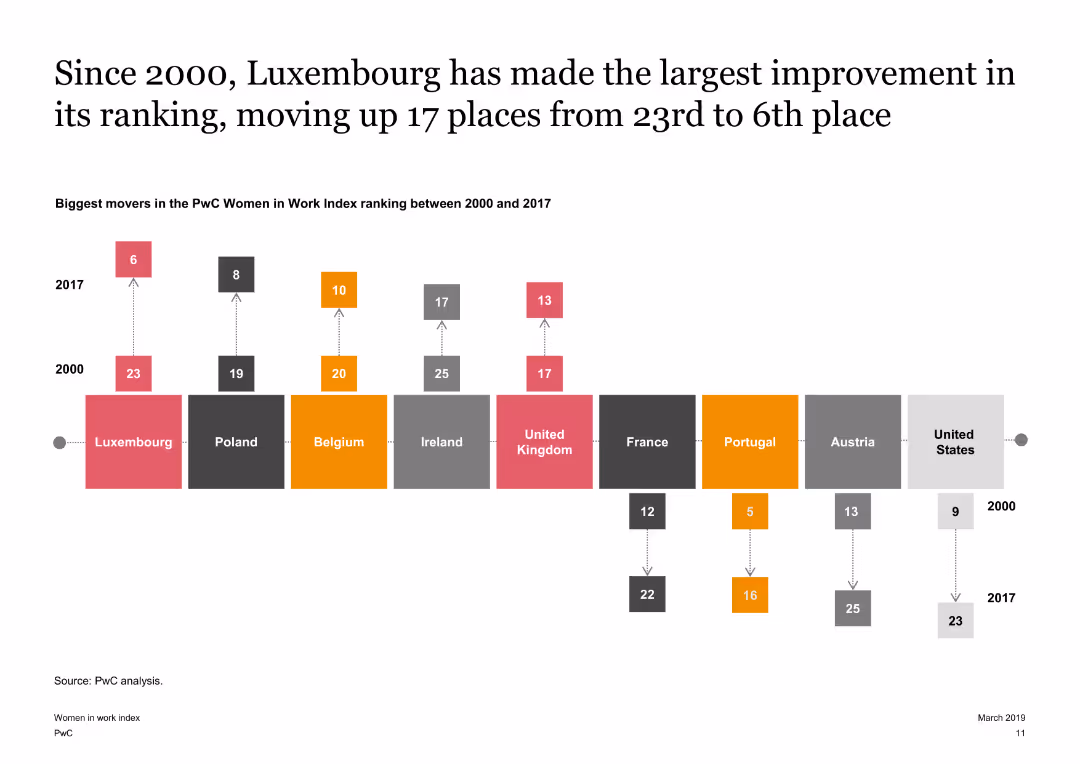
The slide features a timeline diagram showing the biggest movers in the PwC Women in Work Index between 2000 and 2017. It highlights Luxembourg’s significant improvement in ranking over the years.
Market Analysis and Trends
Financial Services
It highlights the countries that have made significant improvements in the Women in Work Index since 2000, with a focus on Luxembourg’s progress in enhancing female economic participation.
Luxembourg, Improvement, Timeline, Index, Gender
false
Market Analysis and Trends
Financial Services
Linear Flow
PwC/Strategy&
Add to my slides
Remove from favorites
Circular flow diagram centered around "Core Promise & Value Proposition" surrounded by strategies like "Elevation" and "Reach Expansion".
Strategic Planning
Consumer Goods
Discusses the evolution of luxury brands towards more unique, opinion-driven products as a way to fuel modern aspiration, emphasizing the transition from traditional to bespoke luxury goods.
Luxury Brands, Strategy, Trends
false
Strategic Planning
Consumer Goods
Diagram
Bain
Add to my slides
Remove from favorites
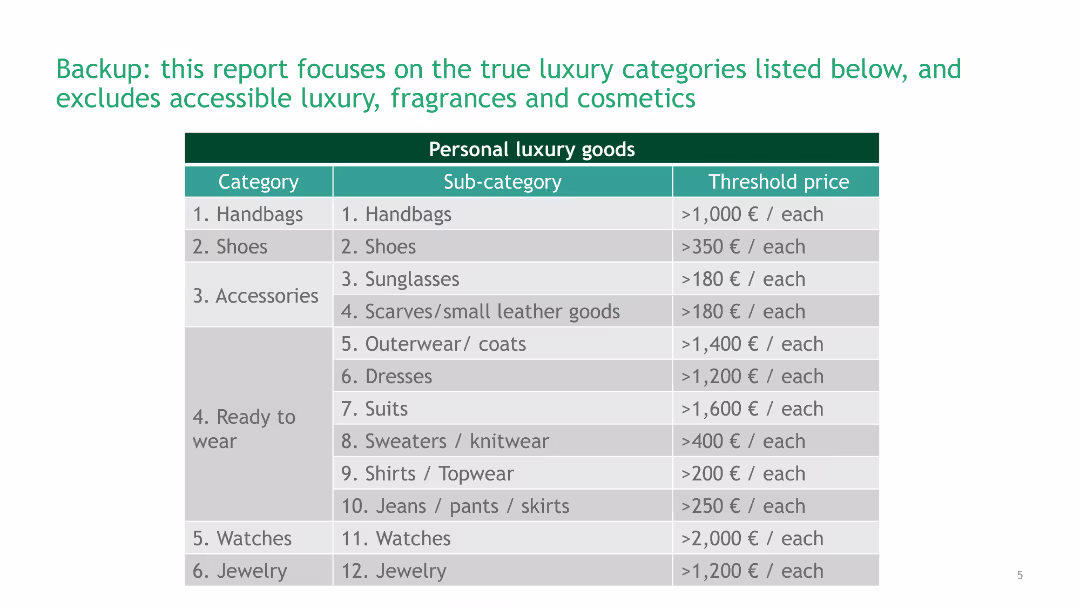
A table listing categories, sub-categories, and threshold prices of personal luxury goods. The table is organized with clear lines and a green header.
Product and Service Analysis
Consumer Goods
This slide provides a detailed breakdown of personal luxury goods categories, including handbags, shoes, accessories, and their respective price thresholds.
Luxury Goods, Categories, Threshold Prices, Product Analysis, Personal Luxury
false
Product and Service Analysis
Consumer Goods
Table
BCG
Add to my slides
Remove from favorites
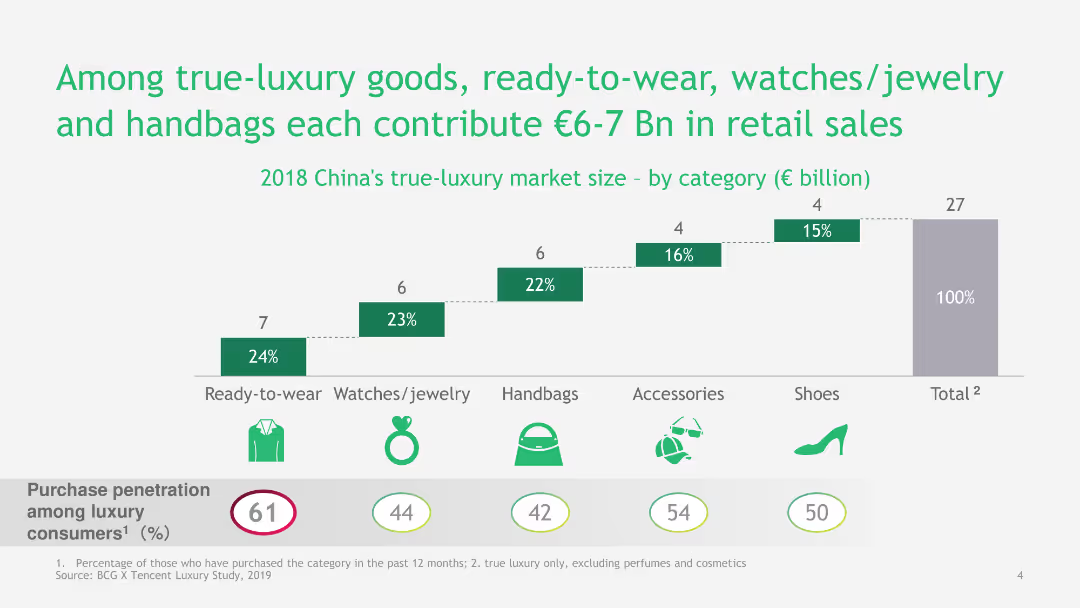
This slide includes a bar chart and infographics to detail the contribution of different luxury goods to retail sales in China. It uses icons and a clear, structured layout.
Market Analysis and Trends
Consumer Goods
The slide breaks down the contribution of various luxury goods categories to China's retail market, highlighting the market size and penetration rates for each category.
Luxury Goods, Ready-to-Wear, Watches, Jewelry, Handbags, Retail Sales, China, Market Size, Penetration Rates
false
Market Analysis and Trends
Consumer Goods
Single Chart
BCG
Add to my slides
Remove from favorites
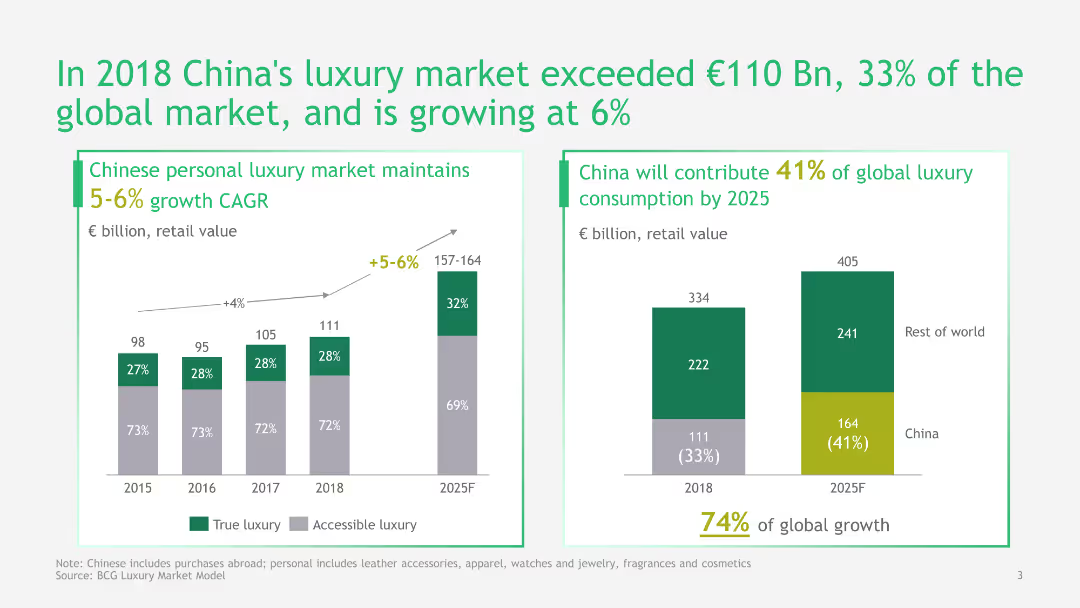
This slide features a column chart and a pie chart to illustrate China's growth in the luxury market. It uses green and gray colors and includes detailed data points and projections.
Market Analysis and Trends
Consumer Goods
The slide provides an analysis of China's luxury market growth, its contribution to the global market, and future projections, highlighting significant market trends and growth rates.
Luxury Market, China, Growth, Global Market, Projections, Data, Analysis, Trends, Retail
false
Market Analysis and Trends
Consumer Goods
Multiple Chart
BCG
Add to my slides
Remove from favorites
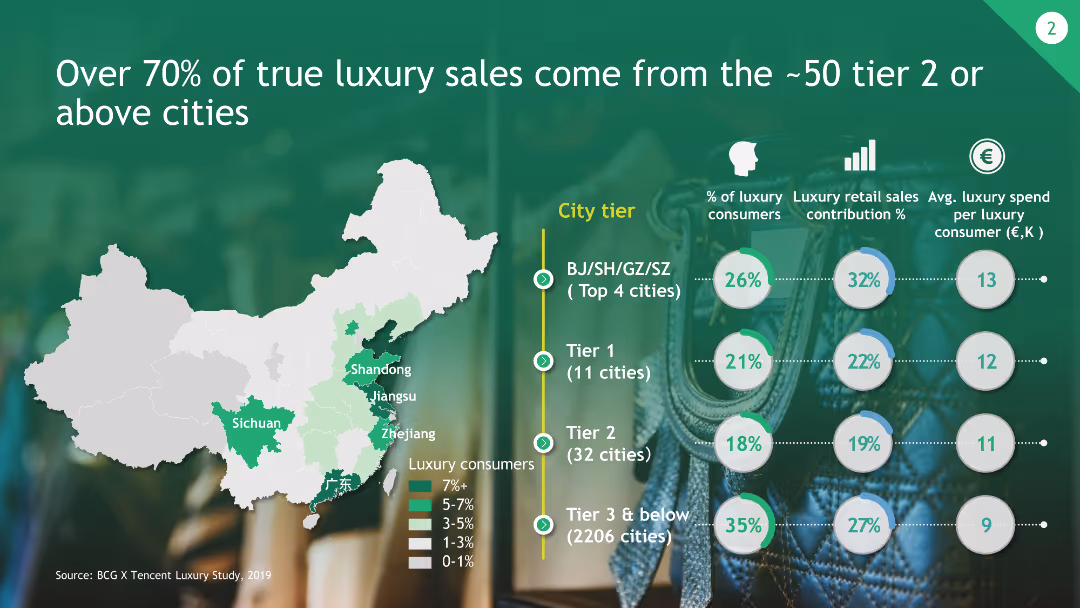
The slide includes a map of China highlighting tiered cities and their contribution to luxury sales, along with circular graphs representing consumer percentages and average spend.
Market Analysis and Trends
Consumer Goods
This slide shows that the majority of luxury sales come from approximately 50 tier 2 or above cities in China, with detailed data on consumer contributions and spending.
Luxury Sales, Tier Cities, Market Contribution, China, Consumer Data
false
Market Analysis and Trends
Consumer Goods
Multiple Chart
BCG
Add to my slides
Remove from favorites
Utilizes column charts to depict consumer awareness and preference statistics across different generations and nationalities.
Competitive Landscape
Retail & E-commerce
Analyzes consumer awareness of luxury brand collaborations, emphasizing the influence of younger generations and Chinese consumers.
Luxury brands, collaborations, consumer awareness, generations, Millennials, Gen Z, Chinese, market influence
false
Competitive Landscape
Retail & E-commerce
Multiple Chart
BCG
Add to my slides
Remove from favorites
Slide with bar charts reflecting consumer preferences for collaborations, segmented by nationality.
Market Analysis and Trends
Retail & E-commerce
Delve into the preferences of luxury consumers towards collaborations, showing strong appeal in different styles and collections.
Luxury consumers, collaborations, preferences, styles, collections, nationality, consumer insights, market trends
false
Market Analysis and Trends
Retail & E-commerce
Multiple Chart
BCG
Add to my slides
Remove from favorites
This slide contains multiple column charts across a timeline from 1996 to 2019, separated into phases labeled "Sortie du temple," "Democratization," "Crisis," and others.
Market Analysis and Trends
Consumer Goods
The slide presents a timeline of the luxury goods market growth from 1996 to 2019, highlighting various market phases and projecting growth. It is used to analyze market trends.
Luxury goods, Market growth, Crisis, Projection
false
Market Analysis and Trends
Consumer Goods
Single Chart
Bain
Add to my slides
Remove from favorites
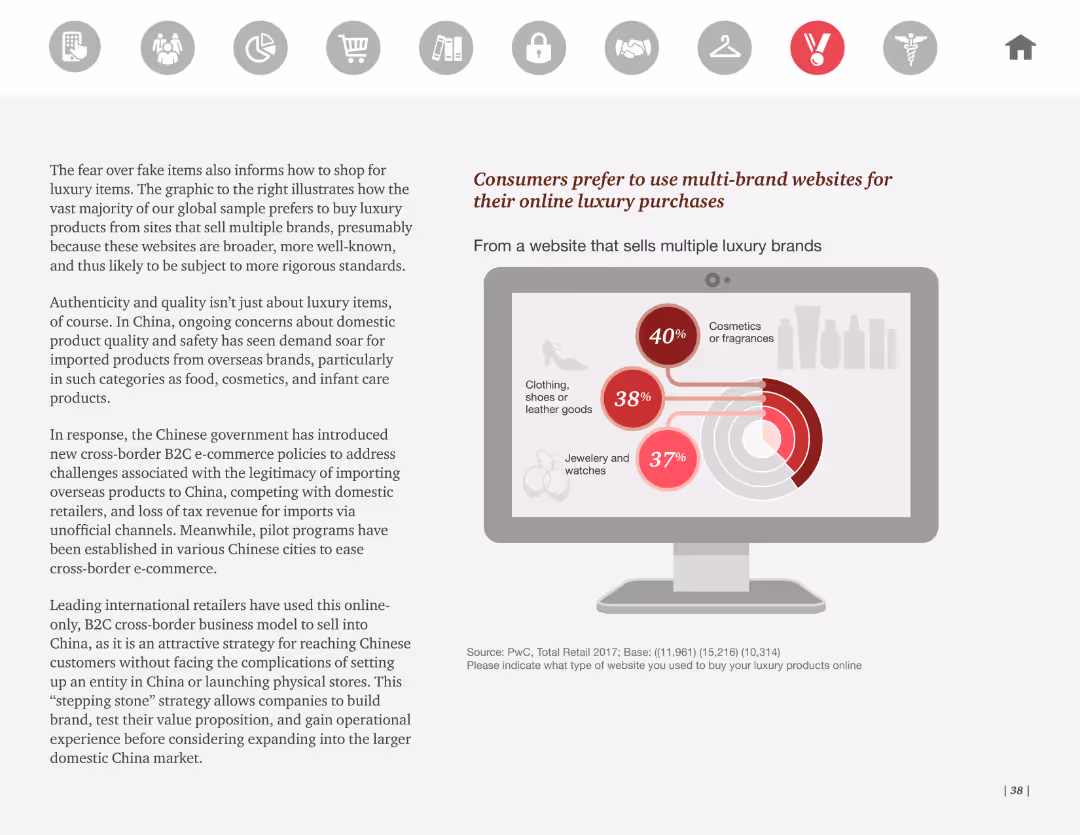
This slide includes a pie chart illustrating consumer preferences for buying luxury items from multi-brand websites. It features a prominent graphic of a laptop screen showing the product categories.
Market Analysis and Trends
Retail & E-commerce
The slide reveals that consumers prefer multi-brand websites for luxury purchases due to broader product ranges and perceived reliability. It discusses the Chinese market's growing demand for imported luxury goods and related B2C e-commerce policies.
Luxury goods, multi-brand websites, online shopping, consumer preferences, e-commerce
false
Market Analysis and Trends
Retail & E-commerce
Mixed Chart
PwC/Strategy&
Add to my slides
Remove from favorites
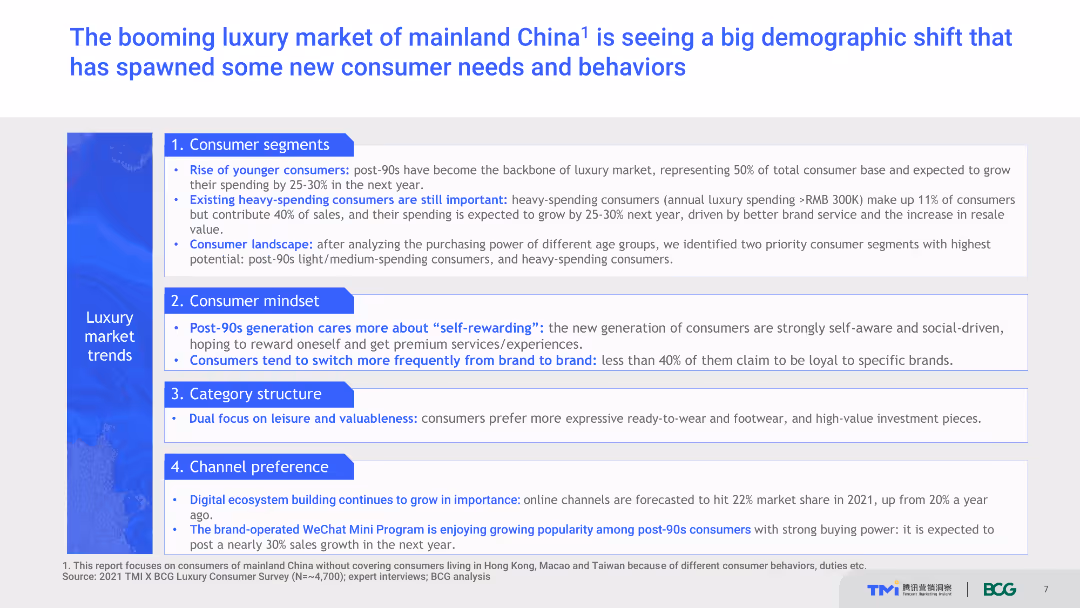
The slide lists consumer segments, mindset, category structure, and channel preference trends in the luxury market of mainland China.
Market Analysis and Trends
Retail & E-commerce
This slide discusses the demographic shifts and emerging trends in the luxury market of mainland China, highlighting new consumer needs and behaviors, particularly among post-90s generation and heavy-spending consumers.
Luxury market, China, consumer trends, demographic shift, spending behavior
false
Market Analysis and Trends
Retail & E-commerce
Header Vertical
BCG
Add to my slides
Remove from favorites
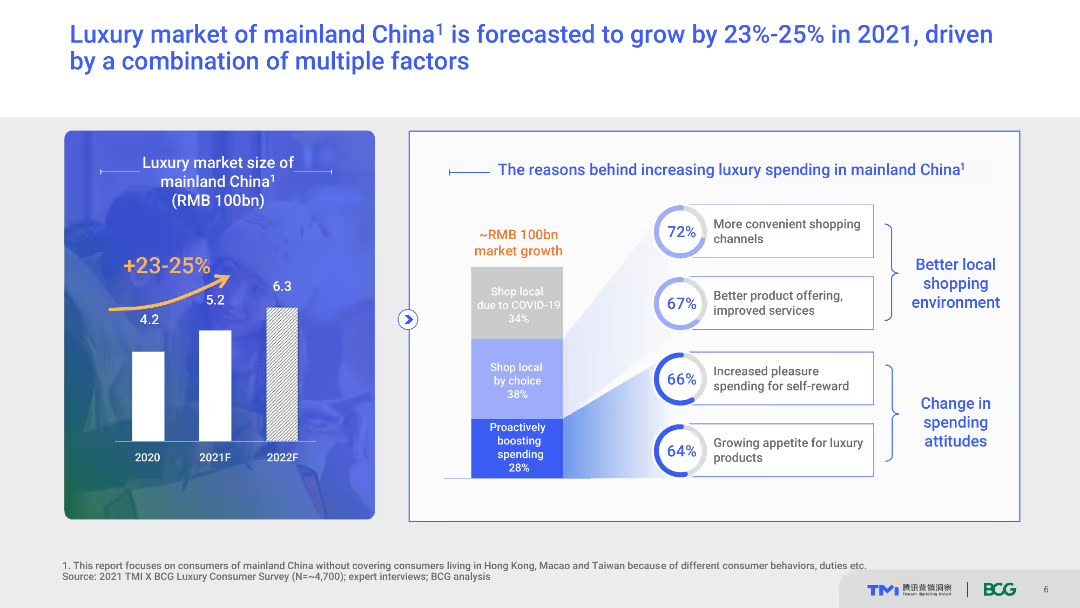
The slide features a column chart showing the luxury market size of mainland China from 2020 to 2022. It also includes a text box with reasons for increased luxury spending.
Market Analysis and Trends
Retail & E-commerce
The slide forecasts a 23%-25% growth in the luxury market of mainland China for 2021, driven by various factors such as more convenient shopping channels, better product offering, and changing spending attitudes.
Luxury market, China, market growth, spending factors, 2021 forecast
false
Market Analysis and Trends
Retail & E-commerce
Multiple Chart
BCG
Add to my slides
Remove from favorites
Column chart illustrating the growth phases of the luxury market from 2001 to 2018, with marked key phases and CAGR.
Market Analysis and Trends
Retail & E-commerce
Shows the development phases of the luxury market, highlighting key periods such as crisis, Chinese growth, and the digital era.
Luxury market, phases, growth, timeline, CAGR
false
Market Analysis and Trends
Retail & E-commerce
Single Chart
Deutsche Bank
Add to my slides
Remove from favorites
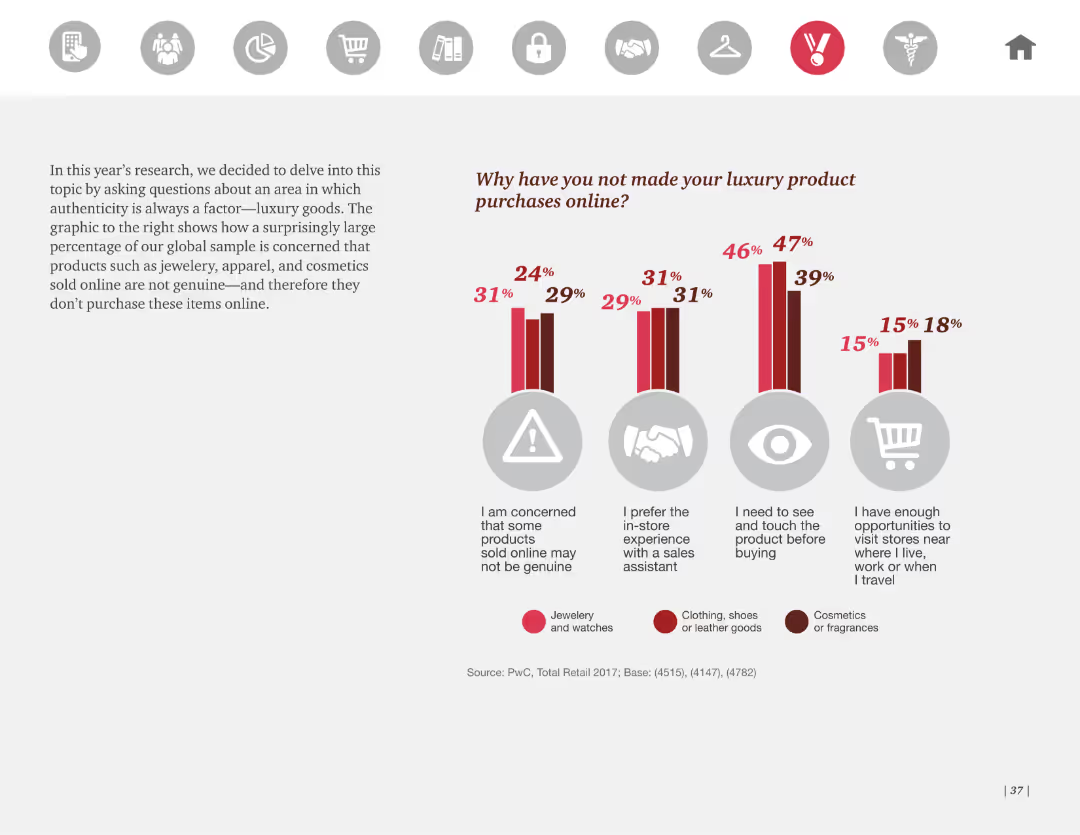
The slide presents a column chart depicting reasons for not purchasing luxury products online, segmented by product type. The design is clear with concise text explaining each reason and related statistics.
Market Analysis and Trends
Retail & E-commerce
It highlights survey findings that a significant number of consumers are hesitant to buy luxury products online due to concerns over authenticity, preference for in-store experiences, and the need to physically inspect items before purchase.
Luxury products, online shopping, consumer concerns, survey, authenticity
false
Market Analysis and Trends
Retail & E-commerce
Mixed Chart
PwC/Strategy&
Add to my slides
Remove from favorites
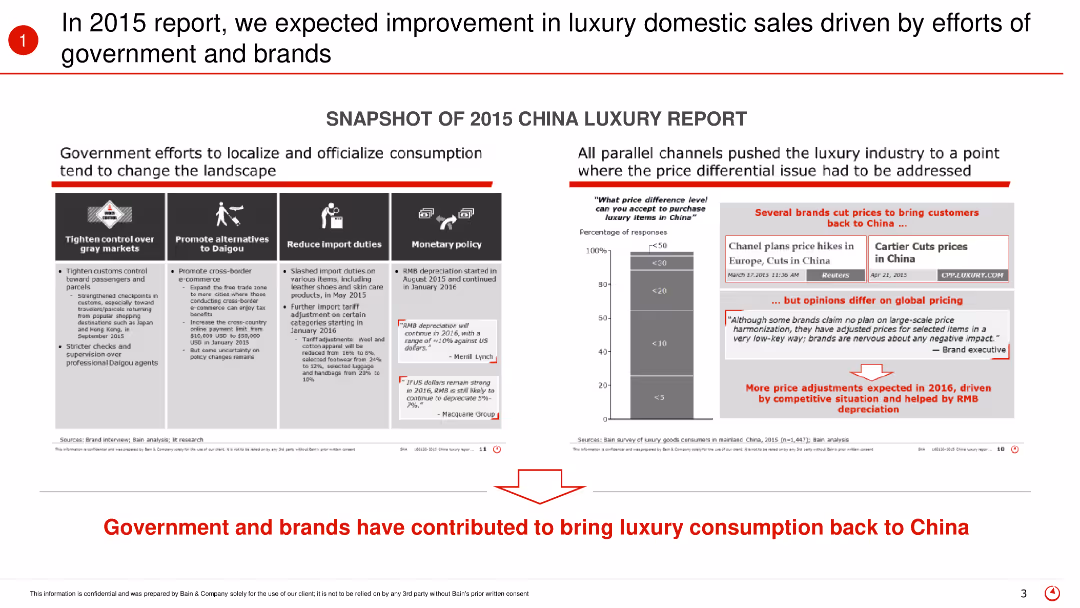
This slide includes text blocks and icons to describe government and brand efforts in improving luxury domestic sales in China. It also features a column chart and text highlighting the impact of these efforts on luxury consumption.
Regulatory and Compliance
Retail & E-commerce
The slide reviews the 2015 expectations for improvement in China's luxury domestic sales due to government policies and brand strategies. It discusses various measures taken to localize consumption and reduce price differences, ultimately contributing to an increase in luxury purchases.
Luxury sales, government efforts, brand strategies, China, 2015 report, luxury market, regulatory impact, consumption trends
false
Regulatory and Compliance
Retail & E-commerce
Mixed Chart
Bain
Add to my slides
Remove from favorites
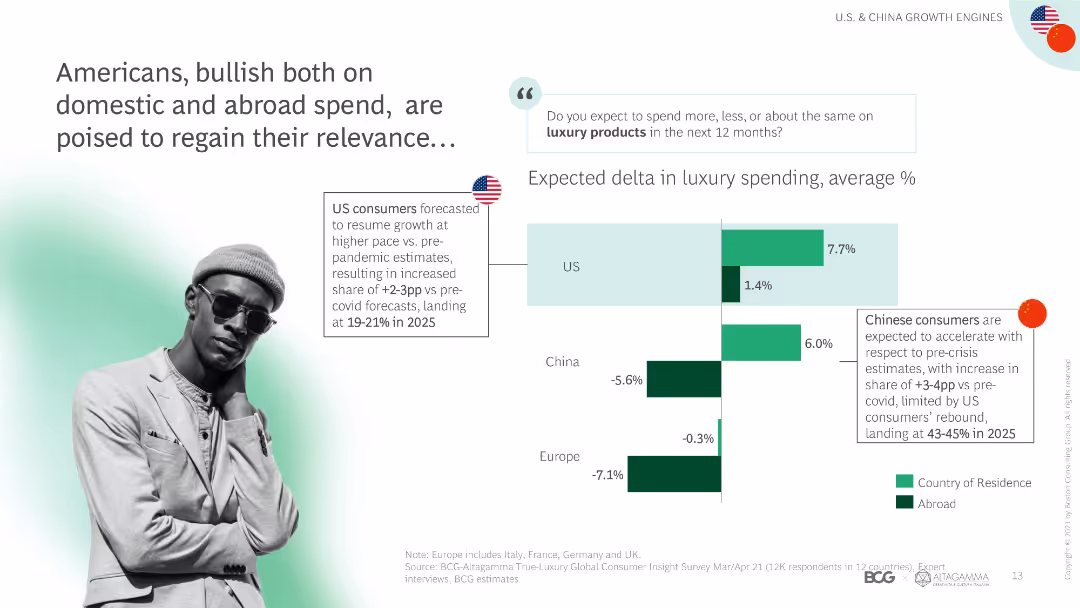
The slide features column charts showing expected changes in luxury spending by Americans domestically and abroad, with text boxes explaining the data.
Market Analysis and Trends
Retail & E-commerce
The slide discusses the optimism among American consumers regarding luxury spending both domestically and abroad, with projected growth rates and market shares.
Luxury spending, American consumers, domestic spend, abroad spend, market growth, projections, consumer optimism, spending trends, market shares
false
Market Analysis and Trends
Retail & E-commerce
Mixed Chart
BCG
Add to my slides
Remove from favorites
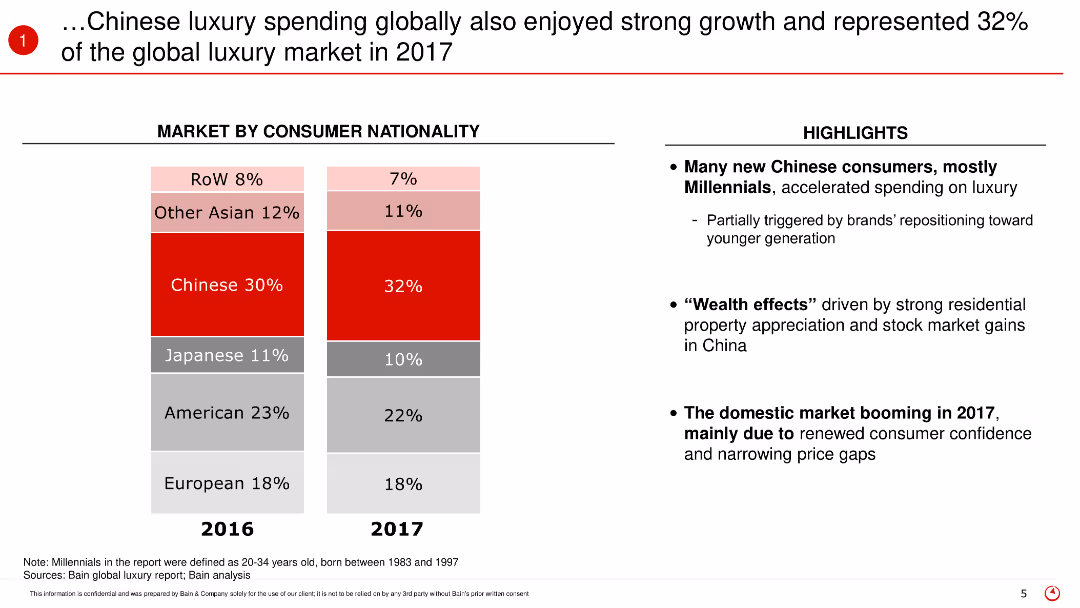
This slide features a stacked bar chart comparing the market share of luxury spending by consumer nationality between 2016 and 2017. The chart is accompanied by text highlighting the key insights and the factors contributing to the growth in Chinese luxury spending.
Market Analysis and Trends
Retail & E-commerce
The slide discusses the global luxury market in 2017, focusing on the significant contribution of Chinese consumers who represented 32% of the market. It highlights the increase in spending among Chinese Millennials and the factors driving this trend, such as the wealth effect and increased consumer confidence.
Luxury spending, Chinese consumers, global market, 2017, Millennials, market share, spending trends, consumer confidence, wealth effect
false
Market Analysis and Trends
Retail & E-commerce
Mixed Chart
Bain
Add to my slides
Remove from favorites
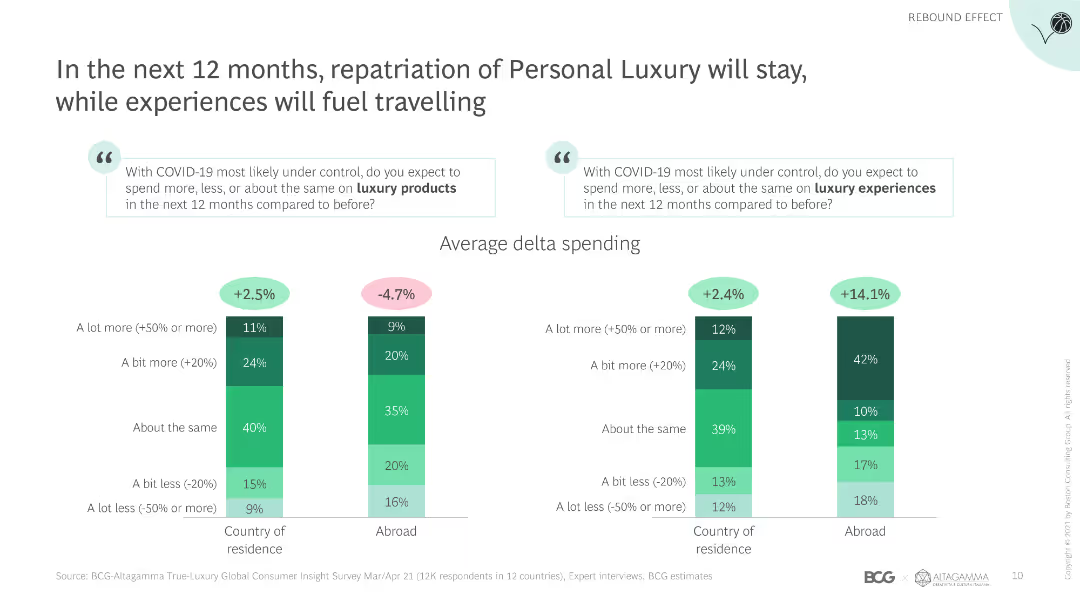
This slide includes column charts comparing spending on luxury products and experiences across different countries, with accompanying text explaining the findings.
Market Analysis and Trends
Retail & E-commerce
The slide analyzes consumer spending trends on luxury products and experiences in the next 12 months, with a focus on repatriation and travel-related luxury spending.
Luxury spending, repatriation, travel, consumer trends, luxury products, experiences, spending patterns, market analysis, next 12 months
false
Market Analysis and Trends
Retail & E-commerce
Multiple Chart
BCG
Add to my slides
Remove from favorites
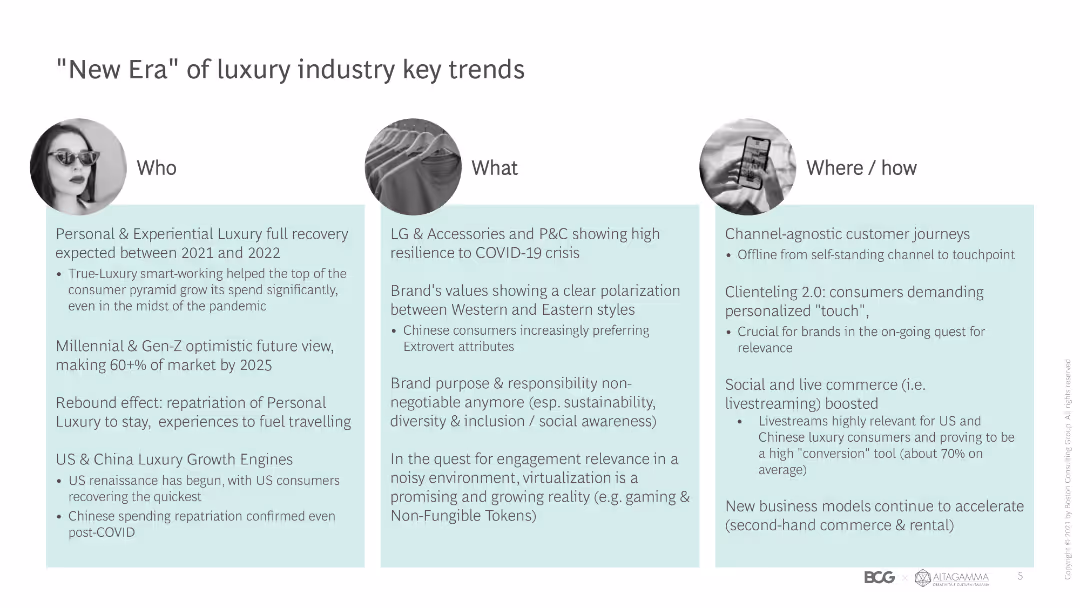
The slide has a three-column layout labeled 'Who', 'What', and 'Where/how', each with text descriptions and small icons representing each section.
Market Analysis and Trends
Retail & E-commerce
The slide outlines key trends in the luxury industry, including personal and experiential luxury recovery, consumer demographics, brand values, and channel-agnostic journeys.
Luxury trends, consumer demographics, brand values, channel-agnostic, experiential luxury, recovery, market trends, luxury goods, Gen Z
false
Market Analysis and Trends
Retail & E-commerce
Pillar
BCG
Add to my slides
Remove from favorites
Column charts showing traffic distribution by type, focusing on mobile
Market Analysis and Trends
Technology & Software
Analyzes the predominant focus of luxury consumers on mobile platforms
Luxury, Consumer Attention, Mobile, Traffic Distribution
false
Market Analysis and Trends
Technology & Software
Single Chart
BCG
Add to my slides
Remove from favorites
Line graphs showing app usage over time, bar charts showing daily mobile time usage per app
Market Analysis and Trends
Technology & Software
Examines luxury consumers' app usage patterns, highlighting preferred platforms
Luxury, Consumer Behavior, Apps, Usage Patterns
false
Market Analysis and Trends
Technology & Software
Multiple Chart
BCG
Add to my slides
Remove from favorites
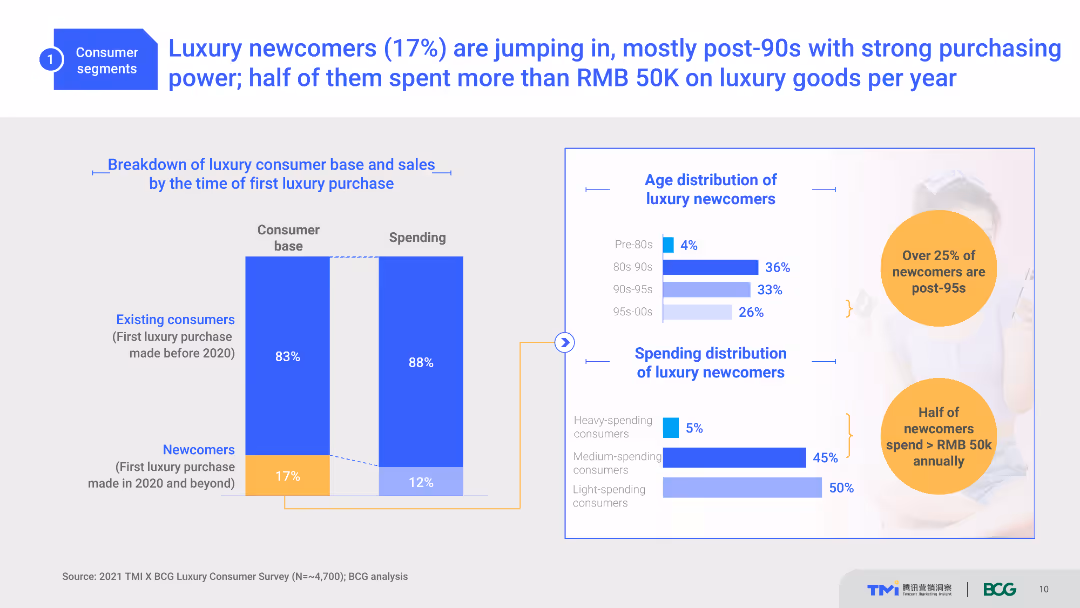
A slide with two column charts depicting the consumer base and spending, and bar charts showing age and spending distribution. Light blue, white, and orange colors are used with text explanations.
Customer and Market Segmentation
Consumer Goods
The slide shows the breakdown of luxury consumers by the time of their first luxury purchase, age distribution, and spending habits of newcomers, primarily post-90s.
Luxury, Consumer Segmentation, Spending, Age Distribution, Post-90s
false
Customer and Market Segmentation
Consumer Goods
Multiple Chart
BCG
Add to my slides
Remove from favorites
A map of China highlighting luxury consumer percentages by province, and pie charts on the right
Market Analysis and Trends
Retail & E-commerce
Analyzes geographical distribution of luxury consumers in China and categorizes city tiers
Luxury, Consumers, China, City Tiers, Geography
false
Market Analysis and Trends
Retail & E-commerce
Multiple Chart
BCG
Add to my slides
Remove from favorites
Diagram with a central circle labeled "Luxury Market" connected to four disruptive forces.
Strategic Planning
Consumer Goods
Identifies key disruptive forces shaping the luxury market in 2024, such as sustainability and technology.
Luxury, Disruption, Forces, 2024, Market
false
Strategic Planning
Consumer Goods
Framework
Kearney
Add to my slides
Remove from favorites
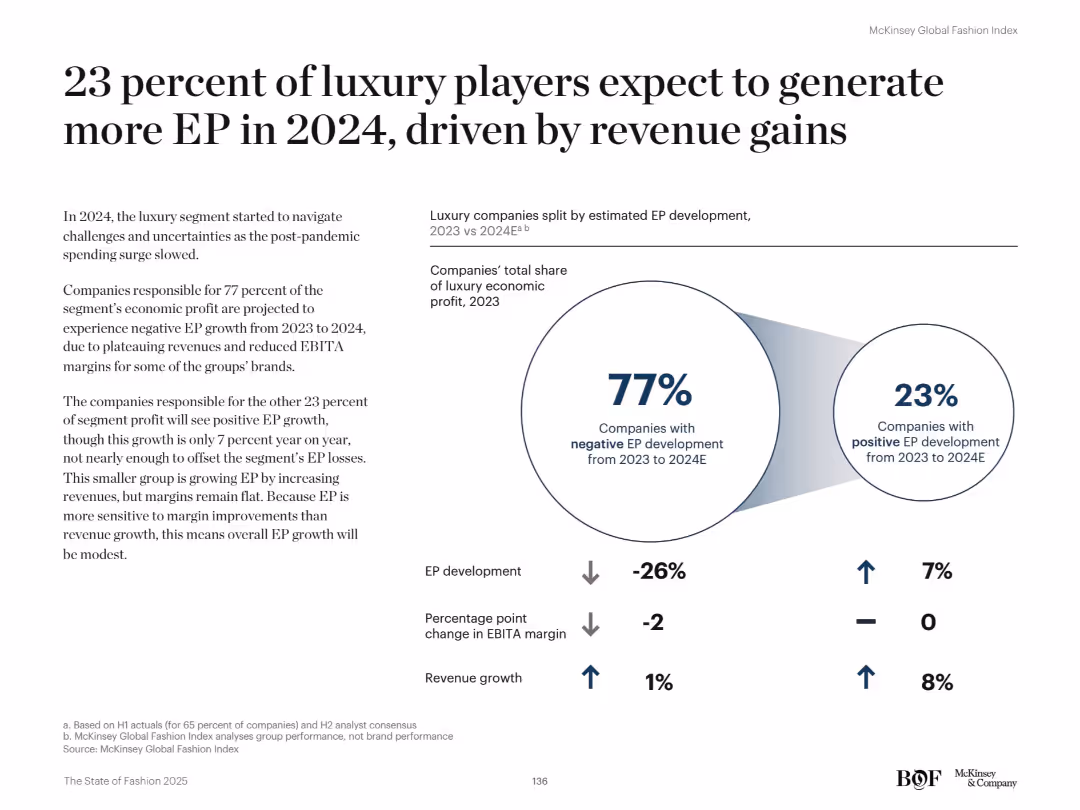
Split layout with a large infographic on the right showing 77% vs. 23% split. Text on left explains segment performance.
Financial Performance
Retail & E-commerce
Only 23% of luxury brands are forecast to grow EP in 2024, mostly via revenue gains rather than margin improvement. The remaining 77% face negative EP due to declining margins. This reflects challenges in the post-pandemic luxury market.
Luxury, EP growth, revenue, margins, fashion industry, 2024 forecast, profitability, segment disparity, economic outlook
false
Financial Performance
Retail & E-commerce
Mixed Chart
McKinsey
Add to my slides
Remove from favorites
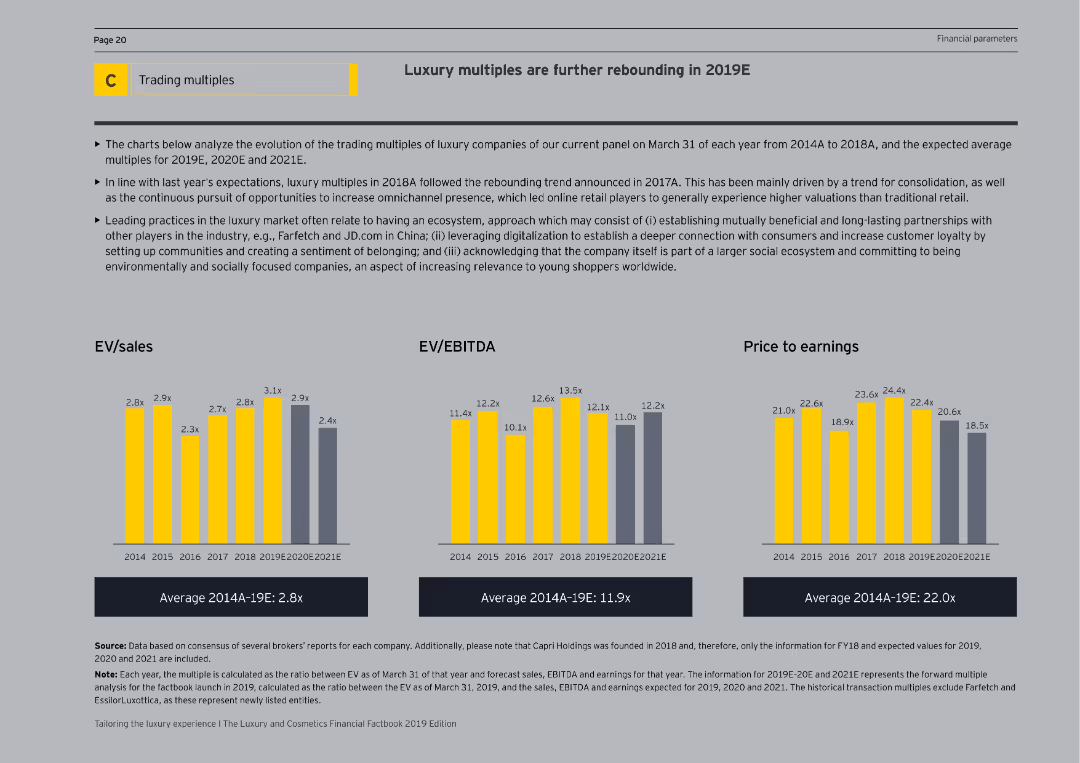
The slide features column charts representing EV/sales, EV/EBITDA, and price to earnings ratios from 2014 to 2021E. The visual complexity is moderate, with clearly labeled axes and a detailed explanation on the right side of the slide.
Financial Performance
Consumer Goods
The slide analyzes the rebound in luxury multiples, focusing on EV/sales, EV/EBITDA, and price to earnings ratios. It compares historical data with future projections, explaining trends and factors driving these financial metrics in the luxury market.
Luxury, EV/Sales, EV/EBITDA, Price to Earnings
false
Financial Performance
Consumer Goods
Multiple Chart
EY
Add to my slides
Remove from favorites
Text with map highlighting key luxury growth markets like Middle East, China, India, and Southeast Asia.
Market Analysis and Trends
Consumer Goods
Discusses the critical role of growth markets in the development of the luxury sector, highlighting key regions.
Luxury, Growth, Markets, Regions, Development
false
Market Analysis and Trends
Consumer Goods
Graphic
Kearney
Add to my slides
Remove from favorites
Graphs and charts showing shift from offline to online luxury purchasing over years
Market Analysis and Trends
Retail & E-commerce
Illustrates how luxury purchases have transitioned from physical stores to online platforms
Luxury, Market Shift, Online Purchase, Timeline
false
Market Analysis and Trends
Retail & E-commerce
Mixed Chart
BCG
Add to my slides
Remove from favorites
Image of a woman using a smartphone, icons and bullet points listing key trends
Market Analysis and Trends
Retail & E-commerce
Discusses six emerging trends in the luxury market influenced by digital technology
Luxury, Market Trends, Digital Influence, Consumer Behavior
false
Market Analysis and Trends
Retail & E-commerce
Vertical Flow
BCG
Add to my slides
Remove from favorites
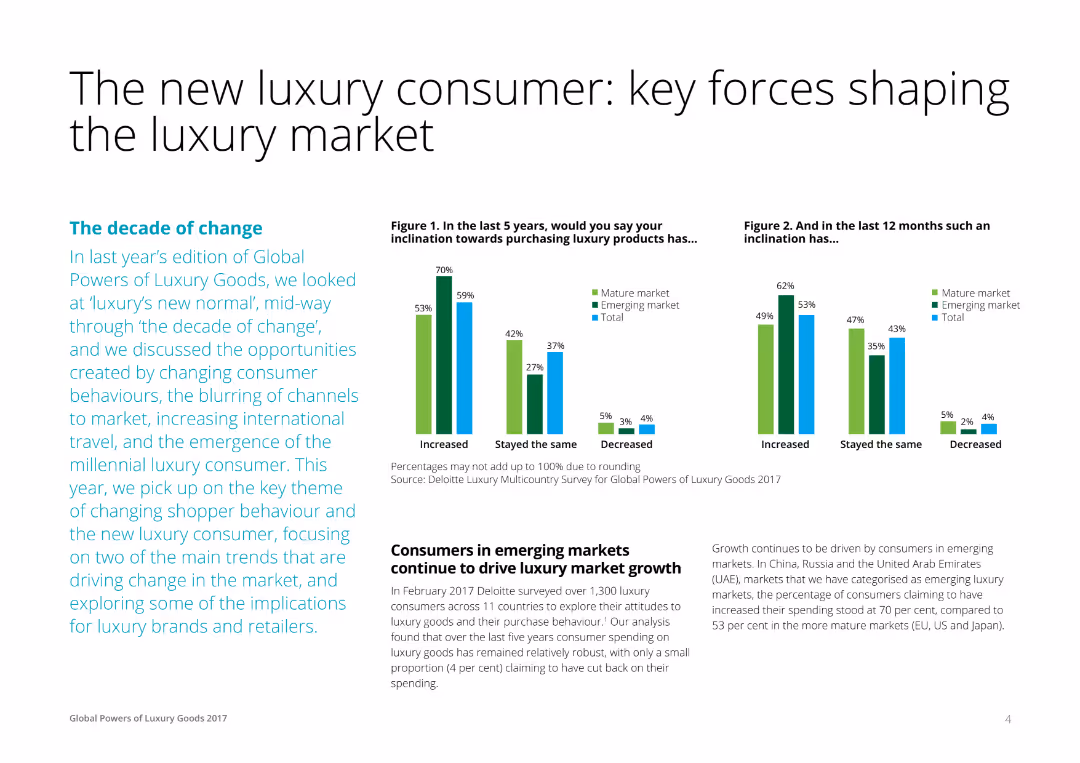
A detailed slide with text on the left and a column chart on the right showing consumer inclination towards luxury products over the past 5 and 12 months. Color-coded bars represent data for mature and emerging markets, and total figures.
Market Analysis and Trends
Consumer Goods
This slide analyzes the key forces shaping the luxury market, focusing on changes in consumer behavior, the rise of the millennial luxury consumer, and market trends over the last year. It includes survey data on consumer inclinations towards luxury goods.
Luxury, Market, Consumer, Trends, Analysis
false
Market Analysis and Trends
Consumer Goods
Multiple Chart
Deloitte
Add to my slides
Remove from favorites
Column chart projecting the global luxury goods market from 2018 to 2028 with different luxury goods categories.
Market Analysis and Trends
Consumer Goods
Provides an outlook for the luxury goods market, showing projected growth rates and market trends.
Luxury, Market, Projection, Growth, Categories
false
Market Analysis and Trends
Consumer Goods
Single Chart
Kearney
Add to my slides
Remove from favorites
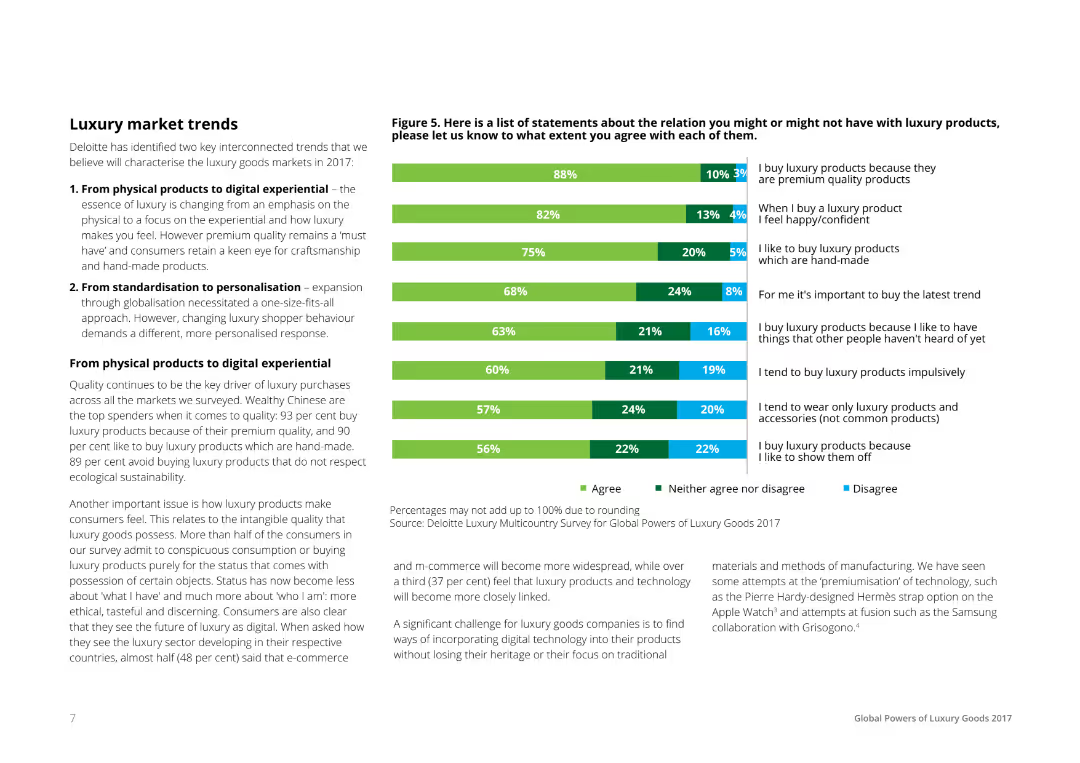
A mix of text and a horizontal bar chart, listing statements about luxury products and consumer agreements. Bars are segmented to show percentages of agreement, neutrality, and disagreement, color-coded in green, gray, and blue respectively.
Market Analysis and Trends
Consumer Goods
The slide discusses luxury market trends identified by Deloitte, focusing on the shift from physical products to digital experiences and from standardization to personalization. It includes consumer survey data on various luxury product statements.
Luxury, Market, Trends, Consumer, Survey
false
Market Analysis and Trends
Consumer Goods
Mixed Chart
Deloitte
Add to my slides
Remove from favorites
Text and bar chart showing market share of top luxury goods markets in 2023.
Market Analysis and Trends
Consumer Goods
Analyzes the market share and growth projections of top markets for luxury goods, focusing on USA and China.
Luxury, Markets, Share, Projections, Growth
false
Market Analysis and Trends
Consumer Goods
Mixed Chart
Kearney
Add to my slides
Remove from favorites
Line chart showing quarterly performance of top luxury players in 2023 vs. 2022.
Competitive Landscape
Consumer Goods
Highlights the performance trends of leading luxury brands and the observed industry-wide slowdown.
Luxury, Performance, Trends, Brands, Industry
false
Competitive Landscape
Consumer Goods
Mixed Chart
Kearney
Add to my slides
Remove from favorites
Complex visual with icons and pathways indicating steps in the luxury purchase process
Market Analysis and Trends
Retail & E-commerce
Details the fragmented journey of luxury purchasing across various channels
Luxury, Purchase Pathways, Consumer Journey, Fragmentation
false
Market Analysis and Trends
Retail & E-commerce
Pillar
BCG
Add to my slides
Remove from favorites
This slide features multiple column charts illustrating M&A trends in discrete automation, including the total number of transactions and valuations for different categories like automation software, process level control, system integrators, machine builders, and component manufacturers.
Mergers and Acquisitions
Industrial & Manufacturing
The slide discusses the expected increase in M&A activity in discrete automation, highlighting trends, investor interests, and the valuation levels across various sub-sectors such as automation software and system integrators.
M&A Activity, Discrete Automation, Investor Trends, Transaction Data, Automation Software, System Integrators, Machine Builders, Component Manufacturers
false
Mergers and Acquisitions
Industrial & Manufacturing
Multiple Chart
LEK
Add to my slides
Remove from favorites
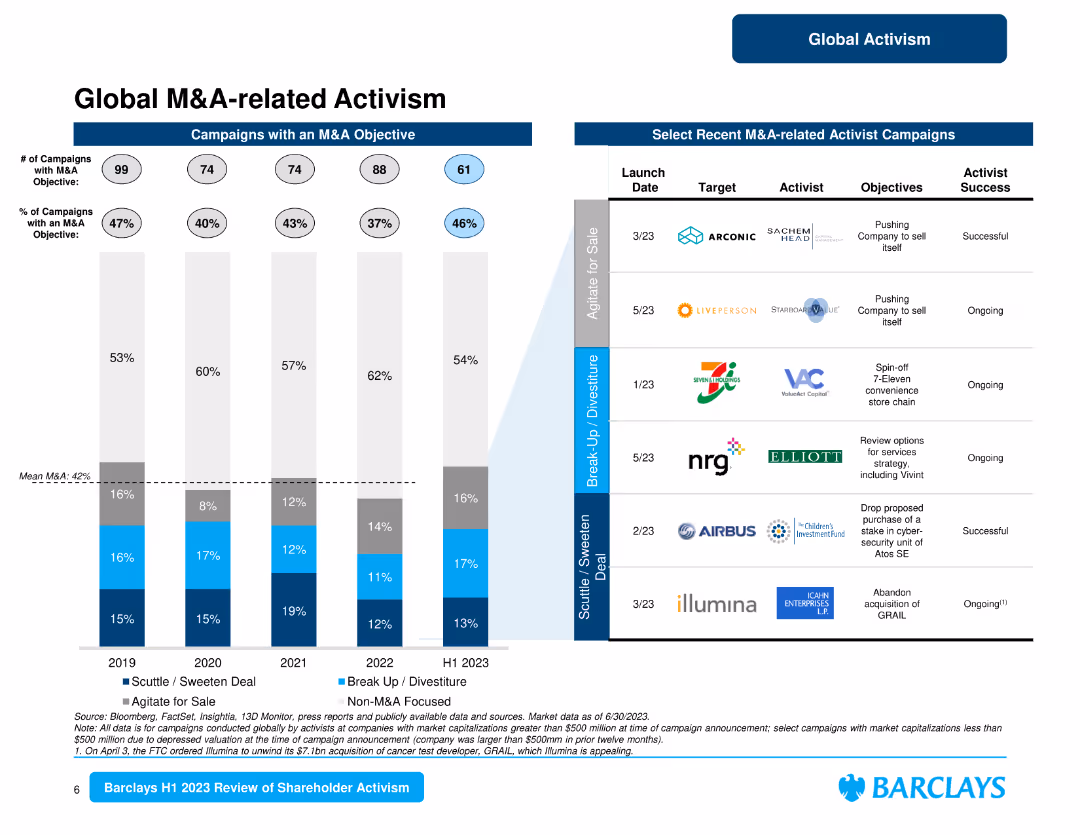
The slide consists of a column chart showing campaigns with M&A objectives and a table with recent M&A-related activist campaigns. It provides a clear visual representation of data related to M&A activism.
Mergers and Acquisitions
Financial Services
Examines the role of M&A-related activism, presenting recent campaigns and highlighting objectives such as company sales, spin-offs, and strategic reviews.
M&A activism, campaigns, objectives, strategic reviews, recent campaigns
false
Mergers and Acquisitions
Financial Services
Mixed Chart
Barclays
Add to my slides
Remove from favorites
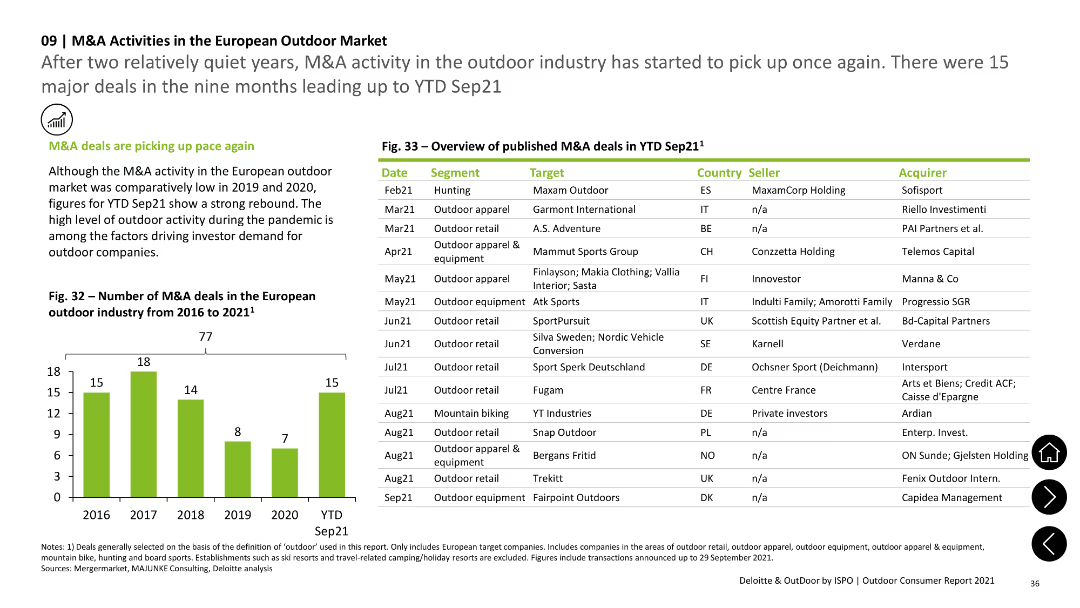
The slide has a column chart showing the number of M&A deals from 2016 to 2021 and a table listing details of M&A deals in 2021, including date, segment, target, country, seller, and acquirer. Text sections add context.
Mergers and Acquisitions
Financial Services
The slide provides an overview of M&A activities in the European outdoor market, with data on the number of deals over recent years and specific details of major deals in 2021, indicating a rebound in M&A activity.
M&A activity, financial services, European market, mergers, acquisitions
false
Mergers and Acquisitions
Financial Services
Mixed Chart
Deloitte
Add to my slides
Remove from favorites
The slide presents bar charts showing historical and projected M&A activity in industrial automation, along with key trends and factors driving this activity.
Mergers and Acquisitions
Industrial & Manufacturing
The slide forecasts increased M&A activity in industrial automation, driven by trends such as digitalization, recurring revenues, and the impact of COVID-19 on investment strategies.
M&A activity, industrial automation, trends, digitalization, COVID-19, investment strategies
false
Mergers and Acquisitions
Industrial & Manufacturing
Multiple Chart
LEK
Add to my slides
Remove from favorites
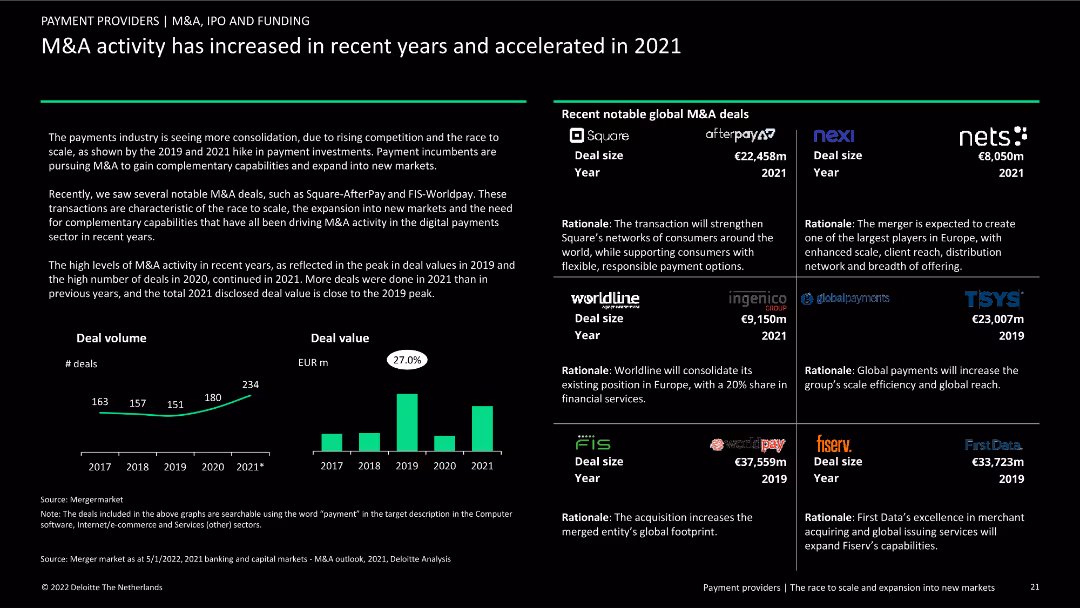
Contains a bar chart showing deal volume and value from 2017 to 2021, and text boxes with notable global M&A deals.
Mergers and Acquisitions
Financial Services
Examination of recent M&A activity in the payments industry, highlighting key deals and the increase in M&A volume and value from 2017 to 2021.
M&A activity, payments industry, deal volume, deal value, notable deals, financial services, market analysis, trends, global perspective
false
Mergers and Acquisitions
Financial Services
Multiple Chart
Deloitte
Add to my slides
Remove from favorites
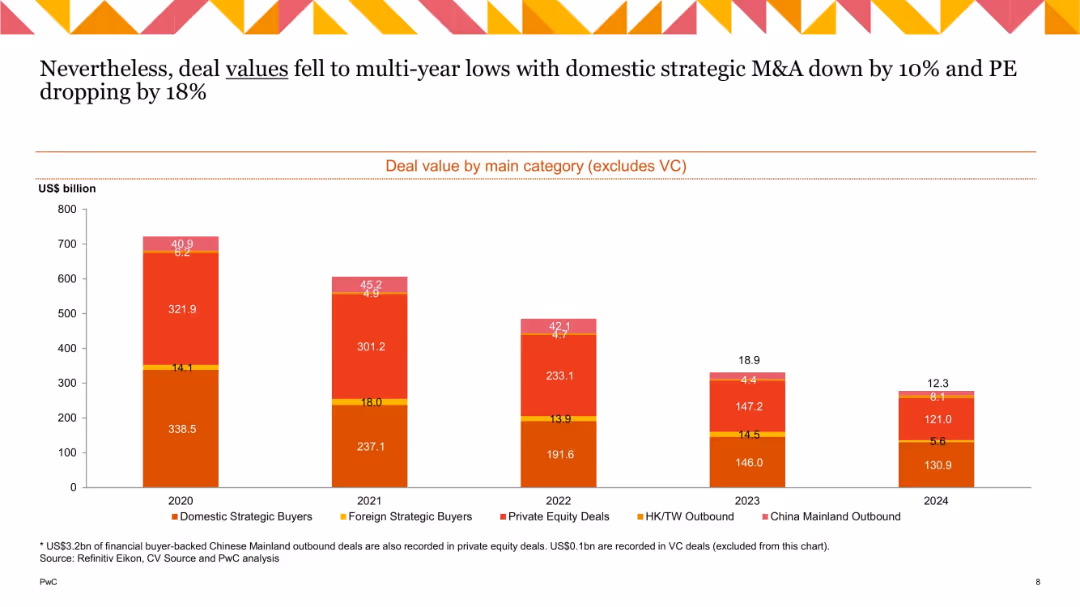
Stacked bar chart (2020–2024) segmented by M&A category; muted red, orange, and yellow colors; value axis on left.
Strategic Planning
Financial Services
Shows the composition of M&A deal value across categories excluding venture capital. Domestic strategic and PE deals saw a significant decline in 2023–24, with PE dropping 18%. Foreign strategic and outbound activity remains limited.
M&A categories, PE, strategic buyers, outbound deals, 2024, deal value
false
Strategic Planning
Financial Services
Single Chart
PwC/Strategy&
Add to my slides
Remove from favorites
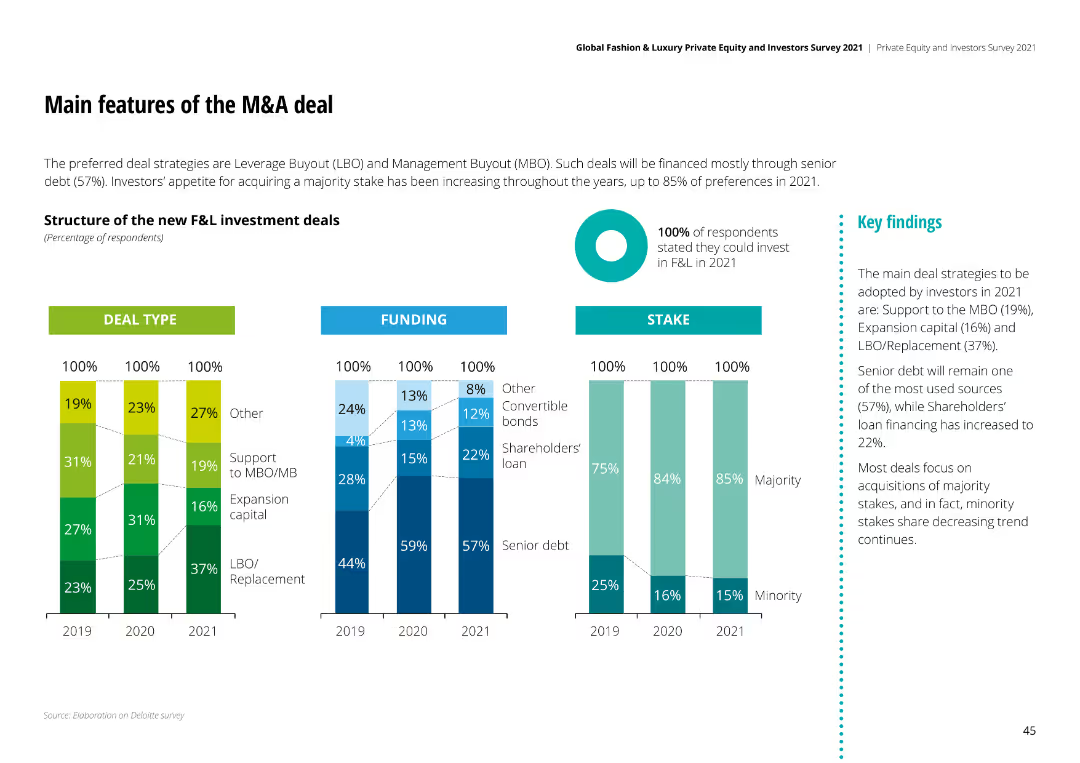
Column charts showing deal types, funding structures, and stake preferences for F&L investment deals, highlighting Leverage Buyouts and Management Buyouts.
Mergers and Acquisitions
Financial Services
Preferred deal strategies are Leverage Buyout (LBO) and Management Buyout (MBO), with senior debt being the primary funding source and majority stakes preferred.
M&A deals, investment strategies, funding structures, stake preferences, Leverage Buyouts
false
Mergers and Acquisitions
Financial Services
Multiple Chart
Deloitte
Add to my slides
Remove from favorites
The slide has high visual complexity with multiple bar graphs, data points, and text blocks. It provides a comprehensive analysis of M&A trends and expectations in the process automation sector over the next few years.
Technology and Digital Transformation
Industrial & Manufacturing
This slide forecasts increased M&A activity in process automation, emphasizing the strategic and financial interests driving these trends. It provides a detailed analysis of the market, including expected investment levels and the sectors most likely to see activity, underscoring the ongoing demand for innovative process automation solutions in a post-COVID-19 economy.
M&A forecasting, Process automation trends, Market analysis, Investment interest
false
Technology and Digital Transformation
Industrial & Manufacturing
Multiple Chart
LEK
Add to my slides
Remove from favorites
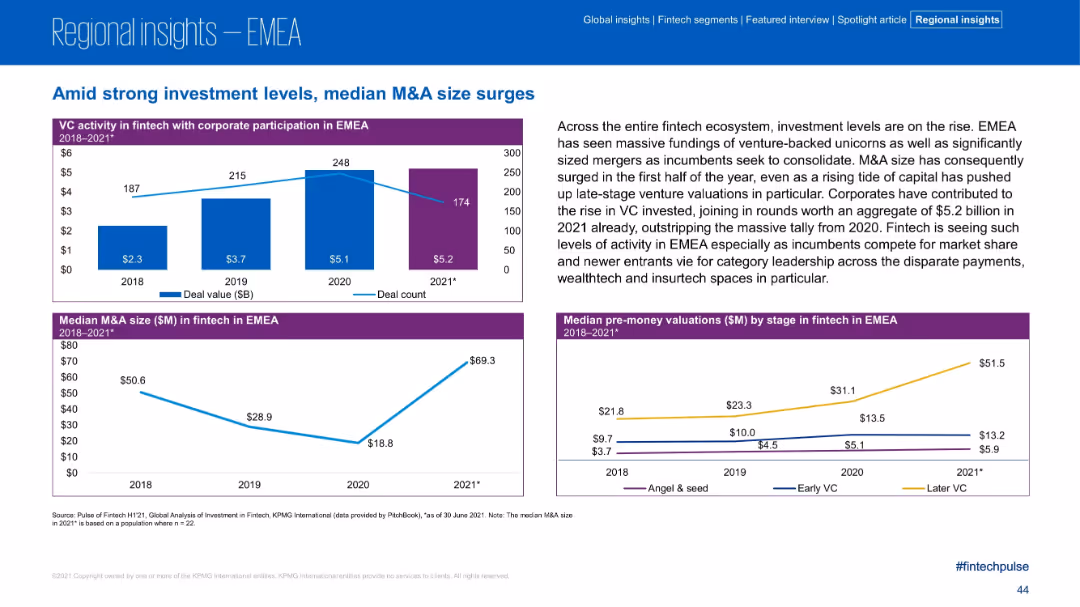
Top chart on corporate VC participation, bottom charts on M&A size and pre-money valuations; narrative highlights surge in unicorns and M&A sizes
Investment Analysis
Financial Services
EMEA fintech saw increased deal sizes and valuations in H1 2021, with rising corporate VC participation. Median M&A deal size jumped to $69.3M. The slide attributes the growth to unicorn funding and consolidation among incumbents. Later VC stages saw a notable rise in pre-money valuations.
M&A size, unicorns, EMEA, corporate VC, fintech growth, valuations, later stage VC, consolidation
false
Investment Analysis
Financial Services
Multiple Chart
KPMG
Add to my slides
Remove from favorites
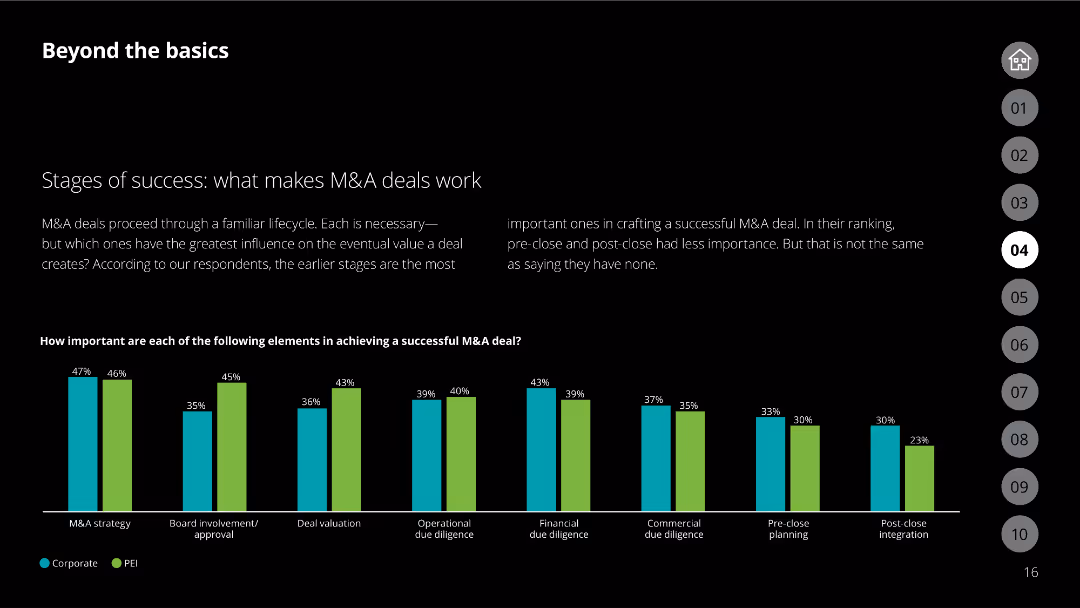
The slide features a column chart comparing corporate and PEI views on the importance of various M&A stages.
Mergers and Acquisitions
Financial Services
Discusses the stages of M&A deals and their influence on the success of these deals according to respondents.
M&A stages, corporate, PEI, deal success, stages importance
false
Mergers and Acquisitions
Financial Services
Single Chart
Deloitte
Add to my slides
Remove from favorites
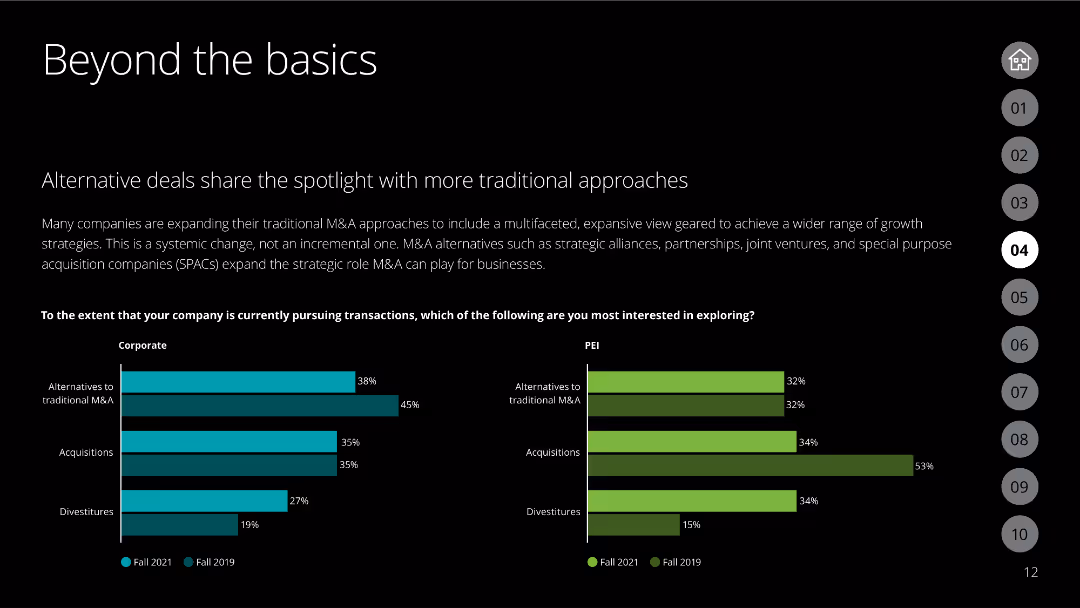
The slide features a column chart comparing corporate and PEI interests in different M&A transaction types in 2021 vs. 2019.
Market Analysis and Trends
Financial Services
Discusses the interest in traditional vs. alternative M&A strategies among corporations and PEIs.
M&A strategies, corporate, PEI, alternative deals, traditional M&A
false
Market Analysis and Trends
Financial Services
Multiple Chart
Deloitte
Add to my slides
Remove from favorites
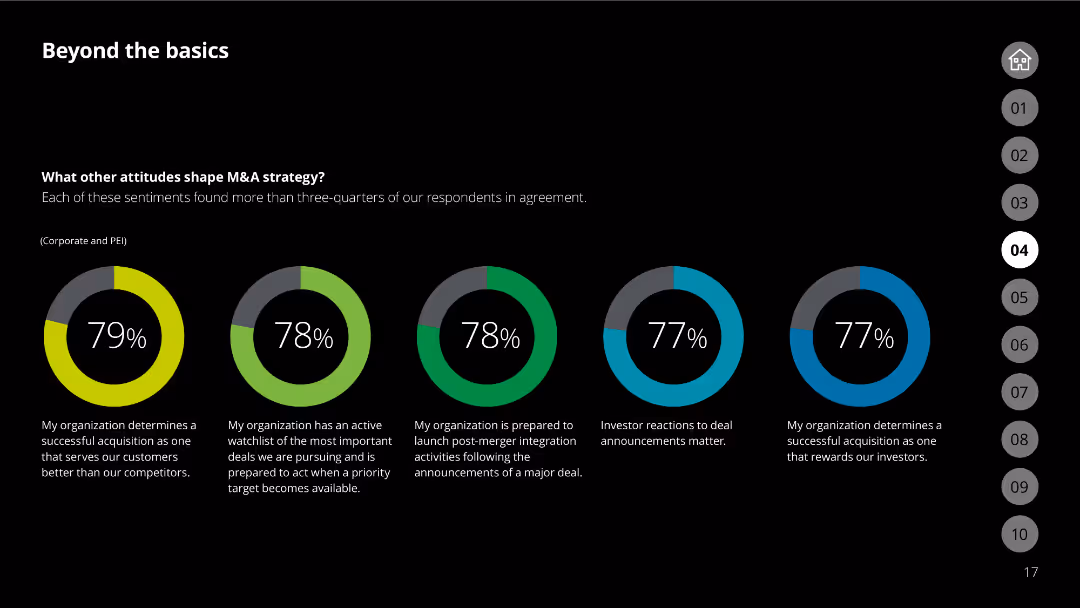
The slide has multiple donut charts showing respondent attitudes towards different M&A strategies.
Strategic Planning
Financial Services
Explores various attitudes that shape M&A strategies among corporations and PEIs.
M&A strategy, corporate, PEI, attitudes, survey
false
Strategic Planning
Financial Services
Multiple Chart
Deloitte
Add to my slides
Remove from favorites
A three-part comparative layout discussing major M&A highlights across industries, including energy, financial services, and consumer sectors.
Market Analysis and Trends
Financial Services
Highlights key M&A activities in 2020, focusing on industries like energy and financial services, including major deals and industry impacts.
M&A, 2020, Philippines, energy, financial services, consumer, industry focus
false
Market Analysis and Trends
Financial Services
Pillar
Deloitte
Add to my slides
Remove from favorites
Split-screen with left-side bar chart and right-side bulleted commentary
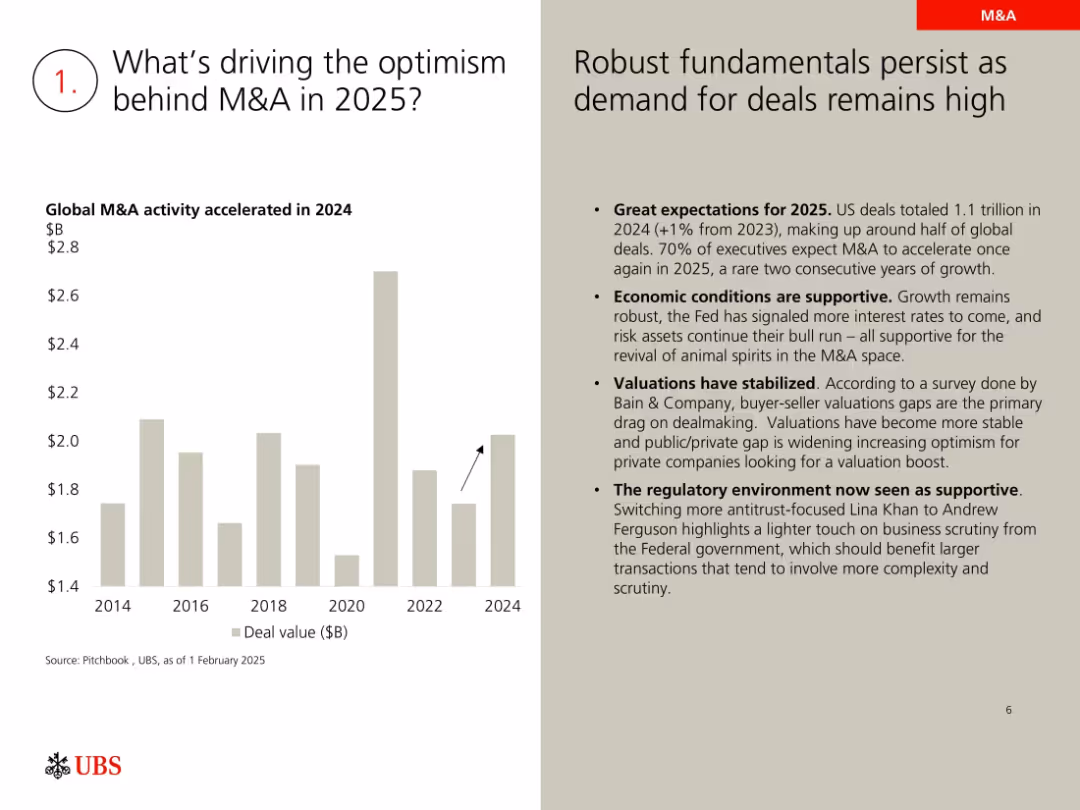
Mergers and Acquisitions
Financial Services
Highlights reasons for optimism in 2025 M&A activity including strong 2024 deal volume, improved economic conditions, stabilized valuations, and a more supportive regulatory environment. Provides statistical support and executive sentiment forecasts.
M&A, 2025 forecast, deal volume, regulatory environment, valuations, executive outlook
false
Mergers and Acquisitions
Financial Services
Mixed Chart
UBS
Add to my slides
Remove from favorites
Split-layout slide: Left side features a vertical bar chart on deal count and value in APAC (2019–2022); right side lists key M&A transactions with logos and structured table format. Blue-themed corporate design.
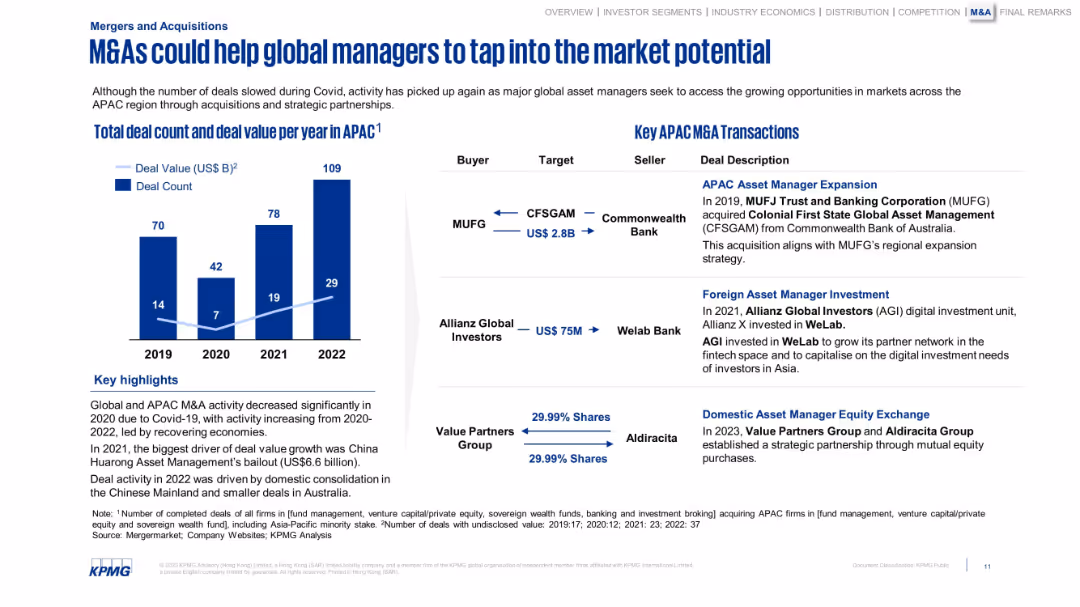
Mergers and Acquisitions
Financial Services
The slide analyzes M&A activity trends in the APAC region, showing recovery post-COVID with rising deal counts and values. It highlights notable transactions involving asset managers like MUFG and Allianz, emphasizing strategic acquisitions and equity exchanges.
M&A, APAC, asset management, strategic partnerships, deal volume, MUFG, Allianz, Value Partners, equity transactions, post-COVID
false
Mergers and Acquisitions
Financial Services
Mixed Chart
KPMG
Add to my slides
Remove from favorites
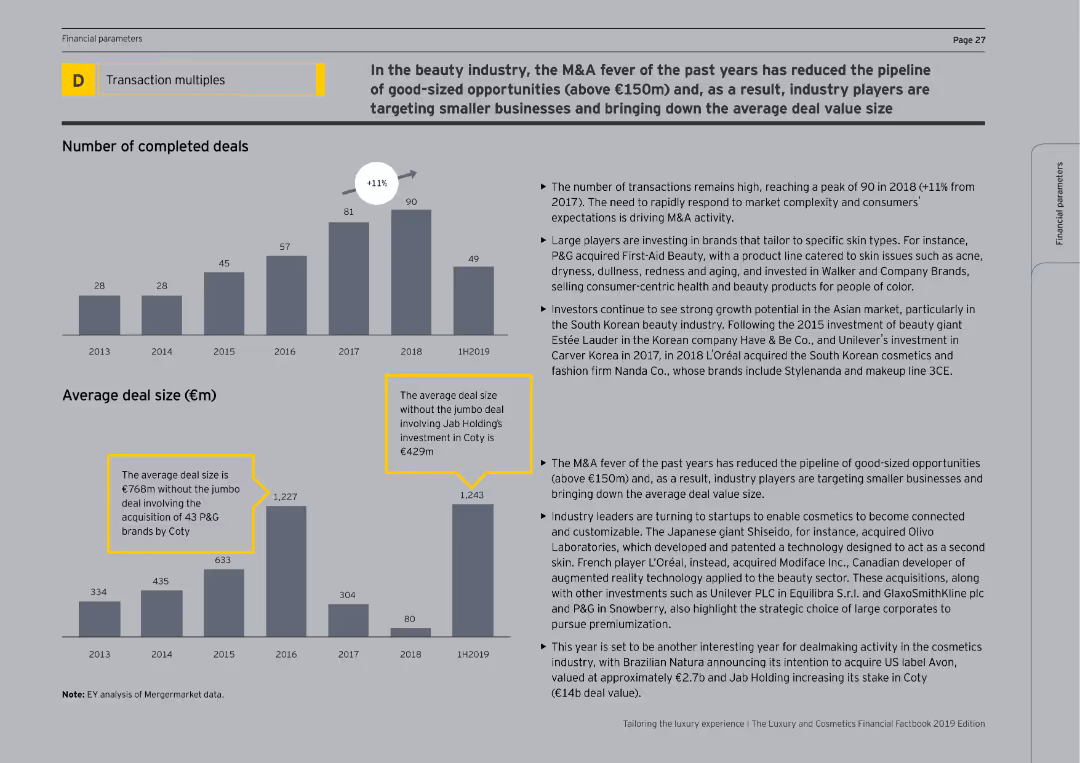
The slide contains column charts depicting the number of completed deals and average deal sizes from 2013 to 1H2019. The text discusses the reduction in large M&A opportunities and the focus on smaller, specialized beauty brands.
Mergers and Acquisitions
Consumer Goods
The slide discusses the trends in M&A activity within the beauty industry, noting a high number of transactions in recent years but a decline in large deal sizes. It highlights the strategic shift towards acquiring smaller, niche beauty brands and the potential for future growth in the sector.
M&A, Beauty, Deals, Acquisitions, Industry Trends
false
Mergers and Acquisitions
Consumer Goods
Multiple Chart
EY
Add to my slides
Remove from favorites
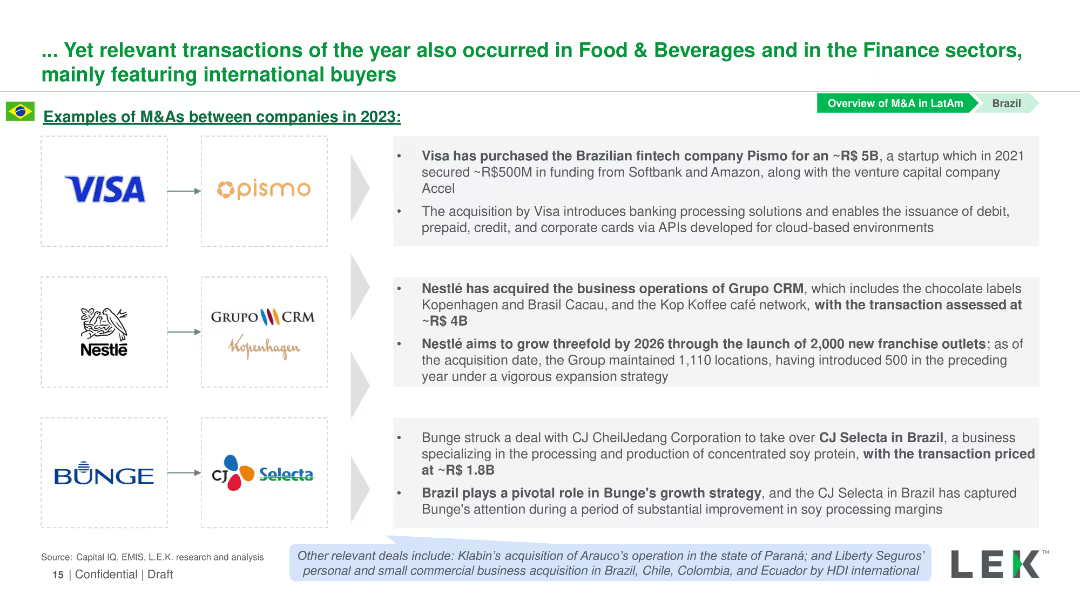
Contains logos of companies involved in M&A deals in 2023, with text descriptions next to each logo detailing the transactions.
Mergers and Acquisitions
Financial Services
Highlights significant M&A transactions in Brazil’s Food & Beverages and Finance sectors, listing the companies involved and details of each deal.
M&A, Brazil, Finance, Food & Beverages, Transactions
false
Mergers and Acquisitions
Financial Services
Table
LEK
Add to my slides
Remove from favorites
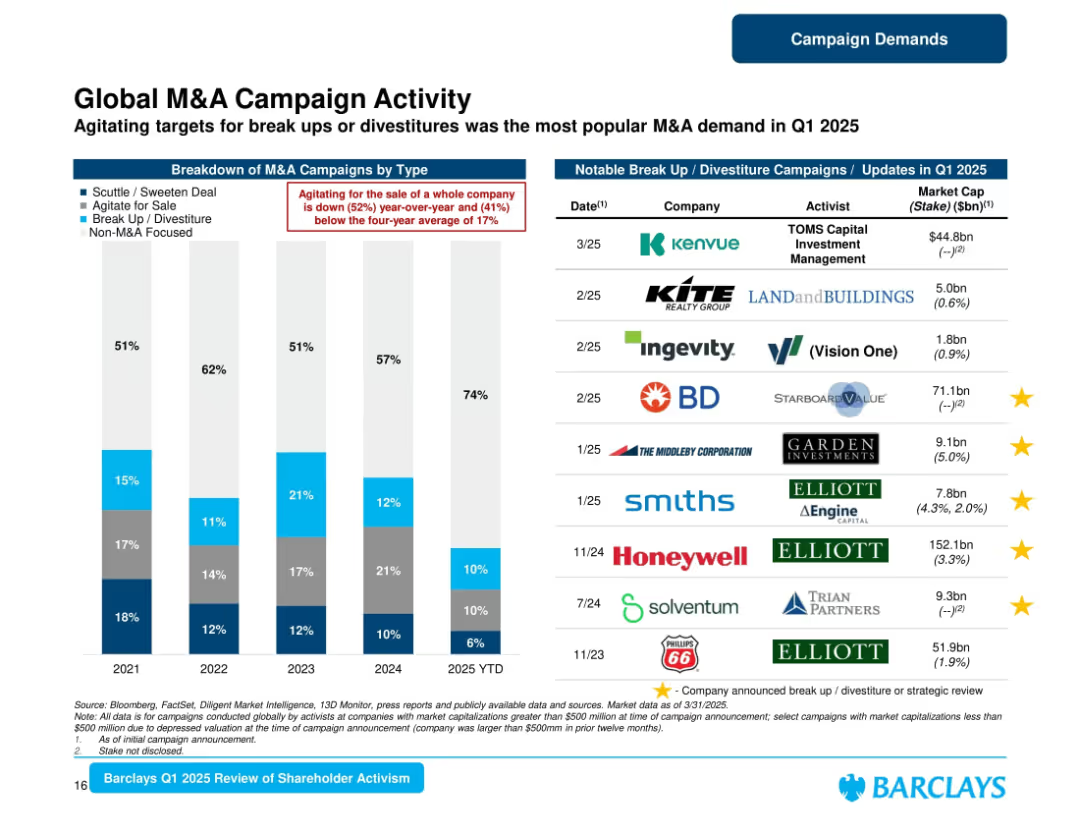
Left section shows stacked bars; right section is a table of notable campaigns with logos and company names.
Mergers and Acquisitions
Financial Services
Reviews M&A-related activist campaigns globally, showing breakdowns by type and a decline in campaigns agitating for full company sales. Includes a list of key break-up/divestiture campaigns with associated firms and market cap data.
M&A, Campaigns, Divestiture, Activists, Global, Shareholder, Barclays, Breakup, 2025
false
Mergers and Acquisitions
Financial Services
Mixed Chart
Barclays
Add to my slides
Remove from favorites
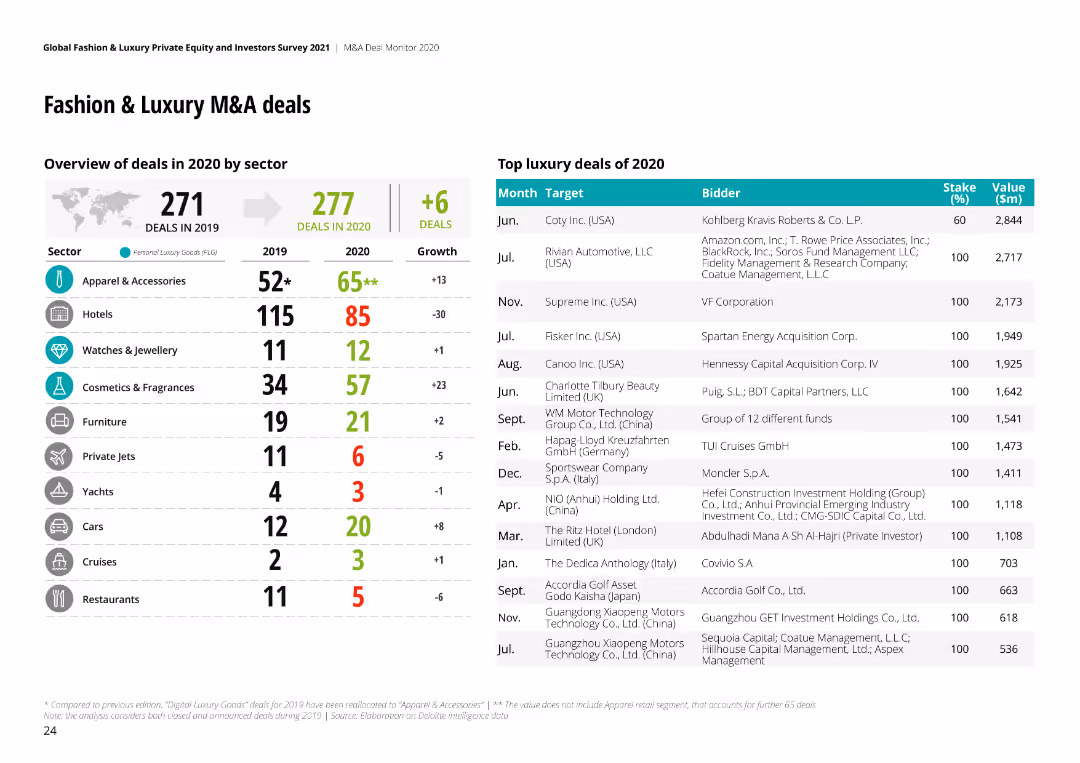
The slide has a table listing M&A deals by sector with a bar chart comparing the number of deals in 2019 and 2020.
Mergers and Acquisitions
Consumer Goods
It provides an overview of M&A deals in the fashion and luxury sector, highlighting growth and decline across various sectors.
M&A, Deals, Fashion, Luxury, Sectors, 2020, 2019
false
Mergers and Acquisitions
Consumer Goods
Header Horizontal
Deloitte
Add to my slides
Remove from favorites
This slide displays a column chart with four bars representing completed M&A activity in emerging private education markets from 2002 to 2013, labeled with "n" numbers indicating the count of deals. There's a title at the top and a table below showing global deals totals.
Investment Analysis
Education & Training
The slide is used to present M&A activity trends in Asian education, highlighting a substantial increase in completed deals over four specified periods, from 2002-2004 to 2011-2013. The upward trend suggests growing investor interest in the sector.
M&A, Education, Asia, Trend, Increase, Deals, Private, Investor Participation, Exponential, Decade
false
Investment Analysis
Education & Training
Single Chart
EY
Add to my slides
Remove from favorites
Bar and patterned bar charts compare the deal values of FGA acquisitions in technology M&A, with highlights on major deals such as Google's and Facebook's acquisitions.
Mergers and Acquisitions
Technology & Software
The slide compares FGA acquisitions against overall technology M&A deal values, underscoring their relatively small proportion with emphasis on notable exceptions. Suitable for M&A trend analysis.
M&A, FGA, Technology, Deal Value, Acquisitions
false
Mergers and Acquisitions
Technology & Software
Mixed Chart
Oliver Wyman
Add to my slides
Remove from favorites
Slide includes two pie charts and a column chart, contrasting the perceptions of value creation with actual outcomes in M&A transactions. It also details factors contributing to the failure of achieving the expected synergies, like integration and due diligence issues.
Mergers and Acquisitions
Financial Services
Explores the common pitfalls in M&A transactions that lead to failure in achieving expected outcomes, focusing on integration challenges and discrepancies in perceived versus actual value.
M&A, Failures, Value, Integration, Due Diligence, Transactions, Challenges
false
Mergers and Acquisitions
Financial Services
Multiple Chart
Deloitte
Add to my slides
Remove from favorites
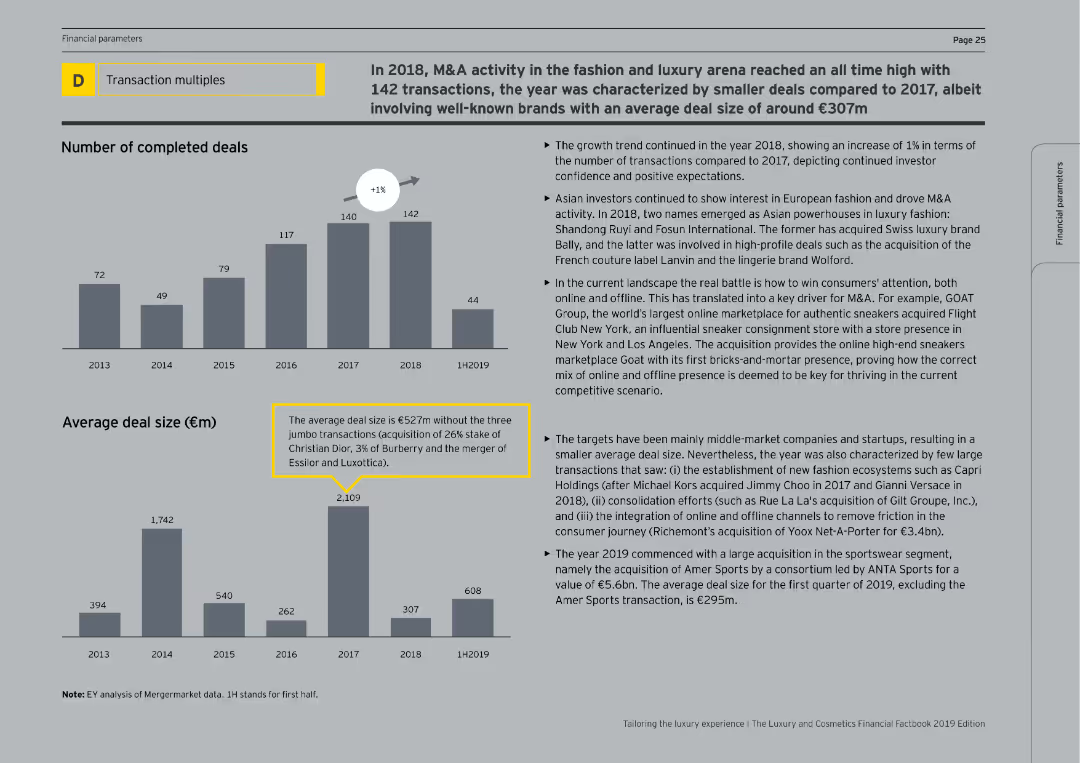
The slide includes a column chart showing the number of completed deals from 2013 to 1H2019 and average deal sizes. The text on the right provides an analysis of M&A trends, with a focus on smaller deal sizes and high-profile acquisitions.
Mergers and Acquisitions
Consumer Goods
The slide details the record-high M&A activity in 2018 within the fashion and luxury sectors, emphasizing the number of transactions, average deal sizes, and notable acquisitions. It also discusses the trends driving this activity, including the focus on smaller, high-value brands.
M&A, Fashion, Luxury, Deals, Acquisitions
false
Mergers and Acquisitions
Consumer Goods
Multiple Chart
EY
Add to my slides
Remove from favorites
Two sets of column charts show Goldman Sachs M&A Fee Share by deal size and coverage rate by client size. Annotations provide additional context about client coverage and deal segmentation.
Market Analysis and Trends
Financial Services
The slide presents data on the firm's M&A fee share across different deal sizes and its client coverage rate in Americas and EMEA. It emphasizes the uniform fee share for well-covered clients across all sizes and the potential to increase fee share by expanding client coverage, showcasing strategic market positioning and client relationship management.
M&A, Fee Share, Client Coverage, Deal Size, Strategy, Market Positioning
false
Market Analysis and Trends
Financial Services
Multiple Chart
Goldman Sachs
Add to my slides
Remove from favorites
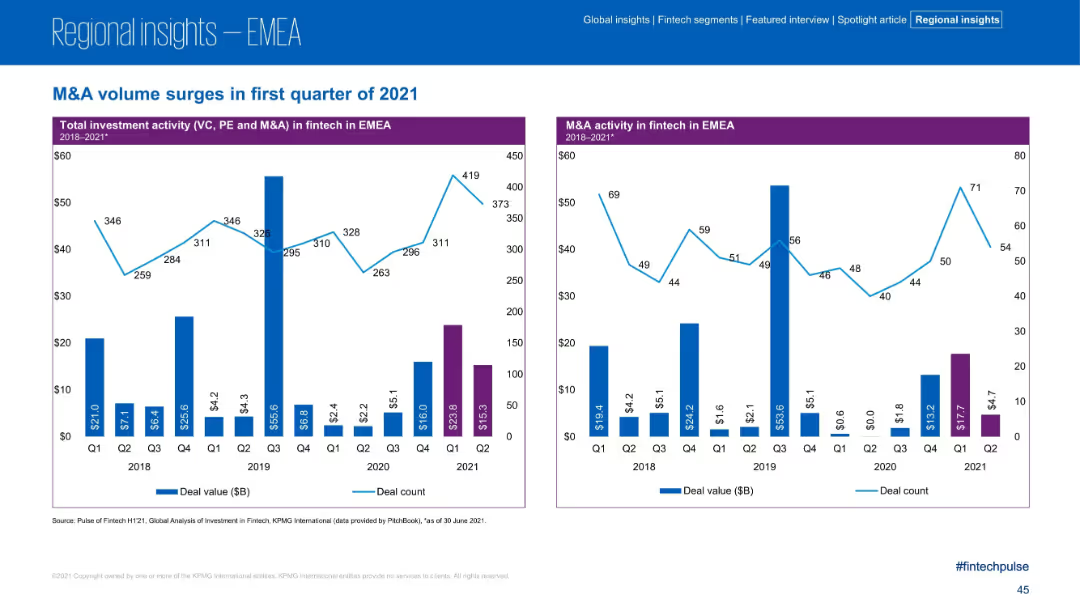
Two-panel bar and line chart layout; left chart covers total investment activity (VC, PE, M&A); right chart focuses on M&A activity; consistent blue and purple color scheme; simple data visuals.
Strategic Planning
Financial Services
The slide showcases the surge in fintech M&A activity in the EMEA region during Q1 2021, with strong increases in both deal value and count. It provides quarterly trend data from 2018–2021 for total investment and M&A-specific metrics, highlighting Q1 2021 as a peak period.
M&A, Fintech, EMEA, Investment, Deal Value, Deal Count, Q1 2021, Trends, PE, VC
false
Strategic Planning
Financial Services
Multiple Chart
KPMG
Add to my slides
Remove from favorites
Features two graphs: a line graph representing M&A activity and a column chart depicting IPO activity, both against a historical average. It has a straightforward design with clear labels and a legend.
Investment Analysis
Technology & Software
The slide provides insights into market trends for mergers, acquisitions, and IPOs in the tech sector, offering a comparative analysis of past and projected activities, which can guide strategic decisions in finance.
M&A, IPO, market trends, tech sector, strategic planning, financial analysis, VC-backed, buyout activity
false
Investment Analysis
Technology & Software
Multiple Chart
JP Morgan
Add to my slides
Remove from favorites
Previous
Next
You don't have any favorites yet.
Please wait loading your favorites slides...
Create a FREE account to continue browsing
Receive Instant Access to 1,000+ slides from companies like McKinsey, Google, and Goldman Sachs
First Name
Last Name
Email
Password
I agree to all
Terms & Privacy Policy
Thank you! Your submission has been received!
Oops! Something went wrong while submitting the form.
Have an account?
Sign in
Upgrade to PRO to Save slides
Advanced Search and Filters
Access to 15,000+ slides
Access to Category Pages
Save/Bookmark Slides
PowerPoint Template Library
Pick a Plan
MONTHLY
$12/month
Billed every month, Cancel anytime.
YEARLY
$9/year
Billed $108 annually, Cancel anytime.
Checkout for $12/month
Checkout for $108/yr
Secured by Stripe | AES-256 bit encryption