My Account
My Slides
Search by Category
Pricing
Templates
View All Templates
Download Template Slides
✦ AI Search
Feedback
Login
Logout
Get Started
Browse all Slides
Browse all Slides
Create a FREE Account
Instant access to 1,000+ real slides from top companies like McKinsey, BCG, Goldman Sachs, Google and many more!
First Name
Last Name
Email
Password
I agree to all
Terms & Privacy Policy
Thank you! Your submission has been received!
Oops! Something went wrong while submitting the form.
Have an account?
Sign in
Saved Slides
Total No. of slides saved
0
↻ Refresh
✖ Clear all
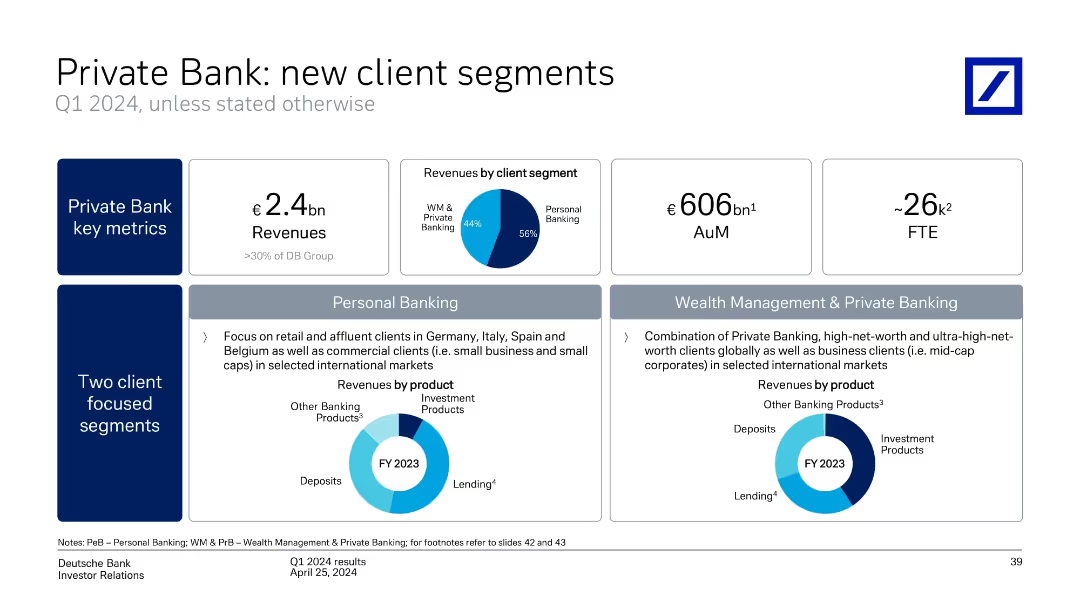
Multi-panel layout with revenue figures, donut charts, and segment descriptions. Structured into key metrics and two client segments.
Customer and Market Segmentation
Financial Services
This slide details Q1 2024 performance in Deutsche Bank’s Private Bank, including €2.4bn revenue, client segmentation (Personal vs. Wealth Management), and regional and product-based focuses. Charts show revenue by client segment and product types.
Private Bank, Client Segments, Wealth Management, Personal Banking, Revenue, Q1 2024, AuM, FTE, Client Focus
false
Customer and Market Segmentation
Financial Services
Multiple Chart
Deutsche Bank
Add to my slides
Remove from favorites
The slide includes column charts comparing data from different years.
Investment Analysis
Financial Services
Shows the growth of the Global Private Bank by comparing the number of hires, training hours, and advisor revenue contribution across years.
Private Bank, Growth, Hires, Training
false
Investment Analysis
Financial Services
Multiple Chart
JP Morgan
Add to my slides
Remove from favorites
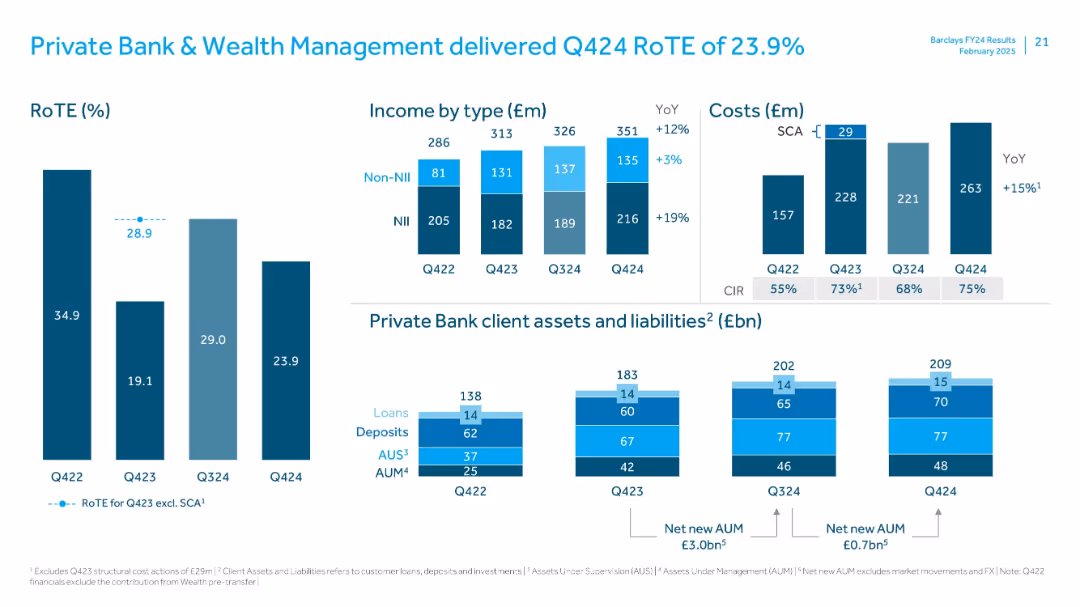
Bar charts for RoTE and income; bottom section covers client assets and liabilities using stacked bars
Financial Performance
Financial Services
Reviews Private Bank & Wealth Management’s Q424 RoTE performance. Income rose YoY, driven by NII growth. Assets under management and supervision increased, highlighting strong net new inflows. CIR and cost movements also explained.
Private Bank, Wealth Management, RoTE, AUM, AUS, NII, CIR, client assets, liabilities
false
Financial Performance
Financial Services
Multiple Chart
Barclays
Add to my slides
Remove from favorites
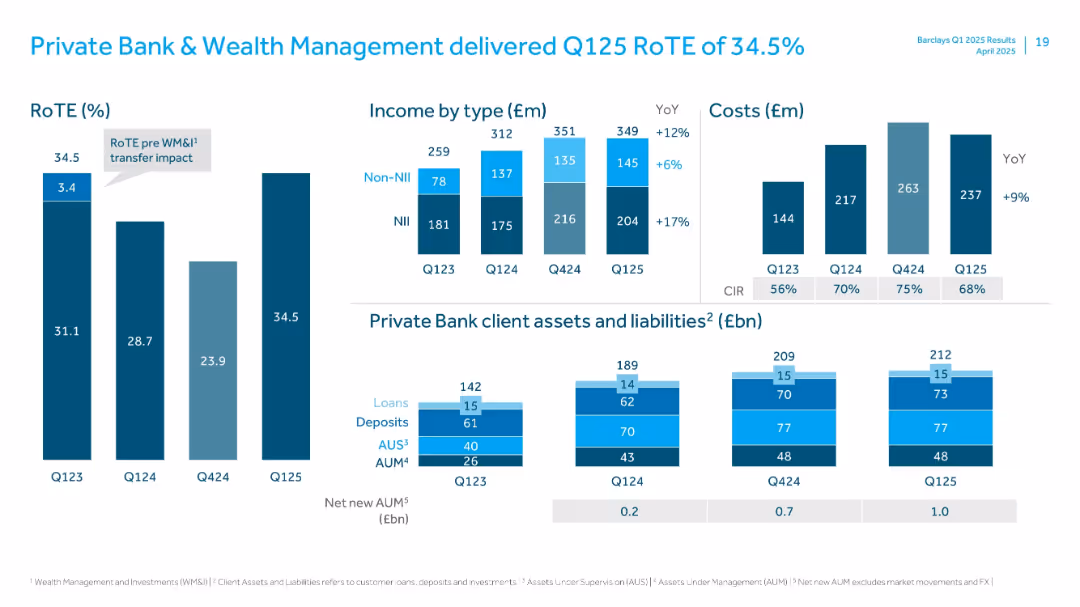
Stacked bar charts showing income, cost, RoTE, and client assets/liabilities with detailed breakdowns.
Financial Performance
Financial Services
Reports strong performance in Private Banking with RoTE of 34.5%. Provides breakdown of income types, costs, and evolution of client assets like loans, deposits, AUS, and AUM. Notes YoY growth in all income and client metric categories.
Private Bank, Wealth Management, RoTE, AUM, AUS, NII, Non-NII, Q125, Client Assets
false
Financial Performance
Financial Services
Multiple Chart
Barclays
Add to my slides
Remove from favorites
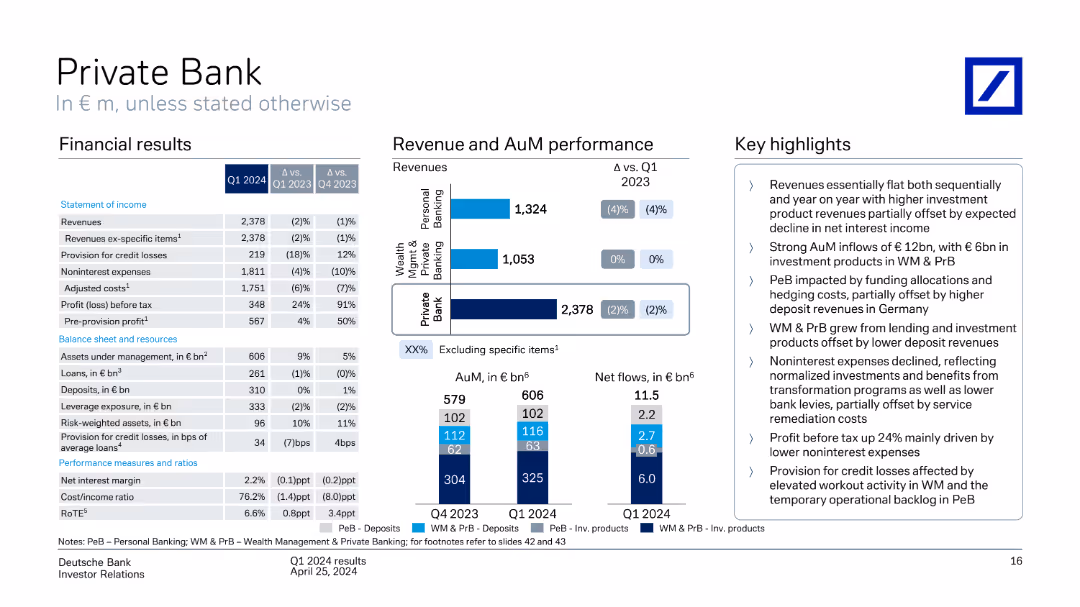
A column chart and bar chart showing revenue and assets under management performance, with a table of financial results and key highlights. The slide is detailed with a balance of text and visuals.
Financial Performance
Financial Services
The slide presents Q1 2024 financial results for the Private Bank, including revenue, profit, and assets under management, with a detailed breakdown of performance across different segments.
Private Bank, revenue performance, financial results, assets under management
false
Financial Performance
Financial Services
Multiple Chart
Deutsche Bank
Add to my slides
Remove from favorites
This slide is a stacked bar chart titled "Global private capital dry powder". It shows various categories of investments stacked over a timeline from 2005 to 2022. The colors differentiate types of private capital like buyout, venture capital, etc. The chart peaks in 2022, emphasizing the increase with "$3.7T".
Investment Analysis
Financial Services
Depicting the accumulation of unallocated private capital over time, this slide can be utilized to discuss investment strategies and potential market saturation with a focus on future allocations in private equity.
Private Capital, Dry Powder, Investment, Buyout, Venture Capital, Market Saturation, Equity
false
Investment Analysis
Financial Services
Multiple Chart
Bain
Add to my slides
Remove from favorites
This is a complex slide with a central circular diagram linking different business services, accompanied by images and statistics related to private capital, tech innovation, and principal investment.
Investment Analysis
Financial Services
Discusses Macquarie's multifaceted approach to combining ideas and capital to unlock business opportunities, particularly in private capital and tech innovation. Geared towards investors and businesses looking to understand investment landscapes.
Private Capital, Tech Innovation, Investment, Business Opportunities
false
Investment Analysis
Financial Services
Framework
Morgan Stanley
Add to my slides
Remove from favorites
Left-aligned bar chart over a dark gradient background; bars color-coded by region with annotations. Right side has detailed explanation in white text.
Investment Analysis
Financial Services
Illustrates the significant and steady growth in global private credit AUM since 2000, driven by non-bank lenders and structural shifts in financial services. The slide also discusses regulatory implications and market expansion potential for non-banks.
Private Credit, AUM, CAGR, Non-Banks, Regulation, Lending, Structured Finance, Dry Powder, Regional Growth
false
Investment Analysis
Financial Services
Mixed Chart
Accenture
Add to my slides
Remove from favorites
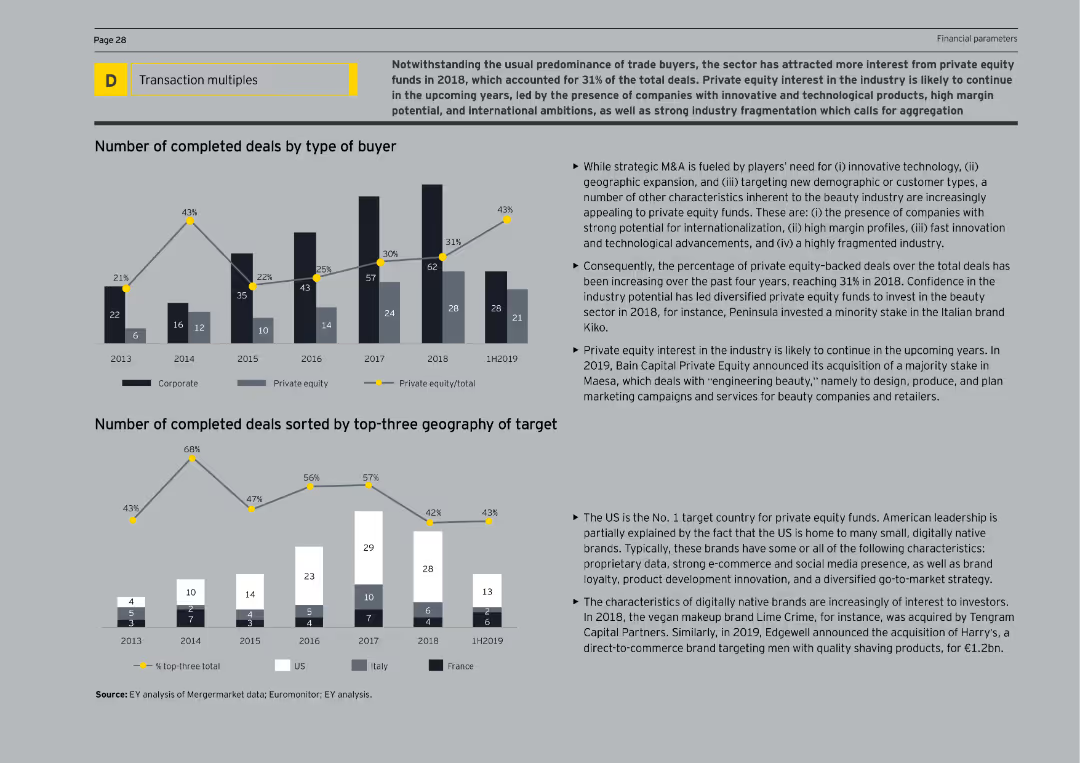
The slide features column charts showing the number of completed deals by buyer type and geography of targets from 2013 to 1H2019. The text explains the growing interest from private equity funds and the characteristics of attractive target companies.
Mergers and Acquisitions
Consumer Goods
The slide examines the growing interest of private equity funds in the beauty sector, highlighting the increasing number of deals by these investors. It provides an overview of the types of companies attracting private equity and the geographical distribution of these investments.
Private Equity, Beauty, M&A, Investments, Deals
false
Mergers and Acquisitions
Consumer Goods
Multiple Chart
EY
Add to my slides
Remove from favorites
Presents a bar chart illustrating the change in global buyout value over years, with the latest year highlighted in red.
Investment Analysis
Financial Services
Discusses the significant drop in global buyout value in 2022, providing insights into the private equity market conditions.
Private Equity, Buyout Value, Market Analysis, 2022 Drop, Investment Trends, Bar Chart, Equity Market Conditions
false
Investment Analysis
Financial Services
Mixed Chart
Bain
Add to my slides
Remove from favorites
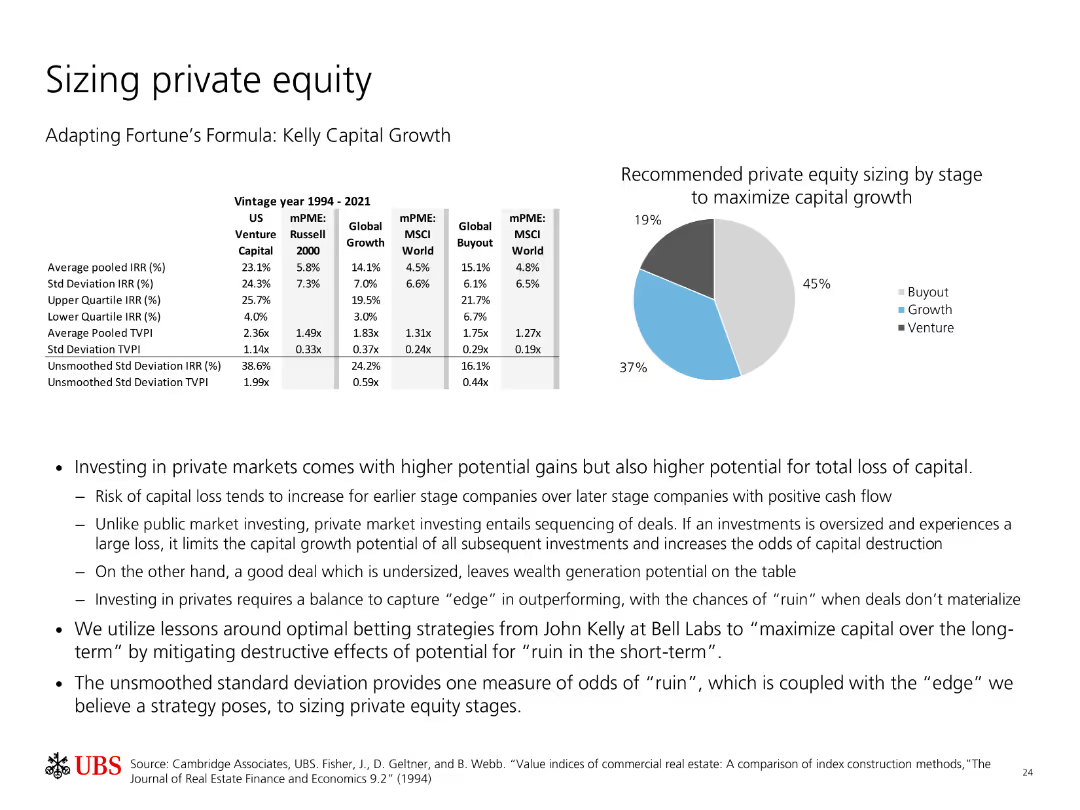
Contains a table with vintage year performance data for private equity and a pie chart showing recommended private equity sizing by stage for maximizing capital growth.
Strategic Planning
Financial Services
Discusses the performance of private equity across different stages and provides recommendations for optimal sizing to maximize capital growth based on historical data.
Private Equity, Capital Growth, Vintage Performance, Risk, Strategy, Investment, Analysis, Recommendations, Kelly Formula
false
Strategic Planning
Financial Services
Mixed Chart
UBS
Add to my slides
Remove from favorites
The slide has a central pyramid diagram detailing EY's private equity services, surrounded by text boxes explaining different service categories.
Corporate Finance and Valuation
Professional Services
This slide describes the various services EY offers for private equity clients, organized into fund services, strategy and transaction services, and portfolio services, aimed at enhancing investment value and performance.
Private Equity, EY Services, Fund Services, Strategy, Transaction, Portfolio
false
Corporate Finance and Valuation
Professional Services
Framework
EY
Add to my slides
Remove from favorites
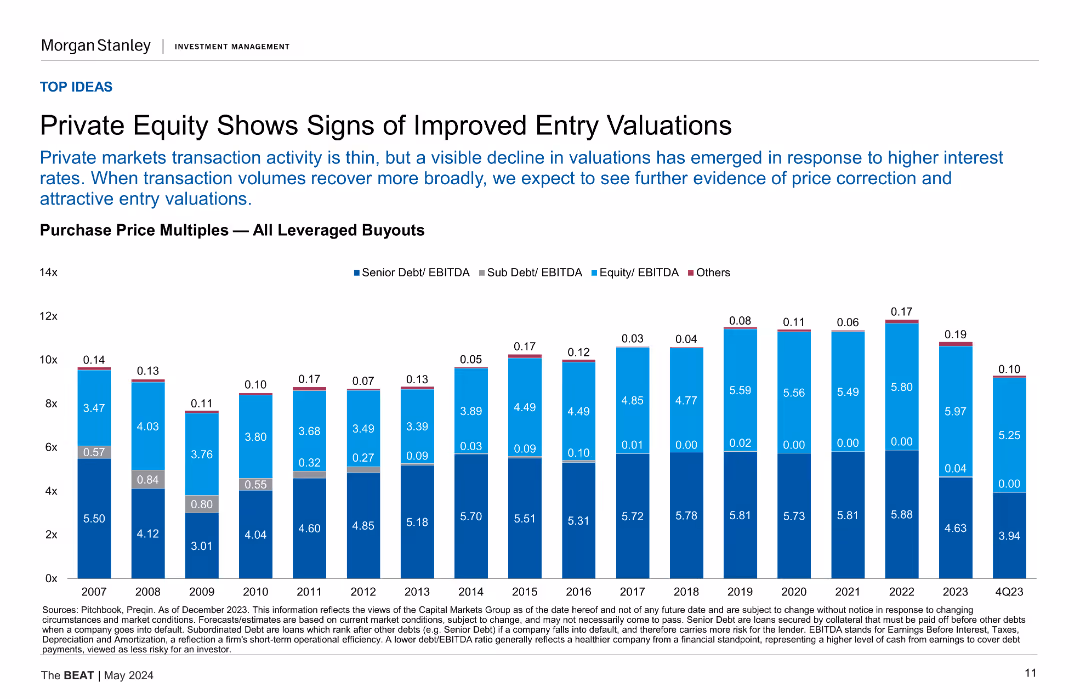
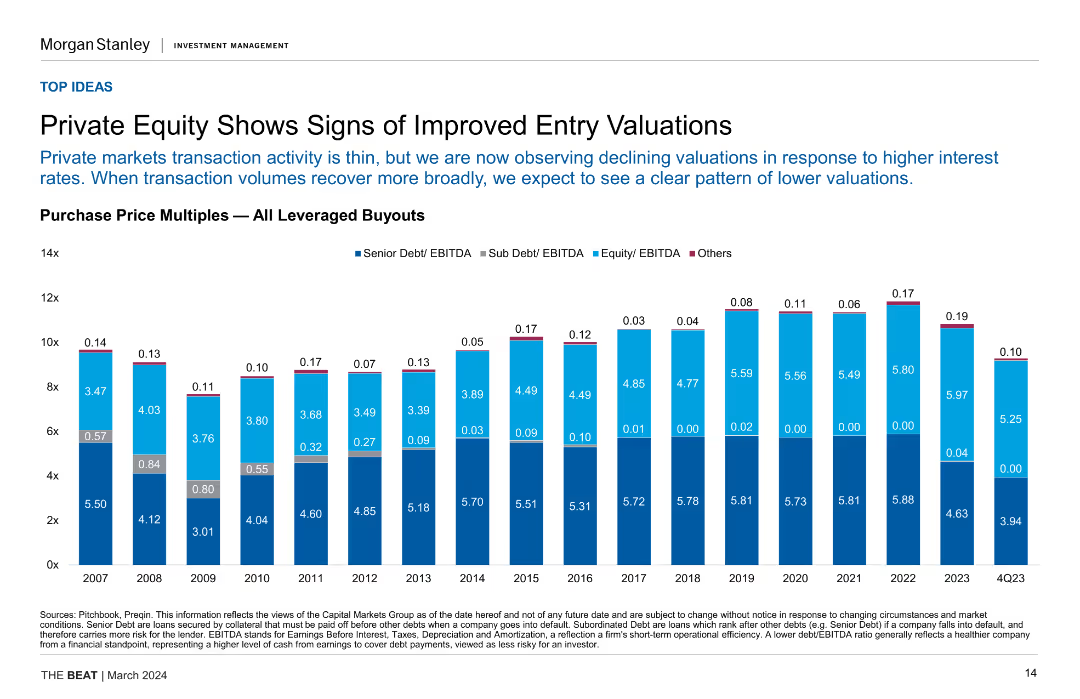
This slide includes a column chart displaying purchase price multiples for leveraged buyouts from 2007 to 4Q2023, segmented by Senior Debt/EBITDA, Sub Debt/EBITDA, Equity/EBITDA, and Others.
Investment Analysis
Financial Services
Indicates that private equity valuations have improved, with entry multiples declining in response to higher interest rates, suggesting better entry opportunities in leveraged buyouts.
Private Equity, Entry Valuations, Leveraged Buyouts, Purchase Price Multiples, Investment, Interest Rates
false
Investment Analysis
Financial Services
Mixed Chart
Morgan Stanley
Add to my slides
Remove from favorites
A title slide with dramatic ocean imagery in the background and bold, white text overlaying it, presenting the report's theme.
Industry Overview
Financial Services
Serves as the introductory slide for a report on global private equity, setting the tone for the data and analysis that will follow.
Private Equity, Global Report, Financial Services, Introduction, Market Overview, Dramatic Imagery, Title Slide
false
Industry Overview
Financial Services
Title
Bain
Add to my slides
Remove from favorites
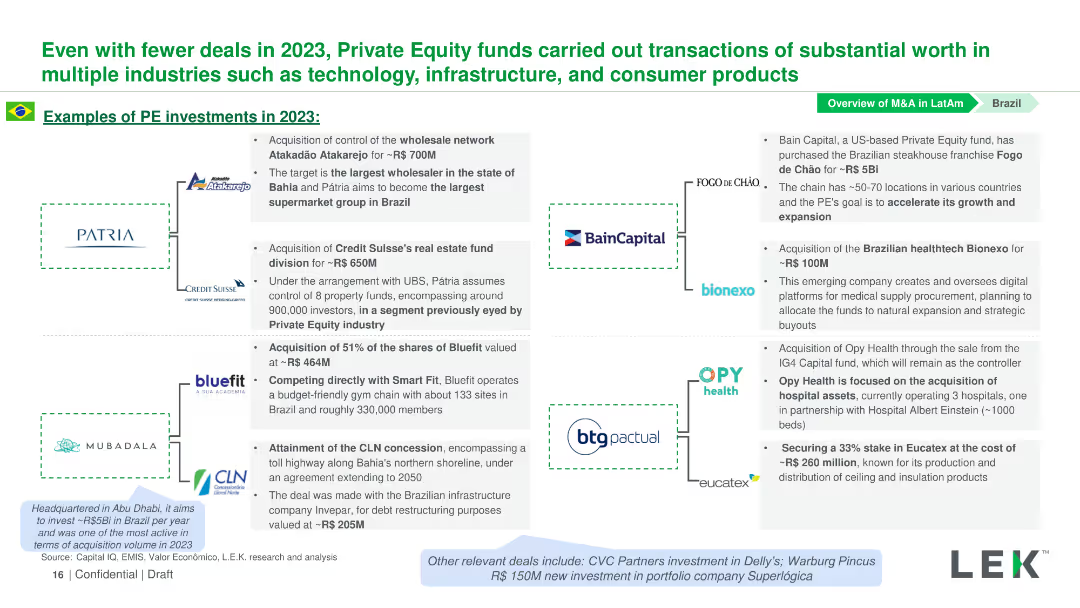
Contains logos of companies involved in PE investments in 2023, with text descriptions next to each logo detailing the investments.
Investment Analysis
Financial Services
This slide details notable PE investments in Brazil in 2023 across various industries, including technology, infrastructure, and consumer products.
Private Equity, Investments, Brazil, Technology, Infrastructure
false
Investment Analysis
Financial Services
Diagram
LEK
Add to my slides
Remove from favorites
Displays column charts comparing the growth of private equity markets and strategies, using data annotations for clarity.
Investment Analysis
Financial Services
Provides an analysis of JPMorgan’s approach to private equity coverage, detailing the market's potential and the bank's strategic actions to maintain discipline and focus on middle market financial sponsors.
Private Equity, Market Analysis, Strategy, Financial Sponsorship, Growth, Investment
false
Investment Analysis
Financial Services
Multiple Chart
JP Morgan
Add to my slides
Remove from favorites
The slide shows a comparative bar graph titled "End-to-end pooled net IRR" with investment horizons for US, Western Europe, and Asia-Pacific. It compares the performance of buyout funds against standard market indices in red and gray.
Investment Analysis
Financial Services
Demonstrates the performance of private equity against public markets across various investment horizons, essential for investment strategies and performance benchmarking.
Private Equity, Performance, Investment Horizons, Public Markets, Benchmarking, IRR
false
Investment Analysis
Financial Services
Multiple Chart
Bain
Add to my slides
Remove from favorites
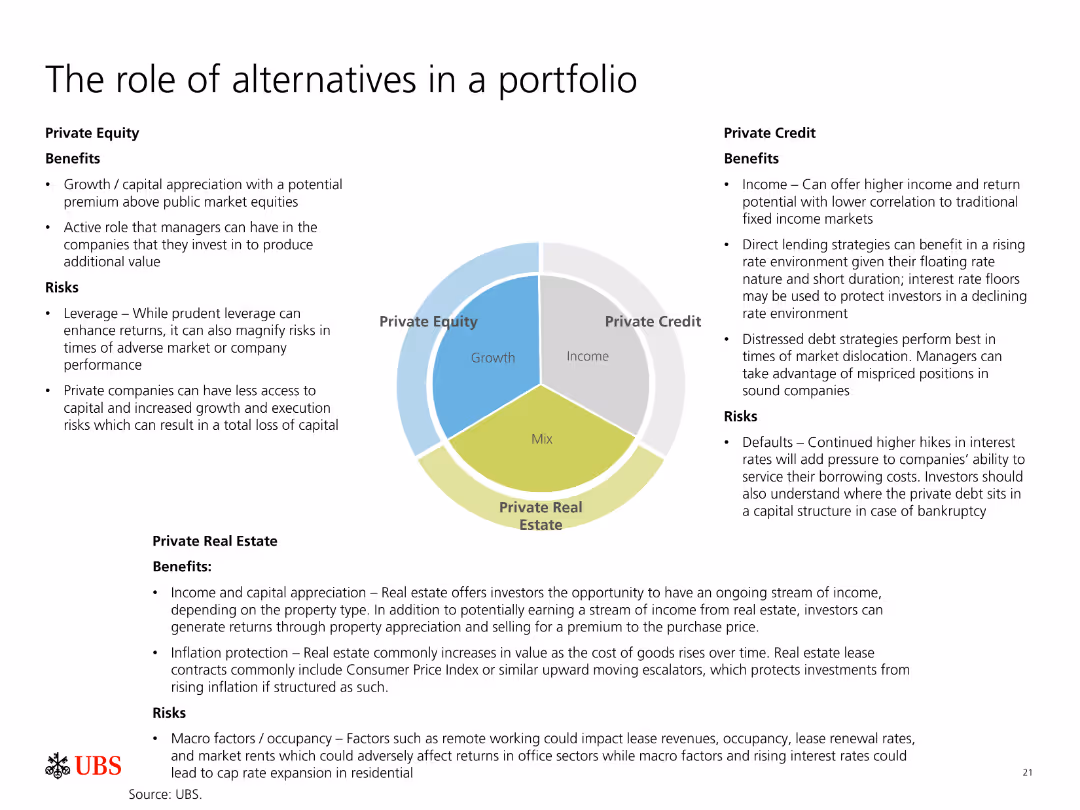
The slide is divided into three sections, each discussing the benefits and risks of Private Equity, Private Credit, and Private Real Estate. A pie chart in the center shows their roles.
Investment Analysis
Financial Services
Describes the roles, benefits, and risks associated with Private Equity, Private Credit, and Private Real Estate in a portfolio, highlighting their potential for growth and income.
Private Equity, Private Credit, Real Estate, Investment, Portfolio, Growth, Income, Risks, Benefits, Strategies
false
Investment Analysis
Financial Services
Diagram
UBS
Add to my slides
Remove from favorites
A column chart showing purchase price multiples for leveraged buyouts from 2007 to Q4'23.
Investment Analysis
Financial Services
This slide analyzes the trends in private equity valuations, indicating a decline in valuations and potential for attractive entry points in the market.
Private Equity, Valuations, Column Chart, Leveraged Buyouts, Market Trends
false
Investment Analysis
Financial Services
Mixed Chart
Morgan Stanley
Add to my slides
Remove from favorites
Column chart displaying purchase price multiples for leveraged buyouts over the years, highlighting trends in senior debt, sub-debt, equity, and other categories.
Financial Performance
Financial Services
The slide shows declining valuations in private equity, suggesting improved entry points for investments, and expecting a clearer pattern of lower valuations as volumes recover.
Private Equity, Valuations, Leveraged Buyouts, Debt, Equity, Investment Trends
false
Financial Performance
Financial Services
Single Chart
Morgan Stanley
Add to my slides
Remove from favorites
The slide is a mixture of column charts and color-coded segments, each representing a sector within Thailand's private funding landscape. It shows funding values from 2019 to H1 2023 and the number of deals, with a notable spike in H2 2022. The design employs a simple color scheme to differentiate sectors and effectively uses annotations to highlight key data points.
Investment Analysis
Financial Services
The content depicts the investment funding trends in Thailand, highlighting the return to typical levels after a substantial increase in the second half of 2022. It is useful for investors and financial analysts to assess the funding environment's normalcy and plan future investments in nascent sectors like travel, transport & food, digital media, e-commerce, and digital financial services (DFS).
Private Funding, Investment, Thailand, Trends, Sectors, E-commerce, DFS, Travel, Digital Media, Transport
false
Investment Analysis
Financial Services
Single Chart
Bain
Add to my slides
Remove from favorites
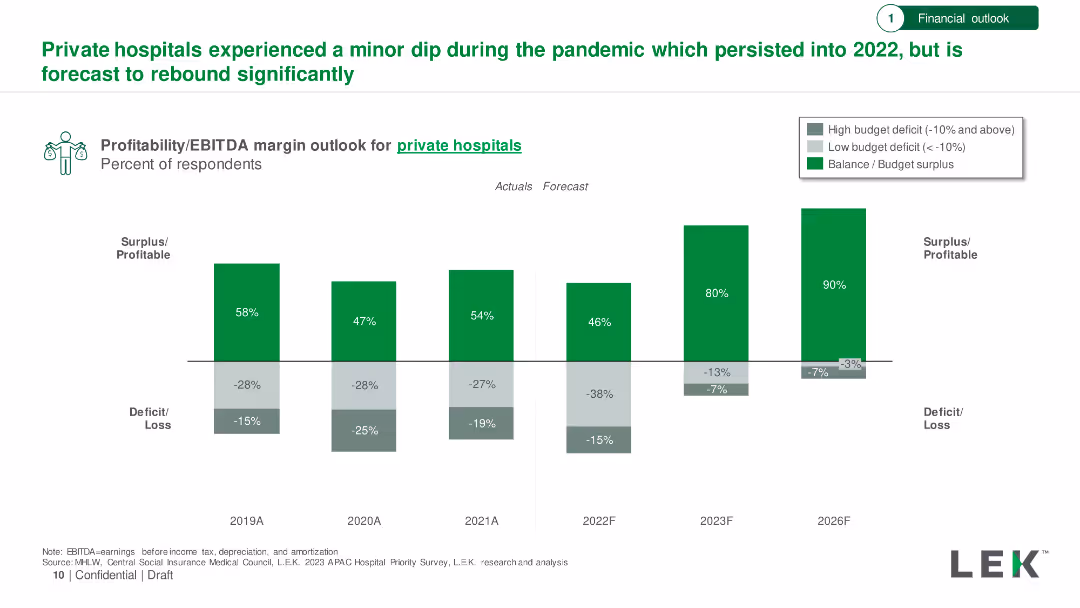
Bar chart showing profitability/EBITDA margin outlook for private hospitals from 2019 to 2026, with actuals and forecasts. Surplus/deficit percentages included.
Financial Performance
Healthcare & Pharmaceuticals
Analysis of private hospitals' financial performance during and after the pandemic, forecasting a significant rebound by 2026.
Private Hospitals, Profitability, EBITDA, Financial Forecast, Recovery
false
Financial Performance
Healthcare & Pharmaceuticals
Single Chart
LEK
Add to my slides
Remove from favorites
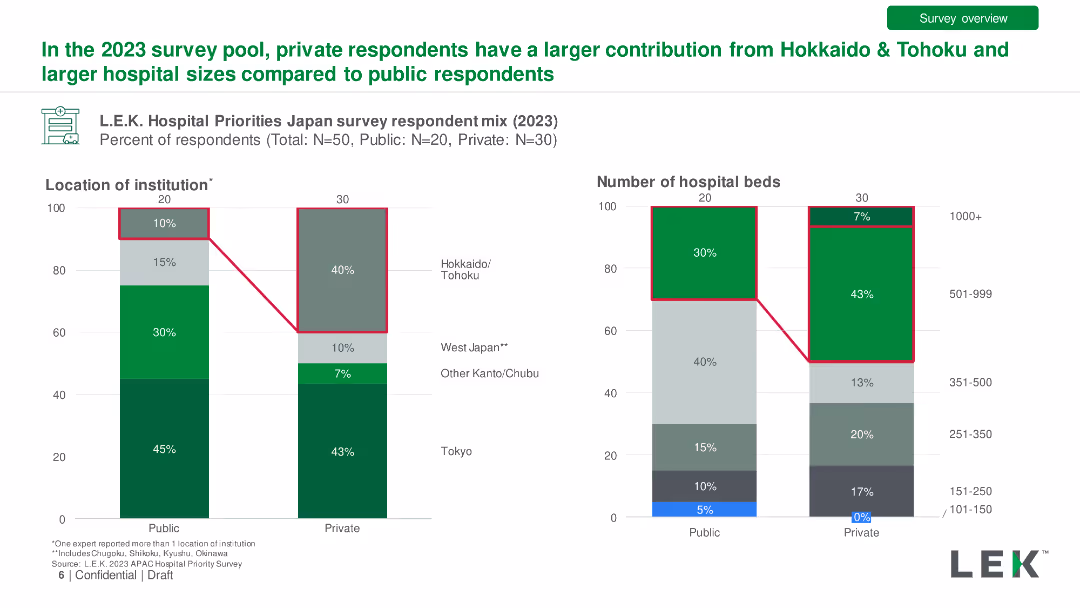
Bar charts comparing private vs. public hospital respondent mix by location and hospital size in 2023. Detailed with percentage differences.
Market Analysis and Trends
Healthcare & Pharmaceuticals
Comparison of survey responses from public and private hospitals, showing differences in regional representation and hospital sizes.
Private Hospitals, Public Hospitals, Respondents, Comparison, Location
false
Market Analysis and Trends
Healthcare & Pharmaceuticals
Multiple Chart
LEK
Add to my slides
Remove from favorites
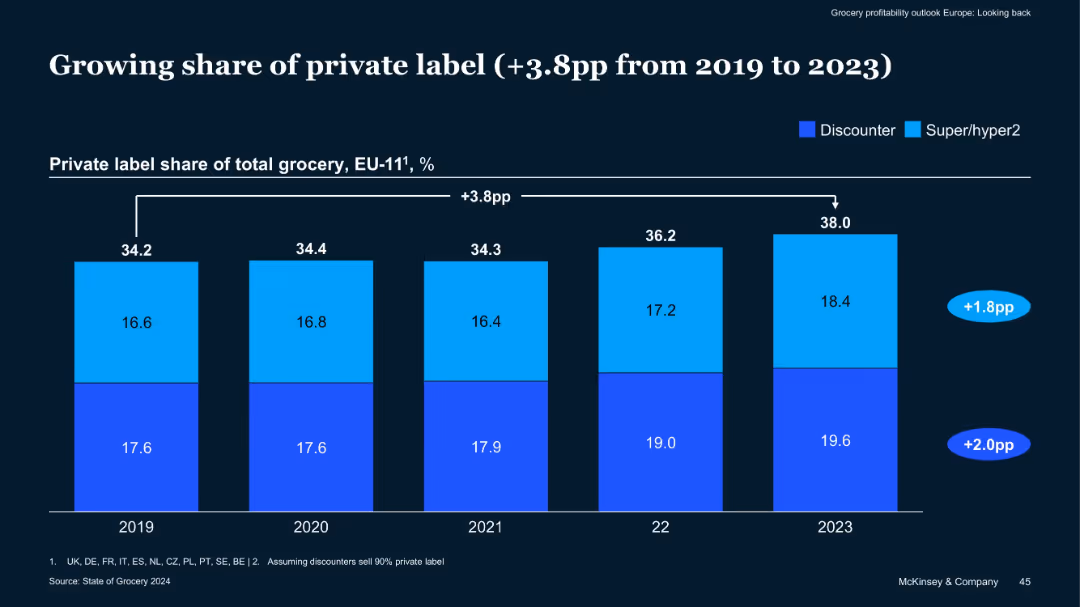
Stacked bar chart split by discounter and hyper/supermarkets; data from 2019–2023
Market Analysis and Trends
Retail & E-commerce
The slide illustrates a 3.8 percentage point growth in private label share in EU-11 groceries, driven by both discounters and supermarkets. It implies consumer shifts towards more affordable private label products in inflationary times.
Private Label, Grocery Share, Discounters, Supermarkets, EU-11, Trends
false
Market Analysis and Trends
Retail & E-commerce
Single Chart
McKinsey
Add to my slides
Remove from favorites
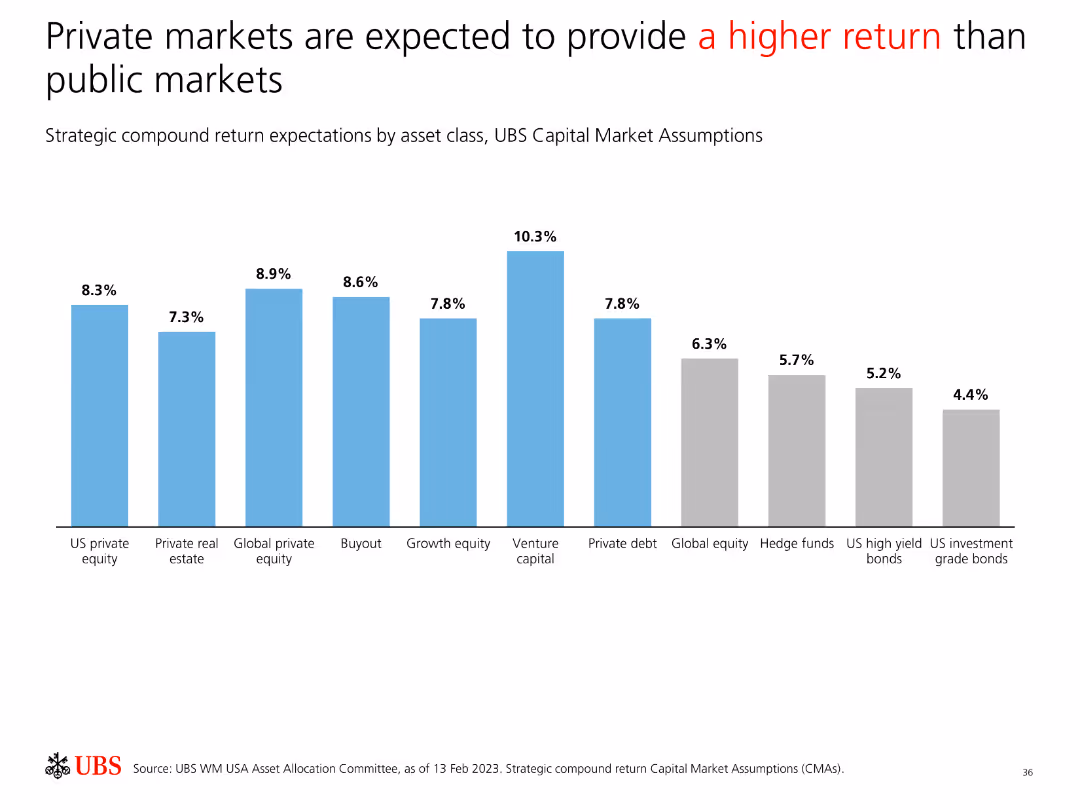
Features a bar chart comparing strategic compound return expectations by asset class, indicating higher returns for private markets compared to public markets.
Investment Analysis
Financial Services
Compares strategic compound return expectations, demonstrating that private markets are projected to offer higher returns than public markets across various asset classes.
Private Markets, Public Markets, Return Expectations, Asset Classes, Investment, Analysis, Comparison, Strategy, Performance
false
Investment Analysis
Financial Services
Single Chart
UBS
Add to my slides
Remove from favorites
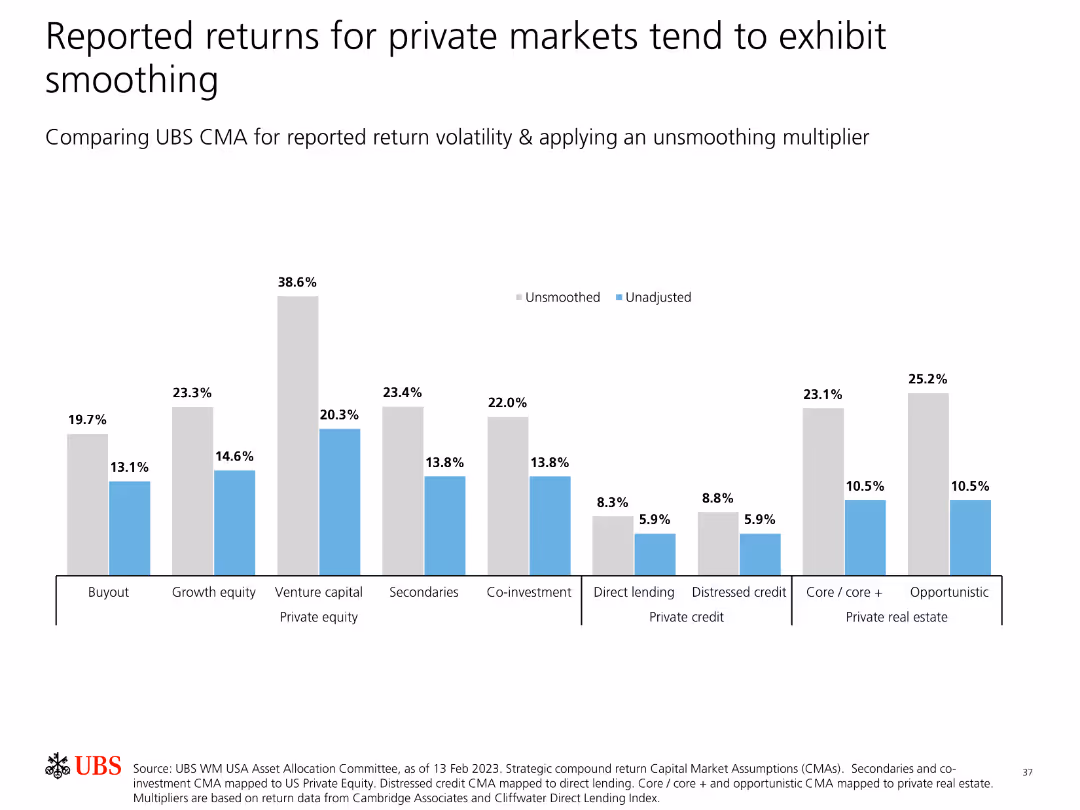
Contains bar charts comparing reported return volatility for private markets, applying an unsmoothing multiplier to show true volatility.
Risk Assessment and Management
Financial Services
Examines the smoothing effect in reported returns for private markets, applying an unsmoothing multiplier to reveal the actual return volatility compared to reported data.
Private Markets, Return Volatility, Smoothing, Unsmoothing, Analysis, Risk, Investment, Data Presentation, Strategy
false
Risk Assessment and Management
Financial Services
Single Chart
UBS
Add to my slides
Remove from favorites
The slide includes bar and column charts depicting financial results and revenue details, complemented by comprehensive financial data and changes over the quarter. Textual highlights emphasize performance metrics.
Financial Performance
Financial Services
Discusses the Q2 2023 financial results of Deutsche Bank's Private Bank, showing significant revenue growth driven by net interest income and other key financial metrics.
Private banking, financial results, revenue growth, net interest income, financial analysis, Deutsche Bank, Q2 2023
false
Financial Performance
Financial Services
Multiple Chart
Deutsche Bank
Add to my slides
Remove from favorites
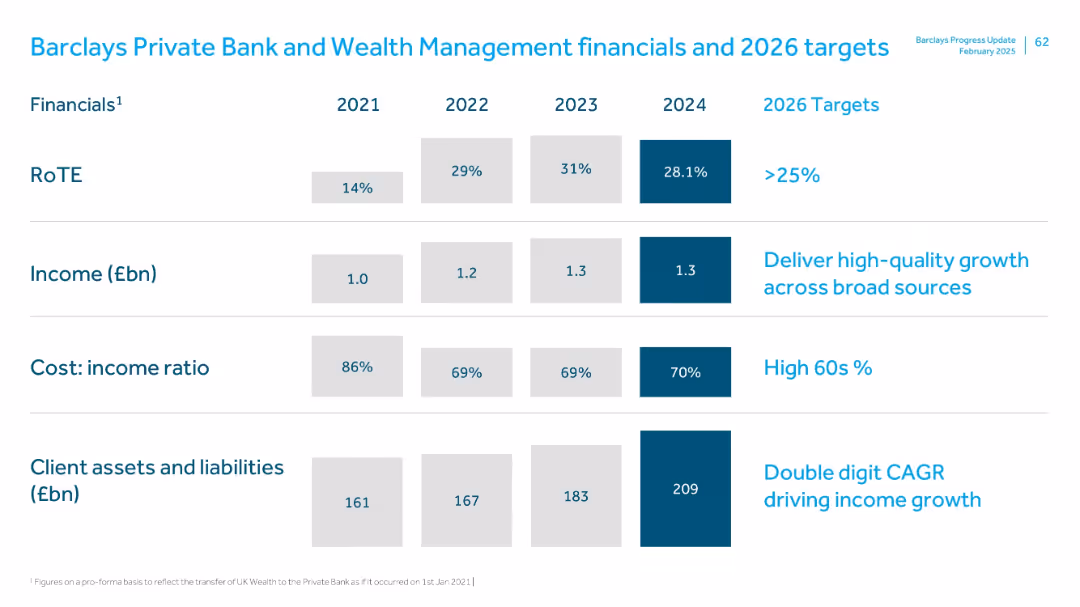
Similar tabular format as previous, showing metrics over time with 2026 targets; bold blue used to highlight 2024 figures
Financial Performance
Financial Services
This slide tracks financial performance from 2021 to 2024 for the Private Bank & Wealth Management division. Key metrics include RoTE, income, cost-income ratio, and client assets/liabilities. The 2026 targets aim for over 25% RoTE and double-digit CAGR in client assets and income.
Private banking, wealth management, RoTE, CAGR, income growth, client assets
false
Financial Performance
Financial Services
Single Chart
Barclays
Add to my slides
Remove from favorites
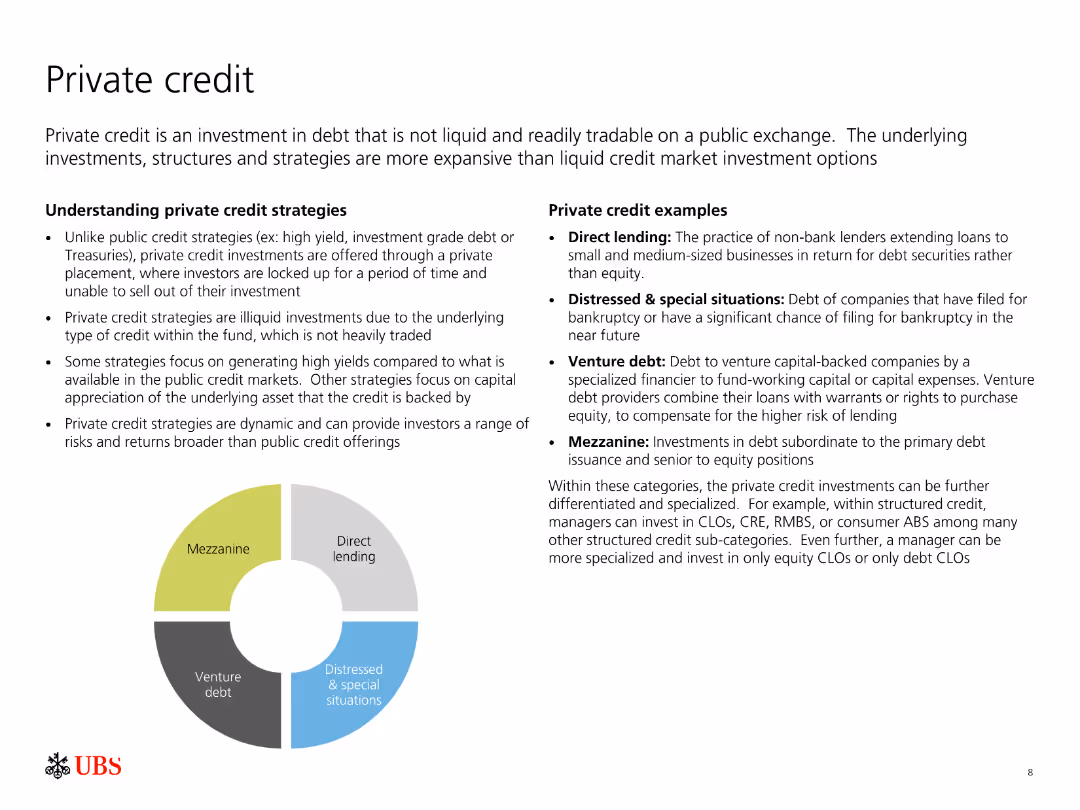
The slide uses bullet points to describe private credit strategies and examples. It includes a circular diagram dividing private credit into four categories.
Investment Analysis
Financial Services
Describes private credit, its illiquidity, high yield potential, and strategies like direct lending, venture debt, and mezzanine. Provides examples of private credit.
Private credit, investment, direct lending, mezzanine, venture debt, distressed debt
false
Investment Analysis
Financial Services
Diagram
UBS
Add to my slides
Remove from favorites
This slide includes a combination of column charts and text. The charts show numerical growth in private equity and use shades of blue for visual distinction. The layout is evenly spaced with clear headers.
Investment Analysis
Financial Services
The slide outlines a strategic approach to private equity coverage, highlighting significant opportunities, middle market potential, and the company's capabilities to capture these opportunities. It provides numerical data to support the potential for growth and strategic direction.
Private equity, investment banking, market potential, capabilities
false
Investment Analysis
Financial Services
Mixed Chart
JP Morgan
Add to my slides
Remove from favorites
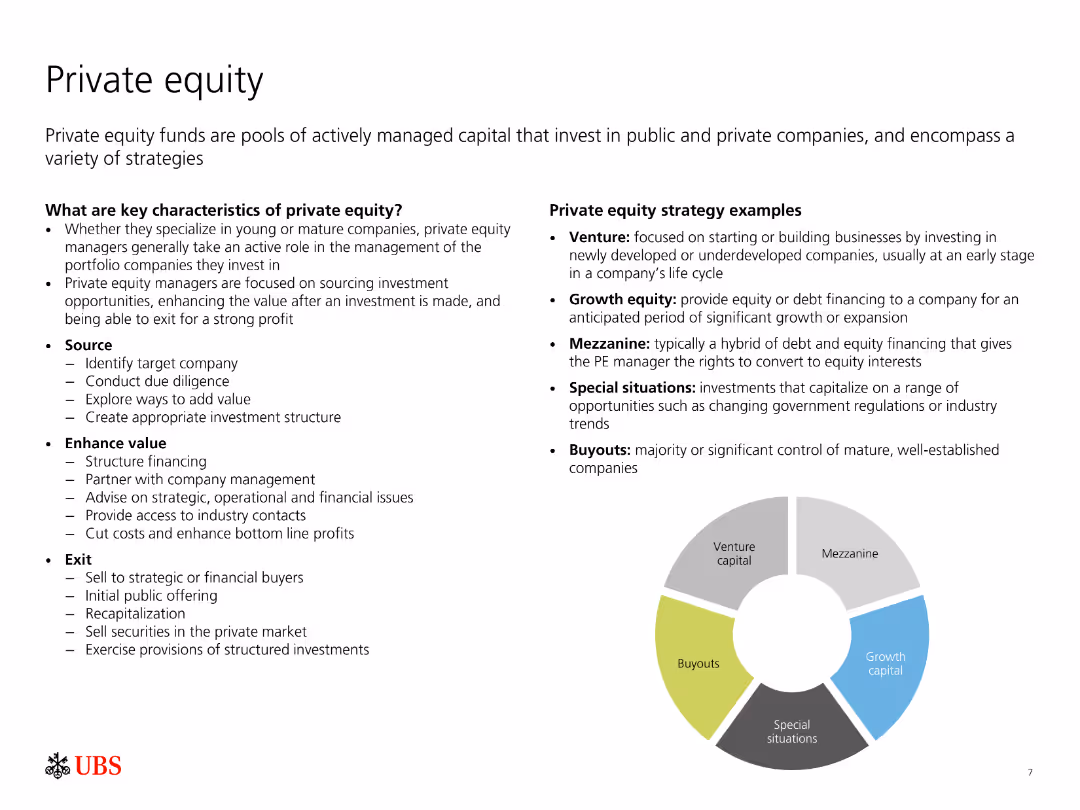
The slide contains a text description of key characteristics and strategies of private equity, along with a segmented circular diagram illustrating different strategy examples.
Investment Analysis
Financial Services
The slide provides an overview of private equity, including its key characteristics, strategies for sourcing and enhancing value, and exit options. It also describes various private equity strategies like venture, growth equity, mezzanine, and special situations.
Private equity, investment strategies, venture capital, growth equity, mezzanine
false
Investment Analysis
Financial Services
Diagram
UBS
Add to my slides
Remove from favorites
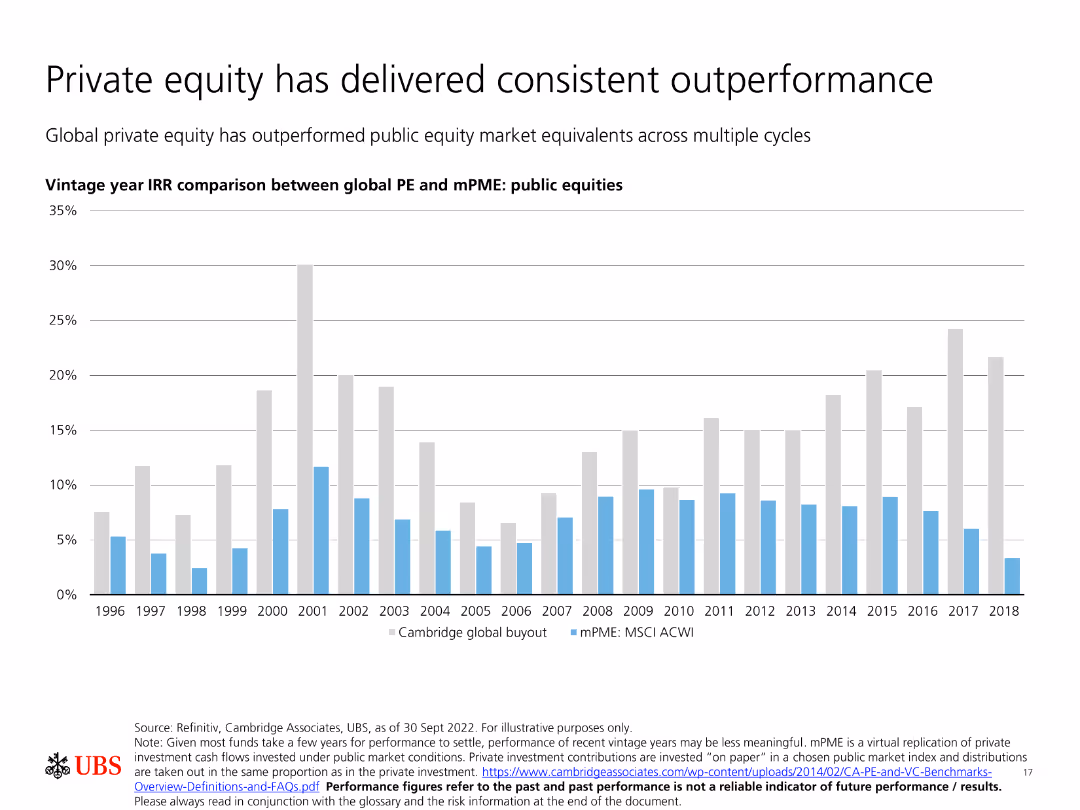
Contains a bar chart comparing vintage year IRR between global PE and mPME public equities, emphasizing private equity’s consistent outperformance.
Investment Analysis
Financial Services
Shows that private equity has consistently outperformed public equity market equivalents across multiple cycles, as demonstrated by vintage year IRR comparisons.
Private equity, outperformance, vintage year IRR, public equities, investment cycles
false
Investment Analysis
Financial Services
Single Chart
UBS
Add to my slides
Remove from favorites
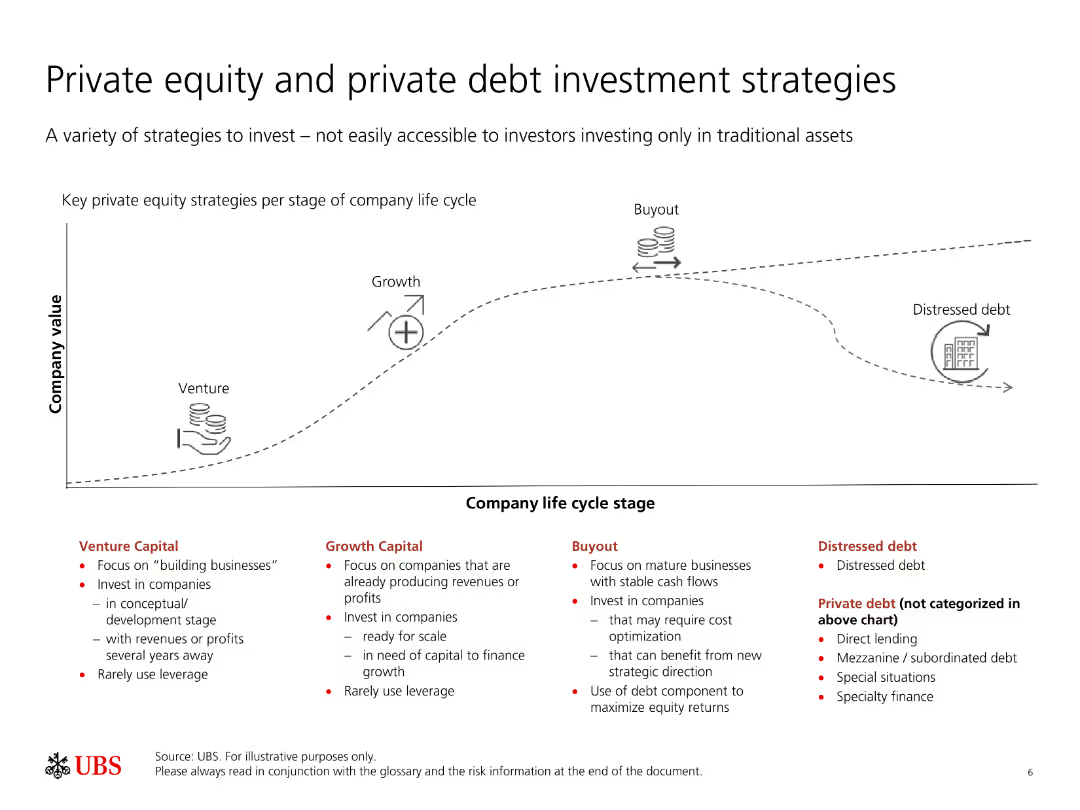
The slide features a diagram showing the company life cycle stages and key private equity strategies for each stage, along with a list of private debt strategies.
Strategic Planning
Financial Services
This slide outlines various strategies for investing in private equity and private debt, showing how they align with different stages of a company's life cycle. It highlights venture, growth, buyout, and distressed debt strategies.
Private equity, private debt, investment strategies, company life cycle, venture
false
Strategic Planning
Financial Services
Linear Flow
UBS
Add to my slides
Remove from favorites
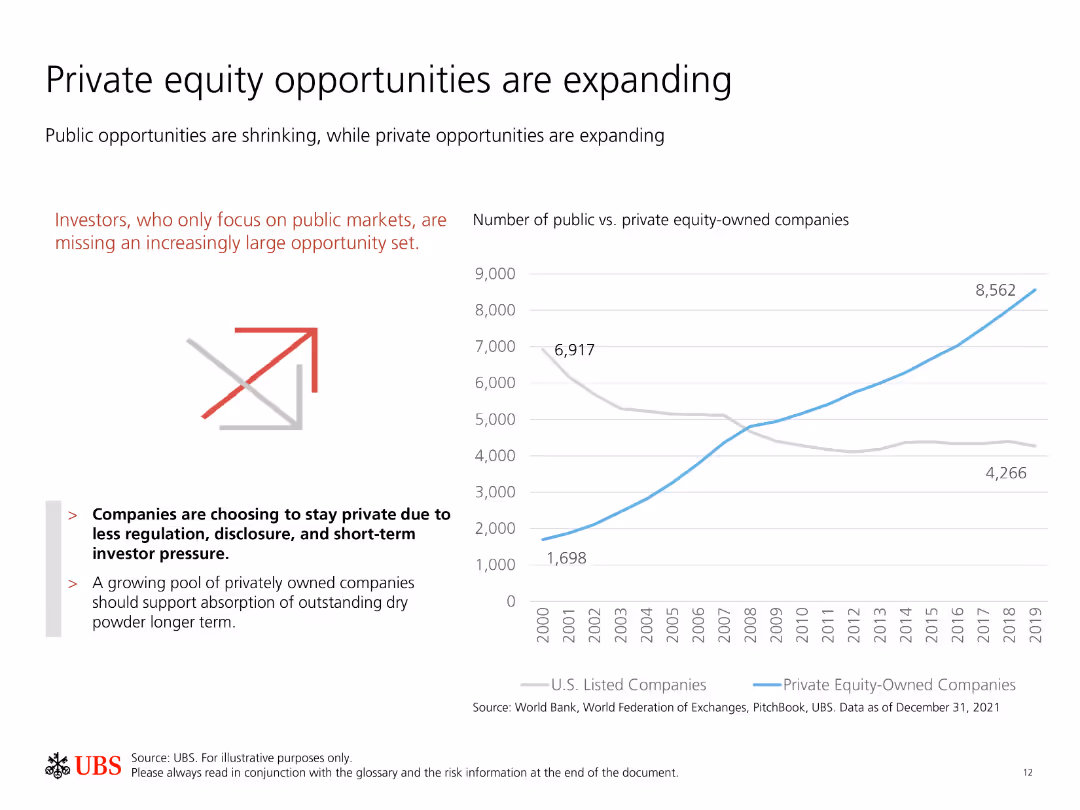
Contains a line chart comparing the number of public vs. private equity-owned companies over time, with explanatory text on the left.
Investment Analysis
Financial Services
Shows the increasing opportunities in private equity compared to public markets, highlighting a trend of companies staying private longer for various advantages.
Private equity, public markets, investment opportunities, growth, trends
false
Investment Analysis
Financial Services
Mixed Chart
UBS
Add to my slides
Remove from favorites
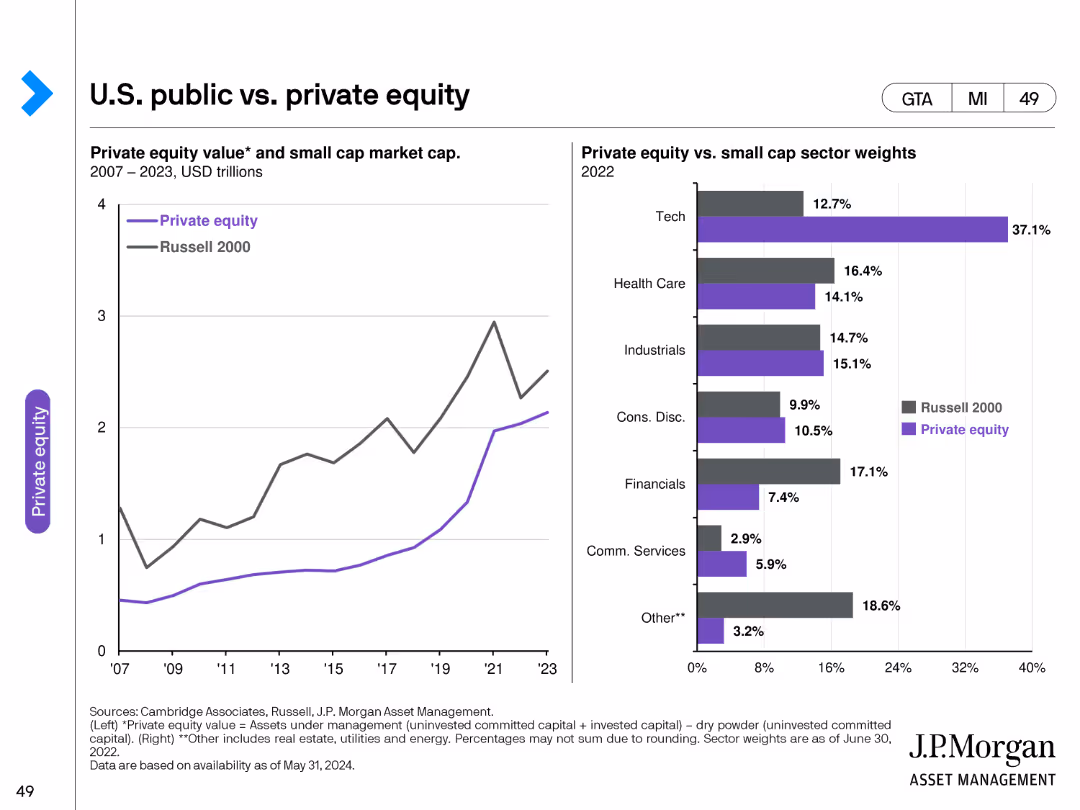
The slide features two charts: a line chart on the left showing the private equity value and small cap market cap from 2007 to 2023, and a bar chart on the right comparing private equity and small cap sector weights in 2022. The charts use distinct colors to differentiate data points and sectors.
Market Analysis and Trends
Financial Services
This slide compares the U.S. public and private equity markets, highlighting trends in private equity value, small cap market capitalization, and sector weights. It is intended to provide insights into the relative performance and sector distribution of these equity markets.
Private equity, small cap market, sector weights, equity comparison, financial analysis, investment trends
false
Market Analysis and Trends
Financial Services
Multiple Chart
JP Morgan
Add to my slides
Remove from favorites
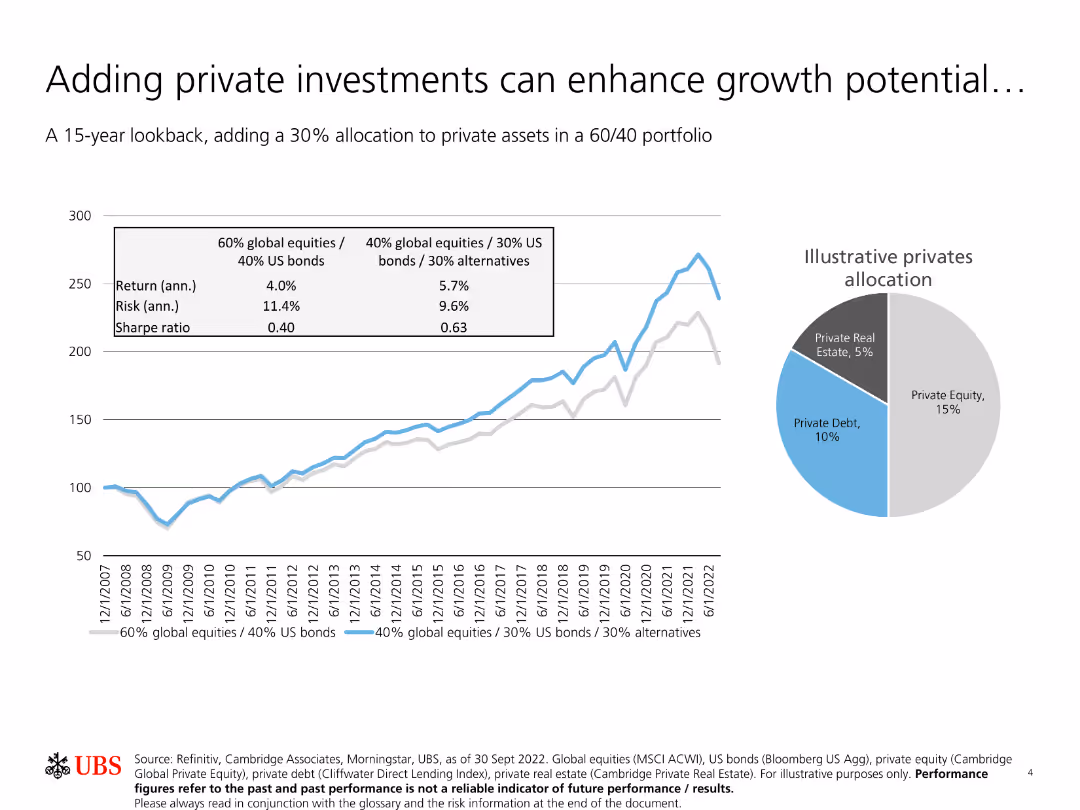
The slide features a line chart comparing returns, risk, and Sharpe ratio of portfolios with different allocations to private assets over a 15-year period. A pie chart shows allocation.
Investment Analysis
Financial Services
The slide highlights how adding a 30% allocation to private assets in a 60/40 portfolio can enhance growth potential. It shows comparative returns, risks, and Sharpe ratios, along with illustrative private asset allocations.
Private investments, growth potential, portfolio allocation, risk, Sharpe ratio
false
Investment Analysis
Financial Services
Multiple Chart
UBS
Add to my slides
Remove from favorites
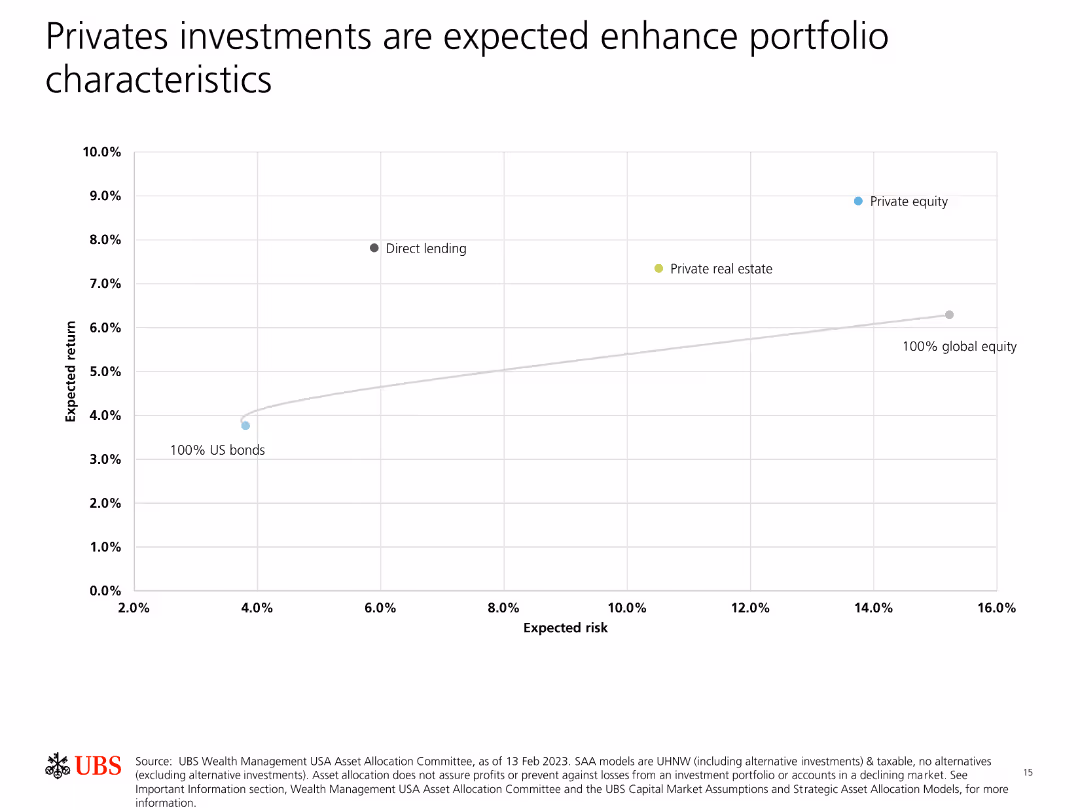
Contains a scatter plot showing expected return vs. expected risk for different asset classes, highlighting private equity and direct lending.
Investment Analysis
Financial Services
Demonstrates how private investments like private equity and direct lending can enhance portfolio returns relative to risk, compared to traditional asset classes.
Private investments, portfolio, expected return, expected risk, enhancement
false
Investment Analysis
Financial Services
Single Chart
UBS
Add to my slides
Remove from favorites
The slide includes two donut charts showing the role of private market investing in hedge fund strategies and investor requirements for limiting exposure to private equity. An image on the left shows a laptop displaying financial charts. The charts use shades of purple.
Investment Analysis
Financial Services
The slide discusses the significant growth in private market investing among hedge fund managers, driven by investor sentiment and the quest for yield, with many managers planning to increase exposure to this asset class.
Private market investing, hedge funds, private equity, investment strategies, growth
false
Investment Analysis
Financial Services
Multiple Chart
EY
Add to my slides
Remove from favorites
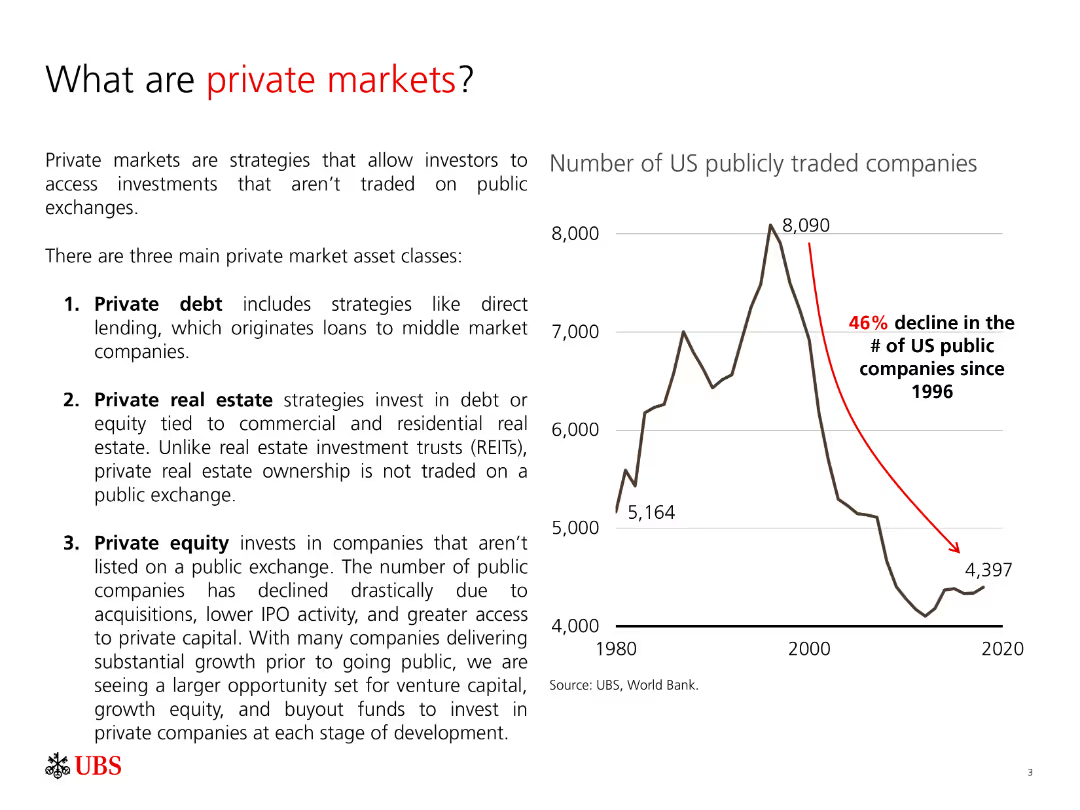
The slide includes a column chart showing the decline in the number of US publicly traded companies from 1996 to 2020. The text explains three main private market asset classes.
Market Analysis and Trends
Financial Services
The slide explains what private markets are, the types of private market asset classes, and provides a visual representation of the decline in US publicly traded companies, illustrating the growing importance of private markets.
Private markets, asset classes, private equity, private debt, private real estate
false
Market Analysis and Trends
Financial Services
Mixed Chart
UBS
Add to my slides
Remove from favorites
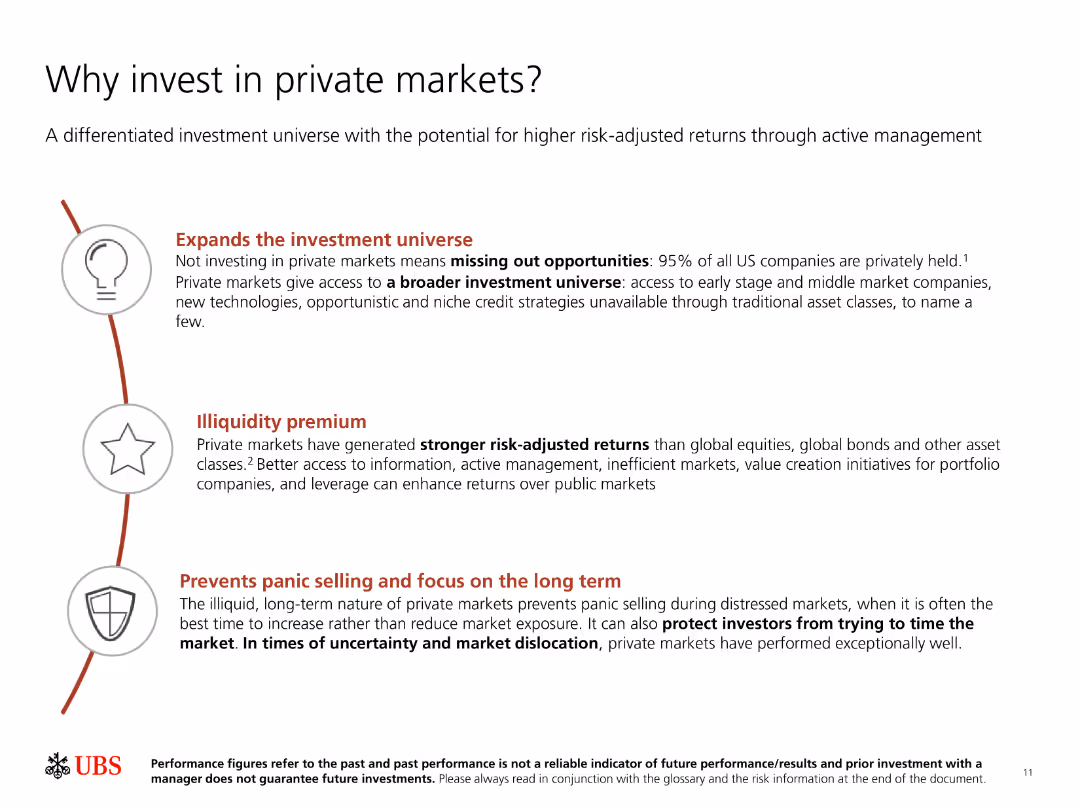
The slide has a title, three key points with icons, and a small text disclaimer at the bottom. It uses a clean layout with red and black text.
Investment Analysis
Financial Services
Highlights reasons to invest in private markets, including expanding investment universe, capturing illiquidity premium, and avoiding panic selling during downturns.
Private markets, investment, returns, illiquidity premium, risk management
false
Investment Analysis
Financial Services
Vertical Flow
UBS
Add to my slides
Remove from favorites
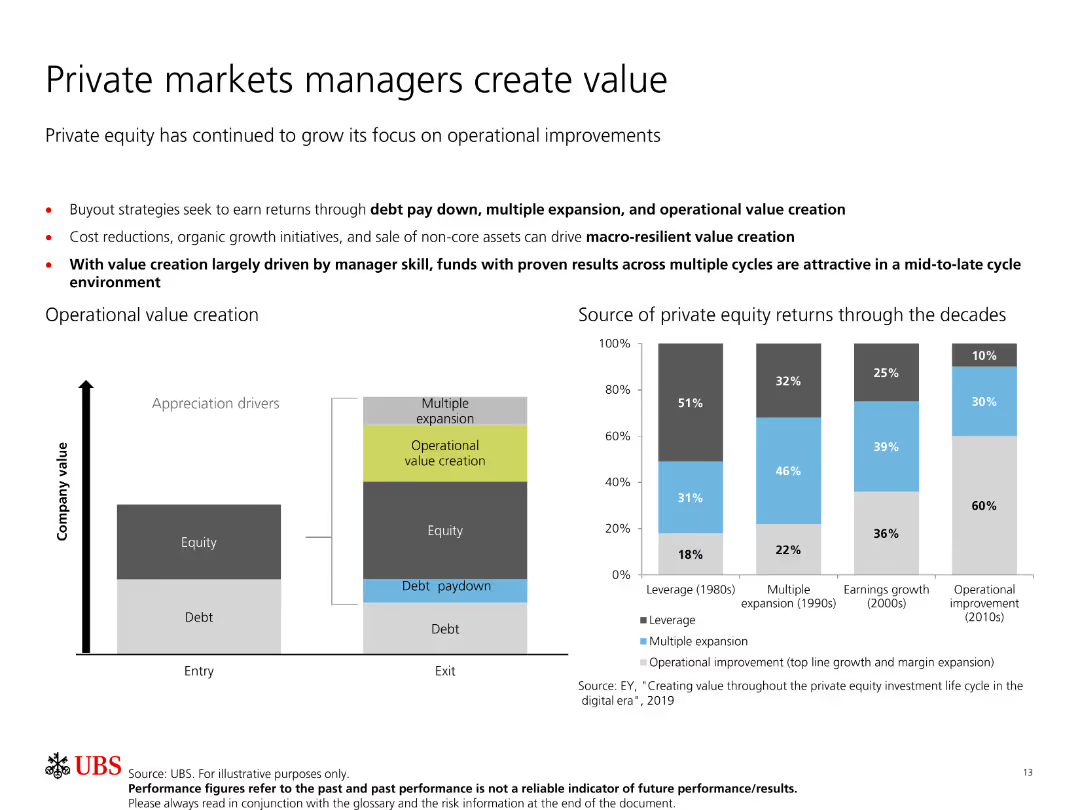
Includes a bar chart and a diagram showing operational value creation in private equity through debt paydown, multiple expansion, and operational improvements.
Operational Efficiency
Financial Services
Discusses how private equity managers create value through different strategies over time, illustrated with a bar chart showing return sources through decades.
Private markets, value creation, operational improvements, debt paydown, equity
false
Operational Efficiency
Financial Services
Multiple Chart
UBS
Add to my slides
Remove from favorites
The slide presents a dual-axis scatter plot with varying dot sizes, contrasting past and future process reinventions across different functions like Customer Service and Finance. The use of purple hues differentiates between the past two years and the next two.
Strategic Planning
Technology & Software
Highlights the evolution in the reinvention of business processes by applying new technologies and working methods. It's useful for analyzing and planning functional improvements and technology adoption in different organizational areas.
Process Reinvention, Functional Areas, Technology Adoption, Future Planning, Customer Service, Finance, Strategic Improvement, Organizational Change, Dot Chart
false
Strategic Planning
Technology & Software
Multiple Chart
Accenture
Add to my slides
Remove from favorites
Moderate visual complexity with a combination of text and infographic elements. The slide provides insights into common themes and strengths across leading companies in the process automation space.
Technology and Digital Transformation
Industrial & Manufacturing
This slide identifies the common strengths among leading companies in the process automation sector, highlighting key areas such as innovation, technology, product offerings, and market positions. It also discusses the role of process automation in addressing megatrends and the increasing demand for connected, software-enabled products in the global market.
Process automation, Industry analysis, Company strengths, Market trends
false
Technology and Digital Transformation
Industrial & Manufacturing
Boxed
LEK
Add to my slides
Remove from favorites
Features a bar chart with color-coded bars, alongside bulleted lists of key findings related to governance roles within shared services. The visual elements are clearly separated from textual elements for easy reading.
Organizational Structure and Change
Professional Services
Explores the roles of regional and global process owners within shared services, focusing on their impact on efficiency and effectiveness. This slide is suitable for discussions on structuring governance to enhance organizational processes.
Process owners, shared services, governance, efficiency, effectiveness
false
Organizational Structure and Change
Professional Services
Mixed Chart
Deloitte
Add to my slides
Remove from favorites
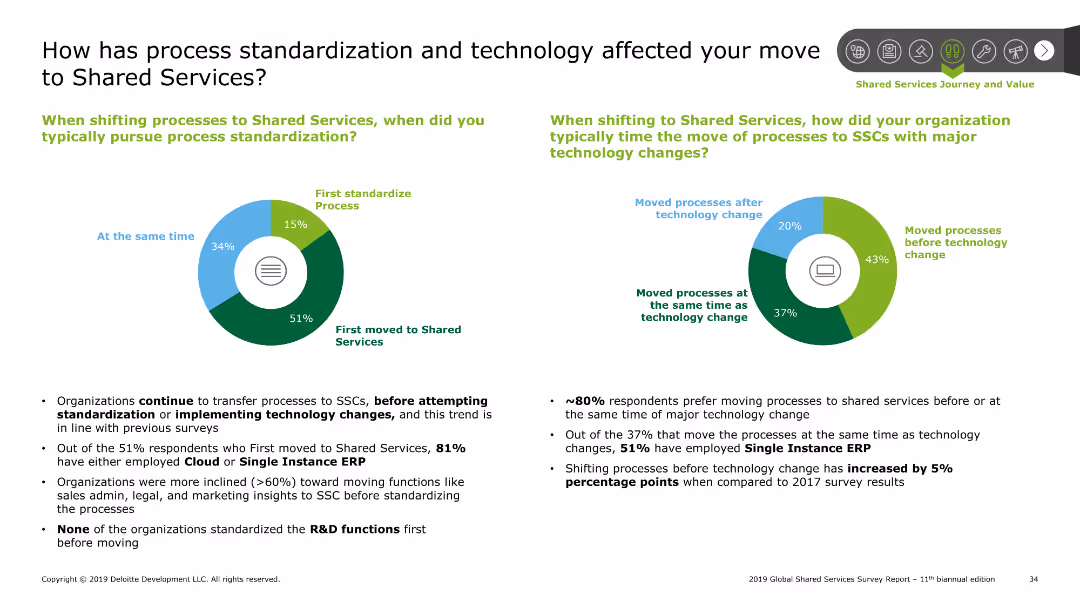
The slide features two pie charts. One chart shows when process standardization is pursued, and the other shows the timing of technology changes.
Technology and Digital Transformation
Professional Services
This slide examines the impact of process standardization and technology changes on moving to shared services, including timing and methods of implementation.
Process standardization, technology, shared services, timing
false
Technology and Digital Transformation
Professional Services
Multiple Chart
Deloitte
Add to my slides
Remove from favorites
The slide lists core, business, procurement, and digital skills, categorized by yesterday's, today's, and tomorrow's skills with a detailed skills layout table.
Technology and Digital Transformation
Professional Services
It outlines the evolving skills needed for procurement success, emphasizing digital transformation, strategic alliances, and advanced analytics.
Procurement skills, digital transformation, strategic alliances, analytics, talent development, future skills
false
Technology and Digital Transformation
Professional Services
Multiple Chart
Kearney
Add to my slides
Remove from favorites
The slide lists core, business, procurement, and digital skills, categorized by yesterday's, today's, and tomorrow's skills with a detailed skills layout table.
Technology and Digital Transformation
Professional Services
It outlines the evolving skills needed for procurement success, emphasizing digital transformation, strategic alliances, and advanced analytics.
Procurement skills, digital transformation, strategic alliances, analytics, talent development, future skills
false
Technology and Digital Transformation
Professional Services
Table
Kearney
Add to my slides
Remove from favorites
The slide contains a diagram illustrating the typical enterprise procurement process and bullet points explaining the rationale behind starting with procurement. Key points are highlighted in yellow circles.
Technology and Digital Transformation
Technology & Software
This slide describes EY OpsChain 4.0 and its Network Procurement module, detailing the procurement process and explaining the benefits of starting with procurement in deploying the Baseline Protocol.
Procurement, Blockchain, EY OpsChain, Baseline Protocol, Digital Transformation
false
Technology and Digital Transformation
Technology & Software
Vertical Flow
EY
Add to my slides
Remove from favorites
Uses column bars to display different levers in procurement, emphasizing their activities and trends.
Sales and Business Development
Industrial & Manufacturing
Discusses key procurement levers, such as commercial procurement applications, supplier management, and category strategies.
Procurement, Commercial, Supplier Management, Trends
false
Sales and Business Development
Industrial & Manufacturing
Single Chart
Roland Berger
Add to my slides
Remove from favorites
A detailed process flow diagram depicts the stages of the procurement process from product selection to payment. Includes icons and descriptions for each step, interactions with a central data hub, and customer service systems.
Operational Efficiency
Professional Services
Provides a comprehensive view of the procurement process, showing the sequence and tools involved from the initial product need to final payment, highlighting integration with technology for efficiency.
Procurement, Process, Technology, Efficiency, Integration
false
Operational Efficiency
Professional Services
Diagram
Kearney
Add to my slides
Remove from favorites
A bar chart showing the percentage of services procurement spend across various industries. Each bar is colored differently, representing sectors like insurance, financial services, and telecommunications.
Industry Overview
Professional Services
Analyzes the proportion of services procurement spending in different sectors, showing higher spend in industries like insurance and financial services compared to sectors like construction or consumer products.
Procurement, Services, Industry, Spend, Analysis
false
Industry Overview
Professional Services
Single Chart
Kearney
Add to my slides
Remove from favorites
Two column charts depicting the average product lifetime and percentage of revenue from long-life product designs. The charts are effectively labeled to show various time spans and revenue percentages.
Product and Service Analysis
Environmental Services & Sustainability
Summarizes survey results on product lifetimes and the economic contribution of long-life product designs, emphasizing the need for enhanced durability and modularity in products.
Product Life, Durability, Revenue, Survey, Sustainability
false
Product and Service Analysis
Environmental Services & Sustainability
Multiple Chart
Accenture
Add to my slides
Remove from favorites
Circular diagram showing the product lifecycle stages (Pre-Launch, At Launch, In Market) and associated services Ipsos offers, with text descriptions of each stage.
Strategic Planning
Professional Services
Outlines the different stages of a product lifecycle and the various services Ipsos provides to support clients at each stage. Emphasizes strategic planning and service integration.
Product Lifecycle, Strategic Planning, Services, Ipsos
false
Strategic Planning
Professional Services
Diagram
IPSOS
Add to my slides
Remove from favorites
Bar graphs detailing anticipated levels of product personalization by industry for 2026, with a summary callout highlighting personalization goals.
Market Analysis and Trends
Professional Services
Forecasts the degree of personalization that companies aim to achieve within the next few years, signifying a strategic shift towards tailored consumer experiences.
Product Personalization, Future Trends, Strategic Shift, Bar Graph, Industry Forecast
false
Market Analysis and Trends
Professional Services
Multiple Chart
Kearney
Add to my slides
Remove from favorites
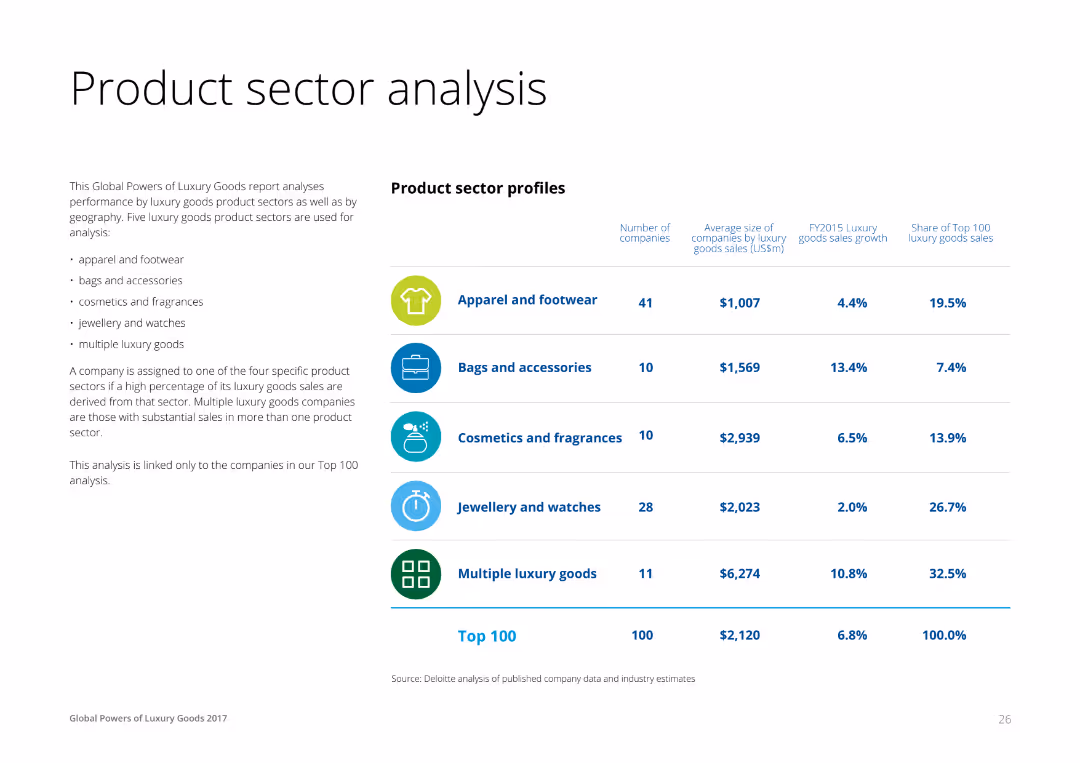
A combination of text and a table on the right, profiling luxury product sectors like apparel, accessories, cosmetics, and jewelry. Each row lists the number of companies, average size, sales growth, and share of top 100 sales for each sector.
Product and Service Analysis
Consumer Goods
This slide analyzes the performance of different luxury product sectors, providing insights into the number of companies, average size by sales, and growth rates for apparel, accessories, cosmetics, and jewelry sectors.
Product, Sector, Analysis, Luxury, Goods
false
Product and Service Analysis
Consumer Goods
Table
Deloitte
Add to my slides
Remove from favorites
A combination of bar charts displays various levers for production efficiency with corresponding trends and activity levels.
Operational Efficiency
Industrial & Manufacturing
Highlights top levers in production efficiency, such as continuous improvement, optimization of production planning, and control.
Production, Efficiency, Optimization, Trends, Activities
false
Operational Efficiency
Industrial & Manufacturing
Single Chart
Roland Berger
Add to my slides
Remove from favorites
This slide uses a flowchart to detail the methodological steps from equipment inventory to material compositions for assessing production impacts in infrastructure projects.
Operational Efficiency
Industrial & Manufacturing
Describes the comprehensive approach for grouping similar equipment into families to streamline data collection for infrastructure production, emphasizing material and lifetime considerations.
Production, infrastructure, equipment grouping, methodological steps, material composition, lifecycle assessment, industrial efficiency
false
Operational Efficiency
Industrial & Manufacturing
Diagram
Deloitte
Add to my slides
Remove from favorites
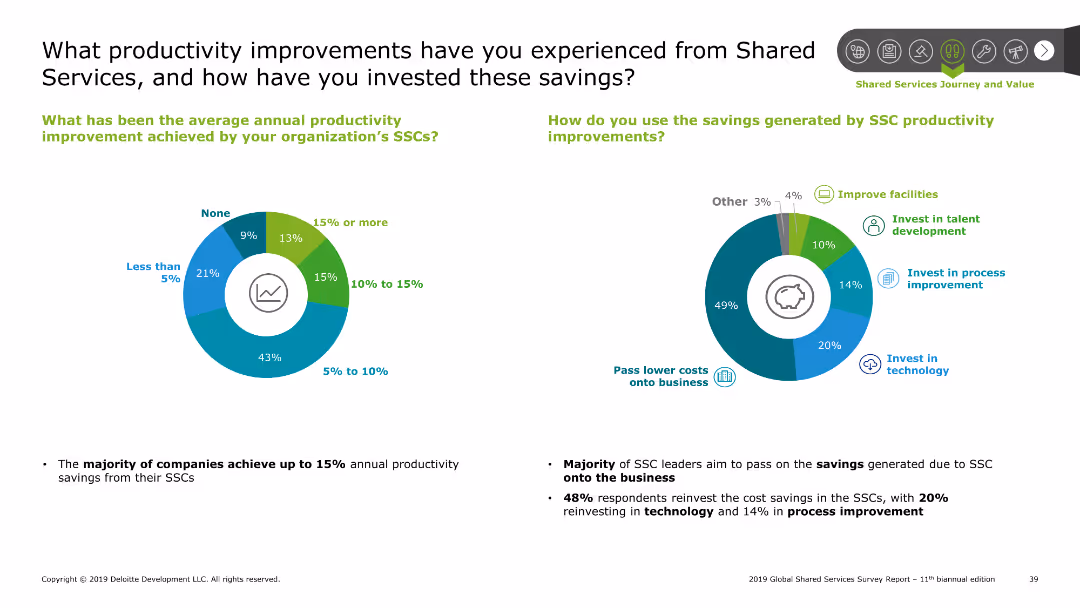
The slide includes a pie chart showing average annual productivity improvement percentages and another pie chart showing how savings are reinvested.
Operational Efficiency
Professional Services
This slide highlights the productivity improvements achieved from shared services and details how the savings generated have been reinvested within organizations.
Productivity improvement, savings, reinvestment, shared services
false
Operational Efficiency
Professional Services
Multiple Chart
Deloitte
Add to my slides
Remove from favorites
Bar charts comparing average GDP growth contributions by multifactor productivity and average patents granted by country and year between 2000-2007 and 2010-2019.
Technology and Digital Transformation
Technology & Software
This slide compares the contributions of multifactor productivity to GDP growth and the number of patents granted across different countries. It highlights the productivity paradox where innovations are rising, but productivity contributions to GDP growth are declining.
Productivity, GDP Growth, Patents, Innovation
false
Technology and Digital Transformation
Technology & Software
Multiple Chart
Roland Berger
Add to my slides
Remove from favorites
Bar chart depicting real GDP per employed worker over several years.
Strategic Planning
Professional Services
Introduces PwC’s PPI, which incorporates various forms of capital to measure productivity potential more comprehensively.
Productivity, GDP, Economic Growth, Index, PwC
false
Strategic Planning
Professional Services
Mixed Chart
PwC/Strategy&
Add to my slides
Remove from favorites
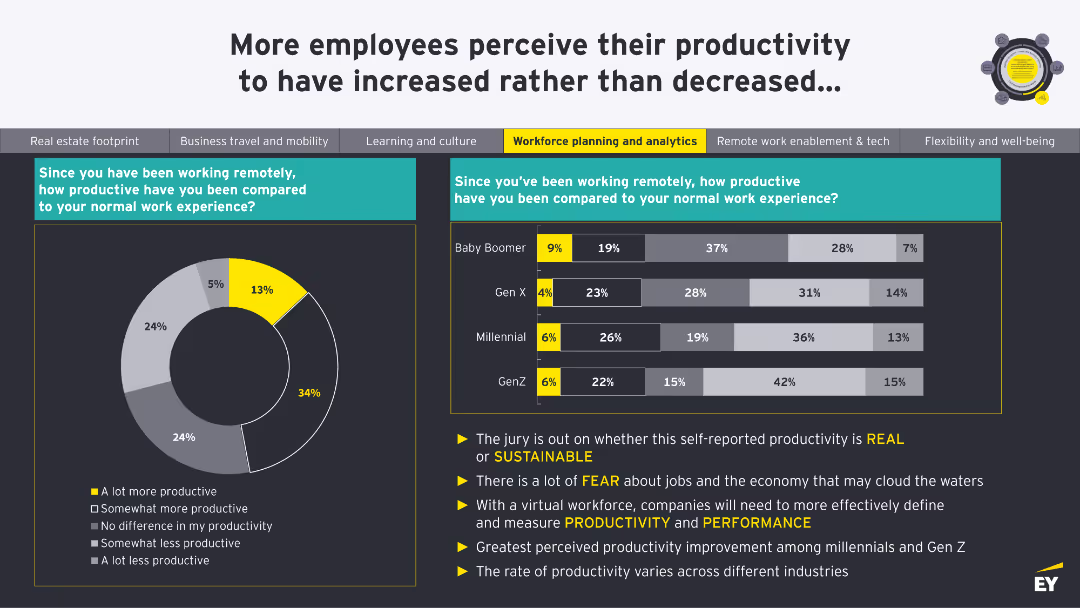
A donut chart showing productivity levels since remote work began. A column chart compares productivity across Baby Boomer, Gen X, Millennial, and Gen Z generations.
Human Resources and Talent Management
Professional Services
This slide shows perceptions of productivity changes since remote work began, comparing different generations. It questions the sustainability of self-reported productivity.
Productivity, Remote Work, Generations, Performance, Sustainability
false
Human Resources and Talent Management
Professional Services
Multiple Chart
EY
Add to my slides
Remove from favorites
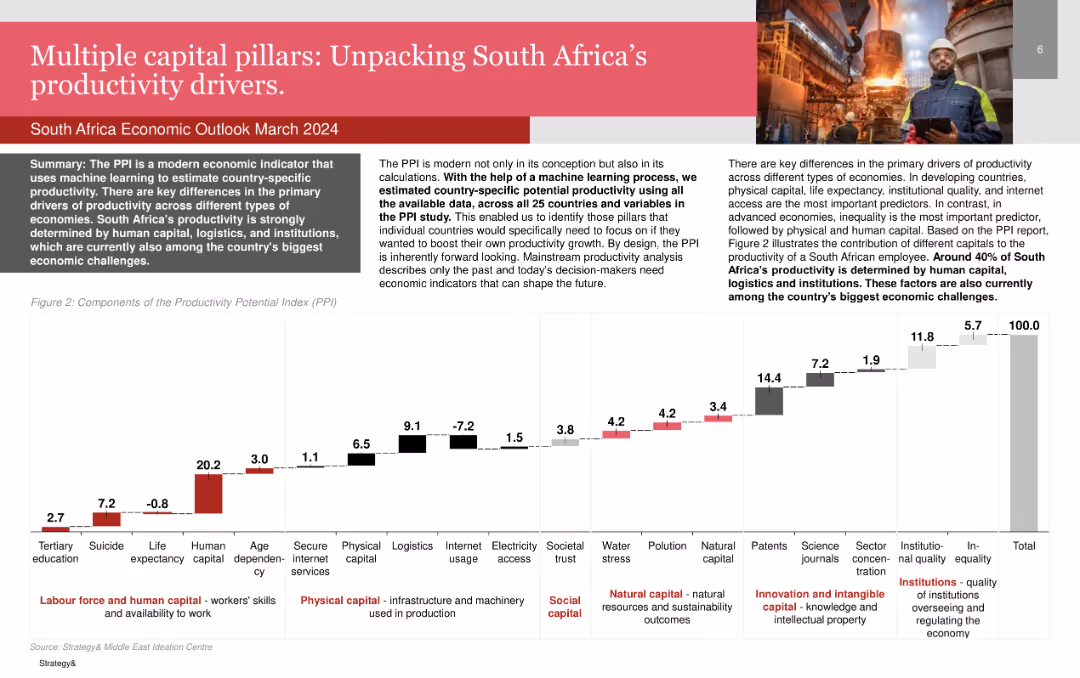
Bar chart showing the components of the Productivity Potential Index (PPI) for South Africa.
Market Analysis and Trends
Professional Services
Details the primary drivers of productivity in South Africa, emphasizing human capital, logistics, and institutions.
Productivity, South Africa, Human Capital, Logistics, Institutions
false
Market Analysis and Trends
Professional Services
Mixed Chart
PwC/Strategy&
Add to my slides
Remove from favorites
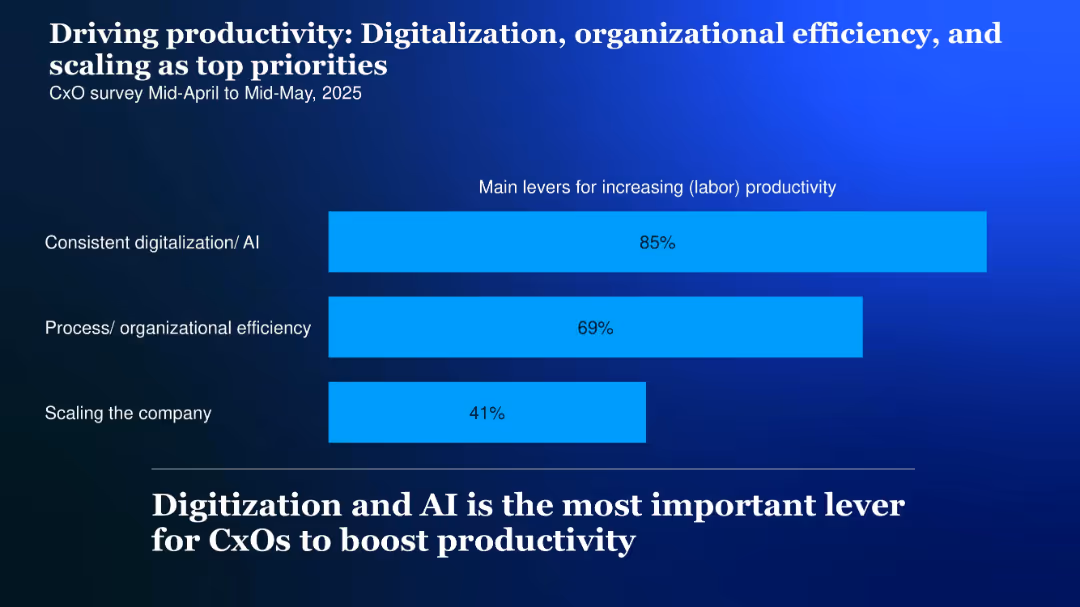
Horizontal bar chart with three bars showing productivity drivers, labeled on the left; high-contrast background and bold headline
Performance Metrics and KPIs
Technology & Software
CxOs cite digitalization and AI (85%), organizational efficiency (69%), and company scaling (41%) as top productivity levers for 2025.
Productivity, digitalization, AI, scaling, efficiency, levers, 2025
false
Performance Metrics and KPIs
Technology & Software
Single Chart
McKinsey
Add to my slides
Remove from favorites
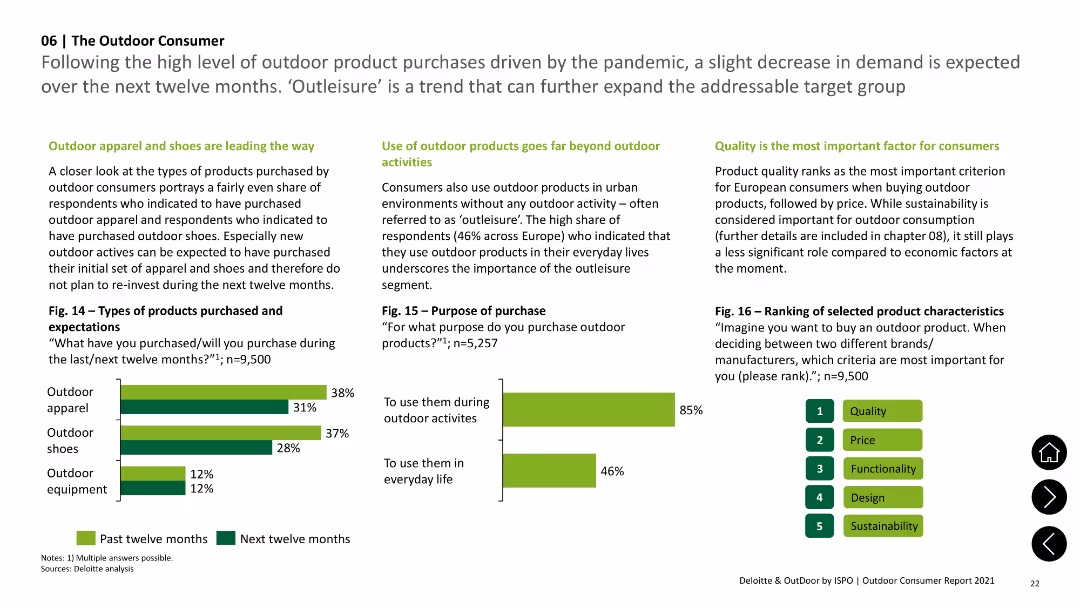
Column charts illustrating types of outdoor products purchased and purposes of purchase, highlighting 'outleisure' trend.
Market Analysis and Trends
Consumer Goods
Details types of outdoor products bought (apparel, shoes, equipment) and reasons for purchase, emphasizing urban use beyond outdoor activities.
Products, Purchase, Outdoor, Apparel, Shoes
false
Market Analysis and Trends
Consumer Goods
Multiple Chart
Deloitte
Add to my slides
Remove from favorites
Stratified blocks depicting various financial products targeting different demographic groups.
Product and Service Analysis
Financial Services
Outlines the range of financial products tailored to customer segments, enhancing the company's market adaptability and consumer reach.
Products, Strategy, Demographics, Financial
false
Product and Service Analysis
Financial Services
Mixed Chart
Barclays
Add to my slides
Remove from favorites
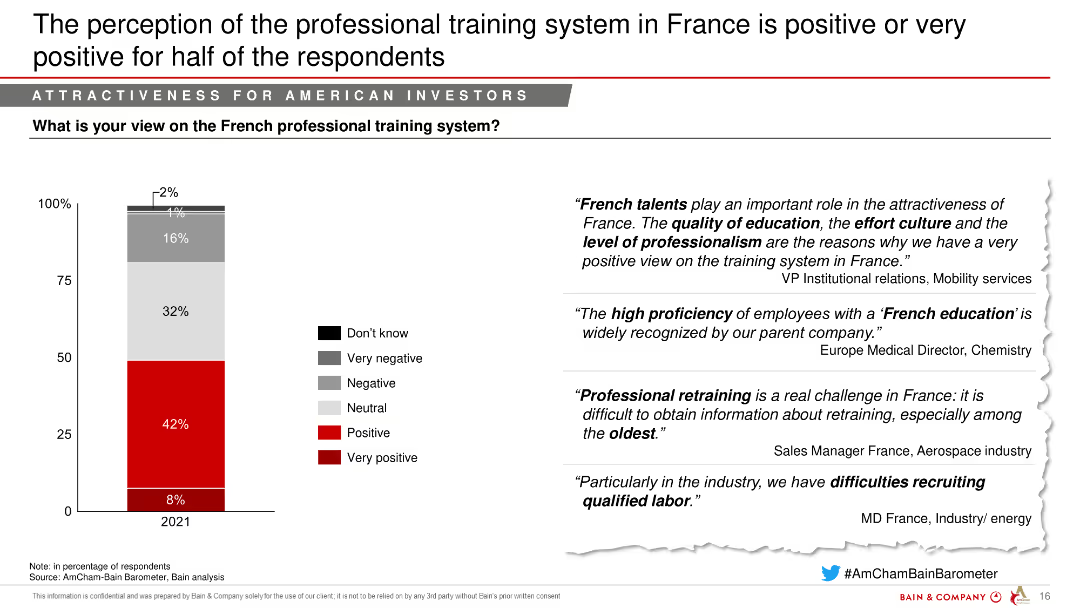
The slide features a column chart showing the perception of France's professional training system in 2021, segmented into positive, very positive, and other categories. Quotes from industry leaders are on the right.
Market Analysis and Trends
Government & Public Sector
This slide presents the perception of France's professional training system, indicating a generally positive outlook from respondents.
Professional training, Perception, Positive outlook, Aerospace, Defense
false
Market Analysis and Trends
Government & Public Sector
Mixed Chart
Bain
Add to my slides
Remove from favorites
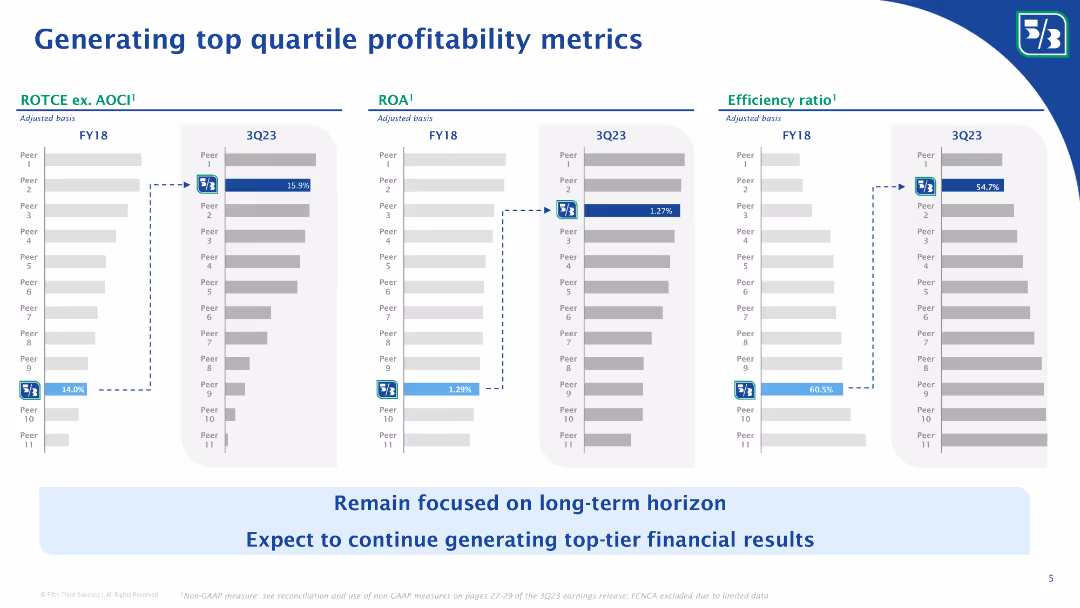
The slide features multiple column charts comparing ROTCE ex. AOCI, ROA, and efficiency ratios of Fifth Third Bank with peers over FY18 and 3Q23. Bullet points highlight their focus on long-term financial results.
Financial Performance
Financial Services
The slide showcases Fifth Third Bank’s top quartile profitability metrics, comparing key performance indicators like ROTCE, ROA, and efficiency ratios with peers. It emphasizes the bank’s focus on long-term financial performance and strategic financial planning.
Profitability metrics, ROTCE, ROA, efficiency ratio, financial performance, Fifth Third Bank, long-term results, peer comparison, financial planning, top quartile
false
Financial Performance
Financial Services
Multiple Chart
Goldman Sachs
Add to my slides
Remove from favorites
Bar graphs showing profitability and capital accumulation rates
Financial Performance
Financial Services
Santander's profitability leading to capital accumulation
Profitability, Capital Accumulation, CET1, Banking, Growth
false
Financial Performance
Financial Services
Single Chart
Morgan Stanley
Add to my slides
Remove from favorites
Bar graphs with comparative analysis of RoTE and RoRWA
Financial Performance
Financial Services
Santander's profitability and capital management from 2015-2019
Profitability, Capital, Acquisitions, Banking, RoTE
false
Financial Performance
Financial Services
Mixed Chart
Morgan Stanley
Add to my slides
Remove from favorites
Bar graph comparing gross and operating margins for durables and nondurables with a clear visual contrast.
Financial Performance
Financial Services
Compares profitability across verticals in the distribution industry, highlighting differences in margins.
Profitability, Distribution, Margins, Durables, Nondurables, Comparison
false
Financial Performance
Financial Services
Multiple Chart
EY
Add to my slides
Remove from favorites
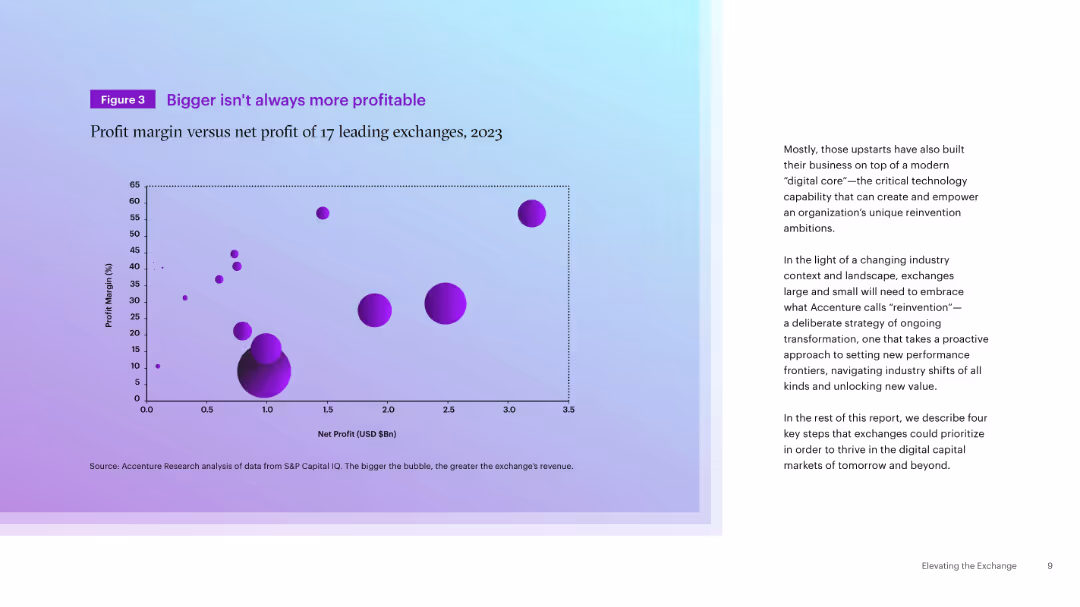
Left-aligned scatter plot with bubble chart (profit margin vs. net profit), accompanied by paragraph text on the right. Purple gradient background.
Financial Performance
Financial Services
The slide presents a bubble chart comparing the profit margins and net profits of 17 global exchanges in 2023, demonstrating that size does not equate to profitability. The accompanying text discusses the need for reinvention driven by digital transformation.
Profitability, Exchanges, Net Profit, Profit Margin, Digital Core, Reinvention, Financials, Market Performance, 2023
false
Financial Performance
Financial Services
Mixed Chart
Accenture
Add to my slides
Remove from favorites
Text and bullet points presenting factors affecting profitability, with a clear separation of industry and company specifics.
Operational Efficiency
Professional Services
Discusses the interplay between industry-specific and company-specific factors in profitability.
Profitability, Industry Factors, Company Factors, Distribution, Efficiency
false
Operational Efficiency
Professional Services
Table
EY
Add to my slides
Remove from favorites
Features a column chart displaying the pre-tax income growth of IWM Asset Management and a table comparing key metrics from 2015 to 3Q19 LTM.
Financial Performance
Financial Services
The slide showcases the significant growth in profitability and key metrics for IWM Asset Management, demonstrating the division's strong performance.
Profitability, Margins, Pre-Tax Income, IWM, Financial Growth
false
Financial Performance
Financial Services
Mixed Chart
Credit Suisse
Add to my slides
Remove from favorites
This slide displays three bar graphs comparing Fifth Third's performance metrics with peers, including ROTEC, ROA, and efficiency ratio. A textual sidebar outlines the significance of these metrics, with color coding to highlight Fifth Third's ranking. The layout is organized to facilitate direct comparison between the company and its competitors.
Financial Performance
Financial Services
The slide evaluates Fifth Third's profitability metrics, placing it within the top quartile among peers. The focus is on adjusted metrics for ROTEC, ROA, and efficiency ratio, with historical comparisons to indicate progress. This slide is useful for presentations to investors or internal stakeholders, detailing the bank's competitive financial health and operational efficiency.
Profitability, Metrics, Comparison, ROTEC, ROA, Efficiency Ratio, Financial Health, Operational Efficiency, Financial Services
false
Financial Performance
Financial Services
Multiple Chart
Goldman Sachs
Add to my slides
Remove from favorites
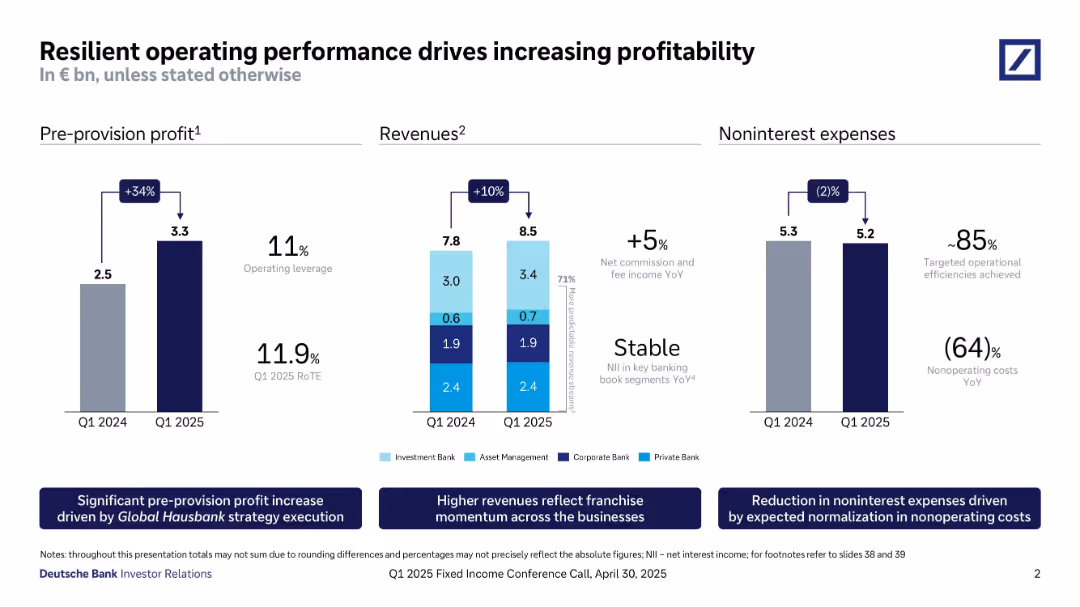
Three-column layout with bar charts showing pre-provision profit, revenues, and noninterest expenses.
Financial Performance
Financial Services
The slide demonstrates Deutsche Bank’s Q1 2025 operating performance improvements: pre-provision profit grew 34%, revenue increased 10%, and noninterest expenses decreased 2%. Highlights include RoTE, stable NII, and cost reductions.
Profitability, Operating Leverage, RoTE, Revenues, Expenses, Efficiency, Strategy Execution, Q1 2025
false
Financial Performance
Financial Services
Multiple Chart
Deutsche Bank
Add to my slides
Remove from favorites
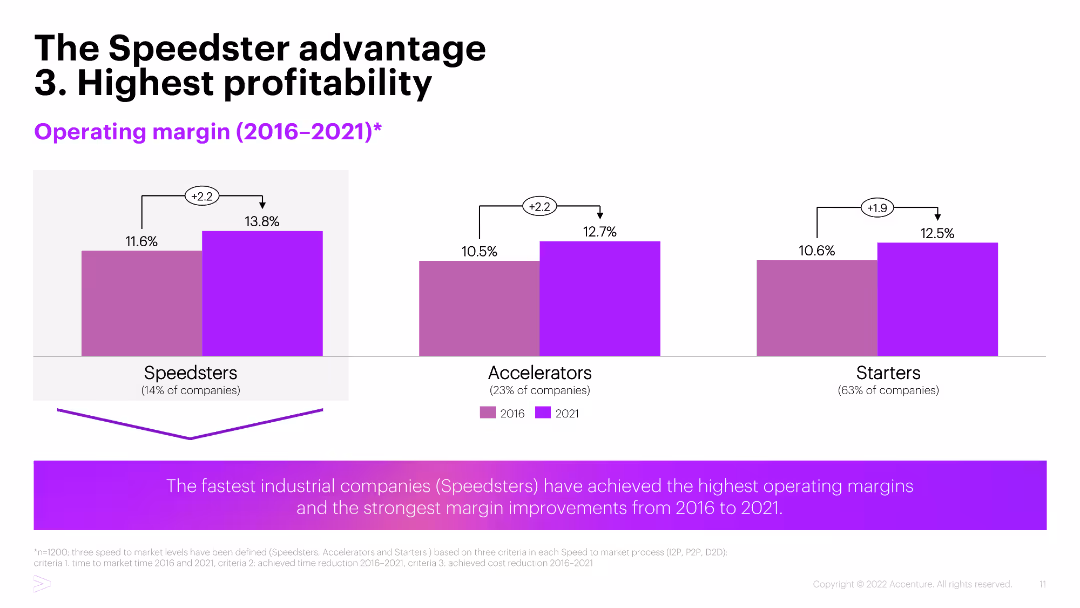
This slide contains a column chart comparing operating margins of three company types: Speedsters, Accelerators, and Starters over two time periods (2016 and 2021). The chart is visually clear, with color coding for easy comparison.
Financial Performance
Financial Services
The slide presents data on the highest profitability among industrial companies, highlighting that 'Speedsters' achieved the highest operating margins and significant improvements between 2016 and 2021.
Profitability, Operating Margins, Speedsters, Financial Performance, Comparison
false
Financial Performance
Financial Services
Mixed Chart
Accenture
Add to my slides
Remove from favorites
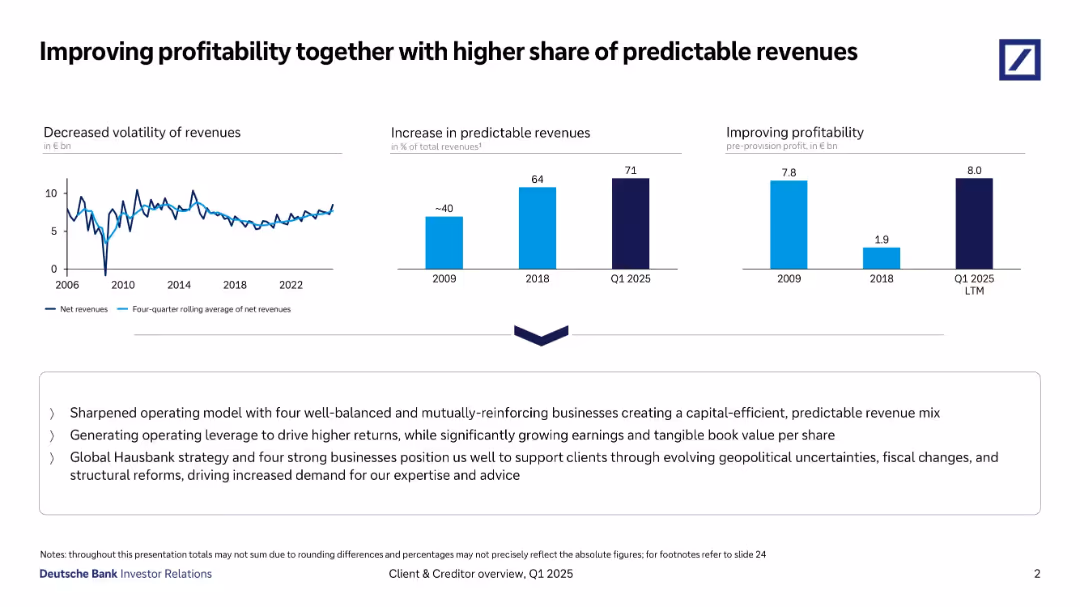
Three-panel horizontal layout showing revenue trends, predictable revenue growth, and profitability, with a strategic summary below.
Strategic Planning
Financial Services
Emphasizes reduced revenue volatility, increased share of predictable revenues (71% by Q1 2025), and strong pre-provision profitability. Highlights strategy with operational leverage, Hausbank positioning, and geopolitical risk management.
Profitability, Predictable Revenues, Strategy, Net Revenues, Hausbank
false
Strategic Planning
Financial Services
Multiple Chart
Deutsche Bank
Add to my slides
Remove from favorites
Features a series of column chart and trend arrows with annotations. It is color-coded to differentiate between various financial metrics over time.
Financial Performance
Financial Services
Slide details factors contributing to profitability, using ROTE and efficiency ratio metrics. Intended for financial analysis or investor briefings.
Profitability, ROTE, Efficiency, Financial Analysis, Performance, Metrics, Trends, Improvement
false
Financial Performance
Financial Services
Single Chart
Goldman Sachs
Add to my slides
Remove from favorites
The slide displays a complex vertical column chart tracing the company's profitability over the years, with a timeline of milestones beneath the chart.
Financial Performance
Financial Services
Reviews Macquarie's historical profitability and growth, ideal for investor relations or financial history presentations.
Profitability, Shareholder Return, Growth, Financial History, Milestones
false
Financial Performance
Financial Services
Single Chart
Morgan Stanley
Add to my slides
Remove from favorites
The slide is divided into three sections, with column charts showing profitability, WM product enablement, and franchise strength. Awards and rankings are listed on the right.
Financial Performance
Financial Services
This slide showcases improvements in profitability, enablement of Wealth Management products, and maintaining franchise strength with various rankings and awards.
Profitability, WM products, franchise strength, awards, rankings
false
Financial Performance
Financial Services
Multiple Chart
Credit Suisse
Add to my slides
Remove from favorites
Two charts: a column chart comparing long-term profitable vs a bar chart showing low-growth companies across industries; a heatmap comparing industry strengths.
Industry Overview
Professional Services
Analyzes long-term profitable growth in various industries, demonstrating different resilience and performance metrics.
Profitable growth, industry comparison, resilience, performance metrics, heatmap
false
Industry Overview
Professional Services
Multiple Chart
Accenture
Add to my slides
Remove from favorites
Bar graphs and line graph showing financial trends
Financial Performance
Financial Services
Santander's profit and CET1 growth over time
Profits, Banking, CET1, Financial Trends, Growth
false
Financial Performance
Financial Services
Multiple Chart
Morgan Stanley
Add to my slides
Remove from favorites
Series of column charts illustrating the EBIT trends of luxury goods brands through different economic phases from 2000 to 2017.
Financial Performance
Consumer Goods
Provides an analysis of how operating profits for luxury brands have evolved through various market conditions, emphasizing their resilience and profitability.
Profits, Luxury Goods, Financial Analysis
false
Financial Performance
Consumer Goods
Single Chart
Bain
Add to my slides
Remove from favorites
The slide displays column charts showing profit before tax and income. Text sections discuss consistent profits, recurring income, and disciplined resource management.
Financial Performance
Financial Services
This slide highlights UBS's strong and steady profits in personal and corporate banking, detailing income sources and financial performance.
Profits, UBS, Banking, Income, Resource Management
false
Financial Performance
Financial Services
Multiple Chart
UBS
Add to my slides
Remove from favorites
A comparative bar chart slide with a dark and light purple theme, comparing factors important for successful strategy delivery on the left with practices important for the same on the right, distinguished by shades and percentage labels.
Strategic Planning
Professional Services
This slide offers insights into program governance and related factors for successful delivery of reinvention strategies. It suggests a focus on effective governance, culture, and partnerships, critical for decision-makers and strategy planners.
Program Governance, Strategy Delivery, Success Factors, Organizational Culture, Partnerships, Leadership Engagement, Business Case, Execution Practices
false
Strategic Planning
Professional Services
Multiple Chart
Accenture
Add to my slides
Remove from favorites
The slide features a three-part comparative layout with check marks and bullet points. It is moderately dense with textual information across three distinct sections, comparing company priorities with achieved progress. The text is organized in blue and black, with green checks indicating progress.
Operational Efficiency
Financial Services
This slide outlines JPMorgan Chase & Co.'s significant progress against set priorities such as acquisition and deepening, engagement, and expenses and simplification. It uses bullet points and check marks to indicate achievements like increased deposit balances and improved digital activity rates. The slide is likely used in presentations to stakeholders to demonstrate company growth and operational achievements.
Progress, Priorities, Banking, Deposits, Engagement, Digital, Expenses, Simplification, Achievements, Growth
false
Operational Efficiency
Financial Services
Table
JP Morgan
Add to my slides
Remove from favorites
The slide contains text boxes and diagrams outlining the inputs (e.g., literature review, surveys) and outputs (e.g., target outcomes, recommendations) for a project on fashion returns.
Strategic Planning
Retail & E-commerce
Describes the scope of a project aimed at addressing fashion returns, detailing the methodology, inputs from stakeholders, and expected outcomes and recommendations.
Project scope, Inputs, Outputs, Recommendations, Fashion returns
false
Strategic Planning
Retail & E-commerce
Diagram
Roland Berger
Add to my slides
Remove from favorites
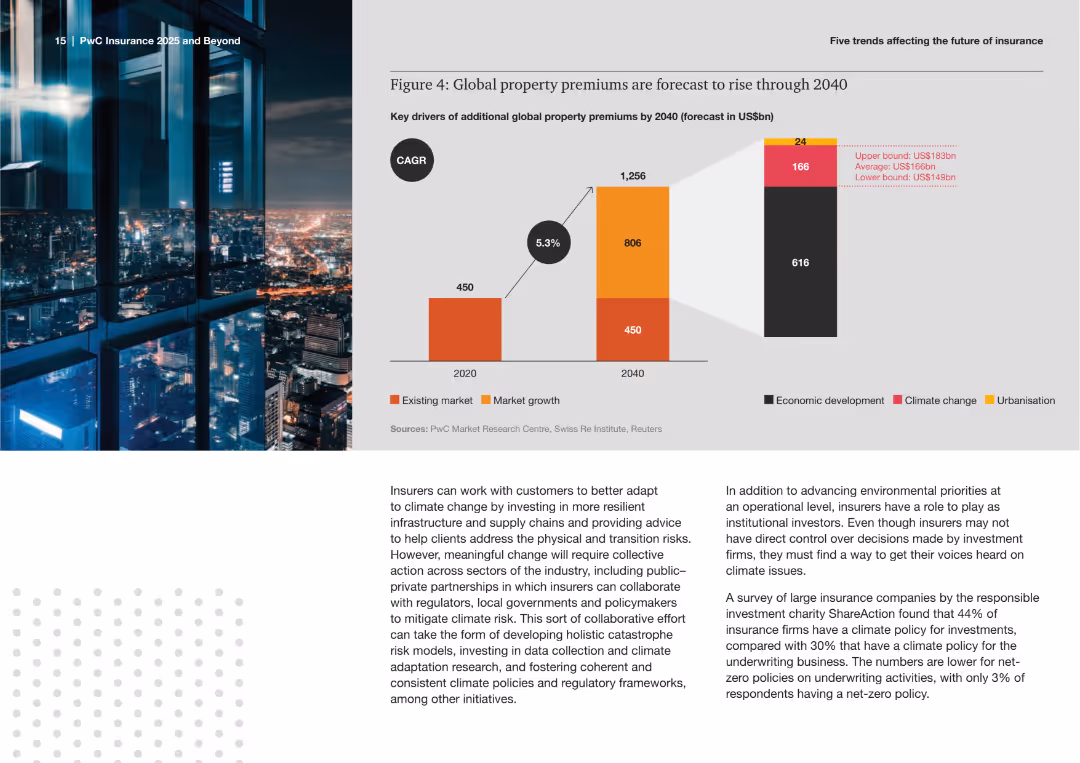
The slide features a bar chart forecasting additional global property premiums by 2040, broken down by economic development, climate change, and urbanization. It shows projections in existing and growth markets.
Market Analysis and Trends
Financial Services
This slide presents forecasts for the rise in global property premiums through 2040, attributing increases to factors like economic development, climate change, and urbanization. It offers insights into future market growth and risks.
Property Premiums, Forecast, Insurance, Market Growth, Climate Change, Urbanization, Economic Development, Bar Chart, Trends, Projections
false
Market Analysis and Trends
Financial Services
Mixed Chart
PwC/Strategy&
Add to my slides
Remove from favorites
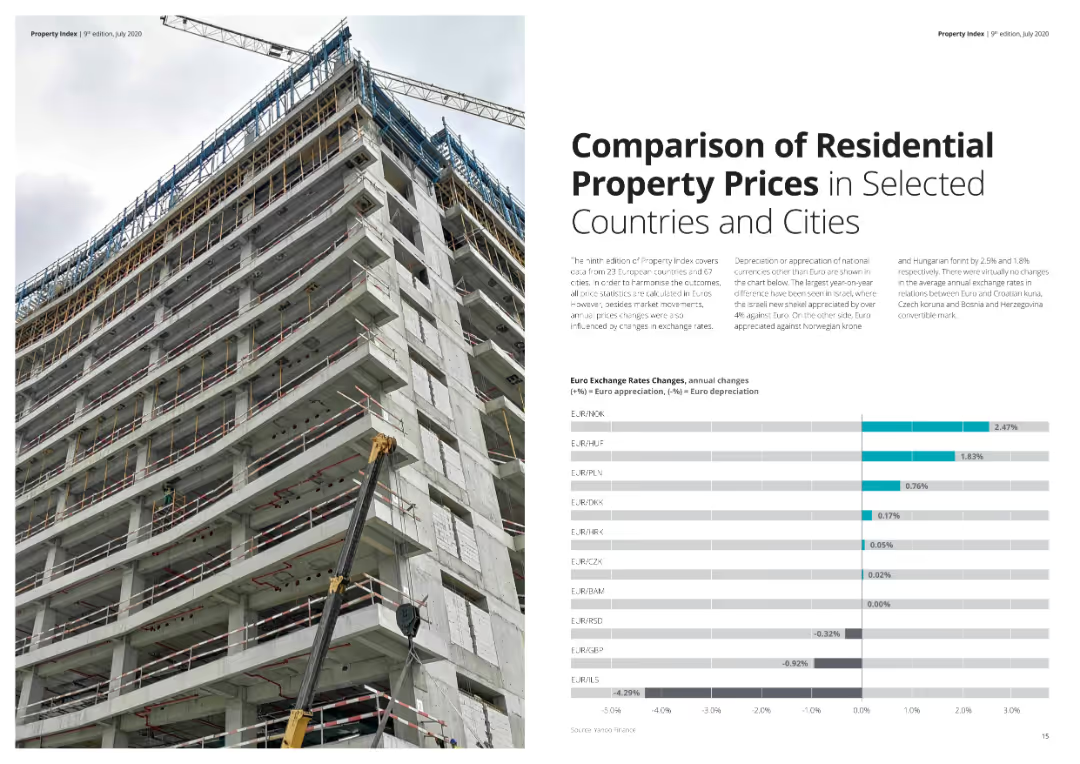
The slide features a bar chart comparing property prices in selected European countries and cities, along with text detailing exchange rate changes. The visual presentation is clear with distinct color usage for data points. Visual complexity is moderate.
Market Analysis and Trends
Real Estate & Construction
Compares residential property prices across European countries and cities, highlighting changes in exchange rates and their impact on property prices. Useful for investors and analysts monitoring the real estate market.
Property prices, residential, Europe, comparison, exchange rates
false
Market Analysis and Trends
Real Estate & Construction
Mixed Chart
Deloitte
Add to my slides
Remove from favorites
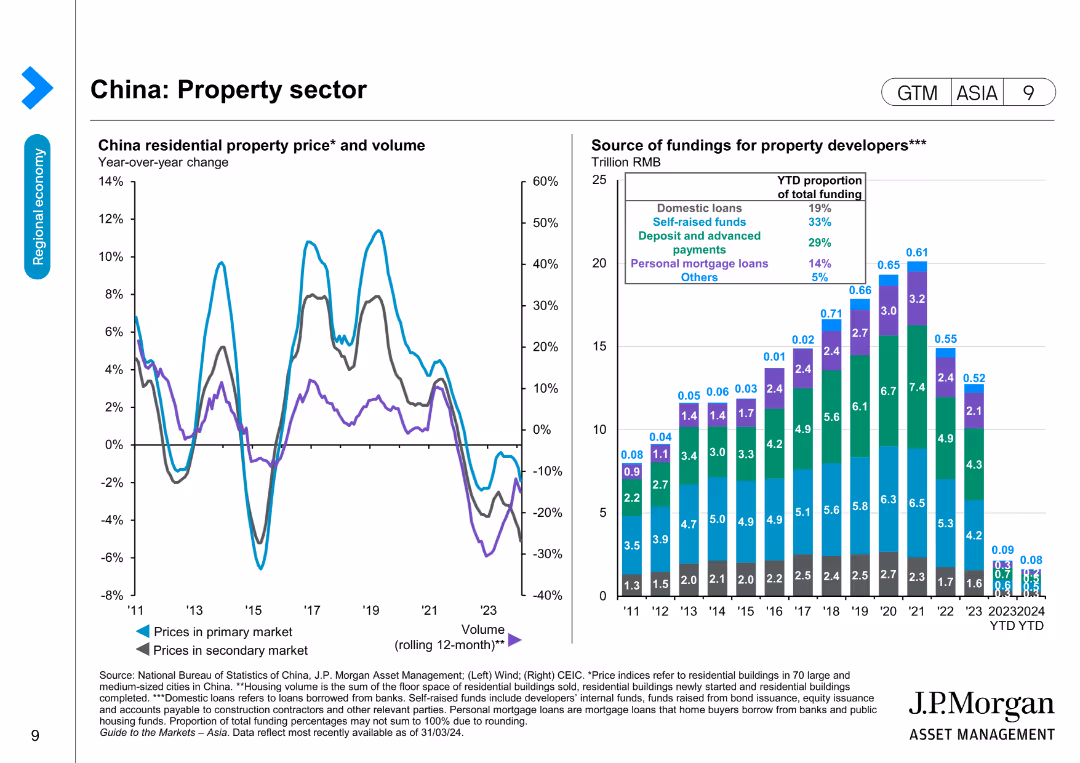
Features two line charts and a bar chart showing China residential property prices and volume, and the source of funding for property developers over time.
Market Analysis and Trends
Real Estate & Construction
Examines the property sector in China by tracking residential property prices and funding sources, useful for market and investment analysis in real estate.
Property sector, China, Real estate, Funding, Residential prices, Market trends, Investment, Economic data
false
Market Analysis and Trends
Real Estate & Construction
Multiple Chart
JP Morgan
Add to my slides
Remove from favorites
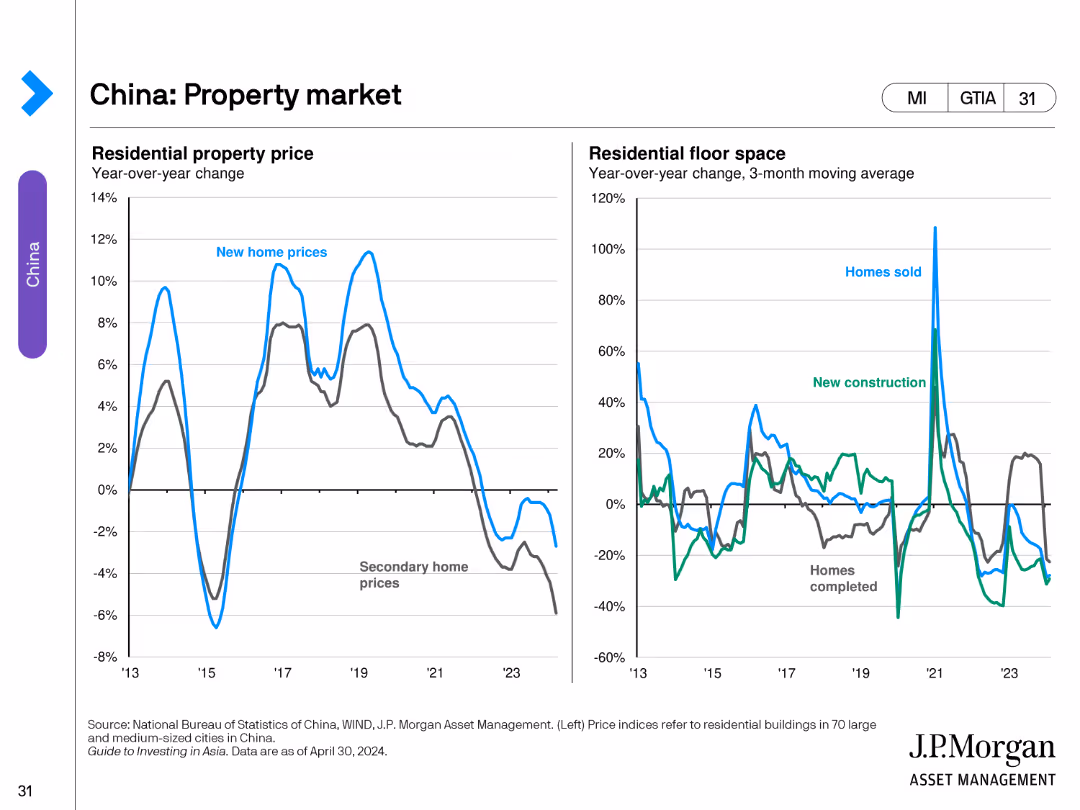
The slide includes two line charts. The left chart shows year-over-year changes in residential property prices. The right chart illustrates year-over-year changes in residential floor space for homes sold and new constructions.
Market Analysis and Trends
Real Estate & Construction
This slide evaluates the property market in China, analyzing trends in residential property prices and residential floor space changes.
Property, Market, China, Prices, Construction
false
Market Analysis and Trends
Real Estate & Construction
Multiple Chart
JP Morgan
Add to my slides
Remove from favorites
The slide features three sections titled Respondent Access, Survey, and Analysis & Reporting, each with icons and brief descriptions. It uses a three-column layout with hexagonal shapes and company logos.
Technology and Digital Transformation
Technology & Software
The slide details the capabilities and benefits of an end-to-end proprietary platform, highlighting respondent access, survey capabilities, and analysis & reporting functionalities.
Proprietary, platform, survey, analysis, reporting, capabilities, respondent, access, AI, efficiency
false
Technology and Digital Transformation
Technology & Software
Linear Flow
IPSOS
Add to my slides
Remove from favorites
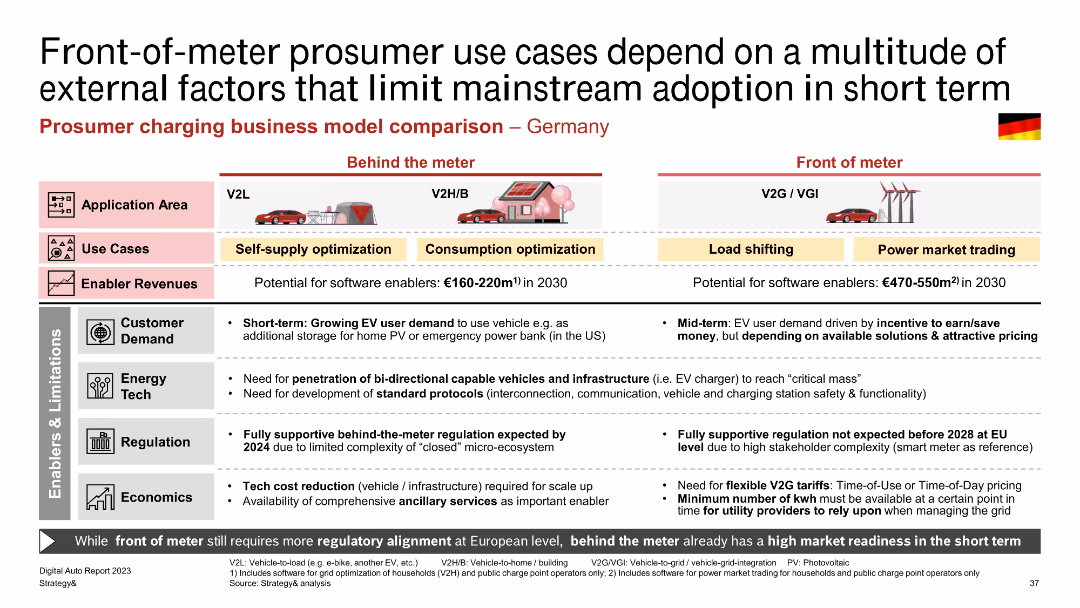
The slide compares different prosumer charging business models (V2L, V2H/B, V2G/VGI) using tables and icons. It includes detailed text on enablers and limitations across customer demand, energy tech, regulation, and economics.
Regulatory and Compliance
Energy & Utilities
The slide provides a detailed comparison of prosumer charging business models, focusing on the different use cases behind and in front of the meter. It discusses potential revenues, customer demand, technology needs, regulatory support, and economic factors influencing adoption.
Prosumer, Charging, V2L, V2H/B, V2G/VGI, Business Models, Revenue, Customer Demand, Regulation, Economics
false
Regulatory and Compliance
Energy & Utilities
Table
PwC/Strategy&
Add to my slides
Remove from favorites
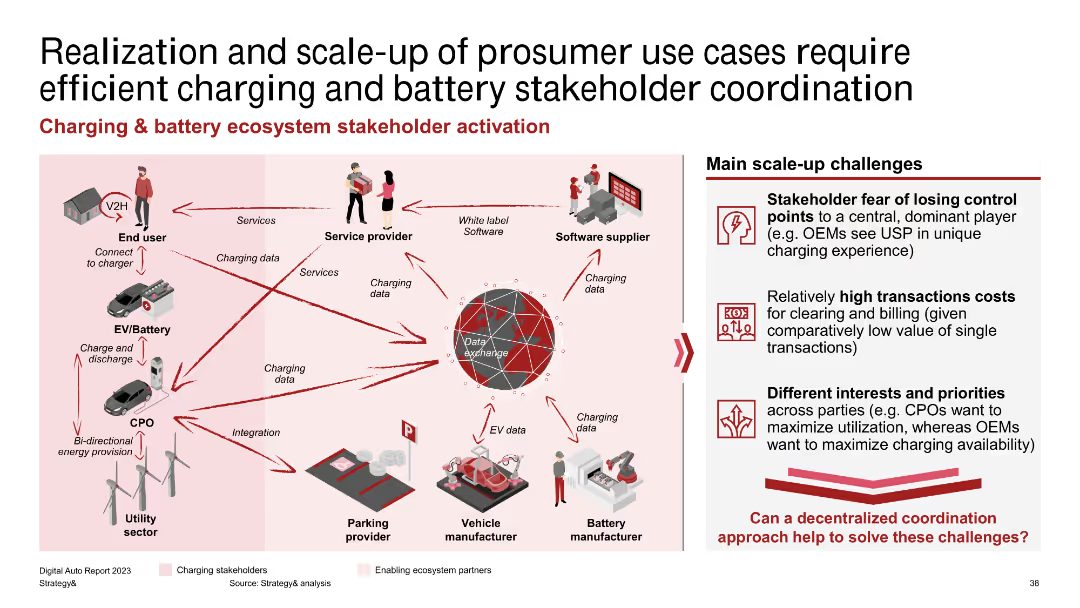
The slide features a stakeholder map with icons and arrows depicting interactions between end users, service providers, software suppliers, CPOs, and utility sectors. The right side lists main scale-up challenges.
Strategic Planning
Energy & Utilities
The slide outlines the ecosystem required for scaling up prosumer use cases, emphasizing the coordination among various stakeholders like end users, service providers, and utility sectors. It highlights challenges such as high transaction costs and differing stakeholder priorities.
Prosumer, Stakeholders, Coordination, Charging, Battery, Scale-up, Challenges, Ecosystem, End Users, Service Providers
false
Strategic Planning
Energy & Utilities
Diagram
PwC/Strategy&
Add to my slides
Remove from favorites
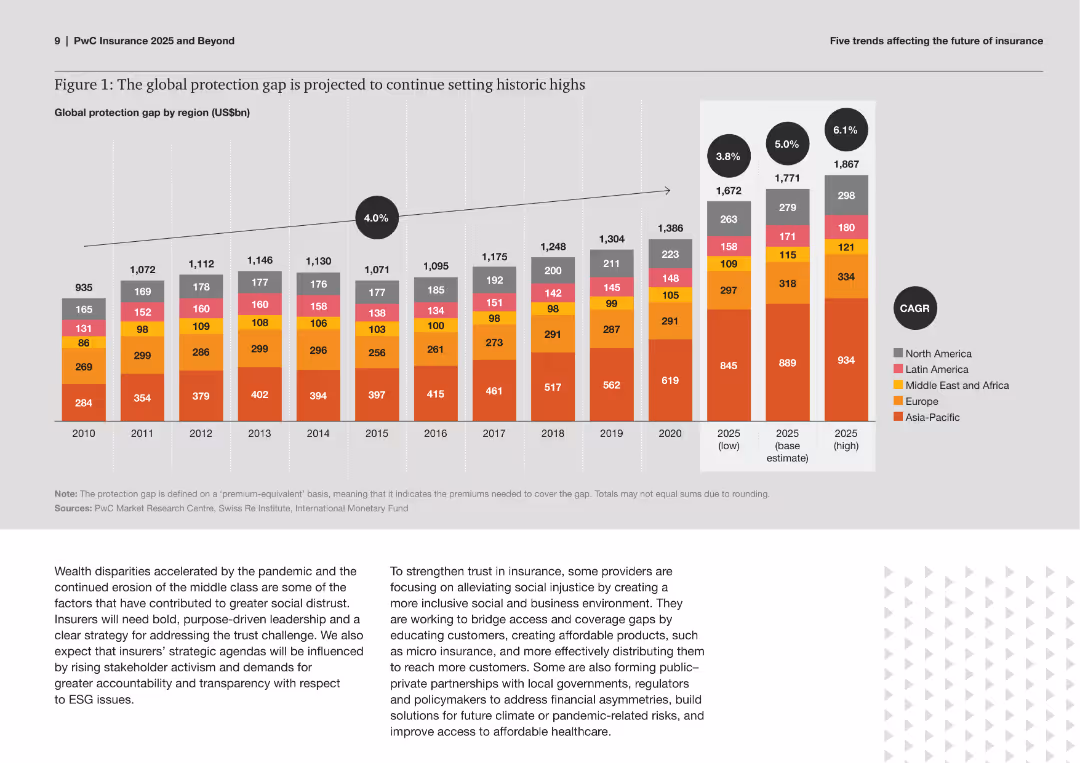
The slide features a stacked column chart showing the global protection gap by region (North America, Latin America, Middle East and Africa, Europe, Asia-Pacific) from 2010 to 2020, with projections to 2025.
Risk Assessment and Management
Financial Services
This slide analyzes the increasing global protection gap, detailing the premiums needed to cover the gap across various regions. It includes historical data and future projections, stressing the need for strategic actions in the insurance sector.
Protection Gap, Insurance, Risk Management, Global, Regions, Historical Data, Projections, Stacked Column Chart, Trends, Analysis
false
Risk Assessment and Management
Financial Services
Mixed Chart
PwC/Strategy&
Add to my slides
Remove from favorites
The slide includes two main visual components: a pie chart showing the percentage of people increasing their protein intake, and a column chart comparing the volume percentage change in total edible products versus total protein. The design is clean, using blues and neutrals to highlight key data.
Market Analysis and Trends
Agriculture & Food Production
Analyzes consumer trends in protein consumption and its impact on market growth. The data suggests a growing consumer preference for protein-rich diets, which is driving retail sales in the protein segment. This insight could be pivotal for businesses looking to capitalize on health and wellness trends.
Protein, Market Growth, Trends, Health, Consumer Behavior
false
Market Analysis and Trends
Agriculture & Food Production
Multiple Chart
Barclays
Add to my slides
Remove from favorites
Four numbered sections with text boxes outlining benefits such as brand recognition, resilience, understanding society, and methodological rigor.
Strategic Planning
Professional Services
Explains the benefits of Ipsos' public affairs service line, focusing on brand recognition, resilience to market shocks, understanding of society, and high methodological standards.
Public Affairs, Benefits, Brand Recognition, Society, Resilience
false
Strategic Planning
Professional Services
Linear Flow
IPSOS
Add to my slides
Remove from favorites
Vertical bar charts compare the main factors of concern for EV charging at public facilities in different regions, using distinct colors for each factor.
Market Analysis and Trends
Transportation & Logistics
This slide covers key issues like charging costs and long wait times at public charging facilities, showing how these concerns vary globally.
Public EV charging, costs, waiting times, regional concerns, charging facilities
false
Market Analysis and Trends
Transportation & Logistics
Multiple Chart
EY
Add to my slides
Remove from favorites
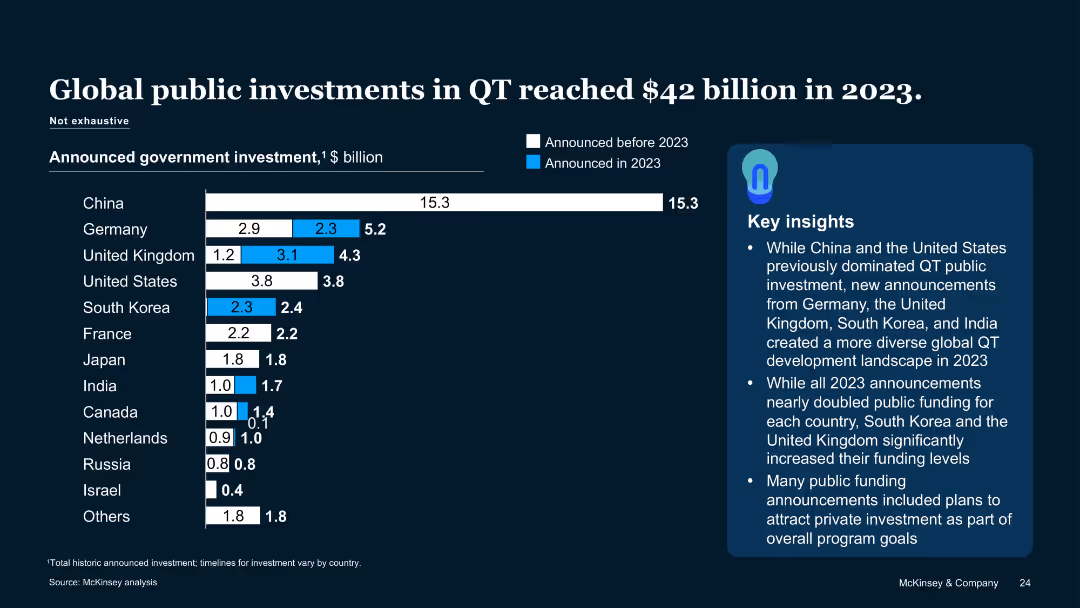
Horizontal bar chart showing public QT investment by country with 2023 additions marked separately
Financial Performance
Government & Public Sector
The slide reveals national government investments in QT, led by China, Germany, UK, and the US. Many 2023 announcements doubled earlier commitments. The chart highlights a broadening global base for QT public funding.
Public Funding, QT Investment, Government Spending, 2023 Announcements
false
Financial Performance
Government & Public Sector
Mixed Chart
McKinsey
Add to my slides
Remove from favorites
Bar chart comparing public health staff counts and budgets per 100,000 residents across states. Text explains findings and implications.
Operational Efficiency
Healthcare & Pharmaceuticals
Review of NH public health staff and budget allocation per resident, identifying NH as understaffed relative to peer states during COVID-19 pandemic.
Public Health, Staffing, Budget, COVID-19, Comparison
false
Operational Efficiency
Healthcare & Pharmaceuticals
Mixed Chart
Alvarez & Marsal
Add to my slides
Remove from favorites
Previous
Next
You don't have any favorites yet.
Please wait loading your favorites slides...
Create a FREE account to continue browsing
Receive Instant Access to 1,000+ slides from companies like McKinsey, Google, and Goldman Sachs
First Name
Last Name
Email
Password
I agree to all
Terms & Privacy Policy
Thank you! Your submission has been received!
Oops! Something went wrong while submitting the form.
Have an account?
Sign in
Upgrade to PRO to Save slides
Advanced Search and Filters
Access to 15,000+ slides
Access to Category Pages
Save/Bookmark Slides
PowerPoint Template Library
Pick a Plan
MONTHLY
$12/month
Billed every month, Cancel anytime.
YEARLY
$9/year
Billed $108 annually, Cancel anytime.
Checkout for $12/month
Checkout for $108/yr
Secured by Stripe | AES-256 bit encryption