My Account
My Slides
Search by Category
Pricing
Templates
View All Templates
Download Template Slides
✦ AI Search
Feedback
Login
Logout
Get Started
Browse all Slides
Browse all Slides
Create a FREE Account
Instant access to 1,000+ real slides from top companies like McKinsey, BCG, Goldman Sachs, Google and many more!
First Name
Last Name
Email
Password
I agree to all
Terms & Privacy Policy
Thank you! Your submission has been received!
Oops! Something went wrong while submitting the form.
Have an account?
Sign in
Saved Slides
Total No. of slides saved
0
↻ Refresh
✖ Clear all
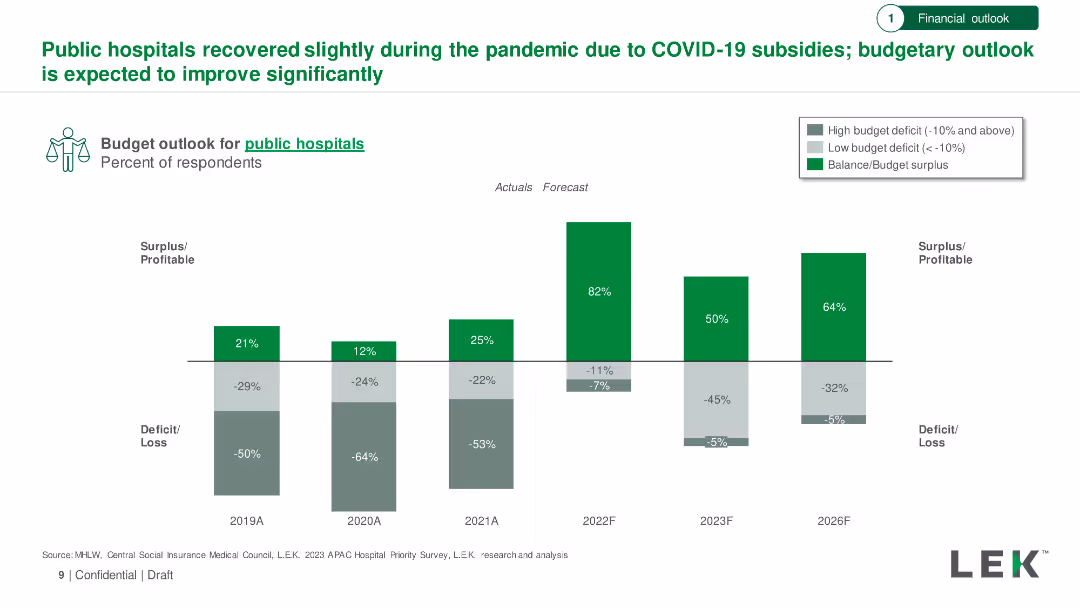
Bar chart showing budget outlook for public hospitals from 2019 to 2026, with actuals and forecasts. Includes surplus/deficit percentages.
Financial Performance
Healthcare & Pharmaceuticals
Analysis of the financial recovery of public hospitals during the pandemic, with an optimistic budget outlook forecasted through 2026.
Public Hospitals, Budget Outlook, COVID-19, Financial Recovery, Forecast
false
Financial Performance
Healthcare & Pharmaceuticals
Single Chart
LEK
Add to my slides
Remove from favorites
A slide with dual charts contrasting public market and tech performance with U.S. venture investment, accompanied by a second chart on key inflation indicators and treasury interest rates. Each chart uses different colored lines for comparison and has annotations for additional context.
Market Analysis and Trends
Technology & Software
This slide analyzes the trend of public market rallies driven by technology companies contrasted against a drop in venture investments. It also provides a secondary focus on inflation and interest rates, aiming to discuss the financial climate and its effects on investment strategies. It can be used to guide discussions on economic trends and investment decisions, especially in technology-driven markets.
Public Markets, Technology, Venture Investment, Inflation, Interest Rates, Economic Trends
false
Market Analysis and Trends
Technology & Software
Multiple Chart
JP Morgan
Add to my slides
Remove from favorites
A column chart showing the likelihood of enterprise executives using public blockchains in the future, with 75% believing public blockchains are in their future. Accompanied by text explaining the challenges of private blockchains and the advantages of public networks.
Market Analysis and Trends
Technology & Software
Shows survey results indicating a strong trend among enterprises towards adopting public blockchains due to the challenges faced with private blockchain networks.
Public blockchains, enterprise, challenges, private blockchains, survey, future adoption, power of public networks
false
Market Analysis and Trends
Technology & Software
Mixed Chart
EY
Add to my slides
Remove from favorites
A diagram showing a model of siloed private networks and a bar chart displaying the participation in private blockchain networks. It contrasts the traditional isolated networks with emerging trends of openness to public blockchains.
Market Analysis and Trends
Technology & Software
Highlights the shift from isolated private networks to a growing interest in public blockchains among enterprises, driven by the limitations of current siloed models.
Public blockchains, enterprise, trends, private networks, isolation, openness, participation, 2019, accelerated interest
false
Market Analysis and Trends
Technology & Software
Mixed Chart
EY
Add to my slides
Remove from favorites
This slide features two column charts depicting "Public Debt", "Budget Deficit", and "Fiscal Weakness". Each chart is labeled with years and financial data in billions and percentage of GDP.
Regulatory and Compliance
Government & Public Sector
This slide compares public debt, budget deficits, and fiscal weaknesses over several fiscal years to illustrate government financial challenges.
Public debt, budget deficit, GDP, fiscal analysis, financial data
false
Regulatory and Compliance
Government & Public Sector
Multiple Chart
PwC/Strategy&
Add to my slides
Remove from favorites
The slide includes two vertical column charts comparing survey responses from 2013 and 2022 in Japan, Sweden, GB, and South Africa.
Market Analysis and Trends
Technology & Software
The slide analyzes the increase in public concerns about technology over time in different countries.
Public disquiet, technology, survey, public opinion, technology growth
false
Market Analysis and Trends
Technology & Software
Multiple Chart
IPSOS
Add to my slides
Remove from favorites
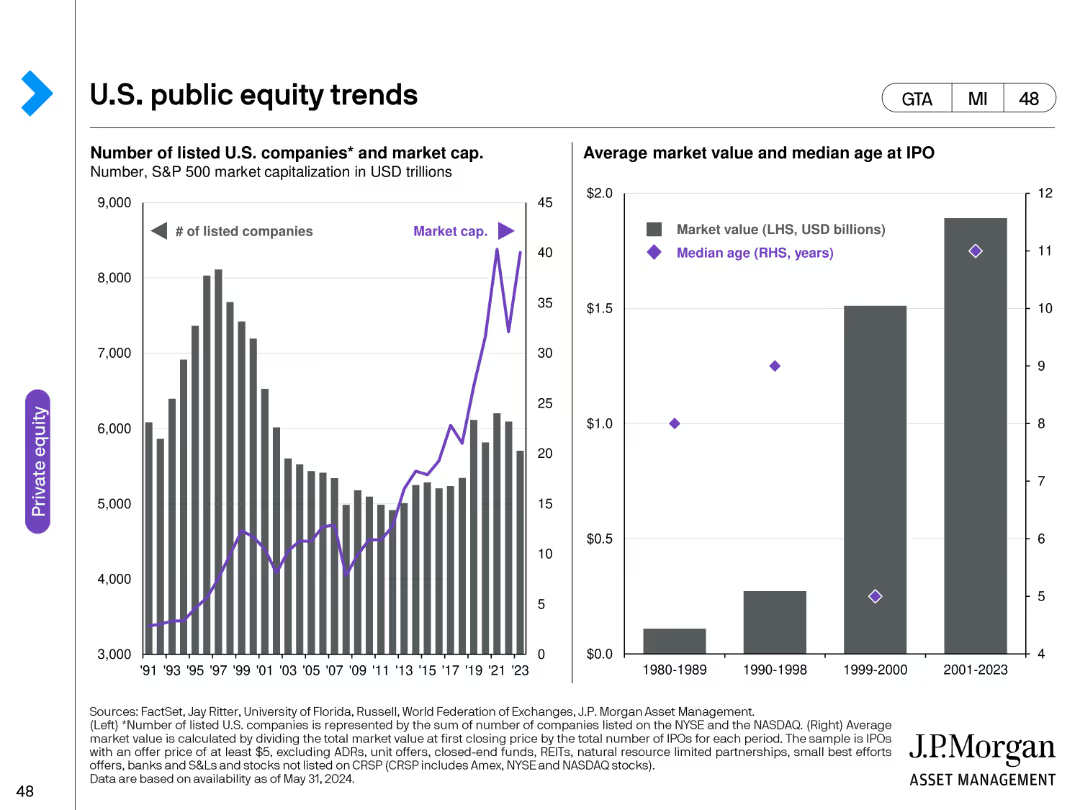
The slide includes two charts: a line chart on the left showing the number of listed U.S. companies and their market cap from 1991 to 2023, and a column chart on the right depicting the average market value and median age at IPO for different periods. The line chart uses a dual-axis to show both company count and market cap.
Market Analysis and Trends
Financial Services
This slide examines trends in the U.S. public equity market, detailing the number of listed companies, their market capitalization, and the average market value and age at IPO. It is useful for understanding the evolution and dynamics of the public equity market.
Public equity, market cap, listed companies, IPO trends, equity market analysis, financial trends
false
Market Analysis and Trends
Financial Services
Multiple Chart
JP Morgan
Add to my slides
Remove from favorites
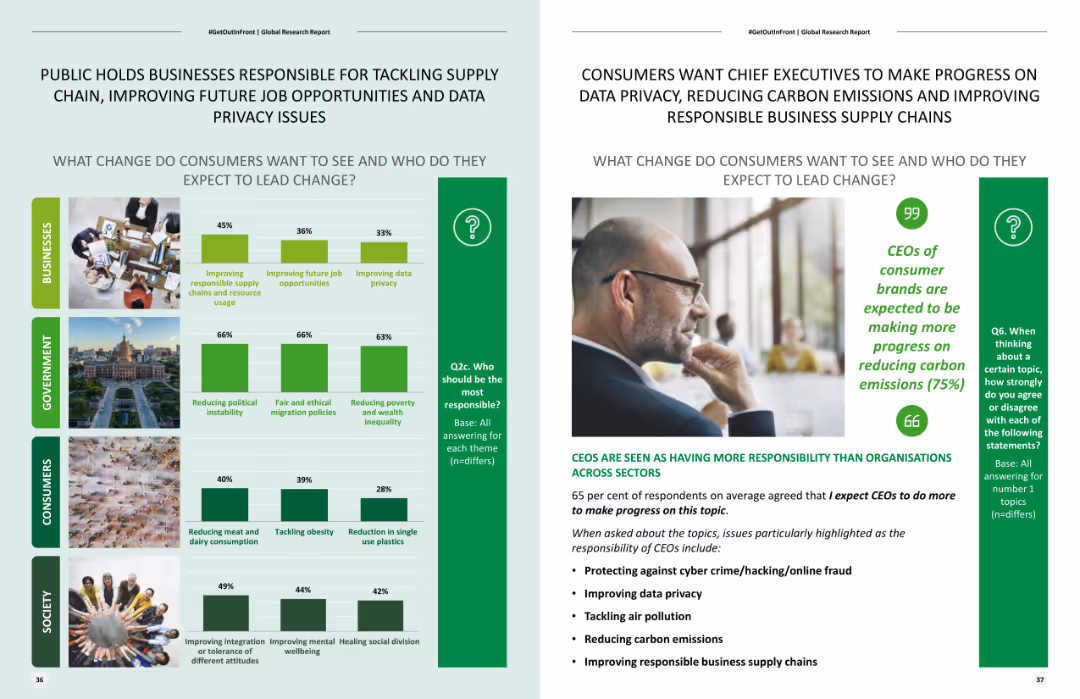
Includes column charts and images depicting different sectors like businesses, government, and society, indicating responsibility for leading changes.
Organizational Structure and Change
Professional Services
Evaluates public opinion on who should be responsible for addressing issues like supply chain improvements and job opportunities, focusing on businesses' roles.
Public responsibility, supply chain, job opportunities, business roles, public opinion
false
Organizational Structure and Change
Professional Services
Multiple Chart
Deloitte
Add to my slides
Remove from favorites
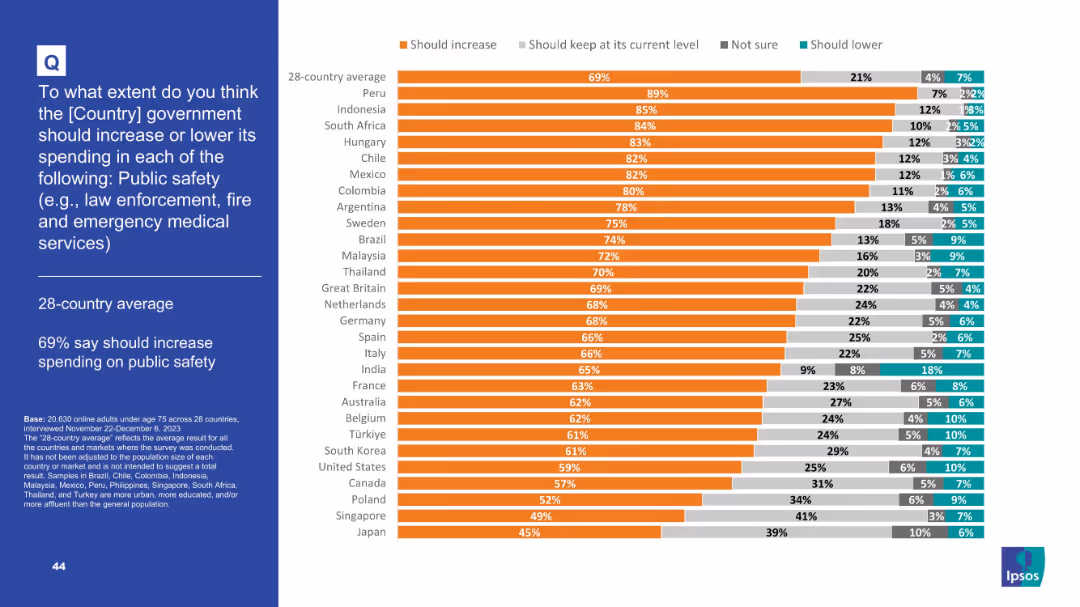
Bar chart ranked by country, orange and gray bars showing opinion on increasing public safety funding
Strategic Planning
Government & Public Sector
The slide presents public opinion across 28 countries on whether government spending on public safety (law enforcement, fire, EMS) should increase. 69% on average support an increase, with Peru showing the highest support (89%).
Public safety, government spending, survey, law enforcement, emergency services, international comparison, bar chart, Ipsos, policy priorities, global views
false
Strategic Planning
Government & Public Sector
Mixed Chart
IPSOS
Add to my slides
Remove from favorites
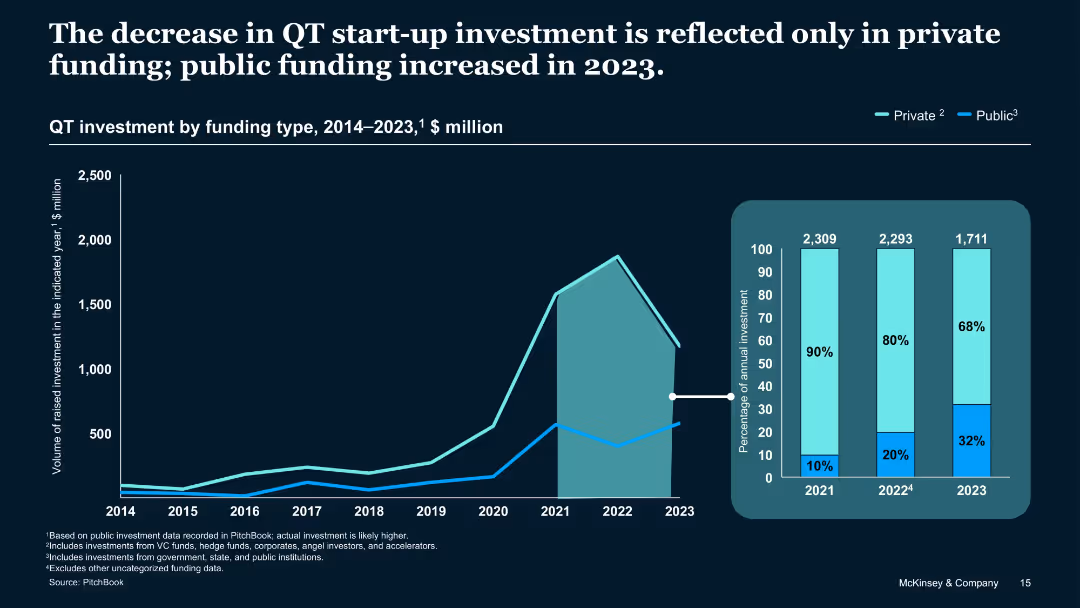
Area chart and stacked bar chart illustrating funding sources over time
Investment Analysis
Artificial Intelligence
Shows the 2023 decline in QT investment was primarily in private funding, while public investment increased. Public funding grew to 32% of total share. Annotations highlight recent shifts in the funding composition.
Public vs private, 2023 funding mix, investment breakdown, VC, trends
false
Investment Analysis
Artificial Intelligence
Single Chart
McKinsey
Add to my slides
Remove from favorites
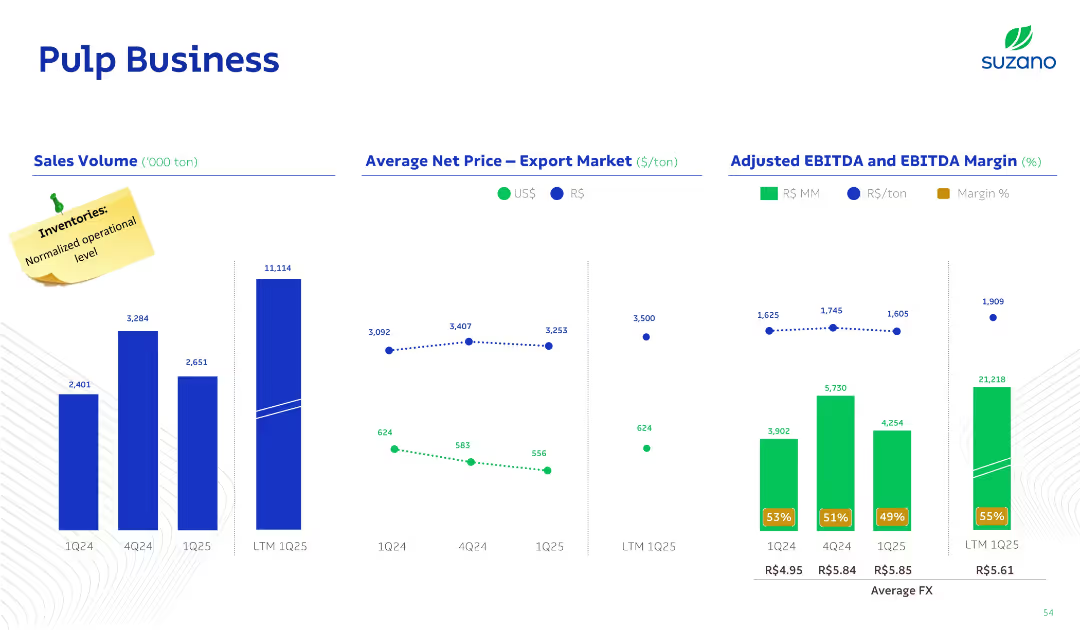
Three-column layout: sales volume (bar), export price trends (dotted lines), and EBITDA metrics (bar + line); design includes note about normalized inventory.
Performance Metrics and KPIs
Consumer Goods
This slide analyzes the pulp business segment, tracking sales volume, export pricing in R$/US$, and EBITDA margins. It includes comparisons over quarters and LTM, showing improvements in efficiency and return metrics.
Pulp, Sales Volume, EBITDA, Pricing, Export
false
Performance Metrics and KPIs
Consumer Goods
Multiple Chart
Goldman Sachs
Add to my slides
Remove from favorites
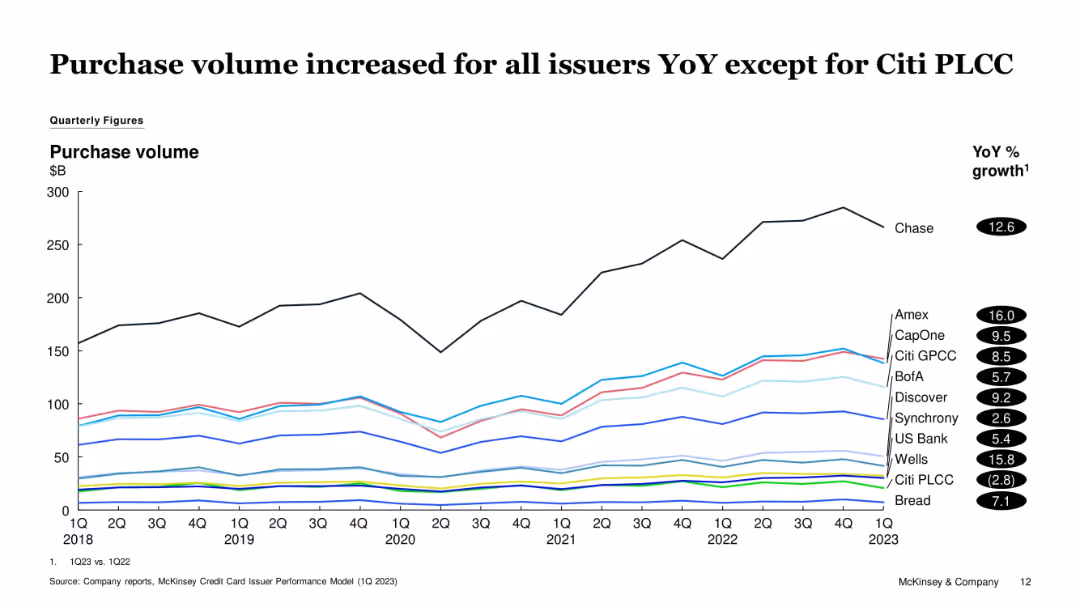
Line graph showing quarterly purchase volumes from 2018 to 1Q23. Different colored lines represent various issuers. YoY % growth is listed on the right.
Financial Performance
Financial Services
The slide tracks changes in credit card purchase volume over time, noting that all issuers except Citi PLCC experienced YoY growth. Chase and Amex show significant upward trends, while Citi PLCC declines slightly.
Purchase Volume, Credit Cards, Issuers, Amex, Citi PLCC, Chase, Trends
false
Financial Performance
Financial Services
Single Chart
McKinsey
Add to my slides
Remove from favorites
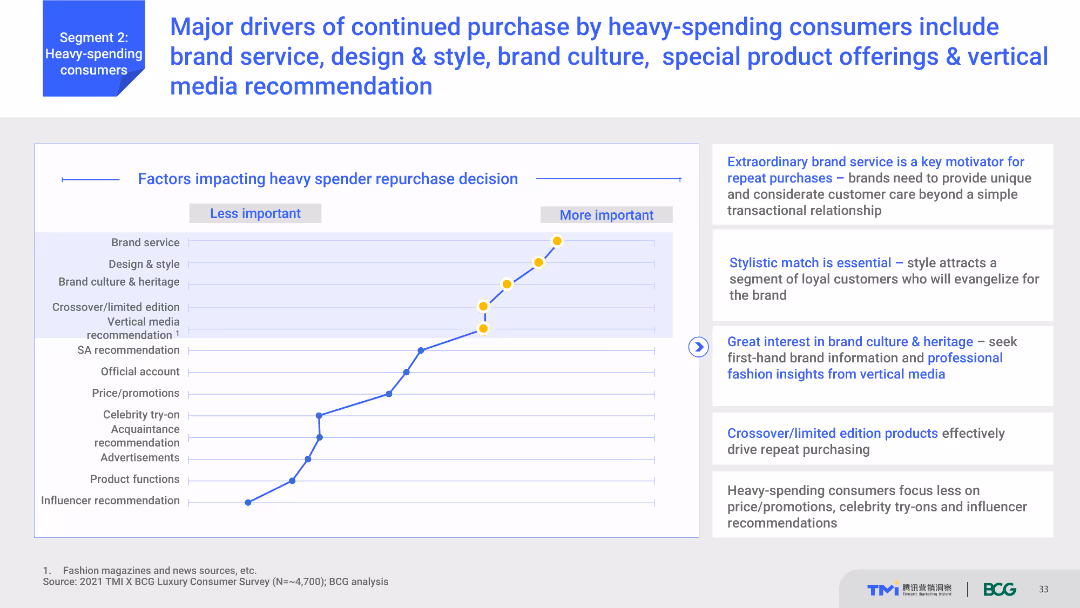
Line graph showing factors influencing heavy spender repurchase decisions, from least to most important. Includes supporting text that explains each factor's significance.
Market Analysis and Trends
Consumer Goods
Analyzes the key factors that drive repeat purchases among heavy-spending consumers, such as brand service, design & style, and special product offerings. Emphasizes the importance of vertical media recommendations in influencing consumer behavior.
Purchase drivers, brand service, design & style, brand culture, consumer retention
false
Market Analysis and Trends
Consumer Goods
Mixed Chart
BCG
Add to my slides
Remove from favorites
Features scatter plots and other visual representations to show various applications of the Purchasing Chessboard® in different contexts.
Market Analysis and Trends
Professional Services
Demonstrates diverse applications of the Purchasing Chessboard® in managing procurement stakeholders and category profiles.
Purchasing Chessboard, applications, procurement, stakeholders, category profiles, scatter plots, visual representation
false
Market Analysis and Trends
Professional Services
Uncategorized
Kearney
Add to my slides
Remove from favorites
Contains matrix-style charts showing the usage of Purchasing Chessboard® levers among leaders and typical companies.
Market Analysis and Trends
Professional Services
Compares the systematic use of Purchasing Chessboard® levers between leading companies and typical firms, highlighting differences.
Purchasing Chessboard, levers, market analysis, trends, procurement, leaders, companies, comparison, matrix charts
false
Market Analysis and Trends
Professional Services
Multiple Chart
Kearney
Add to my slides
Remove from favorites
A detailed step-by-step diagram explaining the 7-step strategic sourcing process, with annotations for each step.
Strategic Planning
Professional Services
Illustrates how the Purchasing Chessboard® is applied in strategic sourcing projects, providing a structured process overview.
Purchasing Chessboard, strategic sourcing, process, steps, procurement, planning, structured process, annotations
false
Strategic Planning
Professional Services
Linear Flow
Kearney
Add to my slides
Remove from favorites
Features column charts comparing purchasing behavior across different demographics.
Market Analysis and Trends
Retail & E-commerce
Explores purchasing trends for special edition luxury products, highlighting the strong market response in younger demographics and in China.
Purchasing trends, luxury products, special editions, demographics, younger consumers, China, consumer behavior
false
Market Analysis and Trends
Retail & E-commerce
Multiple Chart
BCG
Add to my slides
Remove from favorites
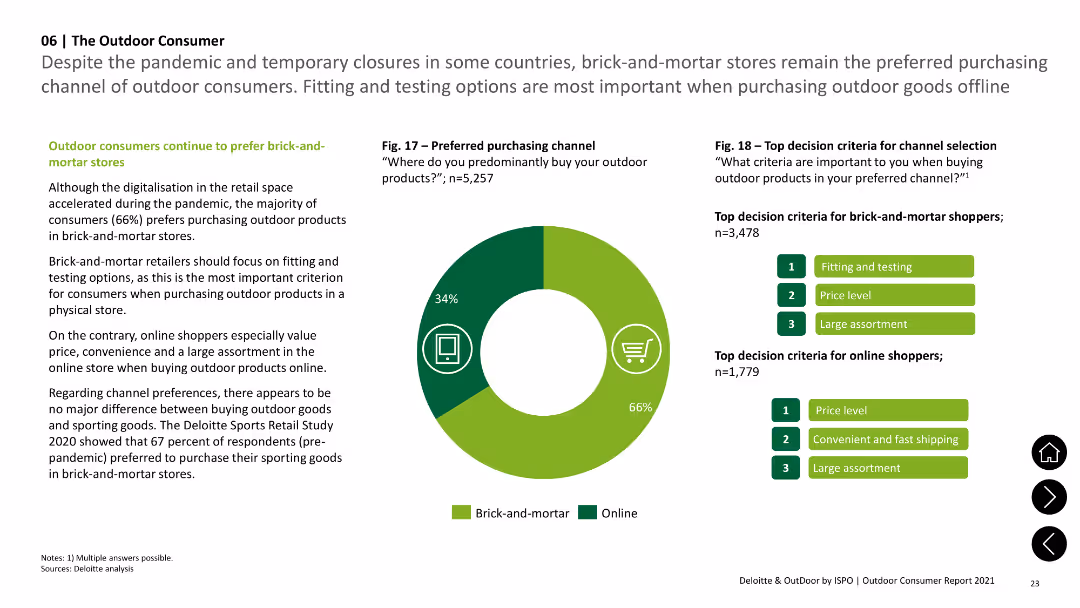
Pie chart and column chart showing preferred purchasing channels (brick-and-mortar vs online) and top decision criteria.
Market Analysis and Trends
Consumer Goods
Describes preferred channels for purchasing outdoor products and key decision criteria, highlighting a preference for brick-and-mortar stores.
Purchasing, Channels, Criteria, Consumer, Preferences
false
Market Analysis and Trends
Consumer Goods
Mixed Chart
Deloitte
Add to my slides
Remove from favorites
Simple design with a title followed by five key themes represented in a row of colored blocks with text labels.
Market Analysis and Trends
Government & Public Sector
Conveys the company's sustainability and financial objectives, suitable for stakeholder briefings or CSR reports.
Purpose, Sustainability, Growth, Empowerment, Responsibility
false
Market Analysis and Trends
Government & Public Sector
Text Only
Goldman Sachs
Add to my slides
Remove from favorites
A slide that creatively integrates textual content with imagery, highlighting the company's purpose and core values, alongside an inspiring action shot of an employee.
Strategic Planning
Professional Services
Communicates the company's core values and purpose, linking their aspirations to tangible actions and societal impact.
Purpose, Values, Integrity, Service, Innovation
false
Strategic Planning
Professional Services
Text Only
Booz Allen Hamilton
Add to my slides
Remove from favorites
The slide features column charts and a quote on a purple background. Charts show data on council members' views on corporate activism.
Market Analysis and Trends
Professional Services
It highlights the polarization in corporate activism and the role of business leaders versus politicians in progressive change.
Purpose, polarization, corporate activism, council members, business leaders, societal issues, debates, change
false
Market Analysis and Trends
Professional Services
Multiple Chart
IPSOS
Add to my slides
Remove from favorites
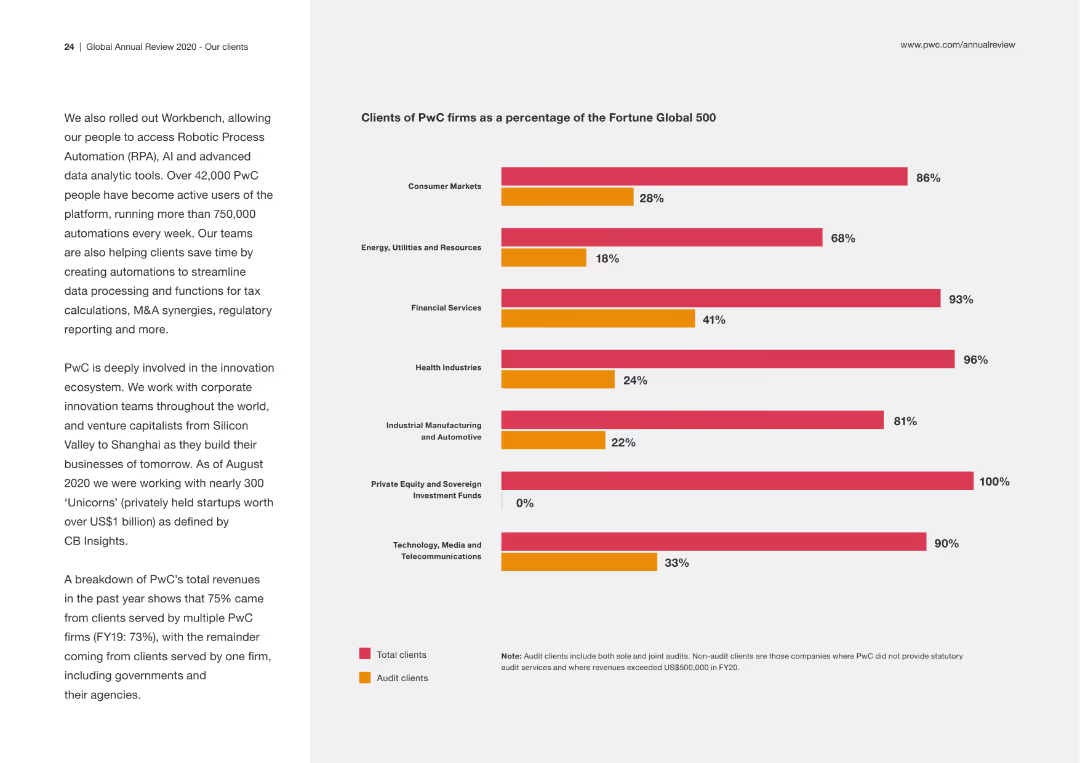
This slide includes a column chart showing the percentage of PwC clients within different industries, using two colors to differentiate between total clients and audit clients. The left side contains a brief description of PwC's involvement in innovation.
Market Analysis and Trends
Professional Services
The slide details the distribution of PwC clients across various industries, highlighting the firm's reach and specialization in different sectors. It underscores PwC's role in driving innovation.
PwC, clients, industries, market analysis, audit clients, innovation
false
Market Analysis and Trends
Professional Services
Mixed Chart
PwC/Strategy&
Add to my slides
Remove from favorites
Map, pie charts, and segmented lists categorizing industry sectors.
Organizational Structure and Change
Professional Services
Focuses on PwC’s collaborative efforts across Europe, detailing the sectors and industries involved, and the significance of shared expertise and resources.
PwC, collaboration, Europe, industry, sectors
false
Organizational Structure and Change
Professional Services
Mixed Chart
PwC/Strategy&
Add to my slides
Remove from favorites
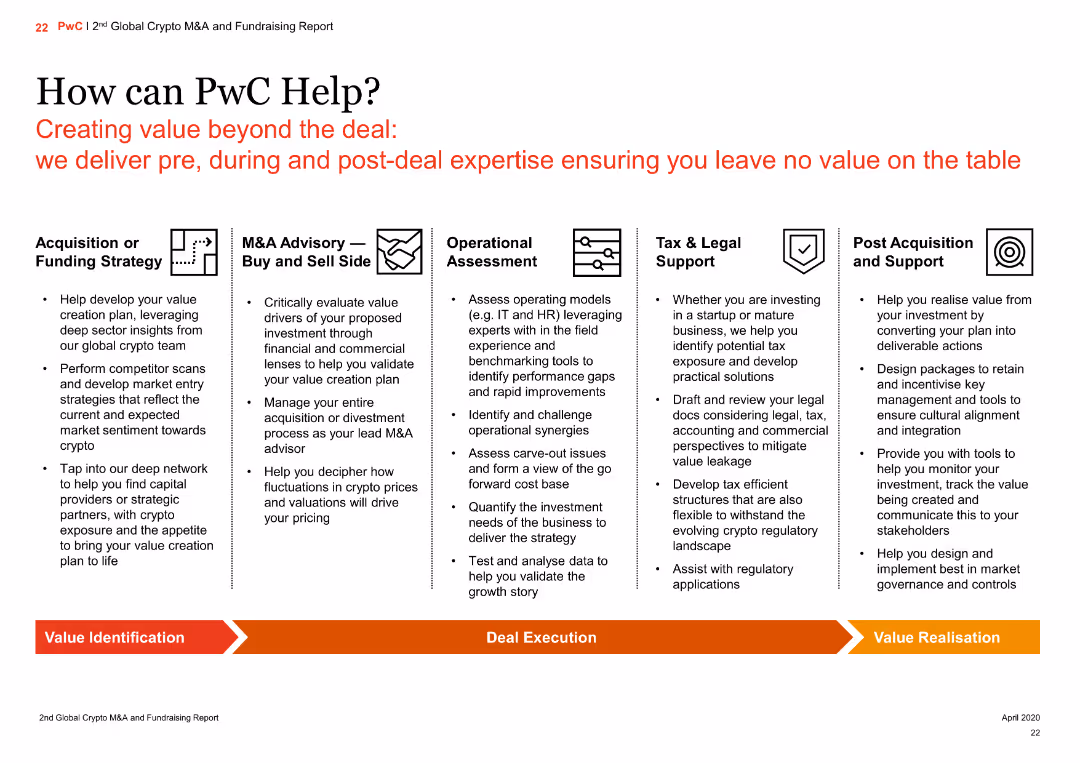
The slide is divided into six sections, each describing different services PwC offers: acquisition strategy, M&A advisory, operational assessment, tax support, post-acquisition support, and value identification.
Strategic Planning
Professional Services
The slide outlines PwC's comprehensive service offerings to support clients before, during, and after deals. Services include strategy development, M&A advisory, operational improvements, tax and legal support, and post-acquisition integration.
PwC, services, strategic planning, advisory, support
false
Strategic Planning
Professional Services
Pillar
PwC/Strategy&
Add to my slides
Remove from favorites
This slide contains two column charts comparing financial data, one table, and bullet points in key highlights section.
Financial Performance
Financial Services
The slide presents Q1 2023 financial data for Asset Management, showing revenue streams, assets under management (AuM), and net flows. Key highlights include net flows driven by passive investments and the impact of market conditions on revenue and AuM growth.
Q1 2023, financial data, revenue, assets, net flows, passive investments
false
Financial Performance
Financial Services
Multiple Chart
Deutsche Bank
Add to my slides
Remove from favorites
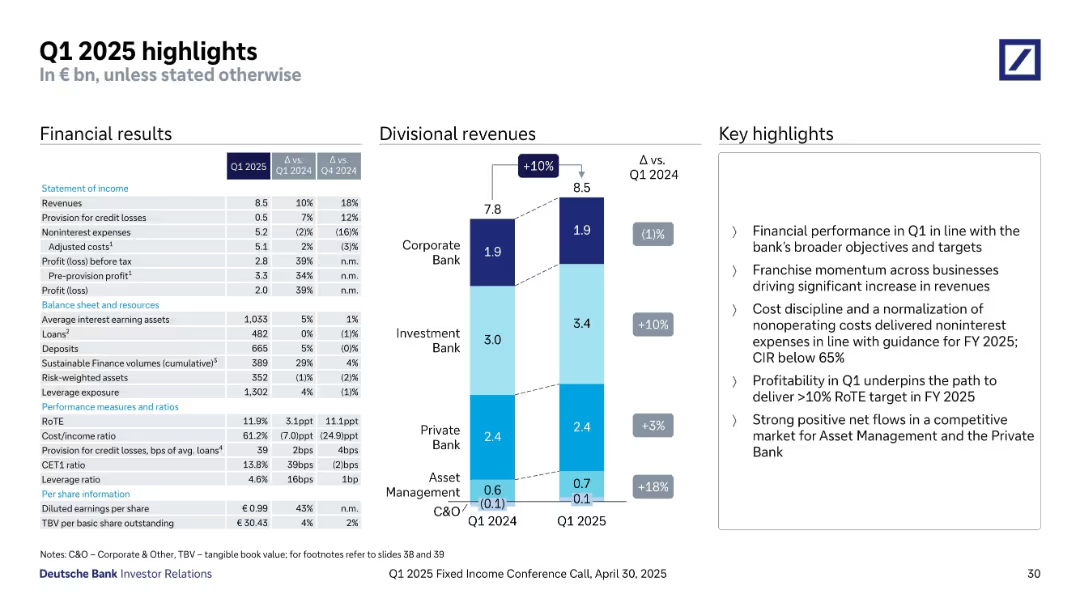
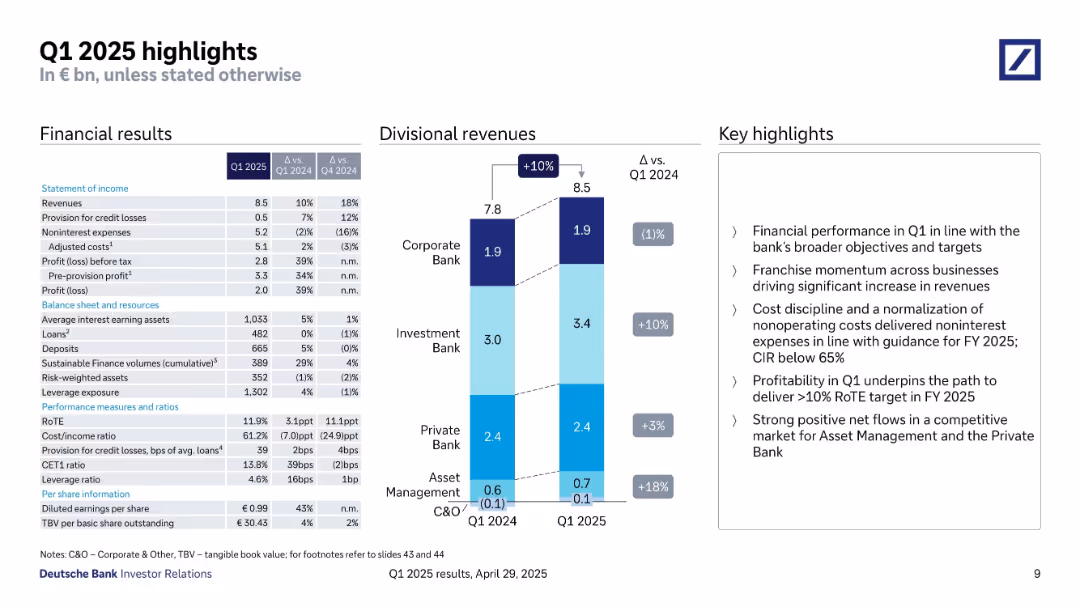
Three-column layout: financial summary, divisional revenue bars, and key takeaways.
Financial Performance
Financial Services
Summarizes Deutsche Bank's Q1 2025 financial results. Revenues increased to €8.5bn, with growth across all segments, especially Investment Bank (+10%) and Asset Management (+18%). Cost-income ratio improved, RoTE hit 11.9%, and sustainable finance volumes reached €389bn. Key highlights focus on cost control, profitability targets, and momentum in asset and private banking.
Q1 2025, Deutsche Bank, revenues, RoTE, CIR, business segments, financial performance, cost discipline, profitability, revenue growth
false
Financial Performance
Financial Services
Mixed Chart
Deutsche Bank
Add to my slides
Remove from favorites
Combined table and chart layout showing financial summary, divisional revenues, and key bullet insights.
Financial Performance
Financial Services
This overview presents key Q1 2025 metrics: revenues of €8.5bn (up 10% YoY), reduced noninterest expenses, 11.9% RoTE, and CIR below 65%. Divisional revenues show strong gains in Investment and Asset Management, reinforcing performance aligned with strategic targets.
Q1 2025, financial results, revenue growth, RoTE, CIR, divisional performance, cost control, strategy execution
false
Financial Performance
Financial Services
Mixed Chart
Deutsche Bank
Add to my slides
Remove from favorites
Split layout with financial summary table, bar chart of divisional revenues, and bullet-point key highlights
Strategic Planning
Financial Services
This slide summarizes Deutsche Bank’s Q1 2025 performance including key financials, divisional revenue shifts, and narrative highlights on profitability, cost management, and net flows.
Q1 2025, highlights, revenue, profit, divisions, cost discipline, Deutsche Bank
false
Strategic Planning
Financial Services
Mixed Chart
Deutsche Bank
Add to my slides
Remove from favorites
The slide features a detailed table comparing financial metrics year-over-year. A sidebar with bullet points elaborates on significant changes.
Financial Performance
Industrial & Manufacturing
The slide compares Q1 profitability from the previous year, explaining factors affecting sales, costs, and earnings, like higher freight costs and negative FX development.
Q1 profitability, sales, costs, earnings, freight costs, FX development, LANXESS, financial comparison, year-over-year analysis
false
Financial Performance
Industrial & Manufacturing
Table
Morgan Stanley
Add to my slides
Remove from favorites
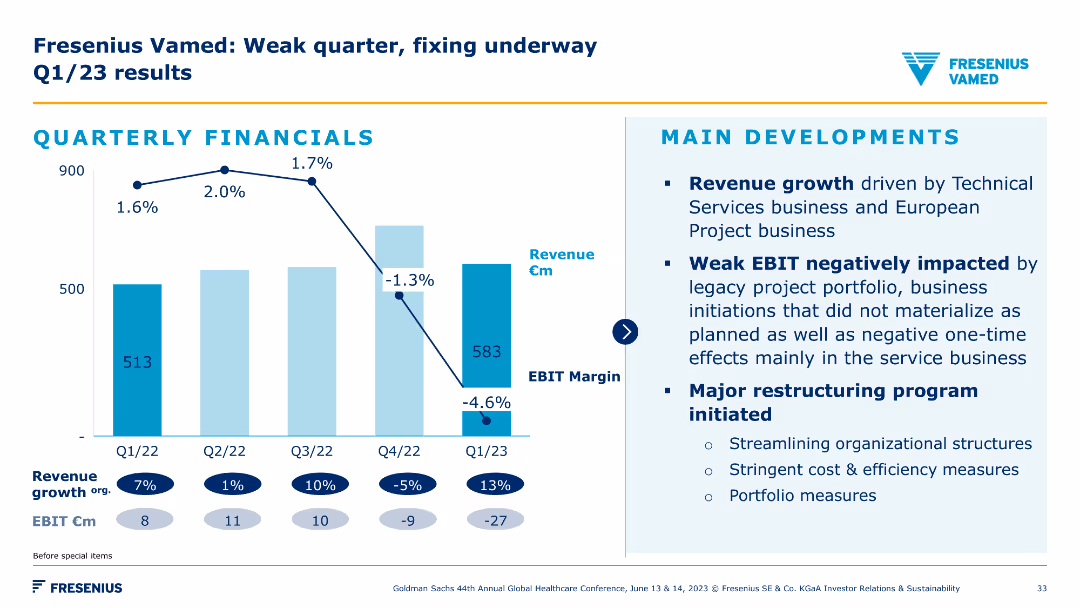
A column chart depicting quarterly financial results with a focus on revenue and EBIT margin. Accompanied by bullet points on main developments and restructuring programs.
Financial Performance
Healthcare & Pharmaceuticals
The slide details Fresenius Vamed's Q1/23 financial results, emphasizing revenue growth drivers, EBIT impact from legacy projects, and major restructuring initiatives to improve performance.
Q1 results, financials, restructuring, EBIT, revenue
false
Financial Performance
Healthcare & Pharmaceuticals
Mixed Chart
Goldman Sachs
Add to my slides
Remove from favorites
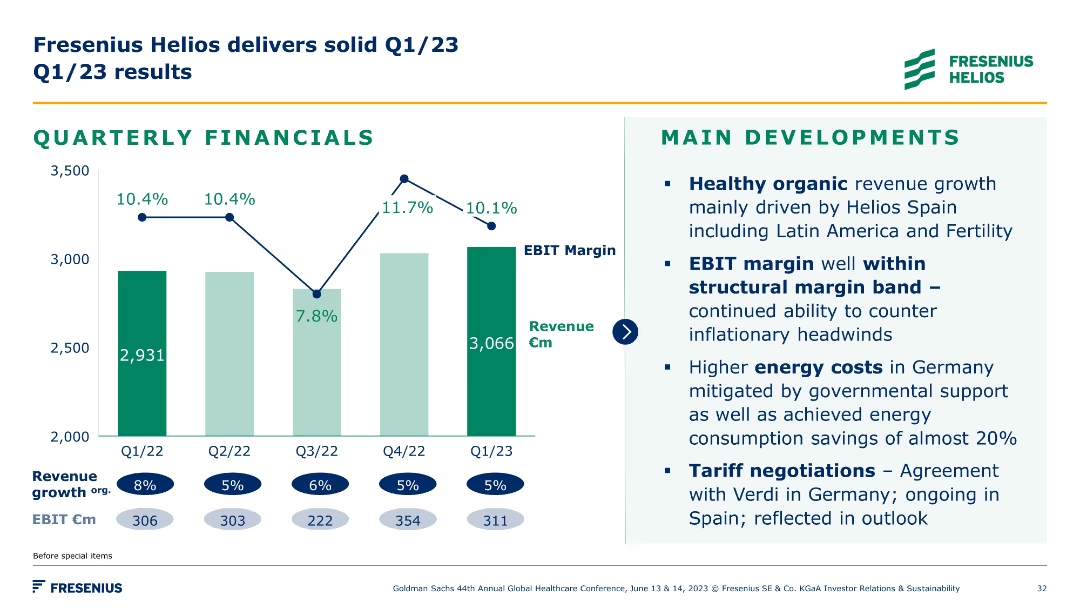
A column chart showing quarterly financial performance for Fresenius Helios with revenue growth and EBIT margins. Main developments are listed in a bullet format.
Financial Performance
Healthcare & Pharmaceuticals
This slide highlights Fresenius Helios's Q1/23 financial results, focusing on healthy revenue growth, margin stability, energy cost management, and tariff negotiations.
Q1 results, financials, revenue, EBIT, Helios
false
Financial Performance
Healthcare & Pharmaceuticals
Mixed Chart
Goldman Sachs
Add to my slides
Remove from favorites
The slide presents column charts and donut charts breaking down sales and EBITDA pre percentages. Red and grey colors are used to show contrasts.
Financial Performance
Industrial & Manufacturing
Analyzing Q1 results, the slide breaks down sales and EBITDA pre percentages by sector, supported by LANXESS’s Consumer Protection and Engineering Materials divisions.
Q1 results, sales breakdown, EBITDA, Consumer Protection, Engineering Materials, LANXESS, financial data, sector analysis
false
Financial Performance
Industrial & Manufacturing
Multiple Chart
Morgan Stanley
Add to my slides
Remove from favorites
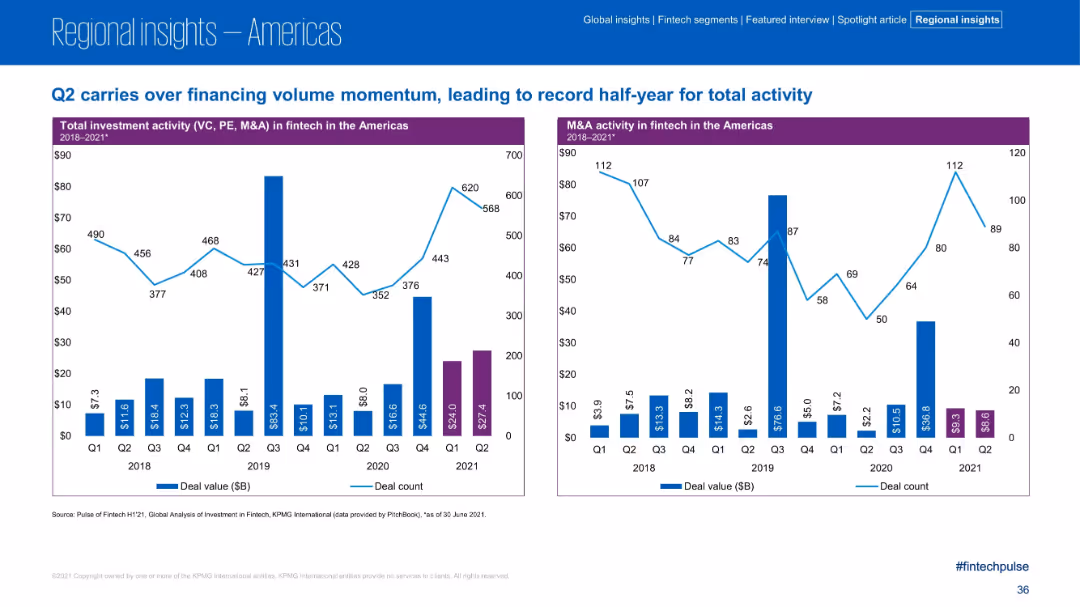
Dual bar charts showing investment and M&A activity quarterly from 2018 to 2021; purple bars for 2021 H1; clean timeline format
Financial Performance
Financial Services
Q2 2021 continues the upward trend in fintech investment and M&A activity, contributing to a record-setting first half. The charts track deal value and count quarterly, with Q2 2021 showing strong deal volume and sustained momentum across investment and M&A in the Americas.
Q2 2021, deal volume, investment trends, M&A activity, fintech, historical data, H1 record
false
Financial Performance
Financial Services
Multiple Chart
KPMG
Add to my slides
Remove from favorites
Slide presents a combination of column charts and text analysis, focusing on Q2 financial results. Visual elements are well-organized, with blue tones highlighting key data points, accompanied by concise textual explanations.
Financial Performance
Financial Services
Reviews Deutsche Bank's financial performance for Q2 2023, emphasizing revenue growth and cost management within different bank divisions. It provides an in-depth quarterly financial breakdown.
Q2 2023, financial performance, revenue growth, cost management
false
Financial Performance
Financial Services
Mixed Chart
Deutsche Bank
Add to my slides
Remove from favorites
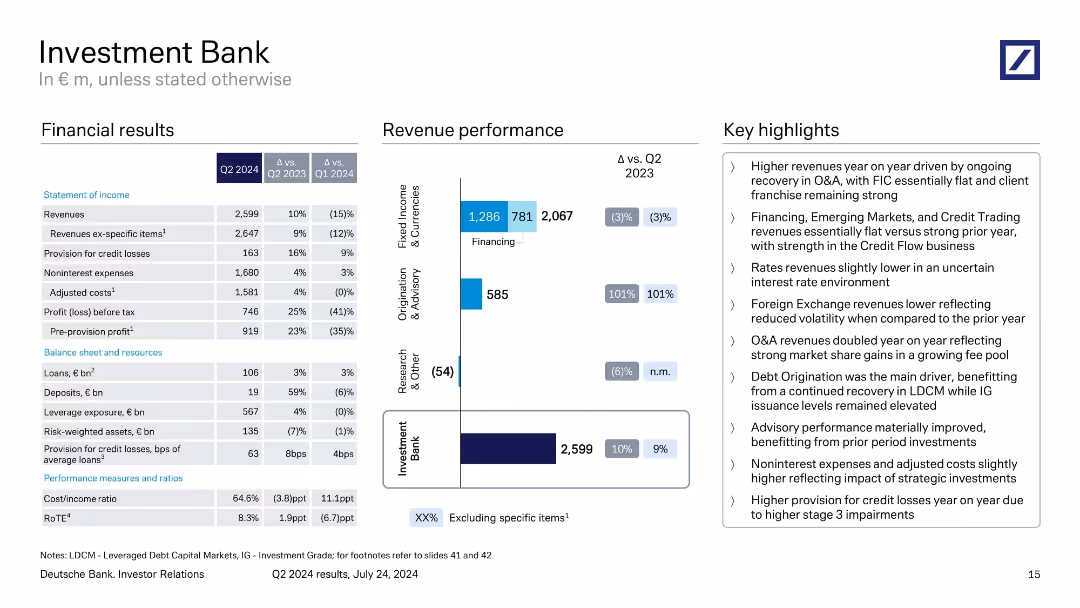
Three-column layout: financial results table on the left, bar chart in the center showing revenue performance by business line, and bullet-point highlights on the right. Corporate branding and subdued blue-gray color palette.
Financial Performance
Financial Services
Presents Q2 2024 results for the Investment Bank division, showing a 10% YoY revenue increase, flat financing results, and 101% YoY growth in Origination & Advisory. Highlights include stable client franchise, reduced volatility in FX, and cost control efforts.
Q2 2024, investment bank, revenues, financing, credit losses, costs, FIC
false
Financial Performance
Financial Services
Mixed Chart
Deutsche Bank
Add to my slides
Remove from favorites
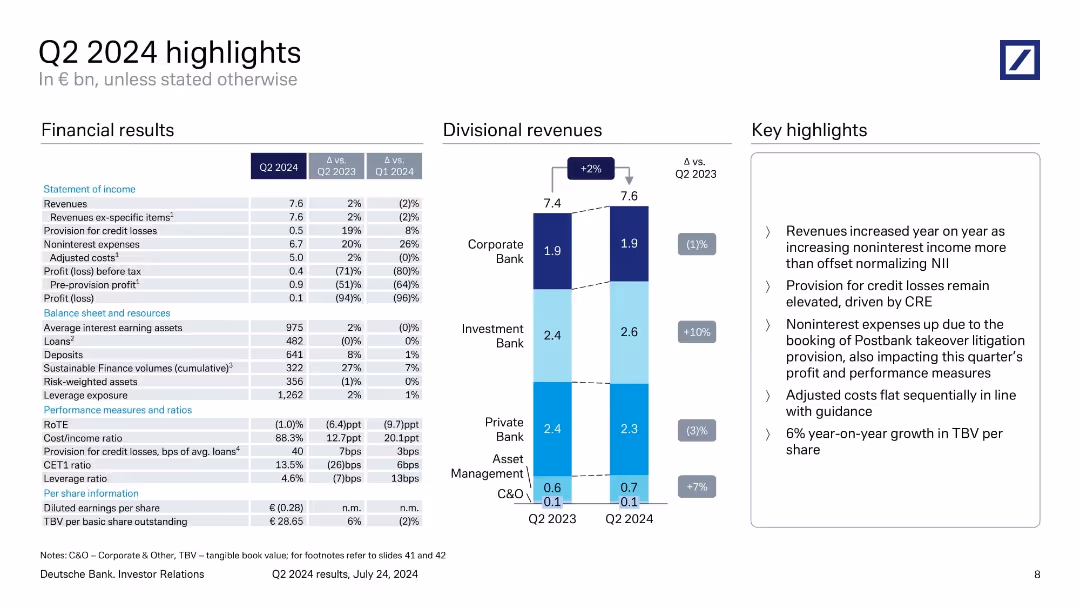
Combination of financial table, stacked bar for divisional revenues, and key highlights box on the right.
Financial Performance
Financial Services
Summarizes Q2 2024 performance with revenue, credit loss provisions, expenses, and pre-provision profit. The slide compares figures against Q2 2023 and Q1 2024, highlighting stable adjusted costs and increased noninterest income despite Postbank litigation impact.
Q2 2024, revenues, credit losses, adjusted costs, noninterest income, TBV, Deutsche Bank
false
Financial Performance
Financial Services
Mixed Chart
Deutsche Bank
Add to my slides
Remove from favorites
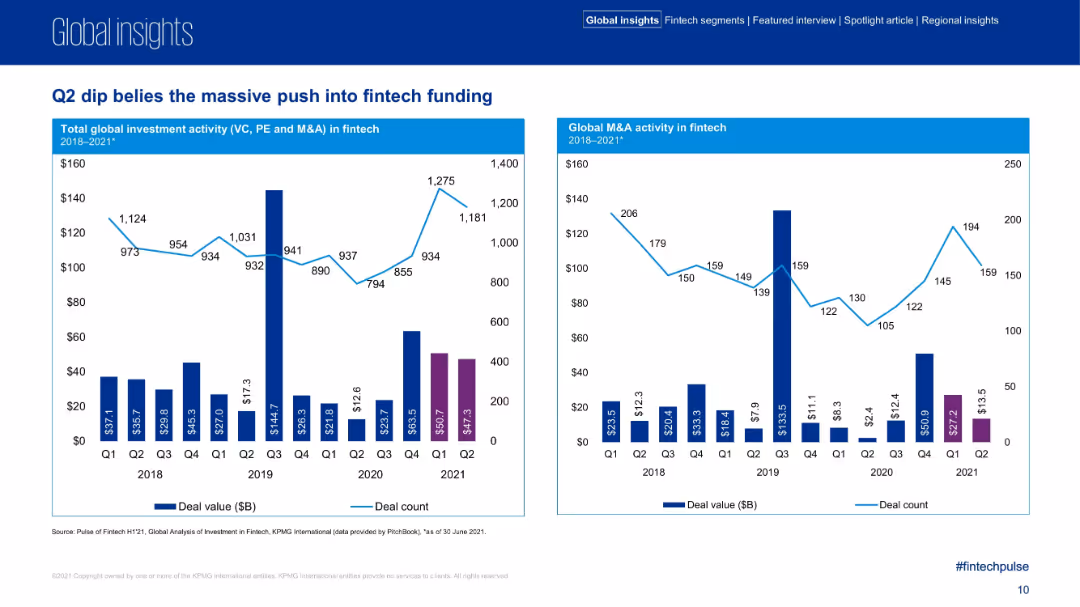
Two adjacent bar+line charts, Q1–Q2 comparisons across 2018–2021, showing total investment and M&A activity in fintech.
Market Analysis and Trends
Financial Services
This slide details quarterly fintech investment and M&A activity trends, showing that despite a Q2 2021 dip, deal value remained strong. It compares year-over-year and quarter-over-quarter metrics across deal value and count, reflecting sector momentum.
Q2 fintech, investment trend, deal count, deal value, M&A activity, quarterly comparison
false
Market Analysis and Trends
Financial Services
Multiple Chart
KPMG
Add to my slides
Remove from favorites
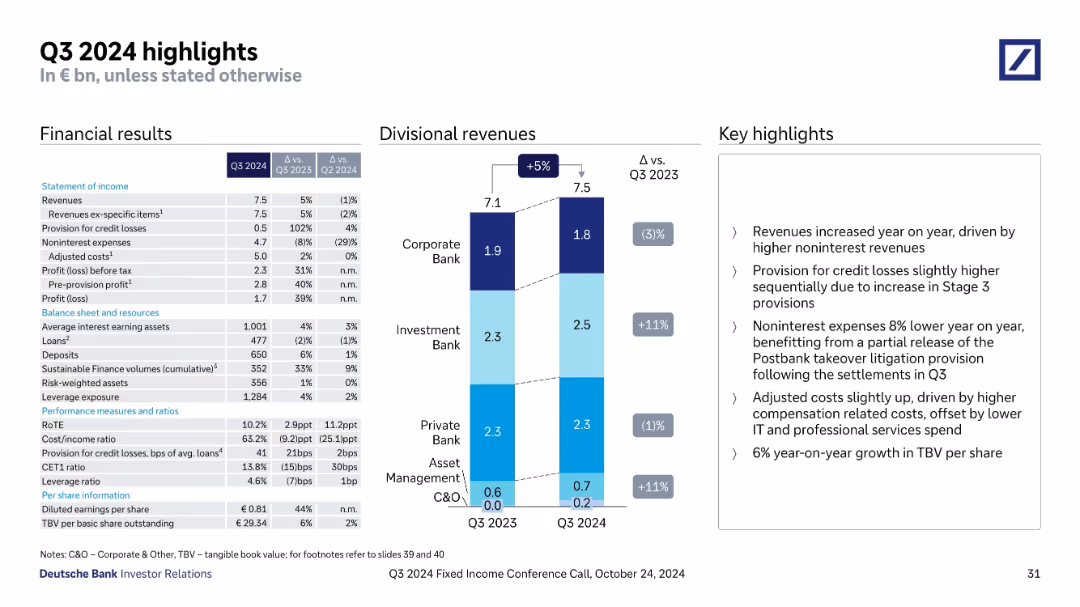
Split layout with tables, bar chart, and bullet points; divisional breakdowns; financial summary on left, narrative on right
Financial Performance
Financial Services
Summarizes Deutsche Bank’s Q3 2024 performance, including revenues, profit, leverage, and RoTE. Breaks down divisional revenues and cost trends, supported by key highlights around litigation, credit losses, and adjusted expenses.
Q3 2024, Deutsche Bank, financial results, revenue, profit, RoTE, cost income, divisional performance, credit loss
false
Financial Performance
Financial Services
Mixed Chart
Deutsche Bank
Add to my slides
Remove from favorites
Three-column layout with financials table, revenue bar chart, and bullet highlights.
Financial Performance
Financial Services
Highlights Q3 2024 performance, including revenues, credit loss provisions, adjusted costs, and divisional performance. Key points cover credit losses, cost dynamics, and TBV per share growth. Revenue increased 5% YoY.
Q3 earnings, credit losses, adjusted costs, TBV, revenue growth
false
Financial Performance
Financial Services
Mixed Chart
Deutsche Bank
Add to my slides
Remove from favorites
Split layout: left side features cityscape image and text summary; right side has bar charts showing quarterly banking metrics. Clean, corporate design.
Financial Performance
Financial Services
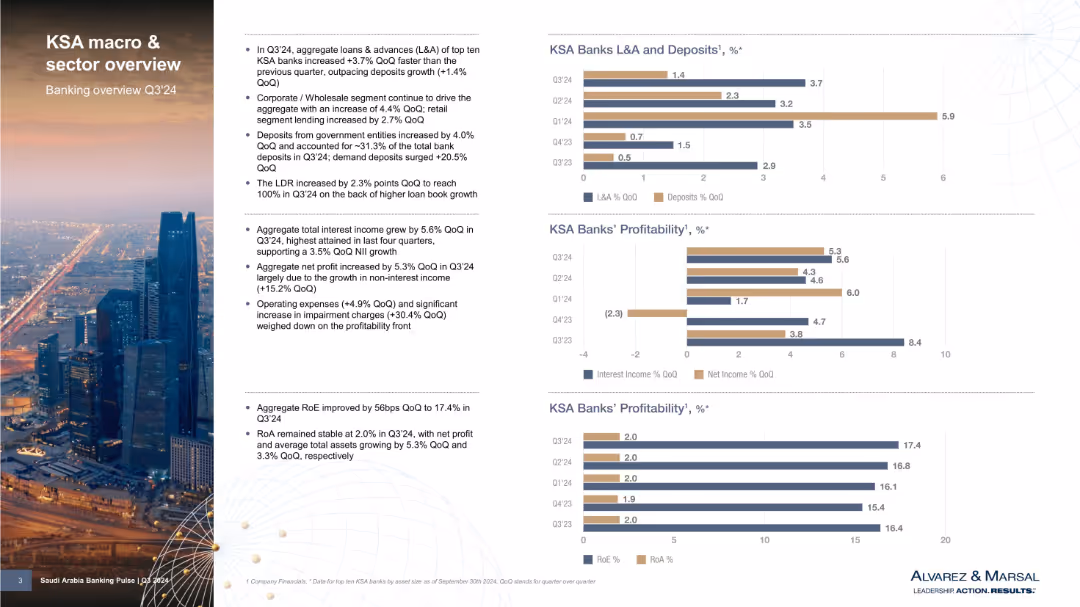
Summarizes Q3'24 banking performance in Saudi Arabia, highlighting metrics such as loans and advances, deposit growth, profitability, and return ratios. Visual charts support data on L&A, deposits, RoE, and interest income.
Q3'24, Saudi banks, deposits, loans, net income, RoE, interest income, financial metrics, profitability, banking sector
false
Financial Performance
Financial Services
Multiple Chart
Alvarez & Marsal
Add to my slides
Remove from favorites
This slide features a column chart with vertical bars showing the profit before tax (£bn) for Q322 and Q323, excluding the impact of over-issuance of securities. Financial metrics are detailed on the left side.
Financial Performance
Financial Services
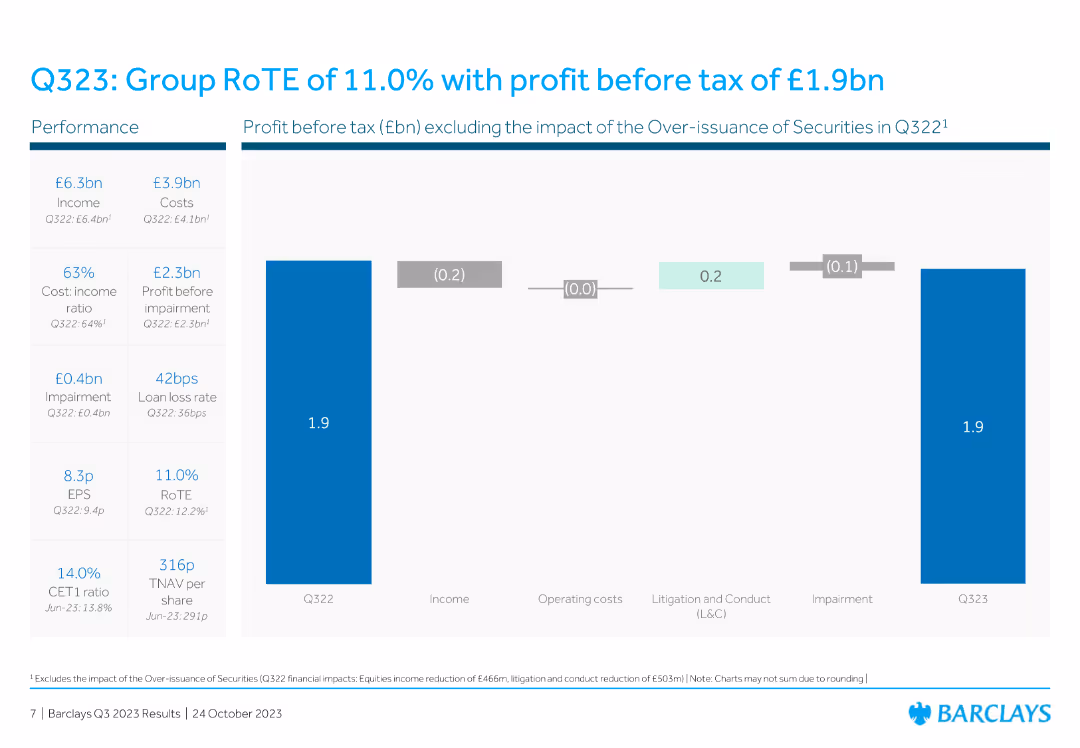
The slide highlights Barclays' financial performance for Q323, reporting a Group RoTE of 11.0% and a profit before tax of £1.9bn. Various financial ratios and metrics are also displayed.
Q323, RoTE, profit, financial metrics, tax
false
Financial Performance
Financial Services
Mixed Chart
Barclays
Add to my slides
Remove from favorites
Slide with a mix of tables and column charts along with text panels. It shows divisional revenues and key financial statistics like revenues, costs, profits, and balance sheet data. Colors are mainly blue and white, with a clear division of data.
Financial Performance
Financial Services
Analyzing Deutsche Bank's financial performance for Q4 2023, highlighting changes in divisional revenues and key financial metrics such as profit and costs. Aimed at providing a detailed quarterly financial summary to stakeholders.
Q4 2023, financial highlights, revenue, costs, banking
false
Financial Performance
Financial Services
Mixed Chart
Deutsche Bank
Add to my slides
Remove from favorites
Left: stacked bar charts of income by business line across quarters; Right: table on inorganic activity; blue-themed visuals
Strategic Planning
Financial Services
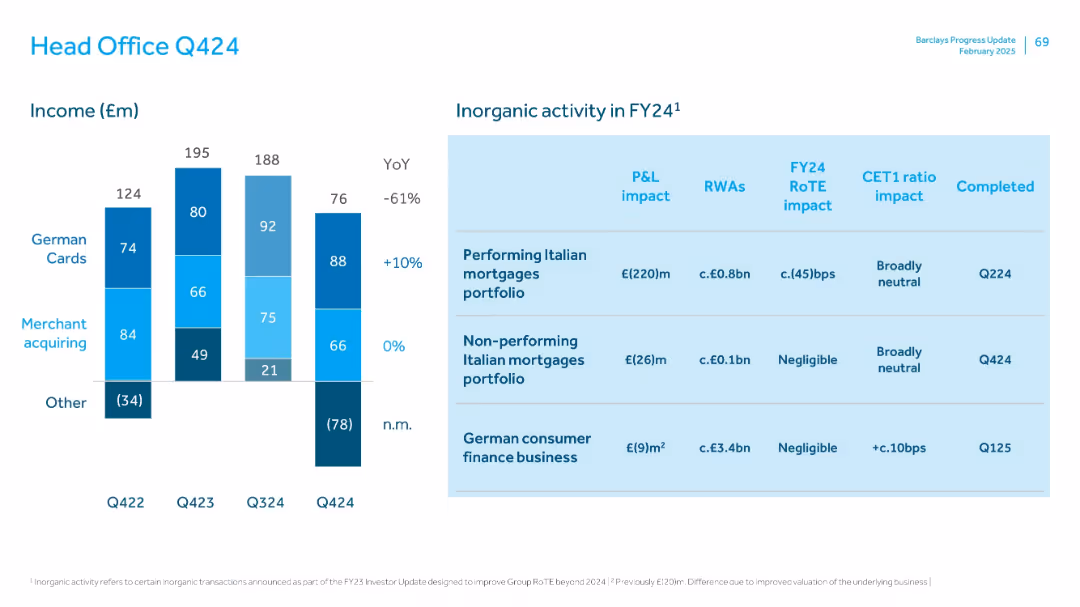
This slide summarizes Q424 income trends and inorganic activity. Income fell 61% YoY, with declines in several segments. The right panel outlines three major M&A activities, detailing their P&L impact, RWA, RoTE impact, and CET1 ratio effects. Completion dates are noted for each transaction.
Q4 income, head office, inorganic activity, acquisitions, P&L impact, RWA
false
Strategic Planning
Financial Services
Mixed Chart
Barclays
Add to my slides
Remove from favorites
Slide includes column charts and a summary section.
Financial Performance
Financial Services
Summarizes Q4 financial highlights and divisional revenues.
Q4, revenue, financial, highlights
false
Financial Performance
Financial Services
Mixed Chart
Deutsche Bank
Add to my slides
Remove from favorites
Waterfall chart format comparing Q421 to Q422 reported profit before tax, showing contributions from income, costs, and impairments. Left sidebar lists financial metrics and ratios.
Financial Performance
Financial Services
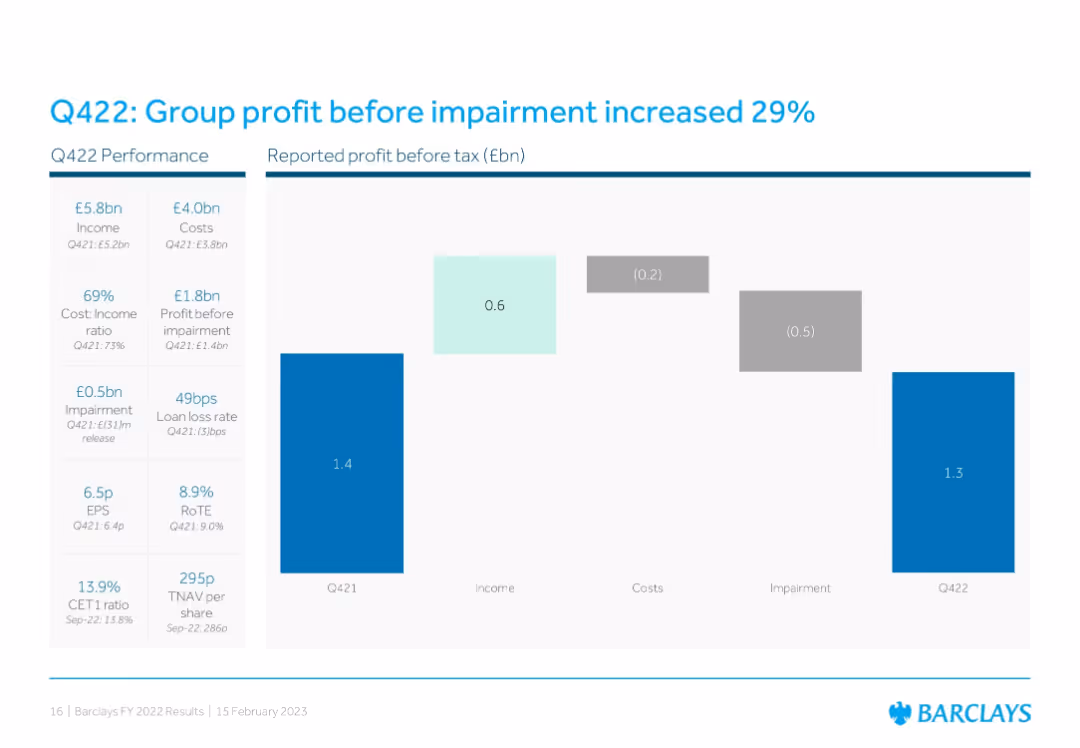
Shows a 29% YoY increase in group profit before impairment, with detailed breakdowns in cost, income, and impairment changes. Financial ratios like EPS, RoTE, and CET1 are also presented for Q422 vs. Q421.
Q422, profit growth, impairments, EPS, RoTE, CET1, waterfall chart, Barclays group
false
Financial Performance
Financial Services
Single Chart
Barclays
Add to my slides
Remove from favorites
Slide includes column charts and data visualizations comparing quarterly financial performance metrics and historical data points to highlight trends and earnings.
Financial Performance
Financial Services
Displays a financial summary for Q423, including income, costs, profit before tax, and related metrics, with comparisons to previous quarters.
Q423, income, profit, financial performance, Barclays, tax, earnings, costs
false
Financial Performance
Financial Services
Mixed Chart
Barclays
Add to my slides
Remove from favorites
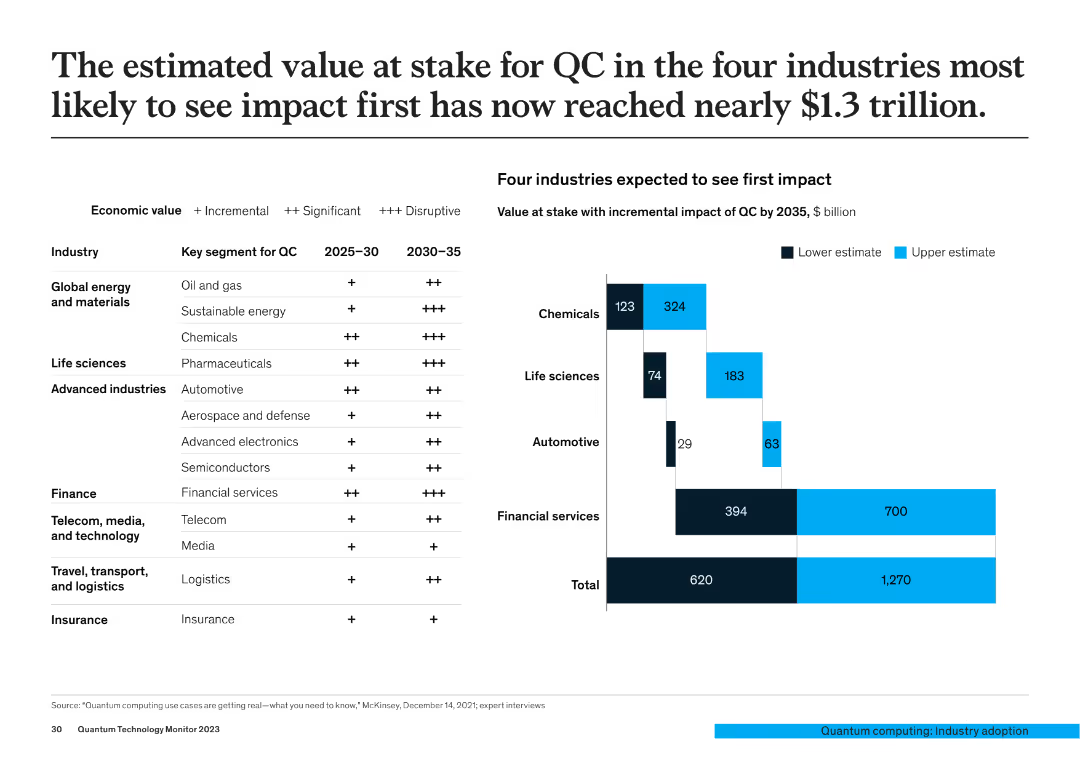
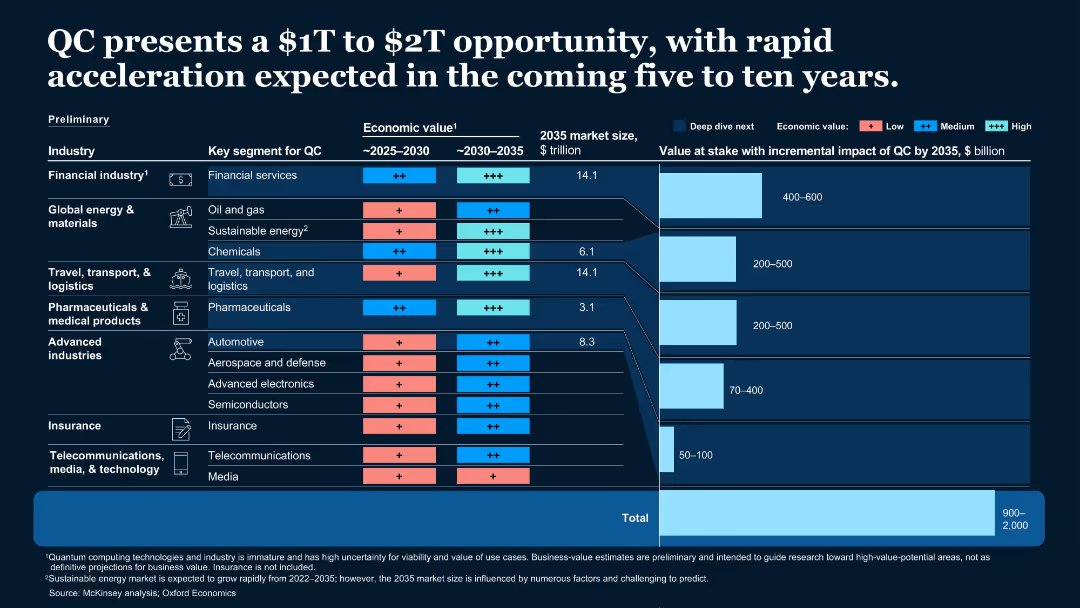
The slide features a table showing economic value segments for QC across different industries and a bar chart detailing the incremental impact value of QC in chemicals, life sciences, automotive, and financial services by 2035.
Market Analysis and Trends
Financial Services
This slide estimates the potential economic impact of QC across four key industries, projecting a nearly $1.3 trillion value at stake, with detailed breakdowns by industry segment.
QC impact, economic value, industry analysis, financial projections, market trends
false
Market Analysis and Trends
Financial Services
Mixed Chart
McKinsey
Add to my slides
Remove from favorites
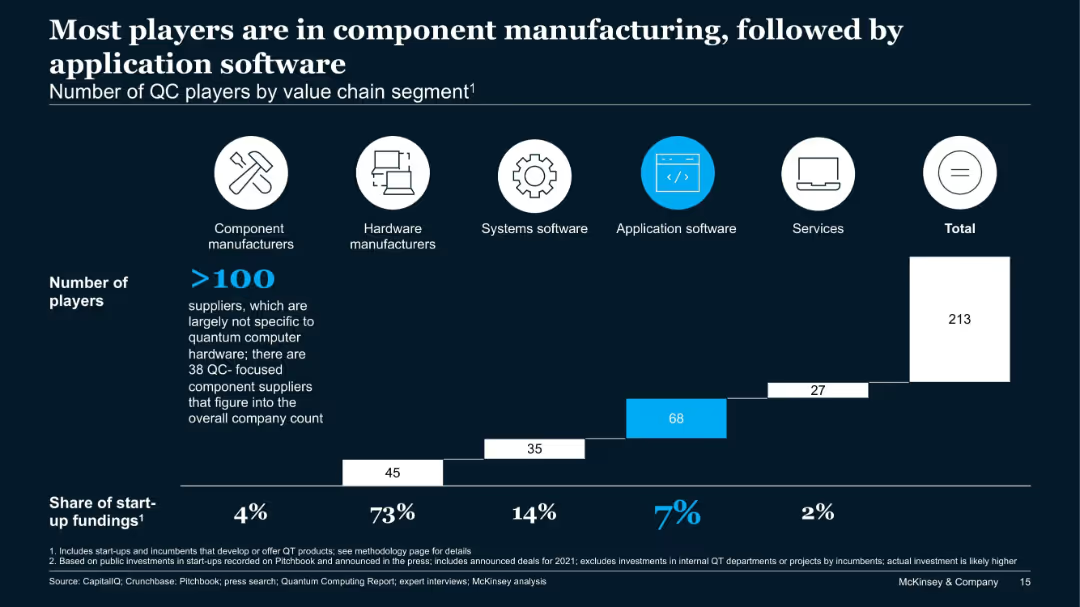
Bar chart showing number of players across five QC value chain segments and their share of start-up funding.
Product and Service Analysis
Technology & Software
This slide analyzes over 213 QC companies by value chain. Component manufacturers dominate in number, while application software sees the second-highest number of firms. However, hardware receives 73% of start-up funding, showing a funding-activity imbalance.
QC players, value chain, hardware, components, application software, start-up funding
false
Product and Service Analysis
Technology & Software
Single Chart
McKinsey
Add to my slides
Remove from favorites
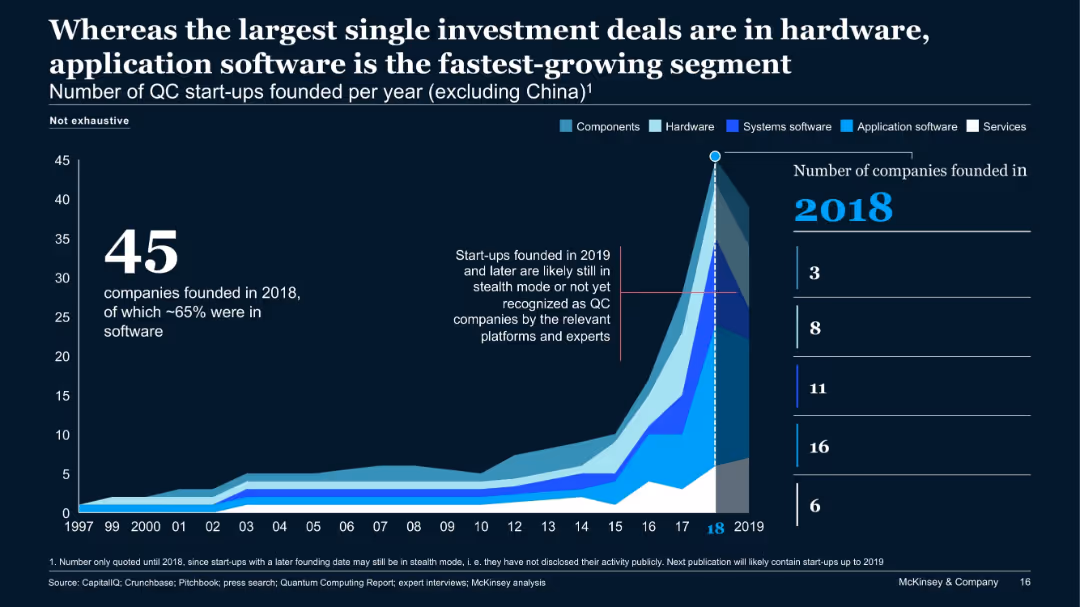
Area chart showing number of QC start-ups founded annually by segment type, excluding China. Emphasizes 2018 as peak year.
Investment Analysis
Technology & Software
The chart illustrates trends in QC start-up formations, peaking in 2018 with 45 companies—65% focused on software. It indicates investment spikes in hardware, while application software shows rapid growth. Start-ups after 2019 may still be in stealth.
QC start-ups, funding, hardware, application software, 2018, stealth, investment trends
false
Investment Analysis
Technology & Software
Single Chart
McKinsey
Add to my slides
Remove from favorites
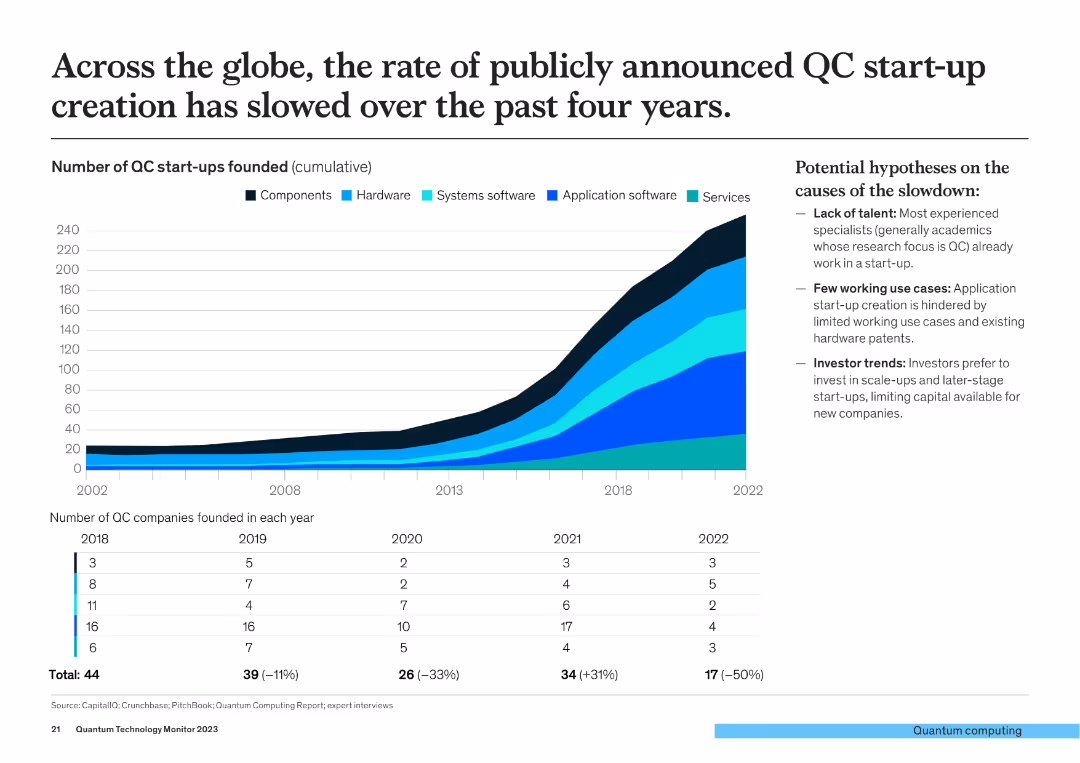
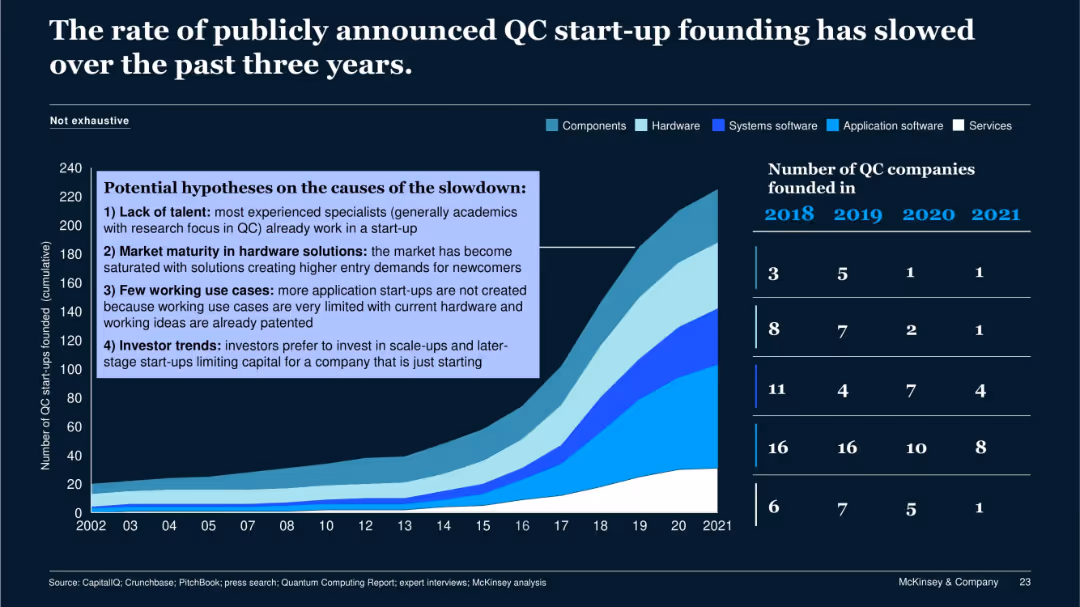
The slide includes a cumulative line chart showing the number of QC start-ups founded (2002-2022) and a column chart detailing the number of QC companies founded per year from 2018-2022.
Market Analysis and Trends
Financial Services
This slide discusses the global slowdown in the creation of QC start-ups over the past four years, with data on the cumulative and annual number of start-ups founded.
QC start-ups, global slowdown, start-up creation, quantum computing, market trends
false
Market Analysis and Trends
Financial Services
Mixed Chart
McKinsey
Add to my slides
Remove from favorites
Area graph showing cumulative QC startups by category (components, hardware, etc.); overlay box listing slowdown causes; startup counts by year.
Market Analysis and Trends
Technology & Software
This slide discusses the reasons behind the recent slowdown in QC startup formation, including talent shortages, hardware market maturity, limited use cases, and investor preference for late-stage funding. The visual includes cumulative growth and yearly startup counts by segment.
QC startup, slowdown, market saturation, investor trend, hardware
false
Market Analysis and Trends
Technology & Software
Single Chart
McKinsey
Add to my slides
Remove from favorites
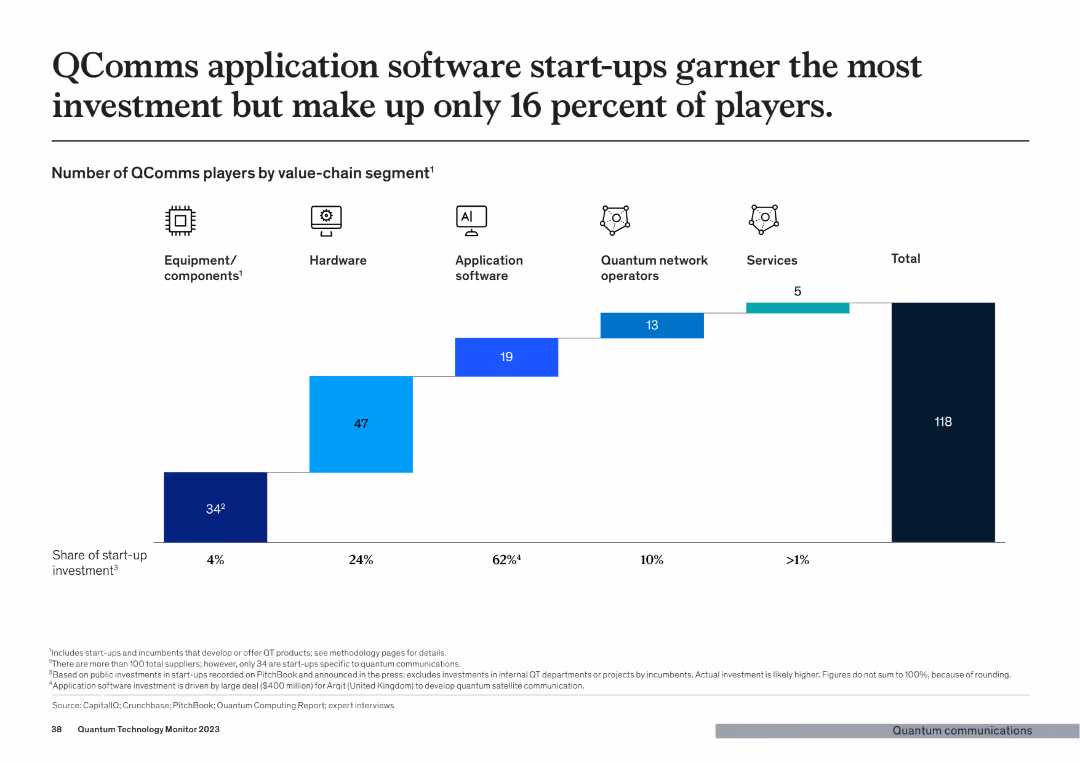
This slide features a column chart showing the number of QComms players by value-chain segment. Segments include equipment/components, hardware, application software, quantum network operators, and services.
Market Analysis and Trends
Telecommunications
The slide provides insights into the investment distribution among QComms start-ups across various segments of the value chain. It highlights that application software start-ups receive the most investment.
QComms, Start-ups, Investment, Value Chain, Segments
false
Market Analysis and Trends
Telecommunications
Single Chart
McKinsey
Add to my slides
Remove from favorites
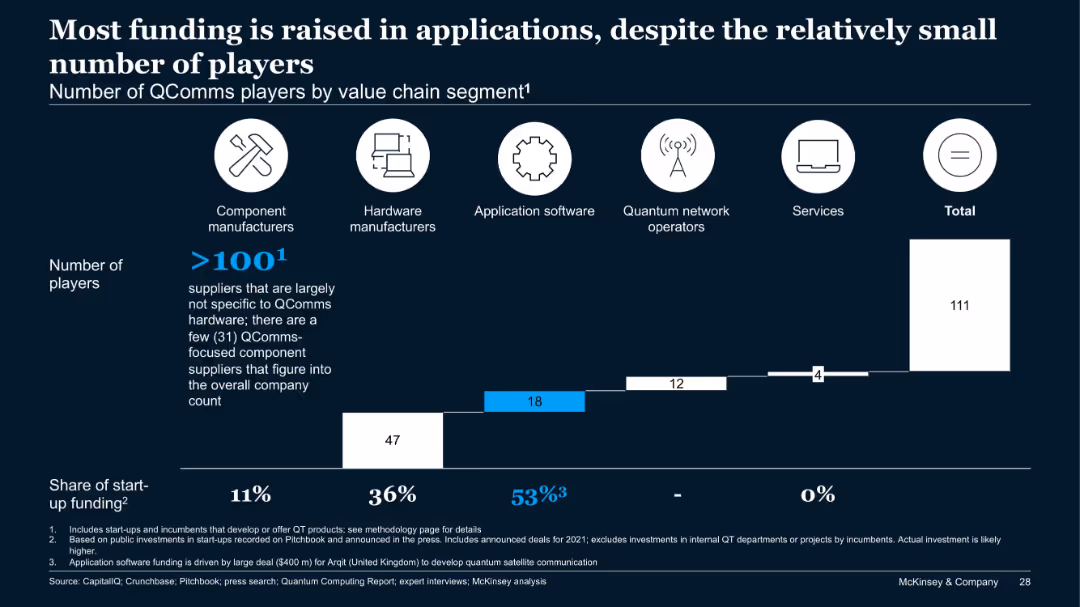
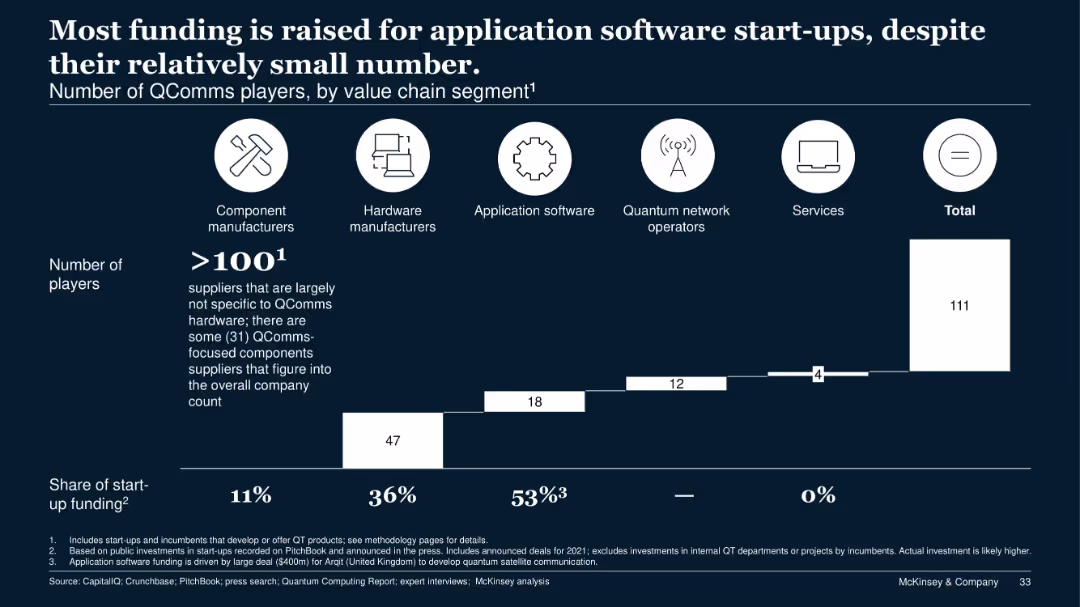
Bar chart categorizing QComms players by value chain segments and their share of funding.
Financial Performance
Telecommunications
While the number of QComms players is highest in components, the bulk of funding (53%) goes to application software, driven by major investments like Arqit ($400M). Hardware follows with 36% of funds. The chart shows a misalignment between player count and capital allocation.
QComms, funding, applications, value chain, Arqit, investment, segments
false
Financial Performance
Telecommunications
Single Chart
McKinsey
Add to my slides
Remove from favorites
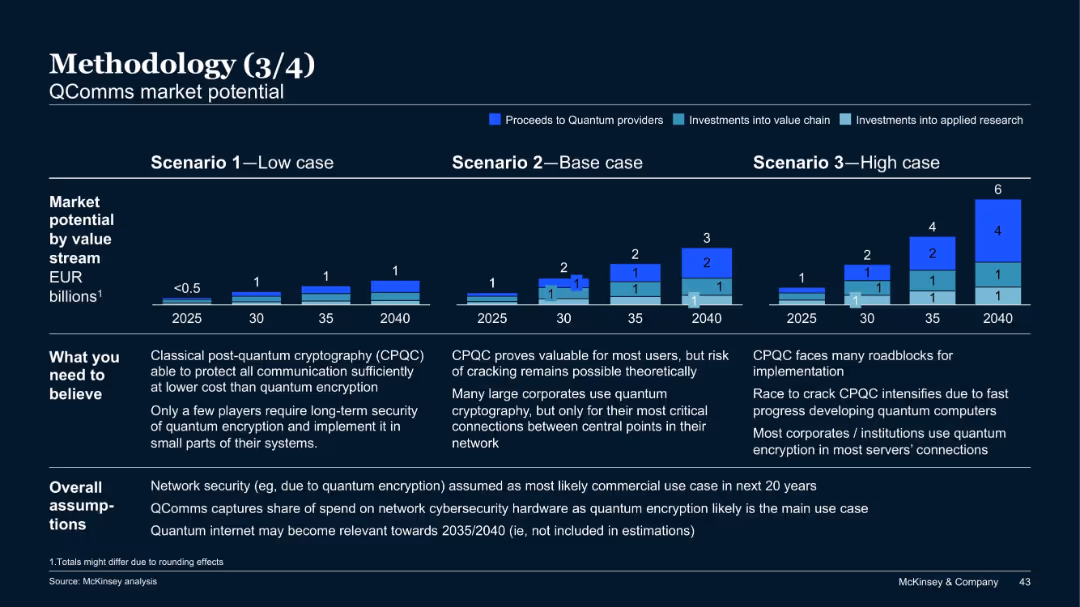
Scenario-based market projection; stacked bar charts for value streams; assumption and belief sections at bottom; muted colors and dark theme.
Investment Analysis
Artificial Intelligence
This slide outlines the potential value of quantum communications (QComms) by 2040. It compares low, base, and high-value projections and explores adoption assumptions and technological hurdles like cracking CPQC.
QComms, quantum encryption, cybersecurity, CPQC, projections, investments, McKinsey
false
Investment Analysis
Artificial Intelligence
Mixed Chart
McKinsey
Add to my slides
Remove from favorites
Horizontal bar chart and proportional block layout with white-on-navy theme, showing number of QComms players and startup funding shares across value chain segments.
Strategic Planning
Technology & Software
This slide breaks down the quantum communications (QComms) ecosystem by value chain, showing that most startup funding flows to application software companies, even though they represent a small portion of the total number of players. Component and hardware manufacturers also attract significant attention.
QComms, start-ups, application software, funding, value chain, investment, quantum tech, segmentation
false
Strategic Planning
Technology & Software
Single Chart
McKinsey
Add to my slides
Remove from favorites
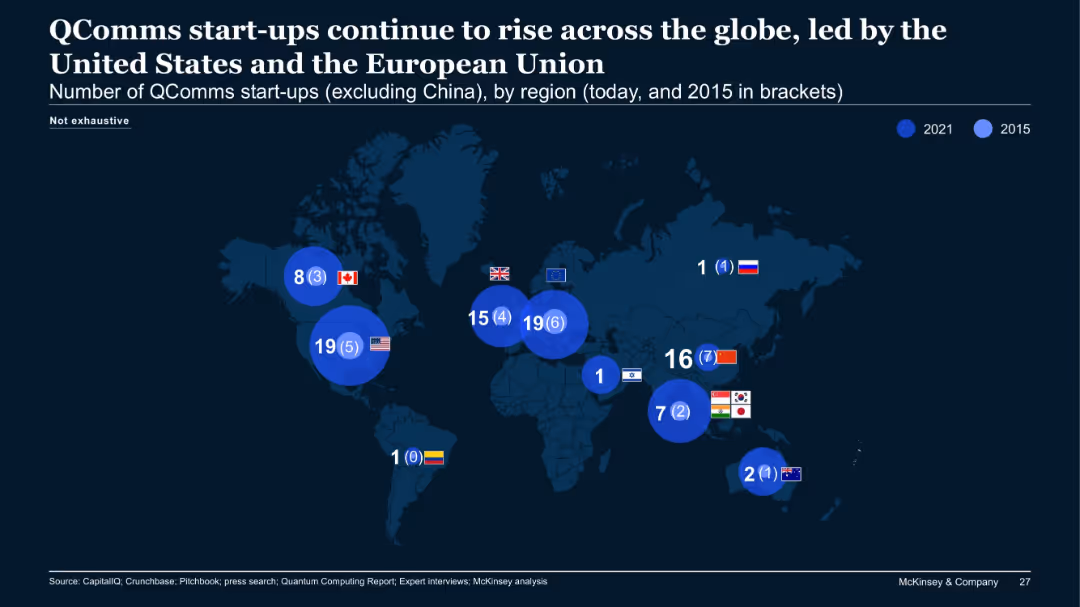
World map showing number of quantum communications (QComms) start-ups by region (2021 vs. 2015).
Market Analysis and Trends
Telecommunications
This slide displays regional growth in QComms start-ups, excluding China. Notably, the US and EU lead with 19 each in 2021, a substantial increase from 2015. Asia shows a moderate rise, while some regions remain stagnant.
QComms, start-ups, global, regional growth, map, telecommunications, EU, US
false
Market Analysis and Trends
Telecommunications
Single Chart
McKinsey
Add to my slides
Remove from favorites
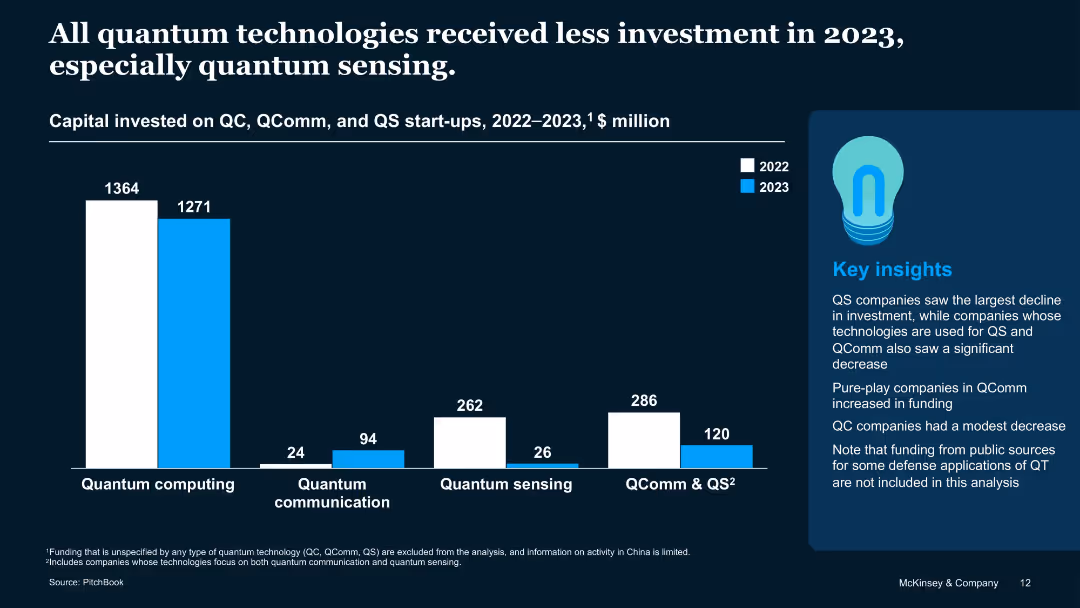
Bar chart comparing QC, QComm, and QS funding across 2022 and 2023 with a sidebar for insights
Investment Analysis
Artificial Intelligence
Visualizes declining investments in all QT segments, with QS experiencing the steepest drop. Also notes that QC saw only a modest decline, and QComm firms with a single focus saw funding increase. Public-sector defense applications are not included.
QS decline, quantum communication, QC funding, capital trends, 2023
false
Investment Analysis
Artificial Intelligence
Mixed Chart
McKinsey
Add to my slides
Remove from favorites
The slide contains a column chart depicting the number of QS players by value-chain segment. Segments include equipment/components, hardware, and application software and services.
Market Analysis and Trends
Technology & Software
This slide discusses the distribution of QS players across different value-chain segments, emphasizing that a significant portion of investment is directed towards hardware manufacturers.
QS, Components, Investment, Hardware, Manufacturers
false
Market Analysis and Trends
Technology & Software
Single Chart
McKinsey
Add to my slides
Remove from favorites
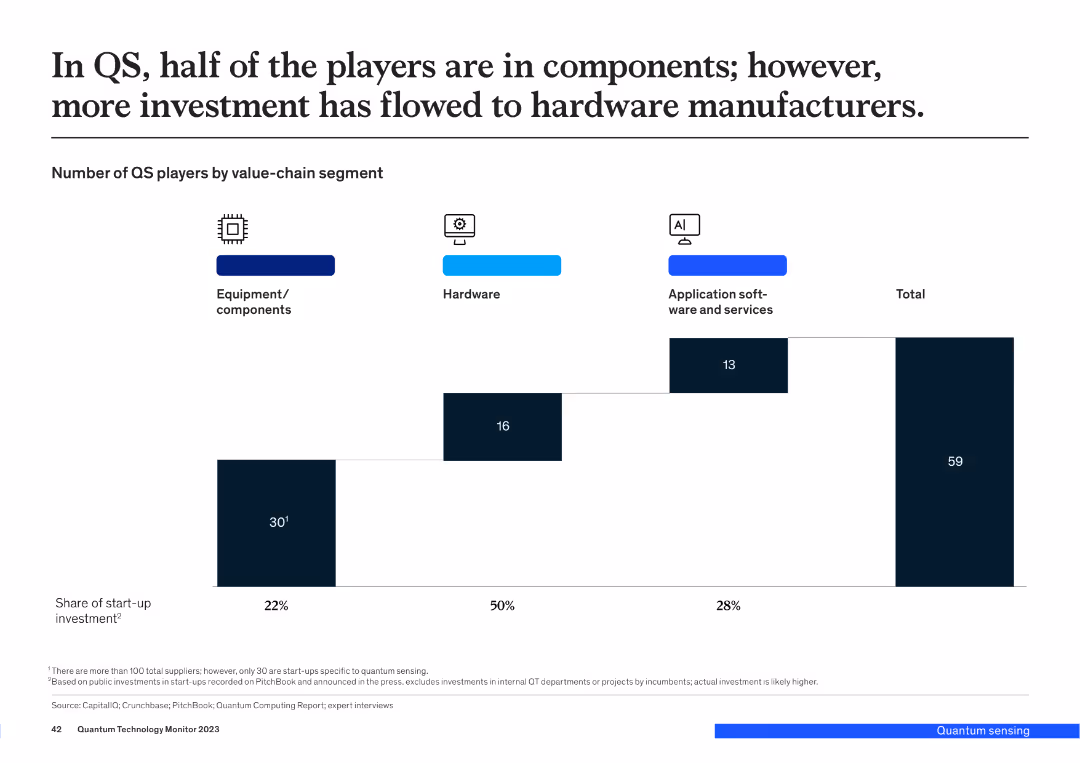
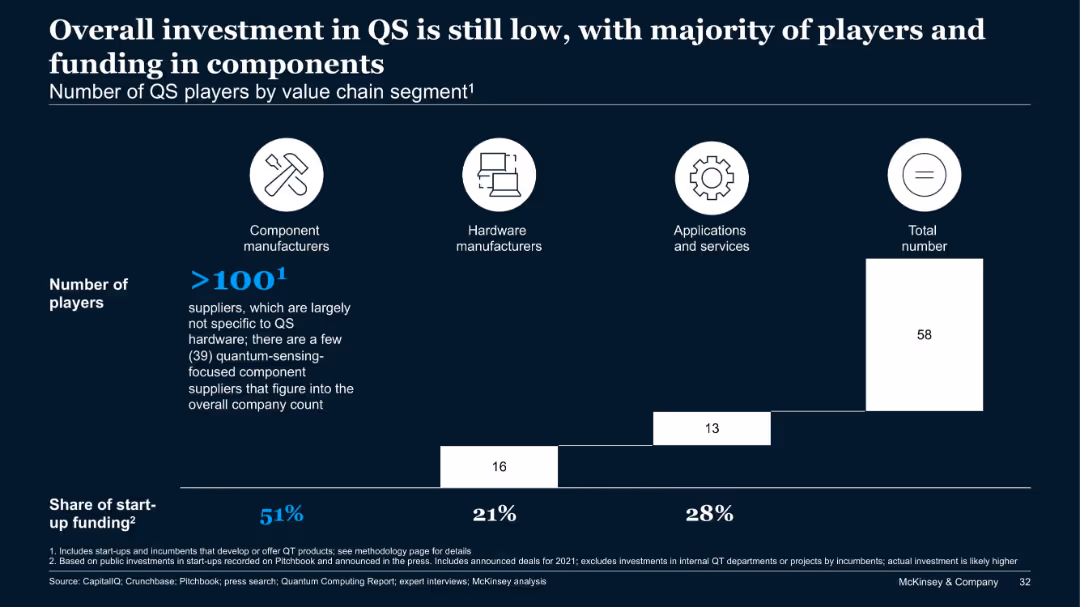
Bar chart of QS players by segment with funding share, segmented into components, hardware, and applications.
Financial Performance
Technology & Software
Most QS players focus on component manufacturing, which also captures over 50% of start-up funding. Hardware and application segments follow distantly. The slide suggests that while QS is gaining attention, it still lags in investment relative to other quantum technology areas.
QS, investment, components, hardware, applications, quantum sensing, funding
false
Financial Performance
Technology & Software
Single Chart
McKinsey
Add to my slides
Remove from favorites
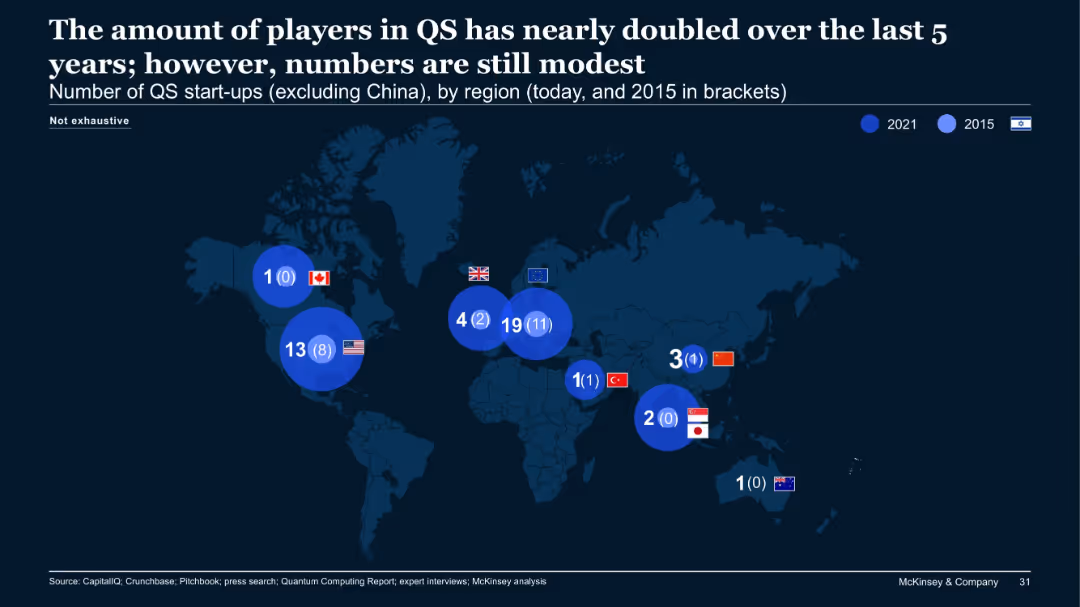
World map illustrating QS (quantum sensing) start-ups per region in 2021 and 2015, excluding China.
Market Analysis and Trends
Technology & Software
The number of quantum sensing (QS) start-ups has almost doubled over five years, though the overall volume remains modest. The EU leads with 19 in 2021 (up from 11), followed by the US. The map emphasizes regional differences and emerging interest in QS.
QS, quantum sensing, start-ups, growth, global, EU, map
false
Market Analysis and Trends
Technology & Software
Single Chart
McKinsey
Add to my slides
Remove from favorites
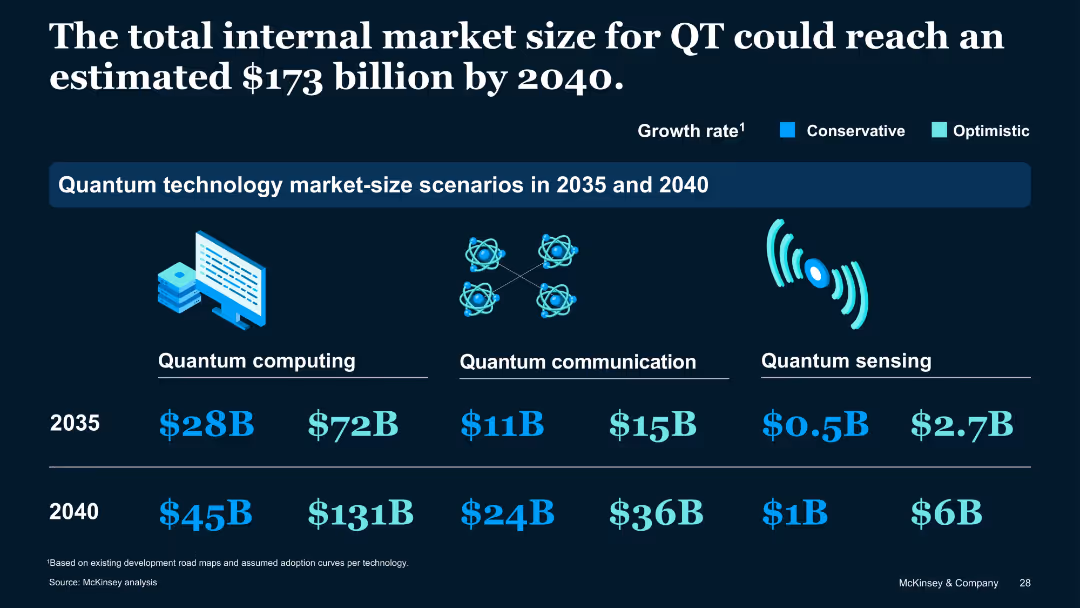
Table-style comparison of market-size forecasts for quantum computing, communication, and sensing
Market Analysis and Trends
Artificial Intelligence
This forecast slide presents conservative and optimistic market estimates for quantum technologies by 2035 and 2040. Quantum computing shows the highest potential growth, followed by communication and sensing technologies.
QT Market Size, Forecast, Quantum Computing, 2040 Outlook, Projections
false
Market Analysis and Trends
Artificial Intelligence
Table
McKinsey
Add to my slides
Remove from favorites
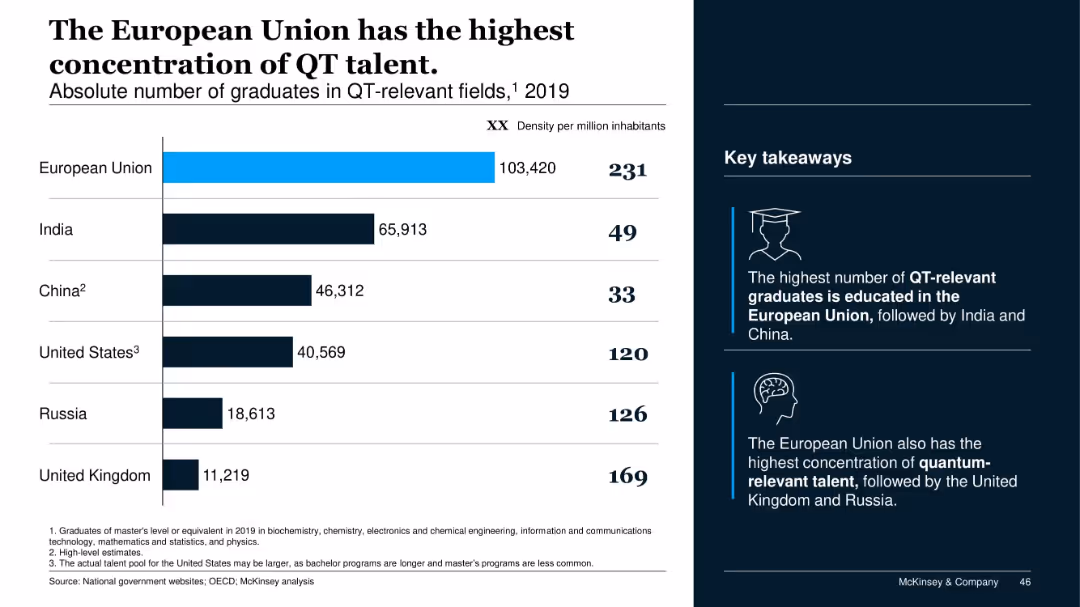
Bar chart showing number of graduates in QT-relevant fields (2019) across countries; dual axis with total graduates and density per capita.
Human Resources and Talent Management
Education & Training
The slide highlights the European Union's leadership in quantum technology education, both in absolute graduates and talent density. The UK, US, and Russia also show strong concentrations relative to population.
QT graduates, education, talent pool, EU, quantum technology, workforce, talent density
false
Human Resources and Talent Management
Education & Training
Mixed Chart
McKinsey
Add to my slides
Remove from favorites
Chart-heavy layout with percentage callouts, key insights box, and year comparison
Investment Analysis
Artificial Intelligence
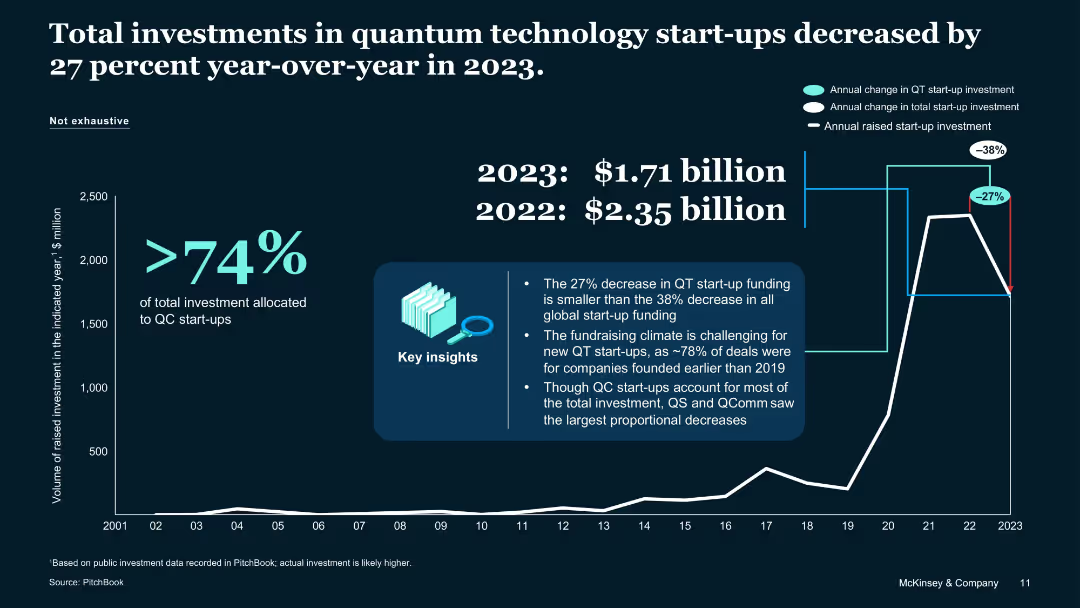
Highlights a 27% drop in QT start-up investments from 2022 to 2023. Emphasizes that QC start-ups received most funding while QS and QComm saw sharper declines. Notes 2023's total investment as $1.71B, down from $2.35B in 2022.
QT investment, QC funding, startup decline, PitchBook, 2023 vs 2022
false
Investment Analysis
Artificial Intelligence
Single Chart
McKinsey
Add to my slides
Remove from favorites
Horizontal bar chart showing QT investment size by investor type and country (2001–2021).
Market Analysis and Trends
Artificial Intelligence
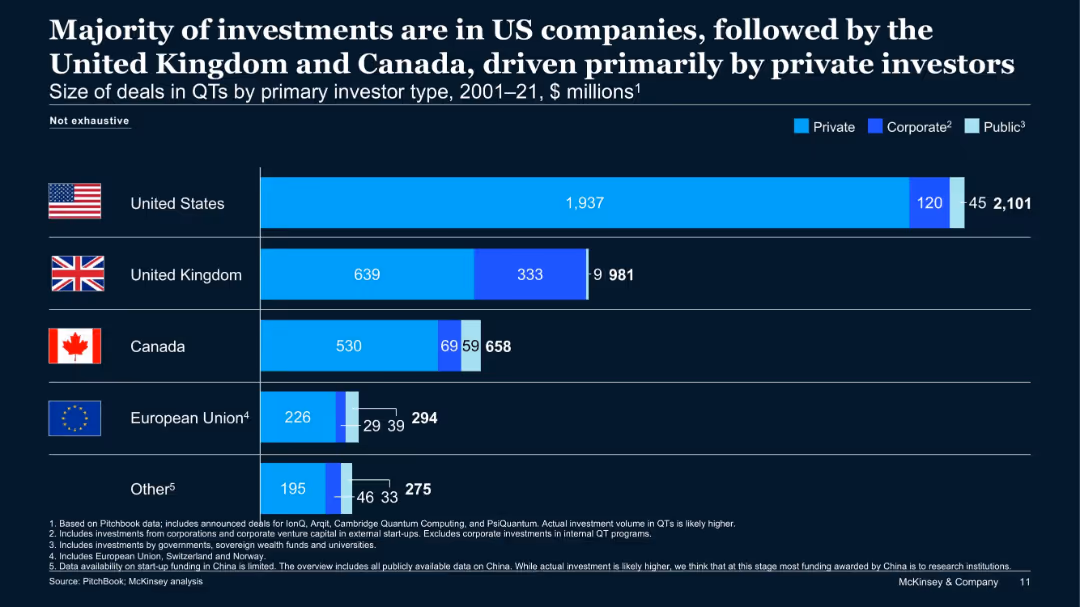
This slide highlights geographic trends in quantum technology investment, showing the US as the dominant market, followed by the UK and Canada. It also distinguishes between private, corporate, and public investment roles.
QT investment, US market, investor type, global funding, quantum tech
false
Market Analysis and Trends
Artificial Intelligence
Single Chart
McKinsey
Add to my slides
Remove from favorites
Horizontal bar chart on dark background showing QT investments by country and investor type; annotations and color-coded segments distinguish investor types.
Investment Analysis
Financial Services
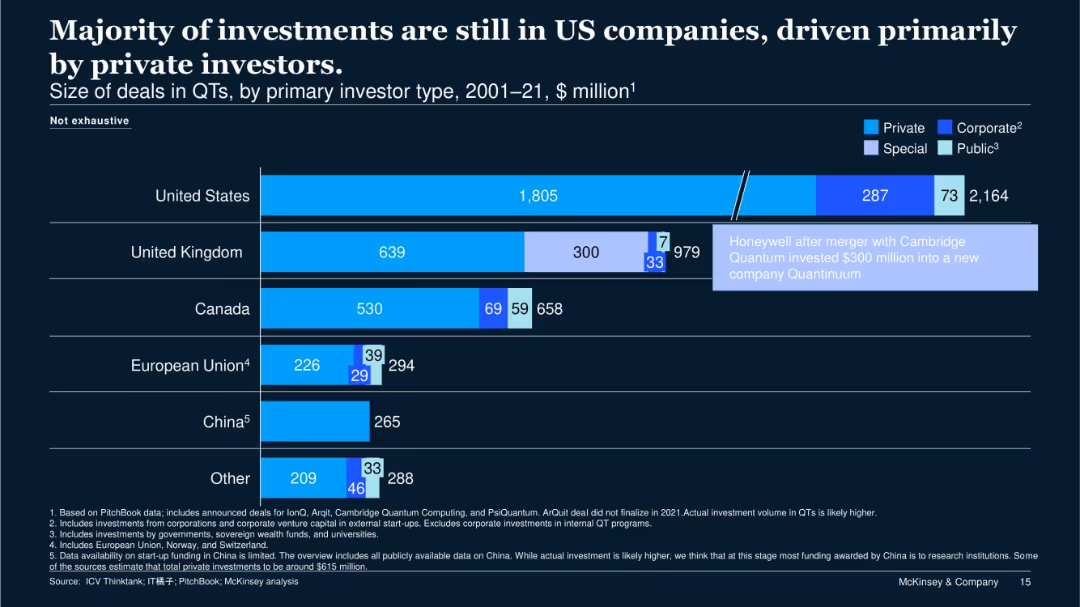
The United States leads QT investments, primarily from private and corporate sources. UK, Canada, and EU follow, with varying levels of public and special investment. The slide highlights a $300M investment post-Cambridge Quantum merger.
QT investment, US, investor type, corporate, public funding
false
Investment Analysis
Financial Services
Single Chart
McKinsey
Add to my slides
Remove from favorites
Horizontal stacked bar chart showing investment distribution by country and investor type
Investment Analysis
Artificial Intelligence
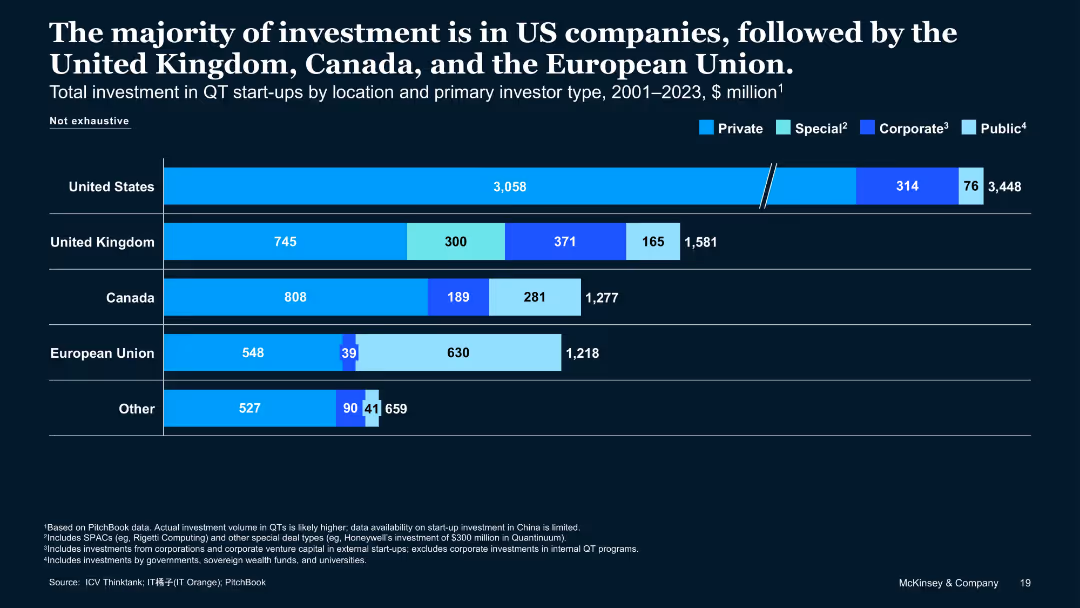
This slide illustrates total QT start-up investment from 2001–2023 by country and investor type. The US leads, followed by the UK, Canada, and the EU. Investor types include private, special, corporate, and public funds.
QT investments, United States, Private Capital, Investor Type, Startups
false
Investment Analysis
Artificial Intelligence
Single Chart
McKinsey
Add to my slides
Remove from favorites
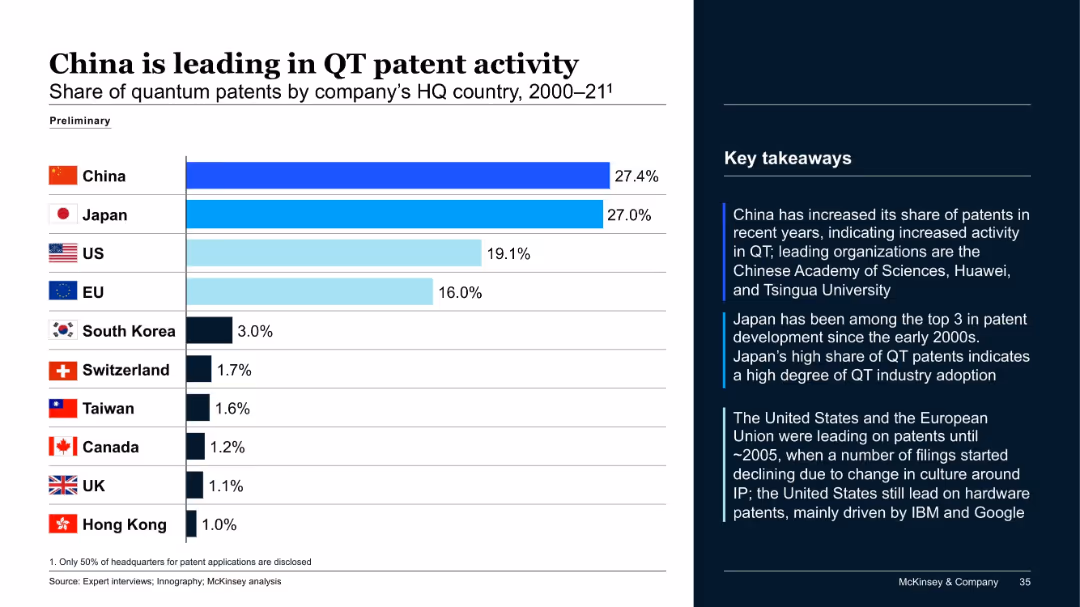
Horizontal bar chart ranking countries by share of quantum patents (2000–2021), with key insights listed on the right.
Competitive Landscape
Artificial Intelligence
China leads with 27.4% of quantum technology (QT) patents, closely followed by Japan. The US and EU trail at 19.1% and 16%, respectively. The commentary highlights China's rapid growth, Japan's consistent top-3 presence, and a decline in US/EU filings since ~2005 due to changing IP cultures.
QT patents, China, Japan, US, EU, intellectual property, competitive analysis
false
Competitive Landscape
Artificial Intelligence
Mixed Chart
McKinsey
Add to my slides
Remove from favorites
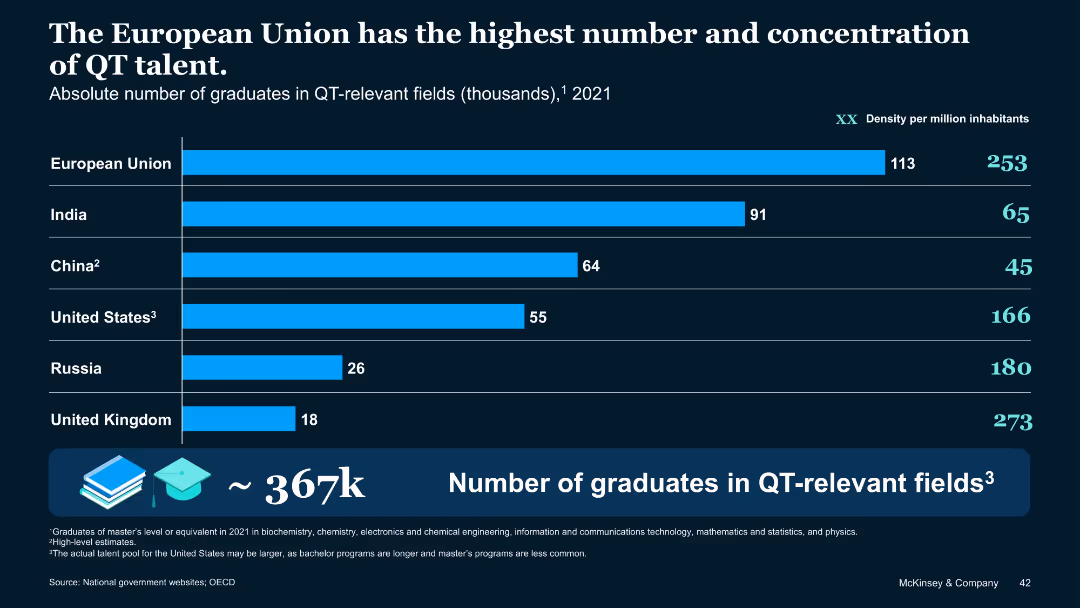
Horizontal bar chart of QT graduates (thousands) by country, with density metrics per million inhabitants.
Human Resources and Talent Management
Education & Training
EU has the most QT graduates in total and per capita (253/million). India has high absolute numbers, while the U.S. leads in talent density. The data suggests the EU is best positioned in terms of depth and breadth of quantum-relevant workforce.
QT talent, graduates, EU, India, U.S., talent pool, workforce, education, density
false
Human Resources and Talent Management
Education & Training
Mixed Chart
McKinsey
Add to my slides
Remove from favorites
This slide shows a series of column charts comparing the share of quantum patents by country and technology type (QT, QC, QComms, QS). Each chart lists countries such as China, Japan, EU, USA, and others.
Market Analysis and Trends
Technology & Software
The slide highlights the dominance of Chinese companies in obtaining QT patents across various technology types. It compares the patent shares of different countries and provides key takeaways on global patent trends.
QT, Patents, China, Technology, Countries
false
Market Analysis and Trends
Technology & Software
Multiple Chart
McKinsey
Add to my slides
Remove from favorites
This slide features two column charts. The left chart ranks countries by the h-index in quantum-relevant publications, while the right chart lists the top 5 EU countries by h-index rank.
Market Analysis and Trends
Technology & Software
The slide presents data on the publication impact of various countries in the field of quantum technology. It shows that while the EU and China publish the most, US publications have the highest h-index, indicating greater impact.
QT, Publications, h-index, EU, US
false
Market Analysis and Trends
Technology & Software
Multiple Chart
McKinsey
Add to my slides
Remove from favorites
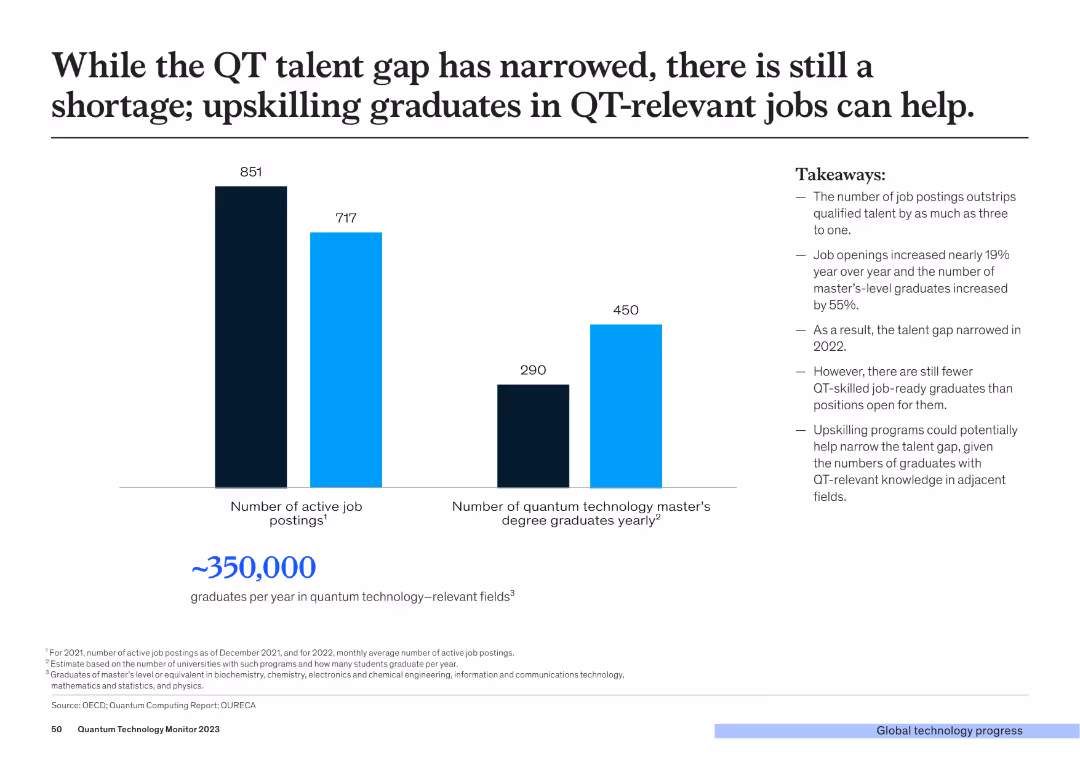
The slide features a column chart comparing the number of active job postings and the number of QT master’s degree graduates per year. It also provides a statistic on the annual number of graduates in QT-relevant fields.
Human Resources and Talent Management
Technology & Software
The slide discusses the persistent QT talent gap despite improvements, suggesting that upskilling graduates in QT-relevant jobs could help bridge this gap. It emphasizes the mismatch between job postings and available qualified graduates.
QT, Talent Gap, Upskilling, Graduates, Jobs
false
Human Resources and Talent Management
Technology & Software
Mixed Chart
McKinsey
Add to my slides
Remove from favorites
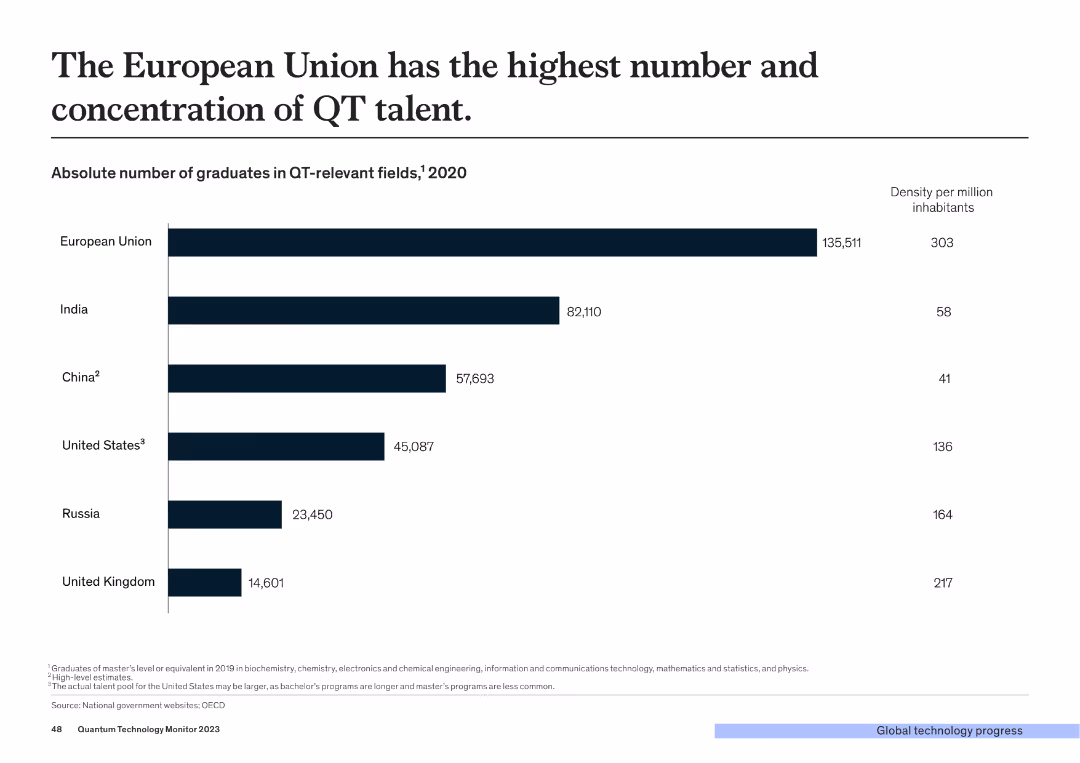
The slide presents a column chart showing the absolute number of graduates in QT-relevant fields by country. The chart lists the EU, India, China, USA, Russia, and the UK.
Market Analysis and Trends
Technology & Software
The slide highlights the European Union as having the highest number and concentration of graduates in quantum technology-relevant fields compared to other countries, emphasizing the region's educational strength in QT.
QT, Talent, Graduates, EU, Education
false
Market Analysis and Trends
Technology & Software
Single Chart
McKinsey
Add to my slides
Remove from favorites
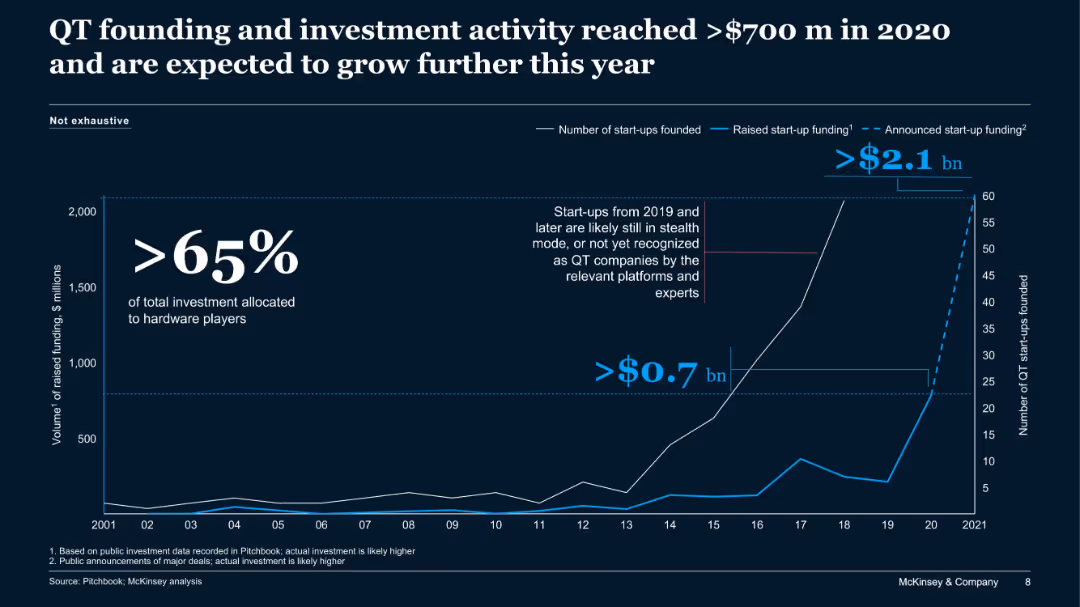
Line chart showing trends in QT start-up funding and number of start-ups from 2001 to 2021, with annotations for stealth and hardware players.
Sales and Business Development
Artificial Intelligence
This slide tracks growth in quantum technology (QT) funding and start-up activity, highlighting over $700M in 2020 and projections for continued growth, particularly in hardware-focused investments.
QT, quantum tech, start-ups, funding, venture capital, hardware, McKinsey
false
Sales and Business Development
Artificial Intelligence
Single Chart
McKinsey
Add to my slides
Remove from favorites
The slide displays a column chart comparing the net revenue mix transformation from 2015 to 2018. The design is simple with blue and white colors and clear labels.
Financial Performance
Financial Services
The slide focuses on the improvement in the quality of earnings by showing the transformation of the net revenue mix. It highlights the shift towards more stable and recurring revenue sources over time.
Quality of Earnings, Revenue Mix, Transformation, Net Revenue, Stable Revenue
false
Financial Performance
Financial Services
Single Chart
Credit Suisse
Add to my slides
Remove from favorites
Three column charts comparing the portfolio and EM Index on return on equity, EPS growth, and net debt/EBITDA ratios.
Financial Performance
Financial Services
This slide highlights the key quality and growth metrics of the portfolio versus the EM Index, focusing on return on equity, EPS growth, and debt ratios.
Quality, Growth, Metrics, Portfolio, EM Index, Return on Equity, EPS, Debt, Financial, Comparison
false
Financial Performance
Financial Services
Multiple Chart
Morgan Stanley
Add to my slides
Remove from favorites
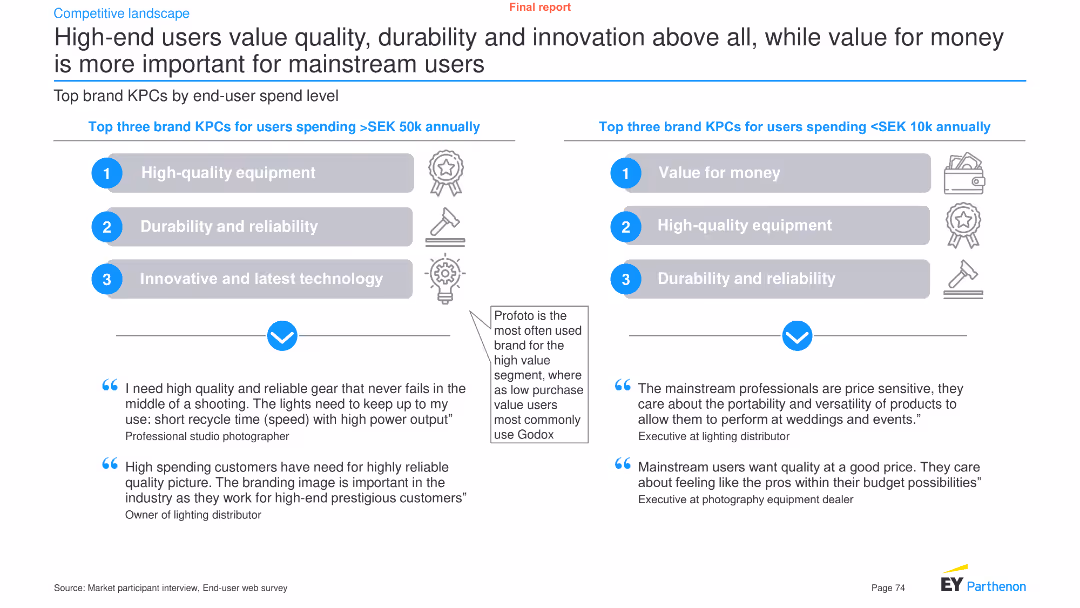
The slide compares brand key purchasing criteria (KPCs) for high-end and mainstream users, using text boxes, icons, and a column chart in the center.
Customer and Market Segmentation
Consumer Goods
It highlights the top three brand KPCs for users spending over SEK 50k and those spending less than SEK 10k annually, with supporting quotes.
Quality, durability, innovation, mainstream, value for money, brand KPCs, purchasing criteria, consumer goods, segmentation, analysis
false
Customer and Market Segmentation
Consumer Goods
Header Horizontal
EY
Add to my slides
Remove from favorites
Slide features a dual line graph and textual insights.
Technology and Digital Transformation
Technology & Software
Tracks the increasing use of quantitative tools in marketing to demonstrate both short-term and long-term impacts, showing a positive trend.
Quantitative Tools, Marketing, Impact, Trends, Long-term, Short-term, Line Graph, Demonstration, Use
false
Technology and Digital Transformation
Technology & Software
Single Chart
Deloitte
Add to my slides
Remove from favorites
This slide contrasts the enabling functions of quantum communications versus its classical counterpart. It has a clear, two-column format that lists applications on the left and expands on them on the right. Icons are used to visually distinguish different applications of quantum communications, such as quantum-enhanced cryptography and quantum internet.
Technology and Digital Transformation
Technology & Software
The slide explores the innovative disruptions quantum communications could bring to secure data transfer and cryptographic processes. It's targeted towards a technical audience interested in the advancements of quantum technology over classical methods, emphasizing enhanced security and the potential for a quantum internet.
Quantum Communications, Cryptography, Internet, Security, Infrastructure
false
Technology and Digital Transformation
Technology & Software
Header Horizontal
McKinsey
Add to my slides
Remove from favorites
The slide features wave graphics and icons to discuss the advantages of quantum communication. The content is arranged in a clear, linear fashion, with color differentiation aiding in distinguishing between the different sections and points made on the slide.
Technology and Digital Transformation
Technology & Software
This slide delves into the benefits and aspirations of quantum communications over traditional methods, focusing on enhanced security and computational power. It serves to inform on the potential applications and breakthroughs that quantum communications might offer in various fields.
Quantum Communications, Security, Computing Power
false
Technology and Digital Transformation
Technology & Software
Header Horizontal
McKinsey
Add to my slides
Remove from favorites
This comparison slide features two columns contrasting classical and quantum computers. Icons and contrasting colors clearly distinguish between the two types, providing an easy-to-follow comparison that is visually simple and effective for educational purposes.
Technology and Digital Transformation
Technology & Software
Exploring the differences between classical and quantum computing, the slide elucidates on storage, computation, performance, and the pros and cons of each. It's tailored to an audience curious about the fundamental changes quantum computing brings compared to traditional computing methods.
Quantum Computing, Comparison, Education
false
Technology and Digital Transformation
Technology & Software
Header Vertical
McKinsey
Add to my slides
Remove from favorites
Diagram showing the projected development of quantum computing power with applications and sectors of interest based on the number of physical qubits.
Technology and Digital Transformation
Technology & Software
The slide discusses the projected development of quantum computing power and its potential applications in various sectors. It outlines the advancements in computing power and the transformative impact quantum computing could have on industries like finance, energy, and security.
Quantum Computing, Computing Power, Sectors
false
Technology and Digital Transformation
Technology & Software
Table
Roland Berger
Add to my slides
Remove from favorites
The slide is divided into two columns, with a headline across the top. The left column provides a brief introduction to quantum computing's potential impact, while the right column lists applications with associated icons representing different quantum computing use cases, such as simulation and optimization.
Technology and Digital Transformation
Technology & Software
This slide illustrates the potential disruptions quantum computing could create in various sectors by detailing specific applications. It serves as a crucial educational tool for understanding the broad implications of quantum computing in fields like drug discovery and finance, highlighting the need for extensive research and development.
Quantum Computing, Disruption, Simulation, Optimization, Algebra
false
Technology and Digital Transformation
Technology & Software
Header Vertical
McKinsey
Add to my slides
Remove from favorites
Detailed table and bar chart outlining value by industry and timeline
Technology and Digital Transformation
Artificial Intelligence
This slide outlines QC's value potential across industries such as finance, pharmaceuticals, energy, and advanced manufacturing. It estimates a $1–2T opportunity by 2035 and highlights sectors for deep-dive research focus.
Quantum Computing, Industry Impact, Economic Value, 2035 Projections
false
Technology and Digital Transformation
Artificial Intelligence
Mixed Chart
McKinsey
Add to my slides
Remove from favorites
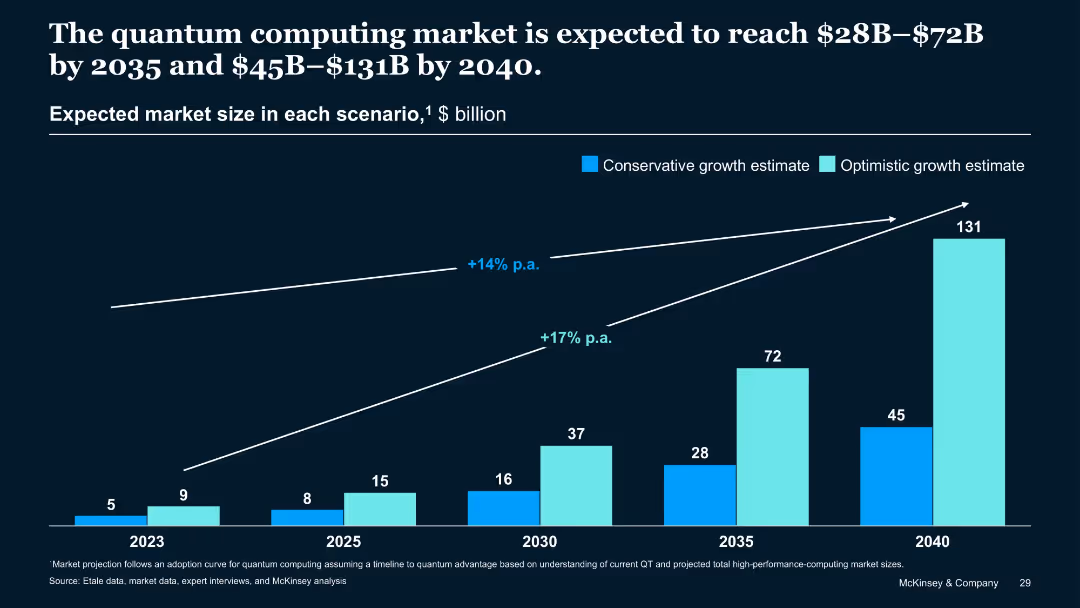
Line and bar graph tracking expected market size in billions through 2040
Market Analysis and Trends
Artificial Intelligence
The graph projects quantum computing market growth from 2023 to 2040 under two scenarios. The optimistic case reaches $131B by 2040, while the conservative path ends at $45B, with annual growth rates of 14–17%.
Quantum Computing, Market Growth, Forecast, Investment Scenarios, Trends
false
Market Analysis and Trends
Artificial Intelligence
Single Chart
McKinsey
Add to my slides
Remove from favorites
The slide provides a straightforward layout with a column of text on the left and a corresponding column with icons and examples of impacts on the right. It utilizes images to represent different industries, which complements the textual information provided and allows for quick visual association.
Industry Overview
Technology & Software
Addressing the cross-industry impact of quantum technologies, this slide outlines specific applications in fields ranging from IT to pharmaceuticals. The slide's structured format aids in communicating the broad relevance of quantum innovations and their transformative potential, making it useful for a diverse business audience.
Quantum Technologies, Industries, IT, Pharmaceuticals, Impact
false
Industry Overview
Technology & Software
Header Vertical
McKinsey
Add to my slides
Remove from favorites
This slide presents two hypothetical scenarios side by side, using illustrations and bullet points. The graphics include representations of hybrid computing solutions and people discussing around high-performance computers. The clear, side-by-side comparison layout helps in contrasting the current state and future expectations in quantum technology.
Strategic Planning
Technology & Software
Offering guidance for leadership engagement with quantum technology, this slide contrasts immediate actionable strategies with long-term goals. It is designed to inform leaders about balancing investments in hybrid quantum-classical solutions now while preparing for the quantum future, thus aiding in strategic decision-making.
Quantum Technologies, Leadership, Strategy, Hybrid Computing, Investment
false
Strategic Planning
Technology & Software
Header Horizontal
McKinsey
Add to my slides
Remove from favorites
A two-column slide listing the advantages and risks of engaging with quantum technologies. Icons symbolize positive and negative aspects on each side.
Strategic Planning
Technology & Software
The slide is a continuation of the strategic considerations for leaders in quantum technology, detailing the potential benefits of early adoption and the uncertainties involved, aiming to guide decision-making processes.
Quantum Technology, Leadership, Strategy, Risks
false
Strategic Planning
Technology & Software
Header Horizontal
McKinsey
Add to my slides
Remove from favorites
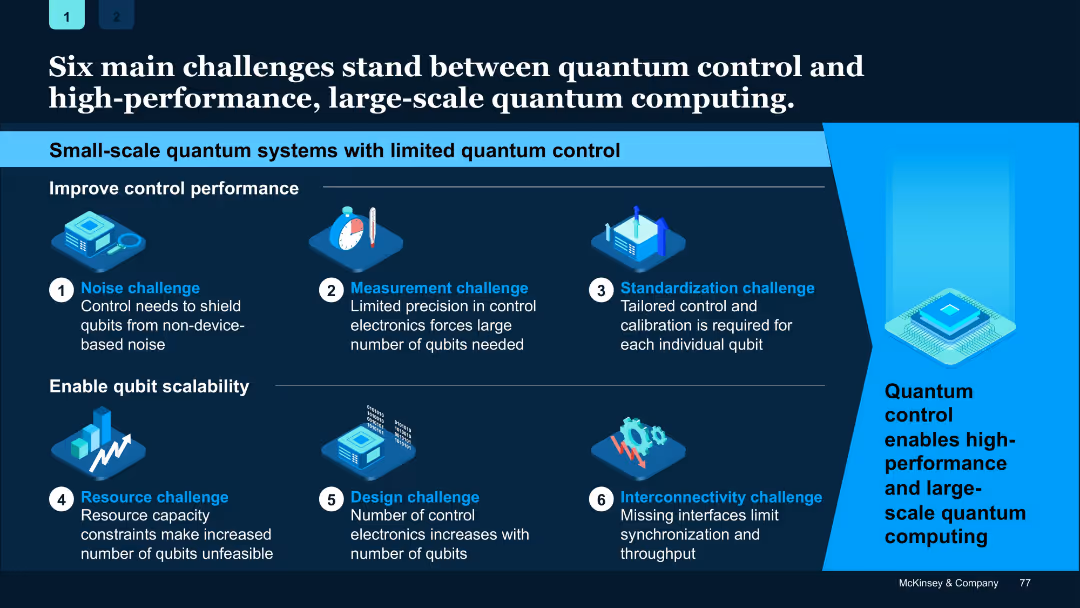
Grid layout with icons and blue highlight sections; challenges numbered 1–6 and grouped under two main themes: control performance and scalability.
Risk Assessment and Management
Artificial Intelligence
Identifies six key technical challenges limiting high-performance quantum computing—ranging from noise control to scalability. Focuses on both improving control and expanding qubit capabilities.
Quantum control, challenges, scalability, qubit, noise, electronics
false
Risk Assessment and Management
Artificial Intelligence
Linear Flow
McKinsey
Add to my slides
Remove from favorites
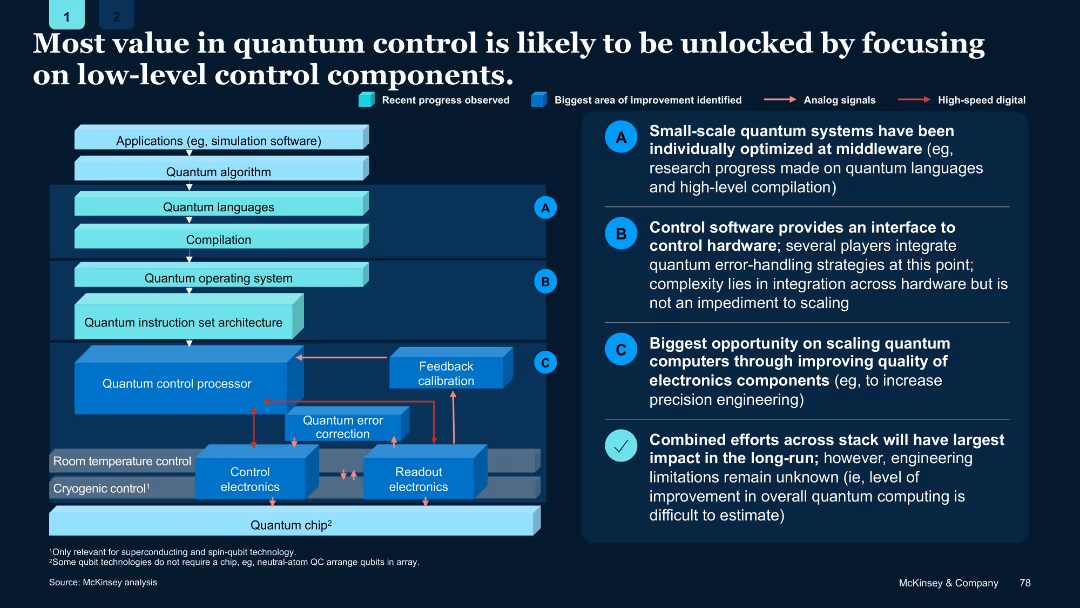
Layered system architecture diagram; arrows indicate flow between components; callouts A–C and summary at bottom-right.
Product and Service Analysis
Artificial Intelligence
Argues that greatest value in quantum control lies in improving low-level components, especially electronics. Emphasizes combined stack improvements for scalable quantum computing.
Quantum control, electronics, middleware, optimization, architecture
false
Product and Service Analysis
Artificial Intelligence
Boxed
McKinsey
Add to my slides
Remove from favorites
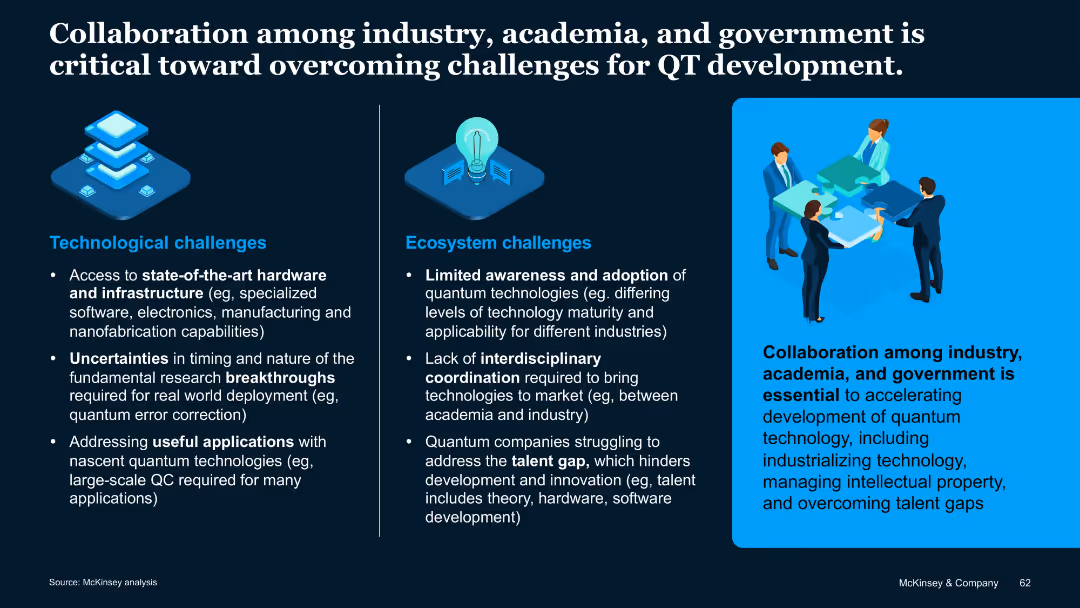
Split-panel layout with icons and bullet points; right section features an illustration and a highlighted quote in a blue box.
Strategic Planning
Artificial Intelligence
This slide outlines technological and ecosystem challenges in quantum technology development. It emphasizes the importance of collaboration across sectors to overcome hardware, talent, and research barriers.
Quantum technology, collaboration, hardware, talent gap, ecosystem
false
Strategic Planning
Artificial Intelligence
Pillar
McKinsey
Add to my slides
Remove from favorites
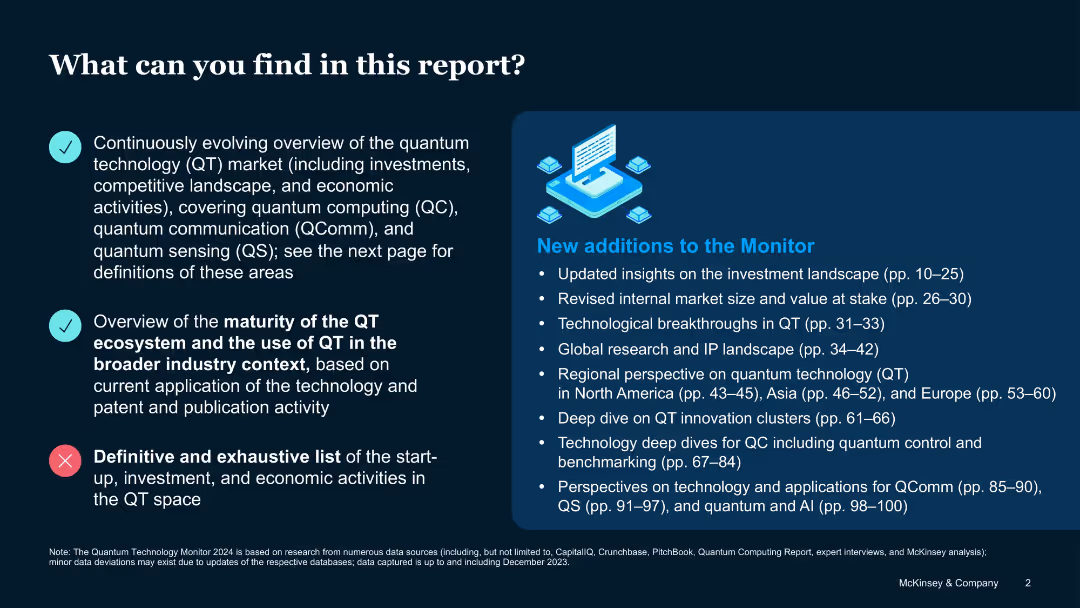
Split-screen layout with bullet points and infographic; check and cross icons indicate inclusion/exclusion
Industry Overview
Artificial Intelligence
Introduces the scope and limitations of the report, outlining what is and isn’t included. Focuses on QT market trends, ecosystem maturity, and new additions such as investment insights and IP analysis, but excludes a full inventory of economic activities.
Quantum technology, market overview, QComm, QC, QS, insights, exclusions
false
Industry Overview
Artificial Intelligence
Boxed
McKinsey
Add to my slides
Remove from favorites
This slide contains two column charts comparing the speedup of quantum and classical algorithms. The charts illustrate polynomial and exponential speedup based on problem size. Text descriptions are on the right side of the slide.
Technology and Digital Transformation
Technology & Software
The slide discusses how algorithm complexity, execution time, and problem size influence the economic value unlocked through speedup. It contrasts quantum and classical algorithms, highlighting performance differences.
Quantum, Classical, Algorithm, Complexity, Execution Time
false
Technology and Digital Transformation
Technology & Software
Multiple Chart
McKinsey
Add to my slides
Remove from favorites
The slide provides key figures and statements around the potential impact of quantum technologies. It employs a simple layout with icons to accompany the text, making the statistical data and projections stand out clearly against the dark background.
Strategic Planning
Technology & Software
Highlighting the financial stakes and developmental progress of quantum technologies, this slide aims to persuade business leaders of the urgency and importance of paying attention to this emerging field. It combines market projections with the current status of the technology to build a case for investment and interest.
Quantum, Leadership, Investment, Market
false
Strategic Planning
Technology & Software
Pillar
McKinsey
Add to my slides
Remove from favorites
The slide is divided into two parts, with the left side outlining established quantum technologies like lasers and magnetic resonance imaging, accompanied by descriptive icons. The right side highlights emerging quantum technologies, represented by icons and concise explanations of their potential.
Technology and Digital Transformation
Technology & Software
This slide provides a comparison between long-standing quantum technologies and emerging ones, explaining their significance and potential future impact. It serves as an educational piece for those interested in understanding how quantum technology has evolved and where it's heading.
Quantum, Technologies, Computing, Sensing
false
Technology and Digital Transformation
Technology & Software
Text Only
McKinsey
Add to my slides
Remove from favorites
This slide displays a dark blue background with an image of a microchip and quantum circuits, representing quantum technologies. The slide's title is in large, bold white font at the top, with a subtitle "Quantum technologies" and the date "August 2022" in smaller font, both clearly legible.
Industry Overview
Technology & Software
As an introduction, this slide signifies the beginning of a section or report on quantum technologies within the technology trends outlook. It is intended to capture the viewer's attention and sets a thematic focus on quantum computing and its related fields for the following content.
Quantum, Technology, Trends, Outlook, 2022
false
Industry Overview
Technology & Software
Title
McKinsey
Add to my slides
Remove from favorites
The slide includes a column chart with vertical bars showing the quarterly reported EPS volatility from 1999 to Q4'19 for various banks. There's a horizontal axis representing net income increase, with banks arranged according to this measure. Logos of the banks are displayed below each bar. The design is clean with minimal text, using shades of blue, red, and gray. The Santander logo is in the top corner, and there's a 'Strength' icon on the right.
Financial Performance
Financial Services
This slide provides a comparative analysis of earnings volatility and net income increase among leading banks, emphasizing Santander's low volatility and strong income growth. This could be used in presentations to showcase financial stability and growth over a 20-year period to investors or company stakeholders.
Quarterly Earnings, Volatility, Net Income, Banks, Santander, Long-term Growth, Financial Stability, Market Comparison, EPS Volatility
false
Financial Performance
Financial Services
Single Chart
Morgan Stanley
Add to my slides
Remove from favorites
This slide is similar to slide 3611 with an updated focus on the latest quarterly data. It has several column charts detailing net interest income by segment and loans by type, along with key metrics, all presented with a clear blue and gray color scheme.
Financial Performance
Financial Services
This is an updated version of a financial overview, detailing net interest income and loan distribution. It's particularly useful for financial reviews, stakeholder briefings, or company quarterly reports.
Quarterly Report, Loan Distribution, Interest Income
false
Financial Performance
Financial Services
Multiple Chart
Goldman Sachs
Add to my slides
Remove from favorites
This slide presents a line graph showing the U.S. market podcast ad revenue percentage share by quarter from 2017 to 2022. Each line is color-coded to represent a different quarter, illustrating trends and changes over time.
Market Analysis and Trends
Media & Entertainment
Analyzes the seasonal distribution of podcast advertising revenue in the U.S. market, noting a decrease in the fourth quarter share in 2022. Useful for understanding seasonal impacts on marketing and advertising budgets.
Quarterly Trends, Podcast Advertising, Revenue Share, Marketing Budgets
false
Market Analysis and Trends
Media & Entertainment
Single Chart
PwC/Strategy&
Add to my slides
Remove from favorites
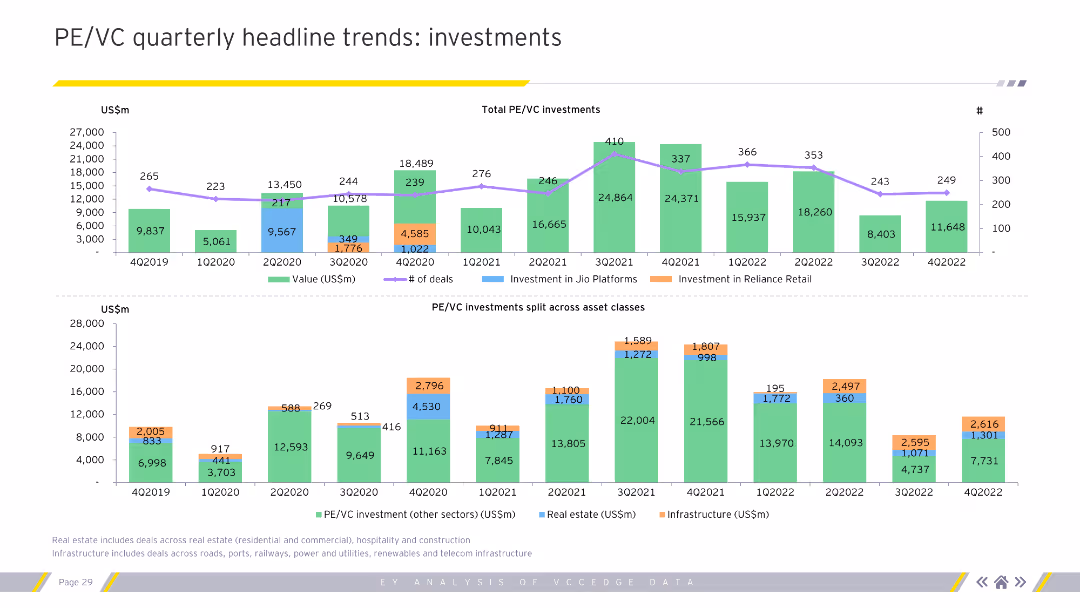
The slide includes two column charts displaying quarterly PE/VC investments by value and by deal segments. The charts use various colors to differentiate between the segments and quarters.
Market Analysis and Trends
Financial Services
This slide analyzes quarterly trends in private equity and venture capital investments, highlighting investment values and deal segments. Useful for understanding quarterly investment patterns.
Quarterly trends, PE/VC, investments, segments
false
Market Analysis and Trends
Financial Services
Multiple Chart
EY
Add to my slides
Remove from favorites
Layout with bullet points and icons showing strategies and impacts of a US grocery player's efforts to innovate quick delivery models.
Operational Efficiency
Retail & E-commerce
The slide focuses on a US grocery company's innovative delivery models that improved their e-commerce sales, highlighting strategies such as 'click & collect' and partnerships for faster delivery services.
Quick delivery, grocery, e-commerce, operational efficiency
true
Operational Efficiency
Retail & E-commerce
Header Vertical
BCG
Add to my slides
Remove from favorites
Previous
Next
You don't have any favorites yet.
Please wait loading your favorites slides...
Create a FREE account to continue browsing
Receive Instant Access to 1,000+ slides from companies like McKinsey, Google, and Goldman Sachs
First Name
Last Name
Email
Password
I agree to all
Terms & Privacy Policy
Thank you! Your submission has been received!
Oops! Something went wrong while submitting the form.
Have an account?
Sign in
Upgrade to PRO to Save slides
Advanced Search and Filters
Access to 15,000+ slides
Access to Category Pages
Save/Bookmark Slides
PowerPoint Template Library
Pick a Plan
MONTHLY
$12/month
Billed every month, Cancel anytime.
YEARLY
$9/year
Billed $108 annually, Cancel anytime.
Checkout for $12/month
Checkout for $108/yr
Secured by Stripe | AES-256 bit encryption