My Account
My Slides
Search by Category
Pricing
Templates
View All Templates
Download Template Slides
✦ AI Search
Feedback
Login
Logout
Get Started
Browse all Slides
Browse all Slides
Create a FREE Account
Instant access to 1,000+ real slides from top companies like McKinsey, BCG, Goldman Sachs, Google and many more!
First Name
Last Name
Email
Password
I agree to all
Terms & Privacy Policy
Thank you! Your submission has been received!
Oops! Something went wrong while submitting the form.
Have an account?
Sign in
Saved Slides
Total No. of slides saved
0
↻ Refresh
✖ Clear all
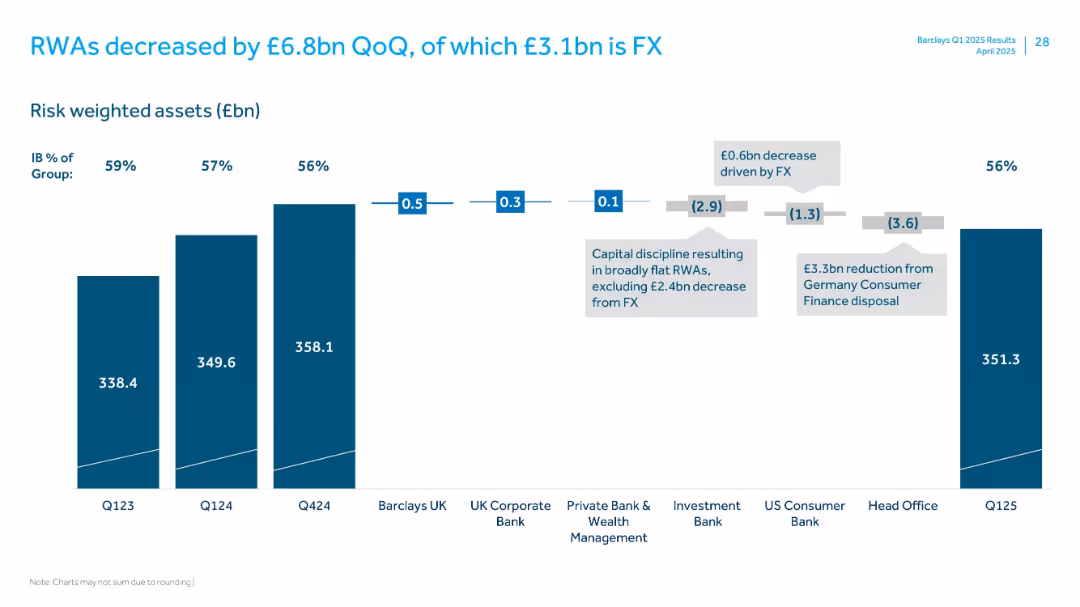
Vertical stacked bar chart with segments showing change in RWAs across divisions and FX effects
Performance Metrics and KPIs
Financial Services
Shows a £6.8bn quarter-over-quarter decrease in risk-weighted assets (RWAs), with detailed breakdowns by business units and impact from FX and the German consumer finance disposal.
RWAs, FX impact, Germany disposal, business units, Q125
false
Performance Metrics and KPIs
Financial Services
Single Chart
Barclays
Add to my slides
Remove from favorites
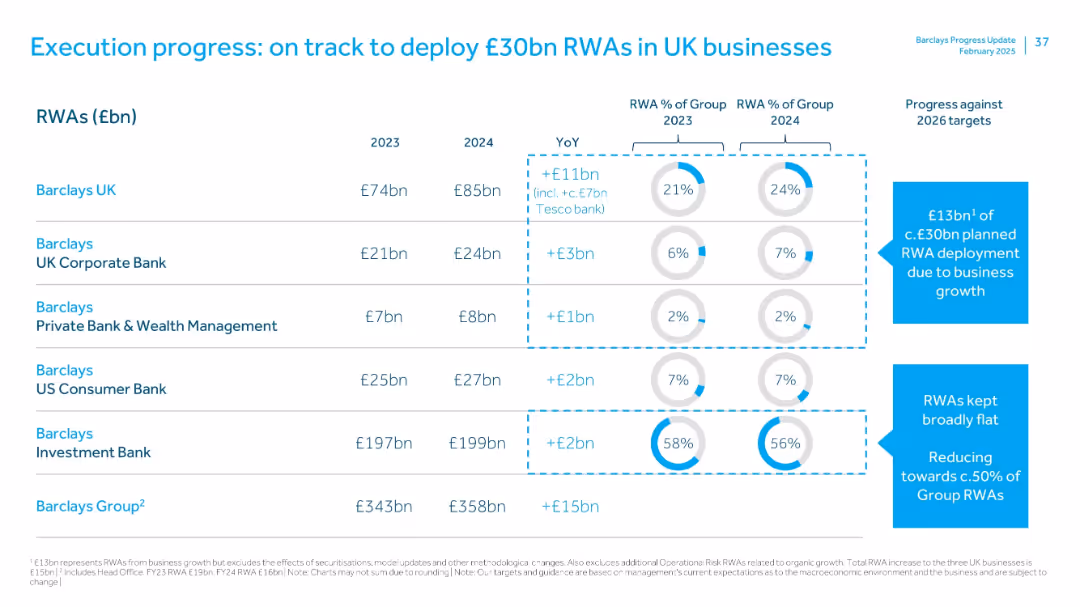
Data table listing RWA growth by Barclays business lines from 2023 to 2024, with accompanying YoY changes, group % shares, and visual callouts of key drivers.
Operational Efficiency
Financial Services
This slide shows progress in planned RWA deployment, with £13bn attributed to business growth. Barclays UK led growth with an £11bn increase. Visual cues show alignment with the 2026 strategy and aim to reduce Investment Bank’s RWA share.
RWAs, business growth, Tesco Bank, UK business, operational progress
false
Operational Efficiency
Financial Services
Mixed Chart
Barclays
Add to my slides
Remove from favorites
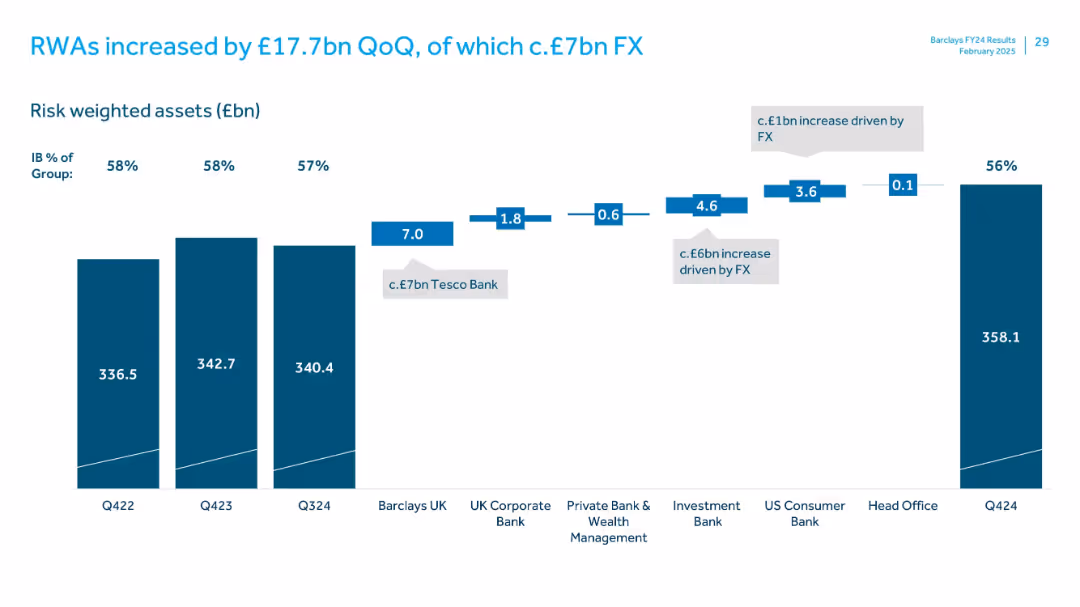
Bar chart timeline with stepwise RWA increases by business unit. Percent share of group noted above bars. Uses labeled boxes and FX callouts for visual clarity.
Risk Assessment and Management
Financial Services
Shows Q4 2024 increase in RWAs to £358.1bn, driven by Tesco Bank acquisition (£7bn) and FX impact (£6bn). Each segment of the business is shown with individual contribution. Investment Bank's share of RWAs declined slightly to 56%.
RWAs, risk weighted assets, FX, Tesco Bank, investment bank, Q4 2024
false
Risk Assessment and Management
Financial Services
Single Chart
Barclays
Add to my slides
Remove from favorites
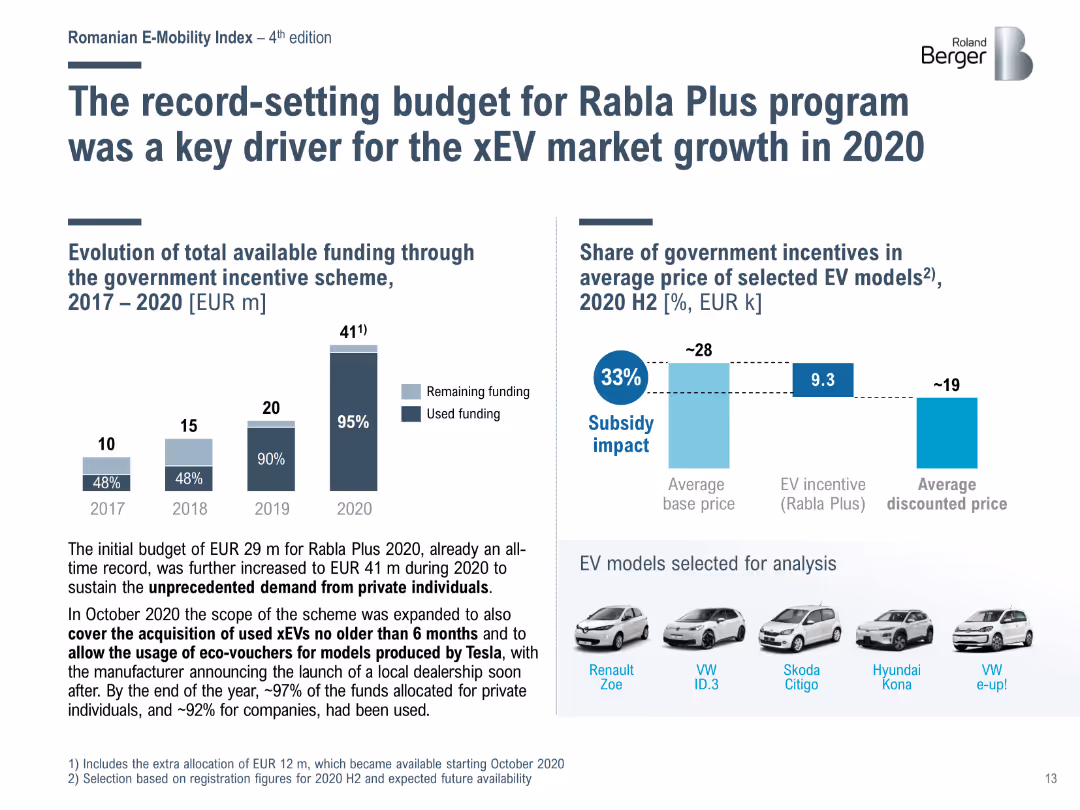
Bar chart showing the evolution of funding for the Rabla Plus program from 2017 to 2020, and its impact on the average price of selected EV models in 2020 H2.
Market Analysis and Trends
Transportation & Logistics
Highlights the role of the Rabla Plus program in driving xEV market growth in Romania, with significant funding increases and subsidies impacting EV affordability.
Rabla Plus, EV market, funding, subsidies, Romania
false
Market Analysis and Trends
Transportation & Logistics
Multiple Chart
Roland Berger
Add to my slides
Remove from favorites
The layout is a numbered list describing specific actions and the progress made in each area, accompanied by icons. The text is clear, with the use of bullet points for readability.
Human Resources and Talent Management
Professional Services
Discusses initiatives toward racial equity and their progress, suitable for showcasing a company’s commitment to diversity and inclusion.
Racial Equity, Diversity, Inclusion, Corporate Responsibility, Progress
false
Human Resources and Talent Management
Professional Services
Table
McKinsey
Add to my slides
Remove from favorites
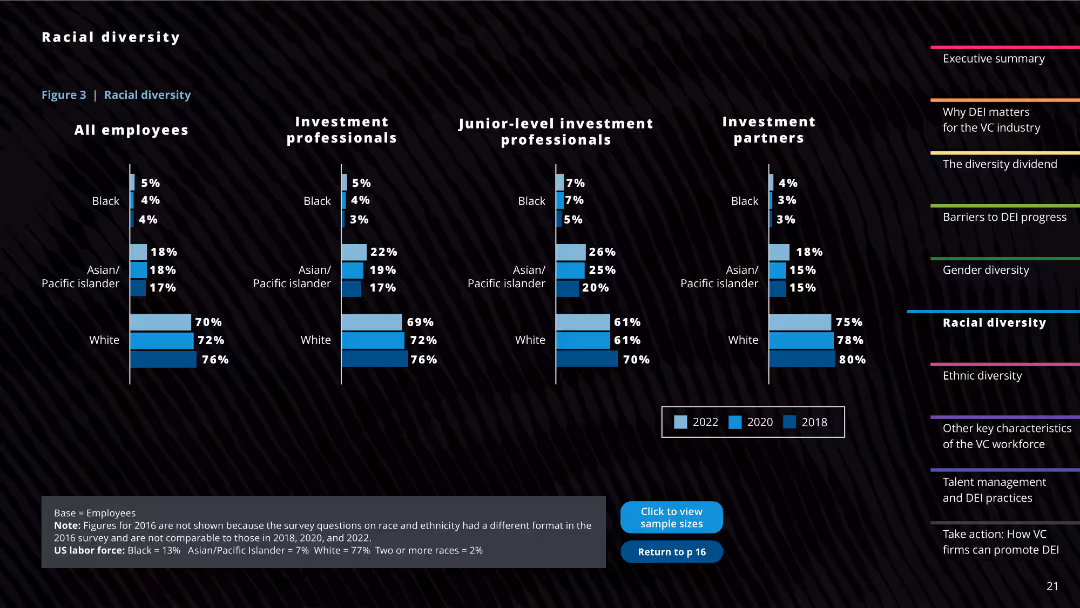
The slide includes multiple column charts illustrating racial diversity statistics for all employees, investment professionals, junior-level professionals, and partners. It also has textual notes and a comparison footnote.
Human Resources and Talent Management
Professional Services
This slide showcases the racial diversity within the venture capital industry, providing comparisons across different years and professional levels, highlighting underrepresentation of certain racial groups.
Racial diversity, VC industry, Professional levels, Diversity comparison, Ethnic representation
false
Human Resources and Talent Management
Professional Services
Multiple Chart
Deloitte
Add to my slides
Remove from favorites
This slide presents a scatter plot and column chart comparing rail freight costs across different distances and states within Australia, focusing on Western Australia's lower costs.
Market Analysis and Trends
Transportation & Logistics
The slide analyzes rail freight costs in Australia, noting that Western Australia's network is the cheapest due to higher throughput capacity and shorter turnaround times, with detailed comparative data.
Rail freight, Australia, cost analysis, transportation, logistics, Western Australia, cost comparison, market trends
false
Market Analysis and Trends
Transportation & Logistics
Multiple Chart
LEK
Add to my slides
Remove from favorites
The slide features a column chart comparing rail transport costs per tonne per kilometer across various Australian states and other countries. It also includes key metrics and explanations.
Operational Efficiency
Transportation & Logistics
The slide compares rail freight costs in Australia to other countries, highlighting that Australian costs are significantly higher despite shorter haul distances, with detailed notes on contributing factors.
Rail freight, Australia, cost comparison, transportation, logistics, haulage distances, operational efficiency
false
Operational Efficiency
Transportation & Logistics
Mixed Chart
LEK
Add to my slides
Remove from favorites
The slide includes text sections and small graphs detailing upcountry receival, rail transport, and domestic port costs comparisons.
Risk Assessment and Management
Transportation & Logistics
The slide discusses international benchmarking of Australia's rail and port charges, showing they are higher compared to Canada and Ukraine, impacting efficiency.
Rail, Port, Costs, Benchmarking, Comparison
false
Risk Assessment and Management
Transportation & Logistics
Pillar
LEK
Add to my slides
Remove from favorites
Features a stepwise flowchart detailing the stages from assessment to sustainable improvement, clearly labeled for easy understanding.
Investment Analysis
Professional Services
Discusses the phased approach of A&M's Rapid Results service, focusing on quick implementation and long-term EBITDA improvements, structured in a clear step-by-step format.
Rapid, Results, EBITDA, Improvement, Approach
false
Investment Analysis
Professional Services
Table
Alvarez & Marsal
Add to my slides
Remove from favorites
This slide uses multiple column charts and a graphical representation of client trust to showcase ratings from agencies, analyst recommendations, and employee commitment trends.
Financial Performance
Financial Services
It discusses the bank's improvement in ratings from various credit agencies, trends in analyst recommendations, and growth in employee commitment over the years, reflecting overall progress and stakeholder trust.
Ratings, Analysts, Employee Commitment, Trust, Trends, Performance, Stakeholder Engagement
false
Financial Performance
Financial Services
Multiple Chart
Deutsche Bank
Add to my slides
Remove from favorites
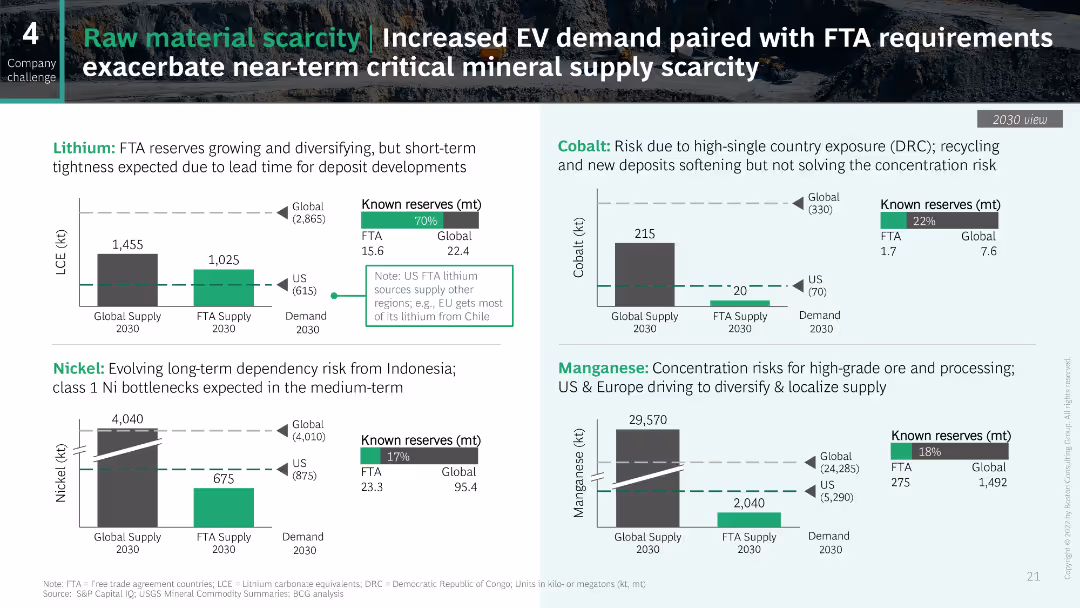
The slide contains multiple column charts and text boxes showing data on lithium, nickel, cobalt, and manganese reserves and supply for 2030. Each section is color-coded for clarity.
Risk Assessment and Management
Industrial & Manufacturing
This slide highlights the scarcity of critical raw materials for EVs, showing known reserves and global supply versus demand projections for 2030 for lithium, nickel, cobalt, and manganese.
Raw materials, EV demand, Supply scarcity, Lithium, Nickel, Cobalt, Manganese
false
Risk Assessment and Management
Industrial & Manufacturing
Multiple Chart
BCG
Add to my slides
Remove from favorites
The slide includes a large pie chart in two shades of blue, with segments labeled with percentages and real estate sectors, and a smaller pie chart. There's a bulleted list to the left.
Financial Performance
Real Estate & Construction
This slide showcases CEREIT's asset allocation in different real estate sectors, emphasizing the proportion of light industrial/logistics acquisitions. It serves to illustrate the strategic direction towards logistics and asset diversification as well as investment performance.
Real Estate, CEREIT, Portfolio, Acquisition, Industrial, Logistics, Investment, Asset Allocation, Performance
false
Financial Performance
Real Estate & Construction
Mixed Chart
Morgan Stanley
Add to my slides
Remove from favorites
Slide includes column chart for portfolio loans, pie charts for mortgage and construction balance by type. Clear and color-coded for easy comprehension.
Market Analysis and Trends
Real Estate & Construction
This slide analyzes the commercial real estate loan portfolio, showing trends in lending and the composition of loans by property type. Ideal for real estate market analysis and understanding sector-specific financial exposure.
Real Estate, Market, Trends, Finance, Loans
false
Market Analysis and Trends
Real Estate & Construction
Multiple Chart
Morgan Stanley
Add to my slides
Remove from favorites
This slide has a map of Europe with highlighted countries, and to the left, a series of mini-tables with property details per country.
Market Analysis and Trends
Real Estate & Construction
The slide provides an overview of CEREIT's real estate portfolio by country in Europe as of a specific date. It is useful for analyzing geographical diversification, property valuation, and occupancy rates across various European markets.
Real Estate, Portfolio, Europe, Valuation, Occupancy, Yield, Diversification, Property, Country
false
Market Analysis and Trends
Real Estate & Construction
Graphic
Morgan Stanley
Add to my slides
Remove from favorites
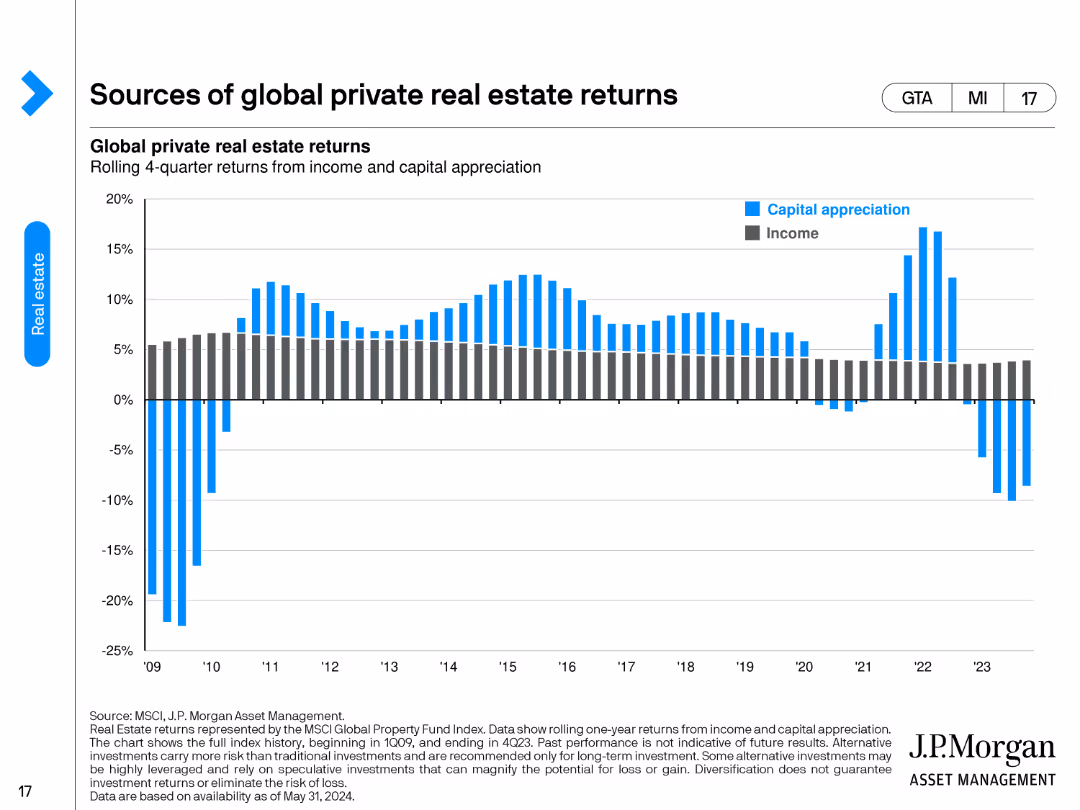
The slide includes a dual-axis column chart showing the rolling 4-quarter returns from income and capital appreciation for global private real estate from 2009 to 2024. The chart uses blue for capital appreciation and grey for income.
Performance Metrics and KPIs
Real Estate & Construction
This slide examines the sources of returns for global private real estate, breaking down the contributions from income and capital appreciation over time, presented in a rolling 4-quarter format from 2009 to 2024.
Real Estate, Returns, Income, Capital Appreciation, Global
false
Performance Metrics and KPIs
Real Estate & Construction
Single Chart
JP Morgan
Add to my slides
Remove from favorites
Three sections with images and accompanying text, each highlighting different aspects of real estate services. Green, blue, and red color highlights for revenue numbers.
Financial Performance
Real Estate & Construction
The slide compares strategies in commercial real estate services, including term lending, community development banking, and real estate banking, focusing on performance and strategic approaches.
Real Estate, Strategy, Lending, Banking, Performance
false
Financial Performance
Real Estate & Construction
Header Vertical
JP Morgan
Add to my slides
Remove from favorites
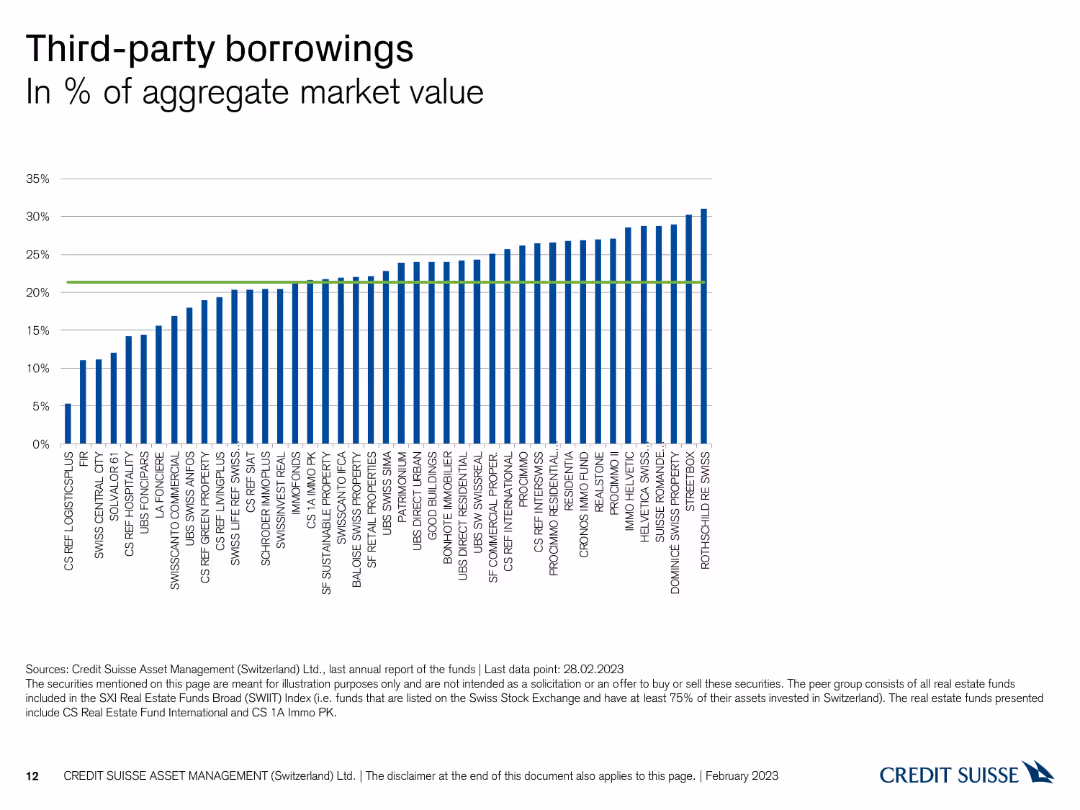
This slide displays a column chart showing third-party borrowings as a percentage of aggregate market value for different Swiss real estate funds, with a green reference line for comparison.
Financial Performance
Real Estate & Construction
The slide illustrates the level of third-party borrowings among Swiss real estate funds, indicating their leverage. It is used for assessing financial risk and leverage ratios of funds.
Real estate, borrowings, market value, leverage, comparison
false
Financial Performance
Real Estate & Construction
Single Chart
Credit Suisse
Add to my slides
Remove from favorites
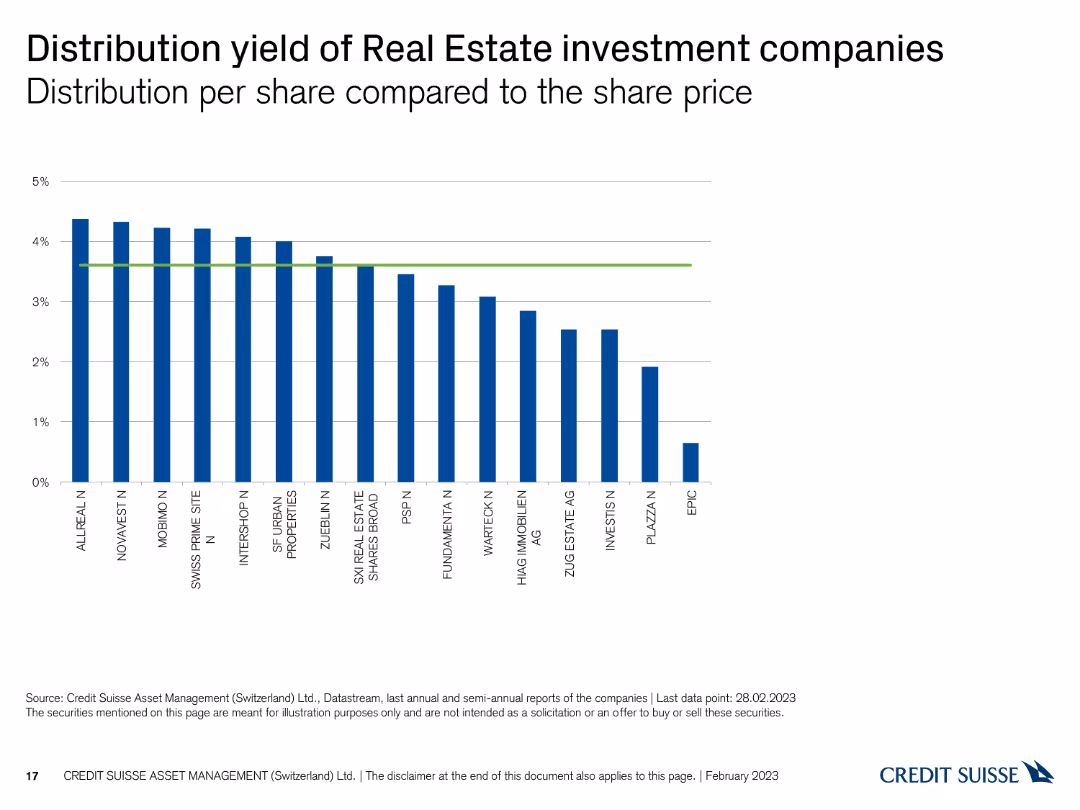
This slide displays a column chart showing the distribution yield per share for Swiss real estate investment companies, with vertical bars representing yield percentages and a green reference line.
Financial Performance
Real Estate & Construction
The slide presents the distribution yields of real estate investment companies, comparing their returns. It is used for evaluating income potential and investment performance.
Real estate, distribution yield, investment companies, returns, comparison
false
Financial Performance
Real Estate & Construction
Single Chart
Credit Suisse
Add to my slides
Remove from favorites
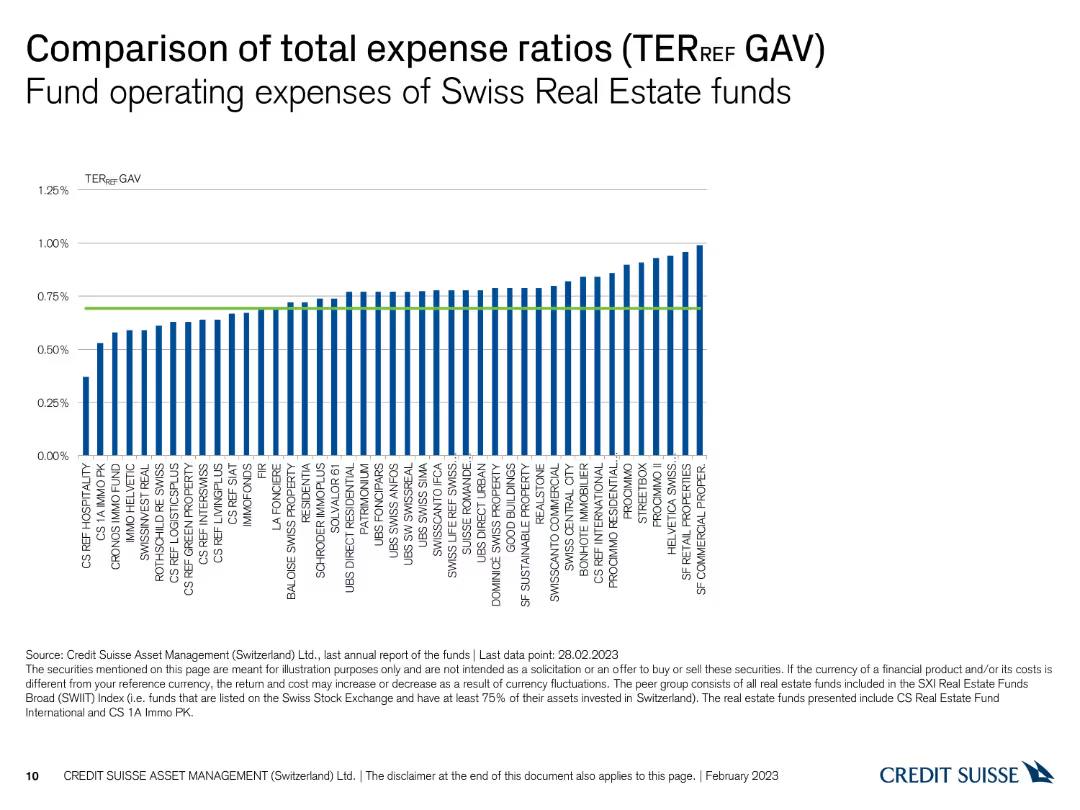
This slide contains a column chart comparing the total expense ratios (TER) of various Swiss real estate funds. The chart has vertical bars representing different funds, with a green horizontal line for reference.
Financial Performance
Real Estate & Construction
The slide shows the fund operating expenses for Swiss real estate funds, helping to analyze cost efficiency across different funds. It is used for evaluating and comparing fund performance.
Real estate, expense ratios, funds, TER, comparison
false
Financial Performance
Real Estate & Construction
Single Chart
Credit Suisse
Add to my slides
Remove from favorites
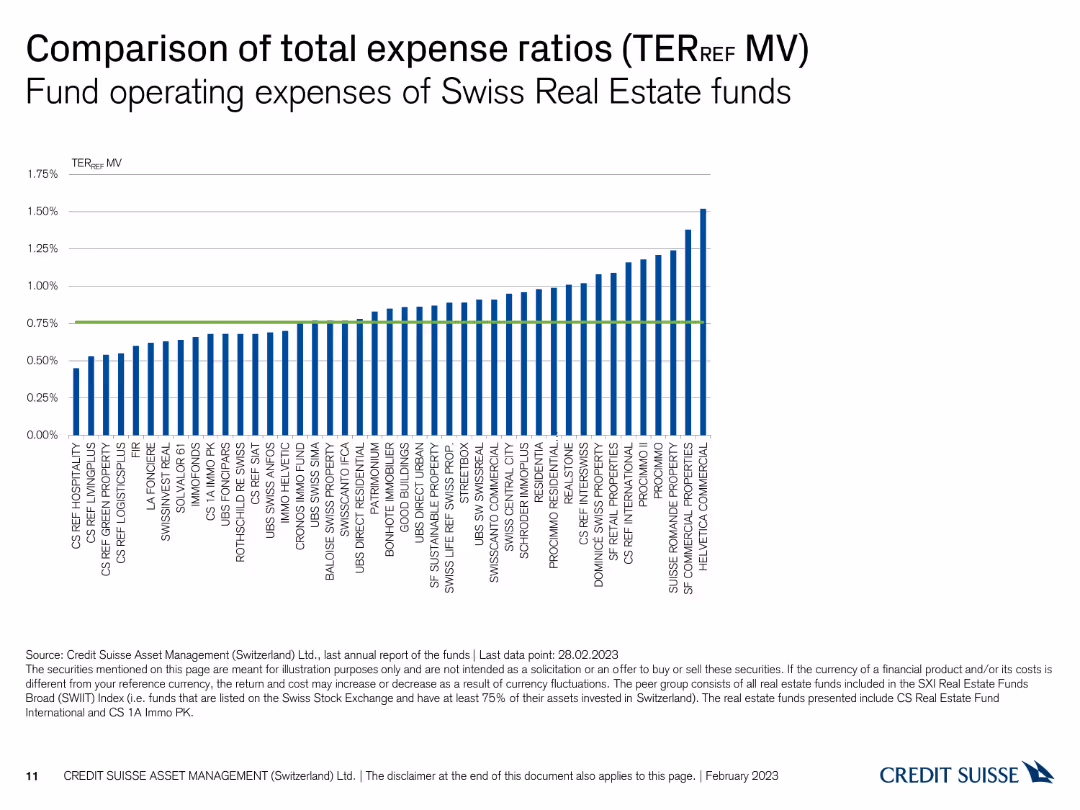
This slide features a column chart illustrating the total expense ratios (TER) for Swiss real estate funds, with vertical bars representing different funds and a green reference line.
Financial Performance
Real Estate & Construction
The slide presents operating expenses for Swiss real estate funds based on TER_REF MV, aiding in cost comparison among various funds. It is useful for performance evaluation and benchmarking.
Real estate, expense ratios, funds, TER, comparison
false
Financial Performance
Real Estate & Construction
Single Chart
Credit Suisse
Add to my slides
Remove from favorites
The slide features two column charts side by side. The left chart displays year-on-year house prices for Australia, Sydney, and Melbourne, while the right chart shows auction clearance rates and house prices as a 3-month moving average. It has a moderate level of visual complexity.
Market Analysis and Trends
Real Estate & Construction
The slide analyzes trends in residential real estate prices in Australia, comparing house prices in Australia, Sydney, and Melbourne over time. It also examines auction clearance rates.
Real estate, house prices, auction rates, Australia, Sydney, Melbourne, trends, data analysis
false
Market Analysis and Trends
Real Estate & Construction
Multiple Chart
JP Morgan
Add to my slides
Remove from favorites
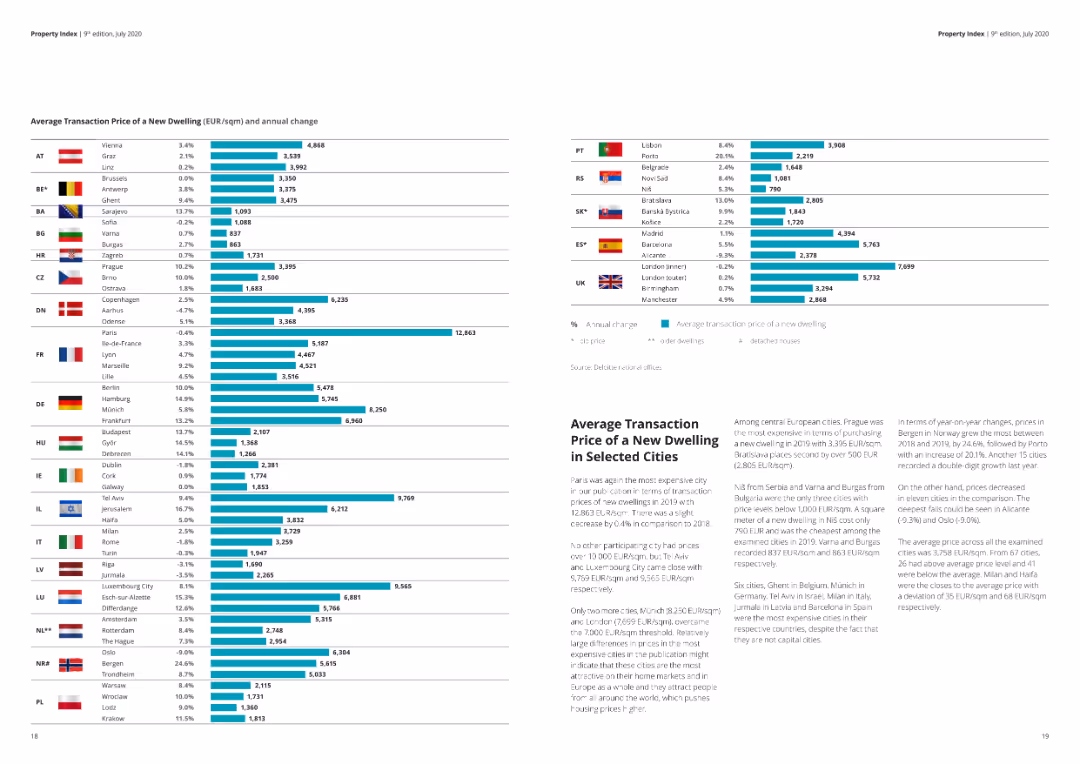
A detailed column chart showing average transaction prices of new dwellings across various cities, including percentage changes.
Market Analysis and Trends
Real Estate & Construction
The slide presents average transaction prices and annual changes for new dwellings in different cities. Useful for market comparison.
Real estate, housing prices, transaction, cities, market analysis, annual change
false
Market Analysis and Trends
Real Estate & Construction
Multiple Chart
Deloitte
Add to my slides
Remove from favorites
The slide features column charts displaying total investments, deal types, and deal sizes within the real estate sector across different quarters. The charts use distinct colors to differentiate quarters.
Market Analysis and Trends
Financial Services
This slide focuses on real estate investments, providing detailed information on total invested amounts, types of deals, and sizes, essential for analyzing real estate investment trends.
Real estate, investments, deal types, deal sizes
false
Market Analysis and Trends
Financial Services
Multiple Chart
EY
Add to my slides
Remove from favorites
Detailed slide with several data blocks and graphs, including data metrics, and textual information.
Technology and Digital Transformation
Financial Services
The slide presents JPMorgan Chase's client solutions, focusing on real estate lending, housing, and payments with specific metrics and capabilities.
Real estate, lending, payments, solutions, client franchise, market opportunity, digital, banking, clients
false
Technology and Digital Transformation
Financial Services
Header Vertical
JP Morgan
Add to my slides
Remove from favorites
This slide contains a column chart depicting the premium or discount of Swiss real estate investment companies, with bars indicating the percentage difference from the average premium.
Financial Performance
Real Estate & Construction
The slide shows the average premium or discount for real estate investment companies, helping to assess market valuation trends. It is useful for investment analysis and valuation.
Real estate, premium, discount, valuation, comparison
false
Financial Performance
Real Estate & Construction
Single Chart
Credit Suisse
Add to my slides
Remove from favorites
This slide features a line chart comparing the historical development of premiums and agios for Swiss real estate investment companies and funds from 2003 to 2023, with two lines in different colors.
Market Analysis and Trends
Real Estate & Construction
The slide tracks the historical trends of premiums and agios for real estate investments, providing insights into market performance over time. It is used for trend analysis and historical comparison.
Real estate, premiums, agios, historical trends, market performance
false
Market Analysis and Trends
Real Estate & Construction
Single Chart
Credit Suisse
Add to my slides
Remove from favorites
A line graph illustrating transaction growth with milestones beneath, detailing the development and integration phases of real-time payments, with text annotations.
Strategic Planning
Financial Services
Used to present the growth and strategic rollout of real-time payment services in the U.S., including key use cases and the acceleration phase, useful for illustrating market adoption and product development strategies.
Real-Time Payments, Growth, Strategy, Integration, U.S. Market
false
Strategic Planning
Financial Services
Mixed Chart
JP Morgan
Add to my slides
Remove from favorites
The slide contains a column chart detailing various reasons for returns, such as incorrect size and fit, unmet quality expectations, and misleading product display.
Market Analysis and Trends
Retail & E-commerce
Presents survey data on the top reasons for returns in the fashion industry, highlighting size and fit issues, quality expectations, and other key factors influencing returns.
Reasons for returns, Size & fit, Quality expectations, Survey data, Fashion industry
false
Market Analysis and Trends
Retail & E-commerce
Mixed Chart
Roland Berger
Add to my slides
Remove from favorites
The slide is a mix of data visualizations including pie charts for recession concerns and views on the economy, and bar graphs for profit expectations and AI use, complemented by descriptive sections.
Operational Efficiency
Financial Services
Summarizes key economic insights from business leaders, covering topics from recession prospects to profit expectations, and the application of AI in business, providing a broad overview of the business climate.
Recession, Economy, Profit, AI, Workforce
false
Operational Efficiency
Financial Services
Multiple Chart
JP Morgan
Add to my slides
Remove from favorites
The slide features a pie chart outlining leaders' expectations for a 2023 recession and colored blocks indicating strategies to mitigate economic downturns.
Risk Assessment and Management
Financial Services
Offers insights into the anticipated economic climate for 2023 with a focus on recession expectation and strategic responses, emphasizing risk management and financial planning.
Recession, Strategy, Risk Management, 2023
false
Risk Assessment and Management
Financial Services
Mixed Chart
JP Morgan
Add to my slides
Remove from favorites
Detailed line graph comparing the decline rates of US GDP across various recessions with projected COVID-19 impacts.
Competitive Landscape
Financial Services
Slide compares current economic downturns with historical recessions, highlighting the severity of COVID-19’s economic impact.
Recessions, GDP, US, COVID-19, Comparison
false
Competitive Landscape
Financial Services
Single Chart
McKinsey
Add to my slides
Remove from favorites
A slide with a bold, purple background containing three key recommendations for marketers to build brand awareness. Each recommendation is supported by an icon and brief text description.
Strategic Planning
Media & Entertainment
This slide provides three key recommendations for marketers to enhance brand awareness: align marketing strategies with KPIs, stay top-of-mind with consumers, and leverage digital channels for long-term engagement and reach.
Recommendations, Marketing, Brand, Awareness, Strategy
false
Strategic Planning
Media & Entertainment
Header Vertical
Nielsen
Add to my slides
Remove from favorites
Four bar chart panels by anatomical segment; growth rates annotated; product list below.
Performance Metrics and KPIs
Healthcare & Pharmaceuticals
Shows double-digit growth in US Shoulder, Hip/Knee, Foot & Ankle, and International segments from 2015–2024e. Lists key contributing products and reinforces strong sustained performance across segments.
Recon, growth, segments, shoulder, hip, foot, ankle, KPIs, products
false
Performance Metrics and KPIs
Healthcare & Pharmaceuticals
Multiple Chart
JP Morgan
Add to my slides
Remove from favorites
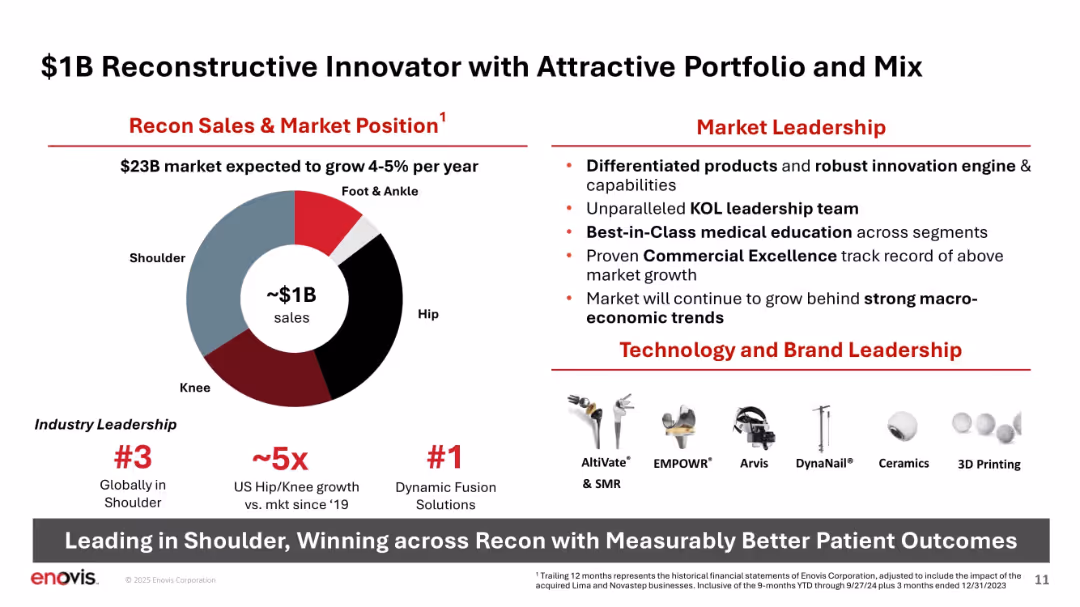
Donut chart for sales distribution; bulleted leadership traits and product visuals; bold typography.
Product and Service Analysis
Healthcare & Pharmaceuticals
Breaks down Recon’s ~$1B sales across anatomical segments (e.g., shoulder, hip), highlights market leadership, differentiated technology, and portfolio strength. Emphasizes innovation and strong competitive position in orthopedic reconstructive.
Recon, portfolio, innovation, sales mix, leadership, shoulder, hip, knee, products
false
Product and Service Analysis
Healthcare & Pharmaceuticals
Mixed Chart
JP Morgan
Add to my slides
Remove from favorites
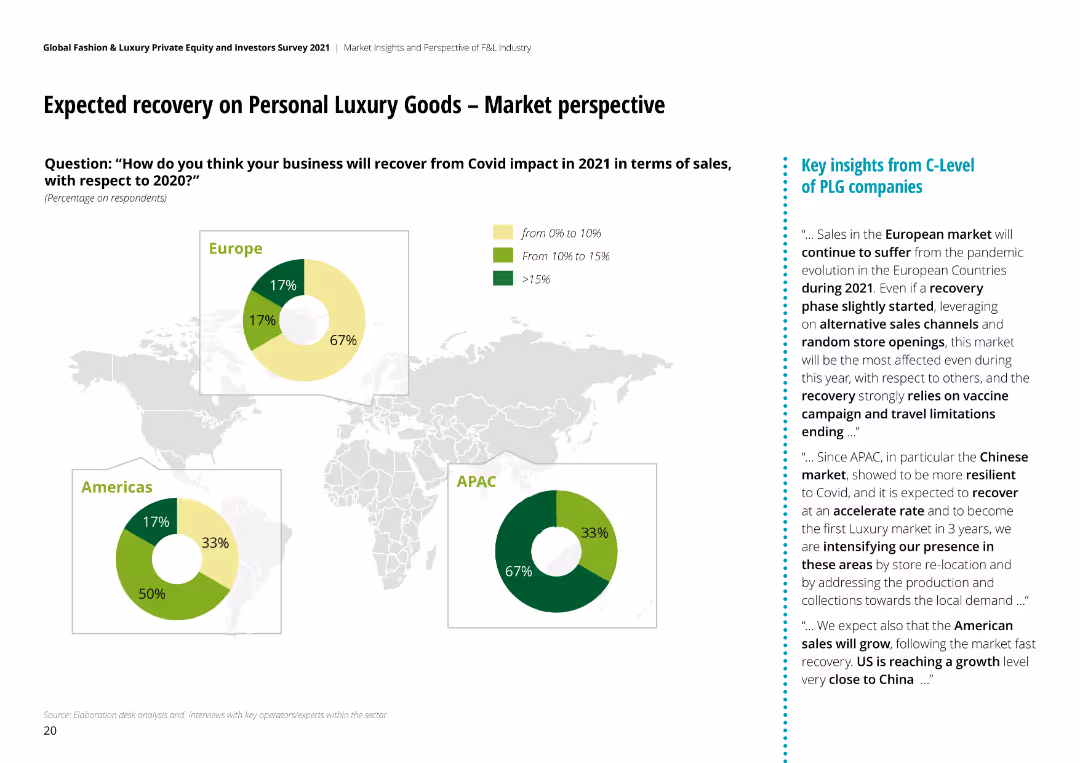
The slide contains a world map with three pie charts representing Europe, Americas, and APAC. Each pie chart shows percentage recovery expectations.
Market Analysis and Trends
Consumer Goods
It discusses the expected recovery of personal luxury goods across different regions, with key insights from C-Level executives highlighted on the right.
Recovery, Luxury Goods, Europe, Americas, APAC, Covid
false
Market Analysis and Trends
Consumer Goods
Multiple Chart
Deloitte
Add to my slides
Remove from favorites
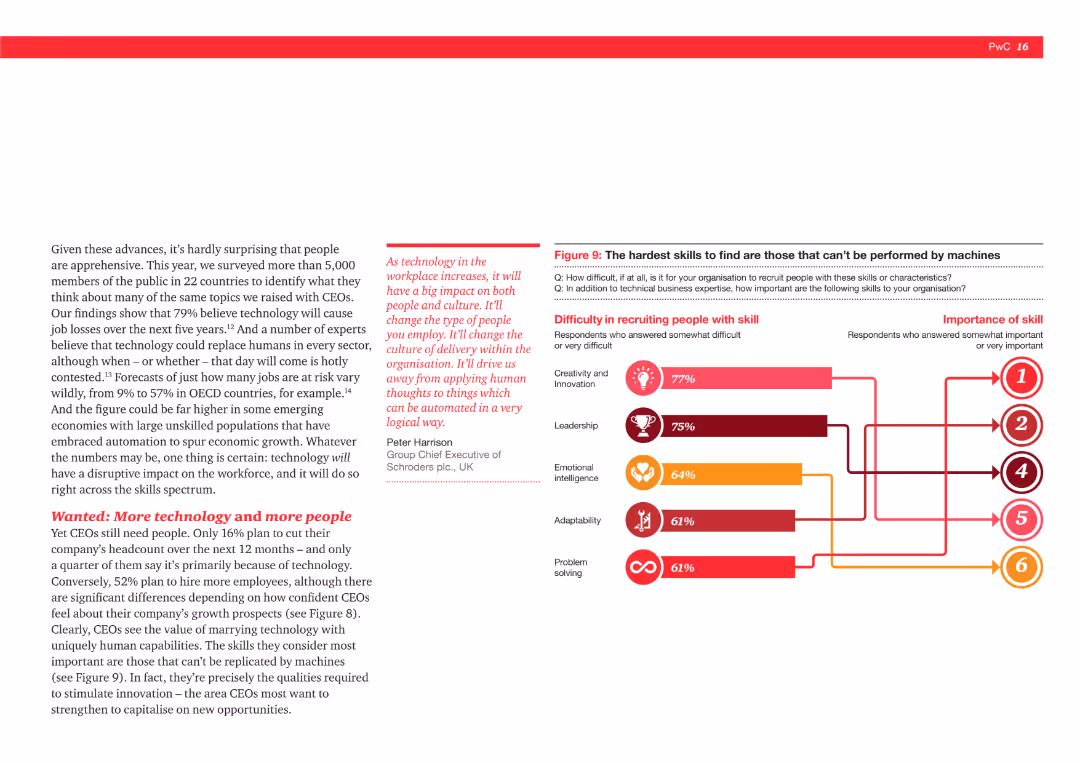
The slide includes a column chart showing the difficulty in recruiting various skills such as creativity (77%), leadership (75%), and emotional intelligence (64%). It also shows the importance of these skills.
Human Resources and Talent Management
Professional Services
This slide addresses the challenges CEOs face in recruiting skills that cannot be automated. It lists creativity, leadership, and emotional intelligence as the most difficult to find, alongside their importance to organizations.
Recruitment, skills, automation, creativity, leadership, emotional intelligence, CEOs, HR challenges
false
Human Resources and Talent Management
Professional Services
Mixed Chart
PwC/Strategy&
Add to my slides
Remove from favorites
Features a column chart illustrating revenue growth from 2015 to 3Q19 and a bar chart showing the targeted deployment of risk-weighted assets.
Financial Performance
Financial Services
The slide focuses on growing recurring management fees, highlighting revenue growth and strategic deployment of risk-weighted assets to enhance financial stability.
Recurring Fees, Management Fees, Revenue Growth, RWA, Financial Stability
false
Financial Performance
Financial Services
Multiple Chart
Credit Suisse
Add to my slides
Remove from favorites
The slide uses a central node labeled "Free Cash Flow" connected to several contributing factors in boxes, indicating drivers and uses of free cash flow.
Financial Performance
Financial Services
The slide explains the business model's impact on free cash flow, highlighting factors like recurring revenue, high renewal rates, and share repurchases.
Recurring Revenue, High Renewal Rates, Contribution Margins, Upfront Invoicing, Low Capital Intensity, Reinvestments for Growth
false
Financial Performance
Financial Services
Diagram
Gartner
Add to my slides
Remove from favorites
The slide presents a column chart with four vertical bars depicting revenue growth over time, from 2017 to a long-term target. The bars are segmented into two parts indicating different revenue sources. To the right, there are three text boxes with additional insights into revenue trends.
Market Analysis and Trends
Financial Services
This slide discusses the growth in recurring revenues, with a focus on management services and revenue goals. It details revenue increases over years, comparison with industry averages, and growth strategy. It’s useful for financial analysts and investors to understand company performance and strategic positioning.
Recurring Revenues, Growth, Management Services, Strategic Goals, CAGR, Competitor Analysis
false
Market Analysis and Trends
Financial Services
Mixed Chart
Goldman Sachs
Add to my slides
Remove from favorites
This slide features a tripartite layout with three content blocks, each with an icon, title, and bullet points describing strategies for increasing recurring revenues. The layout is balanced with equal spacing and a minimalist design.
Strategic Planning
Financial Services
The slide details strategies to increase recurring revenues, focusing on property management business, global corporate services, and investing in predictable businesses. It's aimed at stakeholders interested in understanding and evaluating the company's growth strategies and potential for scaling.
Recurring Revenues, Strategy, Property Management, Global Services, Investment
false
Strategic Planning
Financial Services
Pillar
Goldman Sachs
Add to my slides
Remove from favorites
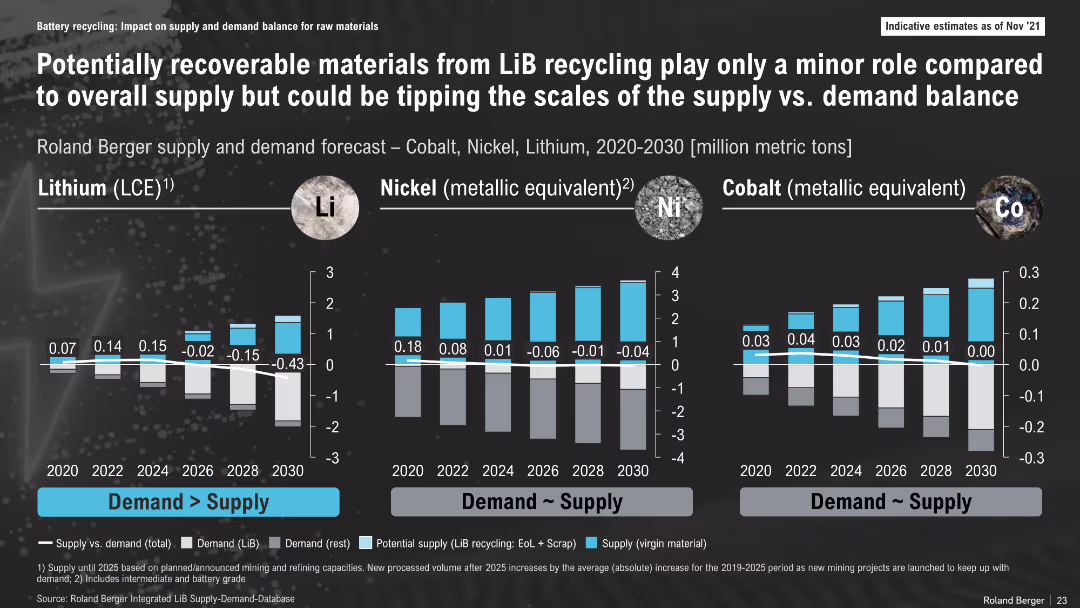
Bar charts for lithium, nickel, and cobalt showing impact of recycled material inclusion in supply forecast; structured similarly to Slide 15391
Risk Assessment and Management
Energy & Utilities
The slide highlights how including recycling contributions narrows the supply-demand gap for critical metals. While still limited in volume, recycled materials can tip the balance toward equilibrium in key markets, notably nickel and cobalt.
Recycling Impact, Supply-Demand, Lithium, Nickel, Cobalt, Battery Recycling, Forecast, Sustainability
false
Risk Assessment and Management
Energy & Utilities
Multiple Chart
Roland Berger
Add to my slides
Remove from favorites
Column chart showing the number of issuances and redemptions, accompanied by a table with details of 9M23 redemptions including ISIN, instrument, and more.
Financial Performance
Financial Services
Details the bond redemptions by UBS in 2023, providing specific data points for financial analysis and performance review.
Redemptions, Bonds, Financial Data, UBS, 2023
false
Financial Performance
Financial Services
Mixed Chart
UBS
Add to my slides
Remove from favorites
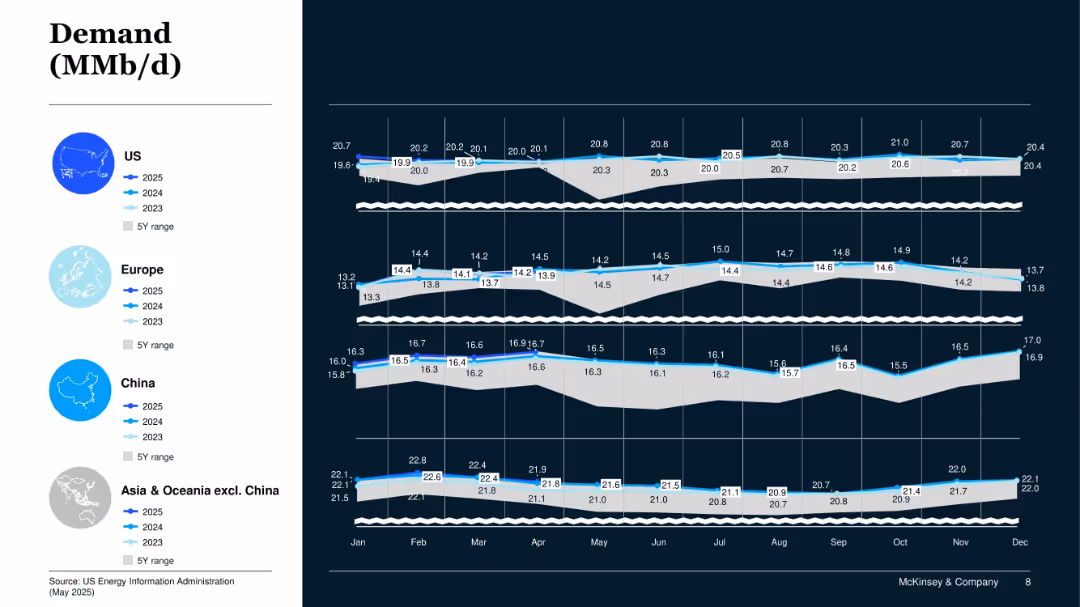
Panel chart with four geographic segments (US, Europe, China, Asia/Oceania excl. China); shows 2023–2025 demand vs 5Y range.
Market Analysis and Trends
Energy & Utilities
This slide provides a geographic breakdown of projected oil demand through 2025, highlighting stronger demand in China and Asia-Pacific, with stability or slight decline in US and Europe.
Regional Demand, Oil Consumption, Asia, Europe, US, 2025 Projections
false
Market Analysis and Trends
Energy & Utilities
Mixed Chart
McKinsey
Add to my slides
Remove from favorites
The slide includes a map of Asia with annotations and percentages indicating market positions and growth. Awards and key strengths are listed on the right side.
Market Analysis and Trends
Financial Services
This slide showcases the company's strong regional footprint in Asia, highlighting market positions, growth percentages, and recent awards, emphasizing strengths in APAC IBCM and PB.
Regional Growth, APAC, Market Position, Awards, Strengths
false
Market Analysis and Trends
Financial Services
Graphic
Credit Suisse
Add to my slides
Remove from favorites
Slide contains colored circles and text to present the growth percentages in luxury goods spending across different regions like China, Asia, and Europe.
Market Analysis and Trends
Retail & E-commerce
Highlights the regional performance in the luxury market with a focus on growth rates in China and other Asian countries compared to Europe and the Americas, stressing regional differences and factors affecting growth.
Regional Growth, Luxury Market, Asia, Europe, Performance
false
Market Analysis and Trends
Retail & E-commerce
Mixed Chart
Bain
Add to my slides
Remove from favorites
The slide features a multi-column table comparing performance metrics across Europe, North America, and South America, with each region highlighted in a different color. There are metrics like RoTE and efficiency ratios with 2019 data and mid-term goals. Icons representing each region add a visual element. The slide uses a combination of red, pink, and light blue, with the Santander logo in the corner and a watermark of the company logo in the background.
Operational Efficiency
Financial Services
This slide compares the bank's operational performance metrics by region and outlines goals for improvement. It's suited for internal strategic discussions or investor presentations to demonstrate operational efficiency and targets in different markets.
Regional Performance, RoTE, Efficiency, Santander, Banking Metrics, Performance Goals, Operational Analysis, Financial Targets
false
Operational Efficiency
Financial Services
Table
Morgan Stanley
Add to my slides
Remove from favorites
This slide contains a set of mini column charts and descriptive statistics detailing the performance of various regions in Asia, Europe, and the Americas.
Market Analysis and Trends
Consumer Goods
Discusses the luxury goods market performance in various regions, emphasizing Asia's growth and challenges in Europe and America due to socio-political issues.
Regional analysis, Asia, Europe, Americas
false
Market Analysis and Trends
Consumer Goods
Mixed Chart
Bain
Add to my slides
Remove from favorites
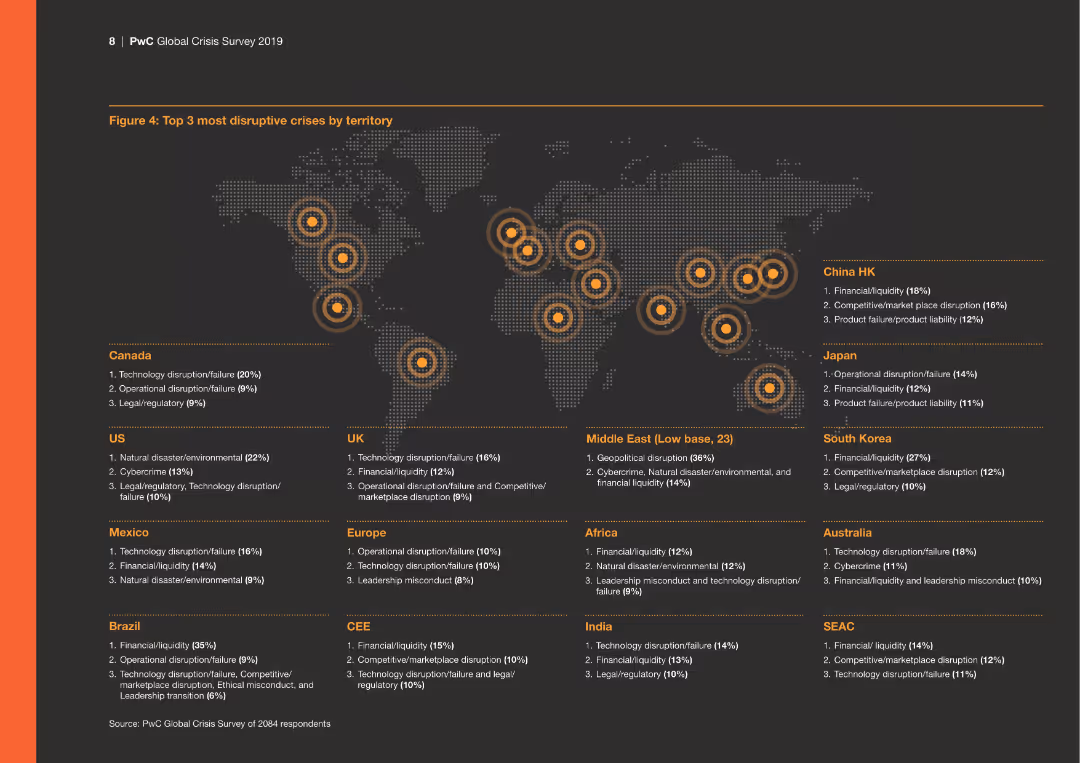
The slide presents a world map with highlighted regions indicating the top three most disruptive crises per territory, with corresponding crisis types listed below the map.
Risk Assessment and Management
Financial Services
This slide provides a regional breakdown of the most disruptive crises, illustrating how different areas are affected by various crisis types such as tech failure and cybercrime.
Regional crises, technology failure, cybercrime, financial, operational
false
Risk Assessment and Management
Financial Services
Graphic
PwC/Strategy&
Add to my slides
Remove from favorites
Map of Denmark, regional highlights, infographic style with icons and color coding.
Regulatory and Compliance
Government & Public Sector
Surveys regional focus on SDGs in Denmark, showing varying priorities such as climate action and economic growth.
Regional strategy, Denmark, SDGs, climate action, economic growth
false
Regulatory and Compliance
Government & Public Sector
Graphic
McKinsey
Add to my slides
Remove from favorites
World map with regions highlighted and metrics on AuM, AuM growth, and PTI growth for different market segments.
Customer and Market Segmentation
Financial Services
Focuses on client proximity strategies to capture regional wealth pools, detailing growth metrics for various emerging and mature markets.
Regional wealth, client proximity, AuM growth, PTI growth, market segments
false
Customer and Market Segmentation
Financial Services
Table
Credit Suisse
Add to my slides
Remove from favorites
A pie chart illustrating the proportion of users who confirmed the registration of crypto trading platforms with provincial regulators before purchasing, in 2023.
Regulatory and Compliance
Financial Services
This slide shows the percentage of users who confirmed if crypto trading platforms were registered before purchase, highlighting awareness and due diligence in 2023.
Registration, crypto, trading, platform, compliance, 2023
false
Regulatory and Compliance
Financial Services
Single Chart
IPSOS
Add to my slides
Remove from favorites
The slide includes a bar chart showing levels of regret among participants who purchased crypto assets, measured on a scale from 1 to 7.
Risk Assessment and Management
Financial Services
This slide analyzes the regret levels of participants who purchased crypto assets, indicating how many regret their decision to varying degrees.
Regret, crypto assets, purchase, sentiment, analysis
false
Risk Assessment and Management
Financial Services
Mixed Chart
IPSOS
Add to my slides
Remove from favorites
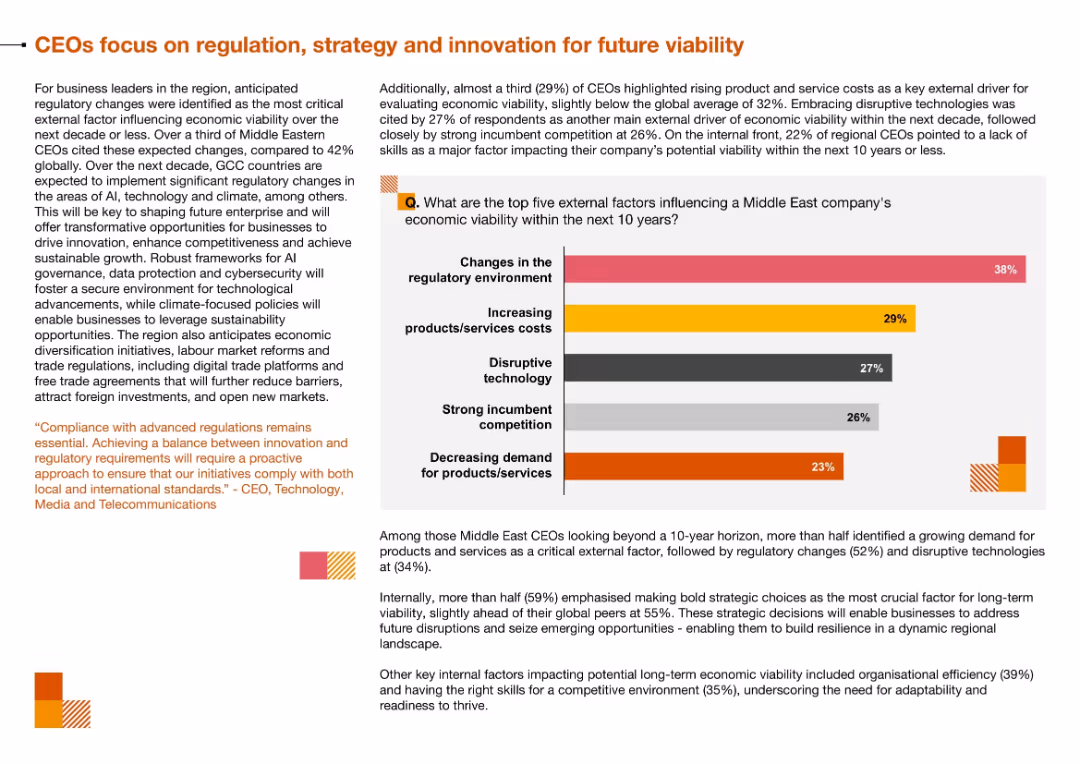
Bar chart of top five external factors influencing viability, with accompanying narrative on right; top section uses orange and gray color palette
Regulatory and Compliance
Technology & Software
The slide identifies the main external challenges facing Middle East businesses—particularly regulatory changes and rising costs—and the internal need to adapt through innovation and strategic decisions.
Regulation, Economic Viability, Disruptive Technology, Strategic Planning, Cost Pressures, Compliance
false
Regulatory and Compliance
Technology & Software
Mixed Chart
PwC/Strategy&
Add to my slides
Remove from favorites
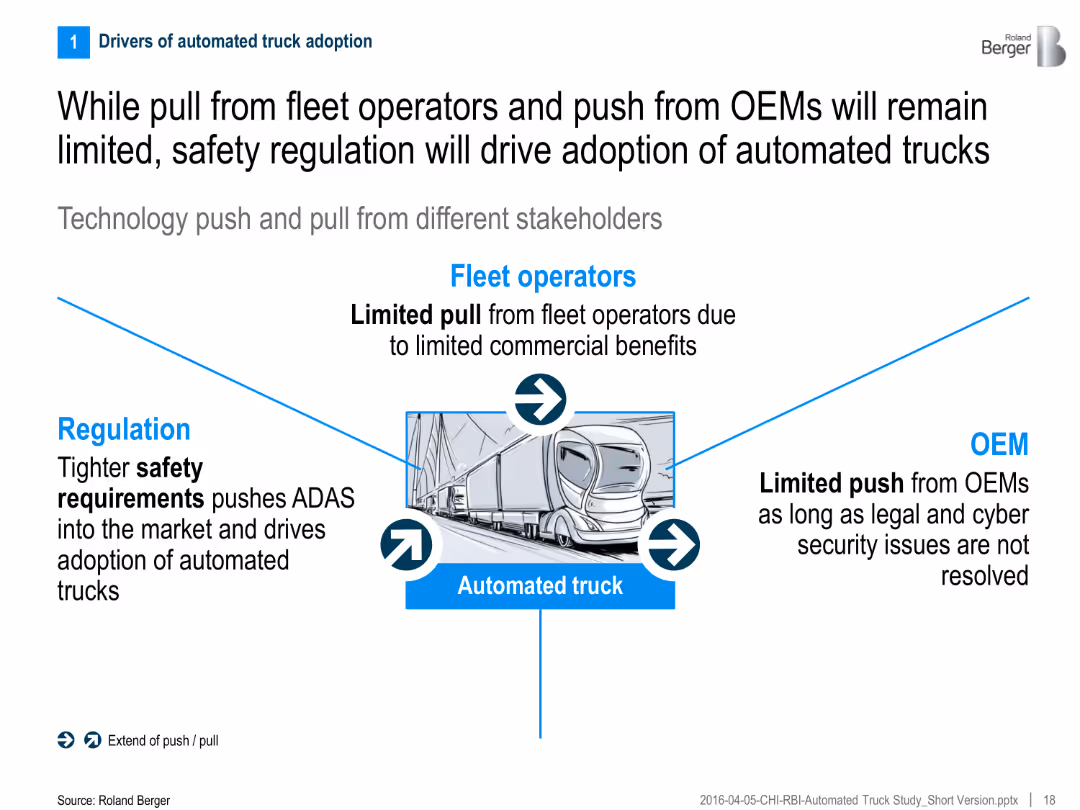
Central graphic showing push/pull from regulation, fleet operators, and OEMs toward automated truck adoption
Regulatory and Compliance
Transportation & Logistics
The slide highlights the limited commercial incentives from fleet operators and OEMs, stressing that regulation—especially safety requirements—is the key driver for automated truck adoption.
Regulation, OEMs, fleet operators, safety, automated trucks, adoption drivers, technology push/pull
false
Regulatory and Compliance
Transportation & Logistics
Linear Flow
Roland Berger
Add to my slides
Remove from favorites
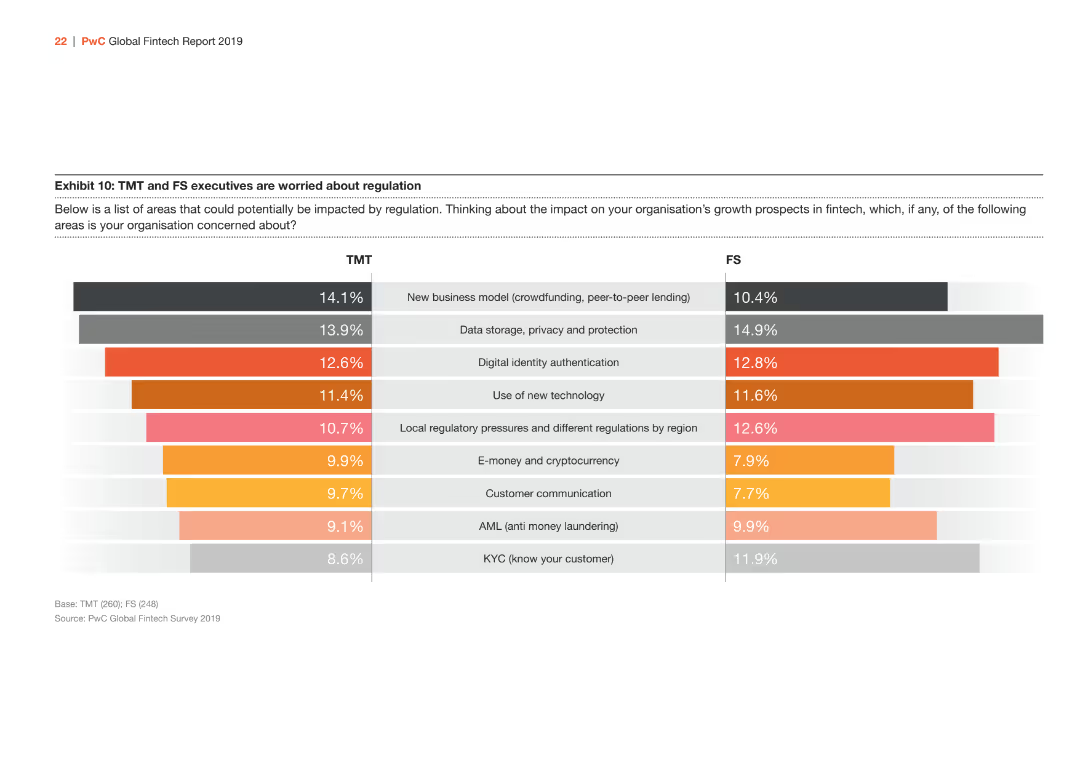
This slide contains a horizontal bar chart (bar chart) that shows regulatory concerns for TMT and FS organizations. Each bar represents a different regulatory concern with varying shades of orange.
Regulatory and Compliance
Financial Services
The slide lists regulatory areas of concern for TMT and FS executives, including data storage, privacy, digital identity authentication, and local regulatory pressures.
Regulation, TMT, FS, Concerns, Data, Privacy
false
Regulatory and Compliance
Financial Services
Multiple Chart
PwC/Strategy&
Add to my slides
Remove from favorites
A more detailed slide featuring three main content sections, each with a distinct icon and bullet points, discussing broad uncertainties affecting Web3 adoption. The design uses a combination of blue, white, and grey.
Risk Assessment and Management
Technology & Software
This slide examines broader uncertainties affecting Web3 adoption, such as evolving regulation, user experience challenges, and ecosystem infrastructure maturity. It's meant to present a critical perspective on Web3's potential impact across various sectors.
Regulation, User Experience, Ecosystem Infrastructure, Web3
false
Risk Assessment and Management
Technology & Software
Boxed
McKinsey
Add to my slides
Remove from favorites
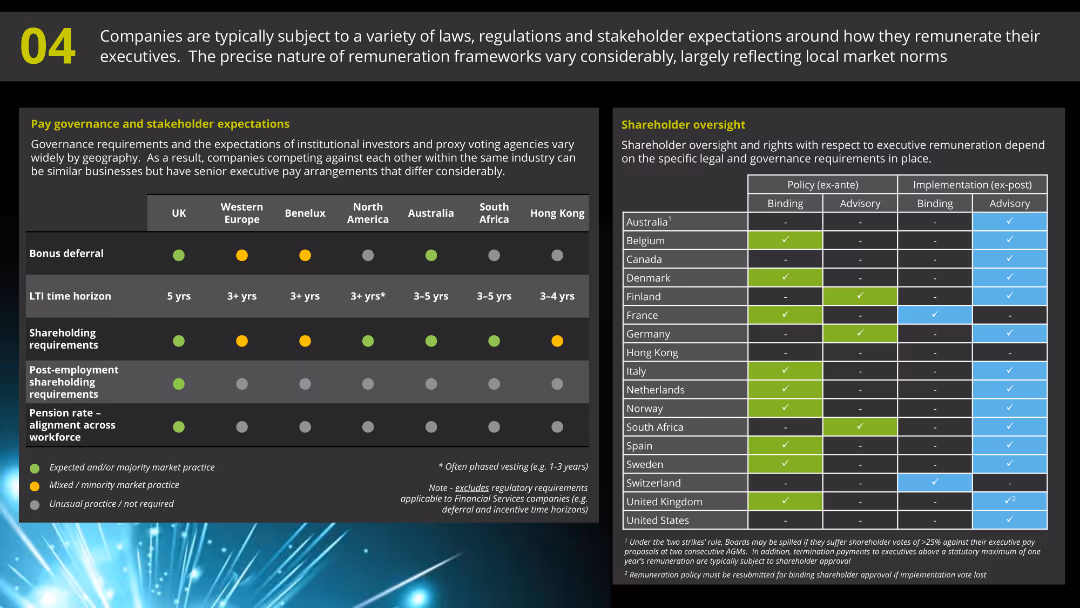
A comparative table on the left showing governance and stakeholder expectations across different regions, and another table on the right detailing shareholder oversight practices in various countries.
Regulatory and Compliance
Financial Services
This slide covers the diversity in laws, regulations, and stakeholder expectations for executive remuneration, and compares shareholder oversight policies and practices in various regions.
Regulations, Governance, Stakeholder, Oversight, Compliance
false
Regulatory and Compliance
Financial Services
Boxed
Deloitte
Add to my slides
Remove from favorites
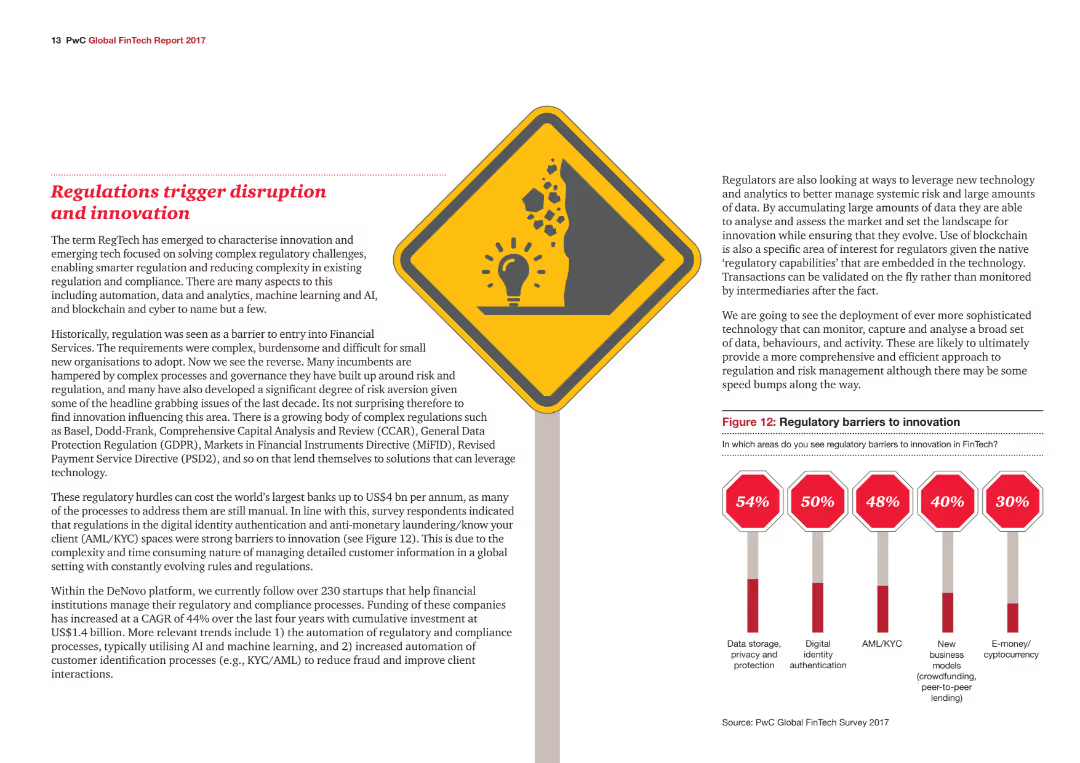
The slide features an icon and a column chart showing the percentage of respondents identifying various regulatory barriers to innovation, with color-coded data points.
Regulatory and Compliance
Financial Services
The slide explains how regulatory challenges in the financial services industry are driving innovation and disruption, focusing on specific regulatory barriers.
Regulations, Innovation, Compliance, Financial Services, Barriers
false
Regulatory and Compliance
Financial Services
Mixed Chart
PwC/Strategy&
Add to my slides
Remove from favorites
This slide includes a series of vertical column chart depicting 'Bank Group Level 2 Ratios', focusing on different financial metrics such as CET1 ratio, Leverage ratio, LCR, and NSFR.
Regulatory and Compliance
Financial Services
Provides a visual representation of Macquarie's regulatory ratios, crucial for assessing the company's compliance with financial regulations and risk management.
Regulatory Ratios, Financial Metrics, Compliance, Risk Management
false
Regulatory and Compliance
Financial Services
Multiple Chart
Morgan Stanley
Add to my slides
Remove from favorites
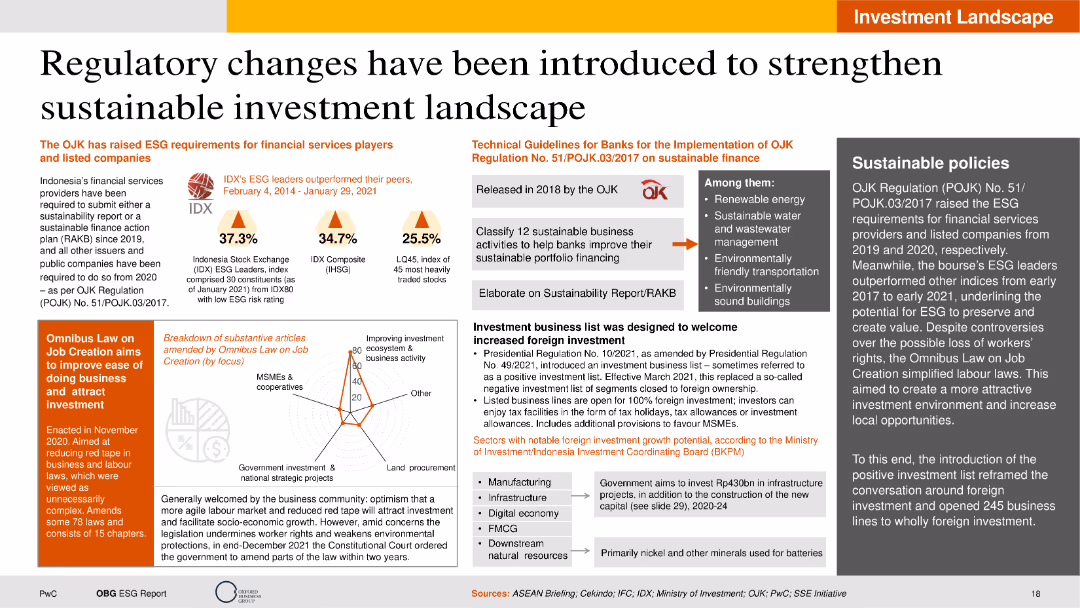
The slide is moderately dense with a combination of text, column charts, icons, and infographics. It has a clear layout featuring sections with distinct background colors for easy distinction. Key metrics are highlighted using column charts.
Regulatory and Compliance
Financial Services
The slide discusses recent regulatory changes in Indonesia aimed at strengthening the sustainable investment landscape. It covers the introduction of ESG requirements, technical guidelines for banks, and the impact of the Omnibus Law on job creation. The slide includes statistical performance data of IDX ESG leaders and highlights key areas for sustainable business activities.
Regulatory changes, ESG requirements, sustainable finance, Omnibus Law, IDX performance
false
Regulatory and Compliance
Financial Services
Mixed Chart
PwC/Strategy&
Add to my slides
Remove from favorites
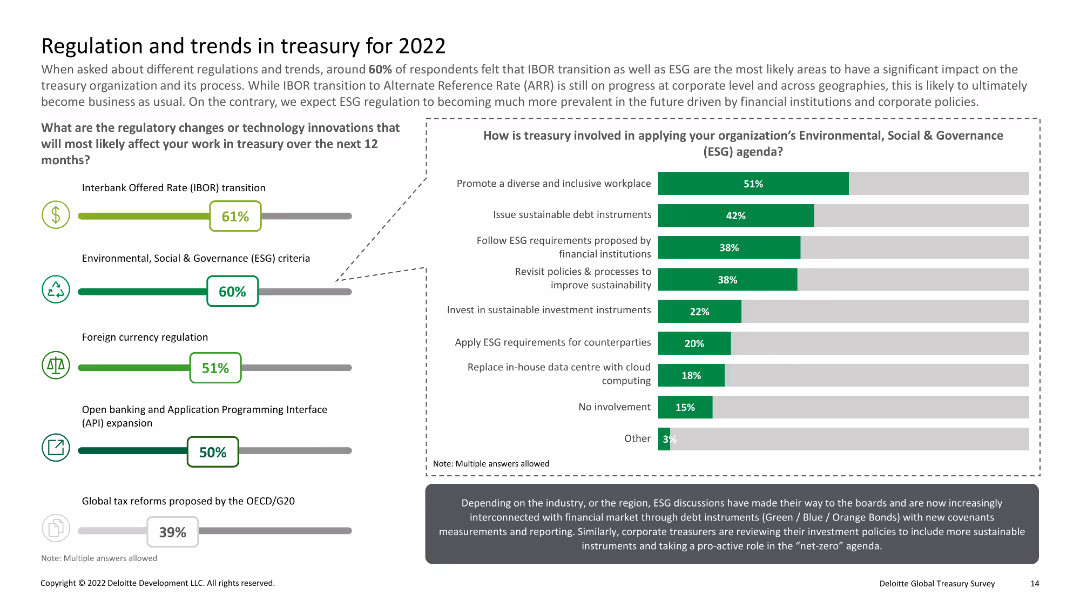
Multiple icons with percentages; column charts detailing involvement in ESG agenda, IBOR transition, etc.
Regulatory and Compliance
Financial Services
Covers regulatory changes and technology innovations affecting treasury work, with a focus on ESG criteria and IBOR transition.
Regulatory changes, ESG, treasury, IBOR, trends
false
Regulatory and Compliance
Financial Services
Multiple Chart
Deloitte
Add to my slides
Remove from favorites
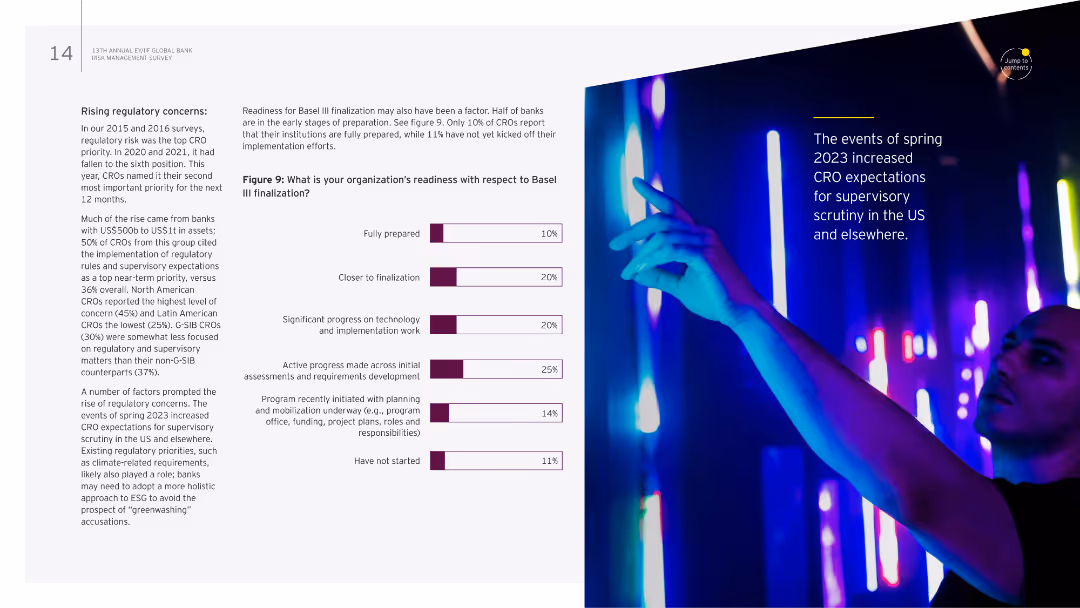
The slide has a textual overview on the left and a column chart on the right. The chart shows readiness levels for Basel III finalization among organizations.
Regulatory and Compliance
Financial Services
It details regulatory concerns, especially the readiness for Basel III finalization, and discusses varying levels of preparedness among institutions.
Regulatory concerns, Basel III, readiness, compliance, risk management
false
Regulatory and Compliance
Financial Services
Mixed Chart
EY
Add to my slides
Remove from favorites
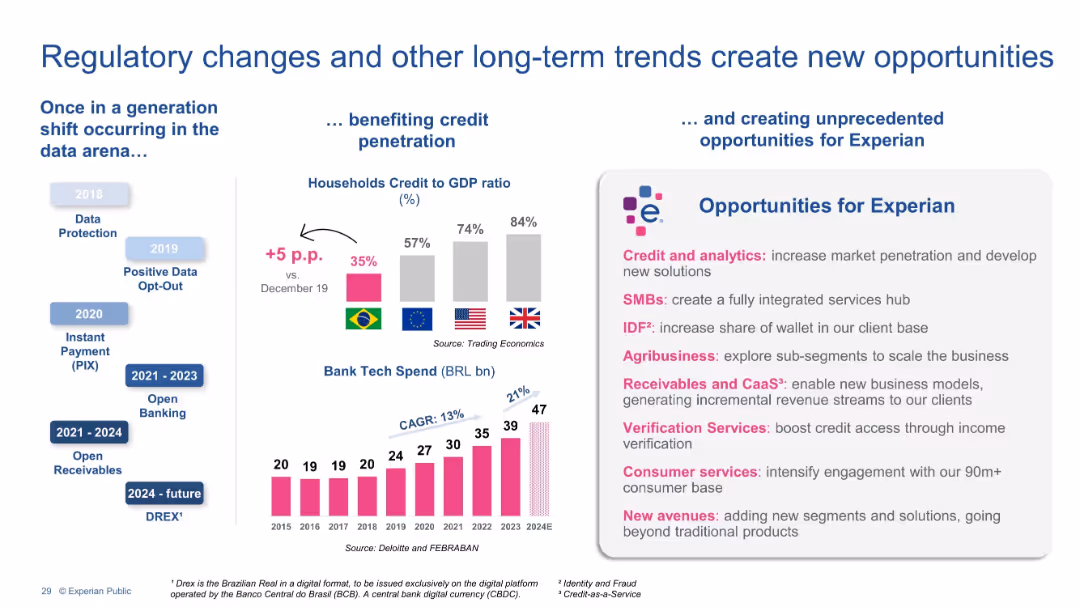
Three-column layout with timelines, bar charts, and opportunity boxes. Left column shows historical regulatory changes, center presents credit-to-GDP comparisons and bank tech spend, and right highlights opportunities for Experian.
Strategic Planning
Financial Services
This slide highlights how regulatory shifts (e.g., PIX, Open Banking) and global credit penetration trends are driving opportunities for Experian. It outlines specific growth areas including credit analytics, SMBs, agribusiness, and verification services, positioning Experian to benefit from evolving financial infrastructure.
Regulatory trends, Credit penetration, Experian, Fintech, Open Banking, Bank tech spend, Opportunities, Credit analytics, SMB, Agribusiness
false
Strategic Planning
Financial Services
Multiple Chart
Barclays
Add to my slides
Remove from favorites
Timeline showing upcoming sustainability regulations and directives from 2023 to 2024.
Regulatory and Compliance
Consumer Goods
Outlines the increasing regulatory pressures on brands to accelerate sustainability efforts, detailing key regulations.
Regulatory, Sustainability, Compliance, Brands, Pressure
false
Regulatory and Compliance
Consumer Goods
Vertical Flow
Kearney
Add to my slides
Remove from favorites
A laptop screen displaying a dashboard with a pie chart and list of financial data, mostly in white and gray colors.
Financial Performance
Financial Services
The slide demonstrates a workbench for relationship managers, showcasing client information, asset allocation, and portfolio details.
Relationship manager, dashboard, financial data, pie chart, portfolio
false
Financial Performance
Financial Services
Mixed Chart
Credit Suisse
Add to my slides
Remove from favorites
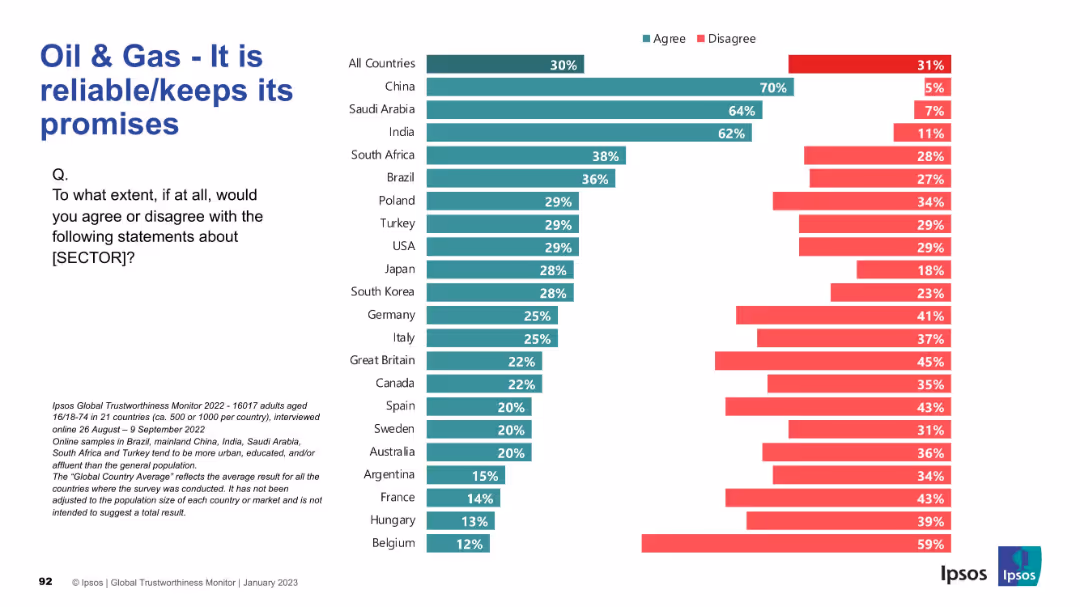
Horizontal stacked bar chart by country with left-side “agree” percentages and right-side “disagree”. Title and question placed top left.
Market Analysis and Trends
Energy & Utilities
This slide assesses the sector's reliability and its ability to keep promises. China, Saudi Arabia, and India again show high agreement. Western countries remain more critical, with low trust in promises from oil & gas companies.
Reliability, Promises, Trust, Oil & Gas Sector, Global Opinions, Ipsos Survey, Accountability, Market Perception, Country Trends
false
Market Analysis and Trends
Energy & Utilities
Mixed Chart
IPSOS
Add to my slides
Remove from favorites
This slide has moderate visual complexity with two pie charts showing employee relocation resistance to specific regions. The design incorporates a clear layout for the text and charts, using color coding to differentiate responses by gender.
Human Resources and Talent Management
Professional Services
This slide discusses how global mobility leaders often face challenges aligning company growth destinations with employee preferences. It emphasizes the need for targeted action plans to address location barriers, particularly in areas less favored by employees, and to support female mobility to these locations.
Relocation challenges, Employee preferences, Geographical barriers, Action plans
false
Human Resources and Talent Management
Professional Services
Multiple Chart
PwC/Strategy&
Add to my slides
Remove from favorites
The slide includes text boxes comparing consulting, testing/analytics, and remediation services with icons and demand outlook descriptions.
Market Analysis and Trends
Environmental Services & Sustainability
It discusses the potential delays in remediation projects due to temporary job access while highlighting stable demand in consulting services.
Remediation, consulting, analytics, project delays, demand, services, engagement cycles, temporary job
false
Market Analysis and Trends
Environmental Services & Sustainability
Table
LEK
Add to my slides
Remove from favorites
Slide compares remote work policies before and during COVID-19 through a column chart and bar graph detailing city-specific work-from-home statistics.
Organizational Structure and Change
Professional Services
Reviews the transition to remote work across various cities, indicating a significant increase in work-from-home adoption due to COVID-19, with comparative insights on employee distribution.
Remote Work, COVID-19, Work From Home, Cities, Transition
false
Organizational Structure and Change
Professional Services
Multiple Chart
McKinsey
Add to my slides
Remove from favorites
Includes a timeline-like graphic showing the varying levels of satisfaction with remote work over time, alongside an image of a working mother.
Human Resources and Talent Management
Professional Services
Explores evolving challenges in remote work environments, from initial struggles to finding successful strategies for managing remote teams, emphasizing the need for adaptability in remote policies.
Remote Work, Challenges, Adaptability, Work Environment, Strategies
false
Human Resources and Talent Management
Professional Services
Linear Flow
McKinsey
Add to my slides
Remove from favorites
A column chart comparing pre and post-COVID percentages of remote working time per employee, highlighting expected changes in remote work patterns.
Human Resources and Talent Management
Real Estate & Construction
The slide shows the expected increase in remote work time per employee post-COVID, indicating a shift towards more flexible work arrangements.
Remote Work, Flexibility, Post-COVID, Work Patterns, Employee Trends
false
Human Resources and Talent Management
Real Estate & Construction
Multiple Chart
EY
Add to my slides
Remove from favorites
A pie chart showing desired remote work frequency post-COVID-19. A column chart compares pre and post-COVID remote work preferences for different days per week.
Human Resources and Talent Management
Real Estate & Construction
This slide illustrates employees' preferences for remote work post-COVID-19, indicating a desire for flexibility between remote and on-site work.
Remote Work, Flexibility, Preferences, Post-COVID, Strategy
false
Human Resources and Talent Management
Real Estate & Construction
Multiple Chart
EY
Add to my slides
Remove from favorites
Two pie charts comparing percentages. One for 'Some of the Time' at 57.5% and another for 'All the Time' at 48.7%. Each pie chart is half and half styled, with symbols representing office buildings and a house respectively.
Customer and Market Segmentation
Professional Services
The slide shows the distribution of marketing professionals working remotely, either part-time or full-time, as surveyed in September 2022. It highlights the significant portion of the workforce that operates from home, showing a major shift in work environments.
Remote Work, Marketing, Telecommuting, Survey, Pie Chart, Workforce Distribution, 2022
false
Customer and Market Segmentation
Professional Services
Multiple Chart
Deloitte
Add to my slides
Remove from favorites
This slide displays a bar chart with horizontal bars illustrating survey responses about remote working preferences among Millennials and Gen Z. The bars are color-coded for each group, accompanied by explanatory text on the left.
Market Analysis and Trends
Professional Services
The slide highlights survey findings on the growing preference for remote work among Millennials and Gen Z, with detailed insights into their views on work-life balance, productivity, and the desire to continue remote work post-pandemic. It provides valuable data for employers planning future work arrangements.
Remote Work, Millennials, Gen Z, Work-Life Balance, Survey
false
Market Analysis and Trends
Professional Services
Multiple Chart
Deloitte
Add to my slides
Remove from favorites
A column chart comparing pre and post-COVID percentages of employees working remotely across different timeframes.
Human Resources and Talent Management
Technology & Software
This slide highlights survey results indicating that a significant portion of employees are expected to work remotely most of the time post-COVID-19.
Remote Work, Post-COVID, Workforce, Survey, Employee Expectations
false
Human Resources and Talent Management
Technology & Software
Multiple Chart
EY
Add to my slides
Remove from favorites
The slide includes screenshots of digital platforms and a pictogram representing remote advice. It's balanced with text on one side and images on the other, with a blue and white color theme.
Strategic Planning
Financial Services
Introduces a remote advice channel for mass-affluent clients, highlighting the human-led, digitally-enabled advisory services. It's designed to showcase a new digital strategy for offering low-cost advice to clients preferring digital engagement, highlighting its flexible and affordable platform.
Remote advice, Digital platform, Mass-affluent, Low-cost, Human-led
false
Strategic Planning
Financial Services
Graphic
JP Morgan
Add to my slides
Remove from favorites
Column charts showing work frequency patterns before, during, and after Covid-19
Human Resources and Talent Management
Professional Services
Analyzes changes in remote work patterns among respondents, comparing pre and post-Covid trends
Remote work, Covid-19, work patterns, survey, EY
false
Human Resources and Talent Management
Professional Services
Multiple Chart
EY
Add to my slides
Remove from favorites
A slide with a mixture of bullet points and charts, focusing on the inefficiencies of remote work. It includes sub-sections with icons and a bar graph comparing productivity decay in different site complexities.
Operational Efficiency
Professional Services
Examines the challenges of work-from-home setups, focusing on structural, people, process, and technology inefficiencies. Offers insights for HR departments and managers overseeing remote teams.
Remote work, Efficiency, Team cohesion, Productivity, Organizational structure
false
Operational Efficiency
Professional Services
Mixed Chart
McKinsey
Add to my slides
Remove from favorites
Includes comparative lists and diagrams outlining remote work evolution and strategies, color-coded for clarity between past and future strategies, with emphasis on technology integration and policy development.
Technology and Digital Transformation
Professional Services
Explores the evolution of smart work practices pre- and post-crisis, examining how organizations can adapt to remote working for improved safety, productivity, and cost efficiency, with a focus on technology and policy enhancements.
Remote work, Technology integration, Work policy, Productivity, Cost efficiency
false
Technology and Digital Transformation
Professional Services
Mixed Chart
BCG
Add to my slides
Remove from favorites
This slide features a horizontal bar chart with data points representing the biggest challenges while working remotely. It is cleanly designed with blue bars on a white background.
Market Analysis and Trends
Professional Services
The slide presents survey data on the main challenges faced by remote workers, such as loneliness, interruptions, and communication issues. It is used for understanding remote work difficulties.
Remote work, challenges, survey, communication, productivity
false
Market Analysis and Trends
Professional Services
Mixed Chart
Deloitte
Add to my slides
Remove from favorites
Circular diagram with multiple sections around a central concept of remote work, highlighting different aspects like tax compliance, data technology, and workforce strategies.
Strategic Planning
Professional Services
This slide outlines the cross-functional nature of remote work, touching on corporate tax, employment law, data/technology, regulatory considerations, and workforce strategies, emphasizing the need for a coordinated approach.
Remote work, compliance, technology, workforce, strategy
false
Strategic Planning
Professional Services
Diagram
Deloitte
Add to my slides
Remove from favorites
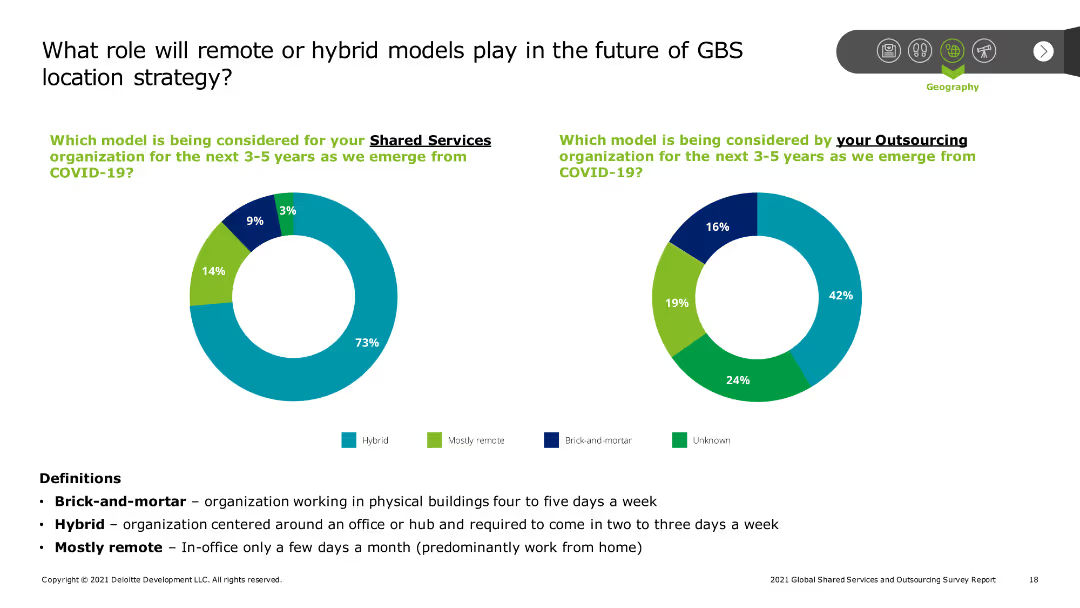
This slide presents two pie charts comparing models considered for shared services and outsourcing organizations post-COVID-19, including hybrid, remote, and brick-and-mortar models. Text provides definitions and key points.
Technology and Digital Transformation
Professional Services
The slide explores the role of remote or hybrid work models in the future of GBS location strategy, showing the distribution of preferred models for shared services and outsourcing organizations.
Remote work, hybrid models, GBS, location strategy, post-COVID-19
false
Technology and Digital Transformation
Professional Services
Multiple Chart
Deloitte
Add to my slides
Remove from favorites
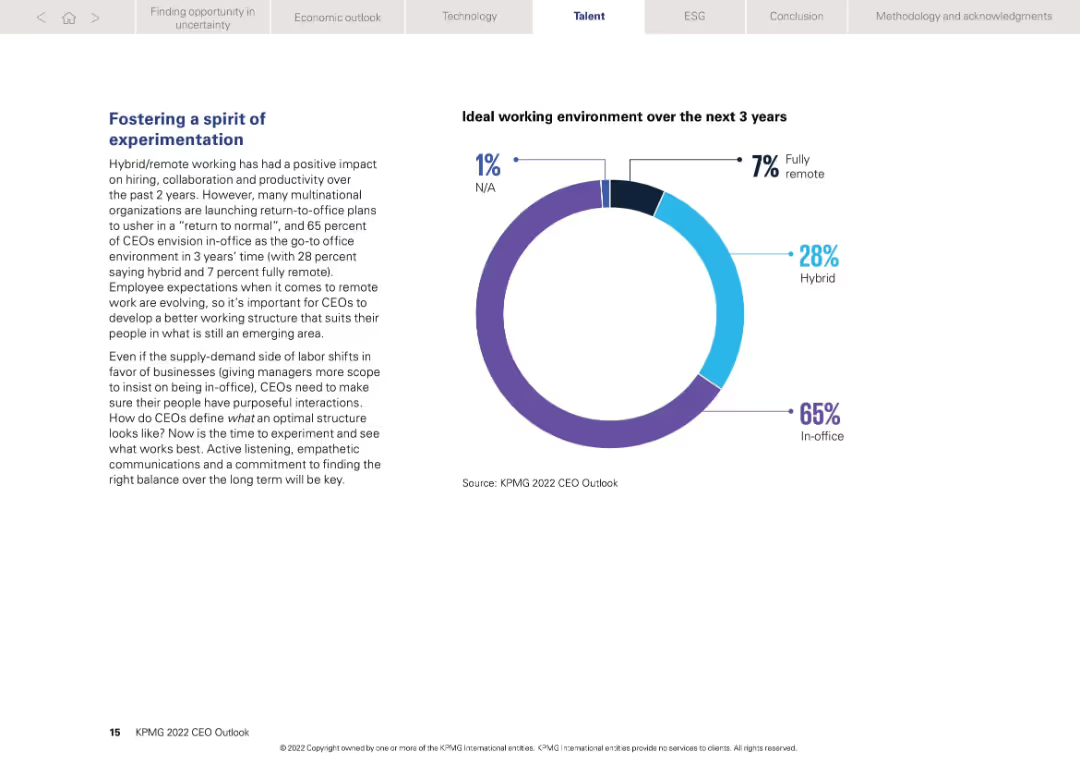
Left-aligned narrative with a donut chart on right showing preferred work models over 3 years
Human Resources and Talent Management
Professional Services
Discusses post-pandemic work structure evolution. 65% of CEOs expect return to in-office setup, while 28% favor hybrid. Only 7% foresee fully remote work. The slide promotes experimentation in leadership style and structure to suit future employee expectations.
Remote work, hybrid, in-office, employee structure, experimentation
false
Human Resources and Talent Management
Professional Services
Mixed Chart
KPMG
Add to my slides
Remove from favorites
Comparative slide with three columns detailing managing remote work requests, assessing compliance risks, and approval/documentation processes, with simple icons and text.
Risk Assessment and Management
Professional Services
This slide focuses on tracking and managing employee and employer risk and compliance related to remote work, outlining methods for managing requests, assessing risks, and handling approvals.
Remote work, risk assessment, compliance, management, approval
false
Risk Assessment and Management
Professional Services
Linear Flow
Deloitte
Add to my slides
Remove from favorites
Diagram with multiple icons representing different remote work scenarios, each described below with brief points in colored boxes.
Human Resources and Talent Management
Professional Services
This slide outlines various remote work scenarios, including domestic and international options for existing employees and new hires, emphasizing features and challenges of each scenario.
Remote work, scenarios, domestic, international, challenges
false
Human Resources and Talent Management
Professional Services
Pillar
Deloitte
Add to my slides
Remove from favorites
Diagram showing a flow from immediate actions to long-term strategy, with icons and descriptions for each stage and related tools.
Strategic Planning
Professional Services
This slide presents a strategy for remote work, from immediate actions to long-term planning, including identifying worker locations, managing compliance, developing frameworks, and continual improvement.
Remote work, strategy, compliance, governance, planning
false
Strategic Planning
Professional Services
Table
Deloitte
Add to my slides
Remove from favorites
Diagram slide with three sections (employee request, compliance assessment, outcomes and results), each with icons and text describing the process.
Risk Assessment and Management
Professional Services
This slide elaborates on leveraging technology to manage and automate requests, risk assessments, and outcomes for remote work, highlighting objectives, activities, and tools used in each stage.
Remote work, technology, automation, risk assessment, outcomes
false
Risk Assessment and Management
Professional Services
Header Horizontal
Deloitte
Add to my slides
Remove from favorites
Two line charts comparing CEO remuneration opportunities at target and maximum performance across various countries, emphasizing the significant outlier status of the US in terms of total compensation.
Market Analysis and Trends
Financial Services
The slide illustrates the variation in CEO remuneration opportunities across different countries, showing that the US has significantly higher levels compared to other regions.
Remuneration, Geography, CEO, Performance, Compensation
false
Market Analysis and Trends
Financial Services
Multiple Chart
Deloitte
Add to my slides
Remove from favorites
Comprises a column chart depicting 'Economic benefits of Copernicus through its contribution to renewable energy monitoring' and a series of diagram depicting benefits for end and intermediate users.
Financial Performance
Energy & Utilities
Details the economic and environmental benefits derived from utilizing Copernicus data in the renewable energy sector, highlighting increased profitability and reduced GHG emissions.
Renewable Energy, Copernicus, Benefits
false
Financial Performance
Energy & Utilities
Mixed Chart
PwC/Strategy&
Add to my slides
Remove from favorites
The slide displays a column chart on 'Copernicus economic impact (2018)' for renewable energy, a list of key Copernicus products, and a small text section.
Technology and Digital Transformation
Energy & Utilities
Focuses on how Copernicus data supports the renewable energy sector, including the use of raw data for improving energy forecasts and planning. Highlights economic impacts and opportunities for growth within the sector.
Renewable Energy, Copernicus, Economic Impact
false
Technology and Digital Transformation
Energy & Utilities
Mixed Chart
PwC/Strategy&
Add to my slides
Remove from favorites
This slide includes a horizontal bar chart comparing the levelized cost of new-build renewable energy sources to the marginal cost of existing conventional generation technologies.
Market Analysis and Trends
Energy & Utilities
The slide contrasts the levelized cost of energy for new renewable energy projects against the marginal cost of existing conventional technologies, showcasing competitiveness and economic viability.
Renewable Energy, Marginal Cost, Comparison, LCOE, Conventional Technologies
false
Market Analysis and Trends
Energy & Utilities
Single Chart
Roland Berger
Add to my slides
Remove from favorites
Includes several column charts related to renewable energy consumption in EU member states, CO2 emissions, and a large text section discussing the role of renewable energy in EU energy targets.
Market Analysis and Trends
Energy & Utilities
Explores the expansion of renewable energy within the EU, noting specific contributions to energy targets and environmental benefits. Discusses the integration of solar and wind power into the energy mix and the impact on CO2 emissions.
Renewable Energy, Market Growth, EU
false
Market Analysis and Trends
Energy & Utilities
Multiple Chart
PwC/Strategy&
Add to my slides
Remove from favorites
This slide contains a bar graph displaying the historical and projected global power generation mix. It uses a color-coded legend to differentiate between renewable and non-renewable sources.
Strategic Planning
Energy & Utilities
The slide emphasizes the growing share of renewables in the power generation mix, projecting that by 2050, 80-90% of power will be from renewable sources, which is vital for strategic energy transition planning.
Renewable Energy, Power Generation, Global Trends, 2050 Projection, Energy Mix, Strategic Planning
false
Strategic Planning
Energy & Utilities
Mixed Chart
McKinsey
Add to my slides
Remove from favorites
The slide includes a column chart illustrating the transition to renewable energy on farms and electric vehicles. It provides detailed descriptions of included actions and example initiatives.
Technology and Digital Transformation
Agriculture & Food Production
This slide outlines the transition to renewable energy and electric vehicles in agriculture. It highlights the adoption of renewable energy on farms, the transition to electric vehicles, and their impact on emissions reduction and cost savings.
Renewable energy, Electric vehicles, Agriculture, Emissions, Cost savings
false
Technology and Digital Transformation
Agriculture & Food Production
Mixed Chart
EY
Add to my slides
Remove from favorites
Slide with multiple data tables and a large, detailed graphic of renewable energy symbols. Blue-toned, clean layout, with graphs displaying renewable energy capacity in MW.
Industry Overview
Energy & Utilities
Shows the status of renewable energy sources in the Philippines, including hydro, geothermal, solar, wind, and biomass, comparing capacity and projects in development.
Renewable energy, Philippines, capacity, hydro, solar, geothermal, biomass, wind, projects
false
Industry Overview
Energy & Utilities
Table
Deloitte
Add to my slides
Remove from favorites
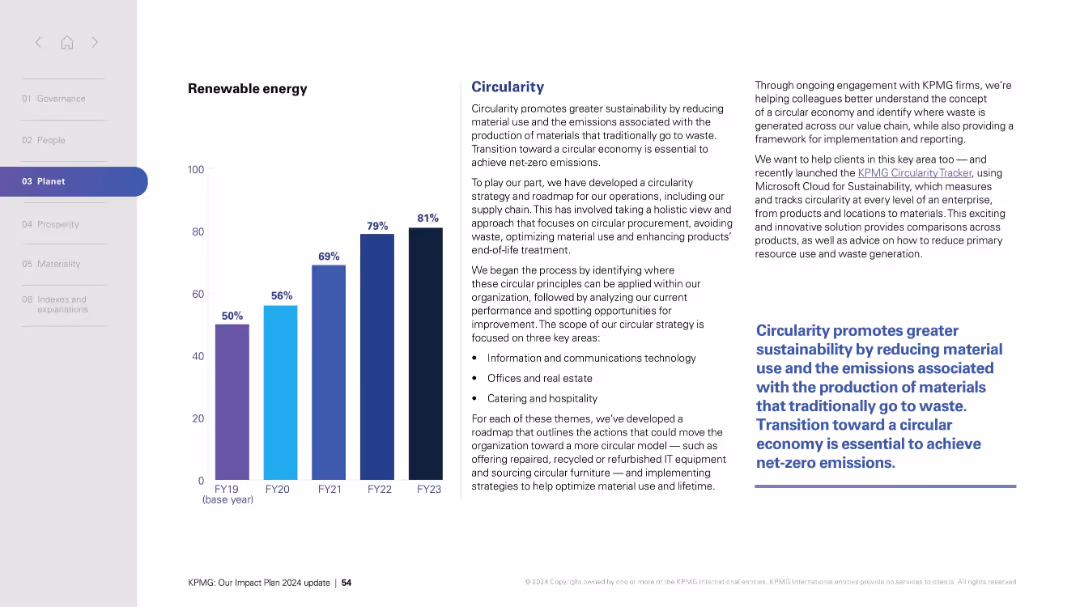
Split layout: left side with vertical bar chart (FY19–FY23), right side with text blocks and a bold quote.
Technology and Digital Transformation
Professional Services
Highlights progress in renewable energy usage across fiscal years and details a circularity strategy aimed at sustainability. The text explains how the organization is adopting circular economy principles by reducing material use, managing waste, and promoting sustainable procurement across various operations. It also mentions a tool (Circularity Tracker) that aids in tracking these efforts.
Renewable energy, sustainability, circularity, emissions, supply chain, procurement, technology, KPMG, net-zero, operations
false
Technology and Digital Transformation
Professional Services
Mixed Chart
KPMG
Add to my slides
Remove from favorites
Column chart showing energy capacity additions from 2017 to 2022 with categories for different energy sources.
Market Analysis and Trends
Energy & Utilities
Details the increase in power generation capacity over the past 5 years, driven by renewable sources.
Renewable, Energy, Capacity, Growth, Sources
false
Market Analysis and Trends
Energy & Utilities
Mixed Chart
Kearney
Add to my slides
Remove from favorites
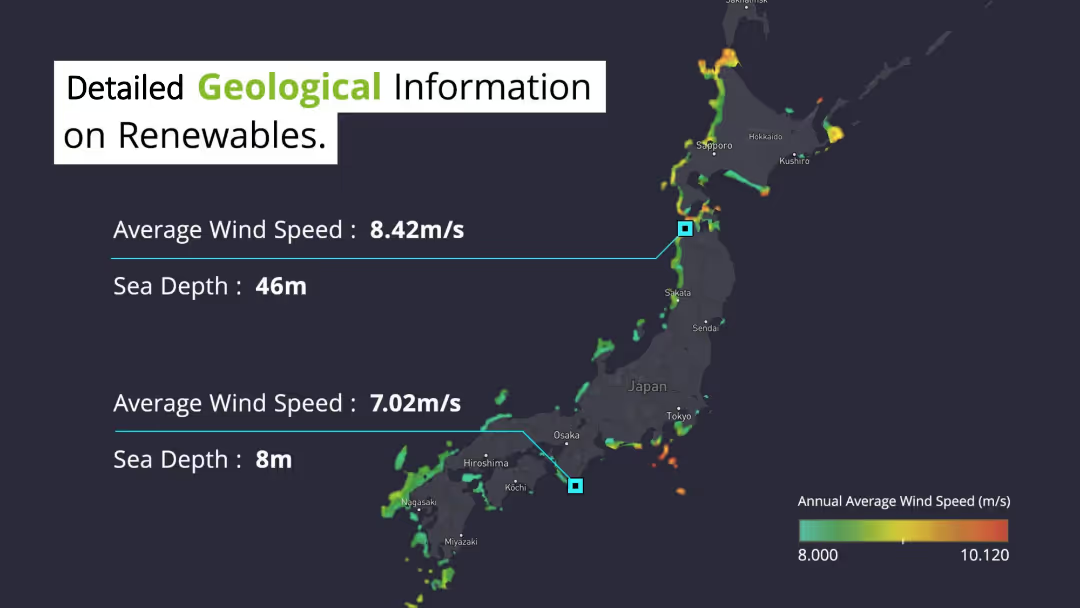
Displays a map of Japan with highlighted areas showing average wind speeds and sea depths. Text on the left and center provides specific wind speed and sea depth data for two locations. The dark background map contrasts with highlighted data points and textual information.
Market Analysis and Trends
Environmental Services & Sustainability
Shares detailed geological data on renewable energy potential in Japan, focusing on average wind speeds and sea depths in various regions. This information is crucial for planning and optimizing renewable energy projects, particularly offshore wind farms.
Renewable, Wind Speed, Sea Depth, Japan, Geological
false
Market Analysis and Trends
Environmental Services & Sustainability
Graphic
Deloitte
Add to my slides
Remove from favorites
The slide includes a column chart showing the change in global electricity generation mix (TWh) from 2022 to 2050, with projections for Coal, Gas, Solar, Wind, Hydro, Nuclear, and Others. It also has a textual highlight indicating a fivefold increase in renewable capacity by 2050.
Market Analysis and Trends
Energy & Utilities
The slide projects that renewables will dominate global energy generation by 2050, highlighting the significant growth in solar and wind power. It provides a detailed forecast of the shift from nonrenewable to renewable energy sources over the next few decades.
Renewables, Energy, Generation, Global, Forecast, 2050, Solar, Wind
false
Market Analysis and Trends
Energy & Utilities
Mixed Chart
EY
Add to my slides
Remove from favorites
Previous
Next
You don't have any favorites yet.
Please wait loading your favorites slides...
Create a FREE account to continue browsing
Receive Instant Access to 1,000+ slides from companies like McKinsey, Google, and Goldman Sachs
First Name
Last Name
Email
Password
I agree to all
Terms & Privacy Policy
Thank you! Your submission has been received!
Oops! Something went wrong while submitting the form.
Have an account?
Sign in
Upgrade to PRO to Save slides
Advanced Search and Filters
Access to 15,000+ slides
Access to Category Pages
Save/Bookmark Slides
PowerPoint Template Library
Pick a Plan
MONTHLY
$12/month
Billed every month, Cancel anytime.
YEARLY
$9/year
Billed $108 annually, Cancel anytime.
Checkout for $12/month
Checkout for $108/yr
Secured by Stripe | AES-256 bit encryption