My Account
My Slides
Search by Category
Pricing
Templates
View All Templates
Download Template Slides
✦ AI Search
Feedback
Login
Logout
Get Started
Browse all Slides
Browse all Slides
Create a FREE Account
Instant access to 1,000+ real slides from top companies like McKinsey, BCG, Goldman Sachs, Google and many more!
First Name
Last Name
Email
Password
I agree to all
Terms & Privacy Policy
Thank you! Your submission has been received!
Oops! Something went wrong while submitting the form.
Have an account?
Sign in
Saved Slides
Total No. of slides saved
0
↻ Refresh
✖ Clear all
The slide features a line chart comparing the share of nonrenewables and renewables in global power generation from 2000 to 2050. Additional information about accelerators and risks associated with this transition is provided on the side.
Market Analysis and Trends
Energy & Utilities
This slide highlights the increasing share of renewable energy in global power generation, predicting that by 2050, renewables will surpass nonrenewables significantly. It also discusses various factors that will accelerate or hinder this transition.
Renewables, Power, Generation, Transition, Forecast, Accelerators, Risks
false
Market Analysis and Trends
Energy & Utilities
Mixed Chart
EY
Add to my slides
Remove from favorites
Features line charts comparing mobility and spending trends in states that reopened early versus late during the pandemic.
Risk Assessment and Management
Transportation & Logistics
Highlights the impact of early versus late reopening on state mobility and spending, suggesting greater variability in spending with earlier reopening schedules.
Reopening, Mobility, Spending, COVID-19, Variability
false
Risk Assessment and Management
Transportation & Logistics
Multiple Chart
McKinsey
Add to my slides
Remove from favorites
Shows a bar chart with sources used for research before purchasing crypto assets, including friends, media, and advisors.
Market Analysis and Trends
Financial Services
The slide outlines the main sources Canadians rely on for researching crypto assets, such as friends, social media, financial press, and advisors, highlighting the varying reliance on these sources across different demographics.
Research sources, crypto assets, Canadians
false
Market Analysis and Trends
Financial Services
Multiple Chart
IPSOS
Add to my slides
Remove from favorites
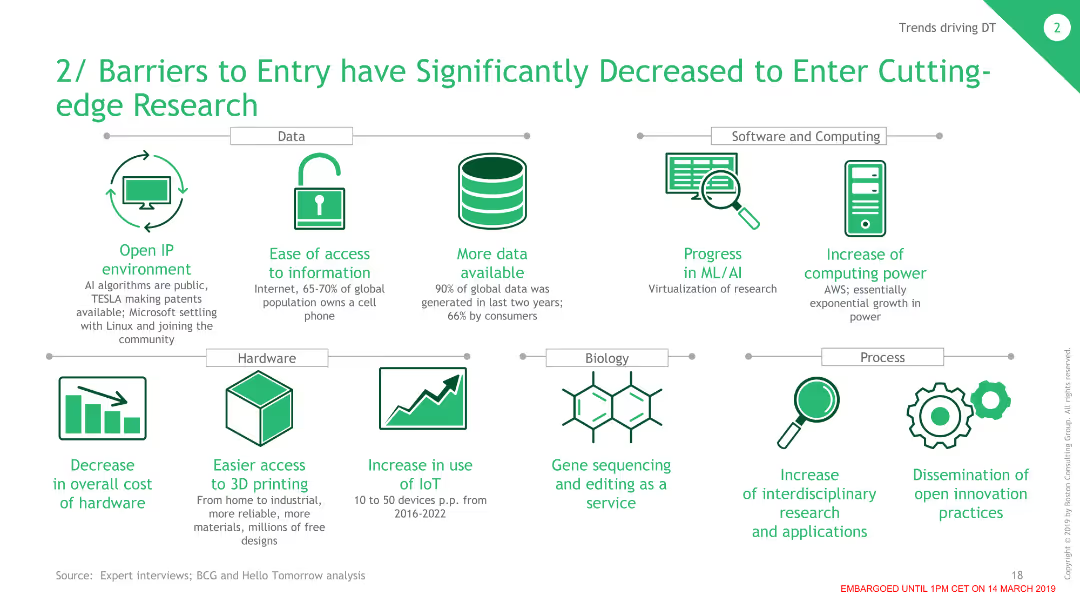
The slide features multiple icons and short texts arranged in three rows, each representing different aspects such as data, hardware, and process that have reduced barriers to entry in research.
Regulatory and Compliance
Technology & Software
This slide discusses the various factors that have lowered the barriers to entry in cutting-edge research, including open IP environments, increased access to information, and more affordable hardware.
Research, Barriers, Data, Hardware, Innovation
false
Regulatory and Compliance
Technology & Software
Header Vertical
BCG
Add to my slides
Remove from favorites
The slide includes pie charts representing industry distribution, job levels, and organizational sizes among research participants in Ukraine. The design is clean with well-labeled sections for clarity.
Market Analysis and Trends
Professional Services
This slide provides demographic and market analysis data of research participants in Ukraine, breaking down their distribution across various industries, job levels, and organizational sizes. It offers insights into the sample's composition, useful for contextualizing the study’s findings within specific sectors and job roles.
Research, Demographics, Ukraine, Industry, Job Levels
false
Market Analysis and Trends
Professional Services
Multiple Chart
Deloitte
Add to my slides
Remove from favorites
This slide includes circular graphics representing different research areas, accompanied by brief descriptions, numerical data, and background images. The layout is spacious and organized.
Industry Overview
Professional Services
It showcases the breadth of McKinsey's research via their Global Institute, highlighting key areas of focus like growth and competition, financial markets, consumer behavior, and technology. It emphasizes McKinsey's contribution to thought leadership in various sectors.
Research, Economics, McKinsey Global Institute, Consumer Behavior, Technology, Sustainability
false
Industry Overview
Professional Services
Diagram
McKinsey
Add to my slides
Remove from favorites
The slide has a basic visual complexity, displaying textual information about the contents of a research report, along with icons representing different themes covered. The layout is straightforward, with a clear focus on the textual message and a simple graphic element to the side.
Human Resources and Talent Management
Professional Services
This slide serves as a summary and call-to-action, inviting viewers to explore a report that covers gender-inclusive mobility and provides insights and case studies on the topic. It's aimed at encouraging further exploration into organizational practices and the experiences of female role models in international assignments.
Research, Gender inclusivity, Case studies, Organizational practices
false
Human Resources and Talent Management
Professional Services
Boxed
PwC/Strategy&
Add to my slides
Remove from favorites
This slide features pie charts showing the distribution of research participants globally across different industries and job levels. The layout is straightforward, focusing on the data.
Market Analysis and Trends
Professional Services
This slide details the demographic and market analysis of global research participants, categorizing them by industry, job level, and organizational size. It provides a comprehensive view of the participant pool, aiding in understanding the global scope of the research and its relevance across different sectors and professional standings.
Research, Global, Demographics, Industry, Job Levels
false
Market Analysis and Trends
Professional Services
Multiple Chart
Deloitte
Add to my slides
Remove from favorites
This slide includes a table with various metrics and two line charts showing contract value and quarterly net contract value increase.
Market Analysis and Trends
Technology & Software
It presents detailed research metrics, including contract value, net contract value increase, productivity, and client enterprises statistics.
Research, Metrics, Contract Value, Productivity, Client Enterprises, Net Increase
false
Market Analysis and Trends
Technology & Software
Multiple Chart
Gartner
Add to my slides
Remove from favorites
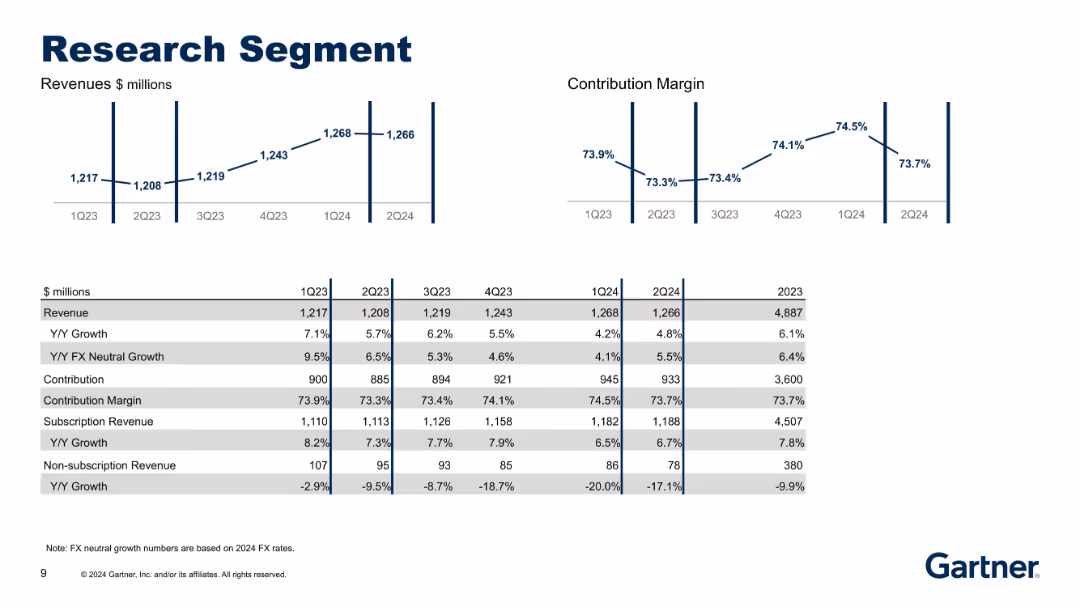
Charts showing revenue and contribution margins above a detailed table. Table includes growth metrics and breakdown into subscription categories.
Performance Metrics and KPIs
Technology & Software
Provides updated data for the Research segment through 2Q24. Tracks sustained subscription growth and contraction in non-subscription revenue, alongside steady contribution margins and FX-neutral growth.
Research, Revenue, Contribution Margin, Subscription, FX Growth
false
Performance Metrics and KPIs
Technology & Software
Multiple Chart
Gartner
Add to my slides
Remove from favorites
The slide combines a table and two line charts to show revenue and contribution margin trends over several quarters.
Market Analysis and Trends
Technology & Software
It details the performance of the research segment, including revenue, growth rates, contribution margins, and subscription revenue trends.
Research, Revenue, Contribution Margin, Subscription, Non-subscription, Growth
false
Market Analysis and Trends
Technology & Software
Multiple Chart
Gartner
Add to my slides
Remove from favorites
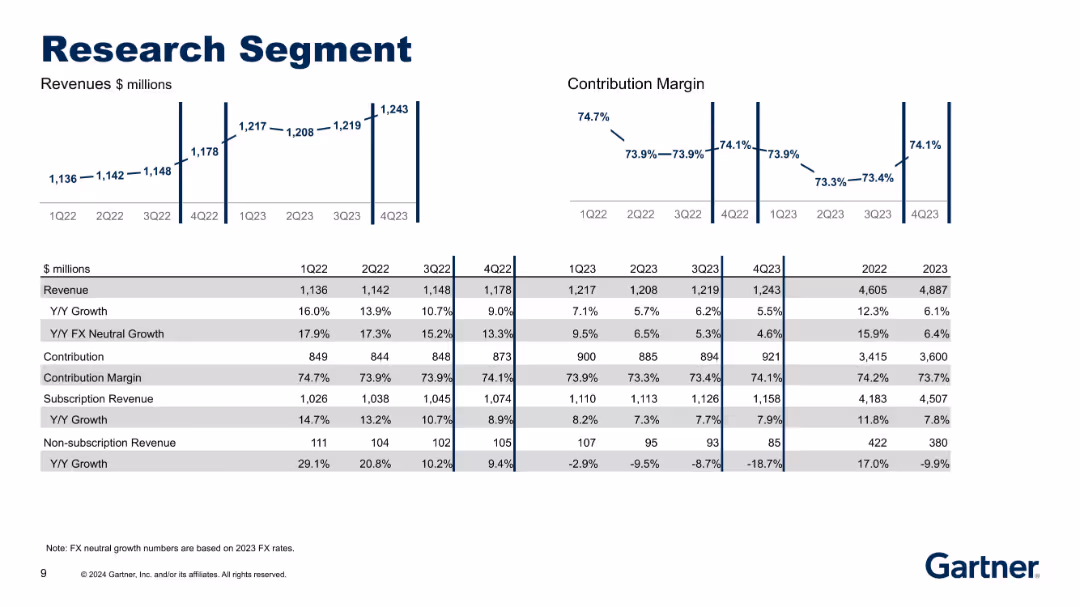
Bar and line charts with tabular financial data; left side features revenue metrics while the right shows contribution margin trends.
Performance Metrics and KPIs
Technology & Software
This slide breaks down the Research segment's quarterly and yearly revenue, contribution, and margin metrics from 1Q22 to 4Q23. It highlights stable growth in subscription revenues with declining non-subscription revenue and presents FX-neutral metrics.
Research, Revenue, Contribution, FX Neutral Growth, Subscription
false
Performance Metrics and KPIs
Technology & Software
Multiple Chart
Gartner
Add to my slides
Remove from favorites
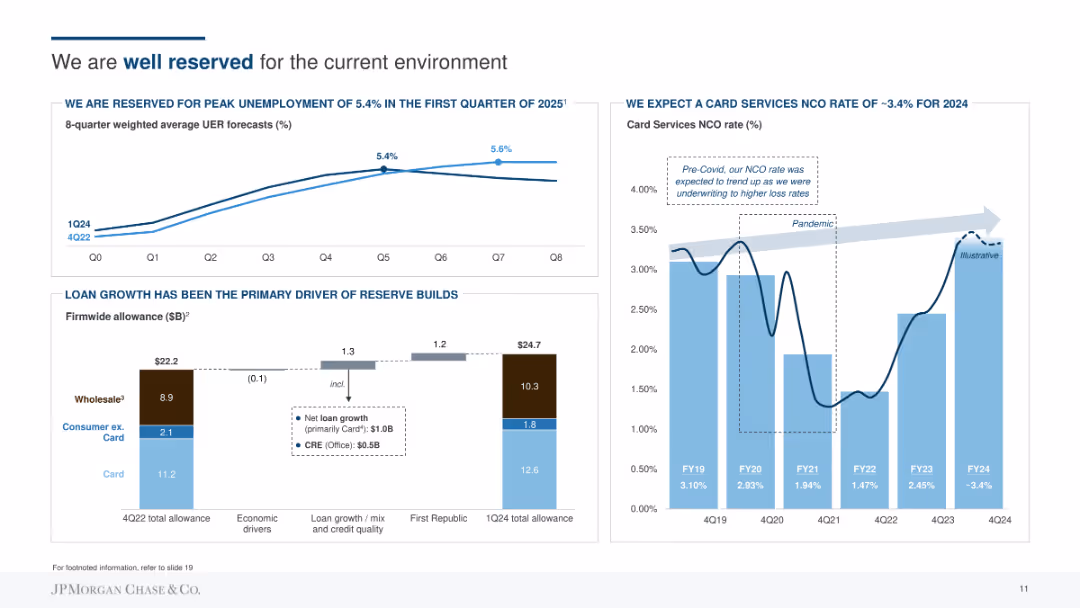
Combination of line chart showing unemployment rate forecasts, column chart for loan growth, and bar chart for card services NCO rate. Uses blue and gray tones to differentiate data sets.
Risk Assessment and Management
Financial Services
Discusses JP Morgan's preparedness for economic conditions, including expected peak unemployment, loan growth driving reserve builds, and projected card services NCO rate for 2024.
Reserve, Unemployment, Loan, Growth, Card, Economic, Forecast
false
Risk Assessment and Management
Financial Services
Multiple Chart
JP Morgan
Add to my slides
Remove from favorites
Slide features a column chart and annotations about reserve releases' impacts on Lloyd's financial health across segments.
Regulatory and Compliance
Financial Services
Explores the increase in reserve releases at Lloyd's, its impact by segment, and implications for financial stability and regulatory compliance.
Reserves, Financial, Compliance, Trends, Increase
false
Regulatory and Compliance
Financial Services
Mixed Chart
PwC/Strategy&
Add to my slides
Remove from favorites
Slide includes bar graphs showing a decrease in reserve strength and increased numbers of firms with "no margin".
Risk Assessment and Management
Financial Services
Discusses the declining margin within reserves at Lloyd's, emphasizing the potential risks and future implications for reserve releases and financial stability.
Reserves, Margin, Decline, Financial, Risk
false
Risk Assessment and Management
Financial Services
Mixed Chart
PwC/Strategy&
Add to my slides
Remove from favorites
The slide contains multiple text boxes with headers and bullet points, contrasting 'Talent resignation' and 'Talent retrenchment', and providing key considerations for the company on the right.
Human Resources and Talent Management
Professional Services
This slide compares different aspects of talent retention and exit, including resignation and retrenchment, and outlines the company's imperatives in managing these situations. It serves as an informational slide for management and HR professionals.
Resignation, Retrenchment, Talent Management, Company Strategy
false
Human Resources and Talent Management
Professional Services
Header Vertical
Kearney
Add to my slides
Remove from favorites
Text heavy with definitions of financial strength and resilience dimensions in bullet points paired with a column chart.
Operational Efficiency
Professional Services
Describes the construction of a resilience index using company metrics across multiple dimensions like financial health and sustainability.
Resilience index, financial health, sustainability, metrics, operational efficiency
false
Operational Efficiency
Professional Services
Mixed Chart
Accenture
Add to my slides
Remove from favorites
This slide features column charts comparing resilience levels across different industries such as Utilities, Consumer Products, etc., marked with lines indicating quartiles.
Market Analysis and Trends
Financial Services
The slide presents Bain Resilience Index benchmarks for various industries, illustrating the variance in resilience among Nordic non-financial companies.
Resilience, Nordic companies, Industry comparison, Benchmarking, Utilities, Consumer Products, Technology, Healthcare
false
Market Analysis and Trends
Financial Services
Single Chart
Bain
Add to my slides
Remove from favorites
The slide has a dark background with column charts showing data on platform adopters' resilience
Strategic Planning
Financial Services
It discusses how platform adopters are more resilient than non-platform companies with relevant data
Resilience, Platform Strategy, Finance, Technology, Supply Chain
false
Strategic Planning
Financial Services
Multiple Chart
Accenture
Add to my slides
Remove from favorites
Features a bold title, a line graph comparing 'Resilients' and 'Non-Resilients', and bulleted text explaining the key takeaways.
Strategic Planning
Professional Services
Highlights the importance of speed and discipline for companies during economic downturns, as evidenced by performance metrics.
Resilience, speed, discipline, economic downturn, performance metrics
false
Strategic Planning
Professional Services
Mixed Chart
McKinsey
Add to my slides
Remove from favorites
This slide showcases a close-up image of a wet umbrella, with annotations highlighting potential business challenges like Earnings miss, Liquidity crunch, etc.
Strategic Planning
Professional Services
Focuses on defining strategic goals for business resilience, enumerating critical challenges that businesses might face under stress.
Resiliency, Business challenges, Strategic planning, Liquidity, Bankruptcy
false
Strategic Planning
Professional Services
Linear Flow
Bain
Add to my slides
Remove from favorites
Includes a bar chart comparing current and future human-machine working hours, and a pie chart showing reskilling needs of employees.
Operational Efficiency
Financial Services
Highlights the need for reskilling employees in the insurance industry due to shifts in labor between humans and machines, emphasizing digitization and automation impacts.
Reskilling needs, Human-machine working hours, Insurance industry, Digitization, Automation
false
Operational Efficiency
Financial Services
Multiple Chart
EY
Add to my slides
Remove from favorites
The slide contains two column charts displaying operating expenses and risk-weighted assets over different periods. It uses a minimalistic design with blue and white colors and clear annotations.
Operational Efficiency
Financial Services
The slide explains the efficient utilization of resources with a focus on cost management and RWA efficiency. It shows changes in operating expenses and risk-weighted assets, emphasizing disciplined expense management.
Resource Utilization, Cost Efficiency, RWA, Operating Expenses, Capital Management
false
Operational Efficiency
Financial Services
Multiple Chart
Credit Suisse
Add to my slides
Remove from favorites
List of additional resources and readings related to advanced connectivity, providing further knowledge exploration.
Technology and Digital Transformation
Professional Services
Provides a curated list of resources for deeper understanding of connectivity trends and their implications.
Resources, Connectivity, 5G, IoT, Digital Transformation, Knowledge Center
false
Technology and Digital Transformation
Professional Services
Uncategorized
McKinsey
Add to my slides
Remove from favorites
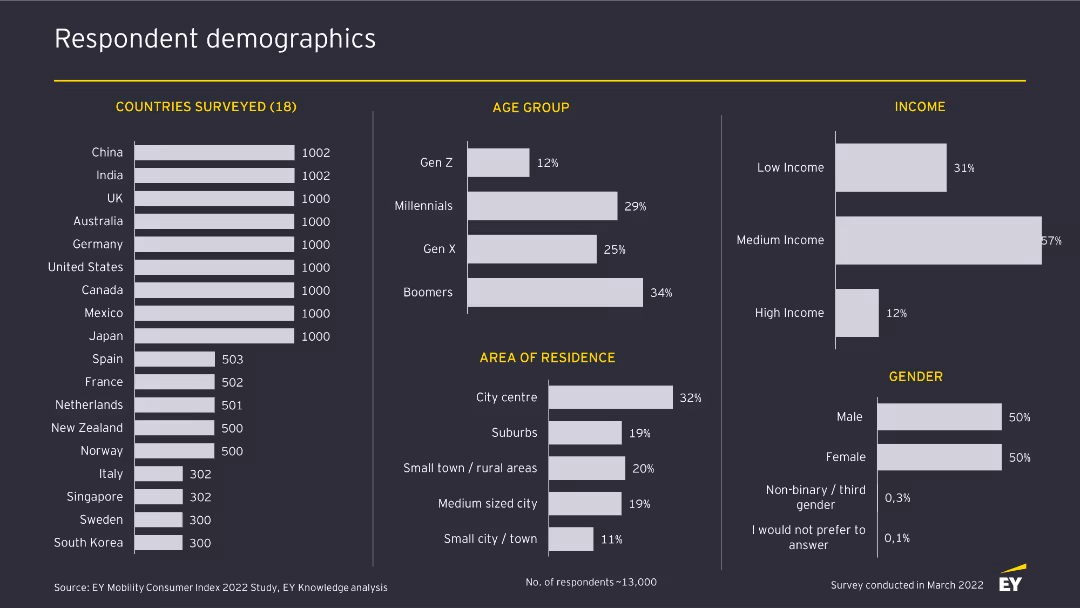
This slide presents various bar and column charts depicting the demographics of survey respondents, including country, age group, area of residence, income, and gender.
Market Analysis and Trends
Transportation & Logistics
The slide provides a detailed demographic breakdown of respondents, showing their distribution across 18 countries, different age groups, income levels, residential areas, and gender.
Respondent demographics, survey data, market research, automotive industry, consumer insights
false
Market Analysis and Trends
Transportation & Logistics
Multiple Chart
EY
Add to my slides
Remove from favorites
The slide features four illustrated avatars with descriptions below each one. The layout is clean, with ample white space and consistent design elements.
Market Analysis and Trends
Education & Training
Describes four key respondent groupings based on attitudes to work, family life, money, society, and other factors, providing insights into their characteristics.
Respondents, Groupings, Attitudes, Work, Family Life, Money, Society, Well-being, Success, Fame
false
Market Analysis and Trends
Education & Training
Pillar
Deloitte
Add to my slides
Remove from favorites
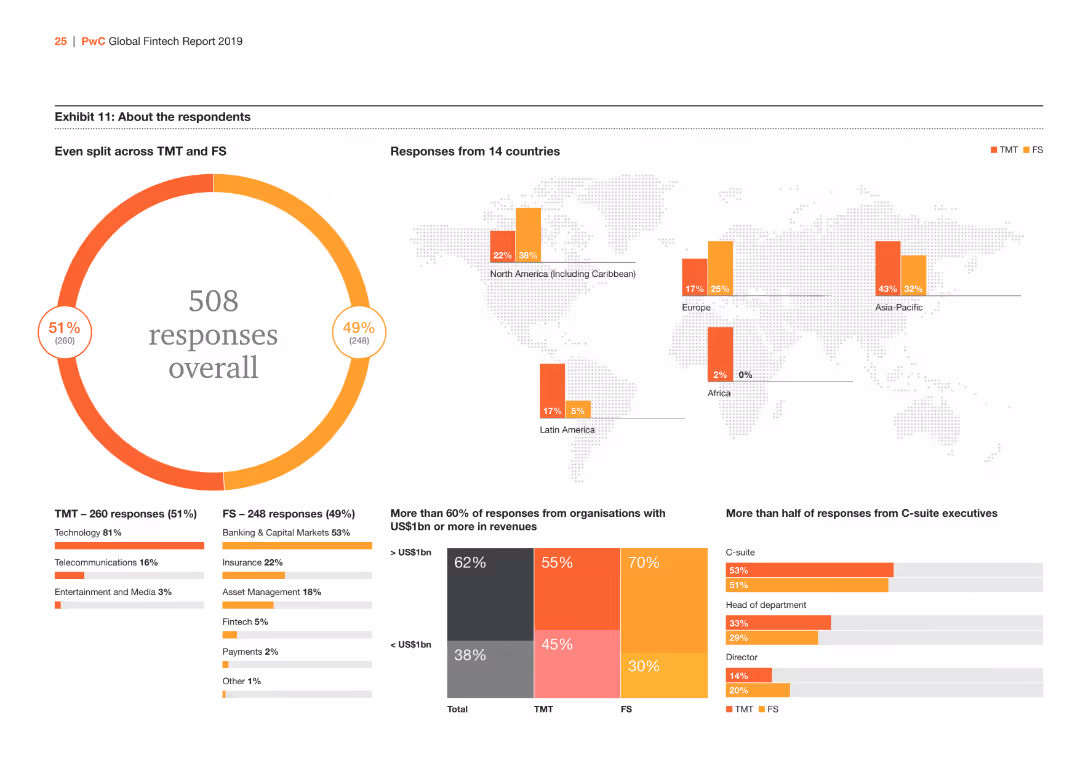
The slide uses a combination of pie charts and column charts to show the demographics and sectors of survey respondents. It includes a map to depict the geographical distribution of respondents.
Market Analysis and Trends
Financial Services
It provides an overview of the respondents' demographics in the survey, including the split between TMT and FS, geographical distribution, industry sectors, and company size.
Respondents, Survey, Demographics, TMT, FS, Map
false
Market Analysis and Trends
Financial Services
Multiple Chart
PwC/Strategy&
Add to my slides
Remove from favorites
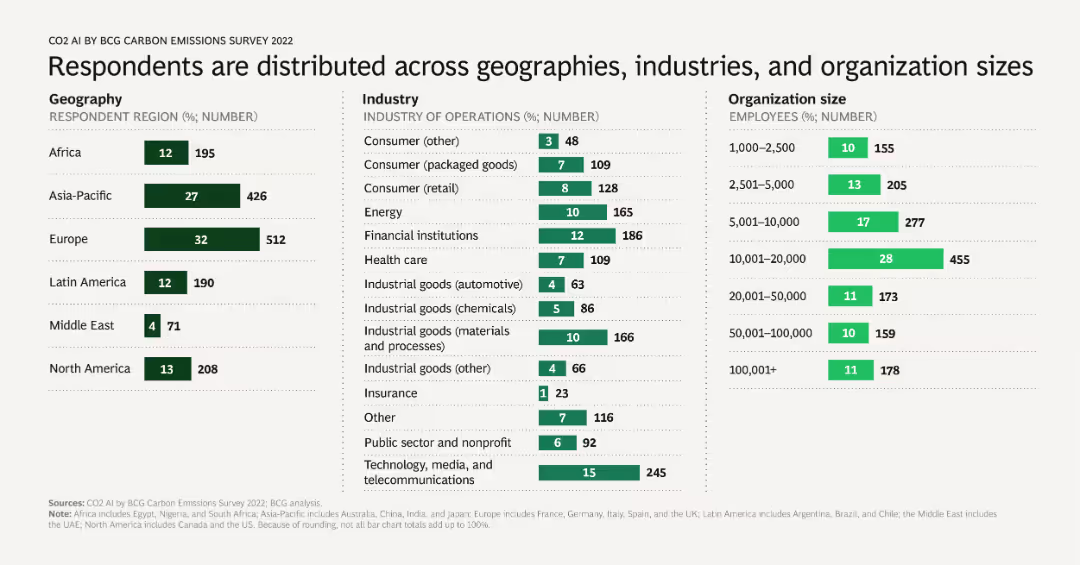
The slide includes a table that distributes respondents by geography, industry, and organization size.
Market Analysis and Trends
Professional Services
This slide provides a distribution of survey respondents across different geographies, industries, and organization sizes, offering a comprehensive view of the survey's coverage.
Respondents, distribution, geography, industry, organization size
false
Market Analysis and Trends
Professional Services
Multiple Chart
BCG
Add to my slides
Remove from favorites
The slide features text and icons describing types of responses and underlying demand drivers, with specific focus on weather events, emergency accidents, and pandemic response.
Market Analysis and Trends
Environmental Services & Sustainability
It explains the short-term demand increase in response and restoration services due to COVID-19, predicting normalization post-pandemic.
Response, restoration, pandemic, emergency, demand, short-term, long-term, services, events, accidents
false
Market Analysis and Trends
Environmental Services & Sustainability
Table
LEK
Add to my slides
Remove from favorites
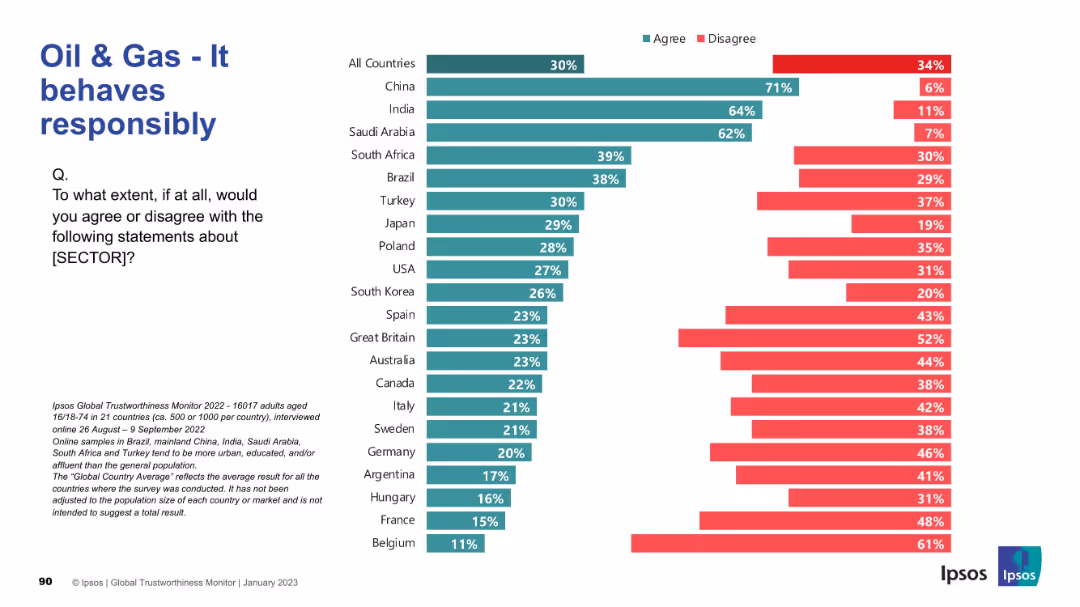
Horizontal bar graph; “agree” and “disagree” percentages visualized for each country. Clean visual with left-aligned question and Ipsos footer.
Market Analysis and Trends
Energy & Utilities
Respondents were asked whether they believe the oil & gas sector behaves responsibly. High agreement in China, India, and Saudi Arabia contrasts with skepticism in Western countries such as Belgium, France, and Germany.
Responsibility, Oil & Gas, Global Opinion, Ipsos, Ethics, Country Survey, Trust, Corporate Behavior, Accountability, Energy Industry
false
Market Analysis and Trends
Energy & Utilities
Mixed Chart
IPSOS
Add to my slides
Remove from favorites
This slide features a bar chart with horizontal bars showing the percentage of Millennials and Gen Z who agree with various statements about the pandemic's impact on their sense of responsibility. It includes text analysis on the left side.
Market Analysis and Trends
Environmental Services & Sustainability
The slide discusses how the pandemic has increased Millennials' and Gen Z's empathy and eagerness to positively impact their communities. The bar chart visualizes the survey responses, showing high levels of agreement on increased individual responsibility and community-focused actions post-pandemic.
Responsibility, Pandemic, Community, Empathy, Survey
false
Market Analysis and Trends
Environmental Services & Sustainability
Mixed Chart
Deloitte
Add to my slides
Remove from favorites
The slide is divided into two columns, each with text and images, including trend assessments.
Operational Efficiency
Consumer Goods
Discusses responsible sourcing and the circular economy, emphasizing social and environmental considerations in supply chains.
Responsible Sourcing, Circular Economy, Supply Chain, Environmental Considerations, Ethical Procurement, Sustainability
false
Operational Efficiency
Consumer Goods
Mixed Chart
Deloitte
Add to my slides
Remove from favorites
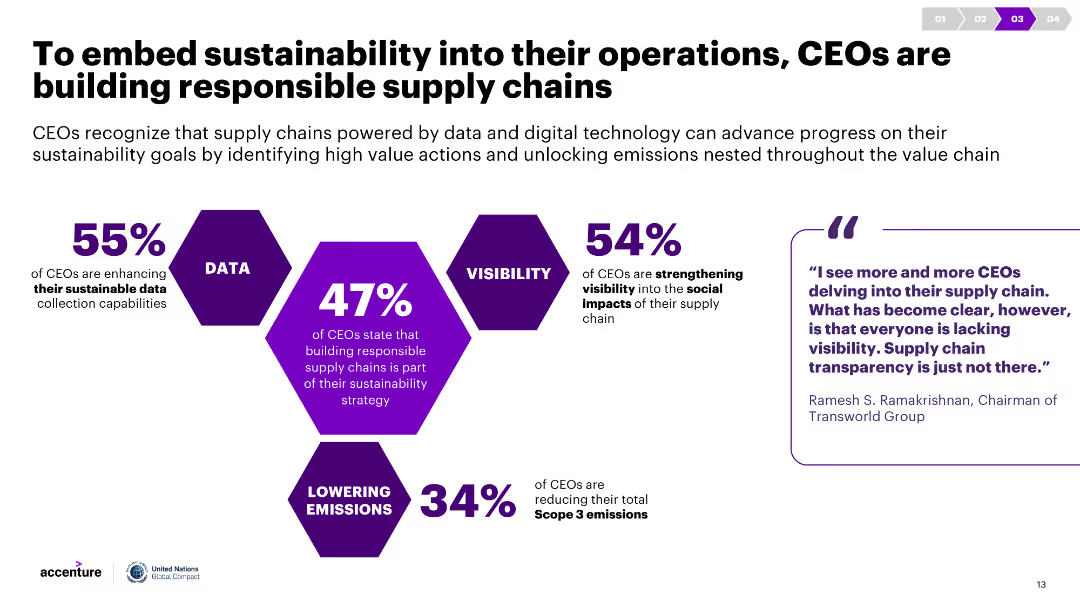
Infographics show percentages of CEOs taking various actions to build responsible supply chains. Commentary includes quotes and detailed descriptions of these actions.
Strategic Planning
Environmental Services & Sustainability
The slide highlights the steps CEOs are taking to incorporate sustainability into supply chains, such as enhancing data collection, visibility, and reducing emissions.
Responsible supply chains, sustainability, CEO actions, data collection, emissions reduction
false
Strategic Planning
Environmental Services & Sustainability
Diagram
Accenture
Add to my slides
Remove from favorites
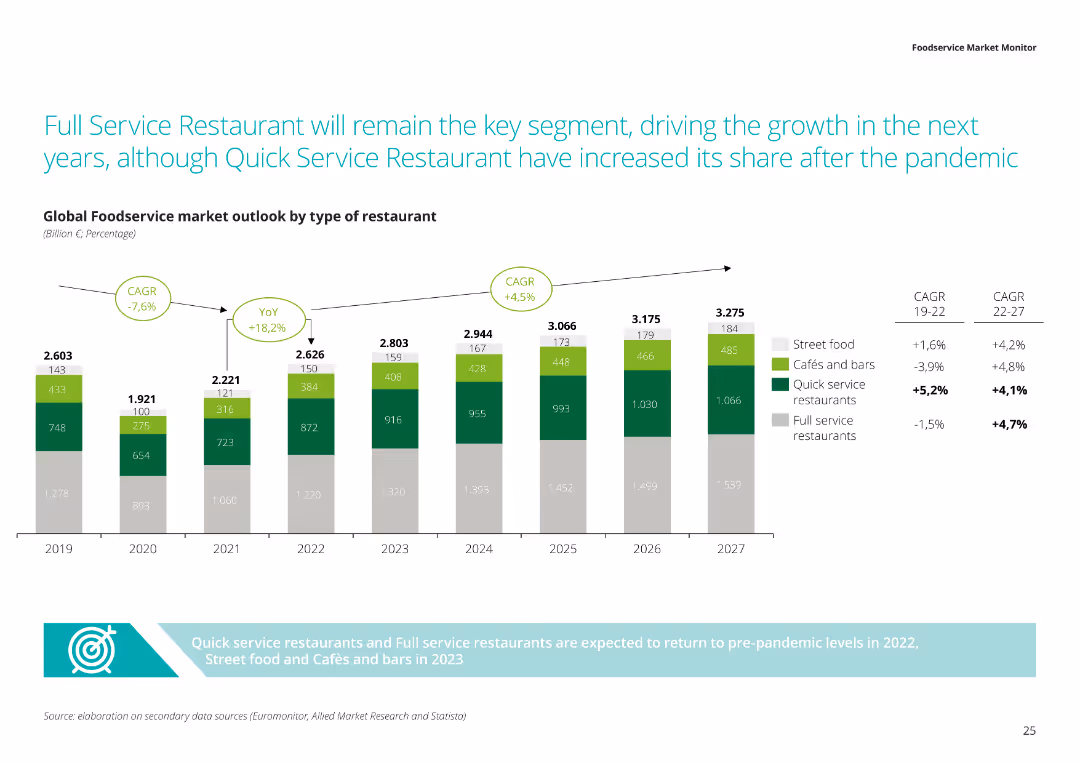
This slide contains a column chart illustrating the global foodservice market outlook by type of restaurant, including CAGR and YoY growth rates from 2019 to 2027.
Market Analysis and Trends
Hospitality & Tourism
It forecasts full-service restaurants leading growth in foodservice, despite quick service restaurants gaining share post-pandemic, with market sizes and growth rates by type.
Restaurant, Growth, Foodservice, Market Outlook, CAGR
false
Market Analysis and Trends
Hospitality & Tourism
Mixed Chart
Deloitte
Add to my slides
Remove from favorites
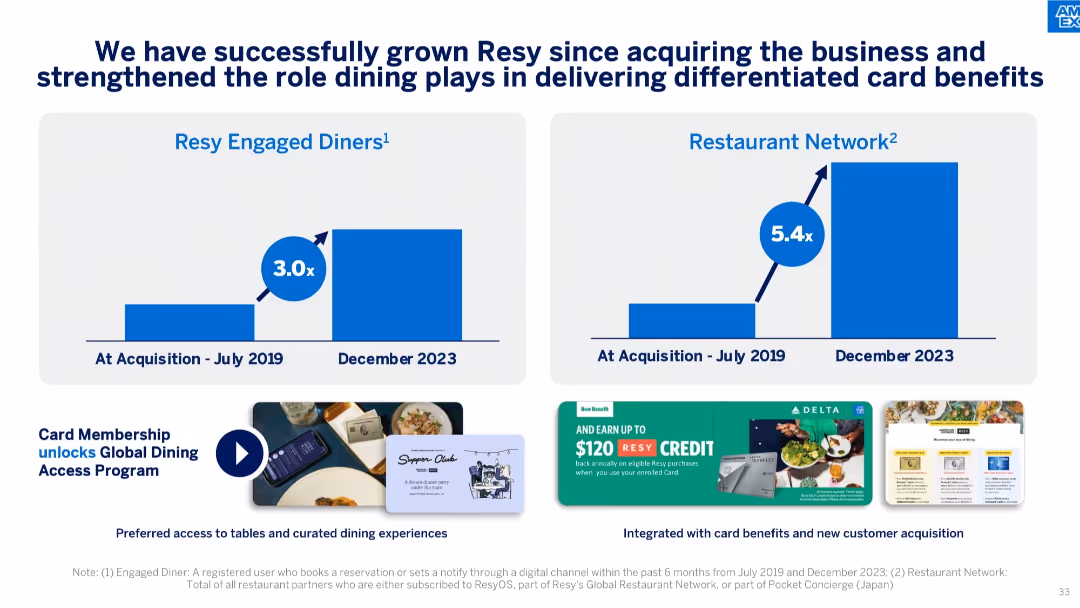
Split bar charts showing growth in diners and restaurant network, with branded visuals at the bottom.
Product and Service Analysis
Financial Services
Describes growth of Resy platform post-acquisition and its integration into cardholder benefits, showing multiplier effects on diner engagement and restaurant network expansion.
Resy, dining benefits, restaurant network, cardholder experience, acquisition impact, loyalty programs
false
Product and Service Analysis
Financial Services
Mixed Chart
McKinsey
Add to my slides
Remove from favorites
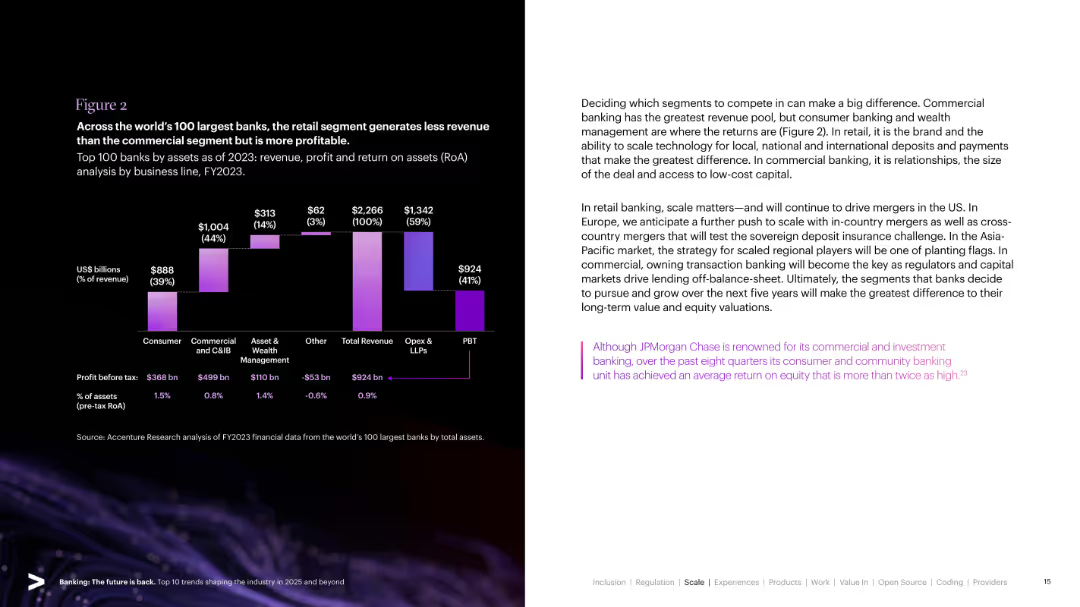
Bar chart with segmented categories for banking revenues and profits. Dark background with violet and white accents. Text on right explains implications of commercial vs. consumer banking segments.
Strategic Planning
Financial Services
Highlights revenue and profit split across banking segments for top global banks, showing that although commercial banking earns more revenue, retail banking is more profitable. Discusses strategic implications for segment focus.
Retail Banking, Commercial Banking, Profitability, RoA, Strategy, Segment Revenue, Bank Operations, Global Banks
false
Strategic Planning
Financial Services
Mixed Chart
Accenture
Add to my slides
Remove from favorites
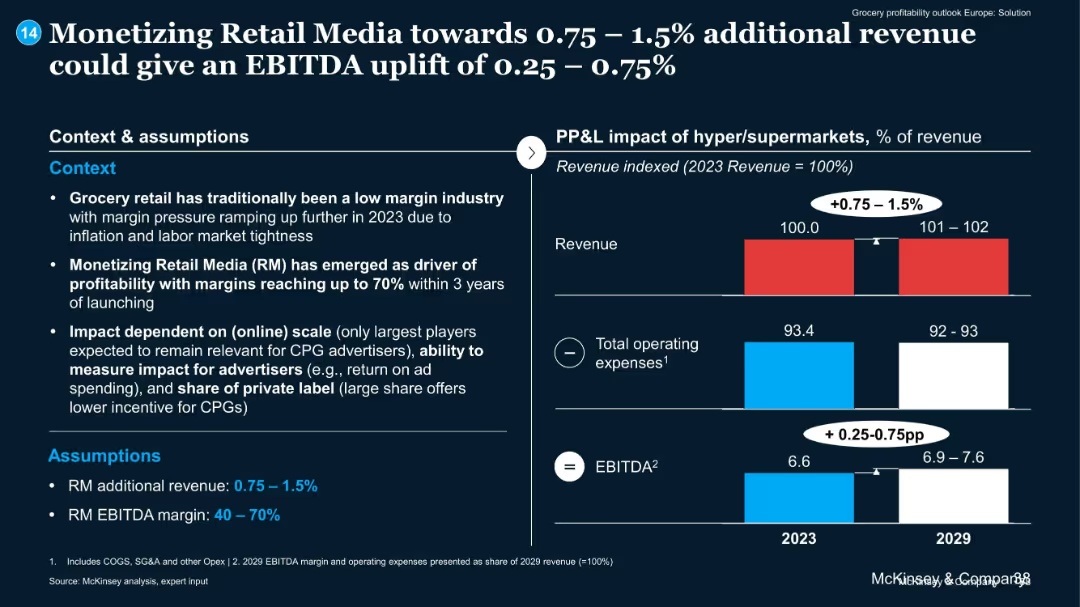
Split layout; left side with bulleted context & assumptions; right side features bar chart comparing 2023 vs 2029 metrics
Strategic Planning
Retail & E-commerce
The slide explains how monetizing retail media (RM) can yield an EBITDA uplift of 0.25–0.75%, driven by additional revenue (0.75–1.5%) and high margins. It highlights dependency on online scale, advertiser impact measurement, and private label share.
Retail Media, EBITDA, Monetization, CPG, Private Label, Profitability
false
Strategic Planning
Retail & E-commerce
Mixed Chart
McKinsey
Add to my slides
Remove from favorites
Uses line charts and column charts to show trends in fashion and accessories store traffic and the net openings of luxury retail stores from 2012 to 2018.
Strategic Planning
Retail & E-commerce
Analyzes the declining trend in physical store traffic and the consequent reduction in luxury retail store openings, predicting a reshaping of the role of physical stores in the luxury market.
Retail Trends, Store Traffic, Luxury Market, Store Openings
false
Strategic Planning
Retail & E-commerce
Multiple Chart
Bain
Add to my slides
Remove from favorites
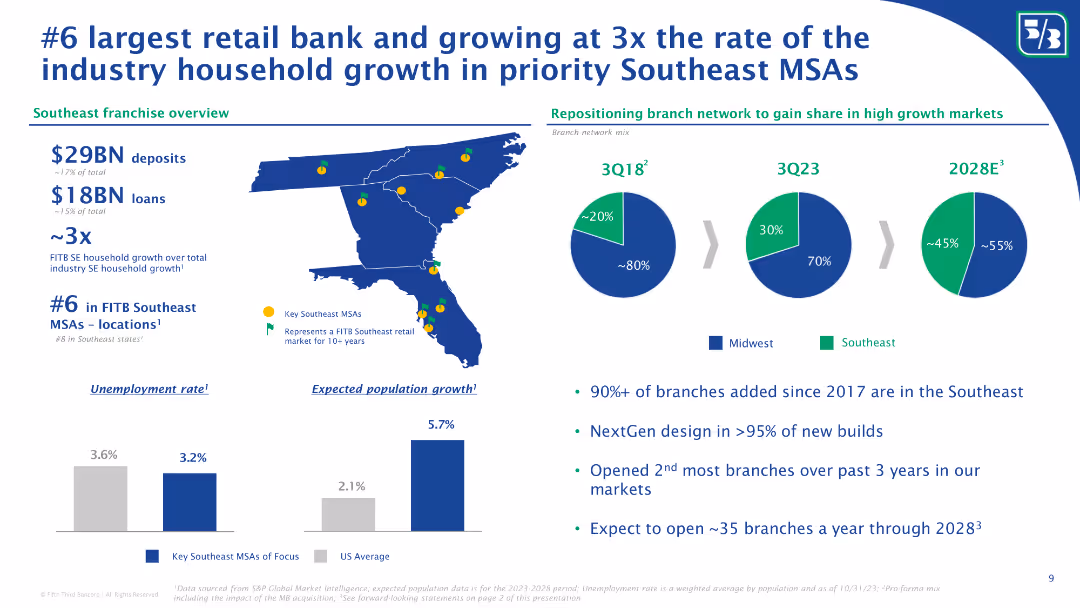
The slide features a map of Southeast MSAs, pie charts showing branch network mix changes, and bullet points on expected population growth and unemployment rates.
Market Analysis and Trends
Financial Services
The slide provides an overview of Fifth Third Bank’s retail banking growth in the Southeast MSAs, highlighting their significant expansion rate compared to the industry. It includes demographic data on unemployment rates and population growth, emphasizing their strategic branch network adjustments for market dominance.
Retail bank, Southeast MSAs, branch network, population growth, unemployment rate, market dominance, retail banking, expansion, Fifth Third Bank, industry growth
false
Market Analysis and Trends
Financial Services
Multiple Chart
Goldman Sachs
Add to my slides
Remove from favorites
Contains a complex comparative chart tracking percentage changes in visits and stay duration against a restriction stringency index.
Market Analysis and Trends
Retail & E-commerce
Analyzes the impact of lifting restrictions on retail footfall across various markets, highlighting how consumer behavior has changed in comparison to pre-event levels.
Retail footfall, Market analysis, Restriction stringency, Consumer behavior, Comparative chart, Visits duration, Global impact, Grocery & Pharmacy
false
Market Analysis and Trends
Retail & E-commerce
Mixed Chart
Accenture
Add to my slides
Remove from favorites
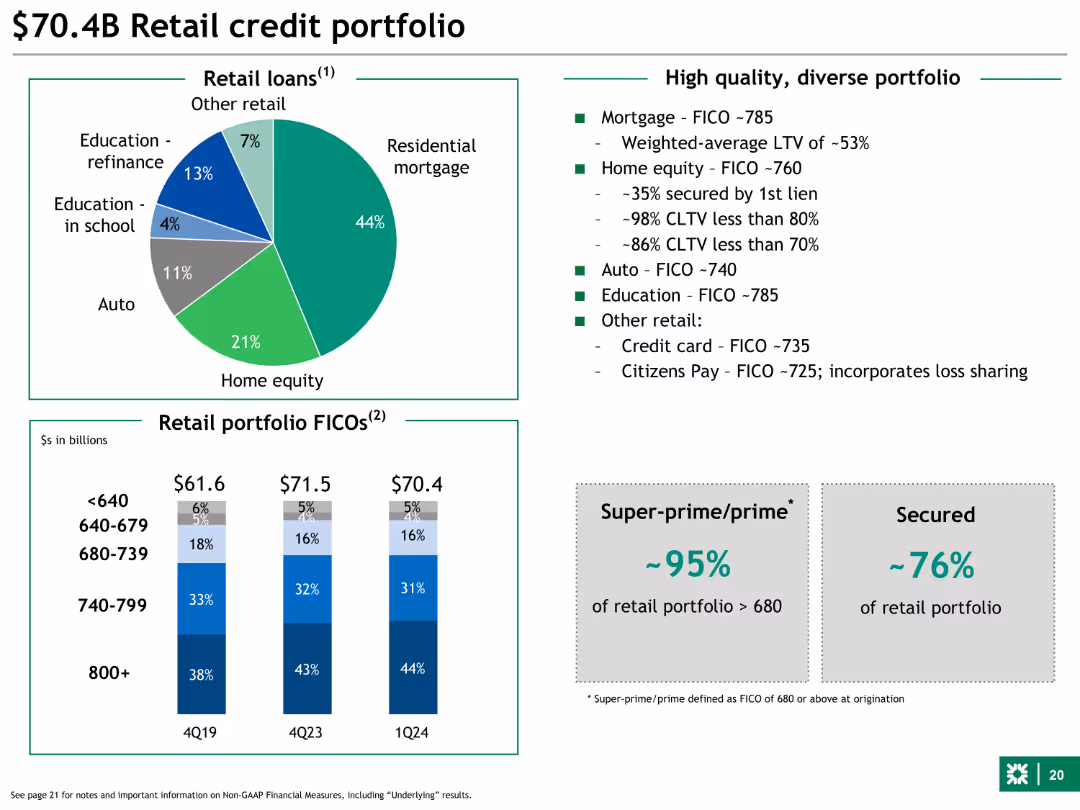
This slide features a pie chart and a column chart. The pie chart breaks down the retail loans by category, and the column chart shows the distribution of retail portfolio FICO scores across different time periods. The slide is moderately dense with detailed textual information.
Financial Performance
Financial Services
The slide provides a detailed breakdown of the retail credit portfolio, highlighting the composition of retail loans and FICO score distributions. It emphasizes the high-quality, diverse nature of the portfolio and mentions specific FICO scores for different loan categories.
Retail loans, FICO scores, mortgage, home equity, auto
false
Financial Performance
Financial Services
Multiple Chart
Barclays
Add to my slides
Remove from favorites
This slide features multiple line charts displaying year-on-year changes in credit card sales across various retail sectors. The layout includes two main sections for short-term impacts and recovery paths, with annotations and a clear color-coded legend.
Market Analysis and Trends
Retail & E-commerce
This slide analyzes the short-term impact of the COVID-19 pandemic on different retail sectors and predicts their recovery paths. It highlights the contrast between essential and non-essential retailers, using data-driven insights to project future industry trends.
Retail, COVID-19, Recovery, Online Sales, Impact Analysis
false
Market Analysis and Trends
Retail & E-commerce
Multiple Chart
BCG
Add to my slides
Remove from favorites
Contains multiple circular flow diagrams with icons and text. In the center, there are four main categories connected by arrows showing a continuous cycle. The layout is clean with moderate visual complexity.
Market Analysis and Trends
Retail & E-commerce
Discusses the future of retail, focusing on empowered consumers, disruptive technologies, and societal impacts. Explains the transformation of business models and the increase in value for society.
Retail, Consumer Empowerment, Disruptive Technologies, Business Models, Societal Impact
false
Market Analysis and Trends
Retail & E-commerce
Framework
Accenture
Add to my slides
Remove from favorites
Includes a multi-line chart with different colors representing each sector, comparing foundational, programmatic, strategic, and integrated talent attraction strategies. Icons depict recruitment approaches.
Strategic Planning
Retail & E-commerce
Explores retail's lag in partnering with diverse organizations and the scope of its recruiting strategies compared to sectors like CGS, Auto/IE, LS/Pharma/Biotech, and Travel/Hospitality.
Retail, Diverse Organizations, Recruiting, Comparison, Sectors, Strategies, Talent Attraction, Foundational, Programmatic
false
Strategic Planning
Retail & E-commerce
Mixed Chart
Accenture
Add to my slides
Remove from favorites
Slide contains a large, colorful multi-line chart comparing foundational, programmatic, strategic, and integrated & sustainable D&I targets across industries. Icons and a strategic intent note are placed at the top. Line colors are distinct for each sector.
Strategic Planning
Retail & E-commerce
This slide analyzes how the retail sector compares with others like CGS, Auto/IE, LS/Pharma/Biotech, and Travel/Hospitality in establishing Diversity and Inclusion targets across four categories: Foundational, Programmatic, Strategic, and Integrated & Sustainable.
Retail, Diversity, Inclusion, Comparison, Sector, Targets, Performance, Strategic, Programmatic, Integrated
false
Strategic Planning
Retail & E-commerce
Mixed Chart
Accenture
Add to my slides
Remove from favorites
Three sections, each with an image and a color-coded title. Images depict sunset, wind turbines, and water waves.
Industry Overview
Financial Services
Sections discuss retail investing, energy transition, and Web 3's impact on markets and efficiency in capital markets.
Retail, Energy, Web 3, Investing, Transition, Crypto, Efficiency, Capital Markets
false
Industry Overview
Financial Services
Pillar
Bain
Add to my slides
Remove from favorites
The slide features text and charts depicting discretionary spending trends and a model for cracking the retail market in India.
Market Analysis and Trends
Retail & E-commerce
This slide explores the retail market in India, focusing on discretionary spending trends and strategic models for market entry and growth.
Retail, India, Discretionary Spending, Market Analysis, Trends, Model, Strategy, Growth, Investment, Consumer
false
Market Analysis and Trends
Retail & E-commerce
Mixed Chart
Morgan Stanley
Add to my slides
Remove from favorites
This slide contains three overlaid line charts comparing projected recovery trajectories for various retail sectors in New York. It uses different colors for each line, with annotations explaining key points.
Strategic Planning
Retail & E-commerce
This slide predicts the retail recovery in New York post-lockdown, focusing on essential and non-essential retailers. It provides insights into the expected timeline for recovery and the ongoing impact of social distancing measures on physical retail spaces.
Retail, New York, Recovery, Projections, COVID-19
false
Strategic Planning
Retail & E-commerce
Mixed Chart
BCG
Add to my slides
Remove from favorites
Diagram outlining the methodology for calculating retail equivalent value of sales, integrating retail, wholesale, and licenses.
Operational Efficiency
Retail & E-commerce
Explains the comprehensive approach to estimating retail sales for business analysis, including both bottom-up and top-down estimates to ensure accuracy.
Retail, Sales Analysis, Methodology
false
Operational Efficiency
Retail & E-commerce
Mixed Chart
Bain
Add to my slides
Remove from favorites
Features a multi-line chart showing percentages of talent retention strategies across industries. Icons represent different strategies at the top. Each line represents a sector with clear color coding.
Strategic Planning
Retail & E-commerce
Focuses on how retail industry's talent retention strategies align with other sectors, including CGS, Auto/IE, LS/Pharma/Biotech, and Travel/Hospitality, in foundational, programmatic, strategic, and integrated categories.
Retail, Talent Retention, Consistency, Industries, Strategies, Foundational, Programmatic, Strategic, Integrated
false
Strategic Planning
Retail & E-commerce
Mixed Chart
Accenture
Add to my slides
Remove from favorites
The slide includes three column charts comparing Tyson's sales volume and growth in the retail perimeter to total grocery sales. The visual design uses deep blue and gray to distinguish between Tyson and total grocery, effectively drawing attention to Tyson's advantageous positioning.
Market Analysis and Trends
Agriculture & Food Production
Discusses Tyson’s competitive advantage in retail sales, particularly in perimeter categories of grocery stores. It highlights Tyson's performance and growth in these areas, providing insights for stakeholders interested in retail strategies and market positioning.
Retail, Tyson, Grocery, Sales, Market Analysis, Growth
false
Market Analysis and Trends
Agriculture & Food Production
Multiple Chart
Barclays
Add to my slides
Remove from favorites
The slide is divided into four sections, each with an icon and text describing different strategies regarding talent resignation, from understanding drivers to handling exits.
Human Resources and Talent Management
Professional Services
The slide outlines a comprehensive strategy for managing talent resignation, emphasizing a preventative approach and the importance of a retention strategy for high-performing individuals. It is likely used in HR training or strategy meetings.
Retention Strategy, Talent Resignation, HR Management, Prevention
false
Human Resources and Talent Management
Professional Services
Header Horizontal
Kearney
Add to my slides
Remove from favorites
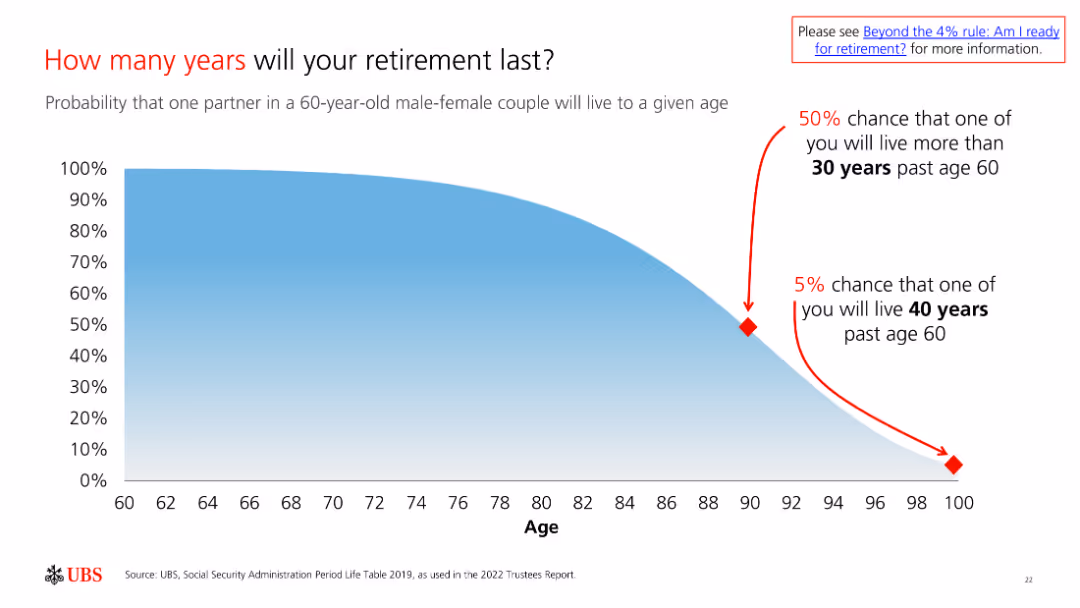
The slide includes a probability chart showing the likelihood of a 60-year-old couple living to different ages, illustrating longevity risk in retirement.
Market Analysis and Trends
Financial Services
The slide assesses the longevity risk in retirement, emphasizing the importance of planning for an extended retirement period to ensure financial security.
Retirement, Longevity, Risk, Probability, Planning
false
Market Analysis and Trends
Financial Services
Single Chart
UBS
Add to my slides
Remove from favorites
Pie chart depicting the proportion of respondents saving for retirement before COVID-19 and those who continued during the pandemic. Text at the top provides context.
Market Analysis and Trends
Financial Services
This slide outlines the savings behavior of Canadian investors for retirement before and during the COVID-19 pandemic. It shows the percentage of those who continued saving and highlights demographic variations in savings habits.
Retirement, Savings, COVID-19, Canadian, Pandemic
false
Market Analysis and Trends
Financial Services
Multiple Chart
IPSOS
Add to my slides
Remove from favorites
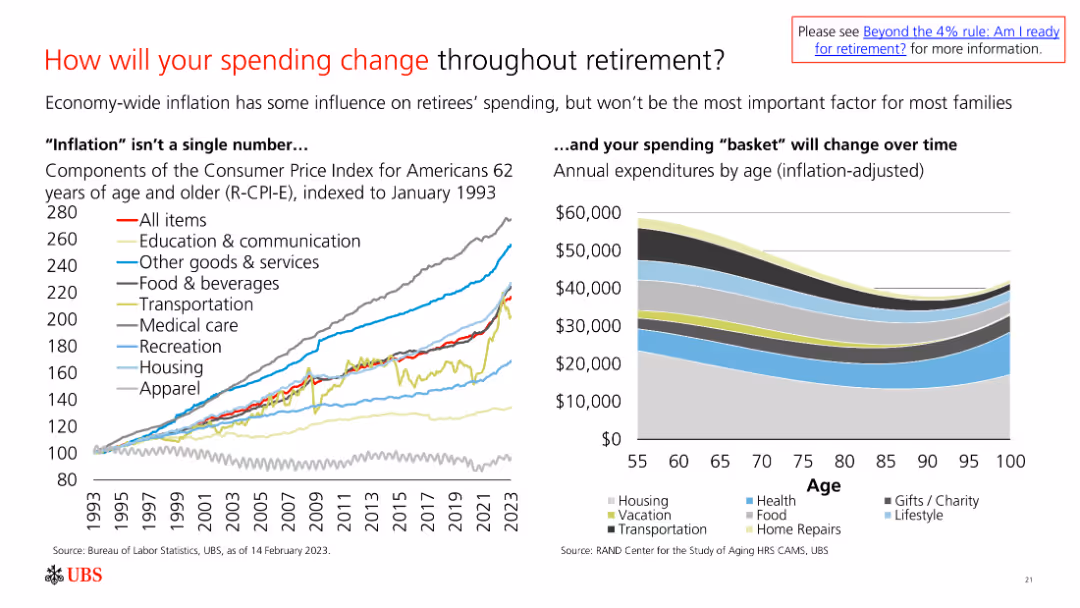
The slide features a line chart showing the Consumer Price Index for different expense categories over time and a bar chart of annual expenditures by age.
Market Analysis and Trends
Financial Services
The slide analyzes spending changes in retirement, influenced by inflation and shifts in expenditure categories, to guide financial planning for retirees.
Retirement, Spending, Inflation, Expenses, Financial Planning
false
Market Analysis and Trends
Financial Services
Multiple Chart
UBS
Add to my slides
Remove from favorites
Features column charts and icons showing the ROE impact from capital and market segments, with a focus on change over time.
Financial Performance
Financial Services
Illustrates the impact of capital on ROE in market business, emphasizing strong returns despite increased capital, with a focus on sub-product ROEs and revenue growth.
Return on Equity, Capital Impact, Revenue Growth, Risk Management
false
Financial Performance
Financial Services
Multiple Chart
JP Morgan
Add to my slides
Remove from favorites
Slide with bullet points and checkboxes detailing strategies for businesses to consider in anticipation of returning to normal operations.
Strategic Planning
Professional Services
Provides a checklist for businesses on considerations and actions for transitioning back to normal operations after a crisis.
Return strategy, business preparedness, employee protection, customer reassurance
false
Strategic Planning
Professional Services
Vertical Flow
McKinsey
Add to my slides
Remove from favorites
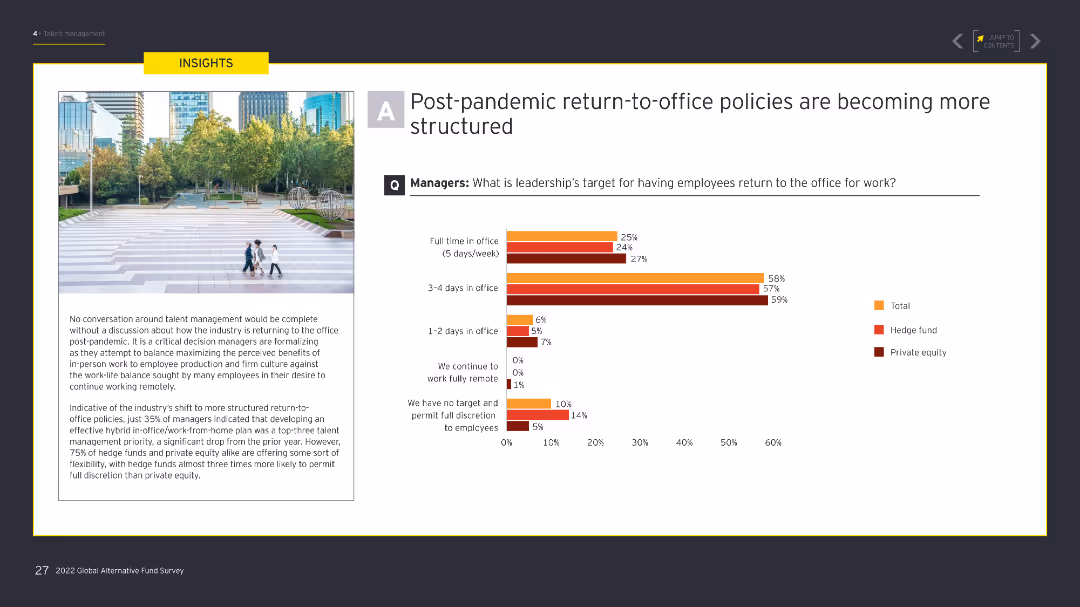
The slide features a column chart illustrating leadership's targets for employees returning to the office post-pandemic. An image on the left shows an outdoor urban setting with people walking. The chart uses shades of orange and red.
Human Resources and Talent Management
Financial Services
The slide outlines how leadership is targeting different levels of in-office presence post-pandemic, with a significant focus on structured return-to-office policies to balance remote work and office work.
Return-to-office, post-pandemic, remote work, office policies, leadership targets
false
Human Resources and Talent Management
Financial Services
Mixed Chart
EY
Add to my slides
Remove from favorites
The slide features a column chart with measures like returns charges, account blocks, and monetary incentives that would deter consumers from making returns.
Risk Assessment and Management
Retail & E-commerce
Details measures that could reduce the frequency of online returns, based on survey responses, including financial and policy-based deterrents like returns charges and account blocks.
Returns charges, Account block, Monetary incentive, Survey measures, Deterrents
false
Risk Assessment and Management
Retail & E-commerce
Mixed Chart
Roland Berger
Add to my slides
Remove from favorites
The slide includes text and a pie chart showing the impact of returns charges on online shopping behavior, such as increased caution in purchasing and cessation of buying from certain brands.
Risk Assessment and Management
Retail & E-commerce
Examines the effects of returns charges on consumer behavior, highlighting how financial penalties influence shopping habits and the decision to purchase from specific brands.
Returns charges, Online shopping, Consumer behavior, Financial penalties, Brands
false
Risk Assessment and Management
Retail & E-commerce
Mixed Chart
Roland Berger
Add to my slides
Remove from favorites
The slide shows a process flow diagram with icons representing various stages of returns handling in the fashion industry, including sorting, refunding, and recycling.
Operational Efficiency
Retail & E-commerce
This slide explains the flow of returns within the fashion ecosystem, highlighting the key stages and actions involved in managing returns efficiently and sustainably.
Returns, Recycling, Sorting, Process flow, Fashion industry
false
Operational Efficiency
Retail & E-commerce
Diagram
Roland Berger
Add to my slides
Remove from favorites
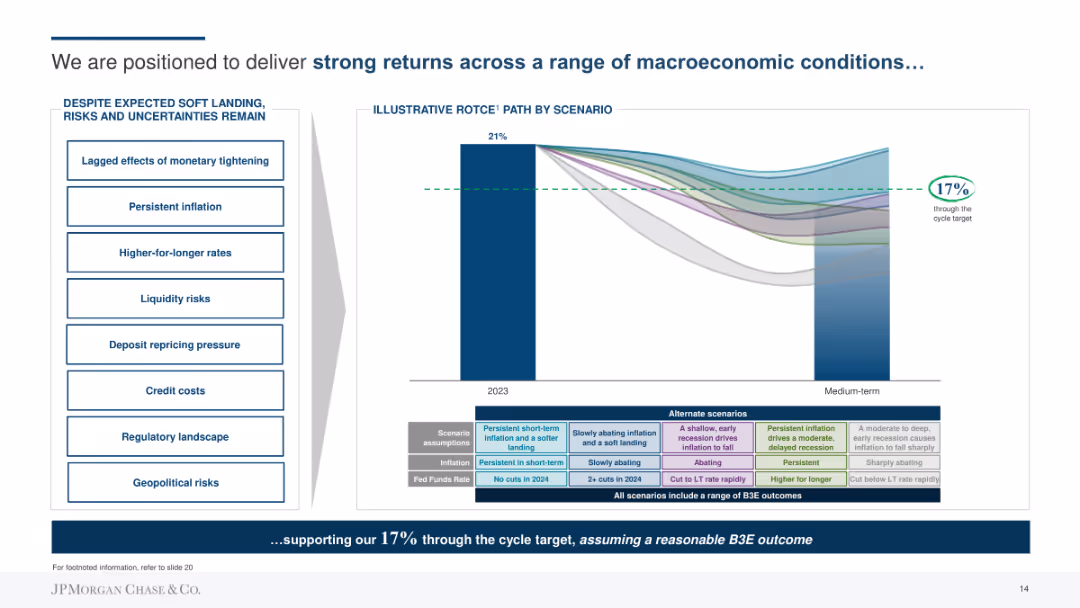
Combination of bar chart showing ROTCE by scenario and a side panel listing economic risks and uncertainties. Uses color-coded scenarios and a line to indicate the target return.
Strategic Planning
Financial Services
Outlines JP Morgan's strategy to deliver strong returns through different economic scenarios, emphasizing risk management and strategic planning. Shows ROTCE projections and lists potential risks like inflation and credit costs.
Returns, Strategy, Planning, ROTCE, Risks, Economic, Financial
false
Strategic Planning
Financial Services
Mixed Chart
JP Morgan
Add to my slides
Remove from favorites
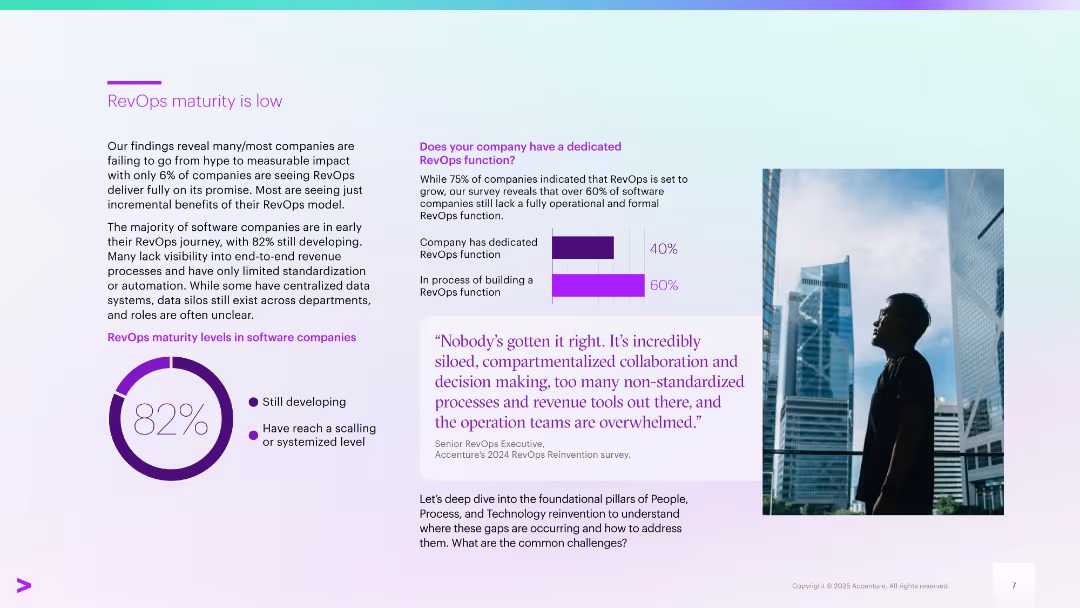
Left side text and chart; right side has quote, vertical bar chart, and person looking at skyline
Technology and Digital Transformation
Technology & Software
Emphasizes that 82% of companies are still developing RevOps capabilities. Majority lack process standardization. Notes 60% are still building a RevOps function despite the growing recognition of its importance.
RevOps maturity, software companies, business transformation, scaling, framework
false
Technology and Digital Transformation
Technology & Software
Multiple Chart
Accenture
Add to my slides
Remove from favorites
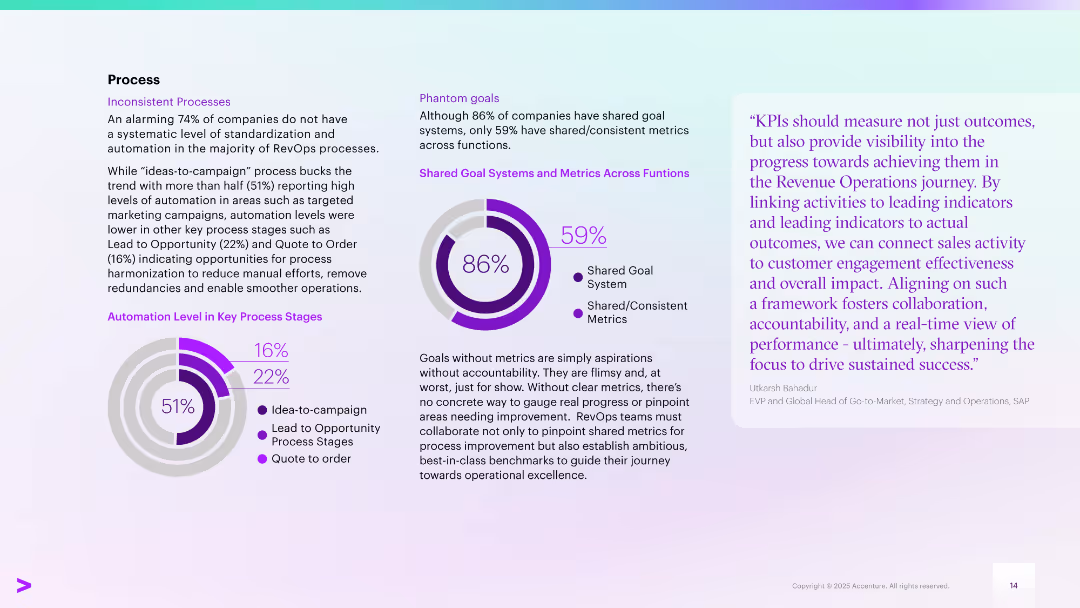
Left section shows automation levels in RevOps stages; center focuses on metrics alignment; right has quote
Operational Efficiency
Technology & Software
Reveals 74% of companies lack standardization in RevOps processes. Key gaps in automation from lead-to-order stages and misalignment in metrics (only 59% have consistent metrics across functions) are highlighted as barriers to operational excellence.
RevOps process, automation, KPIs, standardization, metrics, operational gaps
false
Operational Efficiency
Technology & Software
Multiple Chart
Accenture
Add to my slides
Remove from favorites
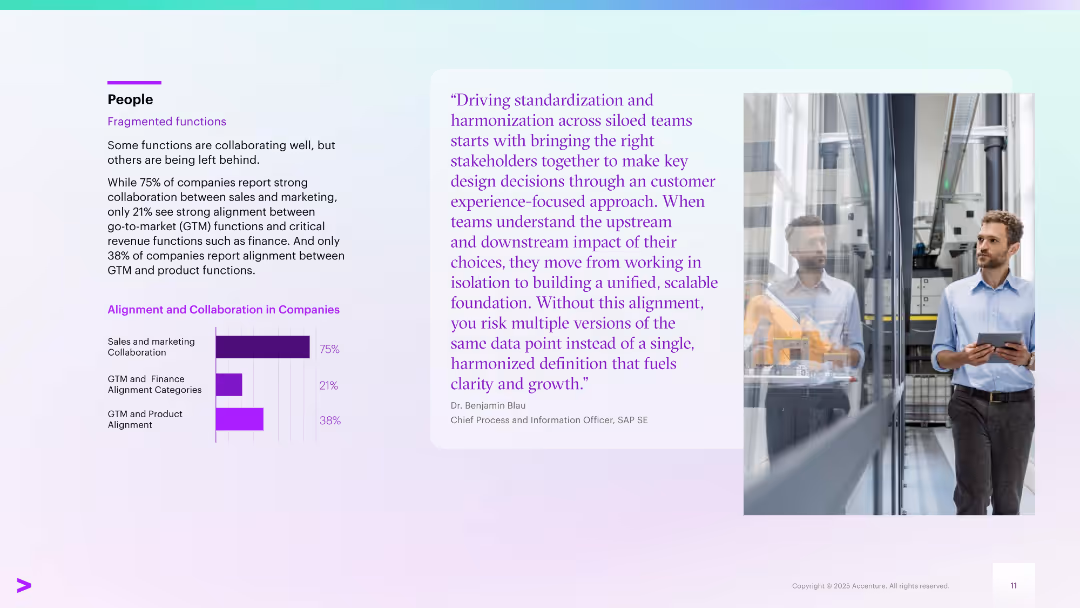
Left has stats and bar chart on collaboration; right side features quote and office image
Organizational Structure and Change
Technology & Software
Addresses fragmentation across departments. Although sales and marketing show 75% collaboration, alignment with finance (21%) and product (38%) lags. Calls for unification to enable scalable growth.
RevOps, process maturity, adoption, transformation, data silos, strategy gaps
false
Organizational Structure and Change
Technology & Software
Mixed Chart
Accenture
Add to my slides
Remove from favorites
Left side shows a person with a data visualization (6% maturity); right contains dense descriptive text
Technology and Digital Transformation
Technology & Software
Reveals that only 6% of software/tech businesses have achieved RevOps maturity. Most are still in early stages due to strategic gaps. Introduces a maturity framework to assess readiness and success.
RevOps, software growth, digital transformation, lead-to-cash, adoption, profitability
false
Technology and Digital Transformation
Technology & Software
Mixed Chart
Accenture
Add to my slides
Remove from favorites
Two sets of vertical column charts comparing the 2016 and 2018 revenue benchmark with divisions CIB and non-CIB highlighted, alongside a title and footnotes at the bottom.
Financial Performance
Financial Services
Used to display growth and market leadership in treasury services, it compares the firm's revenue against competitors over two years, indicating progress and competitive position.
Revenue Benchmark, CIB, Market Leader, Growth, Financial Performance
false
Financial Performance
Financial Services
Multiple Chart
JP Morgan
Add to my slides
Remove from favorites
A series of stacked column charts and labeled circles denote data points, complemented by explanatory text on the side.
Financial Performance
Financial Services
This slide analyzes the composition of 2023 revenues, indicating a shift towards more durable revenue sources. Utilized for financial analysis or strategic planning discussions.
Revenue Breakdown, Financial Analysis, Growth
false
Financial Performance
Financial Services
Mixed Chart
Goldman Sachs
Add to my slides
Remove from favorites
Features a column chart comparing CCB revenue over two years with additional data points broken down into categories like 'Volume-driven revenue growth' and 'Interest rate impact'.
Financial Performance
Financial Services
Represents JP Morgan's Consumer & Community Banking revenue growth, indicating key drivers of the increase. It's intended to display financial progress and factors contributing to revenue change to stakeholders or financial analysts.
Revenue Growth, CCB, Interest Rate, Financial Analysis
false
Financial Performance
Financial Services
Single Chart
JP Morgan
Add to my slides
Remove from favorites
A column chart displaying priorities in operational strategies using yellow to color up its bars.
Strategic Planning
Financial Services
This slide outlines CEOs' strategies for revenue growth, focusing on operational efficiencies and organic growth. Suitable for strategic planning and operational management discussions.
Revenue Growth, CEOs, Strategy, Operational Efficiency, Organic Growth, Planning
false
Strategic Planning
Financial Services
Mixed Chart
PwC/Strategy&
Add to my slides
Remove from favorites
Utilizes horizontal bar graphs and percentage figures to show the impact of AI on business functions, such as revenue increase and cost decrease.
Financial Performance
Technology & Software
Examining the financial implications of AI, this slide presents quantitative data on how AI adoption affects revenue and costs across various business functions.
Revenue Growth, Cost Savings, AI Impact, Business Efficiency, Financial Metrics, AI Benefits
false
Financial Performance
Technology & Software
Multiple Chart
McKinsey
Add to my slides
Remove from favorites
The slide features column charts displaying Revenue Growth, EBITDA Growth, and EBIT Margins for Waste Management and Environmental Services sectors from 2018 to 2020. Key points are listed in bullet points at the top.
Financial Performance
Financial Services
This slide evaluates the revenue, EBITDA, and EBIT margin trends in the Waste Management and Environmental Services sectors from 2018 to 2020, indicating minimal revenue contraction and stable EBITDA margins despite market challenges.
Revenue Growth, EBITDA, EBIT Margins, Waste Management, Environmental Services
false
Financial Performance
Financial Services
Multiple Chart
LEK
Add to my slides
Remove from favorites
Utilizes a column chart to illustrate potential revenue growth with text boxes outlining possible future developments and challenges.
Market Analysis and Trends
Financial Services
Evaluates a revenue opportunity for J.P.Morgan, with projections and an assessment of influencing factors.
Revenue Growth, Financial Services, Projections, J.P.Morgan, Market Opportunities
false
Market Analysis and Trends
Financial Services
Mixed Chart
JP Morgan
Add to my slides
Remove from favorites
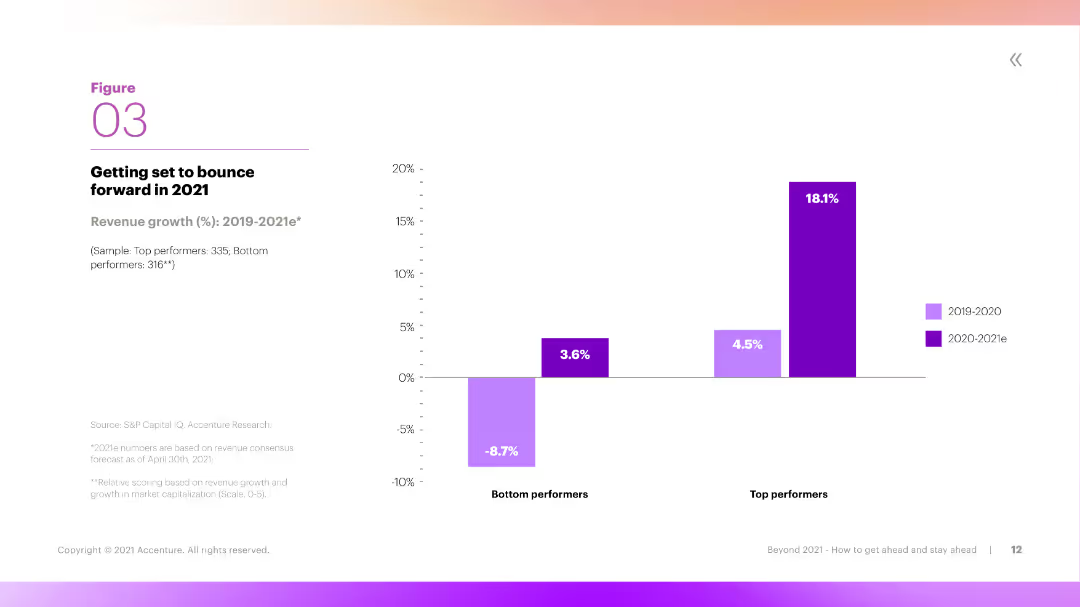
This slide includes a column chart comparing revenue growth rates of bottom performers and top performers over two periods. The chart is clear, with different colors representing different time periods and performance levels.
Market Analysis and Trends
Financial Services
The slide highlights the anticipated revenue growth for 2021, showing the difference between bottom and top performers. It indicates that top performers are expected to see significant growth, rebounding strongly from previous lows.
Revenue Growth, Performance, Top Performers, 2021, Comparison
false
Market Analysis and Trends
Financial Services
Mixed Chart
Accenture
Add to my slides
Remove from favorites
The slide presents a series of column charts comparing APAC Financing Group's net revenues over different periods. The design is minimalistic with blue and white tones and clear labels for each data point.
Financial Performance
Financial Services
The slide demonstrates the consistent revenue growth of the APAC Financing Group while emphasizing disciplined risk management. It shows net revenues over various periods with significant non-recurring items highlighted.
Revenue Growth, Risk Management, APAC, Financing, Net Revenues
false
Financial Performance
Financial Services
Multiple Chart
Credit Suisse
Add to my slides
Remove from favorites
The slide features two visual sections: a column chart on the left representing financing and wallet share gains and showing a 10-year revenue mix. The header and footer are dark blue, and the page number is at the bottom right.
Financial Performance
Financial Services
Catered to the financial services industry, the slide portrays a 10-year revenue mix and illustrates durable revenue growth from a solid base. The visual representations are suited for demonstrating financial stability and strategic growth to investors or stakeholders, focusing on the importance of a solid financial base for enduring revenue growth, and can be effectively used in financial strategy sessions or investor relations communications.
Revenue Growth, Stability, Financial Base, Wallet Share, Financing, Global Markets
false
Financial Performance
Financial Services
Multiple Chart
Goldman Sachs
Add to my slides
Remove from favorites
The slide combines textual information with flow diagrams and a column chart comparing future revenue projections and growth drivers.
Strategic Planning
Financial Services
Outlines the projected revenue growth for 2024-2025 across various banking sectors, driven by strategic investments, market expansions, and performance in key financial areas. It details initiatives aimed at enhancing corporate and private banking revenues, along with improvements in asset management.
Revenue Growth, Strategic Planning, Investment Bank, Asset Management, Corporate Bank
false
Strategic Planning
Financial Services
Mixed Chart
Deutsche Bank
Add to my slides
Remove from favorites
The slide provides pie charts detailing revenue growth and tool fleet expansion. It features points about the benefits of advanced instrumentation and client distribution by region and phase.
Market Analysis and Trends
Financial Services
The slide emphasizes the company's revenue growth outpacing its tool fleet growth, suitable for strategic discussions on market expansion and technological advancements.
Revenue Growth, Tool Fleet, Market Expansion, Technological Advancements, Client Distribution
false
Market Analysis and Trends
Financial Services
Multiple Chart
Morgan Stanley
Add to my slides
Remove from favorites
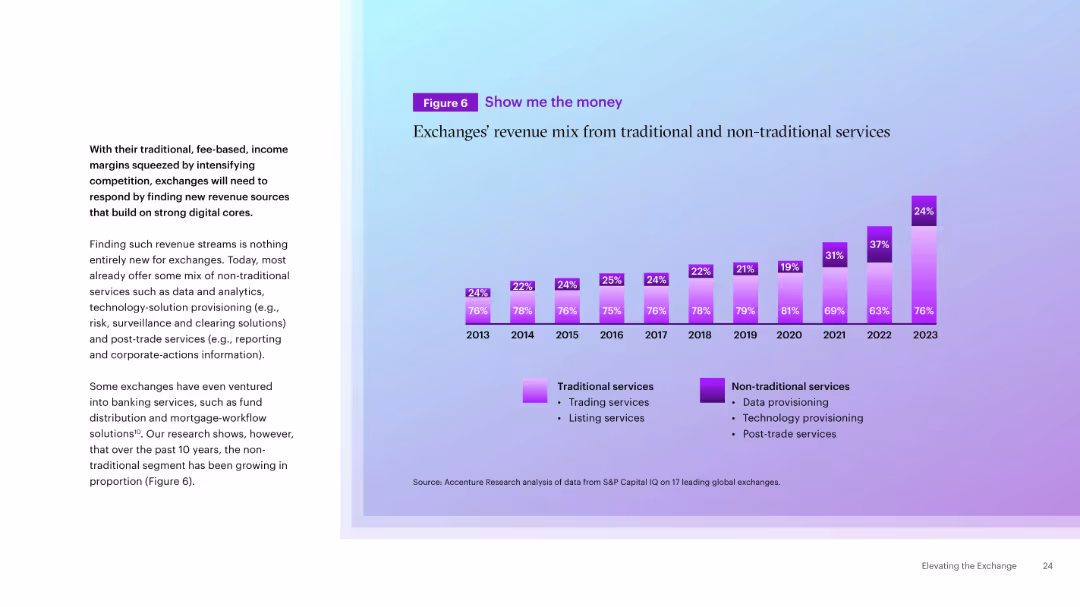
Stacked bar chart showing revenue mix evolution from 2013 to 2023, distinguishing traditional vs. non-traditional services. Supporting text on left.
Financial Performance
Financial Services
The slide tracks how exchanges have shifted revenue generation toward non-traditional services over a decade. It underscores the growing role of tech-based offerings as margins from traditional trading services continue to be squeezed.
Revenue Mix, Traditional Services, Non-Traditional, Exchanges, Trends, Financial, Trading, Innovation
false
Financial Performance
Financial Services
Mixed Chart
Accenture
Add to my slides
Remove from favorites
This slide combines header with icons to discuss strategies for protecting revenue in advertising, including pricing optimization and scaling of ad products.
Strategic Planning
Media & Entertainment
Offers strategies for media companies to protect and increase revenue in advertising by optimizing pricing and embracing new ad products that cater to digital platforms.
Revenue Protection, Media, Advertising, Pricing Optimization, Product Scaling, Strategy, Digital Platforms
false
Strategic Planning
Media & Entertainment
Header Vertical
Accenture
Add to my slides
Remove from favorites
Slide features diagrams and charts detailing revenue segmentation, and circular arrows showing business model components.
Financial Performance
Financial Services
Breakdown of revenue streams and business model for a financial institution, essential for financial analysis and business strategy discussions.
Revenue analysis, business model, financial services, segmentation, assets
false
Financial Performance
Financial Services
Multiple Chart
JP Morgan
Add to my slides
Remove from favorites
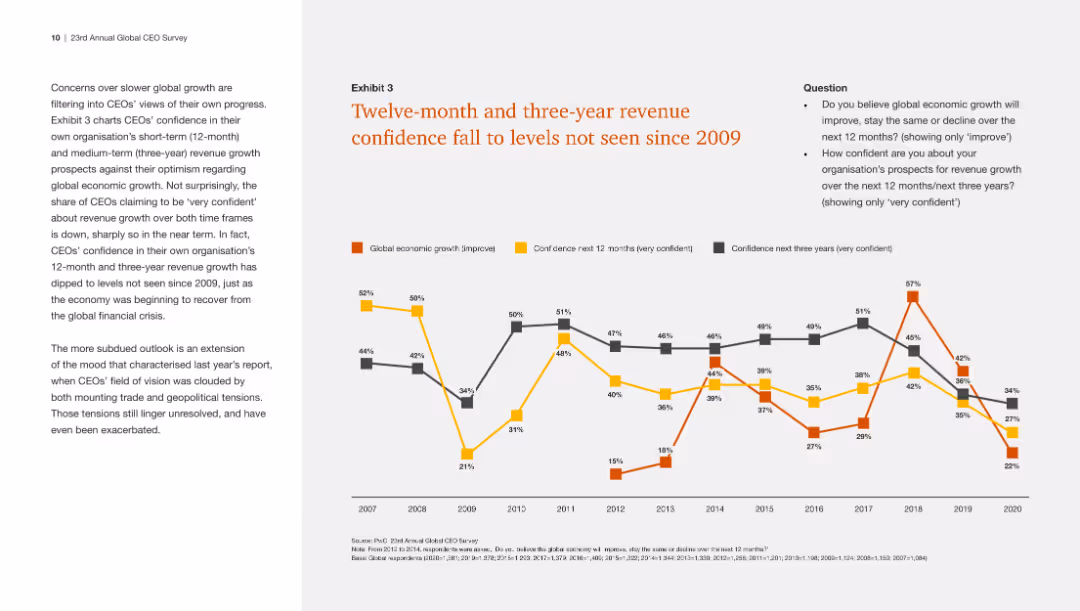
The slide contains a line chart comparing global economic growth confidence with CEOs' confidence in their own revenue growth over the next 12 and 36 months from 2007 to 2020.
Market Analysis and Trends
Financial Services
This slide shows a significant decline in CEOs' confidence in revenue growth, aligning with low confidence in global economic growth, not seen since the global financial crisis.
Revenue confidence, economic growth, CEO outlook, long-term trends
false
Market Analysis and Trends
Financial Services
Mixed Chart
PwC/Strategy&
Add to my slides
Remove from favorites
Two pie charts comparing firmwide revenue by region and segment, additional infographics for headcount diversity. Blue and white color scheme with a structured layout.
Strategic Planning
Financial Services
Explores the international revenue distribution by region and segment and highlights diversity in workforce composition, emphasizing the company's global market reach.
Revenue distribution, diversity, global market, segmentation
false
Strategic Planning
Financial Services
Mixed Chart
Goldman Sachs
Add to my slides
Remove from favorites
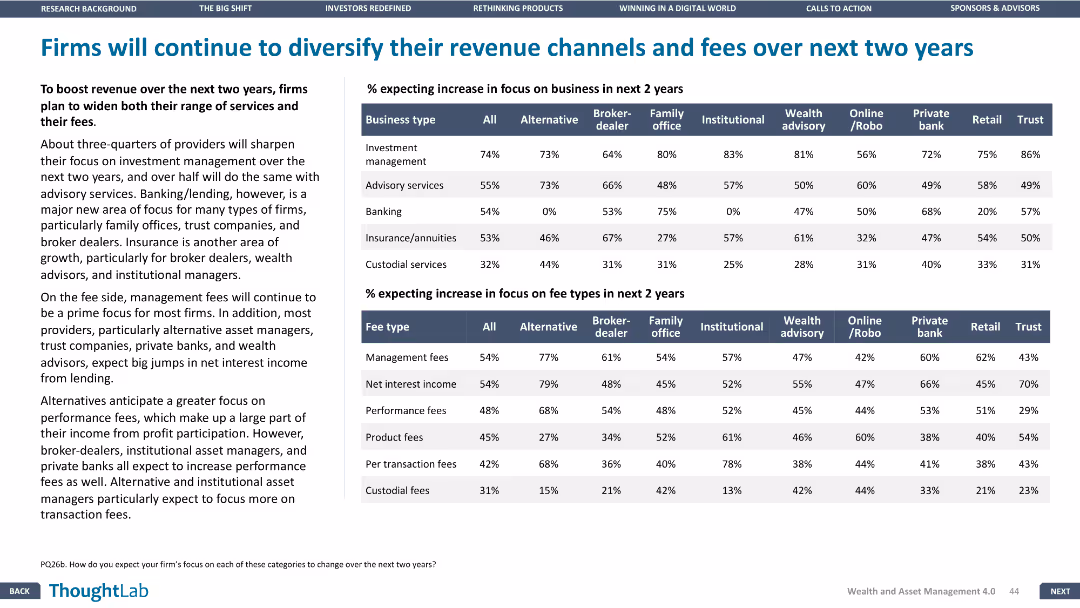
This slide features two tables and a column chart. The layout is dense and information-heavy, showing multiple data points about expected increases in business focus and fee types over the next two years.
Strategic Planning
Financial Services
The slide projects how firms plan to diversify their revenue channels and fees in the next two years, with data on the expected increase in focus on various business types and fee types.
Revenue diversification, fee types, future planning, business focus, projections
false
Strategic Planning
Financial Services
Header Vertical
Deloitte
Add to my slides
Remove from favorites
Multiple graphs including a column chart for net revenue performance, and line charts for spreads, unemployment, and household debt.
Financial Performance
Financial Services
This slide showcases SP’s revenue diversification and stable performance through various economic cycles, highlighting key financial metrics.
Revenue diversification, performance, economic cycles, financial metrics, net revenue
false
Financial Performance
Financial Services
Multiple Chart
Credit Suisse
Add to my slides
Remove from favorites
The slide features column charts and a pie chart to show sector revenue diversification across various sectors including Pharma, Public Sector, GAFA, and CPG.
Market Analysis and Trends
Financial Services
The slide presents a revenue growth analysis of different sectors, highlighting CAGR from 2019-2022 and the share of revenue by sector in 2022.
Revenue diversification, sector analysis, column chart, pie chart, CAGR
false
Market Analysis and Trends
Financial Services
Multiple Chart
IPSOS
Add to my slides
Remove from favorites
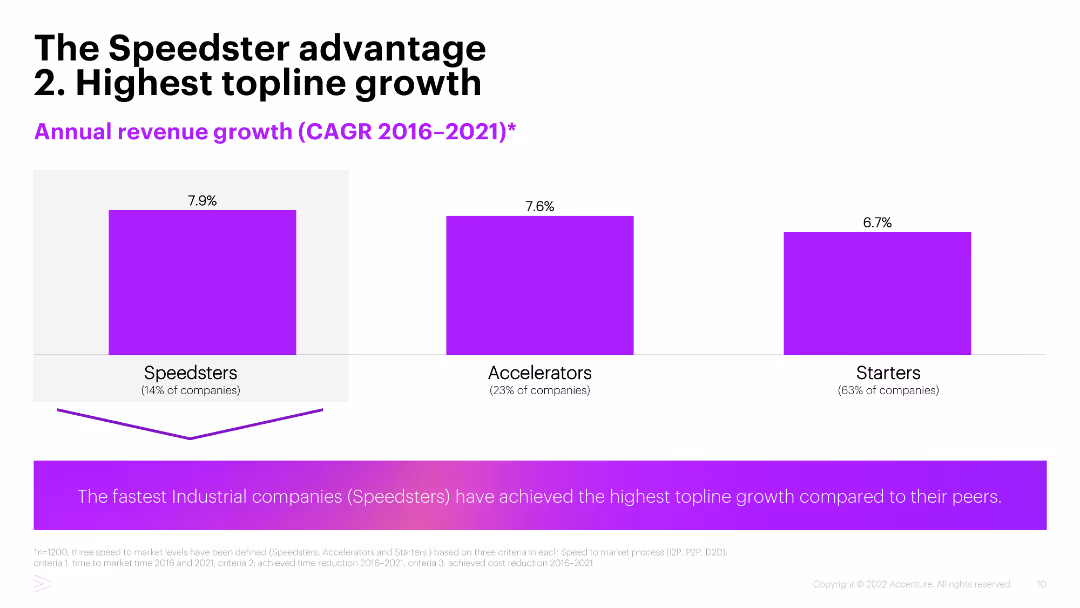
Three column charts showing annual revenue growth (CAGR 2016-2021) for Speedsters, Accelerators, and Starters, with Speedsters achieving the highest growth.
Financial Performance
Industrial & Manufacturing
The slide highlights the annual revenue growth achieved by industrial companies categorized as Speedsters, Accelerators, and Starters, with Speedsters leading in topline growth.
Revenue growth, CAGR, Speedsters, Industrial companies, Financial performance
false
Financial Performance
Industrial & Manufacturing
Mixed Chart
Accenture
Add to my slides
Remove from favorites
Side-by-side bar charts and bullet points showing revenue growth opportunities for Private Clients and Corporate & Institutional Clients.
Strategic Planning
Financial Services
Highlights strategies for driving revenue growth through recurring commissions, fees, and transaction-based revenues.
Revenue growth, Private Clients, Corporate Clients, strategy, commissions
false
Strategic Planning
Financial Services
Multiple Chart
Credit Suisse
Add to my slides
Remove from favorites
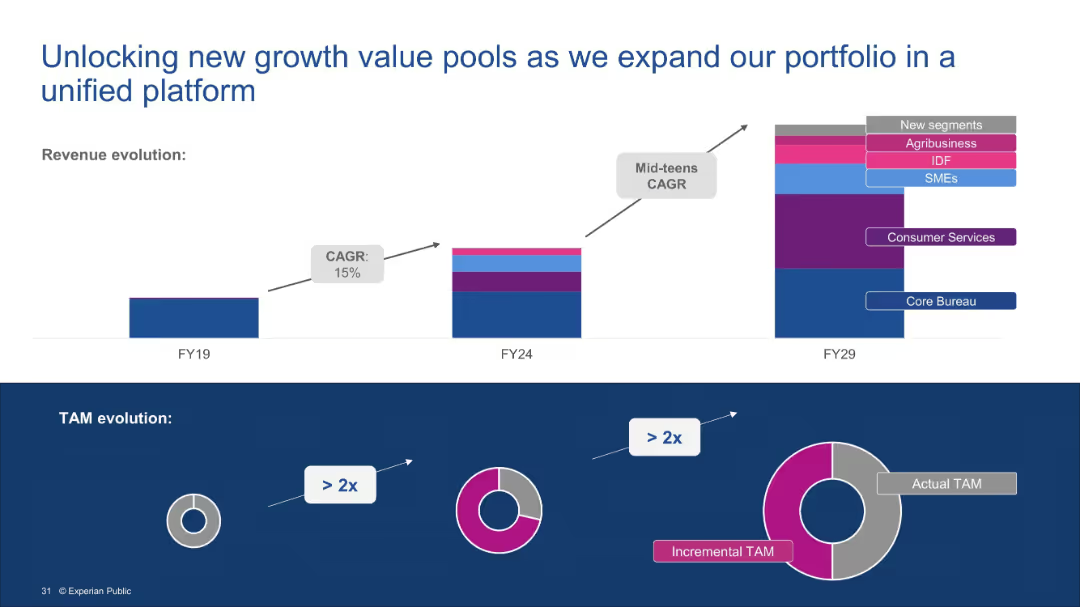
Split into two visual sections. Top: stacked bar chart showing revenue evolution across fiscal years. Bottom: three-part TAM evolution diagram indicating growth potential.
Financial Performance
Financial Services
This slide illustrates how Experian’s expanding service portfolio—from Core Bureau to new segments like agribusiness and SMEs—drives revenue growth. It highlights a projected CAGR and demonstrates how incremental TAM more than doubles the original market opportunity.
Revenue growth, TAM, New segments, Core Bureau, Agribusiness, SMEs, Portfolio expansion, CAGR
false
Financial Performance
Financial Services
Multiple Chart
Barclays
Add to my slides
Remove from favorites
A split-content layout with a column chart, line items, and text boxes to describe reinvestment in business.
Financial Performance
Financial Services
Illustrates how changes in the rate environment impacted revenue and the strategy for reinvestment.
Revenue growth, investment expense, net interest income, non-interest revenue, business reinvestment
false
Financial Performance
Financial Services
Multiple Chart
JP Morgan
Add to my slides
Remove from favorites
The slide has four column charts, comparing financial metrics with competitors. The colors and data points are clearly marked.
Financial Performance
Financial Services
Showcases the year-on-year growth in revenue, net income, ROTCE, and overhead ratios compared to competitors.
Revenue growth, net income, ROTCE, overhead ratio, financial comparison
false
Financial Performance
Financial Services
Multiple Chart
JP Morgan
Add to my slides
Remove from favorites
This slide has pie charts depicting "Asset Management Revenue Mix Shift" and bar charts showing "Firmwide Average Fee Rates." It's a well-structured and balanced layout with a combination of dark and light blue color schemes.
Financial Performance
Financial Services
The slide presents a financial analysis of asset management revenue mix over time and firmwide average fee rates. It indicates strategic financial shifts towards certain investment types and shows the growth in management and incentive fees, implying a plan for improving revenue durability and mix.
Revenue mix, Asset management, Fee rates, Financial analysis, Durability
false
Financial Performance
Financial Services
Multiple Chart
Goldman Sachs
Add to my slides
Remove from favorites
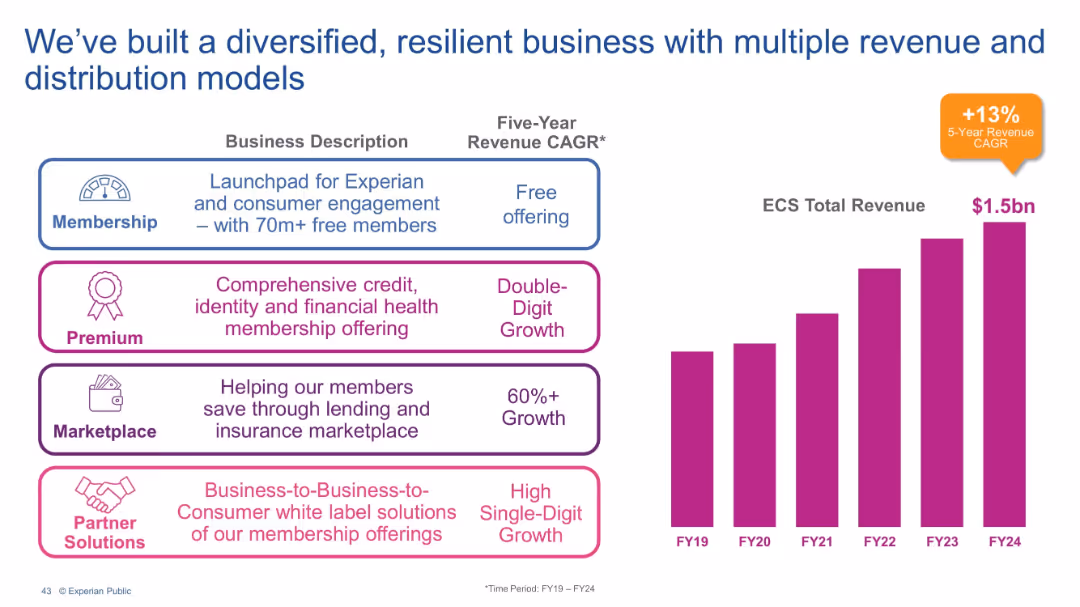
Split into two parts: business model breakdown on left (Membership, Premium, Marketplace, Partner Solutions) and revenue bar chart on right.
Financial Performance
Technology & Software
The slide presents Experian's diversified business models and revenue growth. It categorizes offerings by user type and growth trajectory, with supporting data on ECS revenue growing to $1.5bn over five years at a 13% CAGR.
Revenue model, Membership, Premium services, Marketplace, Partner Solutions, ECS revenue, Growth strategy
false
Financial Performance
Technology & Software
Mixed Chart
Barclays
Add to my slides
Remove from favorites
Slide includes column chart showing revenue distribution over years and textual information organized in bullet points on the right side.
Financial Performance
Financial Services
This slide presents the evolution of revenue streams from 2020 to 2023, highlighting the financial growth in various banking sectors such as Investment, Corporate, and Private Banking. It emphasizes strategic investments and innovations that have propelled client engagement and financial growth.
Revenue, Banking, Strategic Growth, Client Engagement, Financial Trends
false
Financial Performance
Financial Services
Mixed Chart
Deutsche Bank
Add to my slides
Remove from favorites
Slide includes multiple column charts and bullet points comparing various financial metrics like revenue CAGR, CIR development, RoTE development, and CET1 ratio across different quarters.
Performance Metrics and KPIs
Financial Services
This slide presents key performance indicators for a bank, highlighting trends in revenue, costs, returns on equity, and capital ratios, essential for financial analysis and strategic planning.
Revenue, CIR, RoTE, CET1, financial analysis
false
Performance Metrics and KPIs
Financial Services
Multiple Chart
Deutsche Bank
Add to my slides
Remove from favorites
Features an image of a student with headphones using a laptop on the left and two content columns on the right with icons. The slide is clear and uses a split-layout design.
Operational Efficiency
Financial Services
Details strategies to maximize revenue and manage costs within core business operations, suitable for financial and operational strategy discussions.
Revenue, Cost Management, Market Share, Operational Strategy
false
Operational Efficiency
Financial Services
Header Horizontal
Morgan Stanley
Add to my slides
Remove from favorites
Contains two pie charts contrasting current and future revenue composition, with an arrow indicating the strategic direction. The charts are supported by a clean, minimalist design.
Financial Performance
Financial Services
Highlights strategies to improve revenue durability and return on equity, indicating a planned shift in segment revenue composition, and emphasizing the growth of management and incentive fees.
Revenue, Durability, Returns, Management Fees
false
Financial Performance
Financial Services
Diagram
Goldman Sachs
Add to my slides
Remove from favorites
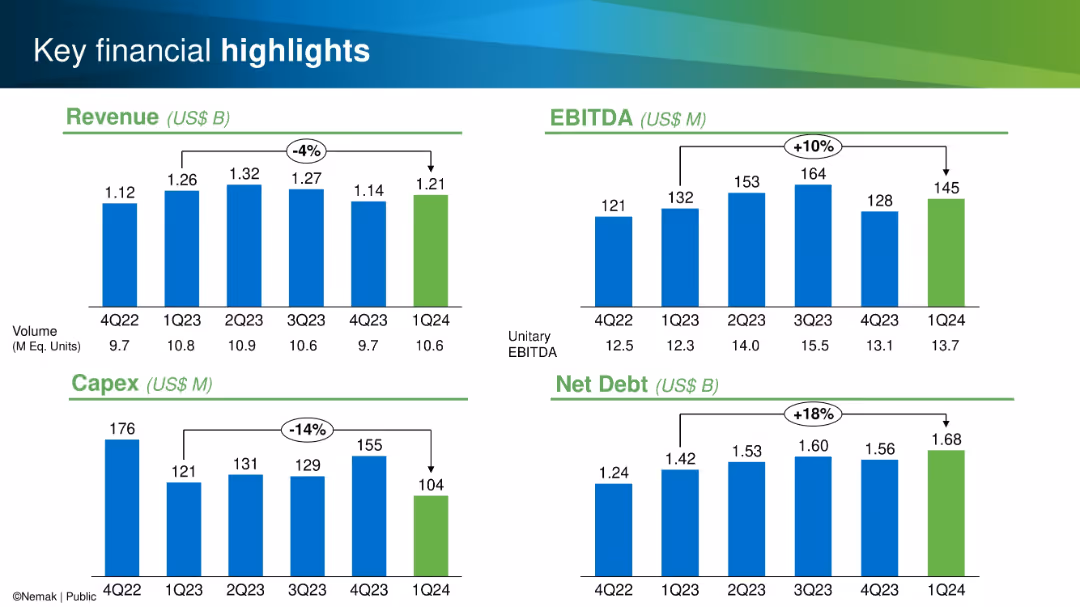
Four quadrant bar chart layout; metrics for Revenue, EBITDA, Capex, and Net Debt shown with color-coded bars
Financial Performance
Industrial & Manufacturing
This slide highlights quarterly performance metrics: revenue, EBITDA, capex, and net debt from Q4 2022 to Q1 2024. Trends and percentage changes are clearly marked to emphasize performance fluctuations and financial trajectory.
Revenue, EBITDA, Capex, Net Debt, Financials, Quarterly, Performance, Manufacturing, Metrics, Trends
false
Financial Performance
Industrial & Manufacturing
Single Chart
Barclays
Add to my slides
Remove from favorites
The slide contains two separate column chart visualizations, one displaying the revenue mix and the other revenues by segment, with a legend explaining the color coding. A green line graph overlays the first chart. There's a dark blue header and page number in the bottom right.
Financial Performance
Financial Services
Focusing on the financial sector, this slide presents the organization's revenue mix and segment revenues over five years, showcasing growth and diversification. It's suitable for financial reviews, stakeholder meetings, or investor briefings to illustrate financial stability and growth trends, serving as evidence of financial success and strategic diversification.
Revenue, Financial Services, Growth, Diversification, Stability, Performance, Segmentation
false
Financial Performance
Financial Services
Multiple Chart
Goldman Sachs
Add to my slides
Remove from favorites
This slide is densely populated with financial data tables and column chart comparing net revenues by segment. The tables are detailed with numerous financial metrics and the graphs use blue bars, all set against a white background.
Financial Performance
Financial Services
Provides a comprehensive financial review of the company, with detailed analytics of revenue segments and profitability. Can be utilized for in-depth financial analysis or to inform stakeholders about the company's financial health.
Revenue, Financial, Banking, Management, EPS
false
Financial Performance
Financial Services
Mixed Chart
Goldman Sachs
Add to my slides
Remove from favorites
Previous
Next
You don't have any favorites yet.
Please wait loading your favorites slides...
Create a FREE account to continue browsing
Receive Instant Access to 1,000+ slides from companies like McKinsey, Google, and Goldman Sachs
First Name
Last Name
Email
Password
I agree to all
Terms & Privacy Policy
Thank you! Your submission has been received!
Oops! Something went wrong while submitting the form.
Have an account?
Sign in
Upgrade to PRO to Save slides
Advanced Search and Filters
Access to 15,000+ slides
Access to Category Pages
Save/Bookmark Slides
PowerPoint Template Library
Pick a Plan
MONTHLY
$12/month
Billed every month, Cancel anytime.
YEARLY
$9/year
Billed $108 annually, Cancel anytime.
Checkout for $12/month
Checkout for $108/yr
Secured by Stripe | AES-256 bit encryption