My Account
My Slides
Search by Category
Pricing
Templates
View All Templates
Download Template Slides
✦ AI Search
Feedback
Login
Logout
Get Started
Browse all Slides
Browse all Slides
Create a FREE Account
Instant access to 1,000+ real slides from top companies like McKinsey, BCG, Goldman Sachs, Google and many more!
First Name
Last Name
Email
Password
I agree to all
Terms & Privacy Policy
Thank you! Your submission has been received!
Oops! Something went wrong while submitting the form.
Have an account?
Sign in
Saved Slides
Total No. of slides saved
0
↻ Refresh
✖ Clear all
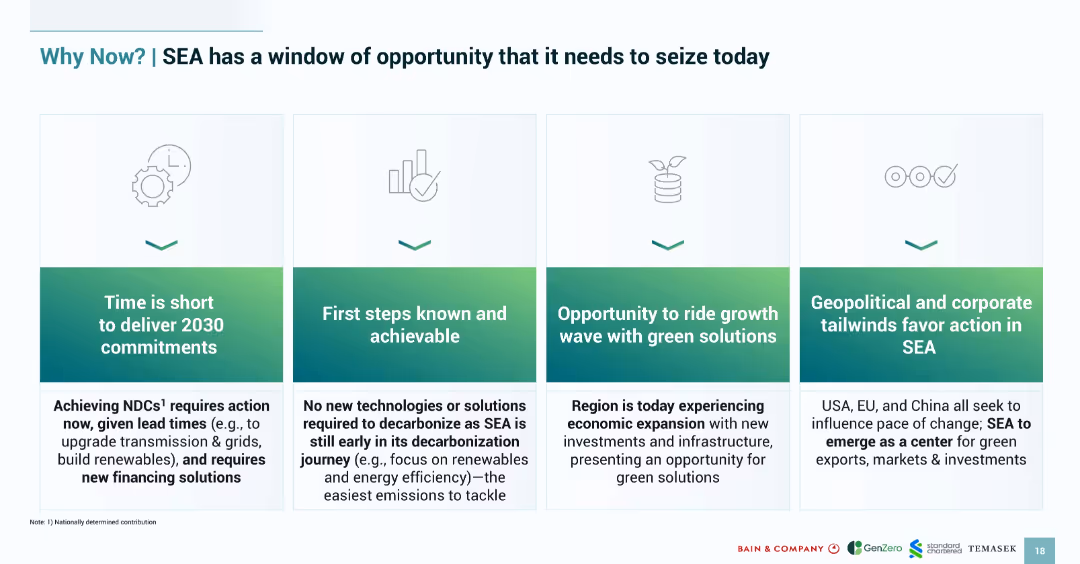
Four-tile layout with icons and captions outlining urgent reasons for SEA to act on green transition; soft green gradient background.
Strategic Planning
Environmental Services & Sustainability
Lays out four reasons why Southeast Asia must act now on decarbonization: short timelines, actionable steps, economic growth synergy, and geopolitical support. Emphasizes urgency and achievability.
SEA, decarbonization, urgency, opportunity, strategic timing, green transition
false
Strategic Planning
Environmental Services & Sustainability
Pillar
Bain
Add to my slides
Remove from favorites
Column charts with blue bars represent the digital economy GMV of SEA countries from 2022 to 2030.
Market Analysis and Trends
Technology & Software
The slide shows projected growth in the digital economy GMV for different SEA countries, highlighting Vietnam and the Philippines.
SEA, digital economy, GMV, growth forecast, Vietnam, Philippines
false
Market Analysis and Trends
Technology & Software
Multiple Chart
Bain
Add to my slides
Remove from favorites
This slide displays two sets of column charts for the years 2015 and 2025, indicating eComm market sizes and percentages.
Market Analysis and Trends
Retail & E-commerce
The slide presents a forecast for the eComm market growth in SEA by 2025, focusing on the increase in market value and percentage of retail. Indonesia's significant market share is highlighted, as are the growth rates for other SEA countries.
SEA, eCommerce, Indonesia, growth, forecast
false
Market Analysis and Trends
Retail & E-commerce
Multiple Chart
Bain
Add to my slides
Remove from favorites
Detailed slide with multiple bar charts, graphs, and text annotations reviewing SEA's current status and the gap to meeting global emissions targets.
Regulatory and Compliance
Government & Public Sector
Analyzes the shortcomings in SEA's efforts to meet global climate commitments, emphasizing the need for increased action and policy adjustments.
SEA, emissions gap, climate targets, policy adjustments, bar charts
false
Regulatory and Compliance
Government & Public Sector
Multiple Chart
Bain
Add to my slides
Remove from favorites
Incorporates a detailed comparative chart mapping out emissions targets and carbon policies across several SEA countries.
Regulatory and Compliance
Government & Public Sector
Discusses the formation of national climate ambitions within SEA, focusing on emissions targets and carbon pricing strategies.
SEA, emissions targets, carbon pricing, climate policy
false
Regulatory and Compliance
Government & Public Sector
Table
Bain
Add to my slides
Remove from favorites
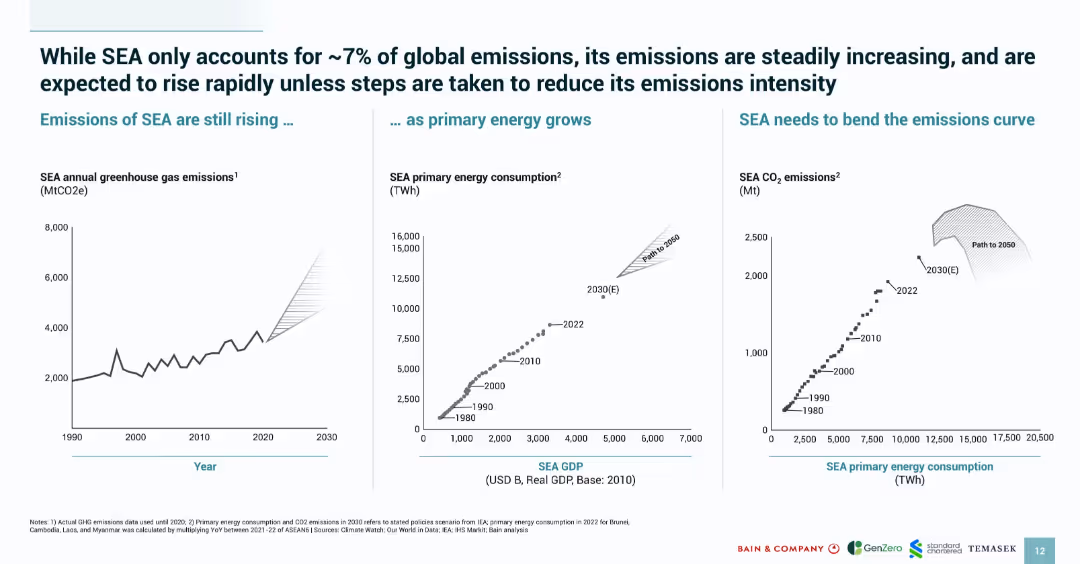
Three-panel graph layout with emission trends, GDP vs. energy, and energy vs. CO₂; green-blue branding with minimal text.
Risk Assessment and Management
Environmental Services & Sustainability
Shows SEA’s increasing greenhouse emissions linked to growing energy consumption and economic activity. Warns that emissions will rise significantly unless curve is bent by 2050. Serves as a call to action for emission intensity reduction.
SEA, emissions, CO₂, energy consumption, GDP, risk, sustainability
false
Risk Assessment and Management
Environmental Services & Sustainability
Multiple Chart
Bain
Add to my slides
Remove from favorites
Slide includes stacked column charts depicting sectorial carbon emissions across SEA countries, complemented by a pie chart showing regional emissions distribution.
Market Analysis and Trends
Environmental Services & Sustainability
Provides a detailed visual breakdown of carbon emissions by sector in SEA, essential for environmental researchers and policy makers focusing on targeted emission reduction strategies.
SEA, emissions, carbon, sectors, bar graphs, pie chart, energy, agriculture, forestry, land use change, data presentation
false
Market Analysis and Trends
Environmental Services & Sustainability
Multiple Chart
Bain
Add to my slides
Remove from favorites
The slide contains a mix of textual content and icons representing environmental and economic challenges, including emissions data and investment needs. It's structured to emphasize the strategic planning required to address these issues.
Strategic Planning
Environmental Services & Sustainability
Discusses the strategic environmental and economic challenges faced by Southeast Asia, highlighting the region's need to address a significant emission gap and the financial investment required to meet sustainability goals by 2030.
SEA, emissions, investment, sustainability, strategic planning
false
Strategic Planning
Environmental Services & Sustainability
Header Horizontal
Bain
Add to my slides
Remove from favorites
Vertical stacked bar chart visualizing 2020 GHG emissions in Southeast Asia by category and sub-sources; minimal text.
Market Analysis and Trends
Environmental Services & Sustainability
Visual representation of emission sources in Southeast Asia in 2020. Major contributors include land use change, power, cement, and livestock. Aims to inform investment decisions by showing emission-heavy sectors.
SEA, emissions, land use, cement, power, livestock, GHG, chart
false
Market Analysis and Trends
Environmental Services & Sustainability
Single Chart
Bain
Add to my slides
Remove from favorites
The slide presents a blue and white color scheme with a column chart showing the SEA food delivery GMV from 2019 to 2025, including a CAGR percentage. Text blocks provide additional insights aligned with bullet points. The layout is clear, utilizing both graphical and textual information efficiently.
Market Analysis and Trends
Technology & Software
This slide provides an overview of the food delivery market growth in Southeast Asia, highlighting trends during and after the pandemic, consumer behavior changes, and strategic focus areas for companies for sustainable growth. It's suitable for market analysis and strategy planning.
SEA, food delivery, pandemic, market growth, consumer behavior, profitability, underpenetrated market, sustainability
false
Market Analysis and Trends
Technology & Software
Mixed Chart
Bain
Add to my slides
Remove from favorites
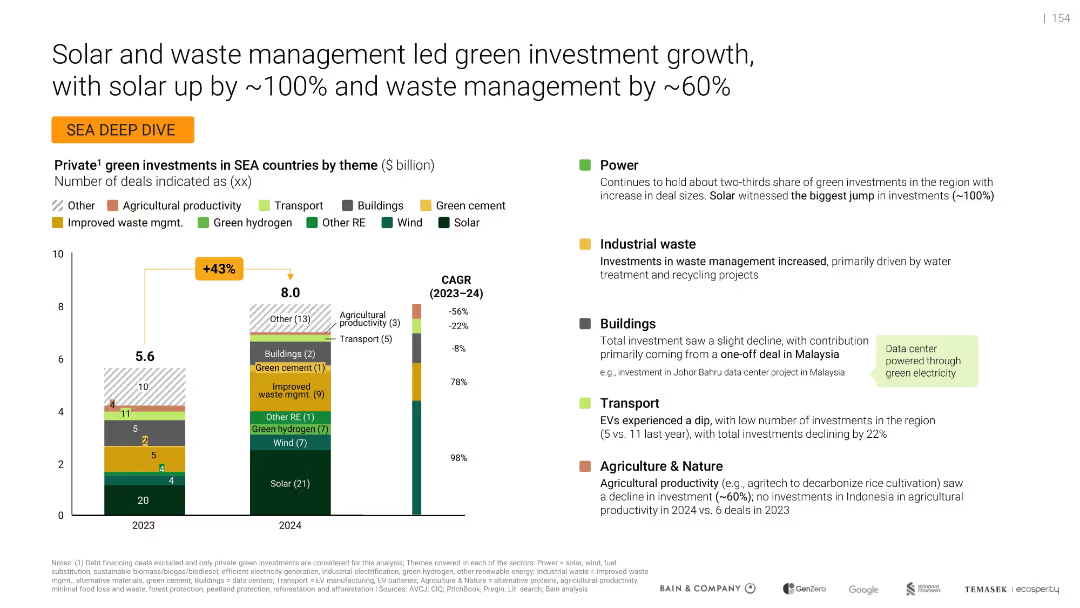
Vertical bar charts with CAGR callouts; text commentary on sector-level trends
Market Analysis and Trends
Environmental Services & Sustainability
Analyzes green investment trends in SEA from 2023–2024. Solar investments nearly doubled while waste management rose 60%. Transport investments declined. Key investment themes include renewables and industrial waste, with commentary on sector performance and country-specific highlights.
SEA, green investment, solar, waste management, CAGR, transport, industrial waste, renewables, buildings
false
Market Analysis and Trends
Environmental Services & Sustainability
Mixed Chart
Bain
Add to my slides
Remove from favorites
The slide shows a bar chart with VC investment percentages relative to GDP in different regions and a descriptive text block.
Investment Analysis
Financial Services
Highlighting the investment needed to grow the SEA internet economy to $200 billion, the slide compares VC investment as a percentage of GDP among various regions.
SEA, internet economy, investment, VC, GDP
false
Investment Analysis
Financial Services
Single Chart
Bain
Add to my slides
Remove from favorites
Includes two column charts and a map visualizing internet user growth in SEA compared to other regions and countries, with descriptive text boxes.
Market Analysis and Trends
Technology & Software
Analysis of the Southeast Asian internet market, highlighting its rapid growth with a focus on Indonesia. The use of column charts and regional maps illustrates the comparative analysis with other countries.
SEA, internet, growth, Indonesia, column chart, comparative
false
Market Analysis and Trends
Technology & Software
Multiple Chart
Bain
Add to my slides
Remove from favorites
Features line graphs for travel-related search trends in six SEA countries against a dashed line indicating average pre-pandemic interest. The layout is uncluttered, prioritizing clarity.
Market Analysis and Trends
Hospitality & Tourism
Highlights the resurgence in online travel interest in SEA countries, comparing current search trends to pre-pandemic levels to predict market demand.
SEA, online travel, search trends, market demand, pre-pandemic levels, Indonesia, Malaysia, Philippines
false
Market Analysis and Trends
Hospitality & Tourism
Multiple Chart
Bain
Add to my slides
Remove from favorites
Features a timeline layout with icons and brief descriptions of significant environmental and policy announcements across SEA countries.
Industry Overview
Government & Public Sector
Highlights key environmental and policy initiatives taken by SEA countries over the past year to address climate and sustainability challenges.
SEA, policy, environmental initiatives, timeline, climate strategy
false
Industry Overview
Government & Public Sector
Vertical Flow
Bain
Add to my slides
Remove from favorites
Contains bullet points and icons related to renewables, electric mobility, and sustainable farming, aligned in a clear, engaging format.
Strategic Planning
Environmental Services & Sustainability
Provides insights into future investment focuses in Southeast Asia, particularly in sustainable and renewable sectors.
SEA, renewable energy, investment focus, sustainability, strategic planning
false
Strategic Planning
Environmental Services & Sustainability
Header Vertical
Bain
Add to my slides
Remove from favorites
Slide with number 2, several column charts showing startups by country and stage, a pie chart depicting startup distribution by sector, and bullet points summarizing the data.
Market Analysis and Trends
Technology & Software
This slide offers a detailed view of startups in Southeast Asia, focusing on their distribution across countries, development stages, and sectors. It highlights the concentration of startups in Singapore, Indonesia, and Vietnam, mainly in the eCommerce sector, reflecting market trends and potential investment targets.
SEA, startups, concentration, stages, eCommerce, market distribution, sector analysis
false
Market Analysis and Trends
Technology & Software
Multiple Chart
Bain
Add to my slides
Remove from favorites
Dense layout with column chart and icons detailing corporate sustainability efforts and partnerships across the SEA region.
Strategic Planning
Government & Public Sector
Outlines the roles of businesses in SEA in advancing sustainability, including commitments, partnerships, and innovations.
SEA, sustainability, business leadership, corporate initiatives
false
Strategic Planning
Government & Public Sector
Mixed Chart
Bain
Add to my slides
Remove from favorites
Icons detailing significant sustainability milestones and regional collaboration efforts within SEA nations.
Industry Overview
Government & Public Sector
Reviews recent sustainability progress and ongoing challenges in Southeast Asia, emphasizing the need for further efforts towards achieving Net Zero.
SEA, sustainability, government actions, regional collaboration, Net Zero
false
Industry Overview
Government & Public Sector
Header Vertical
Bain
Add to my slides
Remove from favorites
Contains icons and brief text blocks in a clean layout highlighting key opportunities for SEA in sustainability sectors like energy, nature, and corporate structure.
Market Analysis and Trends
Environmental Services & Sustainability
Discusses SEA's potential for sustainability leadership, focusing on renewable energy, infrastructural improvements, and corporate roles in sustainability, targeting business strategists and environmental advocates.
SEA, sustainability, renewable energy, corporate strategies, icons, opportunities, market analysis, text blocks, clean layout
false
Market Analysis and Trends
Environmental Services & Sustainability
Pillar
Bain
Add to my slides
Remove from favorites
Features a column chart detailing SEA transport GMV ($B) with projected figures from 2019 to 2025 and accompanying CAGR. A blue and white design, text is arranged in bullet points next to yellow markers for easy reading.
Market Analysis and Trends
Transportation & Logistics
Discusses the post-pandemic recovery of the SEA transport sector, emphasizing the uptick in mobility and associated profitability, with strategic insights on overcoming market challenges and achieving growth.
SEA, transport, recovery, mobility, profitability, supply shortages, penetration, urbanization
false
Market Analysis and Trends
Transportation & Logistics
Mixed Chart
Bain
Add to my slides
Remove from favorites
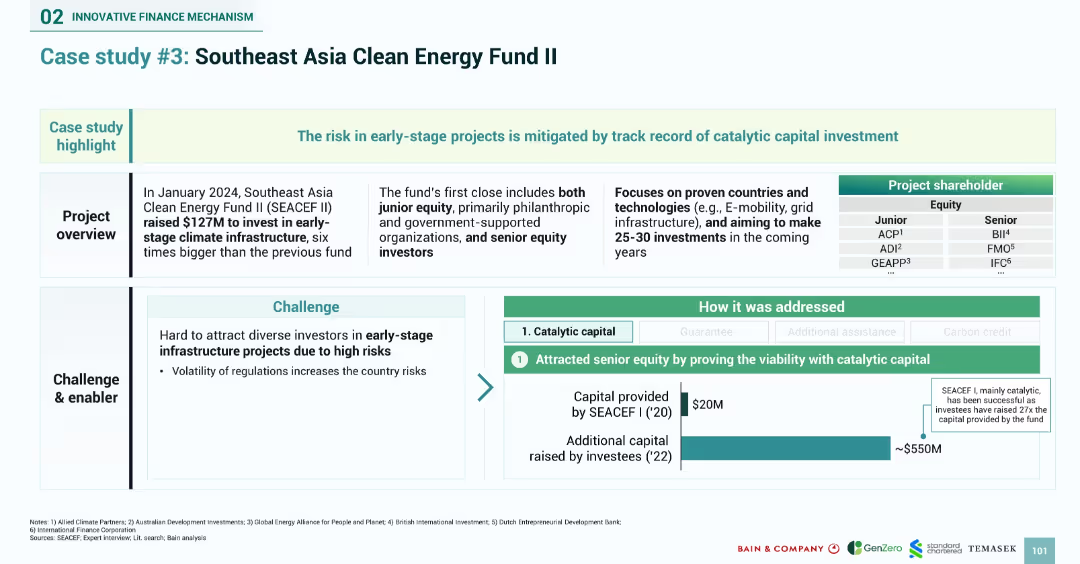
Split layout with a boxed project overview, fund structure (junior/senior equity), and bar graph showing capital leverage. Key challenges and solutions listed below.
Investment Analysis
Financial Services
Presents the Southeast Asia Clean Energy Fund II (SEACEF II) as a catalytic capital model for early-stage infrastructure. Describes how $127M raised in 2024 aims to support 25–30 projects by using junior equity to attract senior equity. Addresses the challenge of high-risk perception by showing 27x capital leverage from original SEACEF I investments.
SEACEF, catalytic capital, infrastructure fund, clean energy, equity investment, Southeast Asia, case study, blended finance
false
Investment Analysis
Financial Services
Mixed Chart
Bain
Add to my slides
Remove from favorites
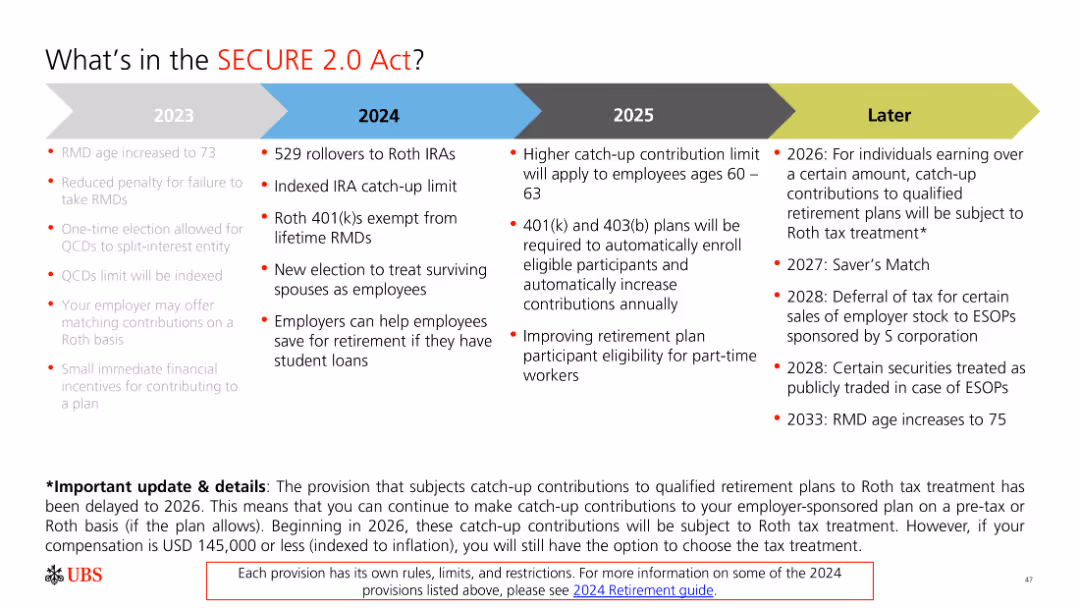
The slide includes a timeline and bullet points with text. It is moderately complex with clear visual differentiation between different years and provisions.
Regulatory and Compliance
Financial Services
The slide outlines key provisions of the SECURE 2.0 Act from 2023 to 2026 and later, emphasizing changes in retirement savings regulations.
SECURE Act, retirement, provisions, 2023, 2024, 2025, 2026
false
Regulatory and Compliance
Financial Services
Linear Flow
UBS
Add to my slides
Remove from favorites
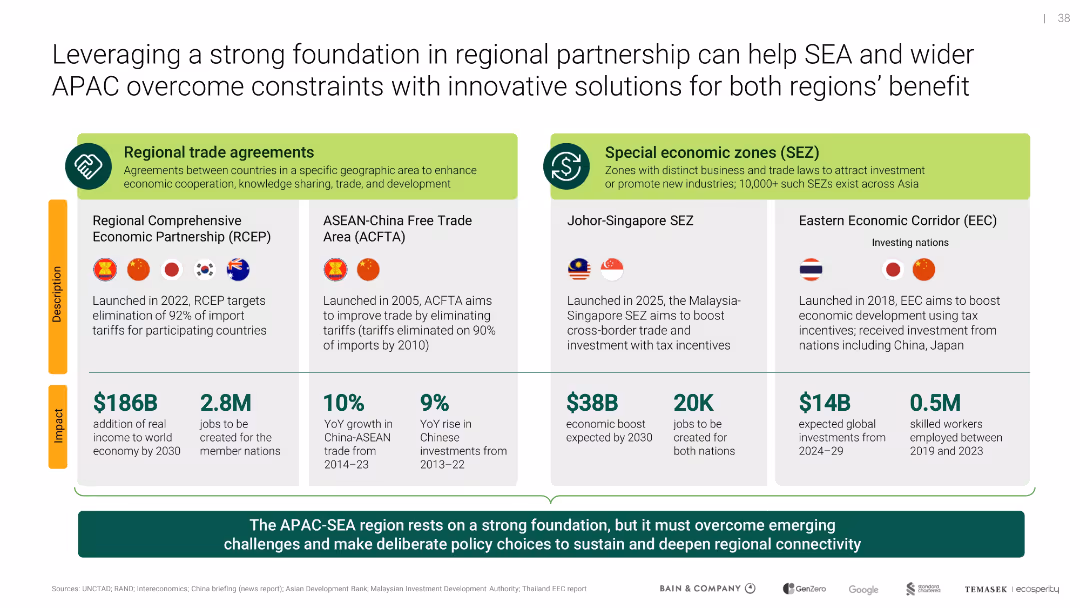
Split layout between trade agreements and SEZs; uses iconography and country flags; includes impact stats like GDP and job growth
Strategic Planning
Environmental Services & Sustainability
Describes how trade agreements and special economic zones (SEZs) across APAC and SEA can foster regional cooperation and economic growth while enabling shared climate solutions and investment flows.
SEZ, trade agreements, APAC, SEA, investment, regional cooperation
false
Strategic Planning
Environmental Services & Sustainability
Table
Bain
Add to my slides
Remove from favorites
Presents a timeline with icons and process maps outlining the steps to identify SG&A improvement opportunities.
Operational Efficiency
Professional Services
Describes a fast-track approach to identifying and implementing cost-saving measures across an organization.
SG&A, cost-saving, operational, improvement, timeline
false
Operational Efficiency
Professional Services
Diagram
Deloitte
Add to my slides
Remove from favorites
Contains a grey column chart comparing the SG&A of different companies, with a goal marker for staying below 14% of sales.
Operational Efficiency
Consumer Goods
Focuses on the operational effectiveness of maintaining low SG&A costs across various companies, with specific goals and benchmarks.
SG&A, operational efficiency, benchmark, competitors, goal
false
Operational Efficiency
Consumer Goods
Single Chart
Barclays
Add to my slides
Remove from favorites
Contains check marks, text boxes, icons in a three-step outline. Green color scheme dominant.
Technology and Digital Transformation
Technology & Software
Explains the three-step approach to data-led customer engagement using the SHoP framework.
SHoP, framework, customer engagement, CMOs, maturity
false
Technology and Digital Transformation
Technology & Software
Vertical Flow
BCG
Add to my slides
Remove from favorites
Scatter plot showing the spread of SIS scores by total paid amount with annotations.
Market Analysis and Trends
Government & Public Sector
Analyzes the correlation between SIS scores and the total paid amount, highlighting inconsistencies in funding based on assessed needs for NH's DD population.
SIS scores, total paid amount, funding analysis, support intensity scale, DD population, correlation, annualized costs, NH's DD population
false
Market Analysis and Trends
Government & Public Sector
Mixed Chart
Alvarez & Marsal
Add to my slides
Remove from favorites
This slide contains pie charts and column charts with accompanying text. There's a circular diagram showing percentages, all within a blue color scheme and clean layout.
Market Analysis and Trends
Financial Services
Showcases the distribution of Chase's small and medium-sized business clients by annual sales size and industry, with growth highlights. It serves to display the bank's role in helping businesses start, run, and grow, indicating market leadership and customer support.
SMB, Chase, Business growth, Market distribution, Sales size, Industry, Client support, Market leadership, Business services
false
Market Analysis and Trends
Financial Services
Multiple Chart
JP Morgan
Add to my slides
Remove from favorites
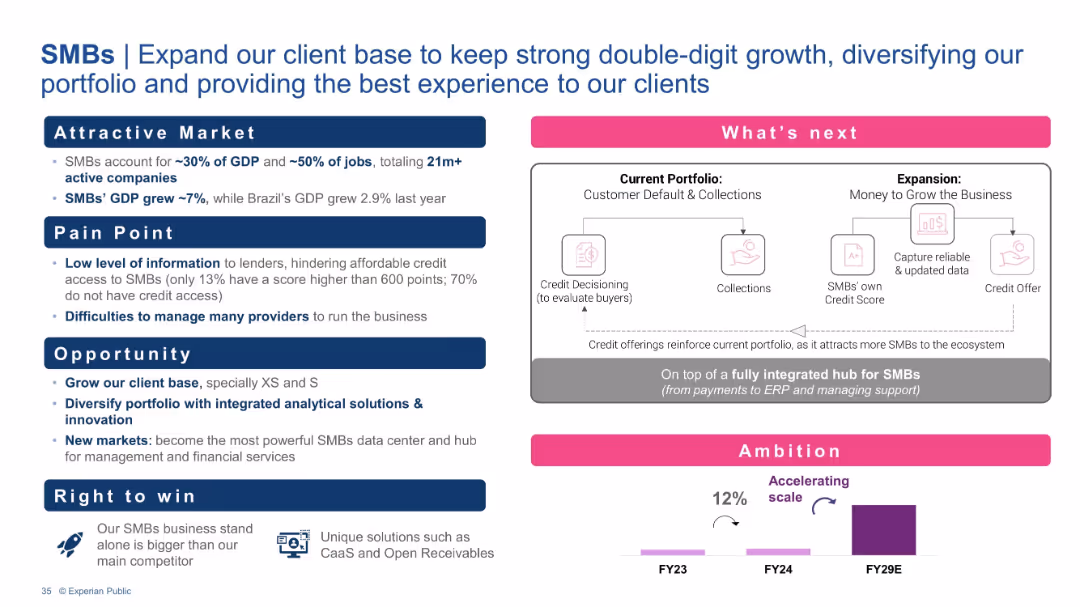
Pain-point/opportunity structure with market stats, a process diagram of Experian’s integrated hub, and an ambition chart.
Customer and Market Segmentation
Financial Services
This slide emphasizes the significance of SMBs in the economy and their challenges in accessing credit. Experian’s solution is a comprehensive data and financial hub, enabling expanded credit access and business growth, aiming for strong double-digit growth and market leadership.
SMBs, Credit access, Financial hub, Integrated solutions, GDP contribution, Data platform
false
Customer and Market Segmentation
Financial Services
Mixed Chart
Barclays
Add to my slides
Remove from favorites
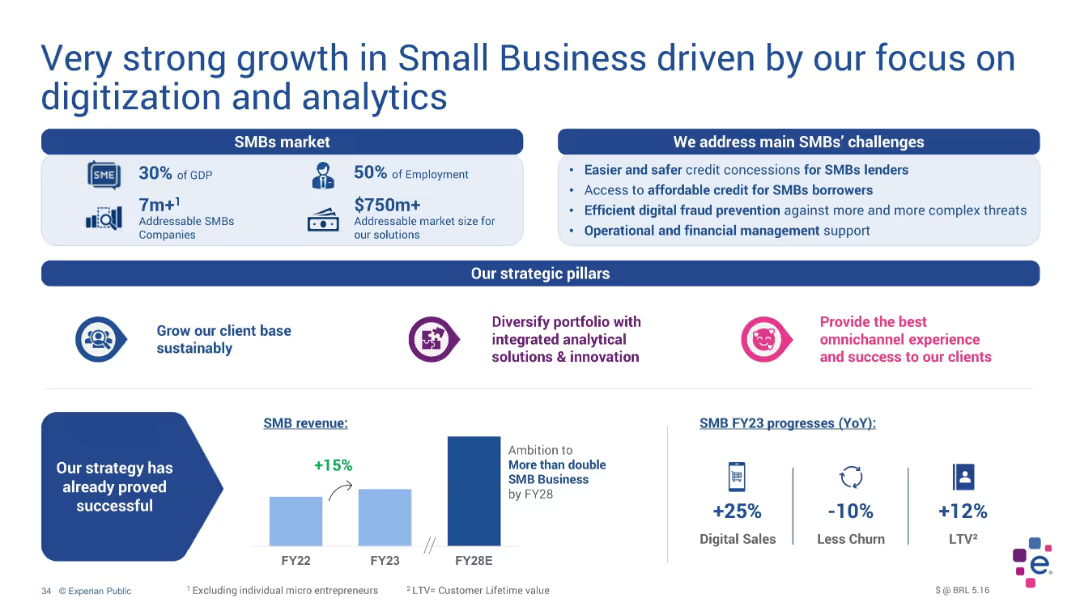
Three-section layout with stats, challenges, and strategic pillars; includes small bar chart and icons
Strategic Planning
Technology & Software
The slide outlines Experian's success in targeting SMBs, highlighting a 15% YoY revenue increase and ambitions to double by FY28. It presents key strategic pillars and FY23 progress metrics like churn reduction, digital sales growth, and LTV gains.
SMBs, digital sales, LTV, churn, strategy, growth, FY23, Experian
false
Strategic Planning
Technology & Software
Mixed Chart
Barclays
Add to my slides
Remove from favorites
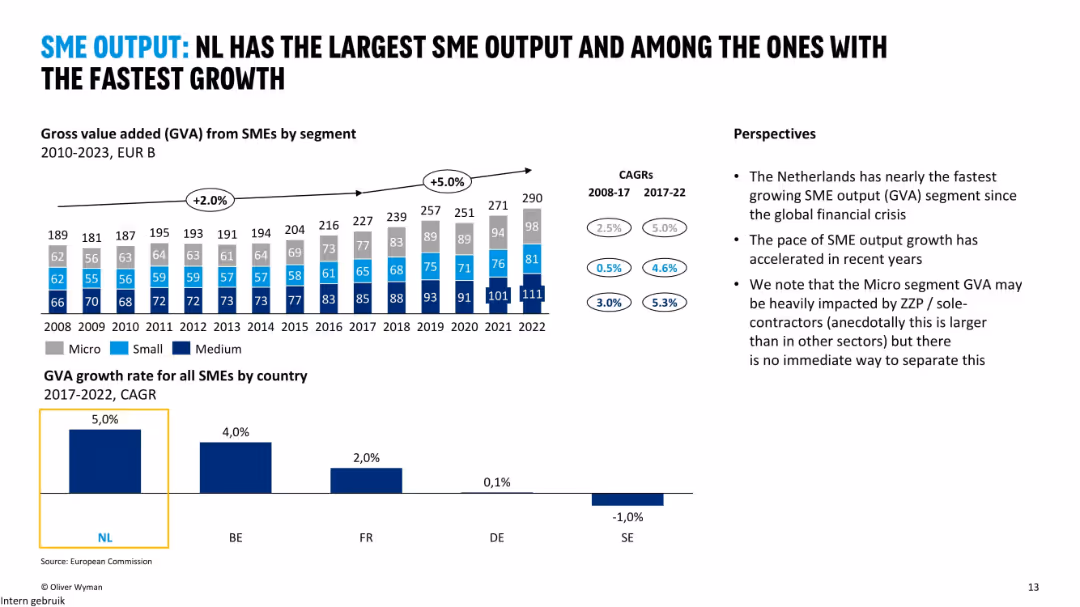
Bar and line charts showing SME GVA from 2008–2022, segment breakdowns, and growth rate comparisons by country; bullet points summarize insights.
Performance Metrics and KPIs
Financial Services
The slide emphasizes the Netherlands' high and accelerating SME output growth, especially in the Micro segment. It compares GVA by SME size and country, showing NL’s top performance in CAGR from 2017–2022.
SME GVA, NL, growth, micro segment, performance, CAGR, EU
false
Performance Metrics and KPIs
Financial Services
Multiple Chart
Oliver Wyman
Add to my slides
Remove from favorites
Column chart predicting net SME and corporate NPL inflow volume from 2010-2023, with different growth scenarios.
Market Analysis and Trends
Financial Services
The slide forecasts net SME and corporate NPL inflow volumes in Turkey from 2010-2023, analyzing various economic impacts and scenarios.
SME NPL, corporate NPL, growth forecast, economic analysis, financial projections, Turkey
false
Market Analysis and Trends
Financial Services
Mixed Chart
PwC/Strategy&
Add to my slides
Remove from favorites
A circular diagram slide depicting various digital solutions for end-to-end SME services with corresponding icons for each service category.
Technology and Digital Transformation
Financial Services
The slide showcases the ecosystem of digital solutions for SME services, suggesting a holistic approach to SME management. It's useful for understanding how digital services are becoming integrated to serve the end-to-end needs of small and medium enterprises.
SME Services, Digital Solutions, Ecosystem, Integration, Management
false
Technology and Digital Transformation
Financial Services
Diagram
Kearney
Add to my slides
Remove from favorites
Features logos of various start-ups in the SME services market, categorized by service type, against a cityscape background.
Competitive Landscape
Financial Services
The slide provides a snapshot of the start-up environment in the SME services sector, highlighting the market entry of specialized service providers. It's valuable for discussing the evolving competitive landscape and potential investment opportunities within the SME services space.
SME Services, Start-ups, Market Landscape, Service Providers, Investment Opportunities
false
Competitive Landscape
Financial Services
Header Vertical
Kearney
Add to my slides
Remove from favorites
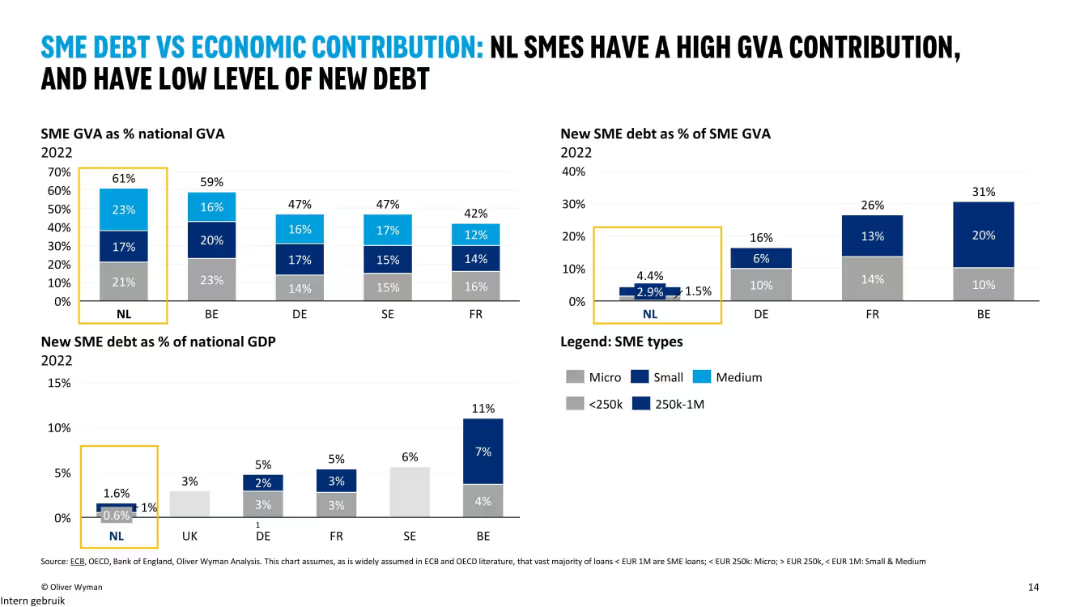
Multiple bar charts showing SME GVA vs. debt ratios for different countries and SME types, with callout boxes emphasizing NL's low new debt levels.
Financial Performance
Financial Services
The slide illustrates that SMEs in the Netherlands contribute significantly to the economy (61% of GVA) while taking on relatively little new debt. It contrasts this with higher debt levels in countries like Belgium and France.
SME debt, GVA, economic contribution, NL, GDP, micro, small, medium
false
Financial Performance
Financial Services
Multiple Chart
Oliver Wyman
Add to my slides
Remove from favorites
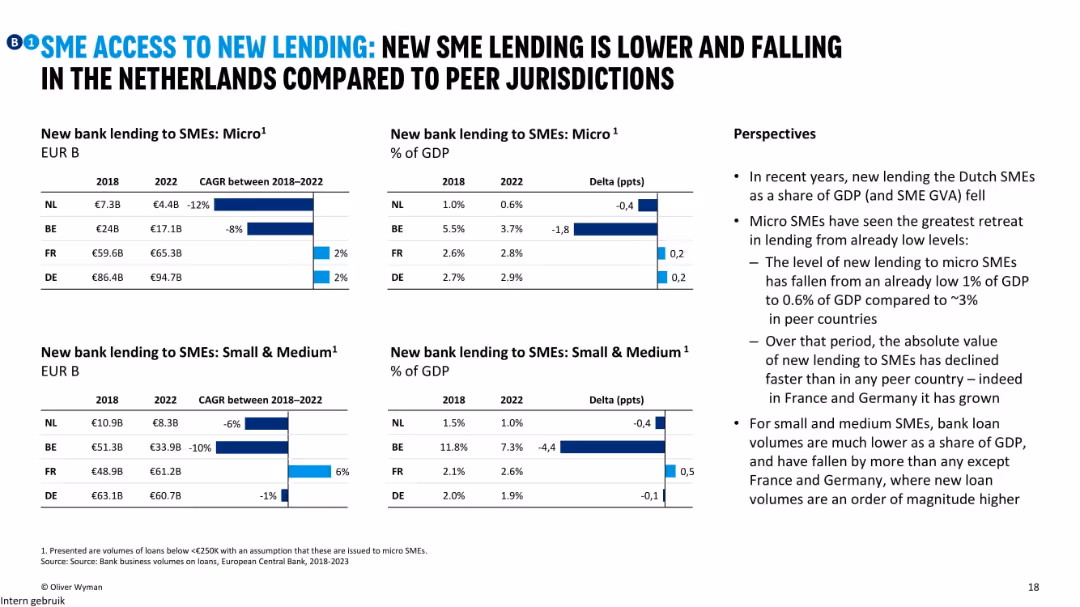
Four bar chart panels comparing 2018–2022 SME lending volumes and GDP share for Micro and Small & Medium loans, plus bullet perspectives.
Investment Analysis
Financial Services
The slide shows a declining trend in new SME lending in the Netherlands, especially for micro enterprises. Lending volumes and GDP share dropped more than in other countries, indicating shrinking access to bank finance for SMEs in NL.
SME lending, micro, small & medium, GDP share, NL, volume decline
false
Investment Analysis
Financial Services
Multiple Chart
Oliver Wyman
Add to my slides
Remove from favorites
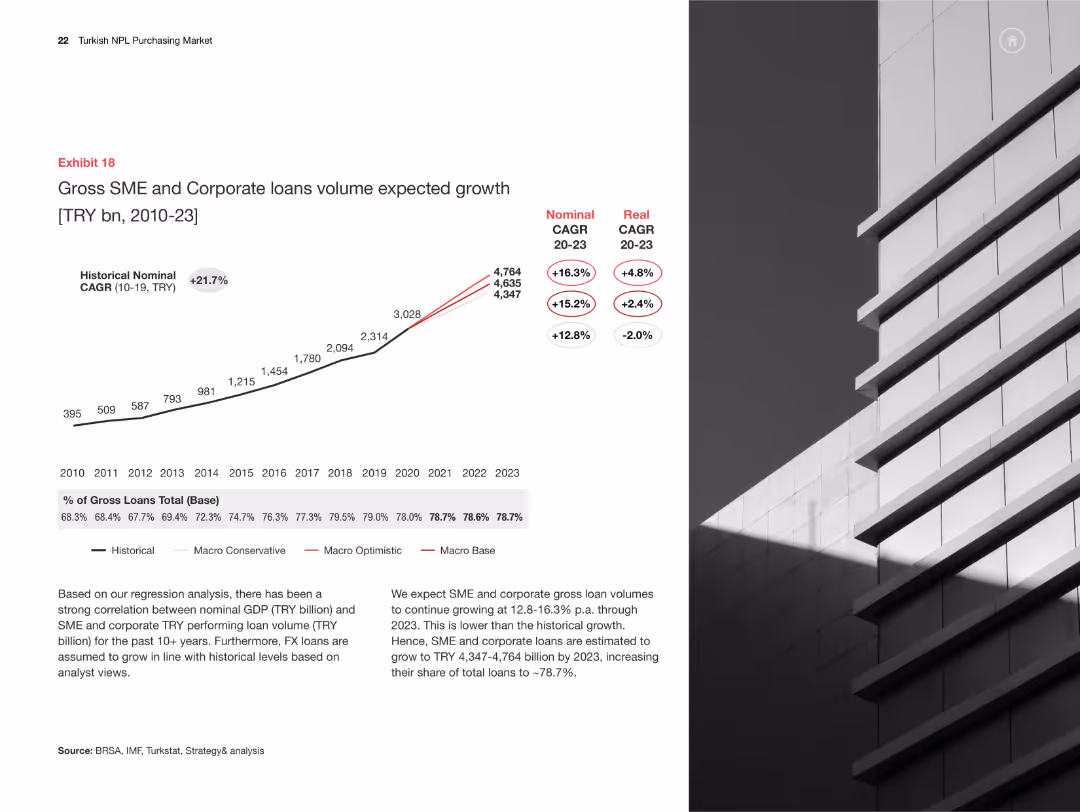
Line chart showing expected growth in SME and corporate loans volume from 2010-2023, with different growth scenarios.
Market Analysis and Trends
Financial Services
This slide forecasts SME and corporate loan volume growth in Turkey from 2010-2023, exploring various growth scenarios and economic impacts.
SME loans, corporate loans, growth forecast, economic analysis, financial projections, Turkey
false
Market Analysis and Trends
Financial Services
Mixed Chart
PwC/Strategy&
Add to my slides
Remove from favorites
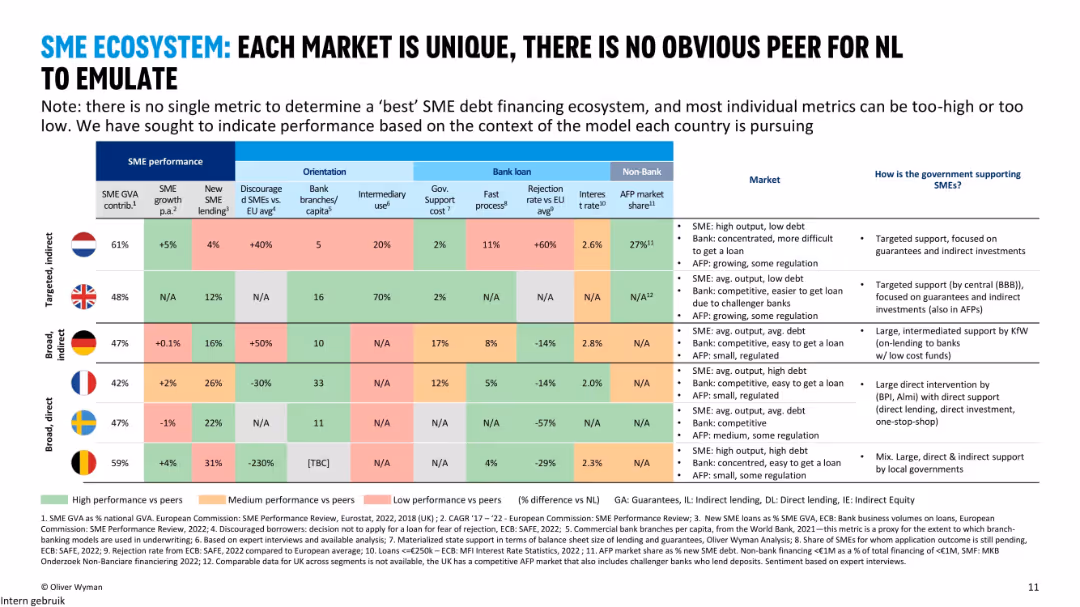
Comparative country-level table with metrics spanning SME performance, orientation, bank loans, and non-bank financing; flags and performance colored heatmap; right-side summary of support models.
Market Analysis and Trends
Financial Services
The slide compares SME financing ecosystems across six European countries using multiple indicators such as SME growth, lending, government support, and bank rejection rates. It highlights that there is no clear benchmark for the Netherlands to emulate due to varying models.
SME, GVA, bank lending, market comparison, government support, NL, UK, BE
false
Market Analysis and Trends
Financial Services
Mixed Chart
Oliver Wyman
Add to my slides
Remove from favorites
Features a column chart displaying SME and corporate NPL sales volumes from 2010 to 2023. Different colors depict various projected growth rates under different scenarios.
Market Analysis and Trends
Financial Services
This slide projects SME and corporate NPL sales volumes in Turkey from 2010 to 2023, presenting different scenarios including optimistic, base, and conservative growth projections.
SME, corporate, NPL, growth, Turkey, projections
false
Market Analysis and Trends
Financial Services
Mixed Chart
PwC/Strategy&
Add to my slides
Remove from favorites
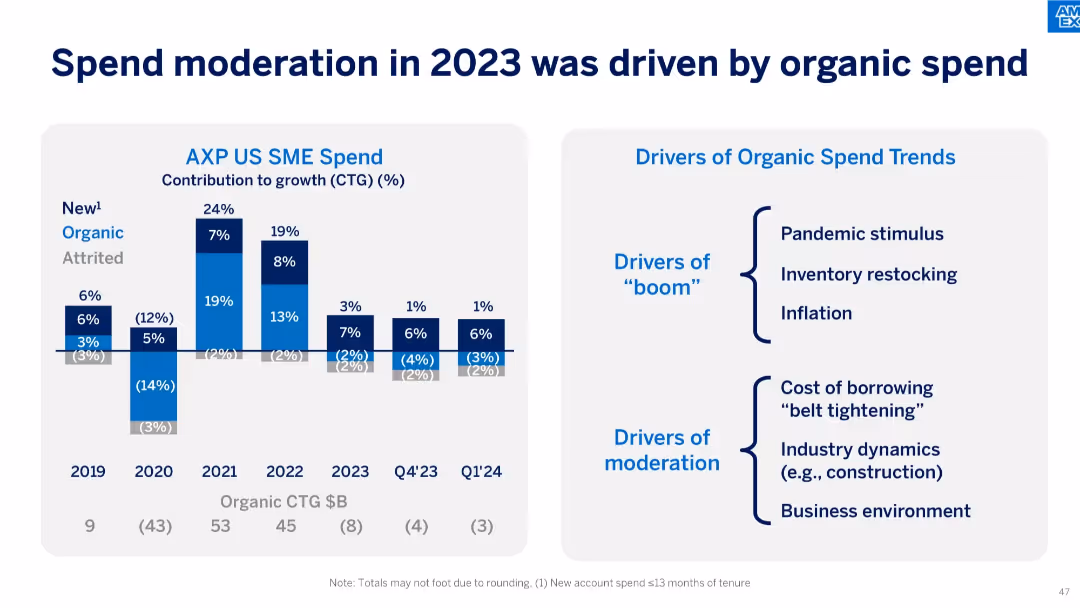
Left side features stacked bar charts showing different spend contributors (New, Organic, Attrited) from 2019 to Q1'24; right side lists "Drivers of Organic Spend Trends" divided into boom and moderation factors.
Operational Efficiency
Financial Services
The slide analyzes drivers of spend patterns in 2023, indicating moderation largely came from organic spend. Factors like cost of borrowing and business conditions contrast earlier drivers like stimulus and inflation.
SME, spend drivers, organic spend, moderation, stimulus, inflation, borrowing cost, CTG, pandemic recovery
false
Operational Efficiency
Financial Services
Mixed Chart
McKinsey
Add to my slides
Remove from favorites
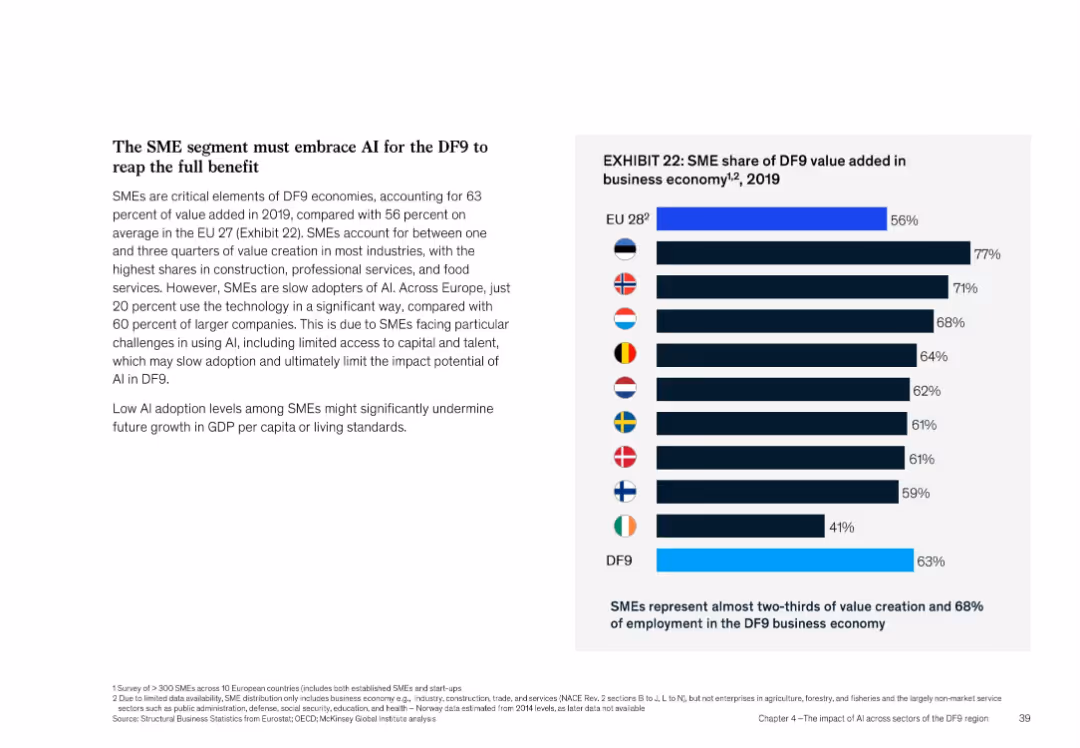
Bar chart comparing SME contribution in DF9 with EU countries, supported by narrative text on left
Organizational Structure and Change
Artificial Intelligence
Describes the role of SMEs in DF9 economies, highlighting their large contribution to value creation (63%) and employment (68%). Notes that SME AI adoption is low (~20%), which could hinder growth. Bar chart ranks SME contributions across EU nations.
SMEs, AI adoption, DF9, EU comparison, value creation, employment
false
Organizational Structure and Change
Artificial Intelligence
Mixed Chart
McKinsey
Add to my slides
Remove from favorites
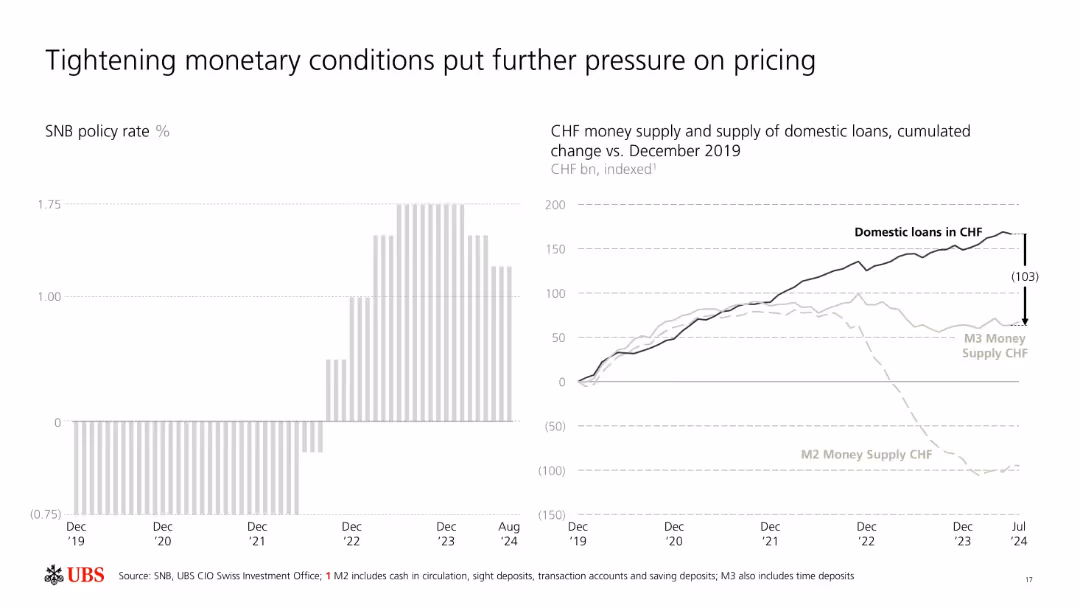
Dual-chart layout: bar chart of SNB policy rates and line graph of CHF loan/money supply trends.
Market Analysis and Trends
Financial Services
This slide shows the tightening of monetary policy by the SNB and its effects on domestic loan supply and CHF money supply (M2/M3). The decline in monetary aggregates vs. stable loan demand reflects increasing pricing pressure and tighter credit environments.
SNB, interest rates, CHF, loan supply, money supply, monetary tightening, M2, M3, pricing pressure, macroeconomic
false
Market Analysis and Trends
Financial Services
Multiple Chart
UBS
Add to my slides
Remove from favorites
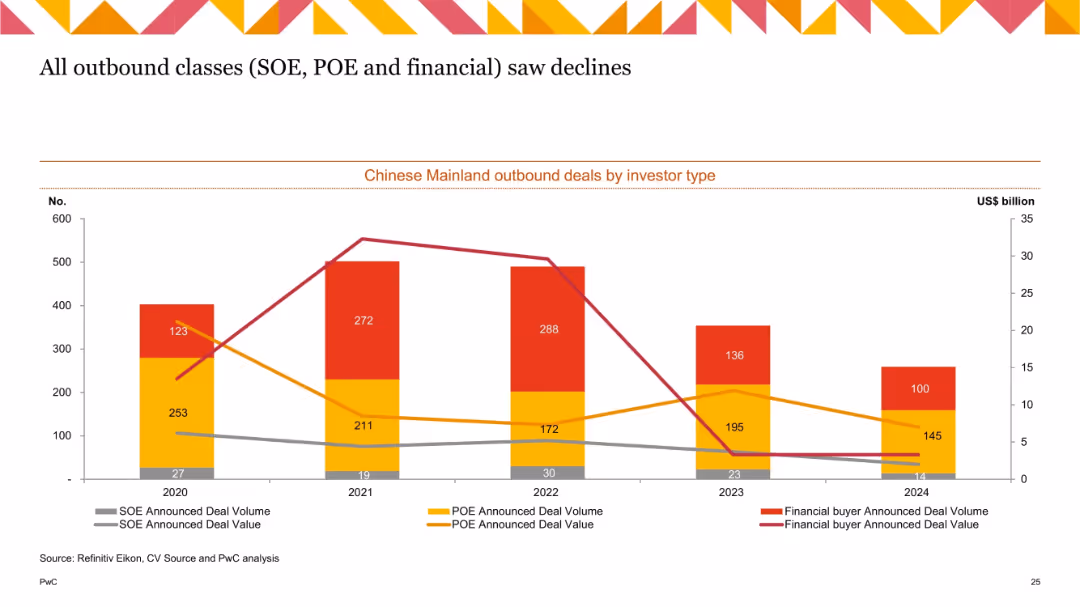
Stacked bar and line chart (2020–2024) showing SOE, POE, and financial buyer activity in terms of volume and value.
Investment Analysis
Government & Public Sector
This chart breaks down outbound Chinese deals by investor type—SOEs, POEs, and financial buyers—over five years. All categories show a downward trend in both value and volume, though POEs remain the most active by volume. The chart underscores broader headwinds for all investor types in outbound activity.
SOE, POE, financial buyers, China outbound, deal type, investment breakdown, volume and value
false
Investment Analysis
Government & Public Sector
Single Chart
PwC/Strategy&
Add to my slides
Remove from favorites
Timeline slide depicting steps before and after becoming a public company, focusing on SOX compliance. Clear labels and distinct phases marked.
Regulatory and Compliance
Financial Services
Outlines the timeline for SOX compliance readiness, detailing pre-IPO and post-IPO activities and requirements.
SOX, compliance, timeline, IPO, public company, regulatory, finance
false
Regulatory and Compliance
Financial Services
Table
PwC/Strategy&
Add to my slides
Remove from favorites
Diagram of SP platform showing different functions like product development, trading, and risk management, with related text boxes.
Product and Service Analysis
Financial Services
Overview of the Securitized Products platform, highlighting its integrated approach to product development, trading, and risk management.
SP platform, product development, trading, risk management, integrated approach
false
Product and Service Analysis
Financial Services
Mixed Chart
Credit Suisse
Add to my slides
Remove from favorites
Column charts showing the growth in consumer need for debt, originations for securitizations, and asset class allocations.
Market Analysis and Trends
Financial Services
The slide highlights the positive outlook for SP products, showing increased consumer debt needs, and rising allocations by hedge funds and insurers.
SP products, consumer debt, securitizations, hedge funds, insurance allocations
false
Market Analysis and Trends
Financial Services
Multiple Chart
Credit Suisse
Add to my slides
Remove from favorites
A timeline depicting the evolution of SP trading from 2000 to 2019, with key milestones and strategic shifts indicated.
Strategic Planning
Financial Services
The slide outlines the historical development of SP trading, focusing on the consolidation, capital usage optimization, and partnership expansions.
SP trading, timeline, strategic planning, capital optimization, partnership expansion
false
Strategic Planning
Financial Services
Linear Flow
Credit Suisse
Add to my slides
Remove from favorites
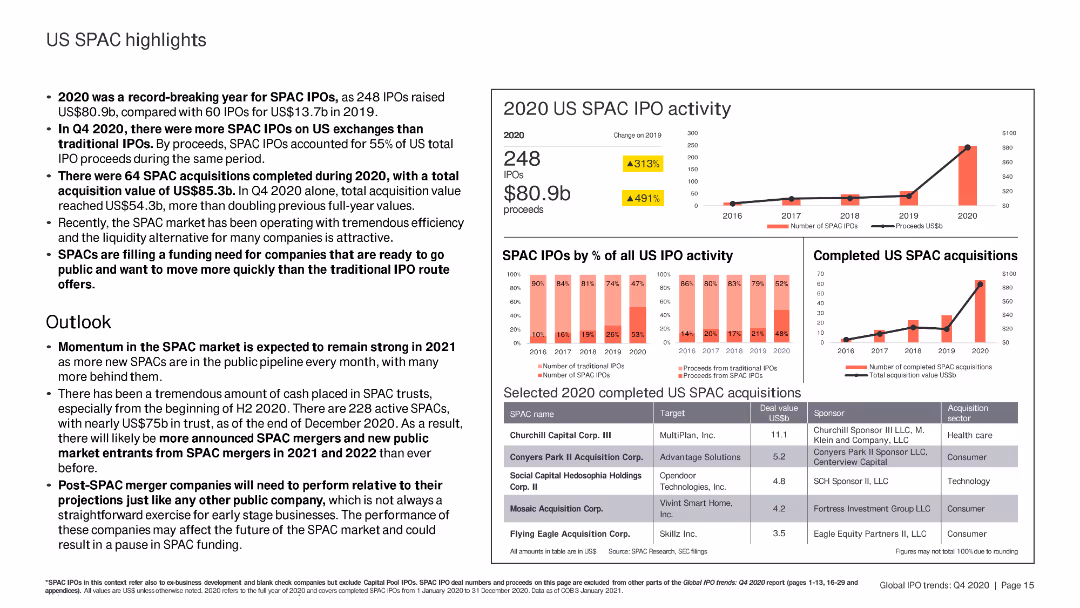
The slide includes column charts and bar charts summarizing US SPAC IPO activity, completed SPAC acquisitions, and selected SPAC deals in 2020.
Market Analysis and Trends
Financial Services
The slide highlights the record-breaking year for US SPAC IPOs in 2020, detailing the number of SPACs, total proceeds, and notable completed acquisitions. Future market outlook is also discussed.
SPAC IPO, 2020, acquisitions, proceeds, market
false
Market Analysis and Trends
Financial Services
Multiple Chart
EY
Add to my slides
Remove from favorites
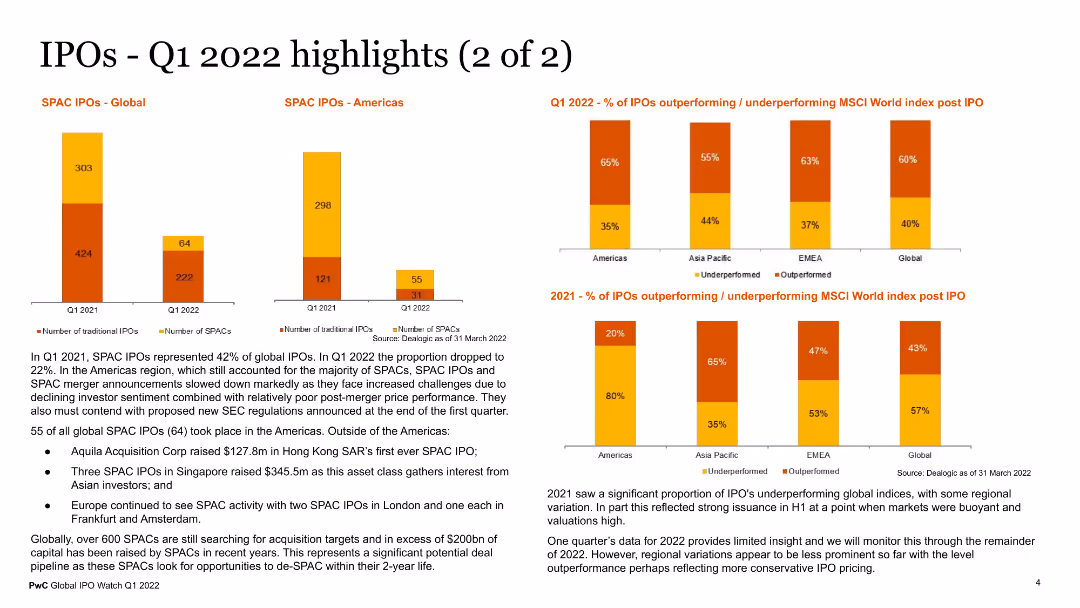
The slide includes visual elements such as a column chart for SPAC IPOs globally and in the Americas, and a bar chart showing the percentage of IPOs outperforming or underperforming MSCI World Index post IPO. The charts use different colors for clarity. Text sections provide additional context on SPAC activities and IPO performance trends.
Market Analysis and Trends
Financial Services
This slide provides additional highlights of IPO activities in Q1 2022, focusing on SPAC IPOs and performance metrics against the MSCI World Index. It offers insights into the performance and trends of SPACs and traditional IPOs, useful for financial analysts and investors.
SPAC IPOs, Q1 2022, IPO performance, MSCI World Index, financial trends
false
Market Analysis and Trends
Financial Services
Multiple Chart
PwC/Strategy&
Add to my slides
Remove from favorites
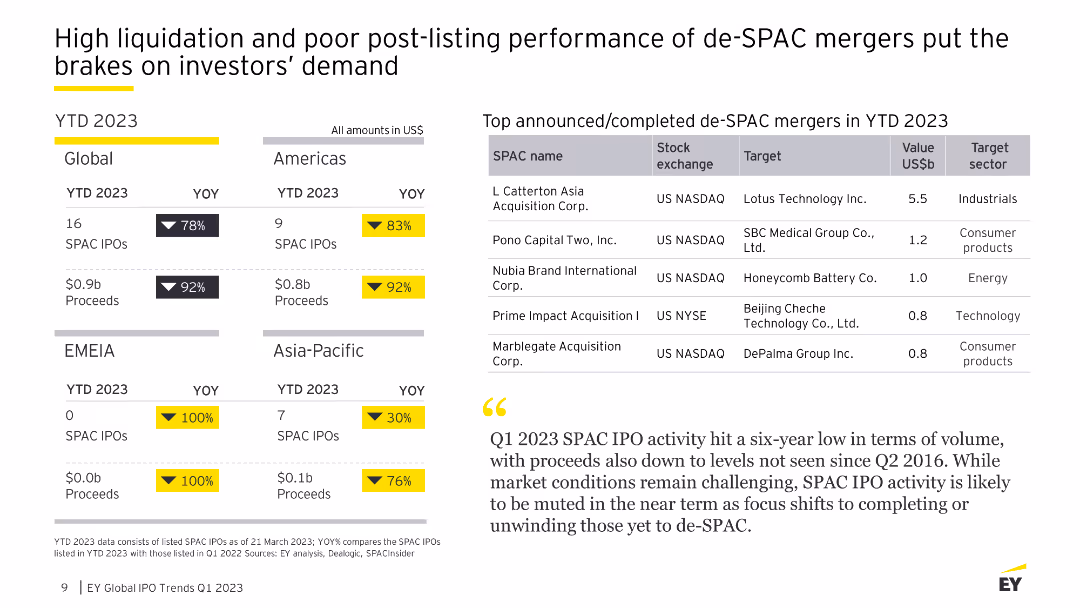
Features multiple graphs including a line chart showing SPAC IPO trends and column charts for de-SPAC mergers and post-merger performance for YTD 2023.
Market Analysis and Trends
Financial Services
The slide discusses the decline in SPAC IPOs and de-SPAC mergers, highlighting high liquidation rates and poor post-merger stock performance.
SPAC IPOs, de-SPAC mergers, YTD 2023, liquidation, market trends, financial services, column charts, line chart
false
Market Analysis and Trends
Financial Services
Table
EY
Add to my slides
Remove from favorites
Detailed charts and a list showing the number of SPAC IPOs, their proceeds over months, and a breakdown of recent SPAC IPOs by industry target and proceeds.
Market Analysis and Trends
Financial Services
Provides an overview of SPAC IPO activities in 2021, noting a slowdown in May but a strong start to the year. Includes detailed breakdowns by month and industry focus.
SPAC IPOs, trends, 2021, industry focus, slowdown
false
Market Analysis and Trends
Financial Services
Mixed Chart
PwC/Strategy&
Add to my slides
Remove from favorites
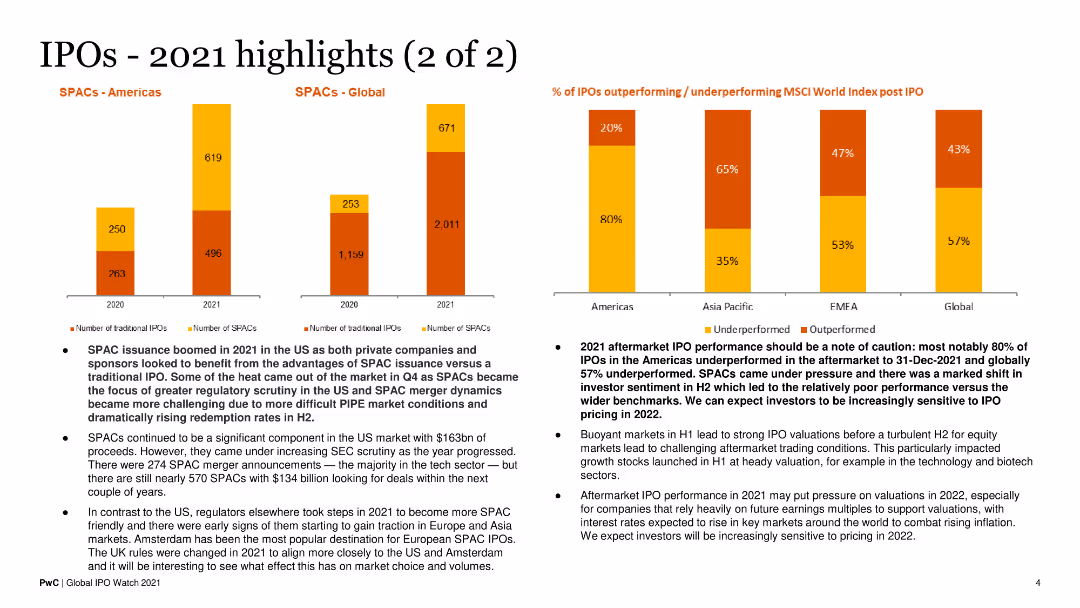
Features bar charts comparing SPAC and traditional IPOs in the Americas and globally. Also includes a bar chart for IPO performance post-IPO. The design is data-heavy.
Financial Performance
Financial Services
This slide focuses on SPAC issuance trends and IPO performance in 2021, discussing underperformance and investor sentiment shifts in the latter half of the year.
SPAC Issuance, IPO Performance, Investor Sentiment, 2021 Trends, Financial Analysis
false
Financial Performance
Financial Services
Multiple Chart
PwC/Strategy&
Add to my slides
Remove from favorites
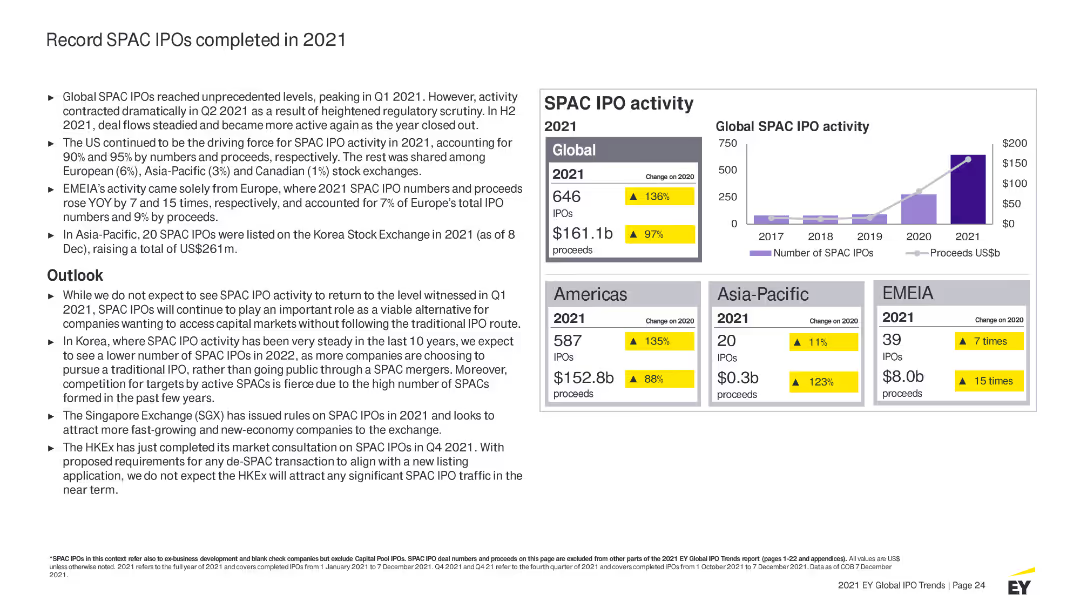
Presents column charts, tables, and text sections highlighting key statistics, with a purple and yellow color scheme to differentiate data points.
Market Analysis and Trends
Financial Services
Analyzes the record levels of SPAC IPOs completed in 2021 globally, detailing activities by region, sector performance, and outlook for SPAC IPOs.
SPAC, IPO, 2021 activity, market highlights, global trends, regions, sectors, proceeds, outlook, regulatory impact
false
Market Analysis and Trends
Financial Services
Mixed Chart
EY
Add to my slides
Remove from favorites
Slide features a title section at the top with two pie charts below, visually divided into segments. Charts show data on SPAC IPOs from 2012 to May 2021, highlighting industry focus. Includes annotations and percentages in vibrant colors.
Market Analysis and Trends
Financial Services
Slide presents statistical insights on SPAC IPOs, indicating industry preferences and historical trends in SPAC investments. Suggests a move towards specialization in target industries by SPACs.
SPAC, IPO, investments, industry focus, trends, pie chart, finance
false
Market Analysis and Trends
Financial Services
Multiple Chart
PwC/Strategy&
Add to my slides
Remove from favorites
The slide contains multiple column charts depicting the number of SPAC IPOs, proceeds, merger announcements, and completed mergers from 2018 to YTD 2022.
Market Analysis and Trends
Financial Services
The slide discusses the decline in SPAC IPOs and mergers in the US, highlighting market performance, regulatory uncertainty, and increased redemptions.
SPAC, IPO, mergers, market performance, regulatory uncertainty
false
Market Analysis and Trends
Financial Services
Multiple Chart
EY
Add to my slides
Remove from favorites
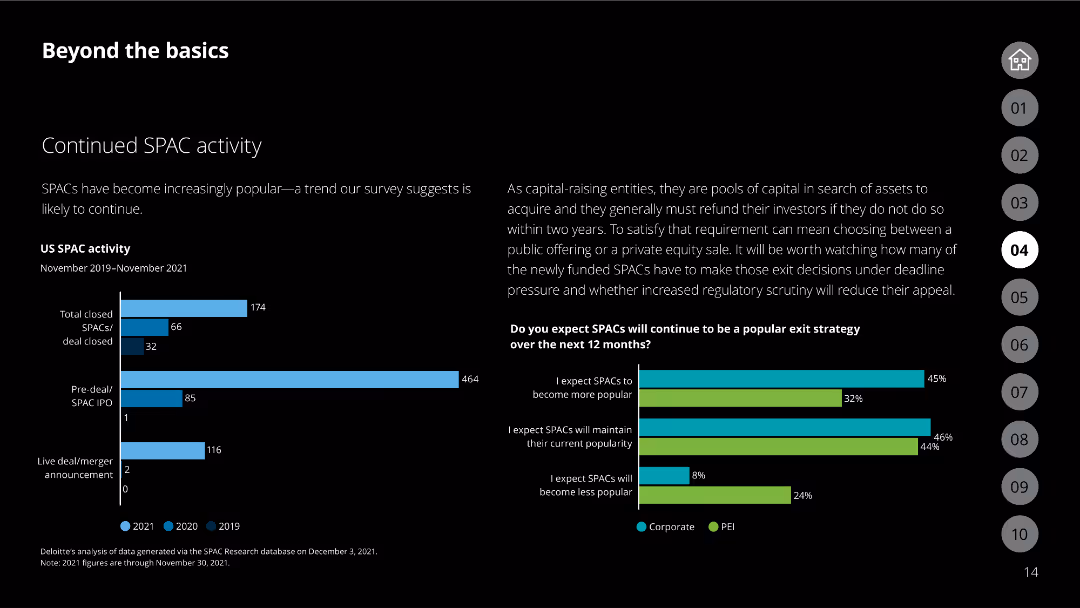
The slide includes a bar chart showing US SPAC activity from 2019 to 2021 and a bar chart on SPAC exit strategy expectations.
Market Analysis and Trends
Financial Services
Analyzes the continued popularity of SPACs and expectations for their future exit strategies.
SPAC, exit strategy, market trends, corporate, PEI
false
Market Analysis and Trends
Financial Services
Multiple Chart
Deloitte
Add to my slides
Remove from favorites
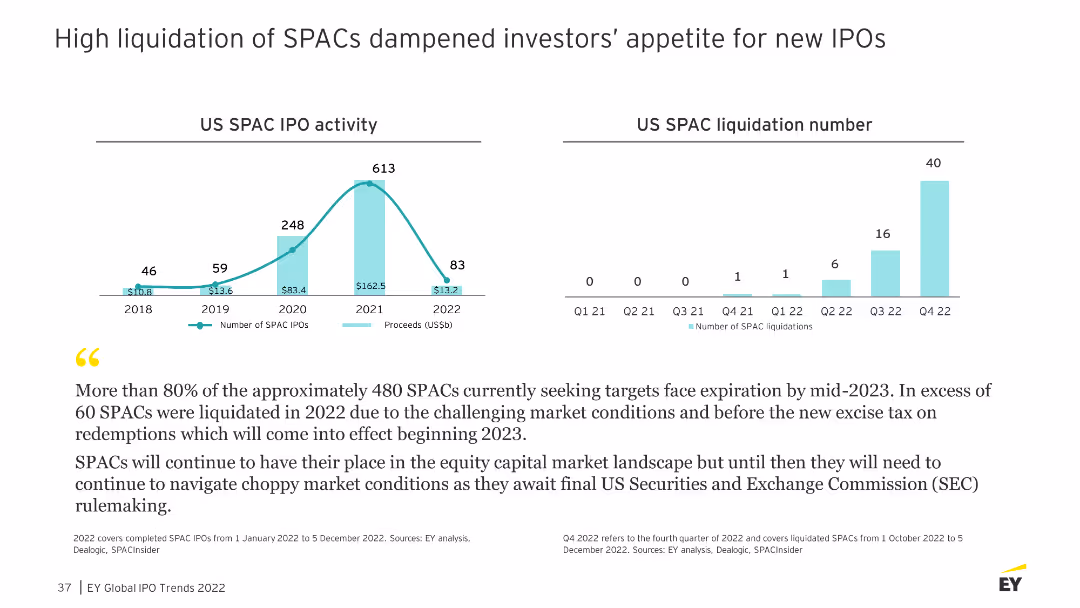
The slide presents two column charts depicting US SPAC IPO activity and SPAC liquidation numbers from 2018 to 2022, with a detailed narrative explaining the trends.
Risk Assessment and Management
Financial Services
Discusses the impact of high SPAC liquidations on investor sentiment and the challenging market conditions leading to these liquidations.
SPAC, liquidation, investor sentiment, trends
false
Risk Assessment and Management
Financial Services
Multiple Chart
EY
Add to my slides
Remove from favorites
Slide includes a title section, a pair of column charts, and a small descriptive text. The charts depict the SPAC merger volume and value from 2017 to 2021, using gradients of red and blue.
Market Analysis and Trends
Financial Services
Discusses the increase in capital raised through SPAC mergers over several years, reflecting a growing trend in their use as liquidity sources.
SPAC, mergers, capital, trends, column chart, liquidity, finance
false
Market Analysis and Trends
Financial Services
Multiple Chart
PwC/Strategy&
Add to my slides
Remove from favorites
Features a flowchart with steps from identifying a partner to closing a deal, described through different stages. Uses blue and gray colors for background and text emphasis.
Strategic Planning
Professional Services
Describes the detailed process of a SPAC from the initial stages through to the finalization, akin to an IPO process. Emphasizes the steps and duration involved.
SPAC, process, flowchart, IPO, strategic planning, timeline, partnership
false
Strategic Planning
Professional Services
Linear Flow
PwC/Strategy&
Add to my slides
Remove from favorites
Slide with multiple data representations including a column chart and pie chart, displaying SPAC acquisitions and sector distribution. Colors are used to differentiate sectors like Tech and Industrial.
Market Analysis and Trends
Financial Services
Analyzes the leading sectors in SPAC acquisitions, focusing on technology and industrial sectors. Lists specific SPAC deals with sector diversity.
SPAC, technology, industrial, acquisitions, pie chart, bar chart, sectors
false
Market Analysis and Trends
Financial Services
Multiple Chart
PwC/Strategy&
Add to my slides
Remove from favorites
Column charts showing US IPO volume by sector and IPO proceeds by sector for several years, highlighting SPACs with textual notes on their recent rise.
Market Analysis and Trends
Financial Services
Details the resurgence and predicted future rise of SPACs on Wall Street, with data showing a marked increase in IPO volumes and proceeds, particularly in 2021.
SPACs, IPO, Wall Street, trends, volume, proceeds
false
Market Analysis and Trends
Financial Services
Multiple Chart
PwC/Strategy&
Add to my slides
Remove from favorites
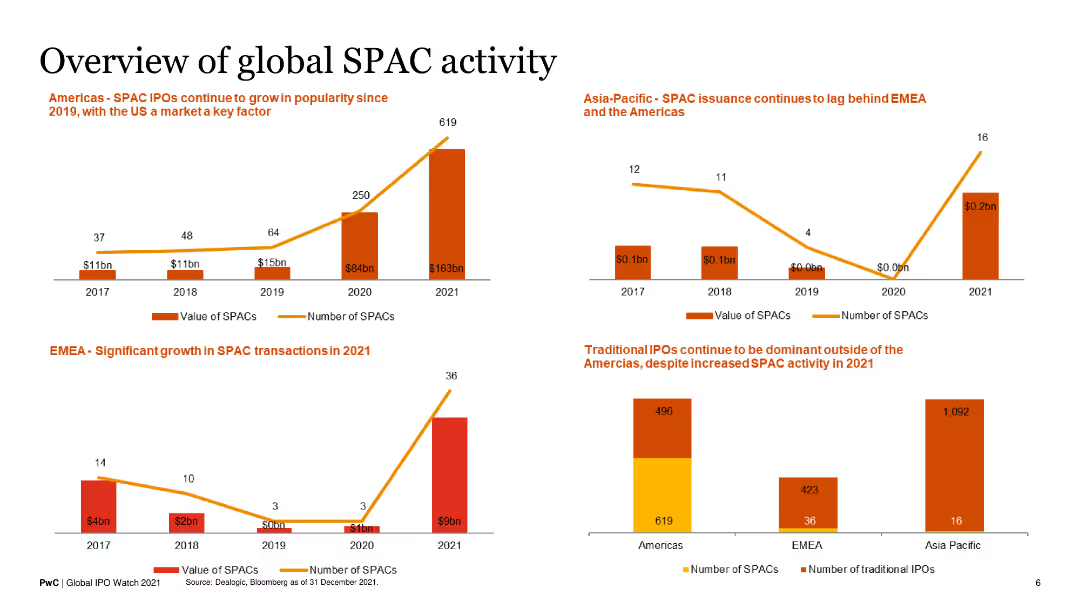
This slide contains four column charts, each showing the number and value of SPACs and traditional IPOs in different regions (Americas, EMEA, Asia-Pacific) from 2017 to 2021.
Market Analysis and Trends
Financial Services
The slide provides a comparative overview of SPAC and IPO activities across various regions, highlighting significant growth in the Americas.
SPACs, IPOs, financial markets, regional analysis, growth trends
false
Market Analysis and Trends
Financial Services
Multiple Chart
PwC/Strategy&
Add to my slides
Remove from favorites
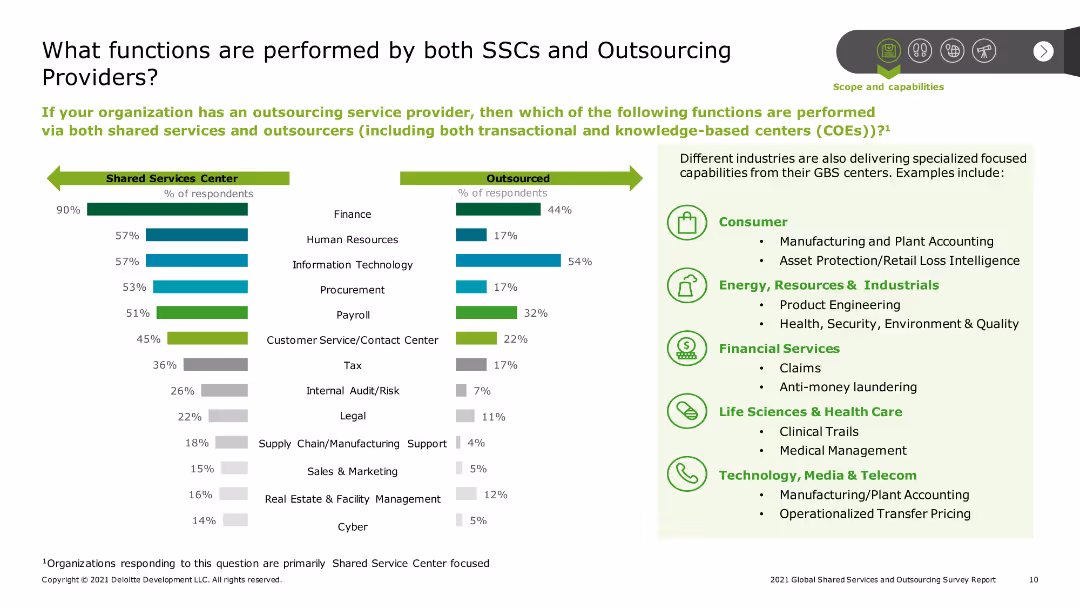
The slide includes two bar charts side by side. The left chart lists functions performed by SSCs, and the right chart shows functions outsourced. Both charts cover areas like finance, HR, IT, procurement, and customer service, highlighting the overlap and specialization in functions.
Strategic Planning
Professional Services
The slide compares the functions performed by Shared Service Centers (SSCs) and outsourcing providers. It outlines the common and specialized functions across finance, HR, IT, and other areas, indicating the strategic division of roles between in-house and outsourced services.
SSC functions, outsourcing functions, functional analysis, finance, HR, IT, procurement, customer service, professional services, strategic division
false
Strategic Planning
Professional Services
Multiple Chart
Deloitte
Add to my slides
Remove from favorites
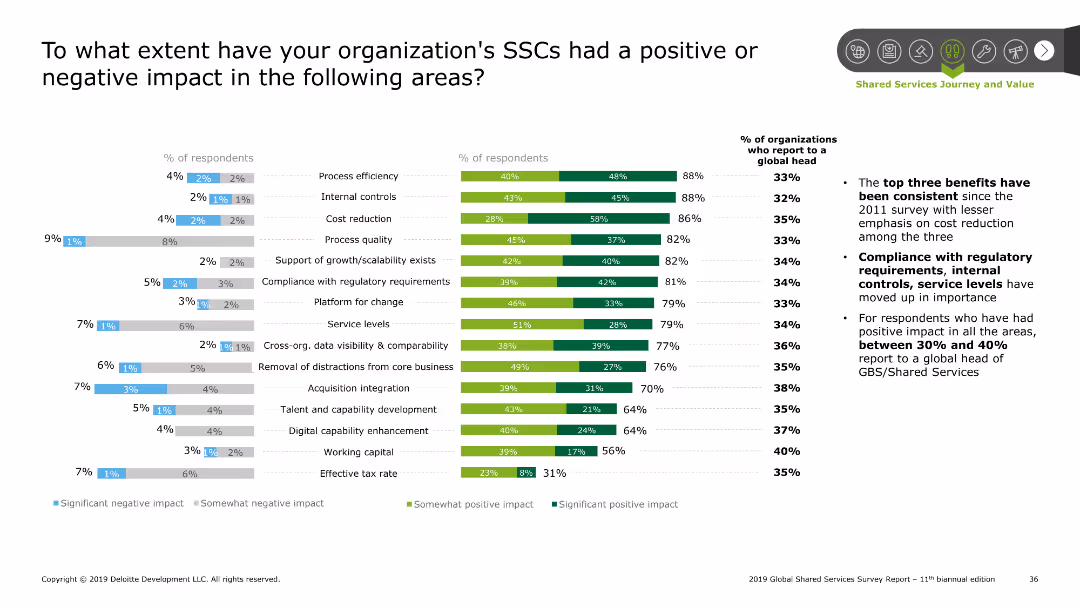
The slide includes a combination of column charts and bar charts. It shows the percentage of respondents reporting various impacts, and the significance of these impacts.
Performance Metrics and KPIs
Professional Services
This slide evaluates the positive and negative impacts of Shared Services Centers (SSCs) on different operational areas, as reported by respondents.
SSC impact, performance, evaluation, metrics, KPIs
false
Performance Metrics and KPIs
Professional Services
Multiple Chart
Deloitte
Add to my slides
Remove from favorites
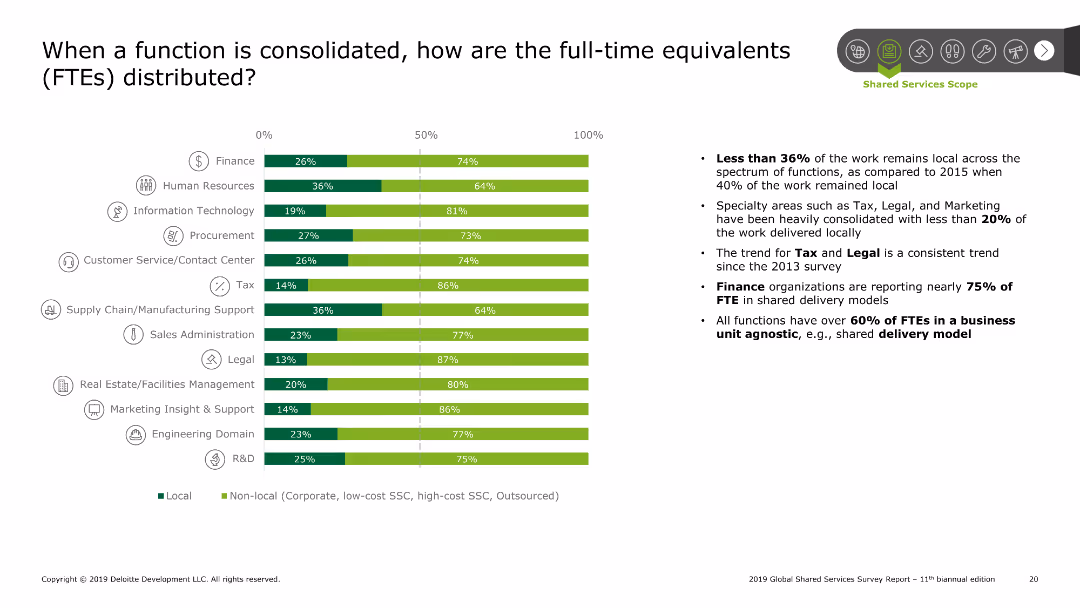
Bar chart displaying the distribution of FTEs between local and non-local for various functions. Functions include finance, HR, IT, procurement, etc. Summary points on the right detail the trends and findings.
Performance Metrics and KPIs
Professional Services
The slide shows how FTEs are distributed when functions are consolidated. The bar chart indicates the split between local and non-local FTEs across different functions like finance and HR. Summary points highlight trends such as the decline in local work and the consistency in finance and tax trends.
SSC, FTE distribution, consolidation, finance, HR
false
Performance Metrics and KPIs
Professional Services
Mixed Chart
Deloitte
Add to my slides
Remove from favorites
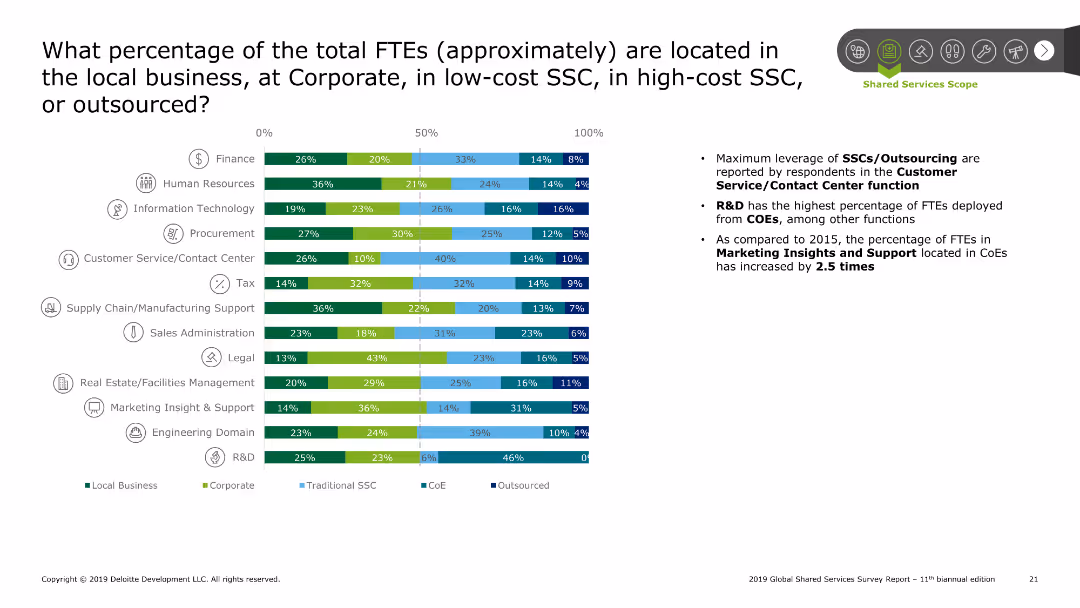
Bar chart showing the percentage of FTEs located across different settings (local, corporate, SSC, CoE, outsourced) for various functions. Summary points on the right discuss trends and findings.
Performance Metrics and KPIs
Professional Services
The slide analyzes the percentage of FTEs distributed across local business, corporate, SSCs, and outsourcing. The bar chart breaks down this data by function, highlighting significant leverage of SSCs/outsourcing in customer service and R&D. Summary points discuss the increase in FTEs located in CoEs compared to 2015.
SSC, FTE location, corporate, local, outsourcing
false
Performance Metrics and KPIs
Professional Services
Mixed Chart
Deloitte
Add to my slides
Remove from favorites
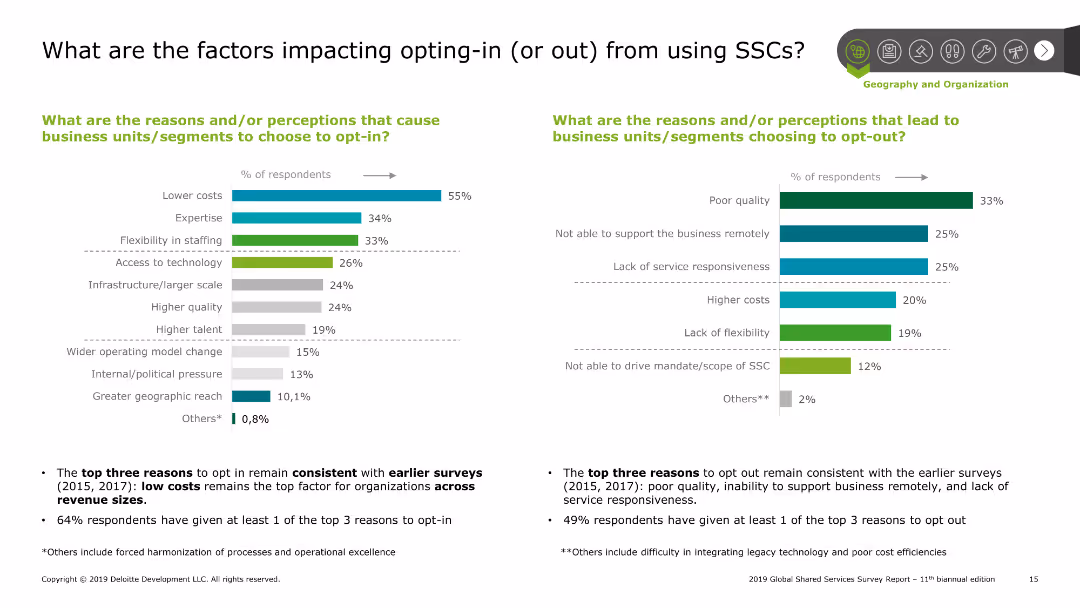
Two column charts side by side; left chart shows reasons for opting-in with percentages, right chart shows reasons for opting-out with percentages. Includes summary points below the charts.
Operational Efficiency
Professional Services
The slide analyzes reasons for opting-in and out of SSCs. The left chart highlights factors like lower costs, expertise, and flexibility. The right chart lists poor quality and lack of service responsiveness as top reasons for opting-out. Summary points emphasize consistency with earlier surveys and key factors.
SSC, factors, opting-in, opting-out, operational efficiency
false
Operational Efficiency
Professional Services
Multiple Chart
Deloitte
Add to my slides
Remove from favorites
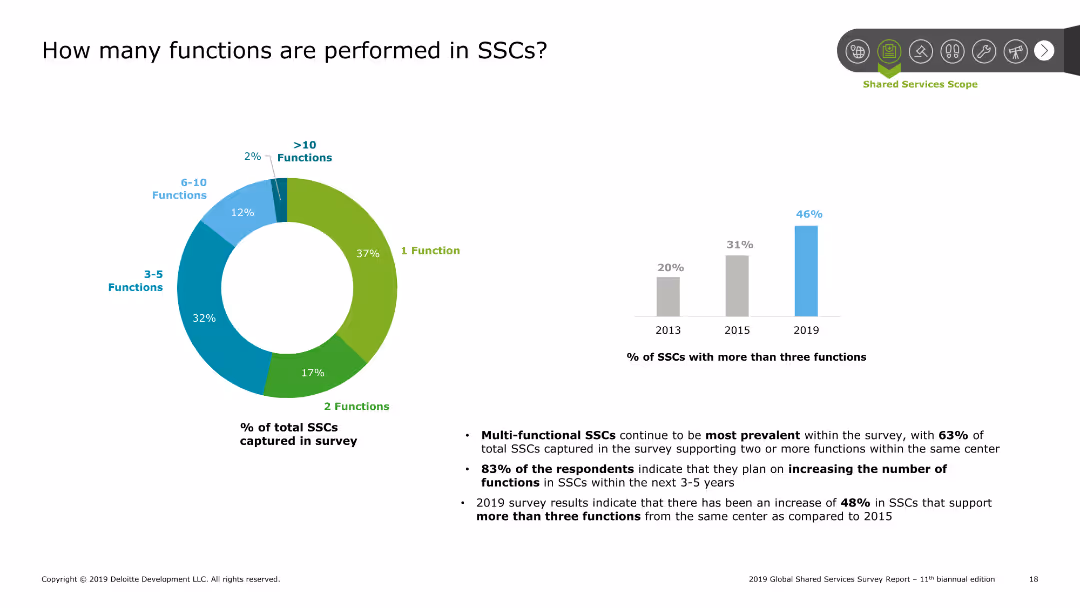
A doughnut chart showing the distribution of functions performed in SSCs. Additional bar chart on the right showing the percentage of SSCs with more than three functions over time.
Performance Metrics and KPIs
Professional Services
The slide details the number of functions performed in SSCs with a doughnut chart showing the distribution. Majority perform 1-2 functions. A bar chart indicates the growth in SSCs with more than three functions over recent years, highlighting an increase in multi-functional SSCs.
SSC, functions, distribution, multi-functional, growth
false
Performance Metrics and KPIs
Professional Services
Multiple Chart
Deloitte
Add to my slides
Remove from favorites
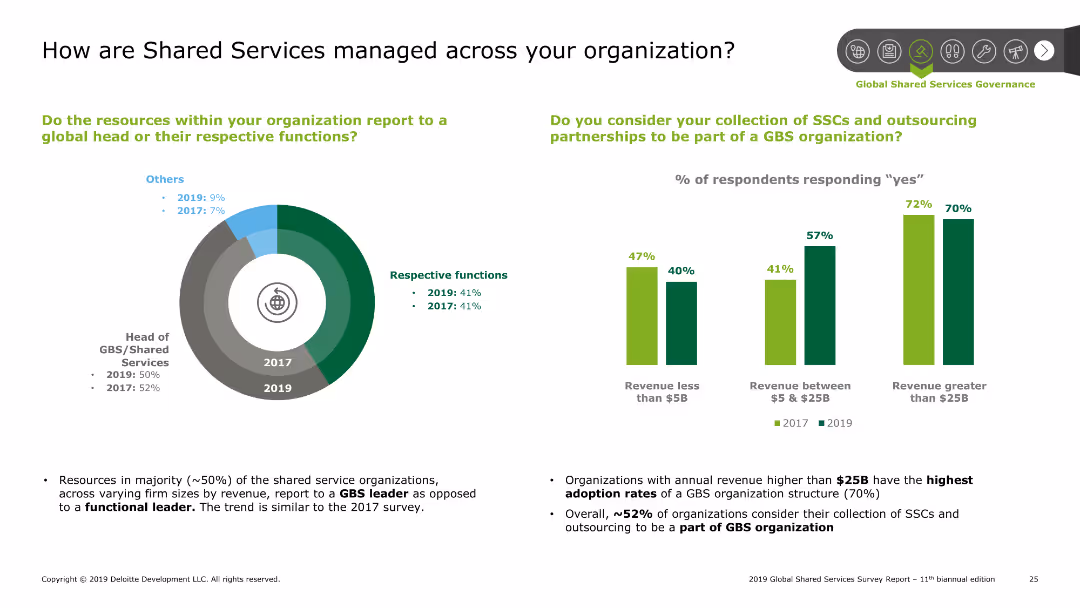
Pie chart showing how resources report within the organization (GBS leader vs respective functions) for 2019 and 2017. Bar chart showing percentage of respondents considering SSCs part of a GBS organization based on revenue size. Summary points discuss trends and findings.
Organizational Structure and Change
Professional Services
The slide examines the management of shared services within organizations. A pie chart shows reporting structure to GBS leaders vs respective functions. A bar chart compares the adoption of SSCs as part of GBS organizations based on revenue size. Summary points highlight the majority trend of reporting to GBS leaders and the high adoption rates among large revenue organizations.
SSC, management, GBS, organizational structure, reporting
false
Organizational Structure and Change
Professional Services
Multiple Chart
Deloitte
Add to my slides
Remove from favorites
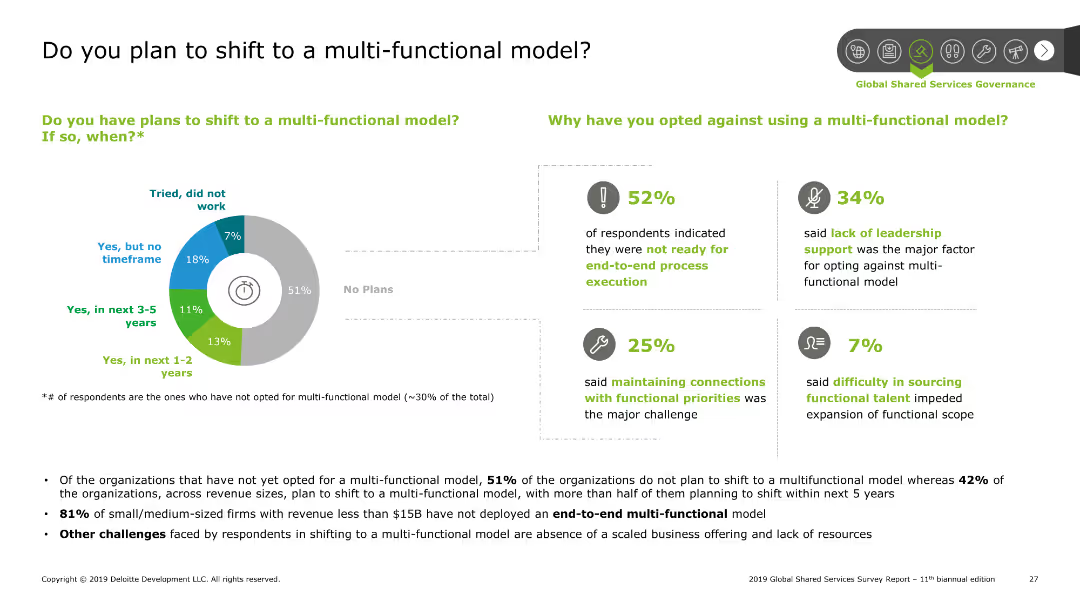
Pie chart showing the percentage of organizations planning to shift to a multi-functional model. Bar charts detailing reasons for not shifting. Summary points discuss findings and challenges faced by organizations.
Strategic Planning
Professional Services
The slide presents data on organizational plans to shift to a multi-functional model. A pie chart shows the percentage breakdown, while bar charts explain reasons for not shifting. Summary points highlight major challenges such as readiness for end-to-end execution and leadership support.
SSC, multi-functional model, planning, challenges, shift
false
Strategic Planning
Professional Services
Mixed Chart
Deloitte
Add to my slides
Remove from favorites
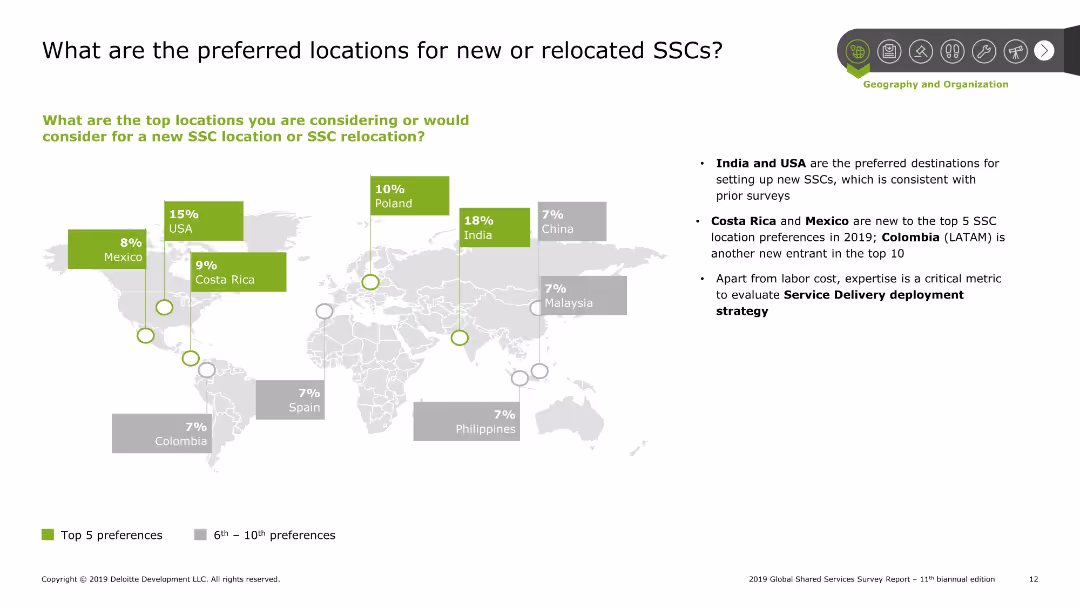
A world map highlighting preferred locations for SSCs with colored blocks indicating percentages. Right side contains bullet points summarizing the key insights.
Market Analysis and Trends
Professional Services
The slide shows the preferred locations for new or relocated SSCs with India, USA, and Costa Rica being the top choices. It includes a world map with highlighted countries and percentage preferences. Additional bullet points summarize trends and insights.
SSC, preferred locations, market trends, insights, geography
false
Market Analysis and Trends
Professional Services
Graphic
Deloitte
Add to my slides
Remove from favorites
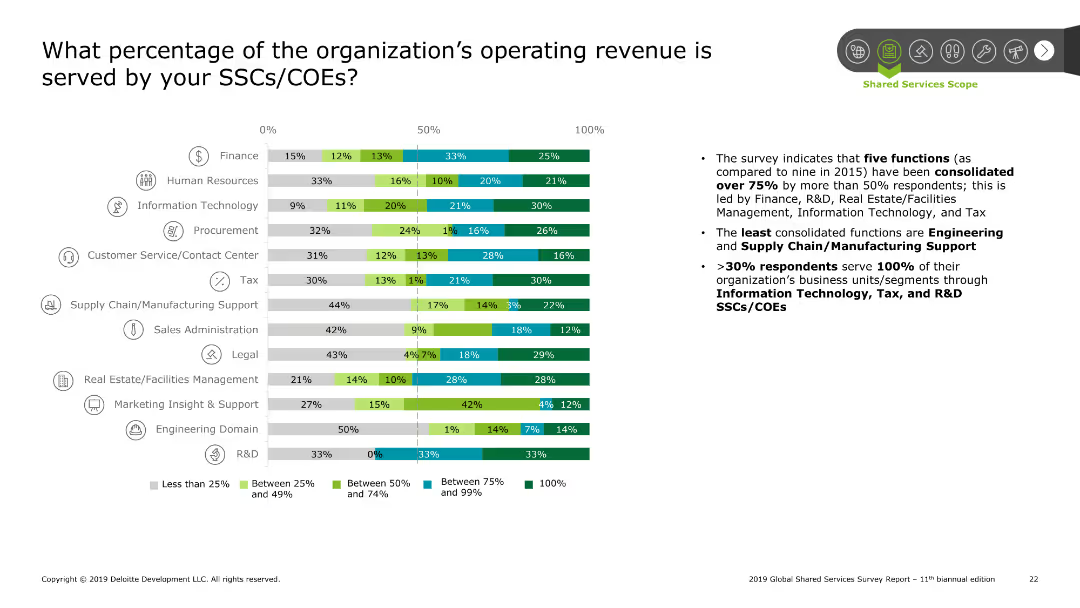
Bar chart showing the percentage of operating revenue served by SSCs/COEs for various functions. Categories include less than 25%, between 25% and 49%, between 50% and 74%, between 75% and 99%, and 100%. Summary points on the right detail the findings.
Financial Performance
Professional Services
The slide presents data on the percentage of operating revenue served by SSCs/COEs across different functions. The bar chart categorizes revenue percentages, with finance and R&D leading. Summary points highlight the consolidation of functions and significant revenue contribution from SSCs/COEs.
SSC, revenue, COE, operating revenue, finance, R&D
false
Financial Performance
Professional Services
Mixed Chart
Deloitte
Add to my slides
Remove from favorites
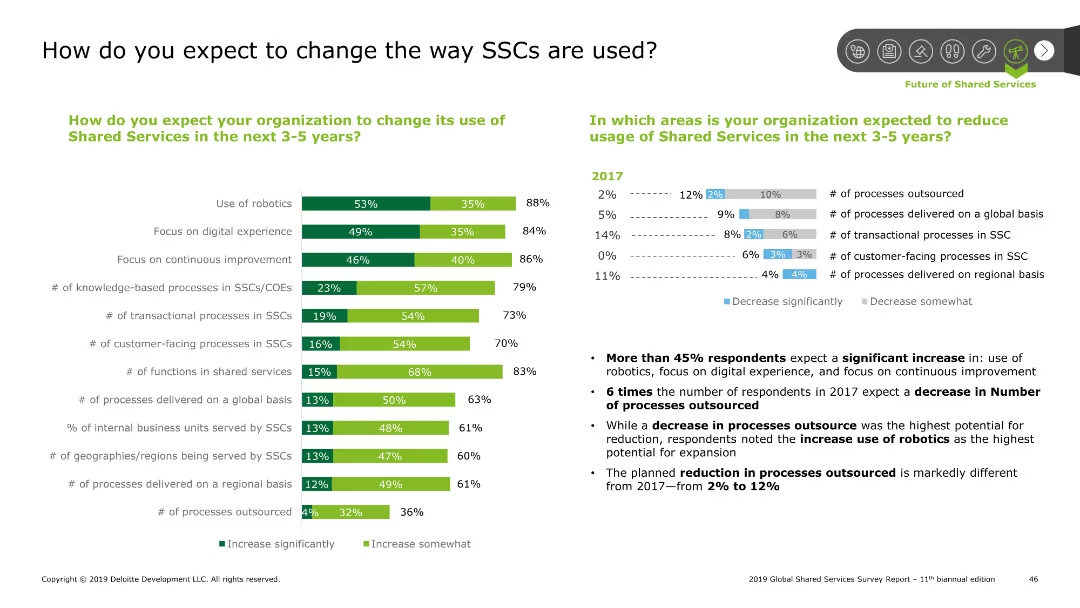
The slide has two sections with a column chart on the left and a mixed bar and line chart on the right, indicating changes in SSC usage expectations.
Strategic Planning
Professional Services
Examines future changes in Shared Services Centers (SSCs) usage, including robotics, digital experience, and continuous improvement, with respondent percentages.
SSC, robotics, digital, improvement, knowledge, processes, customer-facing, functions, reduction, outsourcing
false
Strategic Planning
Professional Services
Multiple Chart
Deloitte
Add to my slides
Remove from favorites
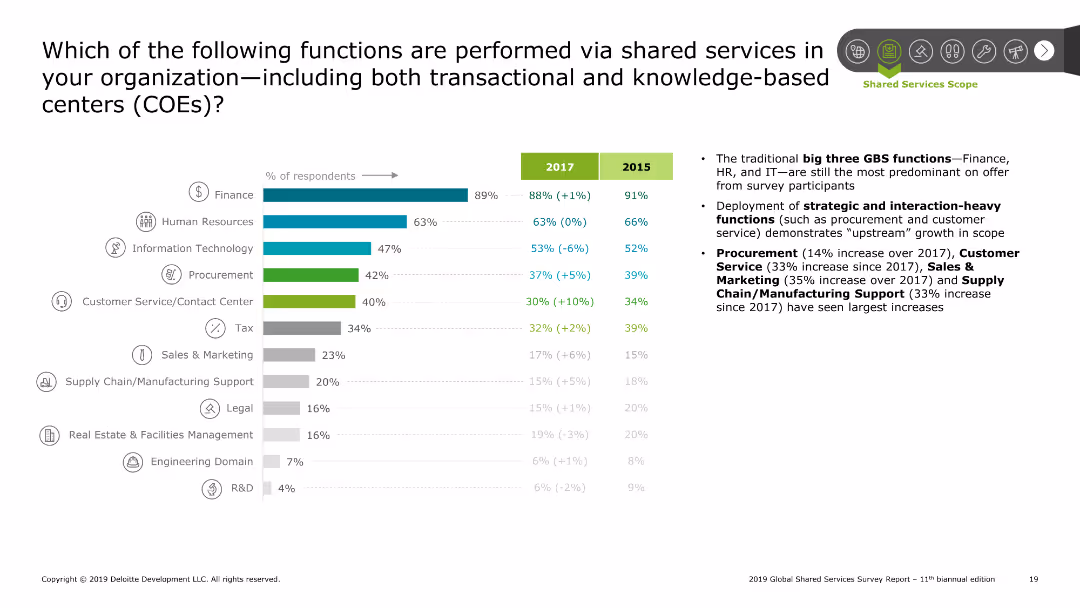
Bar chart showing percentage of respondents performing various functions via shared services for 2017 and 2015. Functions listed include finance, HR, IT, procurement, etc. Right side contains summary points on trends and growth.
Operational Efficiency
Professional Services
The slide presents the functions performed via shared services with a bar chart comparing 2017 and 2015 data. Key functions include finance, HR, and IT, with notable growth in procurement and customer service functions. Summary points emphasize the trends and strategic deployment of these functions.
SSC, shared services, functions, finance, HR, IT
false
Operational Efficiency
Professional Services
Mixed Chart
Deloitte
Add to my slides
Remove from favorites
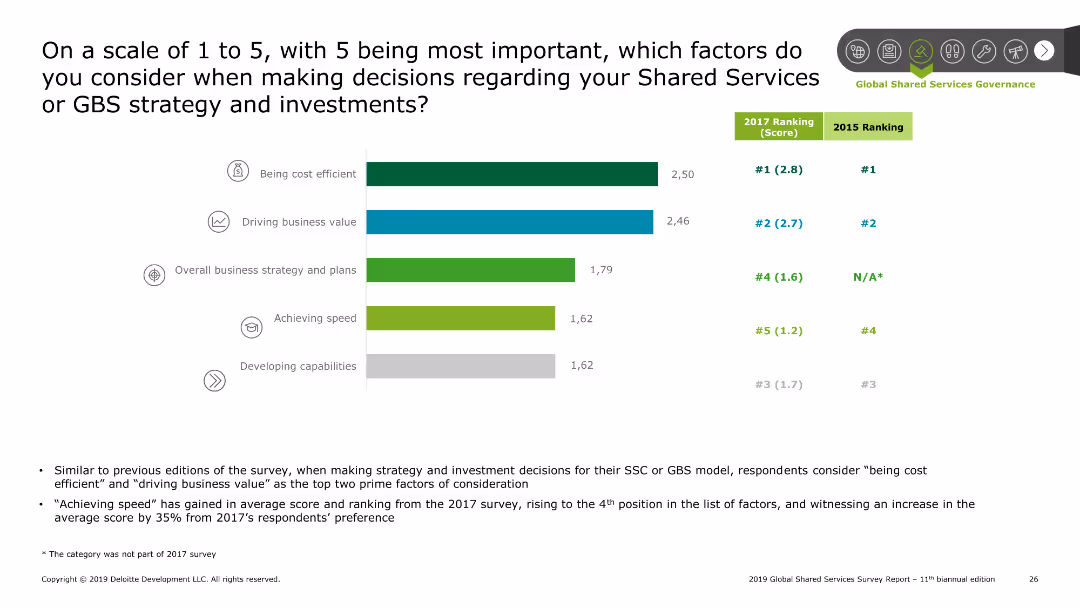
Bar chart ranking factors on a scale of 1 to 5, with being cost efficient and driving business value as top considerations. Comparison with 2017 rankings shown. Summary points on the bottom discuss trends and findings.
Strategic Planning
Professional Services
The slide outlines key factors considered in Shared Services strategy decisions. A bar chart ranks factors such as cost efficiency and business value on a scale of 1 to 5. Comparison with 2017 rankings is included. Summary points discuss the rise in importance of achieving speed and other notable trends.
SSC, strategy, decision factors, cost efficiency, business value
false
Strategic Planning
Professional Services
Mixed Chart
Deloitte
Add to my slides
Remove from favorites
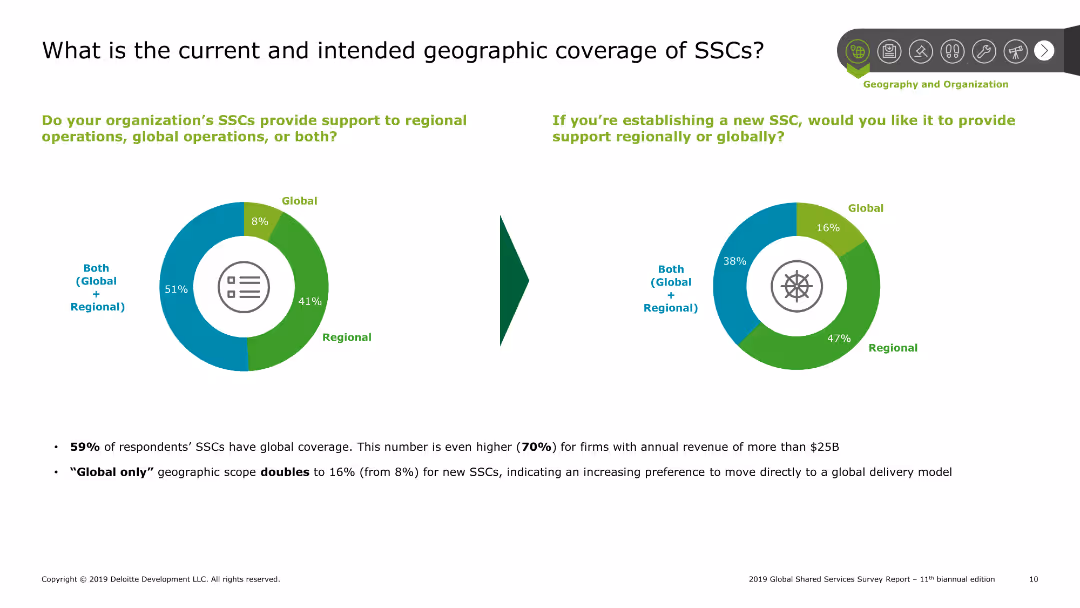
Pie charts showing current and intended geographic coverage of shared services centers (SSCs), with text explaining survey results on global and regional support.
Market Analysis and Trends
Professional Services
Explores the geographic scope of shared services centers, indicating a preference for both regional and global support among survey respondents, along with future intentions.
SSCs, geographic, coverage, global, regional
false
Market Analysis and Trends
Professional Services
Multiple Chart
Deloitte
Add to my slides
Remove from favorites
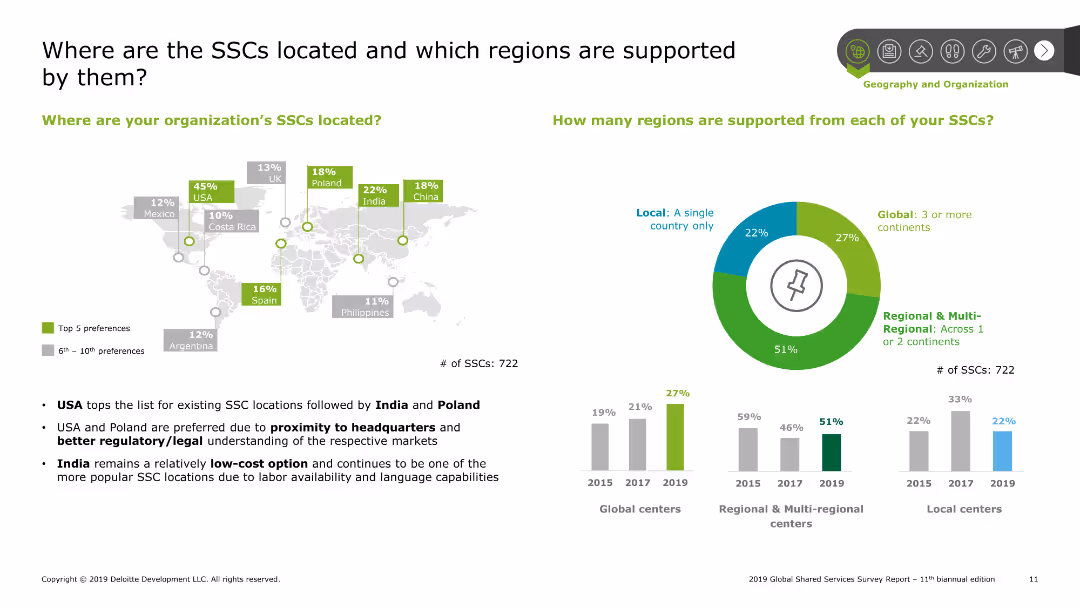
Map and column charts showing preferred SSC locations and the number of regions supported by SSCs, with text explaining trends and preferences.
Market Analysis and Trends
Professional Services
Details the preferred locations for shared services centers and the regional support provided by them, emphasizing trends in location choices and operational scope.
SSCs, locations, regions, support, preferences
false
Market Analysis and Trends
Professional Services
Multiple Chart
Deloitte
Add to my slides
Remove from favorites
Features multiple horizontal bar charts for different functions like Finance, HR, and IT, detailing specific processes like Accounts Payable and Payroll, showing their adoption rates.
Operational Efficiency
Professional Services
Details the most common processes managed through Shared Services Centers (SSCs), highlighting areas of high efficiency and common practices.
SSCs, processes, efficiency, finance, HR, IT, payroll
false
Operational Efficiency
Professional Services
Multiple Chart
Deloitte
Add to my slides
Remove from favorites
This slide displays two stacked column charts comparing the age of SSCs in various countries over different periods.
Strategic Planning
Professional Services
Evaluates the age distribution of shared service centers (SSCs) across different countries, showing trends over time which indicate shifts in global business service strategies.
SSCs, trends, geographic, business
false
Strategic Planning
Professional Services
Mixed Chart
Deloitte
Add to my slides
Remove from favorites
Detailed explanation of the STARK solution for IT project quotations, including breakdown, classification, and sizing models. Text-heavy with minimal visuals.
Technology and Digital Transformation
Technology & Software
Describes the STARK solution's methodology for quoting IT projects by breaking them down into elementary components and classifying them for accurate sizing.
STARK, IT projects, quotation, classification, sizing
false
Technology and Digital Transformation
Technology & Software
Header Vertical
Kearney
Add to my slides
Remove from favorites
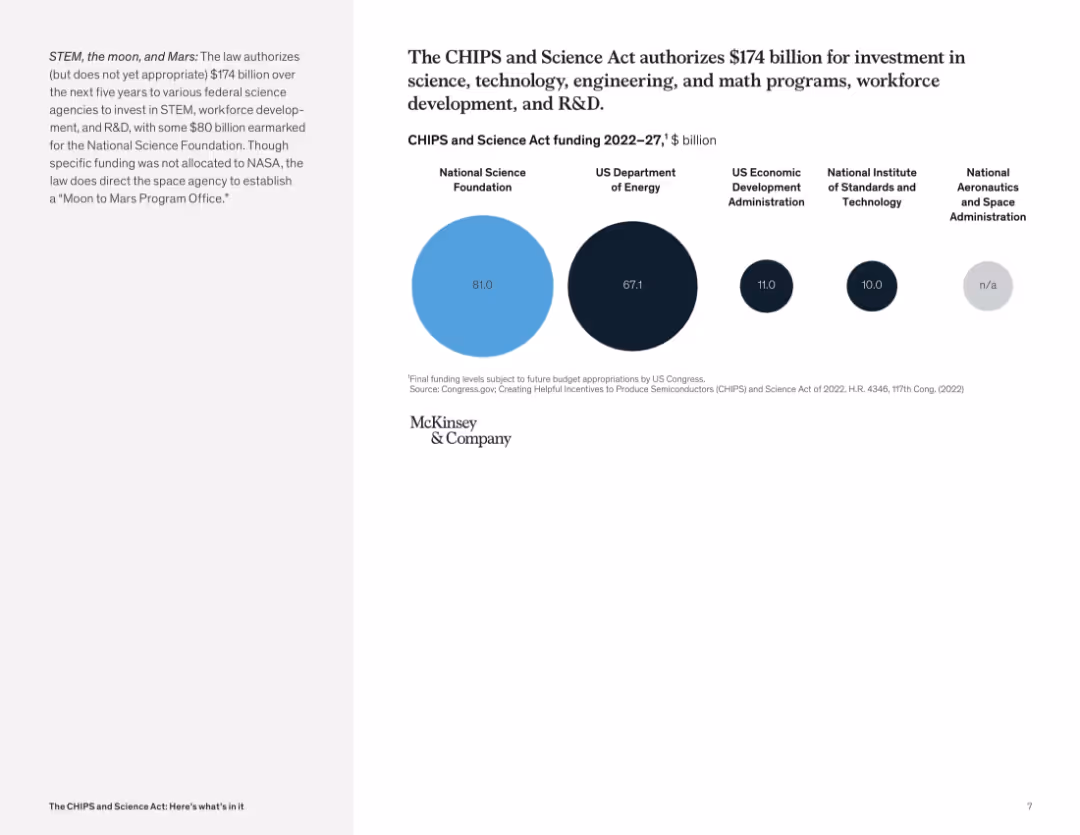
Simple circular infographic with bubble sizes indicating allocated amounts to different agencies; clean and minimalist visual design.
Strategic Planning
Government & Public Sector
The slide outlines the $174B in authorized but not yet appropriated funds over five years for various federal science agencies. It emphasizes funding for STEM, workforce development, and the NSF, with additional mentions of energy and space initiatives.
STEM, CHIPS Act, science funding, workforce development, NSF, DOE, federal budget, R&D, NASA
false
Strategic Planning
Government & Public Sector
Mixed Chart
McKinsey
Add to my slides
Remove from favorites
Contains a chart titled "Figure 8", headers, and bullet points with descriptions. The chart and text are set against a white background with a purple footer.
Technology and Digital Transformation
Technology & Software
Examines the shift in emphasis from technical skills to complex reasoning and analysis skills across various job sectors.
STEM, Complex Reasoning, Skills Analysis, Job Market, Educational Trends
false
Technology and Digital Transformation
Technology & Software
Table
Accenture
Add to my slides
Remove from favorites
This slide is primarily textual with bold, red headings to highlight key messages. It includes six text blocks with bullet points, focusing on initiatives for attracting youth to STEM careers. The layout is clean and structured, with a consistent use of fonts and a red and white color theme.
Strategic Planning
Education & Training
It summarizes the strategic efforts of the Tempest program in attracting and developing the next generation of engineers and technologists, with an emphasis on STEM education and youth engagement, suitable for strategic planning presentations.
STEM, Youth Engagement, Workforce Development, Education, Technology
false
Strategic Planning
Education & Training
Text Only
PwC/Strategy&
Add to my slides
Remove from favorites
The slide features two text sections on the left, discussing the firm’s work in creating inclusive STEM pathways in DC, and on the right, it presents a photo with a focus on technology and education. The design is professional, with a clear separation between text and imagery, and a teal accent color. A page number '27' is found on the bottom right.
Strategic Planning
Professional Services
It delves into the company’s foundation efforts in supporting underrepresented individuals in STEM fields, in partnership with several nonprofits in Washington, D.C. The slide presents how these partnerships work to break barriers and create educational and professional opportunities, with an emphasis on diversity and inclusion. It serves to illustrate the company’s broader commitment to corporate social responsibility and the impact of its foundation’s work.
STEM, inclusion, nonprofit, education, diversity, partnership
false
Strategic Planning
Professional Services
Text Only
Booz Allen Hamilton
Add to my slides
Remove from favorites
Focuses on the educational aspect with photos and text, presenting moderate visual complexity.
Technology and Digital Transformation
Education & Training
The slide covers the Tempest programme's school outreach efforts to promote STEM careers, featuring specific programmes and their impacts.
STEM, outreach, Tempest, education, UK
false
Technology and Digital Transformation
Education & Training
Boxed
PwC/Strategy&
Add to my slides
Remove from favorites
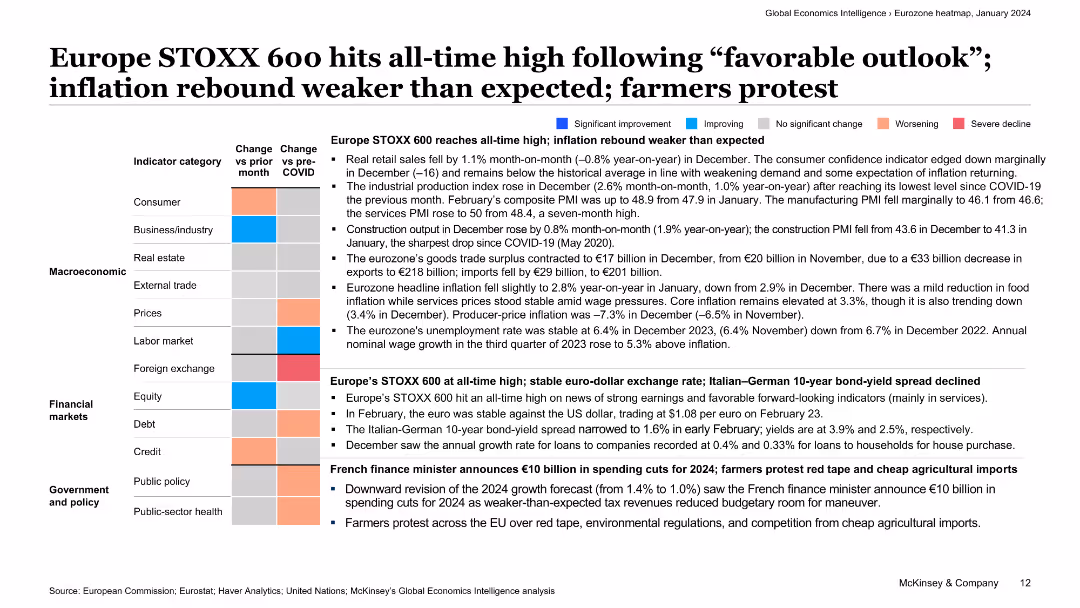
The slide includes a colorful table showing changes in economic indicators and a text summary of factors driving the STOXX 600 to an all-time high.
Market Analysis and Trends
Financial Services
This slide discusses the factors behind the STOXX 600 reaching an all-time high, supported by a detailed table of economic indicators and analysis of the European market outlook.
STOXX 600, economic indicators, market analysis, trends, Europe, financial services, stock market, overview, economic conditions, analysis
false
Market Analysis and Trends
Financial Services
Table
McKinsey
Add to my slides
Remove from favorites
Features a large column chart depicting the monthly development of STO funding volume across two years. Uses a red color palette for bars, with annotations for notable peaks and descriptions of specific STO events.
Regulatory and Compliance
Financial Services
Discusses the trends in STO funding over time, emphasizing key periods of growth and decline. It offers insights into the regulatory developments affecting the market and predicts the future relevance of STOs in the investment landscape, noting the importance of a stable regulatory infrastructure.
STOs, blockchain, funding trends, regulatory, 2018, 2019, growth, investment
false
Regulatory and Compliance
Financial Services
Single Chart
PwC/Strategy&
Add to my slides
Remove from favorites
This slide is a detailed table listing several major institutions and their respective security token offerings. It includes columns for institution name, tokenization specifics, date, and amount raised, presented with a clear, tabular layout.
Investment Analysis
Financial Services
Focuses on major corporate security token offerings by institutions like the Austrian Government and Banco Santander. Details include types of securities tokenized and the financial scope of these offerings, reflecting on the growing adoption of blockchain technology in traditional financial sectors.
STOs, corporate, blockchain, tokenization, securities, financial institutions
false
Investment Analysis
Financial Services
Table
PwC/Strategy&
Add to my slides
Remove from favorites
The slide features multiple column charts showing adjusted pre-tax income, cost/income ratio, return on regulatory capital, and client business volume over the years.
Financial Performance
Financial Services
This slide highlights the strong performance of the Swiss Universal Bank, showing financial metrics such as pre-tax income, cost/income ratio, and business volume growth.
SUB, financial performance, pre-tax income, cost/income ratio, business volume
false
Financial Performance
Financial Services
Multiple Chart
Credit Suisse
Add to my slides
Remove from favorites
This slide displays a world map highlighting various countries with specific projects labeled, alongside a list of project details, using color codes for integration level and project phase.
Strategic Planning
Energy & Utilities
Discusses upcoming SURF projects worldwide, indicating the company's global reach and strategic engagements in various stages of development, which are crucial for understanding market opportunities and planning.
SURF projects, global, strategy, market opportunities
false
Strategic Planning
Energy & Utilities
Graphic
Barclays
Add to my slides
Remove from favorites
Features a column chart reflecting SVOD account sharing statistics by age group, using varied shades of green to differentiate data sets, presented in a clear format.
Regulatory and Compliance
Media & Entertainment
Discusses the prevalence of SVOD account sharing, which may challenge service terms and impact revenue models in the entertainment industry. Key for compliance and regulatory strategy considerations.
SVOD, account sharing, compliance, entertainment, strategy
false
Regulatory and Compliance
Media & Entertainment
Mixed Chart
Deloitte
Add to my slides
Remove from favorites
Incorporates line charts comparing global SVOD revenue against traditional box office figures from 2015 to 2024, with a separate focus on India. The chart uses contrasting colors to highlight the overtaking of box office revenue by SVOD, underscoring a significant industry shift.
Competitive Landscape
Media & Entertainment
Discusses the impact of digital streaming services on traditional cinema, marking a pivotal shift as SVOD revenue surpasses box office collections globally and in India. This slide is vital for analyzing market dynamics, consumer behavior changes, and the strategic implications for content distributors and film producers.
SVOD, box office, digital transformation, cinema
false
Competitive Landscape
Media & Entertainment
Multiple Chart
PwC/Strategy&
Add to my slides
Remove from favorites
Features multiple bar charts detailing subscription and cancellation rates for SVOD services, using contrasting colors to enhance data readability.
Risk Assessment and Management
Media & Entertainment
Analyzes the reasons for SVOD subscription cancellations, highlighting cost as a significant factor. Offers insights into consumer retention challenges in the streaming service industry.
SVOD, churn, cancellation, streaming, cost
false
Risk Assessment and Management
Media & Entertainment
Single Chart
Deloitte
Add to my slides
Remove from favorites
This slide includes a pie chart to depict how SVOD users are sharing costs, using shades of green and blue to distinguish different user groups.
Financial Performance
Media & Entertainment
Explores how SVOD costs are shared among users, highlighting variations in payment responsibilities, which is essential for understanding consumer payment behaviors in media subscription services.
SVOD, cost sharing, media, consumer behavior, subscriptions
false
Financial Performance
Media & Entertainment
Mixed Chart
Deloitte
Add to my slides
Remove from favorites
Displays a line graph showing the adoption rates of SVOD from 2018 to 2023, with a highlight on the COVID-19 impact. The design is minimalistic with a focus on trend lines and data points.
Market Analysis and Trends
Media & Entertainment
Reviews the subscription rates of video streaming services over recent years, noting a plateau in growth. Useful for analyzing media consumption trends and forecasting future changes in the entertainment industry.
SVOD, media trends, COVID-19, streaming, adoption
false
Market Analysis and Trends
Media & Entertainment
Mixed Chart
Deloitte
Add to my slides
Remove from favorites
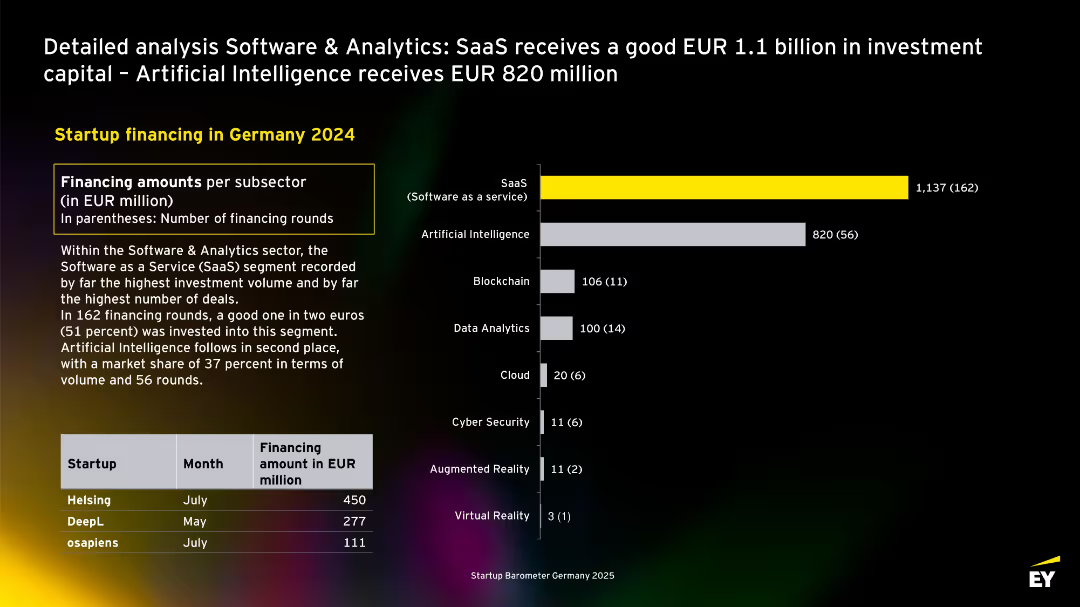
Horizontal bar chart listing subsectors within Software & Analytics by investment volume. SaaS leads, followed by Artificial Intelligence. Includes table of three top-funded startups in 2024.
Product and Service Analysis
Artificial Intelligence
Focuses on financing within the Software & Analytics sector. SaaS dominates with €1.1B across 162 deals, followed by AI with €820M from 56 rounds. The chart highlights subsector specialization and includes key examples like Helsing and DeepL.
SaaS, AI, analytics, blockchain, data, Germany, software, startup funding, subsectors
false
Product and Service Analysis
Artificial Intelligence
Mixed Chart
EY
Add to my slides
Remove from favorites
The slide contains a title at the top, followed by two sections of content, each with a subtitle, bullet points, and column charts. The left section has purple column charts showing growth in SaaS applications from 2022 to 2023, and the right section shows the volume of applications decommissioned. The right section has purple column charts depicting cloud spend as a percentage of total infra spend for 2022 and 2023, and infrastructure RTB expense growth.
Operational Efficiency
Technology & Software
This slide presents a comparison of technology infrastructure development over two years, focusing on the adoption of SaaS applications and decommissioning of legacy systems. It highlights investment in cloud services and maintaining operational costs. The slide illustrates modernization efforts, reflecting the company's strategy to balance infrastructure expansion with cost efficiency, likely aimed at investors or stakeholders to demonstrate prudent financial management and commitment to technological advancement.
SaaS, Decommissioning, Cloud, Infrastructure, Expense, Growth, Technology, Modernization, Investment, Strategy
false
Operational Efficiency
Technology & Software
Multiple Chart
JP Morgan
Add to my slides
Remove from favorites
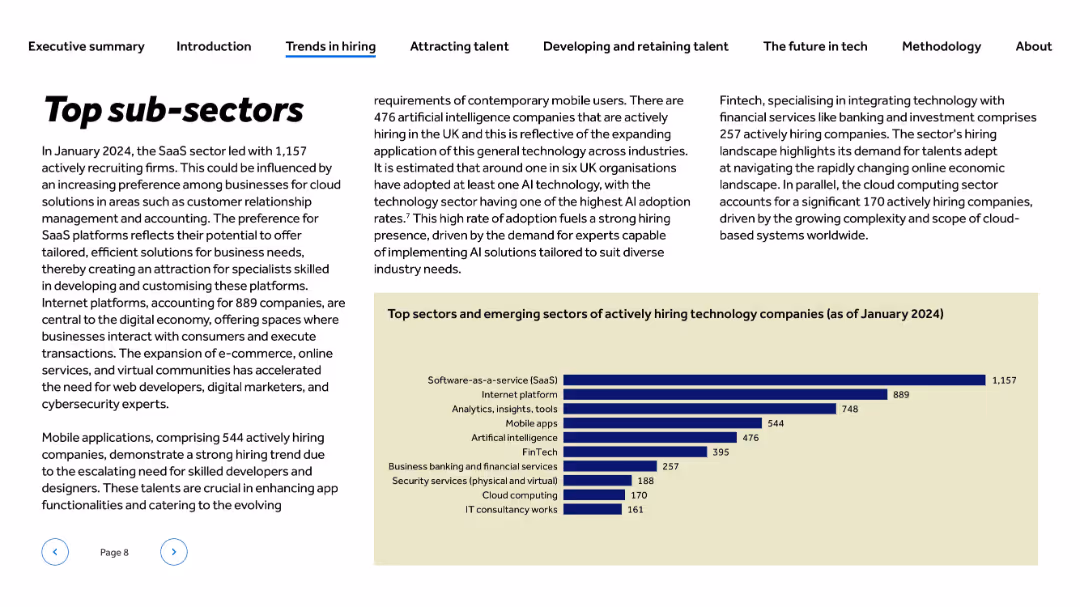
Left-aligned bold title and body text; right-aligned narrative; horizontal bar chart at bottom-right on beige background
Market Analysis and Trends
Technology & Software
The slide outlines the most active tech sub-sectors in hiring as of January 2024. SaaS dominates with 1,157 companies, followed by Internet platforms and analytics. It explores reasons for high hiring in sectors like mobile apps, AI, and FinTech, driven by demand for digital solutions, cloud infrastructure, and customer-facing platforms.
SaaS, FinTech, mobile apps, hiring trends, cloud computing, AI, analytics, UK tech, emerging sectors, internet platforms
false
Market Analysis and Trends
Technology & Software
Mixed Chart
Barclays
Add to my slides
Remove from favorites
Slide features a column chart showing annual unlinked rides with a focus on recent years impacted by the SafeTrack program, marked with annotations and a downward trend.
Risk Assessment and Management
Transportation & Logistics
Analyzes the impact of the SafeTrack program on ridership, presenting the associated risks and losses, and highlighting the need for strategic responses to these challenges.
SafeTrack, ridership loss, risk management, transportation
false
Risk Assessment and Management
Transportation & Logistics
Single Chart
BCG
Add to my slides
Remove from favorites
Previous
Next
You don't have any favorites yet.
Please wait loading your favorites slides...
Create a FREE account to continue browsing
Receive Instant Access to 1,000+ slides from companies like McKinsey, Google, and Goldman Sachs
First Name
Last Name
Email
Password
I agree to all
Terms & Privacy Policy
Thank you! Your submission has been received!
Oops! Something went wrong while submitting the form.
Have an account?
Sign in
Upgrade to PRO to Save slides
Advanced Search and Filters
Access to 15,000+ slides
Access to Category Pages
Save/Bookmark Slides
PowerPoint Template Library
Pick a Plan
MONTHLY
$12/month
Billed every month, Cancel anytime.
YEARLY
$9/year
Billed $108 annually, Cancel anytime.
Checkout for $12/month
Checkout for $108/yr
Secured by Stripe | AES-256 bit encryption


![Backup] Investable Ideas Assessment: Nature and Agriculture, Power, Transport, Buildings, and Industrial and Waste are the major sources of emissions for SEA](https://cdn.prod.website-files.com/654e70fb59937215cac87b19/6899953ad33fac82f2cba73e_mmbgON3bQK6pWFTjrUO0vLt6dHvW1rEcz_-rQsJtocs.avif)


![Exhibit 21 Net SME and Corporate NPL inflow volume expected growth [TRY bn, 2010-23]](https://cdn.prod.website-files.com/654e70fb59937215cac87b19/6877e20fe12f348b3c826c6c_tkMlruY99zc1fTgrR_-gzjy8w1cEAcGj7PCF5vr-SHw.avif)


![Exhibit 24 SME and Corporate NPL Sales Volume Expected Growth [TRY bn, 2010-23]](https://cdn.prod.website-files.com/654e70fb59937215cac87b19/6877e21aeb476b1fdcc185c3_JUV2Ft2aoK3lB7moNg0pc5IvqkFprqK0Sp_gat148wU.avif)