My Account
My Slides
Search by Category
Pricing
Templates
View All Templates
Download Template Slides
✦ AI Search
Feedback
Login
Logout
Get Started
Browse all Slides
Browse all Slides
Create a FREE Account
Instant access to 1,000+ real slides from top companies like McKinsey, BCG, Goldman Sachs, Google and many more!
First Name
Last Name
Email
Password
I agree to all
Terms & Privacy Policy
Thank you! Your submission has been received!
Oops! Something went wrong while submitting the form.
Have an account?
Sign in
Saved Slides
Total No. of slides saved
0
↻ Refresh
✖ Clear all
Bar and line graph showcasing South Korea's testing and cases, with timeline events detailed on the bottom.
Risk Assessment and Management
Healthcare & Pharmaceuticals
Details South Korea's rigorous testing strategy and how it limited the COVID-19 spread, with specific dates and actions taken.
South Korea, testing strategy, COVID-19, case management
false
Risk Assessment and Management
Healthcare & Pharmaceuticals
Single Chart
McKinsey
Add to my slides
Remove from favorites
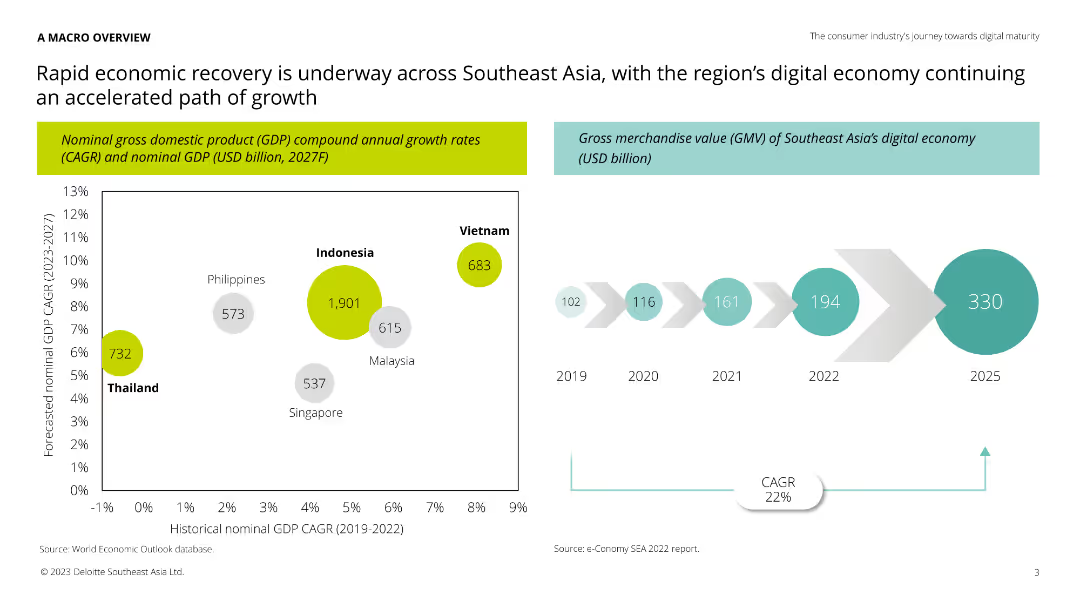
Column chart showing GDP growth rates and GMV of Southeast Asia's digital economy, alongside a timeline of historical GMV from 2019 to 2025.
Market Analysis and Trends
Technology & Software
The slide provides an overview of economic recovery in Southeast Asia, focusing on GDP growth and the digital economy's gross merchandise value. Useful for understanding market trends and growth potential in the region.
Southeast Asia, GDP, digital economy, growth, trends
false
Market Analysis and Trends
Technology & Software
Multiple Chart
Deloitte
Add to my slides
Remove from favorites
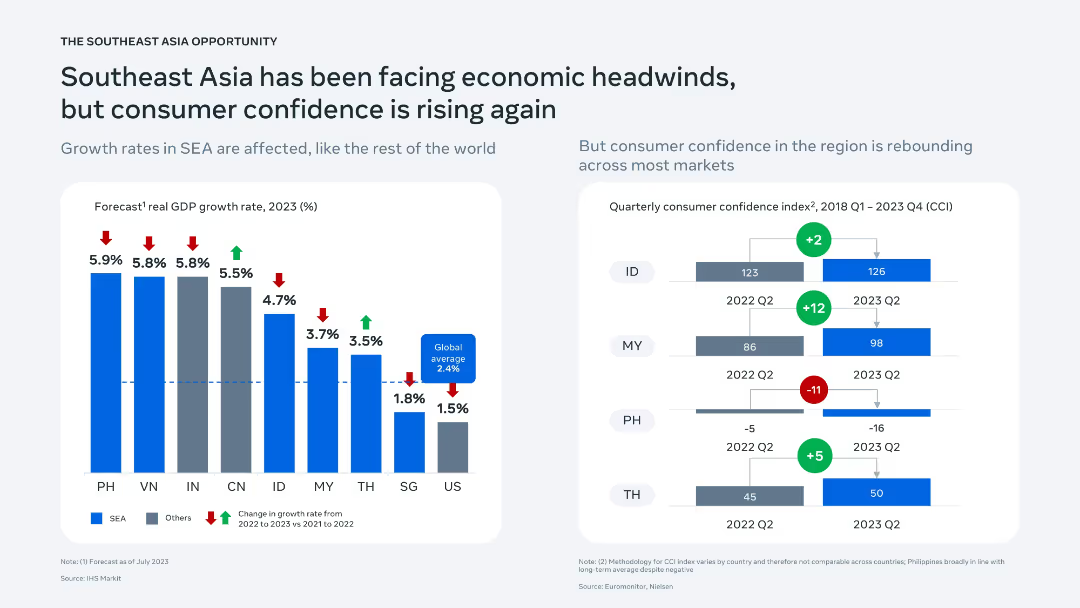
Two-panel slide: left side shows bar chart of GDP growth rates across SEA; right side features CCI trends with bar indicators by country.
Market Analysis and Trends
Financial Services
Analyzes macroeconomic indicators for Southeast Asia, indicating slowed GDP growth but rebounding consumer confidence. CCI data show mixed recovery signals, with Indonesia and Malaysia improving while the Philippines declines.
Southeast Asia, GDP, economic outlook, consumer confidence, regional comparison
false
Market Analysis and Trends
Financial Services
Multiple Chart
Bain
Add to my slides
Remove from favorites
The slide features two doughnut charts showing Southeast Asia’s investment values for 2012 and 2016, focusing on Singapore and Indonesia.
Market Analysis and Trends
Financial Services
Highlights the investment trends in Southeast Asia, with Singapore as the main hub and significant growth in Indonesia’s investment values.
Southeast Asia, Investment, Singapore, Indonesia, Trends
false
Market Analysis and Trends
Financial Services
Single Chart
Kearney
Add to my slides
Remove from favorites
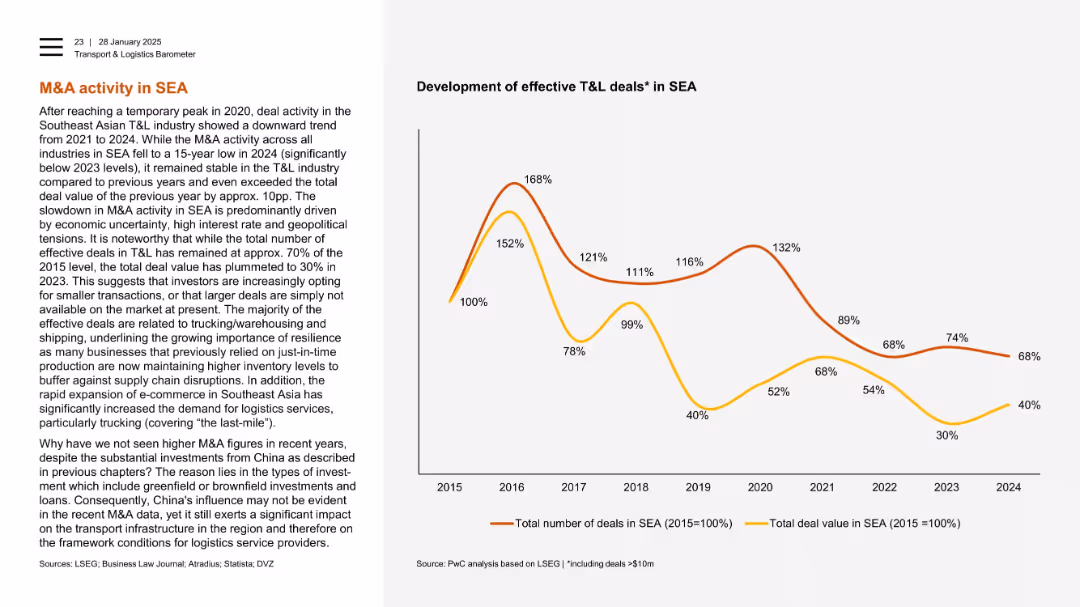
Left panel with explanation, right with dual-line chart showing relative M&A deal trends (2015–2024).
Mergers and Acquisitions
Transportation & Logistics
Despite a long-term decline in M&A activity in Southeast Asia, total deal value in 2024 exceeded 2023 levels. The slide points to investor caution and focus on smaller freight/logistics deals amid geopolitical risks. It also notes the indirect impact of Chinese investment.
Southeast Asia, M&A, logistics, deal value, freight, shipping, economic uncertainty, China
false
Mergers and Acquisitions
Transportation & Logistics
Mixed Chart
PwC/Strategy&
Add to my slides
Remove from favorites
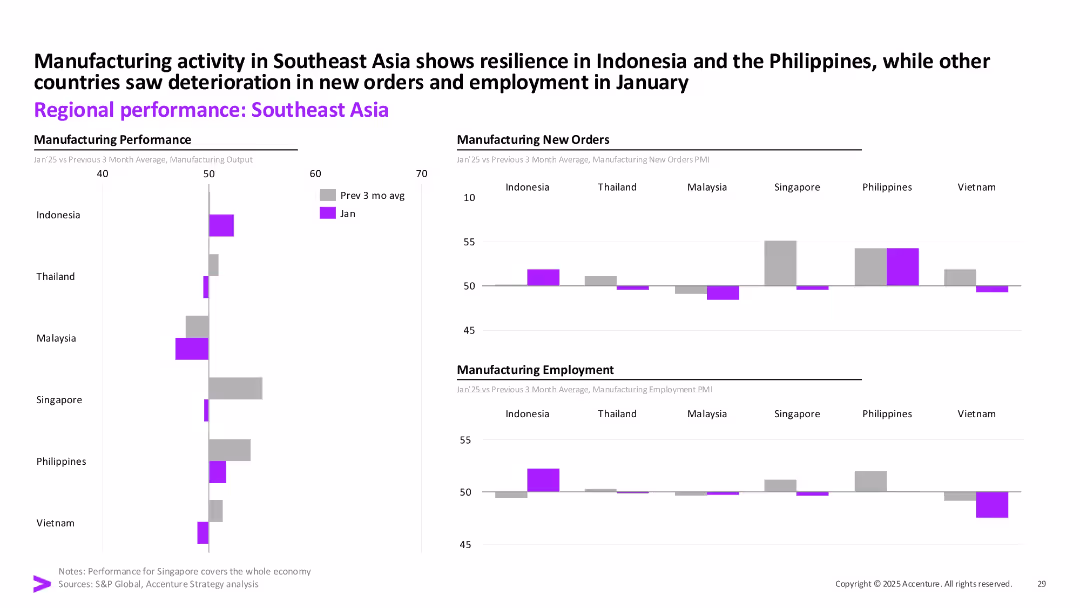
Three-column layout with bar charts comparing manufacturing output, new orders, and employment across Southeast Asian countries.
Performance Metrics and KPIs
Industrial & Manufacturing
Highlights January’s manufacturing trends across Southeast Asia. Indonesia and the Philippines showed strength, while others like Vietnam and Thailand experienced declines in orders and employment.
Southeast Asia, Manufacturing, Employment, PMI, Output, New Orders, January 2025, Industry Trends
false
Performance Metrics and KPIs
Industrial & Manufacturing
Multiple Chart
Accenture
Add to my slides
Remove from favorites
A map of Southeast Asia highlighting six countries with respective population figures, set against a simple backdrop. It's visually straightforward with a focus on the geographical distribution.
Market Analysis and Trends
Technology & Software
A geographic and demographic overview of Southeast Asia, indicating the total population across six key countries and their relevance to the digital economy of the region.
Southeast Asia, Population, Countries, Digital Economy, Geography, Demographics
false
Market Analysis and Trends
Technology & Software
Uncategorized
Bain
Add to my slides
Remove from favorites
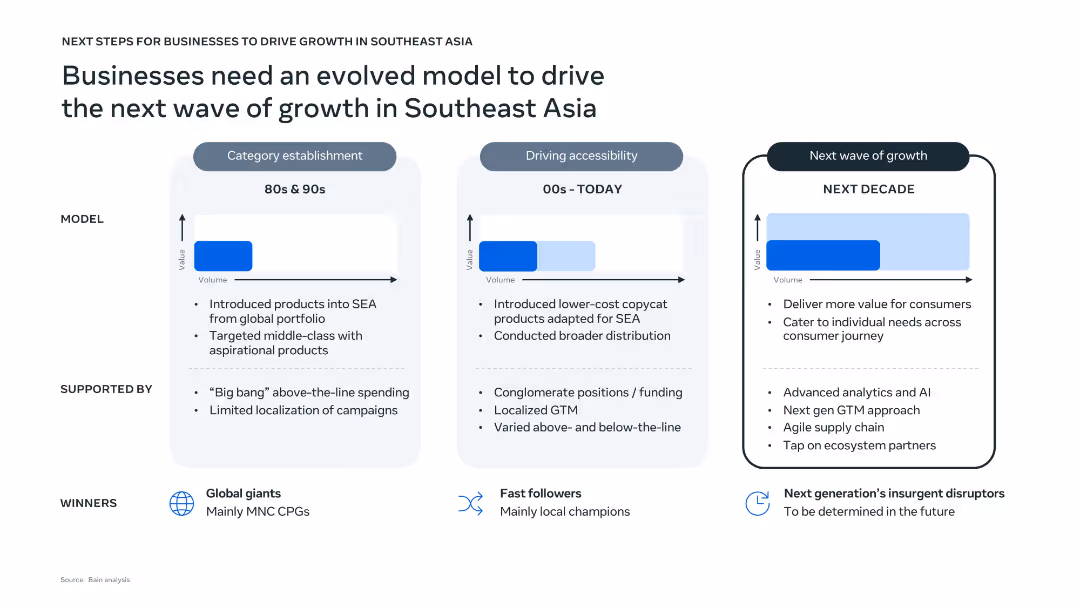
Three-panel vertical layout comparing historical, current, and future business models with text, arrows, and value-volume graphs. Clean design with light blue and white background tones, icons for winners, and dotted line dividers.
Strategic Planning
Professional Services
The slide outlines the evolution of business models in Southeast Asia from the 80s to the projected next decade. It highlights key characteristics, support structures, and market winners for each phase. The upcoming phase emphasizes AI, agile supply chains, and individual consumer targeting to drive future growth.
Southeast Asia, business growth, evolution model, AI, localization, consumer value, strategy
false
Strategic Planning
Professional Services
Single Chart
Bain
Add to my slides
Remove from favorites
Introductory slide with text and small image thumbnails representing reports. Basic complexity.
Industry Overview
Professional Services
Introduction to a thought-leadership series about consumer trends in Southeast Asia by Meta and Bain & Co.
Southeast Asia, consumer trends, Meta, Bain
false
Industry Overview
Professional Services
Pillar
Bain
Add to my slides
Remove from favorites
This slide displays a gray map of Southeast Asia highlighting six countries with blue circles scaled to represent their population sizes. Each country is labeled with a flag icon and population figure.
Industry Overview
Technology & Software
The slide visually communicates the demographic reach of the e-Conomy SEA report, emphasizing the total population of 583 million across six countries in Southeast Asia.
Southeast Asia, e-Conomy SEA, demographics, population, internet economy, country coverage
false
Industry Overview
Technology & Software
Single Chart
Bain
Add to my slides
Remove from favorites
The slide showcases images of different years highlighting the progress in green economy. Text segments outline key accomplishments and strategic visions for Southeast Asia.
Industry Overview
Environmental Services & Sustainability
Provides an overview of the green economy in Southeast Asia, summarizing major developments from 2020 to 2022, including interviews, investment screenings, and prioritizations of decarbonization levers aimed at accelerating the net zero transition.
Southeast Asia, green economy, net zero, investments
false
Industry Overview
Environmental Services & Sustainability
Header Horizontal
Bain
Add to my slides
Remove from favorites
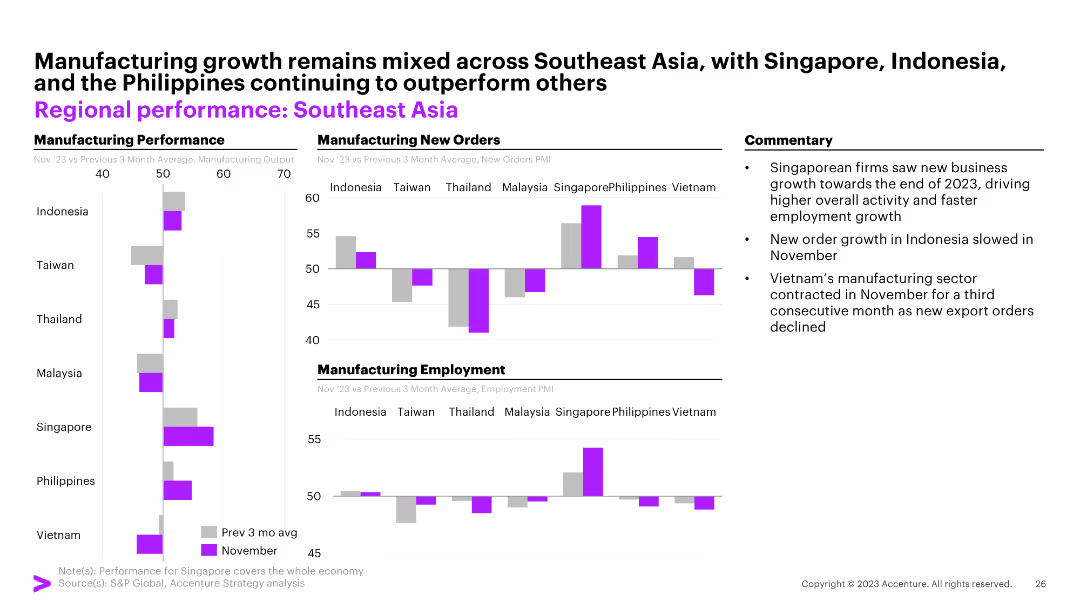
The slide features three column charts illustrating manufacturing performance, manufacturing new orders, and manufacturing employment across Southeast Asian countries. Commentary on the right.
Market Analysis and Trends
Financial Services
The slide highlights mixed manufacturing growth in Southeast Asia with Singapore, Indonesia, and the Philippines outperforming others.
Southeast Asia, manufacturing, new orders, employment, Indonesia, Singapore, Philippines, Taiwan, Thailand, Malaysia, Vietnam
false
Market Analysis and Trends
Financial Services
Multiple Chart
Accenture
Add to my slides
Remove from favorites
Two individuals under a multicolored umbrella looking at a phone. Text on the left. Moderate complexity.
Market Analysis and Trends
Retail & E-commerce
Explores digital habits post-pandemic, particularly in Southeast Asia, with a focus on technology adoption.
Southeast Asia, technology adoption, digital habits
false
Market Analysis and Trends
Retail & E-commerce
Agenda
Bain
Add to my slides
Remove from favorites
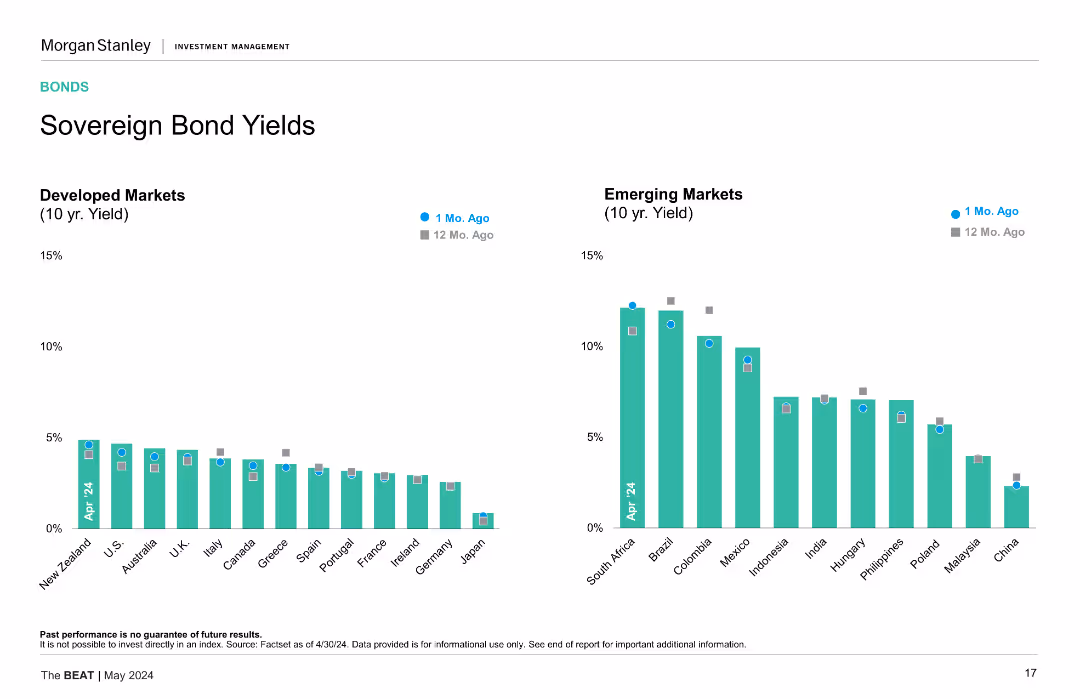
This slide displays two vertical bar charts side by side. The left chart shows 10-year yields for developed markets, while the right chart shows the same for emerging markets, comparing data from 1 month ago and 12 months ago.
Market Analysis and Trends
Financial Services
The slide presents a comparison of sovereign bond yields between developed and emerging markets over the past year, highlighting yield changes and potential market implications.
Sovereign Bonds, Yields, Developed Markets, Emerging Markets, Comparison, Financial Analysis
false
Market Analysis and Trends
Financial Services
Multiple Chart
Morgan Stanley
Add to my slides
Remove from favorites
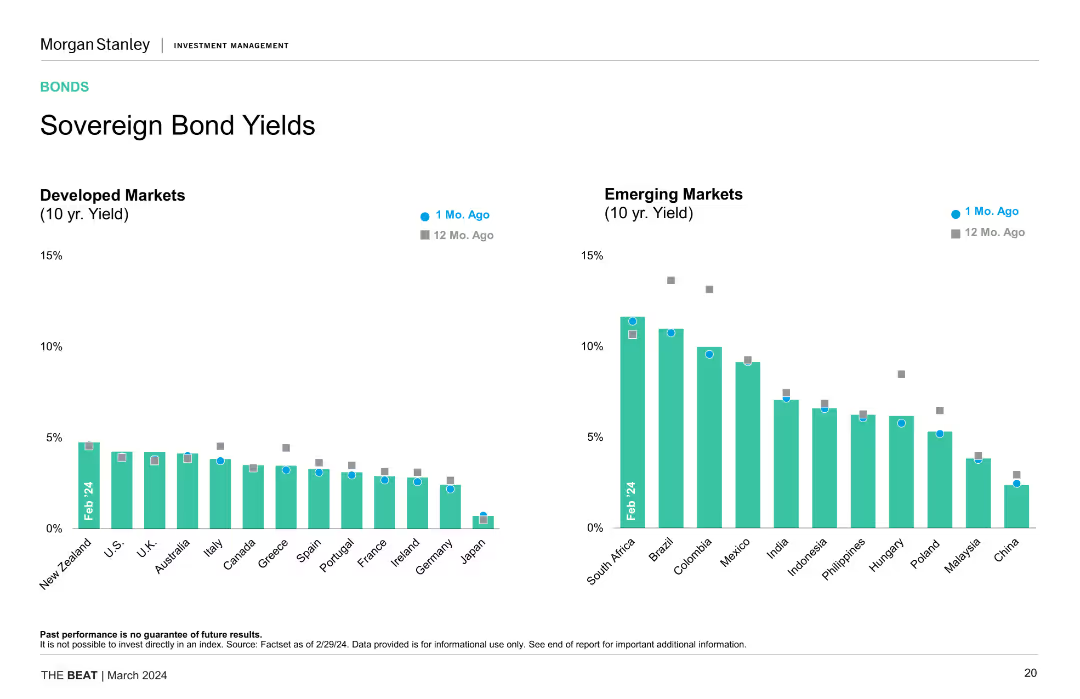
Two column charts comparing 10-year yields of developed and emerging markets over the past month and year, highlighting yield changes and comparisons.
Financial Performance
Financial Services
The slide provides a comparison of sovereign bond yields between developed and emerging markets, showing recent and year-on-year changes, useful for yield analysis and investment decisions.
Sovereign Bonds, Yields, Developed Markets, Emerging Markets, Investment Analysis, Trends
false
Financial Performance
Financial Services
Multiple Chart
Morgan Stanley
Add to my slides
Remove from favorites
Dual column charts displaying 10-year sovereign bond yields for developed and emerging markets, differentiated by color coding for '1 Mo. Ago' and '12 Mo. Ago'.
Investment Analysis
Financial Services
Comparative analysis of 10-year sovereign bond yields between developed and emerging markets, shown in column charts to visualize changes over time. This slide is useful for investors tracking bond market trends and interest rate changes.
Sovereign Bonds, Yields, Developed Markets, Emerging Markets, Investment, Trends
false
Investment Analysis
Financial Services
Multiple Chart
Morgan Stanley
Add to my slides
Remove from favorites
Timeline diagram projecting the evolution of space activities up to geostationary orbit by 2050, with different activities categorized by their orbital distances.
Technology and Digital Transformation
Technology & Software
The slide outlines the projected growth in human space activities, categorizing them by orbital distances from Earth. It highlights the various commercial and scientific endeavors in space, emphasizing the potential for continuous growth and innovation in space exploration and utilization.
Space Activities, Orbital Distances, Growth
false
Technology and Digital Transformation
Technology & Software
Mixed Chart
Roland Berger
Add to my slides
Remove from favorites
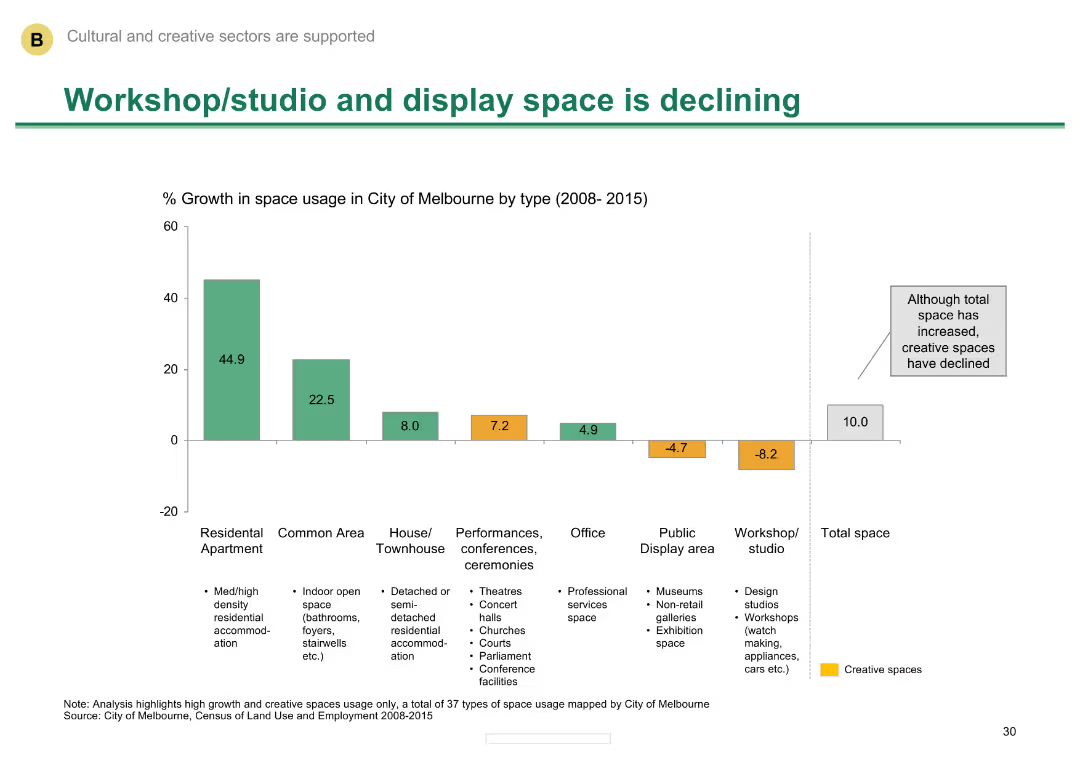
Column chart showing percentage growth in space usage in Melbourne by type from 2008-2015
Market Analysis and Trends
Media & Entertainment
Shows the decline in workshop/studio and display space in Melbourne, despite an increase in total space.
Space usage, Melbourne, decline, workshop/studio, display space
false
Market Analysis and Trends
Media & Entertainment
Single Chart
BCG
Add to my slides
Remove from favorites
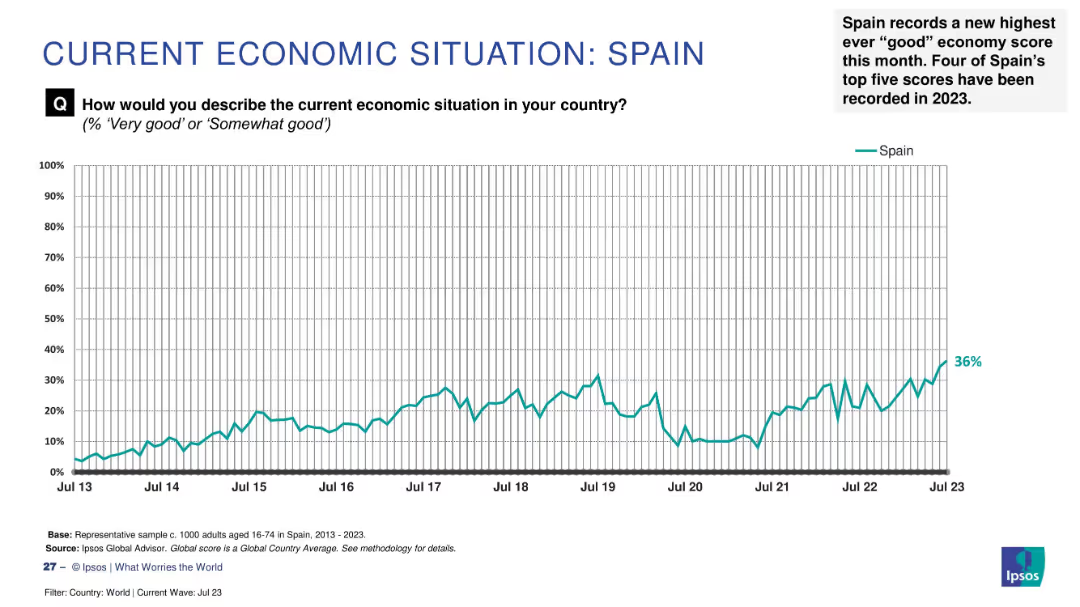
Line chart of economic sentiment from 2013–2023, with annotation showing record-high score (36%) in July 2023.
Market Analysis and Trends
Financial Services
Spain has achieved its highest recorded "good" economy rating at 36%, marking four of its top five scores in 2023. The chart highlights a decade-long upward trend in public economic perception.
Spain, record high, 2023, public sentiment, economic optimism, Ipsos survey, trend analysis, long-term improvement, economic confidence
false
Market Analysis and Trends
Financial Services
Single Chart
IPSOS
Add to my slides
Remove from favorites
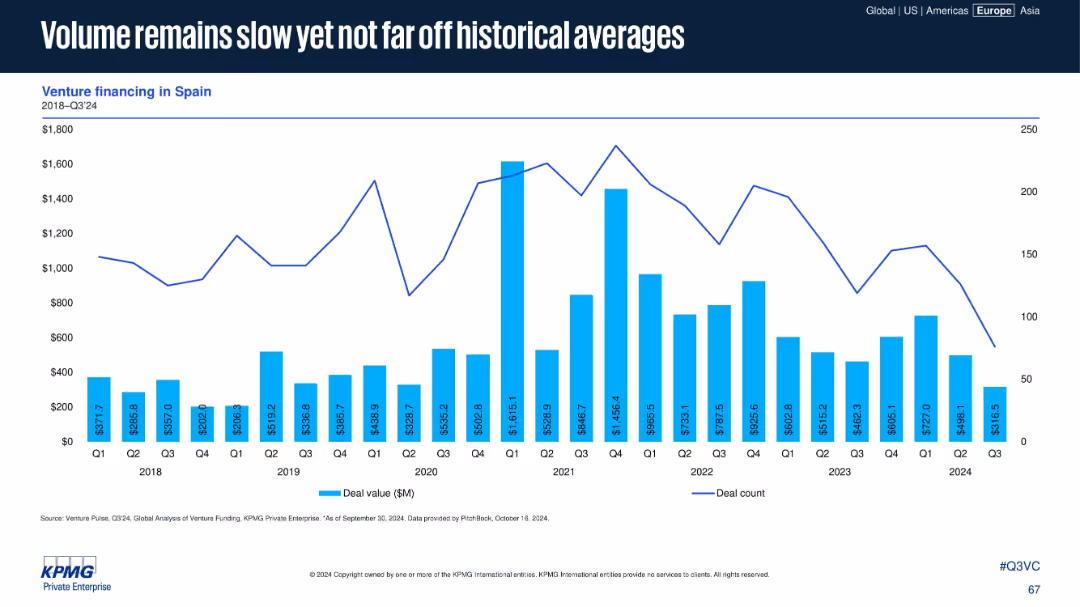
Spain-focused venture financing chart with deal values and counts from 2018 to Q3 2024. Steady layout, minimal design.
Market Analysis and Trends
Financial Services
Spain's VC volume remains subdued in 2024 but aligns with historical norms. Despite occasional surges, overall activity trends remain modest. The layout provides a clear long-term perspective with no interpretive commentary.
Spain, venture financing, historical average, VC volume, investment trend, 2024, steady performance, capital flow
false
Market Analysis and Trends
Financial Services
Single Chart
KPMG
Add to my slides
Remove from favorites
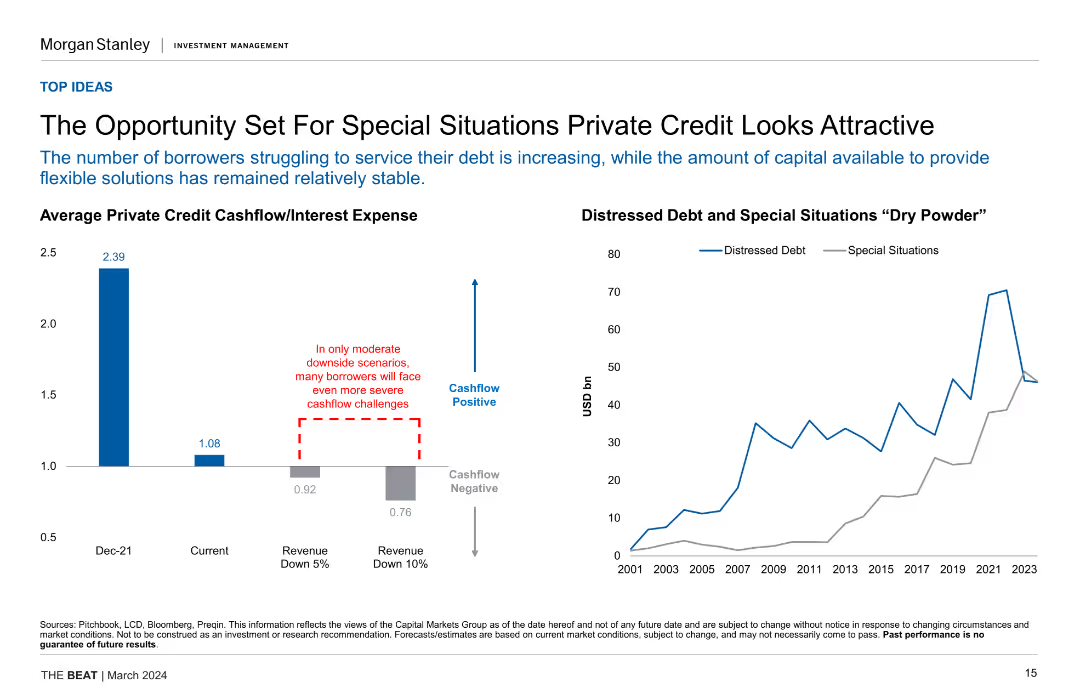
Column chart showing average private credit cashflow/interest expense and line chart of distressed debt vs. special situations "dry powder", highlighting cashflow challenges.
Investment Analysis
Financial Services
This slide discusses the attractiveness of special situations private credit due to increasing borrower struggles and stable capital availability for flexible solutions.
Special Situations, Private Credit, Cashflow, Distressed Debt, Investment Opportunities
false
Investment Analysis
Financial Services
Multiple Chart
Morgan Stanley
Add to my slides
Remove from favorites
Two-column layout comparing "Playing Defense" with Hyper-specialization and "Playing Offense" with Hyper-personalization. Each column lists strategies and roles.
Strategic Planning
Professional Services
Compares the roles of hyper-specialization and hyper-personalization in brand strategy, detailing defensive and offensive approaches for customer engagement.
Specialization, personalization, strategy, comparison, roles
false
Strategic Planning
Professional Services
Multiple Chart
BCG
Add to my slides
Remove from favorites
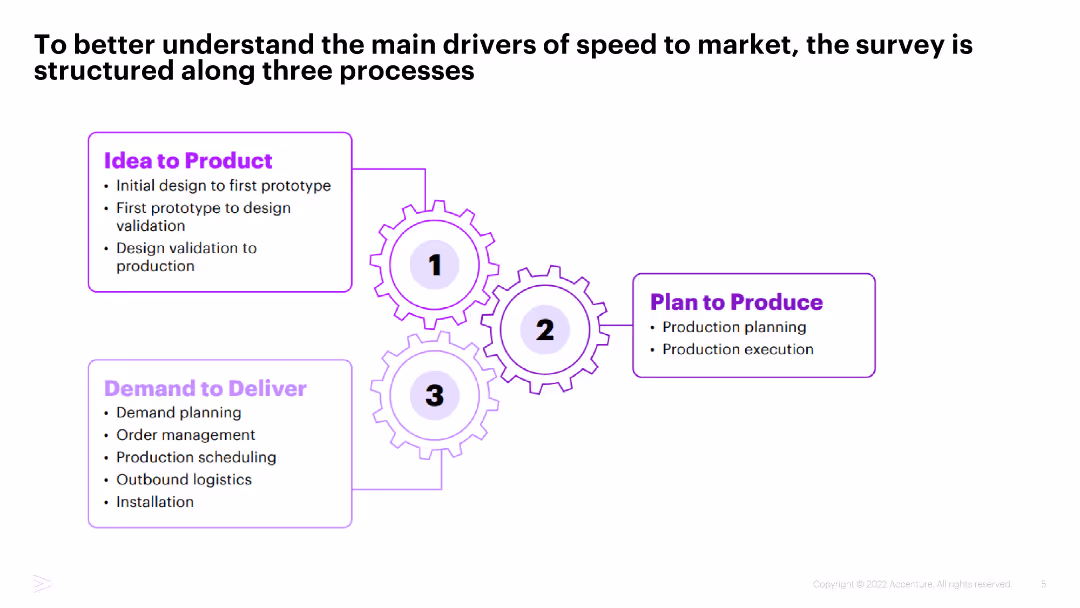
Diagram with three interconnected gears labeled "Idea to Product," "Plan to Produce," and "Demand to Deliver," detailing the stages from design to production and delivery.
Operational Efficiency
Industrial & Manufacturing
This slide explains the structure of the survey focused on speed to market, breaking it down into three main processes: Idea to Product, Plan to Produce, and Demand to Deliver.
Speed to market, Processes, Industrial manufacturing, Survey structure, Operational efficiency
false
Operational Efficiency
Industrial & Manufacturing
Framework
Accenture
Add to my slides
Remove from favorites
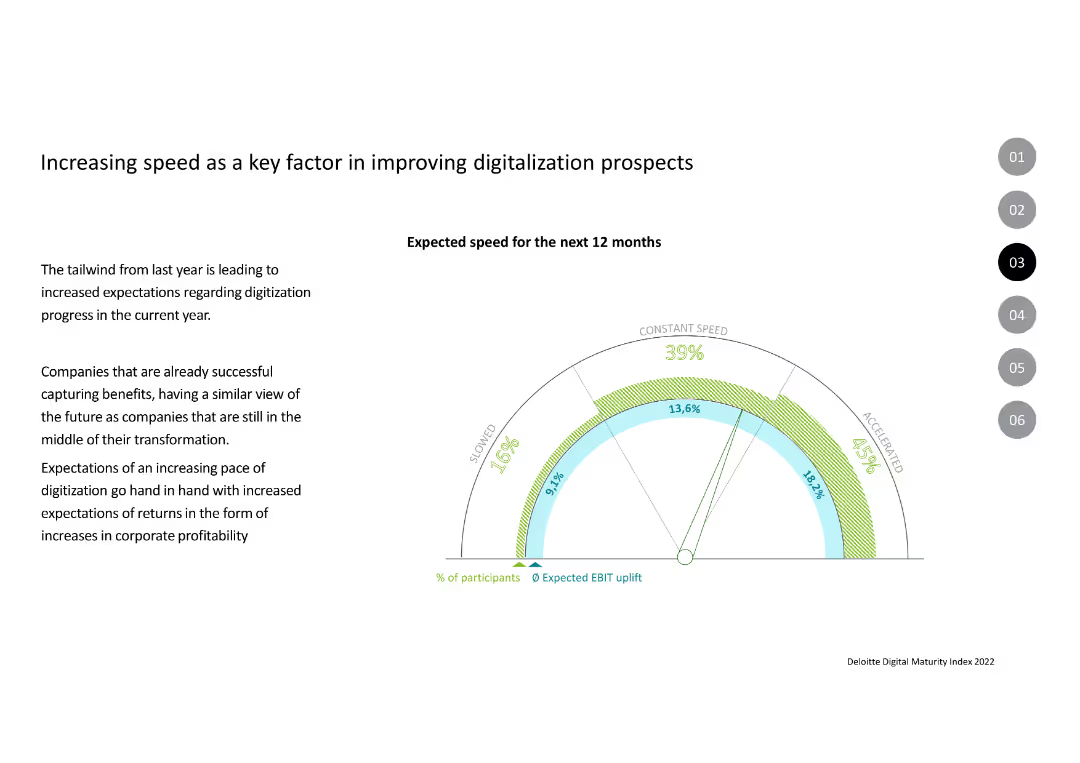
The slide includes a speedometer-style chart indicating expected speed for the next 12 months with segments for slowed, constant speed, and accelerated speeds.
Market Analysis and Trends
Technology & Software
The slide outlines the expectations of increased speed in digitization for the next year, correlating speed with expected EBIT uplift and profitability improvements.
Speed, Digitalization, EBIT, Profitability, Expectations, Transformation
false
Market Analysis and Trends
Technology & Software
Mixed Chart
Deloitte
Add to my slides
Remove from favorites
Presents multiple line charts tracking spending trends across various income and spending categories over several months.
Financial Performance
Financial Services
Analyzes spending patterns in the U.S. during 2020, noting differences in recovery rates among income levels and spending categories, revealing slower discretionary spending recovery among high-income groups.
Spending, COVID-19, Income Levels, Recovery, U.S. Economy
false
Financial Performance
Financial Services
Multiple Chart
McKinsey
Add to my slides
Remove from favorites
The slide includes multiple column charts and quotes on a white background. It compares council members' views on sponsorship.
Client Case Studies
Professional Services
The content focuses on the challenges and considerations in selecting corporate sponsorships, including reputational risks and alignment.
Sponsorship, corporate, alignment, reputational risks, council members, corporate communications, financial sponsorship
false
Client Case Studies
Professional Services
Multiple Chart
IPSOS
Add to my slides
Remove from favorites
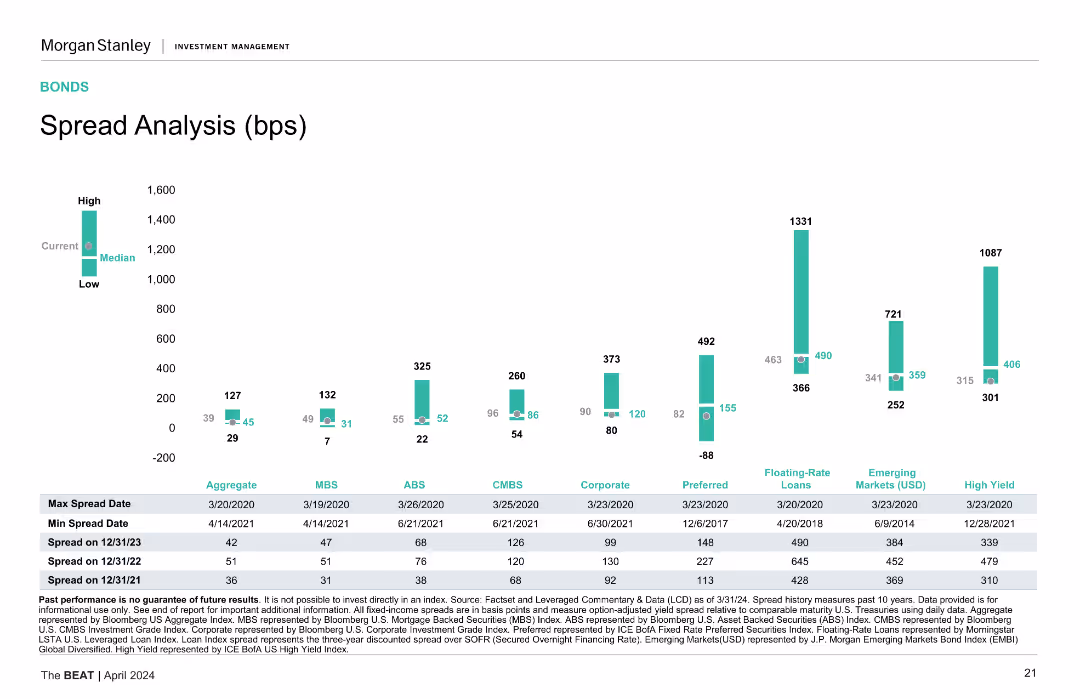
Column charts showing spread analysis for different bond categories, with high, median, and low spread data points.
Market Analysis and Trends
Financial Services
Analyzes spreads across various bond types, showing max and min spread dates, and spread values for different periods.
Spread Analysis, Bonds, Financial Metrics, Market Trends, Credit Spreads
false
Market Analysis and Trends
Financial Services
Mixed Chart
Morgan Stanley
Add to my slides
Remove from favorites
A column chart displays the spread analysis for various financial instruments, with high, low, and median values. Each category is color-coded.
Financial Performance
Financial Services
The slide analyzes spread data for different financial instruments over time, providing insights into current and historical spreads in basis points.
Spread Analysis, Financial Instruments, Basis Points, Historical Data
false
Financial Performance
Financial Services
Mixed Chart
Morgan Stanley
Add to my slides
Remove from favorites
Bar chart comparing spread analysis across different asset classes such as Aggregates, MBS, ABS, CMBS, Corporate, Preferred, etc. showing high, median, and low spreads.
Market Analysis and Trends
Financial Services
Analyzes the spread across various fixed-income asset classes, helping in understanding market risks and the relative pricing of different asset types.
Spread analysis, asset classes, market
false
Market Analysis and Trends
Financial Services
Mixed Chart
Morgan Stanley
Add to my slides
Remove from favorites
This slide features a vertical bar chart comparing spreads (in basis points) for various financial instruments, including Aggregate, MBS, ABS, CMBS, Corporate, Preferred, Floating-Rate Loans, Emerging Markets, and High Yield, over multiple dates.
Risk Assessment and Management
Financial Services
Provides a detailed analysis of spread changes across various financial instruments, highlighting maximum and minimum spreads over the past years and current levels relative to historical medians.
Spreads, Basis Points, Financial Instruments, Risk Management, MBS, ABS, CMBS, Corporate, Preferred, Floating-Rate Loans
false
Risk Assessment and Management
Financial Services
Mixed Chart
Morgan Stanley
Add to my slides
Remove from favorites
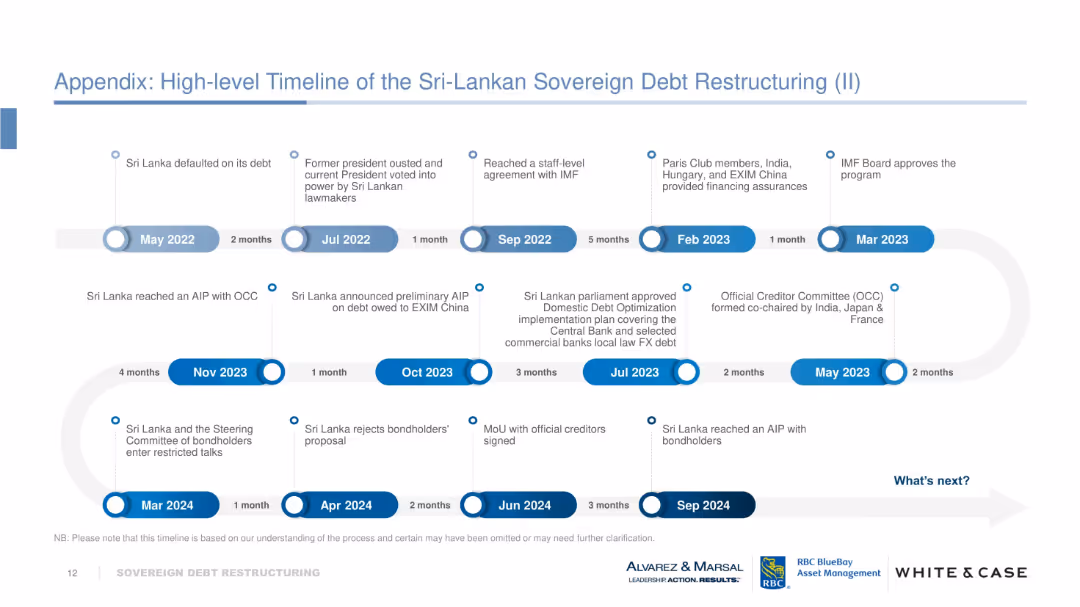
Horizontal timeline using labeled blue and white milestone circles connected by arrows. Covers events from May 2022 to Sep 2024 with major political and financial developments marked clearly. Uses a “What’s next?” callout.
Strategic Planning
Financial Services
This slide visually narrates the progression of Sri Lanka’s debt restructuring efforts, detailing political transitions, agreements with the IMF and OCC, domestic debt optimization, and bondholder negotiations. It emphasizes key events and intervals, forecasting the continuation of restructuring beyond Sep 2024.
Sri Lanka, debt restructuring, IMF, OCC, bondholders, default, timeline, AIP, milestones
false
Strategic Planning
Financial Services
Vertical Flow
Alvarez & Marsal
Add to my slides
Remove from favorites
This slide includes a column chart comparing the holding of various stablecoins in 2022 and 2023, with specific percentages for each stablecoin listed.
Market Analysis and Trends
Financial Services
It details the types of stablecoins held by Canadians, including Binance USD and CAD Coin, noting changes in holding percentages from 2022 to 2023.
Stablecoins, VRCAs, 2023, 2022, holdings, Binance USD, CAD Coin, crypto assets
false
Market Analysis and Trends
Financial Services
Multiple Chart
IPSOS
Add to my slides
Remove from favorites
Features a column chart on the usage of stablecoins, including conversion to fiat currency and payments.
Market Analysis and Trends
Financial Services
The slide presents data on the usage of stablecoins among Canadians, highlighting top uses like converting to fiat currency, making payments, and earning yield, while also showing a significant portion who have never used them.
Stablecoins, usage, Canadians
false
Market Analysis and Trends
Financial Services
Mixed Chart
IPSOS
Add to my slides
Remove from favorites
Table and bar chart comparing staff counts per 100,000 residents across states. Text explains findings. Dense with detailed information.
Operational Efficiency
Healthcare & Pharmaceuticals
Benchmarking NH DHHS staffing levels compared to other states, suggesting that NH is not overstaffed relative to total population served.
Staffing, Benchmarking, DHHS, Residents, Comparison
false
Operational Efficiency
Healthcare & Pharmaceuticals
Mixed Chart
Alvarez & Marsal
Add to my slides
Remove from favorites
Table and bar chart comparing staff counts per 10,000 beneficiaries across states. Detailed text explanation. Dense with a focus on data.
Operational Efficiency
Healthcare & Pharmaceuticals
Analysis of NH DHHS staff relative to the number of beneficiaries served, indicating NH is in the middle range compared to other states.
Staffing, Beneficiaries, DHHS, Comparison, Analysis
false
Operational Efficiency
Healthcare & Pharmaceuticals
Mixed Chart
Alvarez & Marsal
Add to my slides
Remove from favorites
Contains a pie chart and a column chart, detailed textual information regarding staffing challenges in shared services, and clear graphical representation of turnover rates and retention strategies.
Human Resources and Talent Management
Professional Services
Offers insights into the staffing and turnover challenges within shared services centers, including statistics on turnover rates and strategies for talent retention. Useful for HR management discussions and planning.
Staffing, turnover, shared services, retention strategies, talent management
false
Human Resources and Talent Management
Professional Services
Multiple Chart
Deloitte
Add to my slides
Remove from favorites
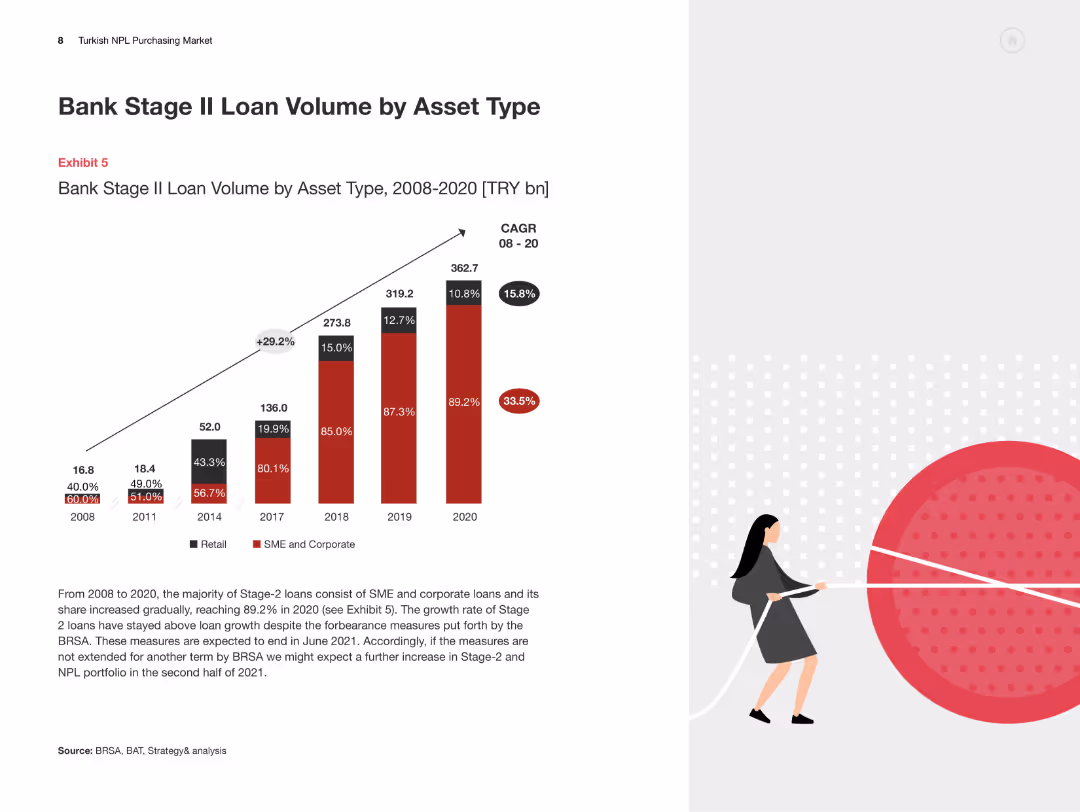
The slide features a column chart illustrating the bank Stage II loan volume by asset type from 2008 to 2020, with explanatory text on the growth and trends observed.
Market Analysis and Trends
Financial Services
This slide examines the growth of Stage II loans by asset type in the Turkish banking sector, detailing the significant trends and factors influencing the market.
Stage II Loans, Asset Type, Turkey, Loan Volume, Market Trends
false
Market Analysis and Trends
Financial Services
Mixed Chart
PwC/Strategy&
Add to my slides
Remove from favorites
The slide is divided into two main sections. The left side contains text analysis on stagflation with a graph on inventory sales. The right side displays two line graphs concerning inflation rates and asset value vs. growth rates.
Market Analysis and Trends
Financial Services
This slide analyzes the shift from stagflation to disinflation and the potential recession, providing insights into inventory levels and inflation rates that are crucial for economic and market predictions.
Stagflation, disinflation, recession, market analysis, inventory levels, inflation rates, economic prediction, growth rates, asset values, market trends
false
Market Analysis and Trends
Financial Services
Multiple Chart
Morgan Stanley
Add to my slides
Remove from favorites
This slide features a clean, two-column layout with bullet points. It discusses different stakeholder groups and methods of engagement. The left side of the slide categorizes stakeholders, while the right side details engagement strategies. There are no visual data elements.
Strategic Planning
Technology & Software
Describes how the firm engages with customers, clients, employees, and communities. It covers the approaches to interaction and feedback, highlighting the importance of informed decision-making and responsive policies.
Stakeholders, Engagement, Customers, Employees, Communities, Communication, Feedback
false
Strategic Planning
Technology & Software
Table
JP Morgan
Add to my slides
Remove from favorites
Features a combination of column charts and small text explanations. The design is compact and focused on delivering statistical data effectively.
Investment Analysis
Environmental Services & Sustainability
Highlights the growth in stakeholder engagement in climate actions in SEA, showing statistics on investments and policy changes among corporates, investors, and consumers.
Stakeholders, climate action, SEA, investments, policy changes
false
Investment Analysis
Environmental Services & Sustainability
Mixed Chart
Bain
Add to my slides
Remove from favorites
A circular diagram in the center with icons around representing different stakeholders, text on left
Client Case Studies
Professional Services
Details the involvement of various stakeholders in EY, emphasizing internal and external communication
Stakeholders, engagement, EY, communication, plan
false
Client Case Studies
Professional Services
Diagram
EY
Add to my slides
Remove from favorites
Features multiple pie charts with accompanying descriptive text. Uses green and gray color scheme.
Regulatory and Compliance
Environmental Services & Sustainability
Details the pressure from various stakeholder groups on companies to act on climate change.
Stakeholders, pressure, climate change, company actions
false
Regulatory and Compliance
Environmental Services & Sustainability
Multiple Chart
Deloitte
Add to my slides
Remove from favorites
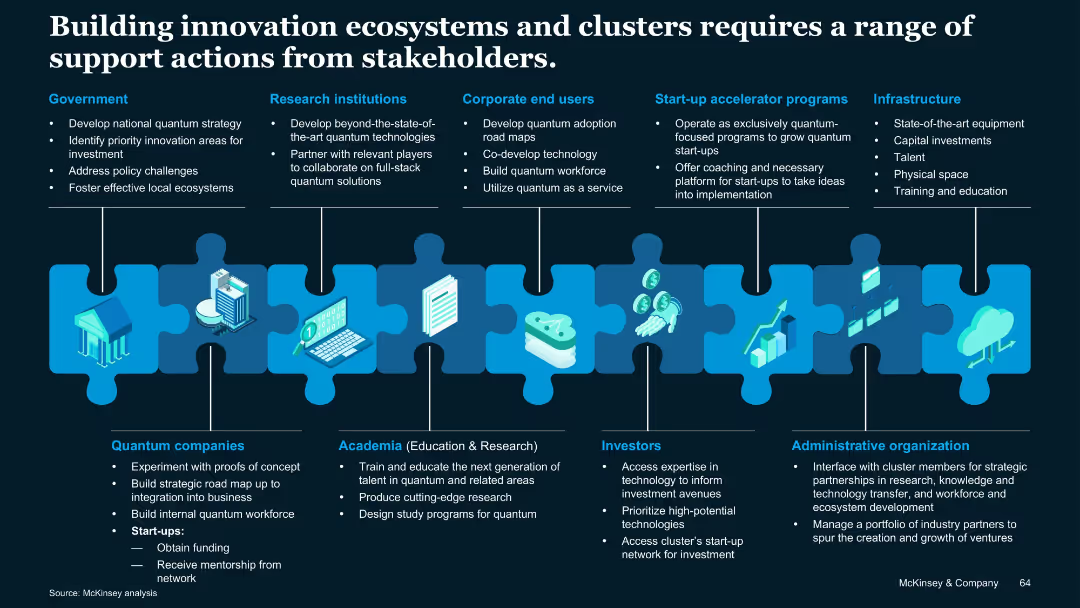
Puzzle piece metaphor visual linking different stakeholder groups; icons and vertical segments describe roles of various players.
Technology and Digital Transformation
Artificial Intelligence
Describes stakeholder roles—government, academia, industry, investors, infrastructure—in building innovation ecosystems for quantum tech. Emphasizes coordinated contributions to support development and commercialization.
Stakeholders, quantum clusters, infrastructure, investment, academia
false
Technology and Digital Transformation
Artificial Intelligence
Uncategorized
McKinsey
Add to my slides
Remove from favorites
The slide includes column charts showing the types of medical supplies hospitals are standardizing, segmented by overall, private, and public hospitals.
Operational Efficiency
Healthcare & Pharmaceuticals
The slide highlights the trends in standardizing medical supplies, focusing on diagnostic imaging equipment, surgical instruments, and medical consumables, comparing overall trends with private and public hospitals.
Standardization, medical supplies, hospitals, imaging, trends
false
Operational Efficiency
Healthcare & Pharmaceuticals
Multiple Chart
LEK
Add to my slides
Remove from favorites
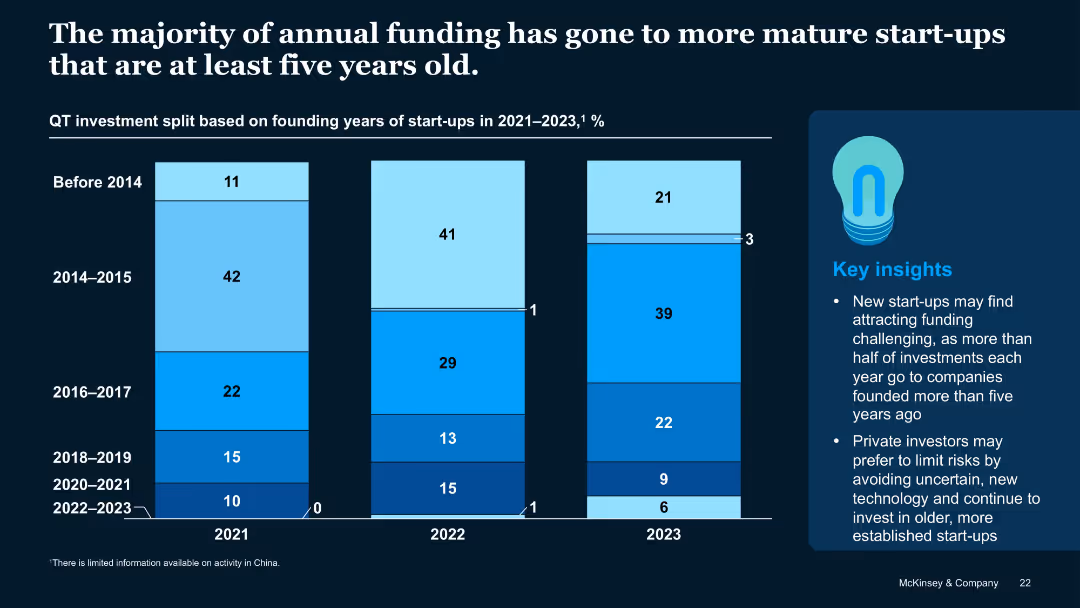
Stacked vertical bar chart showing funding split by start-up founding year across 2021–2023
Investment Analysis
Artificial Intelligence
Most QT investments go to start-ups older than five years, with declining shares for younger firms. The trend suggests investor caution toward early-stage or recently founded start-ups, particularly those formed post-2020.
Start-up Age, Founding Year, Funding Trends, QT Investment, Investor Bias
false
Investment Analysis
Artificial Intelligence
Mixed Chart
McKinsey
Add to my slides
Remove from favorites
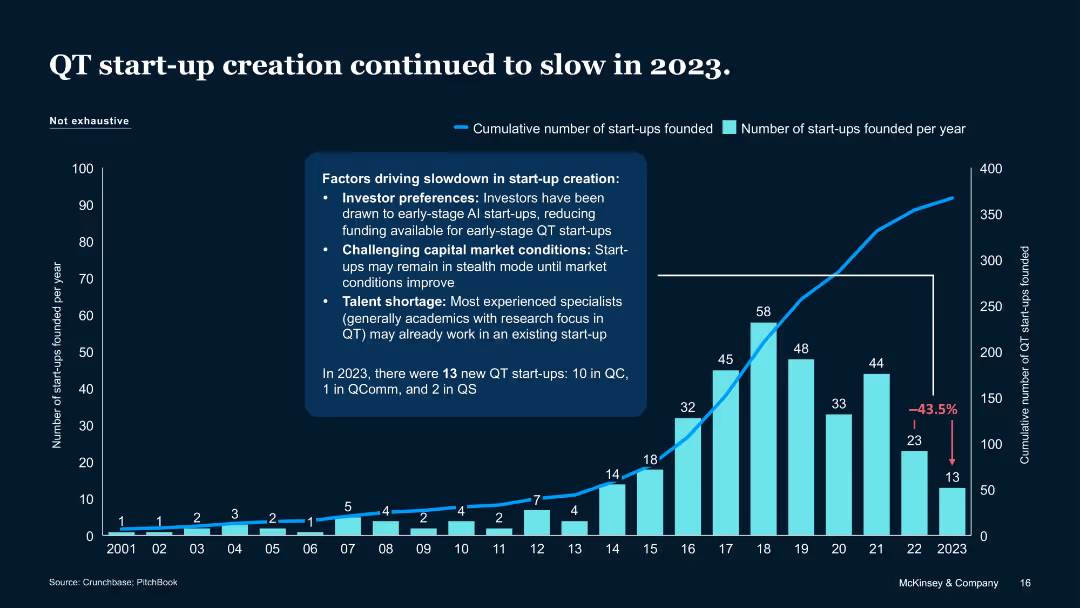
Column and line chart with annotation and bullet-pointed factors
Market Analysis and Trends
Artificial Intelligence
Reports a 43.5% drop in QT start-up formation in 2023. Attributes slowdown to investor preference for Gen AI, tough market conditions, and talent scarcity. Indicates only 13 QT start-ups were founded in 2023.
Start-up creation, QT trends, slowdown factors, 2023, Crunchbase
false
Market Analysis and Trends
Artificial Intelligence
Mixed Chart
McKinsey
Add to my slides
Remove from favorites
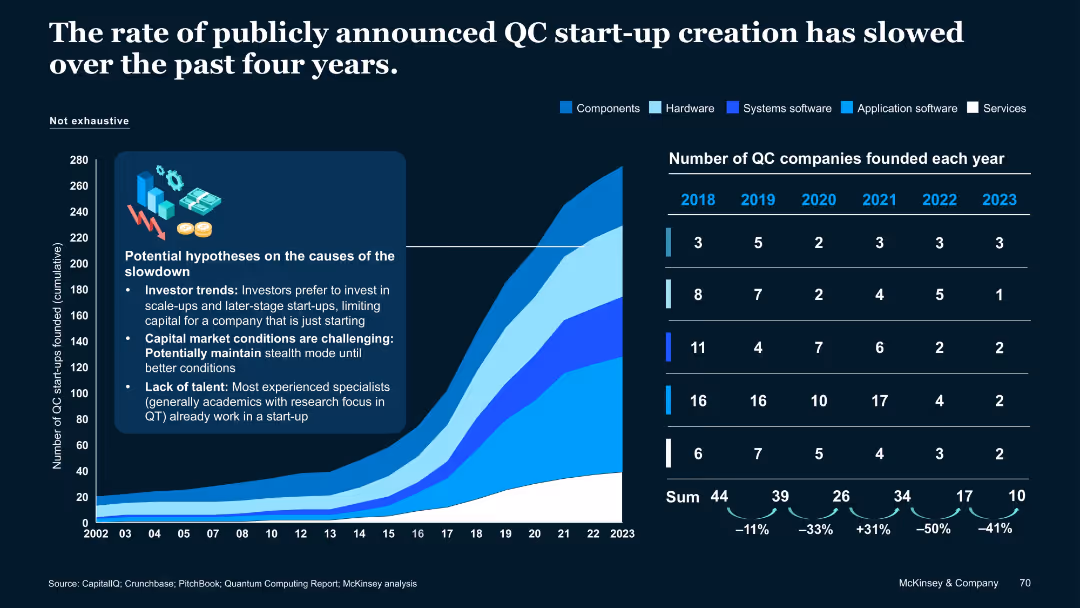
Combination of line graph and bar chart with annotations; left side includes potential causes of slowdown in a callout box.
Market Analysis and Trends
Artificial Intelligence
Shows declining trend in quantum computing start-up creation since 2020, analyzing causes like investor behavior, market conditions, and talent shortages. Visualizes number of start-ups founded by category and year.
Start-up trends, investment, talent shortage, market analysis, QC growth
false
Market Analysis and Trends
Artificial Intelligence
Mixed Chart
McKinsey
Add to my slides
Remove from favorites
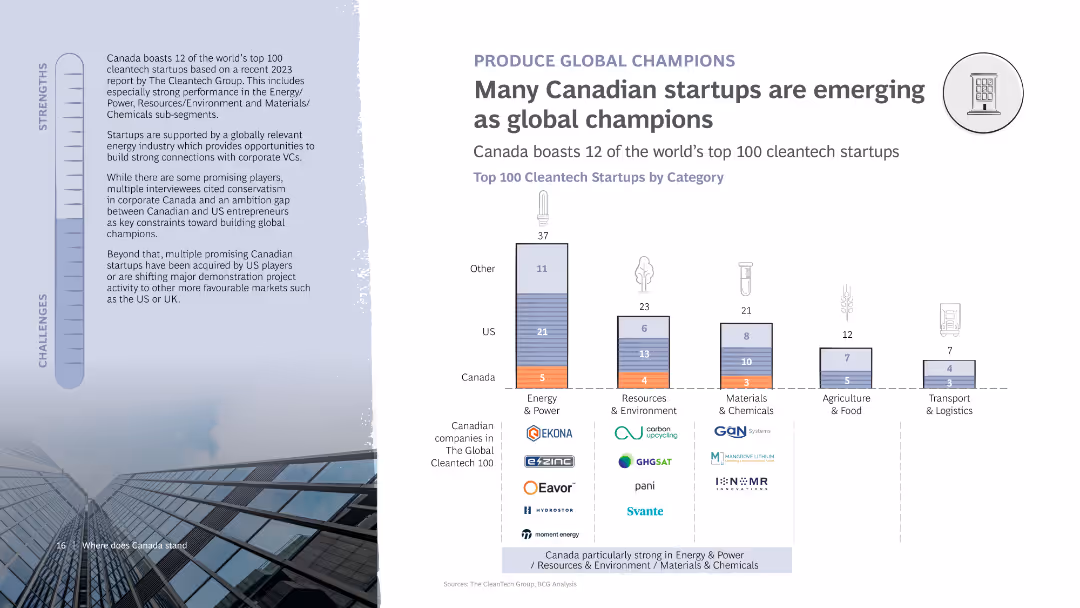
The slide includes a column chart showing the top 100 cleantech startups by category, with a breakdown of companies from Canada and the US. It features text discussing the strengths and challenges of Canadian startups in becoming global champions.
Competitive Landscape
Technology & Software
Discusses the emergence of Canadian startups as global leaders in cleantech, with specific examples from various categories. Highlights strengths and challenges in achieving global recognition and success.
Startups, Cleantech, Canada, Global champions, Chart
false
Competitive Landscape
Technology & Software
Mixed Chart
BCG
Add to my slides
Remove from favorites
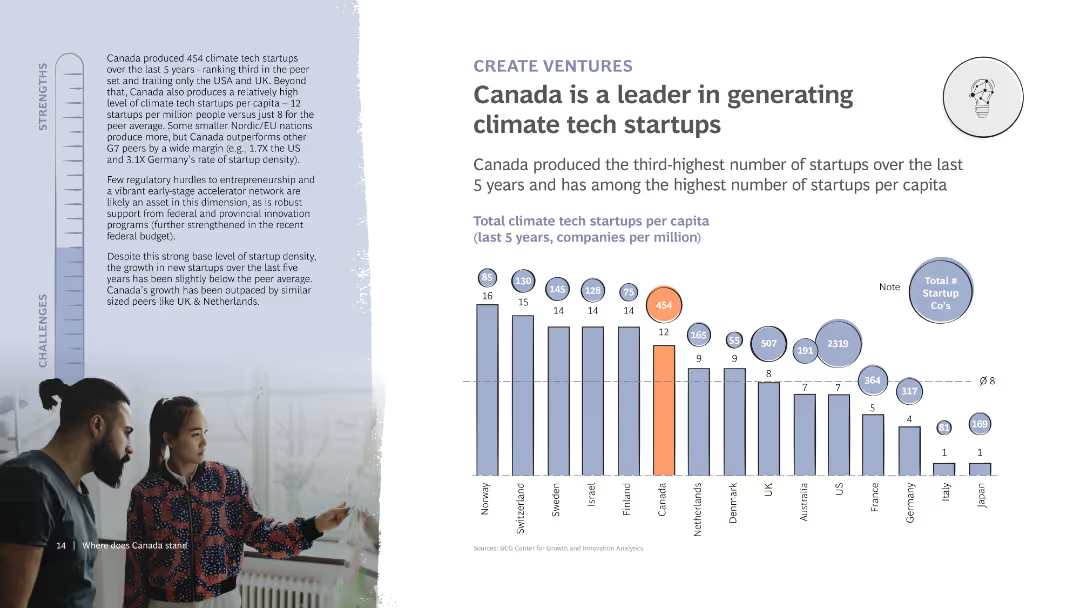
The slide includes a column chart showing the number of climate tech startups per capita in various countries. It also features detailed text discussing Canada’s startup ecosystem and its strengths and challenges, with a photo of two people collaborating.
Market Analysis and Trends
Technology & Software
Highlights Canada's leadership in generating climate tech startups, showing it ranks high in startups per capita. Discusses the supportive ecosystem and challenges in maintaining growth and innovation in the sector.
Startups, Climate tech, Canada, Innovation, Ecosystem
false
Market Analysis and Trends
Technology & Software
Mixed Chart
BCG
Add to my slides
Remove from favorites
Displays column charts and startup logos, organized in a visually engaging and informative manner to showcase growth and investment trends.
Investment Analysis
Environmental Services & Sustainability
Examines the booming startup ecosystem in SEA focused on sustainability, detailing the rapid increase in startups and investments in the sector since 2015.
Startups, sustainability, SEA, growth, investments
false
Investment Analysis
Environmental Services & Sustainability
Multiple Chart
Bain
Add to my slides
Remove from favorites
Six line graphs with search volumes for staycations by country, indexed to January, annotated with spikes post-lockdown. The graphs reflect the increased interest in staycations during the pandemic.
Market Analysis and Trends
Technology & Software
Shows the surge in interest for staycations as lockdown restrictions eased, indicating market opportunities for the hospitality industry. Relevant for businesses adapting to changing consumer preferences in tourism during the pandemic.
Staycations, Search volumes, Lockdown effects, Market opportunities, Hospitality industry
false
Market Analysis and Trends
Technology & Software
Multiple Chart
Bain
Add to my slides
Remove from favorites
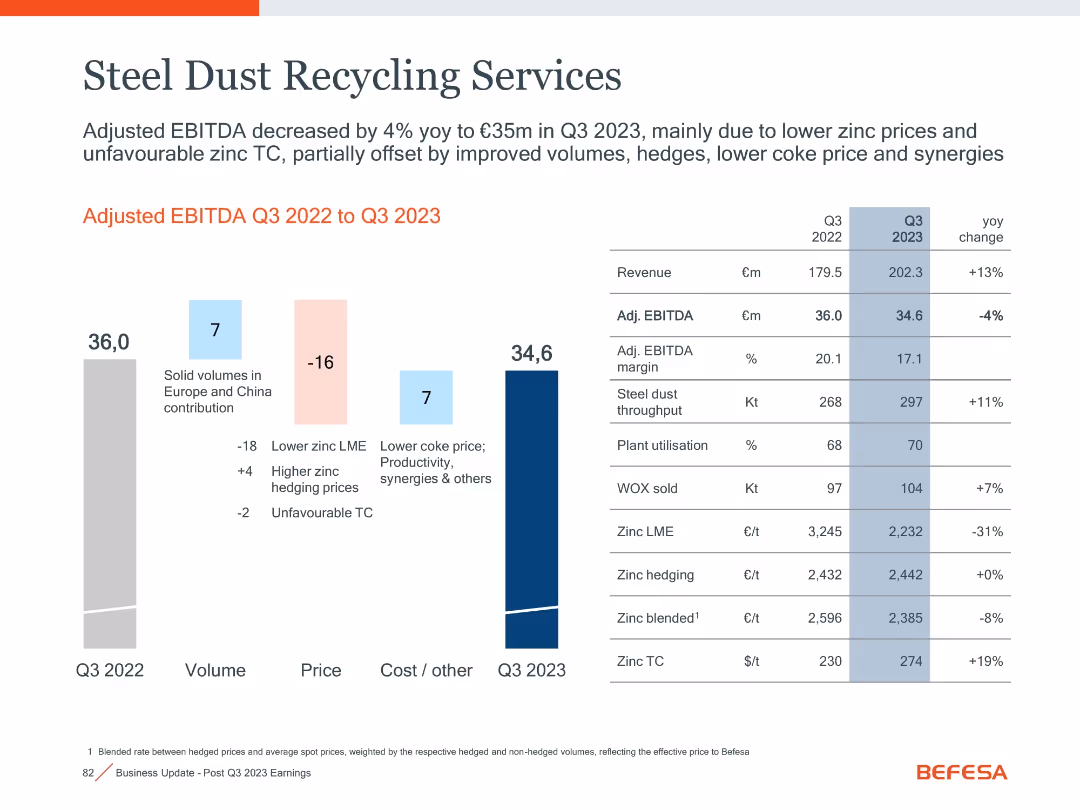
Bar chart with waterfall logic; financial summary table
Operational Efficiency
Industrial & Manufacturing
The slide provides a performance summary of steel dust recycling, with changes in EBITDA attributed to pricing, volume, and cost efficiency for Q3 2023.
Steel Dust, Recycling, EBITDA, Volumes, Zinc Prices, Q3 2023
false
Operational Efficiency
Industrial & Manufacturing
Mixed Chart
Goldman Sachs
Add to my slides
Remove from favorites
The slide presents a column chart showing global steel demand projections from 2021 to 2030, with regional breakdowns and future growth drivers indicated.
Market Analysis and Trends
Industrial & Manufacturing
This slide forecasts global steel demand up to 2030, noting a decline in Chinese demand but growth driven by ASEAN and India, and highlights regional differences in demand.
Steel demand, projections, 2030, ASEAN, India, China, regional growth, market analysis, future, trends
false
Market Analysis and Trends
Industrial & Manufacturing
Single Chart
BCG
Add to my slides
Remove from favorites
The slide includes a map highlighting key steel investment projects in ASEAN countries, a table of projects with capacities and start years, and regional supply increase data.
Investment Analysis
Industrial & Manufacturing
This slide details steel investment projects in ASEAN countries, indicating major projects, capacities, start years, and the regional contribution to steel supply increase by 2030.
Steel investment, ASEAN, projects, capacities, start years, regional supply, 2030, key projects, map
false
Investment Analysis
Industrial & Manufacturing
Single Chart
BCG
Add to my slides
Remove from favorites
The slide features multiple line charts displaying price trends of steel HRC, scrap, iron ore, and met coal from Q1 2020 to October 2022, accompanied by key challenge notes on the side.
Risk Assessment and Management
Industrial & Manufacturing
This slide discusses the volatility in the global steel supply chain in 2022, highlighting supply chain disruptions, demand disruptions, and inflation impacts through various price charts.
Steel supply chain, volatility, price trends, disruptions, demand, inflation, global, 2022, charts, risks
false
Risk Assessment and Management
Industrial & Manufacturing
Single Chart
BCG
Add to my slides
Remove from favorites
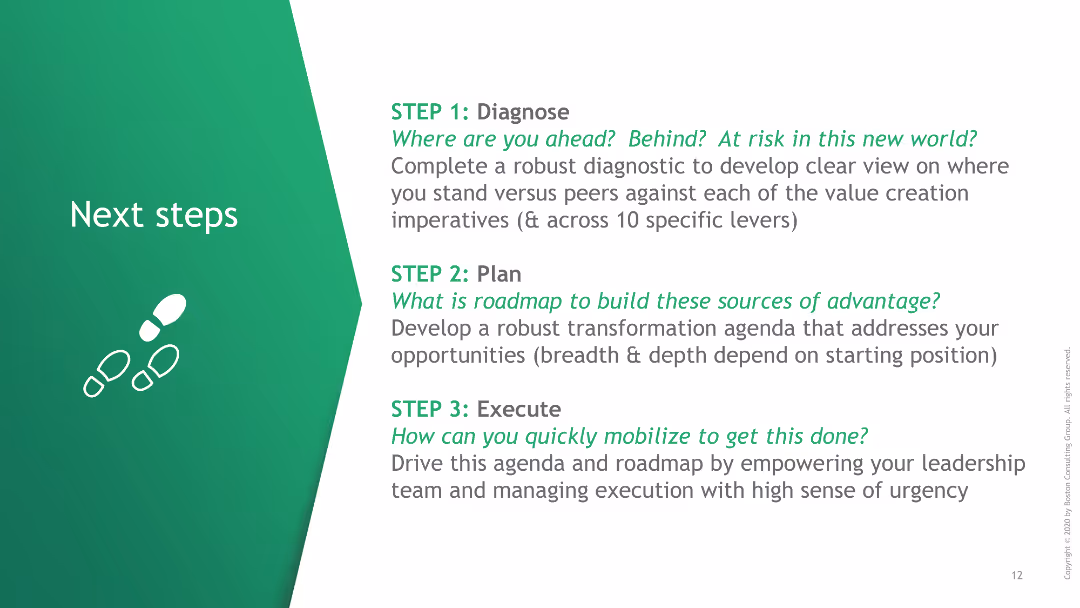
The slide uses a simple text-based format with green highlights, outlining three steps for strategic planning.
Strategic Planning
Professional Services
It provides a step-by-step guide for diagnosing, planning, and executing a transformation agenda in response to current challenges.
Steps, Strategy, Planning, Execution, Transformation
false
Strategic Planning
Professional Services
Vertical Flow
BCG
Add to my slides
Remove from favorites
The slide features two column charts: one showing annual stock market returns by political party control and another showing stock market returns by year in the presidential cycle.
Market Analysis and Trends
Financial Services
This slide presents data indicating that past stock market performance, segmented by political control and presidential cycles, does not predict future results. It underscores the unpredictability of market performance.
Stock Market, Political Control, Presidential Cycle, Performance, Analysis
false
Market Analysis and Trends
Financial Services
Multiple Chart
JP Morgan
Add to my slides
Remove from favorites
Line graph and table detailing distributor stock performance and M&A activity, color-coded by industry segment.
Investment Analysis
Financial Services
Shows distributor stock performance against the S&P 500 and the number of acquisitions by segment since 2000.
Stock Performance, M&A, Distribution, Acquisition, Benchmark, Industry
false
Investment Analysis
Financial Services
Single Chart
EY
Add to my slides
Remove from favorites
The slide features a line chart showing correlations between stocks and sovereign bonds, with the six-month correlation in gray and the one-year correlation in purple, covering the period from 1998 to 2023.
Market Analysis and Trends
Financial Services
This slide analyzes the correlations between stocks and sovereign bonds, providing insights into market trends and investment strategies.
Stock-bond correlation, market analysis, investment strategy, financial analysis, six-month correlation, one-year correlation
false
Market Analysis and Trends
Financial Services
Multiple Chart
JP Morgan
Add to my slides
Remove from favorites
The slide includes two donut charts comparing 2023 and 2022 responses on investment knowledge, with key percentages highlighted.
Market Analysis and Trends
Financial Services
It displays the percentage of Canadians who correctly answered a question about stocks vs. mutual funds, comparing 2022 to 2023.
Stocks, Mutual Funds, Knowledge, Canadians, Percentage, 2023, 2022, Chart, Financial, Trends
false
Market Analysis and Trends
Financial Services
Multiple Chart
IPSOS
Add to my slides
Remove from favorites
The slide shows icons with percentages representing different methods of storing crypto assets, such as exchanges, online wallets, and hardware wallets.
Technology and Digital Transformation
Financial Services
This slide details how participants store their crypto assets, including exchange platforms, online wallets, and offline methods.
Storage methods, crypto, assets, security, digital wallets
false
Technology and Digital Transformation
Financial Services
Pillar
IPSOS
Add to my slides
Remove from favorites
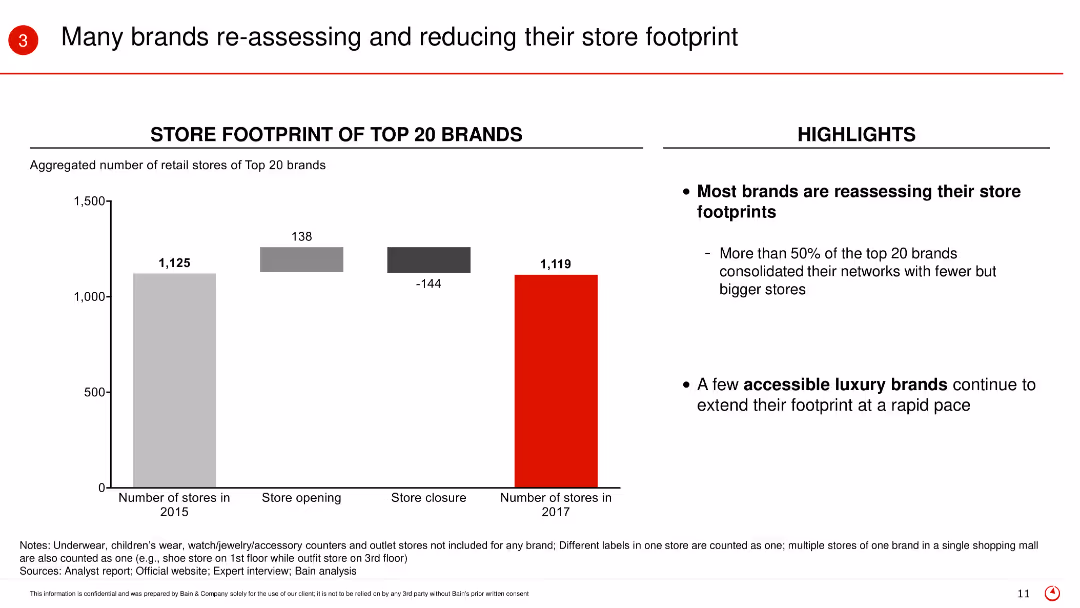
The slide includes a column chart showing the aggregated number of retail stores of top 20 brands from 2015 to 2017, with categories for store openings and closures. Highlights on the right side emphasize key points about brands reassessing their store footprints.
Operational Efficiency
Retail & E-commerce
This slide highlights the trend of brands reducing their store footprint by consolidating their networks, with a focus on efficiency and bigger stores.
Store footprint, retail brands, consolidation, operational efficiency, store closures
false
Operational Efficiency
Retail & E-commerce
Mixed Chart
Bain
Add to my slides
Remove from favorites
Bar chart showing division of tasks likely to be carried out remotely versus onsite. Colors used are yellow and gray, with a clear division between remote and onsite activities.
Strategic Planning
Real Estate & Construction
Analyzes which business tasks will remain onsite versus becoming remote, highlighting strategic and creative tasks staying onsite while routine tasks move remote.
Strategic Activities, Teamwork, Creative Tasks, Onsite, Remote, Business, Management, Delivery, Division
false
Strategic Planning
Real Estate & Construction
Linear Flow
EY
Add to my slides
Remove from favorites
This slide features a combination of text and illustrative icons outlining adaptive strategies for reimagining business in the insurance industry. The design is clean with a focus on key strategic imperatives.
Strategic Planning
Financial Services
The slide provides a framework for insurance companies to adapt and innovate by engaging in digital ecosystems, enhancing customer value, focusing on execution, embedding ESG principles, and upskilling talent. It emphasizes strategic adaptability.
Strategic Adaptation, Insurance, Digital Ecosystems, Customer Value, Execution, ESG, Talent Management, Strategic Imperatives, Innovation, Business Reimagination
false
Strategic Planning
Financial Services
Framework
PwC/Strategy&
Add to my slides
Remove from favorites
Slide contrasts two lists detailing what Strategic Cost Transformation (SCT) is and is not, with highlighted focus points in green.
Strategic Planning
Professional Services
Defines and differentiates Strategic Cost Transformation (SCT) from traditional cost management approaches, focusing on its scope, nature, and business alignment, tailored to specific business challenges.
Strategic Cost Transformation, Business Alignment, Organizational Change, Scope
false
Strategic Planning
Professional Services
Table
Deloitte
Add to my slides
Remove from favorites
Slide includes structured text blocks outlining Essity's vision, mission, objectives, and strategies with distinct color coding for each section.
Strategic Planning
Financial Services
Outlines Essity's strategic goals and methods to enhance stakeholder value, improve customer satisfaction, and promote sustainability, useful in corporate strategy sessions.
Strategic Goals, Stakeholder Value, Customer Satisfaction, Sustainability
false
Strategic Planning
Financial Services
Framework
Barclays
Add to my slides
Remove from favorites
The slide shows a three-column layout with text and arrows. It details different strategic focuses and projected financial impacts.
Strategic Planning
Financial Services
Explains strategic growth areas, including business diversification and efficiency. Designed for strategy presentations or stakeholder meetings.
Strategic Growth, Business Diversification, Efficiency, Financial Impact, Planning, Stakeholders
false
Strategic Planning
Financial Services
Vertical Flow
Goldman Sachs
Add to my slides
Remove from favorites
The slide splits into two sections, one with bullet points outlining strategic imperatives and the other with a graphic metaphor of "timeboxing" the virus. It's simple with minimal color usage, primarily black and white.
Strategic Planning
Healthcare & Pharmaceuticals
This slide discusses strategic imperatives to safeguard lives and livelihoods amid COVID-19, alongside a graphic illustrating the concept of "timeboxing" the pandemic's impact. It's useful for conveying strategic actions and their expected outcomes.
Strategic Imperatives, COVID-19, Timeboxing, Safety
false
Strategic Planning
Healthcare & Pharmaceuticals
Mixed Chart
McKinsey
Add to my slides
Remove from favorites
A structured layout with categorized initiatives for various industries, highlighting specific digital trends and strategies.
Industry Overview
Technology & Software
Summarizes key digital initiatives across industries like healthcare, logistics, and telecommunications, aiming to guide strategic planning and innovation efforts.
Strategic Initiatives, Digital Transformation, Industry Overview, Future Trends, Multi-Industry
false
Industry Overview
Technology & Software
Table
Accenture
Add to my slides
Remove from favorites
A U.S. map pinpointing U.S. Bank and State Farm locations, alongside line graphs showcasing crypto fund flows and the number of new accounts, using red and blue colors.
Strategic Planning
Financial Services
Outlines strategic partnerships with State Farm and NYDIG, detailing the expansion of deposit accounts and the introduction of cryptocurrency custody services, reflecting diversification and digital advancement strategies.
Strategic Partnerships, Crypto, State Farm
false
Strategic Planning
Financial Services
Multiple Chart
Goldman Sachs
Add to my slides
Remove from favorites
The slide shows a central circular diagram with four divisions, each representing a line of business. Around this central feature, various services and market segments are interconnected.
Strategic Planning
Financial Services
This diagram represents JPMorgan Chase's strategic partnerships across different lines of business, emphasizing cross-functional collaboration and services offered.
Strategic Partnerships, JPMorgan Chase, Cross-LOB, Market Segmentation, Business Strategy, Client Services, Financial Planning
false
Strategic Planning
Financial Services
Mixed Chart
JP Morgan
Add to my slides
Remove from favorites
Two U.S. maps comparing branch network coverage in 2017 vs 2021, with additional statistics on coverage expansion.
Strategic Planning
Financial Services
Emphasizes strategic planning in branch distribution to serve more communities effectively rather than maximizing the number of branches.
Strategic Planning, Branch Network, Community Service, Coverage Expansion, Customer Needs, Financial Goals
false
Strategic Planning
Financial Services
Text Only
JP Morgan
Add to my slides
Remove from favorites
The slide features three red-bordered text boxes each with a symbol at the top, labeled "Strengthen our Core," "Transform to Grow," and "Master the New." Each box has bullet points beneath these titles.
Strategic Planning
Industrial & Manufacturing
It summarizes the company's strategic accomplishments and future direction. The "Be Tomorrow-2030" strategic plan is broken down into three focal areas. This slide is likely used in corporate strategy meetings to discuss past performance and future initiatives.
Strategic Planning, Corporate Strategy, Defense, Technology, Innovation
false
Strategic Planning
Industrial & Manufacturing
Pillar
Goldman Sachs
Add to my slides
Remove from favorites
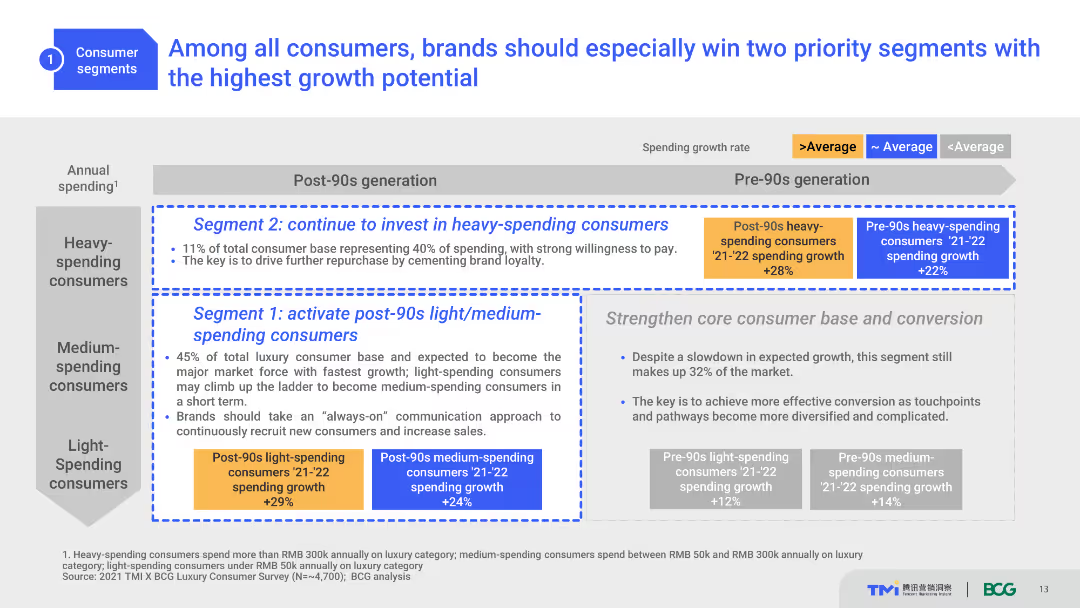
The slide uses a table to segment consumers by spending growth rate, with emphasis on post-90s generation. Various colors indicate growth rates and strategic advice.
Strategic Planning
Consumer Goods
This slide advises brands to focus on heavy-spending and light/medium-spending post-90s consumers due to their high growth potential, offering strategic insights.
Strategic Planning, Growth Potential, Consumer Segments, Brand Strategy, Spending Growth
false
Strategic Planning
Consumer Goods
Table
BCG
Add to my slides
Remove from favorites
The slide summarizes strategic focus areas through four segments with icons and brief descriptions: delivering products, software development capabilities, data power, and customer protection. It employs a clear layout with each segment distinctly color-coded for emphasis.
Strategic Planning
Financial Services
Summarizes the bank's strengths in delivering products, enhancing software development, leveraging data, and protecting customers with a focus on technology.
Strategic Planning, Product Differentiation, Financial Services, Technology, Data Utilization, Cybersecurity, Customer Protection
false
Strategic Planning
Financial Services
Pillar
JP Morgan
Add to my slides
Remove from favorites
This slide features a bar graph and a list of action points. The graph provides a visual comparison of performance outcomes based on planning strategies, using a clear color differentiation for each category. The layout is straightforward, focusing on clarity and ease of interpretation.
Strategic Planning
Professional Services
The slide compares the effectiveness of scenario-based and dynamic planning in achieving performance targets, offering actionable insights on strategic planning processes. It's used to advocate for proactive and data-driven decision-making in business strategies.
Strategic Planning, Scenario Planning, Performance, Data-Driven, Bar Graph
false
Strategic Planning
Professional Services
Mixed Chart
PwC/Strategy&
Add to my slides
Remove from favorites
Slide presents bullet points, check marks for progress, and four circular icons with financial figures for different strategic priorities.
Strategic Planning
Financial Services
Communicates strategic priorities and the progress made in different financial sectors, including international expansion and carbon transition.
Strategic Priorities, Financial Sponsors, Capital, International, Carbon Transition, Progress
false
Strategic Planning
Financial Services
Table
JP Morgan
Add to my slides
Remove from favorites
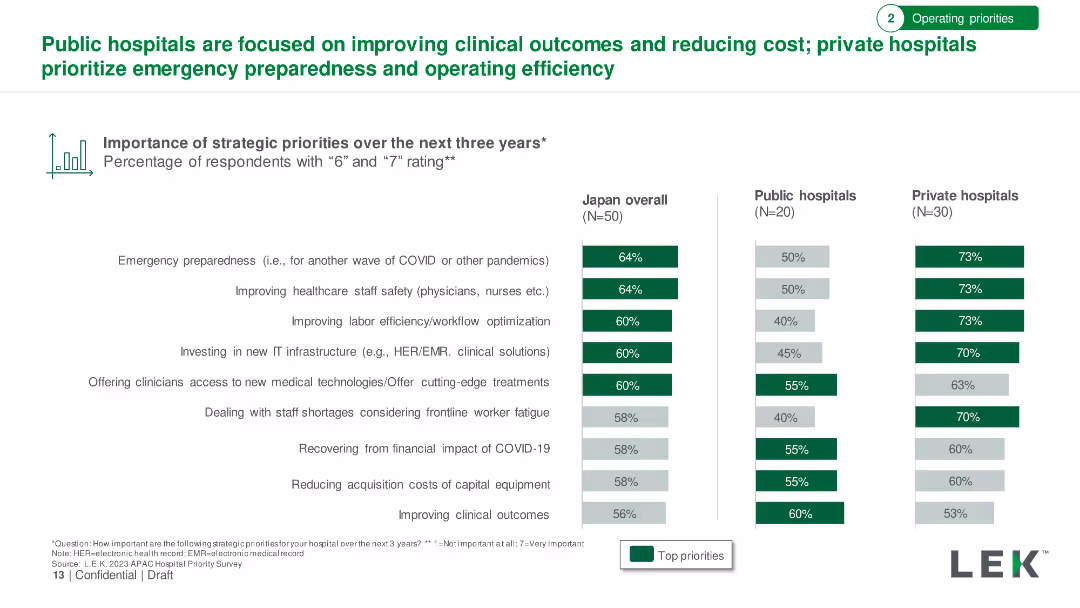
Bar charts showing the importance of strategic priorities over the next three years for public and private hospitals. Detailed with priority percentages.
Strategic Planning
Healthcare & Pharmaceuticals
Overview of strategic priorities for public and private hospitals, highlighting different focuses such as clinical outcomes, cost reduction, and preparedness.
Strategic Priorities, Public Hospitals, Private Hospitals, Clinical Outcomes, Cost Reduction
false
Strategic Planning
Healthcare & Pharmaceuticals
Multiple Chart
LEK
Add to my slides
Remove from favorites
The slide lists four strategic priorities in a simple, blue, and white layout. Each priority is represented in a separate box with a brief description.
Strategic Planning
Financial Services
This slide outlines the strategic priorities aimed at driving resilience and value creation. The priorities include scaling market-leading businesses, strengthening partnerships, enhancing earnings quality, and resource efficiency.
Strategic Priorities, Resilience, Value Creation, Market-leading, Partnerships
false
Strategic Planning
Financial Services
Linear Flow
Credit Suisse
Add to my slides
Remove from favorites
This slide displays two column charts representing the Return on Capital Employed (ROCE) and Gearing percentages over several years, along with future targets.
Operational Efficiency
Financial Services
Designed for strategic planning, it shows past performance and future targets in capital efficiency and financial leverage.
Strategic Targets, ROCE, Gearing, Performance, Efficiency, Finance, Goals, Capital, Leverage
false
Operational Efficiency
Financial Services
Multiple Chart
Goldman Sachs
Add to my slides
Remove from favorites
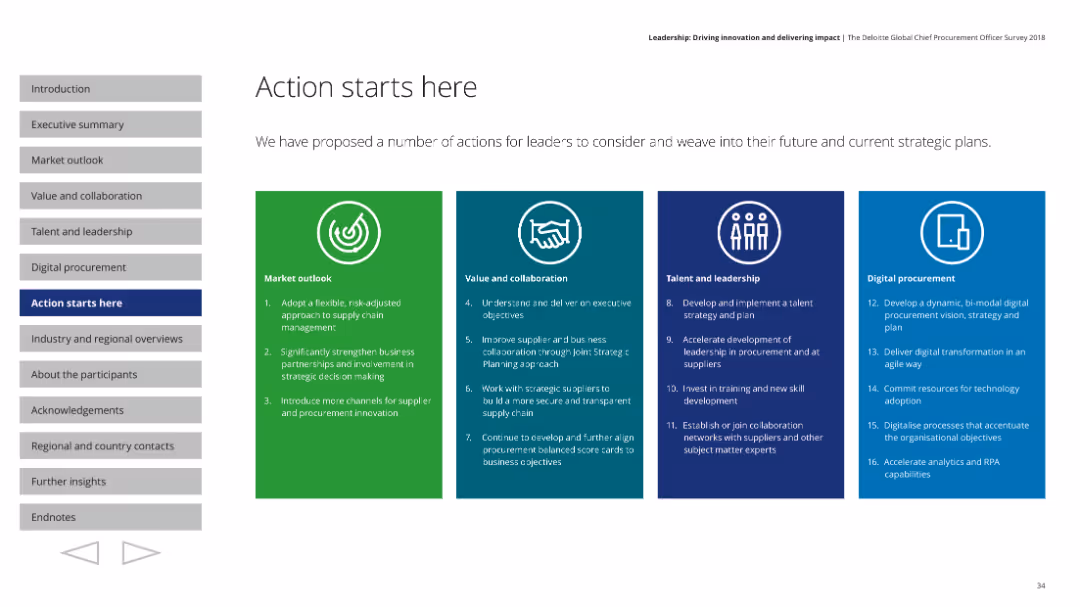
Features a structured layout with four distinct colored sections, each outlining strategic actions across different focus areas like market outlook and leadership.
Strategic Planning
Professional Services
Proposes strategic actions for leaders to integrate into their plans, covering market outlook, collaboration, leadership, and digital procurement.
Strategic actions, market outlook, collaboration, leadership
false
Strategic Planning
Professional Services
Pillar
Deloitte
Add to my slides
Remove from favorites
Three columns juxtapose elements of 'Engage with 16MM Relationships', 'Offerings Across Wealth Levels and Preferences', and 'Industry Leading Capabilities'.
Strategic Planning
Financial Services
This slide outlines strategic capabilities that differentiate the company, categorizing them into engagement, service offerings, and leading industry capabilities, suggesting a unique positioning.
Strategic capabilities, Industry leadership, Engagement, Offerings, Wealth levels
false
Strategic Planning
Financial Services
Table
Goldman Sachs
Add to my slides
Remove from favorites
The layout presents a three-column text arrangement with headers like 'Global Banking & Markets', 'Asset & Wealth Management', and 'Platform Solutions'. The text is white on a dark background for contrast, with bullet points summarizing objectives and accomplishments in each sector.
Strategic Planning
Financial Services
Describes the strategic objectives and achievements in various business units, such as expanding banking footprint and client assets under supervision, relevant for understanding the company's strategic focus areas and growth measures.
Strategic goals, banking, wealth management
false
Strategic Planning
Financial Services
Table
Goldman Sachs
Add to my slides
Remove from favorites
Several lists with bullet points, divided into four sections with different colored headers, describing various business strategies.
Strategic Planning
Financial Services
Describes strategic investments in distribution, products, technology, and cost efficiency to strengthen the franchise.
Strategic investment, distribution, product expansion, technology, cost efficiency
false
Strategic Planning
Financial Services
Table
JP Morgan
Add to my slides
Remove from favorites
Contains several data blocks and bullet points explaining the strategic rationale and outcomes of investments.
Investment Analysis
Financial Services
Highlights JPMorgan's strategic investments and acquisitions, including performance metrics and integration of technology platforms.
Strategic investments, acquisitions, market share, banking, investment platforms, digital transformation
false
Investment Analysis
Financial Services
Table
JP Morgan
Add to my slides
Remove from favorites
The slide features a matrix showing the usage of strategic levers by leaders, with a heatmap indicating the percentage of companies selecting each lever.
Strategic Planning
Professional Services
It presents the strategic levers used by leaders to create value, highlighting the importance of supply and demand power in procurement strategies.
Strategic levers, procurement, supply power, demand power, value creation, leaders, strategic planning
false
Strategic Planning
Professional Services
Mixed Chart
Kearney
Add to my slides
Remove from favorites
The slide features a matrix showing the usage of strategic levers by leaders, with a heatmap indicating the percentage of companies selecting each lever.
Strategic Planning
Professional Services
It presents the strategic levers used by leaders to create value, highlighting the importance of supply and demand power in procurement strategies.
Strategic levers, procurement, supply power, demand power, value creation, leaders, strategic planning
false
Strategic Planning
Professional Services
Table
Kearney
Add to my slides
Remove from favorites
The slide contains a column chart progressing from 'Today' to a '5-year aspiration', divided into segments labeled 'Pick well', 'Do better', and 'Green box'. The colors vary with each segment to emphasize progression and focus on innovation.
Strategic Planning
Professional Services
Focuses on the strategic importance of setting measurable innovation goals in the 'Green Box' to drive resource allocation and long-term planning. This slide is essential for discussions on strategic management and goal setting in corporate environments, providing a clear visualization of planning and execution stages.
Strategic management, goal setting, innovation goals, resource allocation, corporate strategy
false
Strategic Planning
Professional Services
Single Chart
McKinsey
Add to my slides
Remove from favorites
Features a complex matrix assessing strategic capabilities against priorities, using icons and color coding to enhance readability.
Operational Efficiency
Professional Services
Analyzes current organizational capabilities versus strategic importance to prioritize initiatives and prepare for new business realities, aiding leaders in decision-making.
Strategic planning, Capability assessment, Business strategy, Leadership
false
Operational Efficiency
Professional Services
Header Vertical
BCG
Add to my slides
Remove from favorites
The slide uses a metaphorical image of a cooking setup with various ingredients laid out next to a diagram representing the organization's operating model. The image and diagram complement the textual content that outlines the structured phases of strategy development.
Strategic Planning
Professional Services
Illustrates the company's structured approach to strategic planning and innovation, represented through a culinary metaphor. This creative presentation aids in understanding the systematic phases of strategy formulation and execution, emphasizing the organization's extensive experience with numerous companies.
Strategic planning, innovation process, operational model, company experience
false
Strategic Planning
Professional Services
Vertical Flow
McKinsey
Add to my slides
Remove from favorites
Graph and textual layout depicting the timeline of business expansion and its financial projections.
Strategic Planning
Financial Services
The slide presents JPMorgan's investment plans to achieve operational leverage, showing expected growth in customer numbers and cost per customer.
Strategic planning, investment, growth, operating leverage, banking, business expansion
false
Strategic Planning
Financial Services
Multiple Chart
JP Morgan
Add to my slides
Remove from favorites
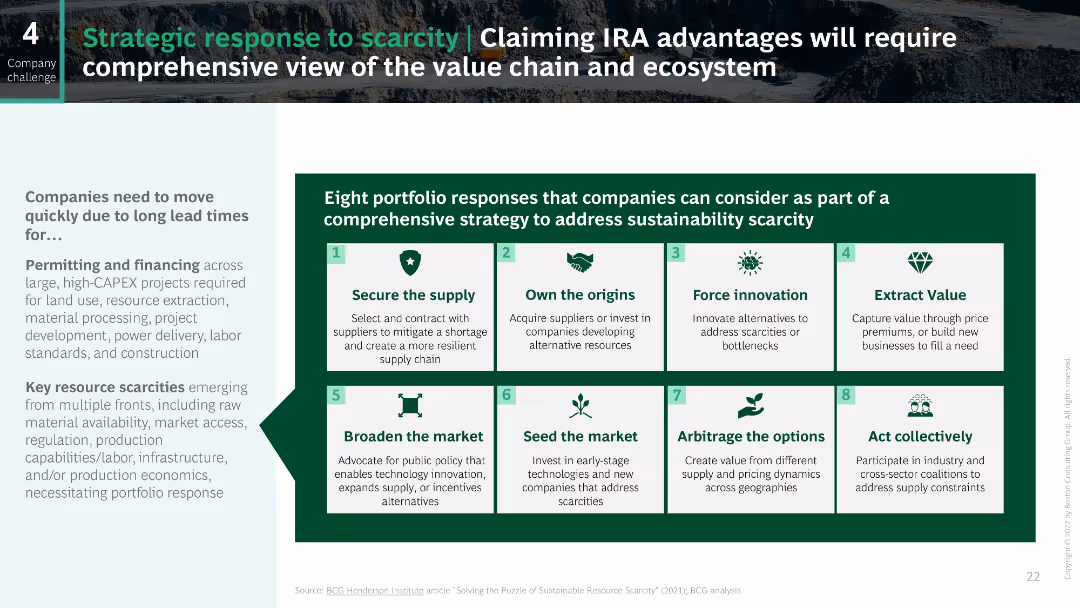
The slide features a large, green-bordered box in the center with eight smaller boxes inside, each representing a different strategic response, surrounded by text explaining the importance of a comprehensive strategy.
Strategic Planning
Industrial & Manufacturing
This slide outlines eight strategic responses that companies can adopt to address sustainability scarcity, emphasizing the need for a comprehensive view of the value chain and ecosystem.
Strategic response, Sustainability, Supply chain, Ecosystem, Scarcity
false
Strategic Planning
Industrial & Manufacturing
Linear Flow
BCG
Add to my slides
Remove from favorites
The slide has four content boxes each with a heading, a ranking, and three bullet points summarizing strategy aspects. Two larger blue boxes highlight the market leadership position, while two smaller gray boxes detail engagement metrics.
Strategic Planning
Financial Services
This slide focuses on the strides made in Consumer Banking, Branch Network, and Business Banking, juxtaposing the current achievements with future strategic goals. It serves to communicate progress and set a determined outlook for extending market leadership.
Strategy progress, Consumer banking, Market leadership, Business strategy, Future outlook, Banking network
false
Strategic Planning
Financial Services
Table
JP Morgan
Add to my slides
Remove from favorites
Contains a central circular diagram illustrating the strategy to scale, engage, and deepen relationships, surrounded by checklists and headers for clarity. Utilizes a loop format to indicate continuity and progression.
Strategic Planning
Financial Services
This slide outlines Chase's strategic approach to growth and success factors. It might be used to discuss business strategy development, with the central loop diagram representing a continuous improvement process in scaling, engaging, and deepening customer relationships.
Strategy, Business Growth, Customer Relationships, Engagement, Scaling, Improvement Process, Financial Services, Chase, Success Factors, Strategic Loop
false
Strategic Planning
Financial Services
Linear Flow
JP Morgan
Add to my slides
Remove from favorites
Similar in layout to slide 11, uses icons and lists to illustrate the strategic initiatives and their benefits in terms of market and client metrics.
Strategic Planning
Financial Services
Reiterates the details of JPMorgan’s focused strategic investments, particularly in client coverage, showcasing the targeted benefits like market share and client satisfaction.
Strategy, Client Coverage, Banking, Market Share, Client Satisfaction, Investments
false
Strategic Planning
Financial Services
Linear Flow
JP Morgan
Add to my slides
Remove from favorites
Text and image layout with multiple sections detailing strategies for Global Wealth Management, Personal & Corporate Banking, Asset Management, and Investment Bank.
Strategic Planning
Financial Services
Outlines UBS's strategic plans to enhance client franchises and capabilities across different business areas, aiming for growth and scale.
Strategy, Client Franchises, UBS, Growth, Capabilities
false
Strategic Planning
Financial Services
Multiple Chart
UBS
Add to my slides
Remove from favorites
This slide displays four key strategy areas, each accompanied by an icon and brief description, and central metrics such as ROTCE target and CET1 ratio. The layout is clear and spacious, with ample white space and large, readable fonts, creating a visually accessible summary of strategic commitments.
Strategic Planning
Financial Services
Reiterating its commitment to customers, Slide 19 summarizes JPMorgan Chase & Co.'s strategic targets and performance metrics, emphasizing a robust, client-focused approach across global markets.
Strategy, Commitment, ROTCE, CET1 Ratio, Client Focus, Global, Performance Metrics
false
Strategic Planning
Financial Services
Boxed
JP Morgan
Add to my slides
Remove from favorites
Slide with a list layout, including bullet points and headers, detailing strategy points in a clear, readable format without additional visual elements.
Strategic Planning
Financial Services
JP Morgan's strategic focus areas such as customer engagement, digital tool scaling, expense management, and risk control are outlined on this slide. Intended for communicating to stakeholders how the company intends to grow and strengthen its market position.
Strategy, Customer Engagement, Digital Tools, Expense Management, Risk Control
false
Strategic Planning
Financial Services
Table
JP Morgan
Add to my slides
Remove from favorites
Balanced layout with four key strategy icons on the left and three upward-pointing arrows on the right. Clean design with company color scheme.
Strategic Planning
Financial Services
Strategic initiatives for customer relations, services, and growth in a financial institution. Objectives for customer engagement and market share are highlighted.
Strategy, Customer Engagement, Product Development, Market Expansion, Value Proposition, Household Growth, Financial Services
false
Strategic Planning
Financial Services
Header Vertical
JP Morgan
Add to my slides
Remove from favorites
This slide features an abstract design with bright lines connecting various aircraft, reflecting a network or system. The image occupies the entire slide, with a red title bar at the top for contrast.
Strategic Planning
Government & Public Sector
The visual suggests strategic connections within the defense network, suitable for presentations focusing on strategic planning within the defense sector or for illustrating integrated defense systems.
Strategy, Defense, Aircraft, System, Network, Integration
false
Strategic Planning
Government & Public Sector
Text Only
PwC/Strategy&
Add to my slides
Remove from favorites
Previous
Next
You don't have any favorites yet.
Please wait loading your favorites slides...
Create a FREE account to continue browsing
Receive Instant Access to 1,000+ slides from companies like McKinsey, Google, and Goldman Sachs
First Name
Last Name
Email
Password
I agree to all
Terms & Privacy Policy
Thank you! Your submission has been received!
Oops! Something went wrong while submitting the form.
Have an account?
Sign in
Upgrade to PRO to Save slides
Advanced Search and Filters
Access to 15,000+ slides
Access to Category Pages
Save/Bookmark Slides
PowerPoint Template Library
Pick a Plan
MONTHLY
$12/month
Billed every month, Cancel anytime.
YEARLY
$9/year
Billed $108 annually, Cancel anytime.
Checkout for $12/month
Checkout for $108/yr
Secured by Stripe | AES-256 bit encryption