My Account
My Slides
Search by Category
Pricing
Templates
View All Templates
Download Template Slides
✦ AI Search
Feedback
Login
Logout
Get Started
Browse all Slides
Browse all Slides
Create a FREE Account
Instant access to 1,000+ real slides from top companies like McKinsey, BCG, Goldman Sachs, Google and many more!
First Name
Last Name
Email
Password
I agree to all
Terms & Privacy Policy
Thank you! Your submission has been received!
Oops! Something went wrong while submitting the form.
Have an account?
Sign in
Saved Slides
Total No. of slides saved
0
↻ Refresh
✖ Clear all
Utilizes texts and checkmarks to list opportunities and actions for lead generation, sales optimization, and fulfillment automation, with a sidebar highlighting progress.
Strategic Planning
Financial Services
Discusses strategic initiatives to enhance productivity and efficiency in home lending, including digital ecosystem enhancements, AI modeling, and automated workflows, accompanied by metrics demonstrating the progress made so far.
Strategy, Digital Ecosystem, AI, Sales, Automation, Productivity, Efficiency
false
Strategic Planning
Financial Services
Table
JP Morgan
Add to my slides
Remove from favorites
Slide has a clean white background with seven numbered blue and green circular icons, each corresponding to a strategic question about the future of work and digital strategies.
Strategic Planning
Professional Services
The slide poses seven strategic questions relating to digital strategy, the nature of work with smart machines, and the workforce. This could be a prompt for strategic planning sessions.
Strategy, Digital, Workforce, Planning, Questions
false
Strategic Planning
Professional Services
Agenda
Deloitte
Add to my slides
Remove from favorites
Features tables and lists describing efficiency measures, capital efficiency, and revenue growth strategies, with a breakdown of financial figures.
Strategic Planning
Financial Services
This slide outlines the bank's strategic initiatives aimed at enhancing operational efficiency, optimizing capital use, and driving revenue growth, along with specific financial targets and achievements.
Strategy, Efficiency, Capital, Revenue, Financial Targets, Operational, Growth
false
Strategic Planning
Financial Services
Mixed Chart
Deutsche Bank
Add to my slides
Remove from favorites
A highlighted map of Europe with key strategy points listed to the left, and a descriptive heading at the top. Neat layout with icons and colored text boxes.
Strategic Planning
Financial Services
Focuses on the growth and strategic positioning within the developed European markets, outlining opportunities and initiatives to strengthen the company's presence.
Strategy, Europe, market growth, development, positioning
false
Strategic Planning
Financial Services
Table
Goldman Sachs
Add to my slides
Remove from favorites
The slide contrasts two sets of data with column charts representing average net revenues and book value per share growth, using a blue color scheme. Text boxes describe the strategy's impact on performance.
Strategic Planning
Financial Services
Compares historical and recent financial performance, showcasing the results of a client-centric strategy. Suitable for investor meetings or strategic planning sessions to illustrate successful business strategies.
Strategy, Financial Growth, Client-Centric, Performance
false
Strategic Planning
Financial Services
Mixed Chart
Goldman Sachs
Add to my slides
Remove from favorites
This slide features a pyramid diagram with text boxes, highlighting strategies and actions. There is also a bullet point text section on the right side.
Strategic Planning
Transportation & Logistics
The slide outlines the National Freight and Supply Chain Strategy, detailing actions and priority actions for improving freight performance and efficiency.
Strategy, Freight, Supply Chain, Logistics, Data
false
Strategic Planning
Transportation & Logistics
Diagram
LEK
Add to my slides
Remove from favorites
Bullet points and strategic keywords with directional icons.
Strategic Planning
Financial Services
Summarizes strategic initiatives for the global markets division leading into 2026.
Strategy, Global Markets, Initiatives, 2026, Roadmap
false
Strategic Planning
Financial Services
Linear Flow
Barclays
Add to my slides
Remove from favorites
Three bold blocks emphasizing strategic growth areas, with a brief descriptor under each. Very minimal text and high contrast.
Strategic Planning
Financial Services
Explains three strategic priorities for growth, likely for presenting to investors or company executives.
Strategy, Growth, Wealth, Digital, Consumer Bank
false
Strategic Planning
Financial Services
Boxed
Goldman Sachs
Add to my slides
Remove from favorites
Contains graphs and bullet points with strategic goals.
Strategic Planning
Financial Services
Outlines strategic objectives for simpler, better, and more balanced approaches in investment banking.
Strategy, Investment Banking, Improvement, Goals, Simplification, Balance, Growth
false
Strategic Planning
Financial Services
Linear Flow
Barclays
Add to my slides
Remove from favorites
A line graph showing the frequency of strategy topics in earnings calls over time. Text discusses the evolution of strategic focus among CEOs and senior leadership teams.
Strategic Planning
Technology & Software
This slide highlights the renewed focus on strategy among CEOs, with a line graph illustrating the increasing mention of strategy topics in earnings calls.
Strategy, Leadership, Earnings Calls, Evolution, Strategic Focus
false
Strategic Planning
Technology & Software
Mixed Chart
Accenture
Add to my slides
Remove from favorites
Contains a text-heavy slide with multiple sections and key strategic objectives outlined in boxes with connecting lines.
Strategic Planning
Financial Services
A strategic slide outlining priorities and focus areas for 2024. It includes client experience, durable revenue streams, and investment in culture, potentially used in strategic or business development meetings.
Strategy, Objectives, Execution, Priorities
false
Strategic Planning
Financial Services
Header Vertical
Goldman Sachs
Add to my slides
Remove from favorites
Comparative bar graphs, key performance indicators
Financial Performance
Financial Services
Santander's 5-year performance review from 2014 to 2019
Strategy, Performance, Profitability, Investment, Banking
false
Financial Performance
Financial Services
Table
Morgan Stanley
Add to my slides
Remove from favorites
The slide presents four numbered strategic imperatives with icons, each on differently colored banners (blue, light blue, red, and green). The layout is clean and uses large, bold fonts for emphasis.
Strategic Planning
Financial Services
This slide outlines strategic imperatives focused on profitability, brand value, narrative about student lending, and capital allocation for shareholder value. Used for presenting core business strategies.
Strategy, Profitability, Brand Value, Capital Allocation, Shareholder Value
false
Strategic Planning
Financial Services
Pillar
Morgan Stanley
Add to my slides
Remove from favorites
The slide displays a circular diagram in two shades, dividing key business areas, and text blocks on the right, all on a dark background.
Strategic Planning
Financial Services
It emphasizes strategic business priorities such as maximizing wallet share and scaling platform solutions for profitability.
Strategy, Profitability, Growth, Management, Wallet Share, Financing, Platform
false
Strategic Planning
Financial Services
Framework
Goldman Sachs
Add to my slides
Remove from favorites
This slide is divided into two main columns. The left side has two purple boxes with bullet points, each labeled as 'Infrastructure' and 'Resiliency'. The right side has two teal boxes, labeled 'Client Experiences' and 'Teammate Experiences'. There are four icon bullet points at the bottom.
Strategic Planning
Financial Services
The slide presents a technology strategy with a focus on modernizing infrastructure and enhancing client and teammate experiences. The content is strategically laid out to compare foundational improvements with benefits for users and employees.
Strategy, Technology, Infrastructure, Client Experience, Teammate Experience, Resiliency, Modernization
false
Strategic Planning
Financial Services
Table
Goldman Sachs
Add to my slides
Remove from favorites
This slide uses a colorful, icon-driven design to represent various strategic areas such as profitability, portfolio transformation, and corporate responsibility. Each area is highlighted with distinct icons and color blocks, making the information approachable and easy to digest.
Strategic Planning
Agriculture & Food Production
Presents Tyson's multi-faceted strategic approach in a visually engaging manner. It outlines core areas of focus including profitability, product portfolio, and corporate responsibility, aiming to communicate the company's long-term objectives and commitments to stakeholders in a clear and memorable way.
Strategy, Tyson, Profitability, Sustainability, Corporate Responsibility
false
Strategic Planning
Agriculture & Food Production
Pillar
Barclays
Add to my slides
Remove from favorites
This slide has a simple layout with a clear division between text sections and a central infographic. The infographic is a circular diagram with four segments, each containing an icon and label, indicating a strategic approach.
Organizational Structure and Change
Professional Services
The slide describes an organization's strategy and foundational elements for creating value. It could be used to explain a company's core objectives and strategic guideposts, such as purpose, mission, and impact on various stakeholders.
Strategy, Value Creation, Impact, Growth, Sustainability, Inclusivity
false
Organizational Structure and Change
Professional Services
Diagram
McKinsey
Add to my slides
Remove from favorites
Three pairs of bullet points, each with an icon, describing different aspects of the strategy supported by integrated global platforms, with text headers above.
Strategic Planning
Financial Services
This slide explains the wholesale payments strategy, supported by pillars like product variety, client connectivity, and analytics, useful for strategic planning discussions.
Strategy, Wholesale Payments, Global, Analytics, Connectivity, Innovation
false
Strategic Planning
Financial Services
Pillar
JP Morgan
Add to my slides
Remove from favorites
The slide includes a strategy diagram similar to slide 8017, with actions and priority-actions for improving freight location and performance data.
Strategic Planning
Transportation & Logistics
It emphasizes strategic actions for enhancing freight location and performance, focusing on data improvement and regulatory approaches.
Strategy, freight, supply chain, data, improvement, regulatory, planning, actions, priorities
false
Strategic Planning
Transportation & Logistics
Diagram
LEK
Add to my slides
Remove from favorites
The slide includes a strategy diagram with four main actions, priority-actions listed below, and text summarizing the need for national strategy and its components.
Strategic Planning
Transportation & Logistics
It details the strategic actions and priorities for improving the national freight and supply chain, highlighting efficiency, planning, and investment needs.
Strategy, freight, supply chain, national, planning, investment, efficiency, priorities, components
false
Strategic Planning
Transportation & Logistics
Diagram
LEK
Add to my slides
Remove from favorites
Two columns of bulleted lists, contrasting elements of a strategy on the left and its impacts on the right.
Strategic Planning
Professional Services
Explains a strategic growth plan and its operational, technical, and market impacts.
Strategy, growth, performance, innovation, talent retention, market expansion
false
Strategic Planning
Professional Services
Header Horizontal
Booz Allen Hamilton
Add to my slides
Remove from favorites
Four icons with corresponding text blocks outlining strategic concepts, set against a background with an organizational image.
Strategic Planning
Financial Services
Outlines a strategic framework for an operating model in finance, touching on client relations, global principles, and sustainability.
Strategy, operating model, client focus, global, diversified, scale, financial services
false
Strategic Planning
Financial Services
Pillar
JP Morgan
Add to my slides
Remove from favorites
Clean layout with bullet points and icons representing various strategic opportunities. Each opportunity is numbered and comes with a brief description.
Market Analysis and Trends
Financial Services
Focuses on identifying latent opportunities within the Limpa Nome framework, such as improving money flow, marketing efficiency, and market expansion.
Strategy, opportunities, efficiency
false
Market Analysis and Trends
Financial Services
Header Vertical
Barclays
Add to my slides
Remove from favorites
Column charts depicting the percentage of users joining due to COVID-19 for SVOD and music, with text on the right discussing user behavior and retention.
Market Analysis and Trends
Technology & Software
Assesses the impact of COVID-19 on streaming entertainment services, detailing new user adoption rates and long-term customer retention. Key for streaming services to understand market penetration and forecast future trends.
Streaming services, COVID-19 impact, User adoption, Market trends, Customer retention
false
Market Analysis and Trends
Technology & Software
Mixed Chart
Bain
Add to my slides
Remove from favorites
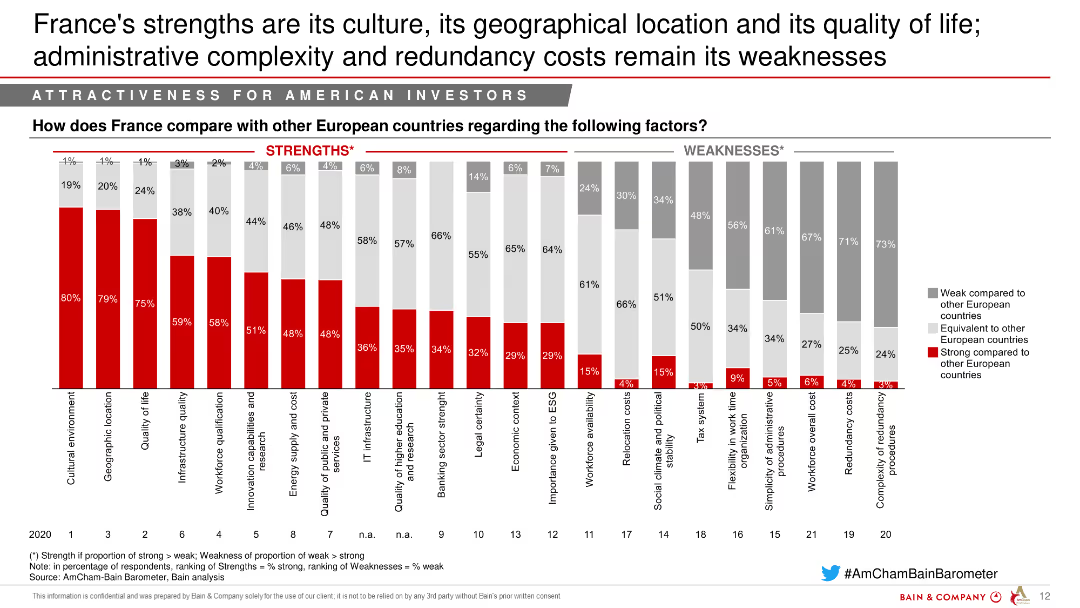
The slide includes a column chart comparing France's strengths and weaknesses against other European countries, highlighting areas like cultural environment and administrative complexity.
Market Analysis and Trends
Hospitality & Tourism
This slide assesses France's strengths and weaknesses as an investment destination, emphasizing its cultural and geographical advantages.
Strengths, Weaknesses, Cultural environment, Geographical location, Administrative complexity
false
Market Analysis and Trends
Hospitality & Tourism
Single Chart
Bain
Add to my slides
Remove from favorites
The slide contains a text section and a bar chart. The chart shows the percentage of respondents citing different factors contributing to stress, with shades of green differentiating millennials and Gen Z. The design is clean, utilizing white space effectively.
Risk Assessment and Management
Technology & Software
The slide presents the main stress factors for millennials and Gen Z, such as family welfare, financial future, and job prospects. It provides a detailed bar chart on stress drivers and discusses the pandemic's impact on financial concerns and job security, offering insights into workforce stress management and planning.
Stress Factors, Millennials, Gen Z, Pandemic Impact, Financial Concerns, Job Security, Bar Chart, Workforce Management
false
Risk Assessment and Management
Technology & Software
Mixed Chart
Deloitte
Add to my slides
Remove from favorites
Contains text with a comparative bar chart showing stress levels among Gen Z and millennials over three years, along with top stress factors for both groups.
Market Analysis and Trends
Healthcare & Pharmaceuticals
The slide addresses the rising stress levels among Gen Z, especially women, compared to millennials. It includes a comparative bar chart of stress levels from 2020 to 2022 and identifies key factors contributing to stress, such as financial concerns and work-life balance.
Stress levels, Gen Z, millennials, comparison, stress factors
false
Market Analysis and Trends
Healthcare & Pharmaceuticals
Multiple Chart
Deloitte
Add to my slides
Remove from favorites
A comparative bar chart showing stress levels among Millennials and Gen Z across various countries, with percentages and color-coded bars.
Market Analysis and Trends
Professional Services
The slide compares stress levels before and after the pandemic among Millennials and Gen Z across multiple countries, highlighting the impact of global economic changes.
Stress levels, Millennials, Gen Z, comparison, pandemic, global survey, mental health, economic impact
false
Market Analysis and Trends
Professional Services
Multiple Chart
Deloitte
Add to my slides
Remove from favorites
The slide is divided into two segments with a central title. On the left, bullet points outline key assumptions. On the right, a line graph depicts the unemployment rate with two scenarios. There's a table below the graph summarizing potential losses.
Risk Assessment and Management
Financial Services
This slide performs a stress scenario analysis for the credit card division, with assumptions based on unemployment rates and potential credit losses. It provides projections and comparative scenarios to assist in strategic planning and risk preparedness.
Stress test, Credit card, Unemployment rate, Loss projections, Risk analysis, Scenario planning
false
Risk Assessment and Management
Financial Services
Single Chart
JP Morgan
Add to my slides
Remove from favorites
The slide is split into two main sections. The left side has a text block and an illustration of a stressed individual, while the right side features a column chart depicting stress levels over three time points with gender differentiation. The chart uses green tones for distinction.
Market Analysis and Trends
Technology & Software
The slide addresses the high levels of stress experienced by millennials and Gen Z during the pandemic, with a focus on gender differences. A bar chart compares stress levels across 2020, 2020 Pulse, and 2021, highlighting that women reported higher stress. The content suggests persistent high stress levels and the implications for mental health and workforce management strategies.
Stress, Pandemic, Millennials, Gen Z, Mental Health, Gender, Bar Chart, Workforce Management, Health Trends
false
Market Analysis and Trends
Technology & Software
Mixed Chart
Deloitte
Add to my slides
Remove from favorites
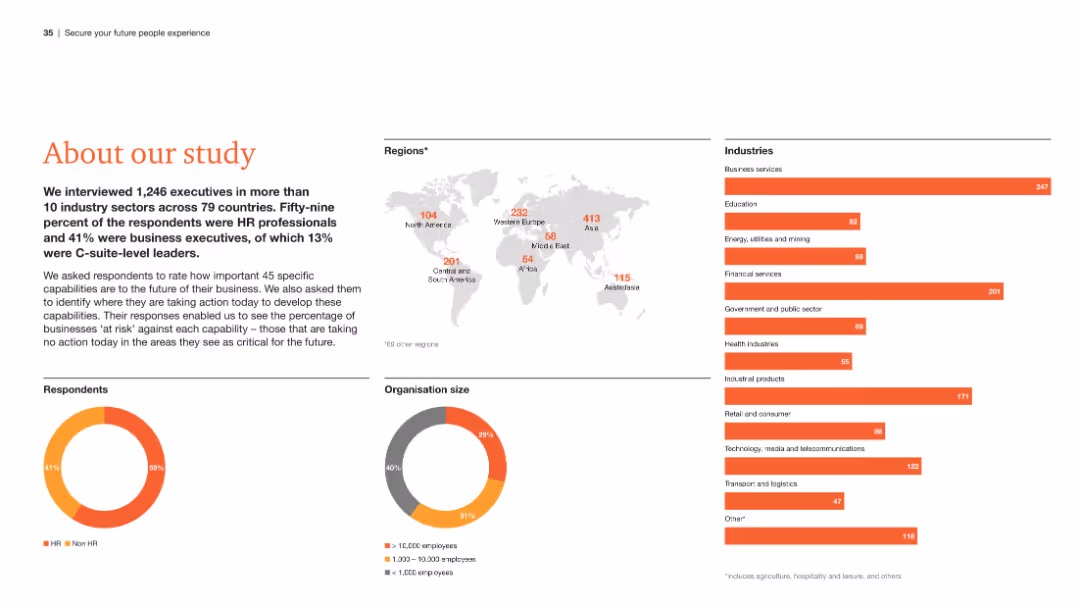
The slide presents an overview of the study, including a world map showing respondent distribution, pie charts of respondent roles and organization sizes, and a list of industries surveyed.
Strategic Planning
Professional Services
This slide provides a summary of the study's scope, detailing the demographics of respondents, the regions and industries covered, and the roles of the participants.
Study overview, respondent demographics, regions, industries, roles
false
Strategic Planning
Professional Services
Multiple Chart
PwC/Strategy&
Add to my slides
Remove from favorites
Includes three line charts showing Sub-Saharan Africa y/y real GDP, y/y inflation, and repurchase rate path from 2005-2026F, with explanatory text.
Market Analysis and Trends
Financial Services
Provides an overview of Sub-Saharan Africa's economic outlook, covering GDP growth, inflation, and interest rate trends.
Sub-Saharan Africa, GDP, Inflation, Interest Rates, Economic Activity
false
Market Analysis and Trends
Financial Services
Multiple Chart
EY
Add to my slides
Remove from favorites
Displays a bar chart analyzing consumer concerns regarding vehicle subscription services, focusing on availability and cost issues.
Risk Assessment and Management
Transportation & Logistics
Discusses main consumer concerns about vehicle subscription services, including availability, cost, and the psychological impact of not owning a vehicle.
Subscription services, consumer concerns, availability, cost, ownership
false
Risk Assessment and Management
Transportation & Logistics
Single Chart
Deloitte
Add to my slides
Remove from favorites
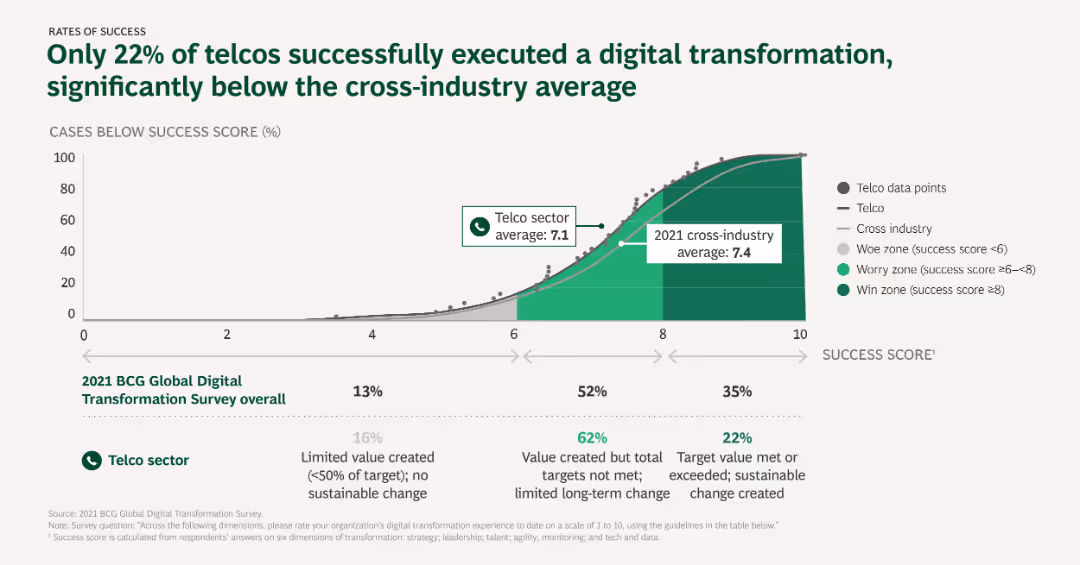
The slide presents a line graph comparing success scores of digital transformation across the telco sector and cross-industry, with annotations for worry, win, and average zones.
Performance Metrics and KPIs
Telecommunications
This slide illustrates the success rates of digital transformation initiatives in the telco sector compared to the cross-industry average, highlighting the low success rate among telcos.
Success rates, Digital transformation, Telcos, Cross-industry, Performance metrics
false
Performance Metrics and KPIs
Telecommunications
Mixed Chart
BCG
Add to my slides
Remove from favorites
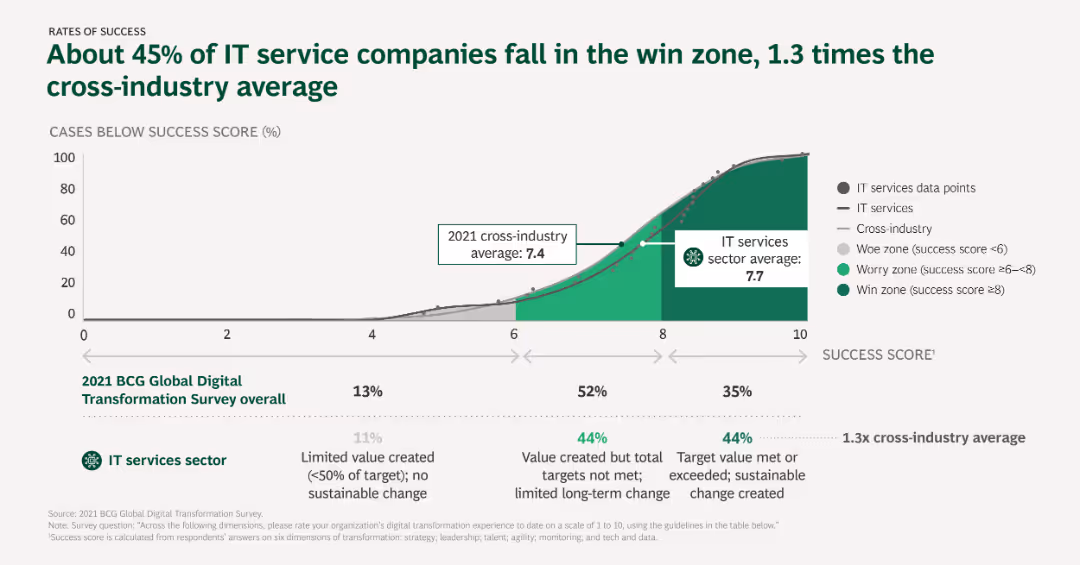
Column chart displaying success rates of IT service companies compared to cross-industry averages, with different zones indicating levels of success.
Performance Metrics and KPIs
Telecommunications
The slide examines the success rates of IT service companies in digital transformation, comparing them to cross-industry averages and categorizing success into different zones.
Success rates, IT services, Cross-industry comparison, Performance metrics, Digital transformation
false
Performance Metrics and KPIs
Telecommunications
Mixed Chart
BCG
Add to my slides
Remove from favorites
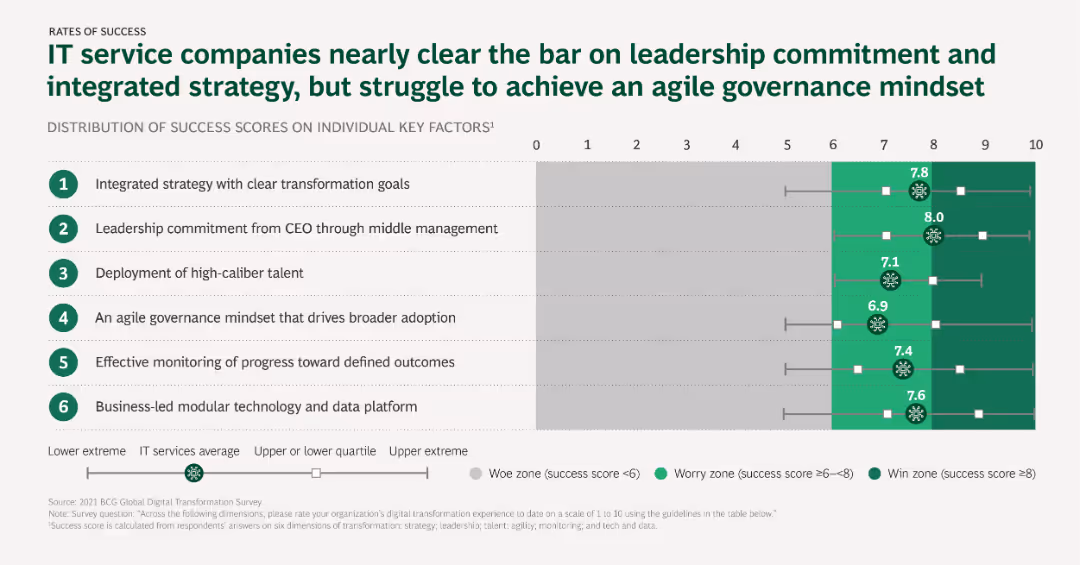
Scatter plot showing distribution of success scores on key factors for IT service companies, with different success zones and averages indicated.
Performance Metrics and KPIs
Telecommunications
This slide analyzes the success scores of IT service companies on individual key factors, highlighting areas like leadership commitment and agile governance mindset.
Success scores, Key factors, Leadership, Governance, IT services
false
Performance Metrics and KPIs
Telecommunications
Mixed Chart
BCG
Add to my slides
Remove from favorites
A list format slide with a bold header, followed by four key points each backed by a description.
Corporate Finance and Valuation
Financial Services
Outlines the key success factors of an asset management company, ideal for investor relations or company meetings.
Success, Asset Management, Investment, Global Scale, Performance
false
Corporate Finance and Valuation
Financial Services
Table
Goldman Sachs
Add to my slides
Remove from favorites
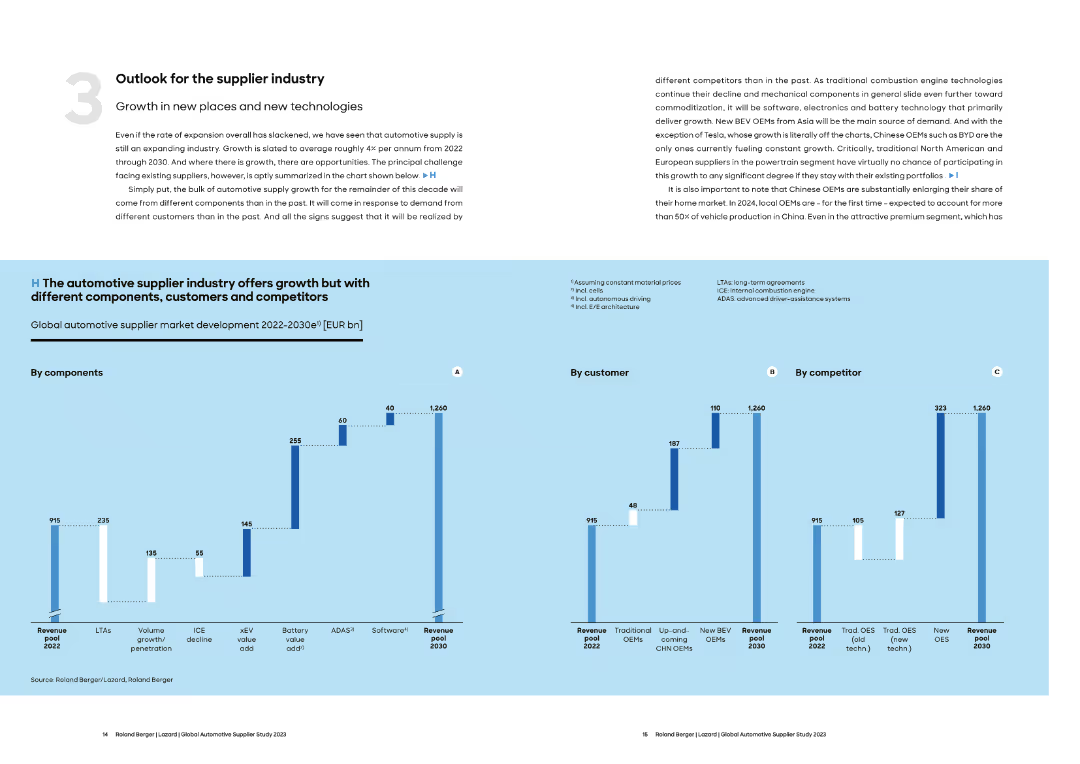
Features column charts depicting market development by components, customer segments, and competitors from 2022 to 2030. Text discusses the outlook for the automotive supplier industry with a focus on growth in new technologies.
Strategic Planning
Transportation & Logistics
Provides a strategic overview of the growth opportunities in the automotive supplier industry. Emphasizes the importance of new technologies, components, and customer segments in driving future market growth.
Supplier Industry, Automotive, Growth, Technology, Strategy
false
Strategic Planning
Transportation & Logistics
Multiple Chart
Roland Berger
Add to my slides
Remove from favorites
Features diagrams and bar graphs displaying the number of Tier 1 suppliers across different industries and major companies.
Operational Efficiency
Industrial & Manufacturing
Details the extent of reliance on Tier 1 suppliers in large companies, highlighting the vast networks involved and the industries most dependent on these suppliers for operations.
Suppliers, Industries, Supply Chain, Tier 1, Companies
false
Operational Efficiency
Industrial & Manufacturing
Multiple Chart
McKinsey
Add to my slides
Remove from favorites
The slide outlines the machinery and equipment value chain with detailed icons and text descriptions for each stage: raw material processing, manufacturing, and logistics. It includes several company logos representing various stakeholders.
Operational Efficiency
Industrial & Manufacturing
Explains the process and stages in the machinery and equipment value chain, emphasizing the efficiency and longevity of products. It mentions specific companies and their roles in the circular economy.
Supply Chain, Efficiency, Longevity, Machinery, Equipment
false
Operational Efficiency
Industrial & Manufacturing
Linear Flow
Accenture
Add to my slides
Remove from favorites
The slide contains two line charts. The left chart shows global supply chain pressure and freight costs (standard deviation from historical average) from 2011 to 2023. The right chart compares freight costs by route (Shanghai-Los Angeles, Shanghai-Rotterdam) from 2011 to 2023.
Operational Efficiency
Transportation & Logistics
This slide examines global supply chain pressures and freight costs, providing valuable insights into logistics challenges and cost trends in major shipping routes.
Supply Chain, Freight, Costs, Global, Logistics
false
Operational Efficiency
Transportation & Logistics
Multiple Chart
JP Morgan
Add to my slides
Remove from favorites
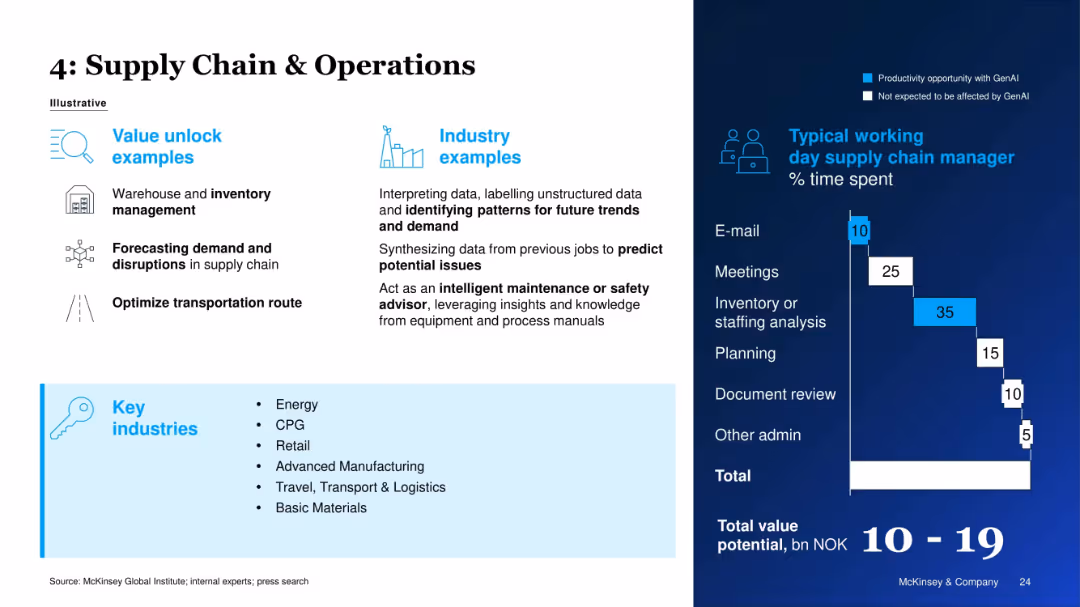
Similar structure to previous slides, showing use cases, industry examples, and a time chart.
Operational Efficiency
Energy & Utilities
This slide discusses how GenAI improves supply chain operations by enhancing inventory management, forecasting, and transportation optimization. The time allocation for a supply chain manager is used to identify high-impact GenAI opportunities.
Supply Chain, Inventory, GenAI, Demand Forecasting, Operational Efficiency, Energy, Manufacturing, Time Utilization
false
Operational Efficiency
Energy & Utilities
Mixed Chart
McKinsey
Add to my slides
Remove from favorites
This slide shows a line chart depicting the US Markit manufacturing PMI supplier delivery times from 2007 to 2021. The chart displays a trend where higher index values signify faster deliveries. There are fluctuations, with a notable increase in delivery times, indicated by a downward trend towards the end of the timeline.
Operational Efficiency
Technology & Software
The slide presents trends in supplier delivery times as a measure of supply side constraints, especially relevant for manufacturing and logistics industries. It's useful for analyzing supply chain efficiency and the effects of external factors like economic policies or global events on delivery performance.
Supply Chain, Manufacturing PMI, Delivery Times, US, Market Trends, Supplier Constraints, Logistics
false
Operational Efficiency
Technology & Software
Single Chart
JP Morgan
Add to my slides
Remove from favorites
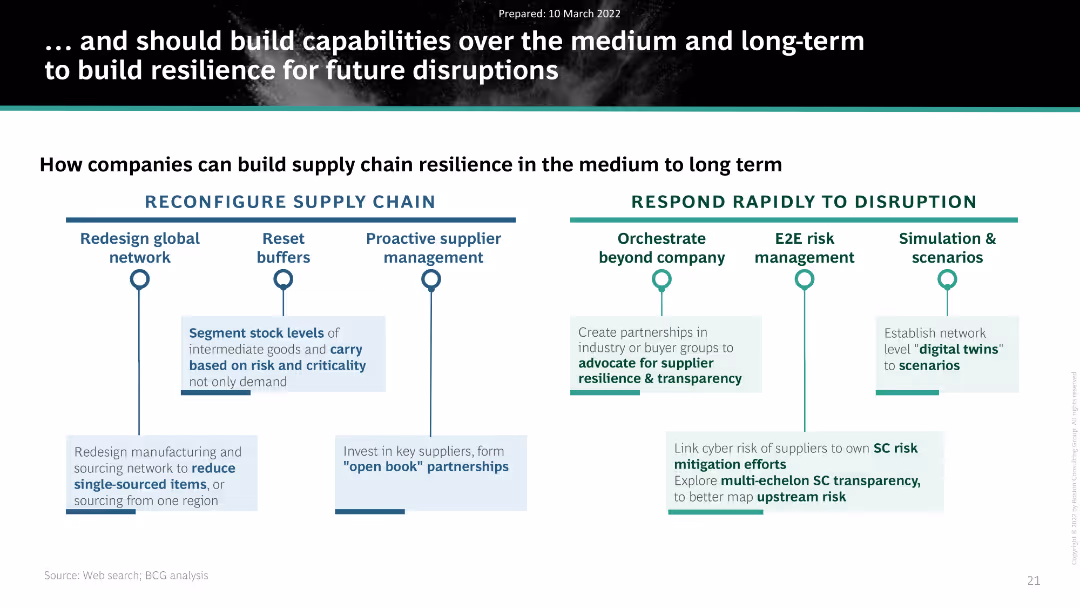
Similar to the previous slide, it uses a two-column format to show strategies for building long-term supply chain resilience.
Strategic Planning
Consumer Goods
It discusses how companies can build resilience in their supply chains over the medium and long term, focusing on various strategic actions.
Supply Chain, Resilience, Strategic Planning, Long-Term, Companies
false
Strategic Planning
Consumer Goods
Header Horizontal
BCG
Add to my slides
Remove from favorites
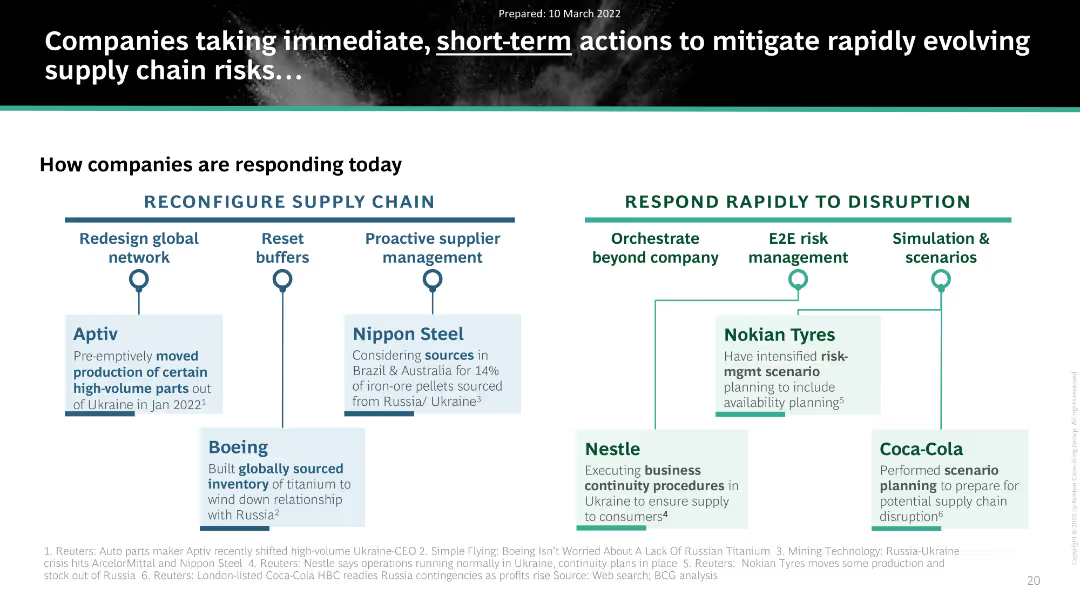
The slide lists actions by various companies in response to supply chain risks, using a two-column format with icons.
Strategic Planning
Consumer Goods
The slide details how companies are mitigating supply chain risks by reconfiguring their supply chains and responding rapidly to disruptions.
Supply Chain, Risk Mitigation, Strategic Planning, Companies
false
Strategic Planning
Consumer Goods
Header Horizontal
BCG
Add to my slides
Remove from favorites
Half of the slide shows an image of hands exchanging a package, symbolizing supply chain activity. The other half lists six key steps with associated icons, designed to enhance supply chain security and efficiency.
Risk Assessment and Management
Transportation & Logistics
Offers recommendations on improving supply chain management, focusing on diversity, visibility, logistics optimization, ecosystem development, data monitoring, and ESG agenda. The slide is likely used in discussions about strengthening supply chain resilience in the face of increasing complexity and disruption.
Supply Chain, Security, Efficiency, Resilience, ESG
false
Risk Assessment and Management
Transportation & Logistics
Boxed
Bain
Add to my slides
Remove from favorites
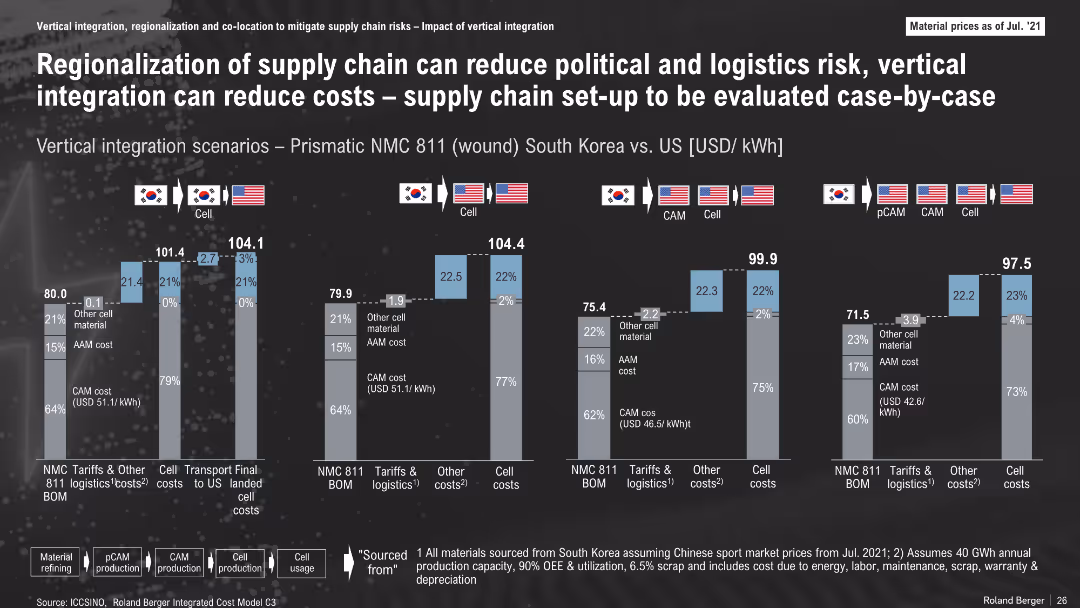
Comparative bar graphs of cost scenarios for various supply chains (South Korea vs. US); icons and flags used to denote material flow; breakdown by cost components
Operational Efficiency
Industrial & Manufacturing
The slide compares costs of vertical integration and regionalization of the battery supply chain across different configurations. It shows cost advantages of localized U.S. supply chains and how material origin affects final cell costs.
Supply Chain, Vertical Integration, Logistics, Battery Production, Cost Analysis, South Korea, U.S.
false
Operational Efficiency
Industrial & Manufacturing
Multiple Chart
Roland Berger
Add to my slides
Remove from favorites
This slide features a diagram comparing cost differences in the wheat supply chains of Australia and Canada, with annotations highlighting key findings.
Operational Efficiency
Transportation & Logistics
The slide compares the cost structures of the wheat supply chains in Australia and Canada, emphasizing the higher domestic supply chain costs in Australia and identifying areas for potential improvement.
Supply chain costs, Australia, Canada, transportation, logistics, wheat supply chain, cost comparison, operational efficiency
false
Operational Efficiency
Transportation & Logistics
Single Chart
LEK
Add to my slides
Remove from favorites
The slide presents a diagram comparing the wheat supply chain costs between Australia and Ukraine, with detailed annotations on cost components and findings.
Operational Efficiency
Transportation & Logistics
The slide evaluates the cost differences in the wheat supply chains of Australia and Ukraine, noting that Australia's costs are higher despite Ukraine's longer transport distances and older infrastructure.
Supply chain costs, Australia, Ukraine, transportation, logistics, wheat supply chain, cost comparison, operational efficiency
false
Operational Efficiency
Transportation & Logistics
Single Chart
LEK
Add to my slides
Remove from favorites
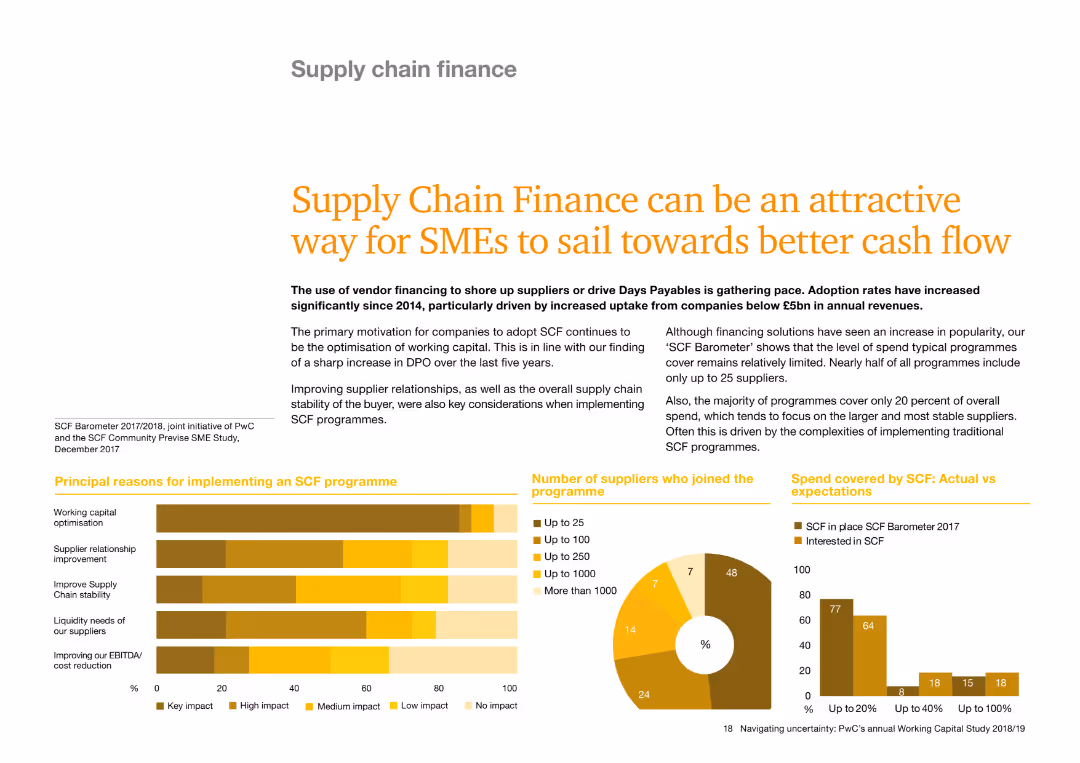
The slide includes a main title, several paragraphs of text, and a bar chart showing the principal reasons for implementing an SCF program. A pie chart illustrates the number of suppliers involved in the program. A three-color scheme of yellow, orange, and brown is used consistently throughout the slide.
Operational Efficiency
Financial Services
This slide discusses the benefits of supply chain finance (SCF) for SMEs, highlighting improved cash flow and supplier relationships. It also presents data on the number of suppliers participating in SCF programs and the impact on working capital. The bar and pie charts provide a clear visual representation of the data.
Supply chain finance, SMEs, cash flow, supplier relationships, SCF program, bar chart, pie chart
false
Operational Efficiency
Financial Services
Multiple Chart
PwC/Strategy&
Add to my slides
Remove from favorites
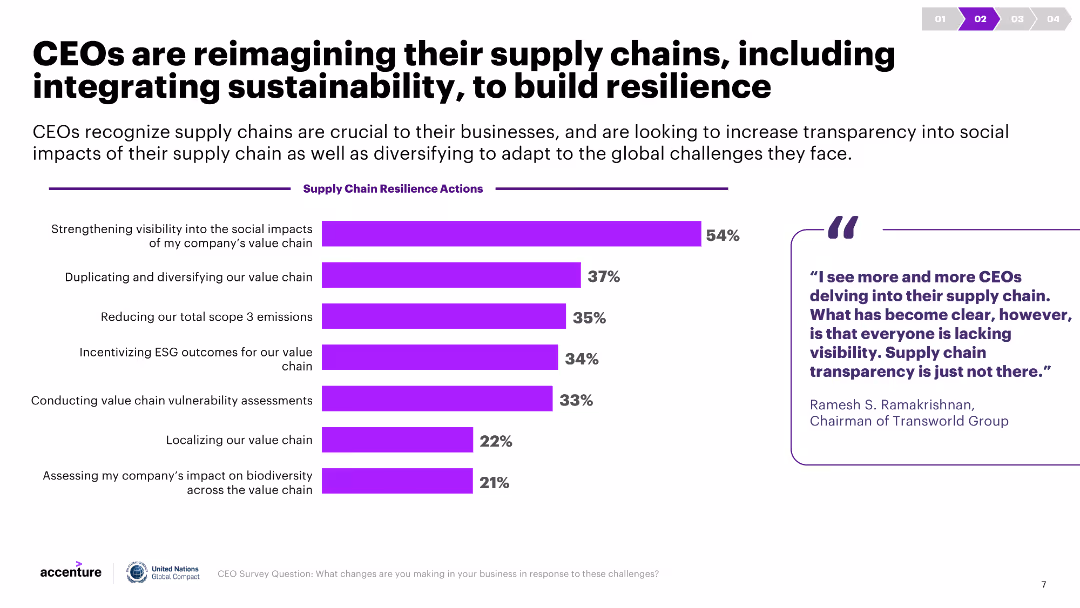
A column chart shows various supply chain resilience actions taken by CEOs, with percentages indicating the adoption rate. A quote and commentary are included on the right.
Strategic Planning
Transportation & Logistics
The slide highlights actions CEOs are taking to build resilient supply chains, including improving visibility, diversifying the value chain, and reducing emissions.
Supply chain resilience, CEO actions, sustainability, visibility, diversification
false
Strategic Planning
Transportation & Logistics
Mixed Chart
Accenture
Add to my slides
Remove from favorites
Column charts display the top three supply chain impacts across different regions, with corresponding icons for each impact. Commentary is on the right.
Market Analysis and Trends
Transportation & Logistics
The slide presents survey results showing CEOs' concerns about supply chain disruptions due to geopolitical instability, climate change, and other challenges, highlighting regional differences.
Supply chain, CEO concerns, regional impacts, disruptions, survey
false
Market Analysis and Trends
Transportation & Logistics
Mixed Chart
Accenture
Add to my slides
Remove from favorites
This slide presents a map and diagram of Ukraine's grain supply chain, showing major production areas and transport routes, along with comparative logistics data.
Operational Efficiency
Transportation & Logistics
The slide discusses Ukraine's grain supply chain, comparing transport distances and port infrastructure with those of Australia, and highlighting areas for potential improvement and investment.
Supply chain, Ukraine, logistics, transport distances, port infrastructure, grain production, harvest, storage, transportation, efficiency
false
Operational Efficiency
Transportation & Logistics
Graphic
LEK
Add to my slides
Remove from favorites
The slide uses detailed diagrams to represent three supply chain models for cement and clinker. Each model is broken down into stages with icons and annotations.
Operational Efficiency
Industrial & Manufacturing
Illustrates the supply chain processes for domestic production, clinker import, and cement import in Australia. Highlights the different stages and logistics involved in each archetype.
Supply chain, cement, clinker, logistics, Australia
false
Operational Efficiency
Industrial & Manufacturing
Diagram
LEK
Add to my slides
Remove from favorites
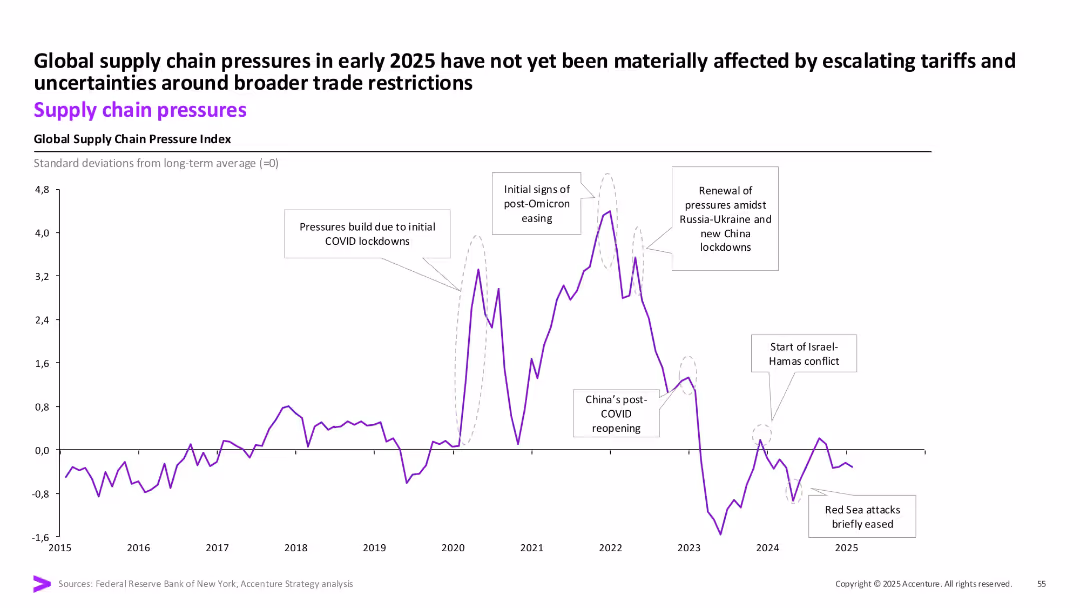
Line graph with annotations showing trends from 2015–2025, labeled inflection points, simple layout, purple theme.
Market Analysis and Trends
Professional Services
This slide analyzes global supply chain pressure trends over the past decade, highlighting key geopolitical and pandemic-related events that have influenced pressure points. It indicates that early 2025 pressures are relatively unaffected.
Supply chain, global index, COVID-19, Russia-Ukraine, trade restrictions, inflation
false
Market Analysis and Trends
Professional Services
Single Chart
Accenture
Add to my slides
Remove from favorites
The slide includes a diagram of the Canadian grain supply chain, detailing the stages from harvest to port, along with key statistics and logistical information.
Operational Efficiency
Transportation & Logistics
The slide provides a detailed overview of Canada's grain supply chain, highlighting the long transport distances and the efficiency of its port infrastructure.
Supply chain, logistics, Canada, transport distances, port infrastructure, grain export, harvest, storage, transportation, efficiency
false
Operational Efficiency
Transportation & Logistics
Graphic
LEK
Add to my slides
Remove from favorites
The slide contains text on the left and a vertical image of a shipping dock on the right. A horizontal bar chart at the bottom displays percentages for different supply chain strategies.
Market Analysis and Trends
Transportation & Logistics
Discusses the changes in supply chains due to global disruptions and highlights various strategies companies are using to transform their supply chains globally.
Supply chain, logistics, market trends, disruptions, strategies
false
Market Analysis and Trends
Transportation & Logistics
Mixed Chart
EY
Add to my slides
Remove from favorites
Displays a comparative table of key performance indicators (KPIs) for Australia, the US Northeast, and France, with color-coded performance ratings.
Performance Metrics and KPIs
Industrial & Manufacturing
Benchmarks the supply chain performance of Australia against the US Northeast and France. Identifies areas for improvement in trucking and coastal shipping costs and highlights key metrics.
Supply chain, performance metrics, Australia, US Northeast, France
false
Performance Metrics and KPIs
Industrial & Manufacturing
Table
LEK
Add to my slides
Remove from favorites
The slide includes a map of the US Northeast with locations of cement plants and port terminals, along with icons representing different supply chain stages.
Operational Efficiency
Transportation & Logistics
Describes the supply chain characteristics of the US Northeast cement industry. Emphasizes the role of water-based freight and identifies key logistical challenges and constraints.
Supply chain, water-based freight, cement, US Northeast, logistics
false
Operational Efficiency
Transportation & Logistics
Graphic
LEK
Add to my slides
Remove from favorites
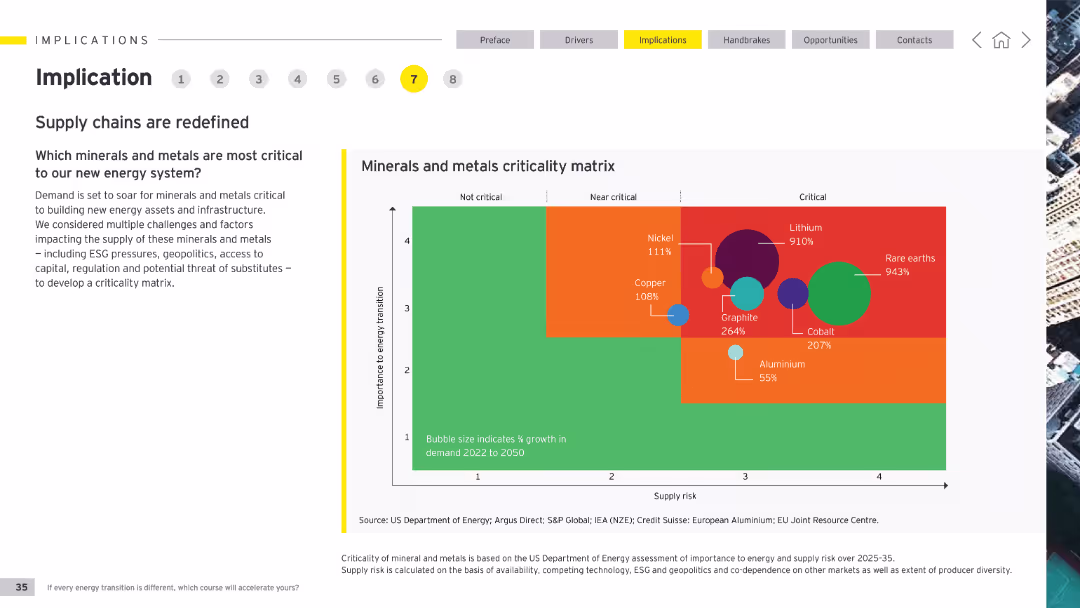
Column chart with colored sections representing criticality of minerals. Bubble sizes indicate percentage growth in demand from 2022 to 2050.
Market Analysis and Trends
Energy & Utilities
This slide analyzes the criticality of minerals and metals in the new energy system, focusing on supply risks and importance to energy transition.
Supply chains, minerals, metals, energy, transition, demand, criticality, risk, infrastructure, growth
false
Market Analysis and Trends
Energy & Utilities
Mixed Chart
EY
Add to my slides
Remove from favorites
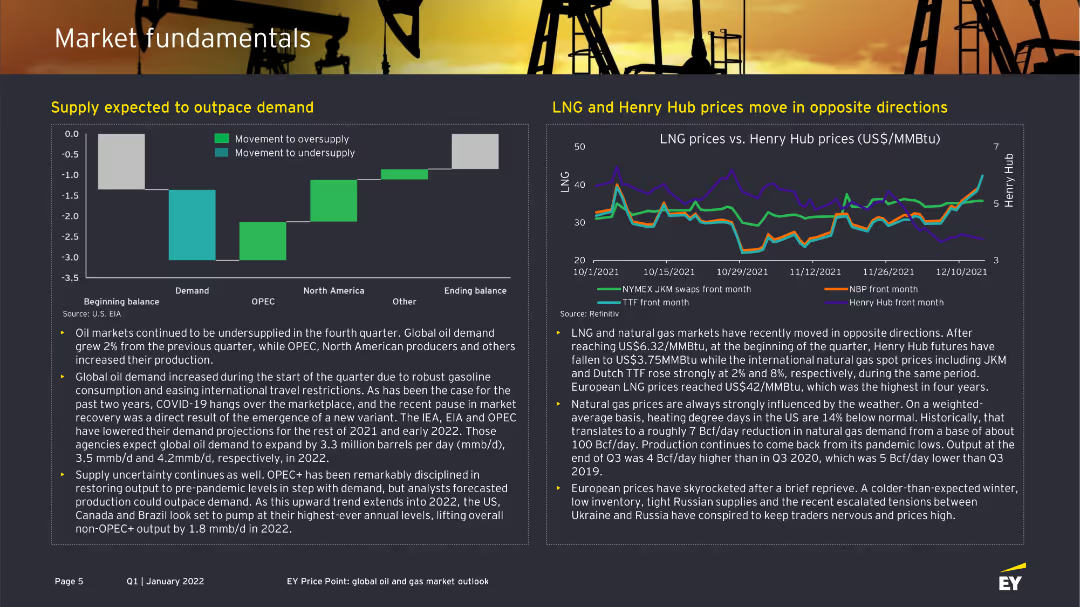
The slide contains two sections: one with a column chart showing the balance of demand and supply in the oil market and another with a line chart comparing LNG and Henry Hub prices. Each section is supported by descriptive text.
Market Analysis and Trends
Energy & Utilities
This slide provides insights into the oil and gas market fundamentals, showing the expected supply and demand dynamics and the contrasting movement of LNG and Henry Hub prices over time.
Supply, demand, oil market, LNG, Henry Hub prices
false
Market Analysis and Trends
Energy & Utilities
Multiple Chart
EY
Add to my slides
Remove from favorites
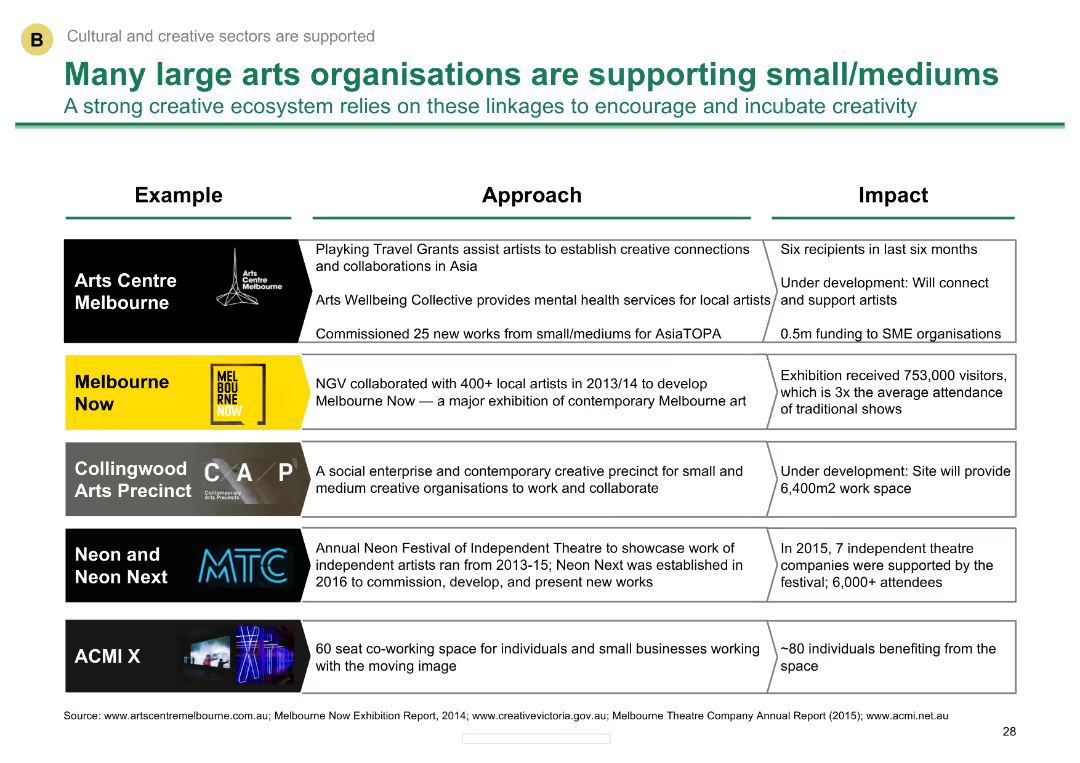
Comparative layout with examples of large arts organizations and their support initiatives
Client Case Studies
Media & Entertainment
Describes how large arts organizations in Melbourne support small and medium creative businesses, detailing specific programs and impacts.
Support initiatives, large organizations, small/medium businesses, Melbourne, arts support
false
Client Case Studies
Media & Entertainment
Table
BCG
Add to my slides
Remove from favorites
The slide uses a combination of text and diagrams to compare open surgery, minimally invasive surgery (MIS), and robotic-assisted surgery (RAS). Visual elements include checkmarks and arrows to highlight benefits and comparisons among the different surgical techniques.
Market Analysis and Trends
Healthcare & Pharmaceuticals
The slide discusses the evolution of surgical techniques, comparing open surgery, MIS, and RAS. It highlights the benefits and differentiators of each method, emphasizing the technological advancements and their impact on surgery outcomes.
Surgery, evolution, robotic-assisted, MIS, open surgery, benefits, comparisons, technological advancements, outcomes
false
Market Analysis and Trends
Healthcare & Pharmaceuticals
Linear Flow
LEK
Add to my slides
Remove from favorites
Slide presents a pie chart and bar charts detailing the methodology of a survey on C-level executives' attitudes towards climate action, with key statistics highlighted.
Industry Overview
Environmental Services & Sustainability
Describes the methodology of a comprehensive survey targeting C-level executives regarding climate action, detailing the demographic and job title distribution of respondents.
Survey Methodology, Climate Action, C-Level Executives, Demographics, Job Titles, Statistical Analysis
false
Industry Overview
Environmental Services & Sustainability
Multiple Chart
Deloitte
Add to my slides
Remove from favorites
Slide with a bar chart showing industry participation in a survey, highlighted in various shades of green, alongside pie charts depicting regional and operational scopes.
Market Analysis and Trends
Professional Services
Summarizes industry, regional, and operational participation in a 2023 survey, focusing on the evolving landscape of contact centers.
Survey Participation, Industry Representation, Regional Analysis, Operational Scope, Contact Centers
false
Market Analysis and Trends
Professional Services
Mixed Chart
Deloitte
Add to my slides
Remove from favorites
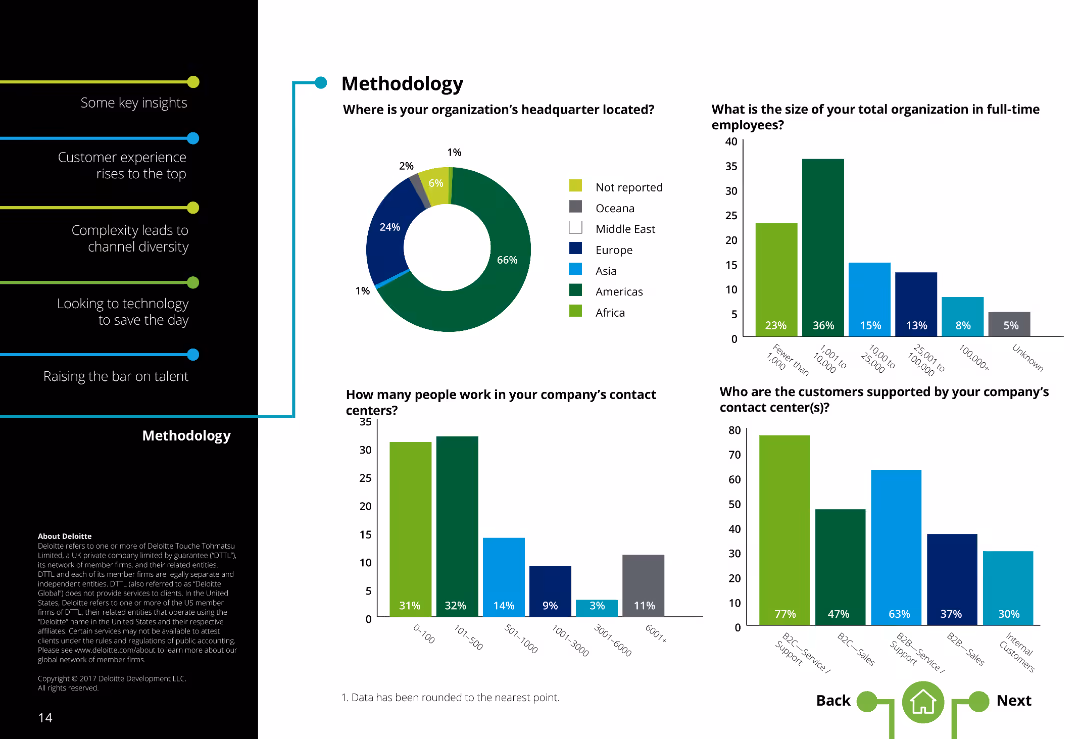
Two-column layout with text on the left and various charts (pie chart, column charts) on the right. Text density is moderate.
Market Analysis and Trends
Professional Services
Outlines demographics of survey respondents, including headquarters location, organization size, number of contact center employees, and customer types supported.
Survey demographics, Headquarters location, Organization size, Contact center employees, Customer types, Respondent information
false
Market Analysis and Trends
Professional Services
Multiple Chart
Deloitte
Add to my slides
Remove from favorites
Text and graphical data including a table of survey respondents by country and industry, with bar charts showing industry and company size distributions among respondents.
Market Analysis and Trends
Professional Services
This slide provides demographics from the Work Reimagined 2022 Survey, including respondent distribution by country, industry representation, and company size range.
Survey demographics, respondents, country distribution, industry representation, company size
false
Market Analysis and Trends
Professional Services
Multiple Chart
EY
Add to my slides
Remove from favorites
The slide features text and a column chart showing the most frequently returned product categories, including womenswear, shoes, menswear, and children/kids.
Market Analysis and Trends
Retail & E-commerce
Delivers insights from a survey on returns behavior, showing which product categories are most frequently returned, with a focus on demographic differences.
Survey findings, Returns, Product categories, Womenswear, Shoes
false
Market Analysis and Trends
Retail & E-commerce
Mixed Chart
Roland Berger
Add to my slides
Remove from favorites
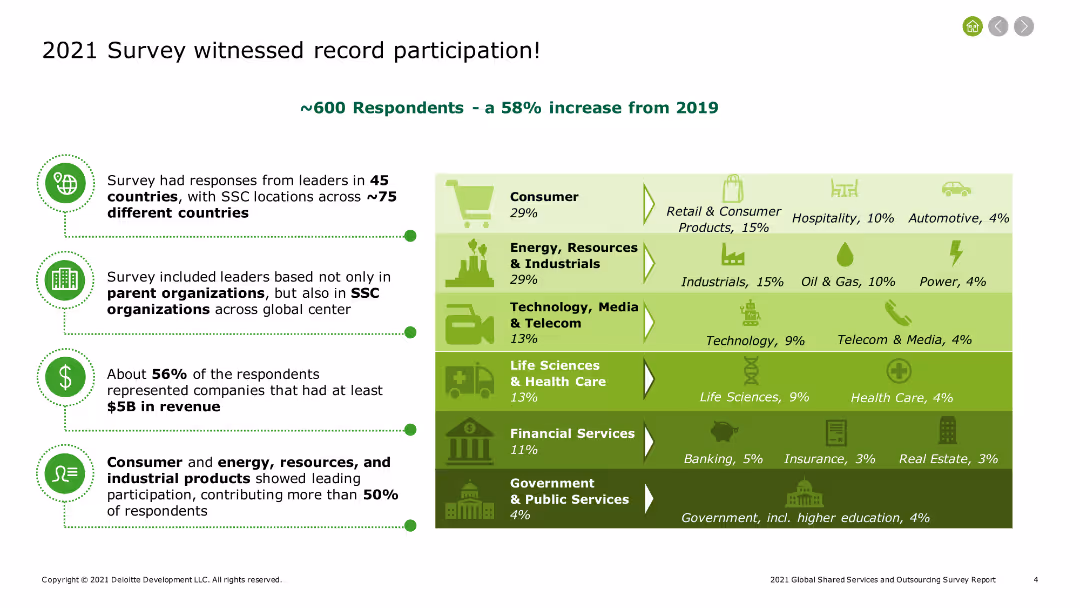
The slide includes a summary of survey participation, with key points highlighted in bullet form on the left and a stacked bar chart on the right showing the distribution of respondents across various industries such as consumer products, energy, and technology.
Industry Overview
Professional Services
The slide summarizes the 2021 survey participation, noting a 58% increase from 2019. It highlights the diverse representation from different industries and companies with substantial revenue, providing a broad overview of the survey demographics and industry engagement.
Survey participation, industry overview, respondent distribution, 2021 survey, consumer products, energy, technology, revenue analysis, survey demographics
false
Industry Overview
Professional Services
Table
Deloitte
Add to my slides
Remove from favorites
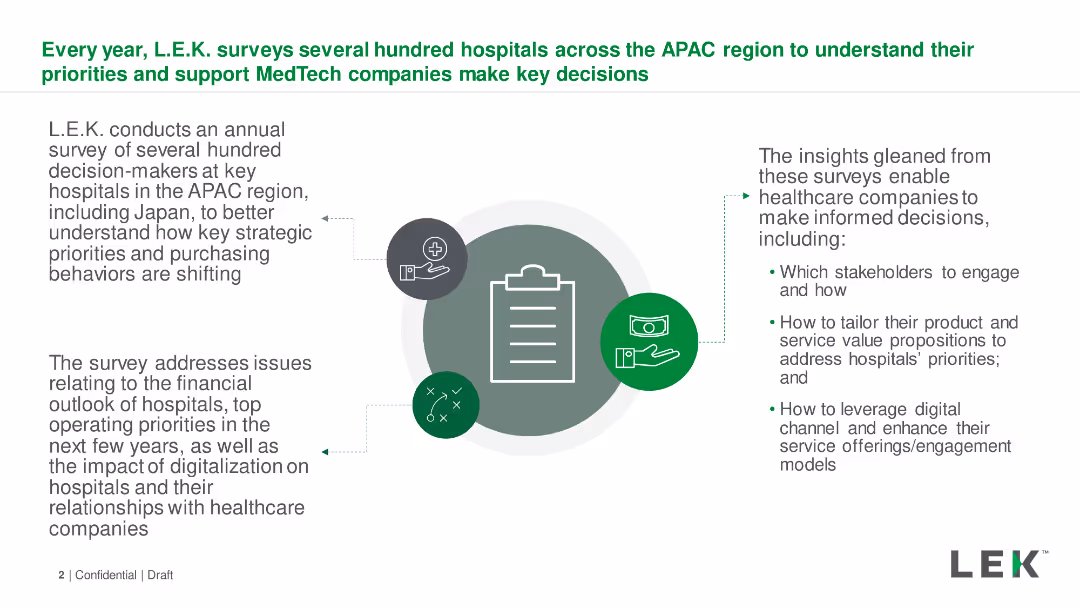
Text with icons describing L.E.K.'s survey process of APAC hospitals. Text boxes detail survey focus areas and insights. Simple layout.
Market Analysis and Trends
Healthcare & Pharmaceuticals
Description of an annual survey conducted by L.E.K. to understand strategic priorities and purchasing behaviors of hospitals in the APAC region.
Survey, APAC, Hospitals, Priorities, Purchasing Behaviors
false
Market Analysis and Trends
Healthcare & Pharmaceuticals
Diagram
LEK
Add to my slides
Remove from favorites
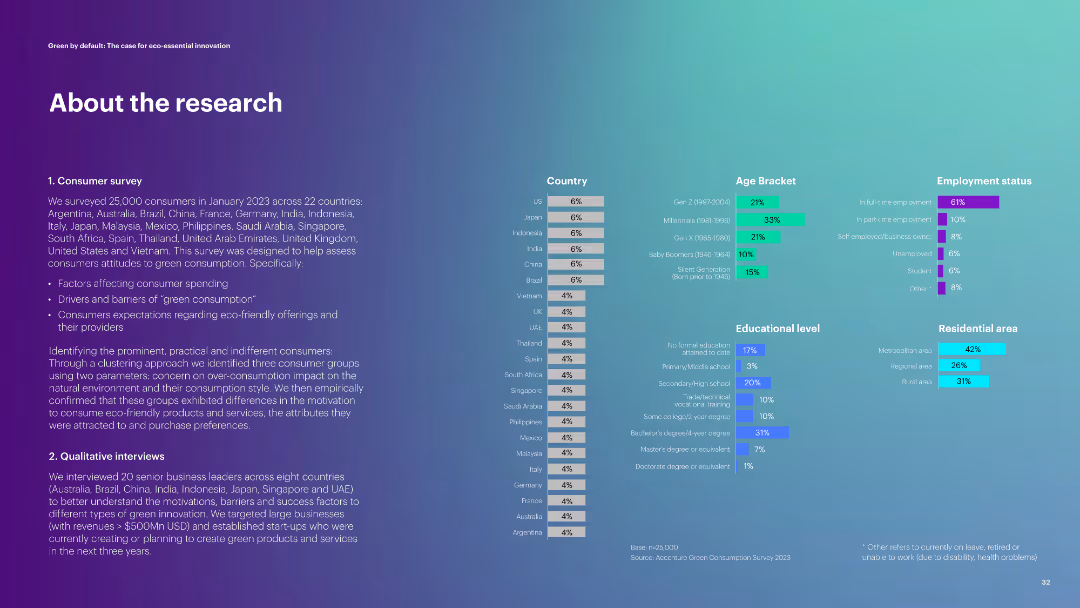
The slide has a purple gradient background with white text. It includes a detailed breakdown of a survey
Market Analysis and Trends
Consumer Goods
It details a consumer survey conducted across 22 countries and qualitative interviews with business leaders
Survey, Consumer Research, Demographics, Green Consumption, Interviews
false
Market Analysis and Trends
Consumer Goods
Multiple Chart
Accenture
Add to my slides
Remove from favorites
Demographics infographic, statistical representations, and a purple and white theme.
Industry Overview
Technology & Software
The slide shows survey demographics, highlighting the representation of various high-tech industries and geographic distribution. This could be used in presentations analyzing market trends, industry representation, or for setting the context in a broader industry analysis discussion.
Survey, Demographics, High Tech, Industries, Geographic Distribution, Market Trends, Analysis, Context, Representation
false
Industry Overview
Technology & Software
Multiple Chart
Accenture
Add to my slides
Remove from favorites
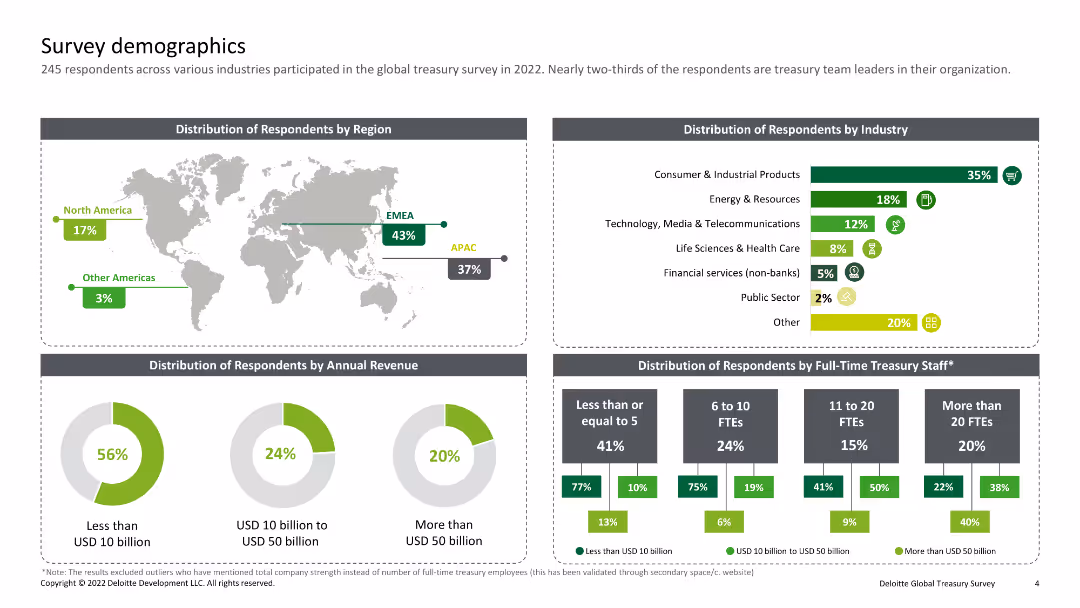
Combination of a world map and several pie charts and bar charts. Displays the distribution of survey respondents by region, industry, annual revenue, and full-time treasury staff.
Market Analysis and Trends
Professional Services
This slide presents the demographics of survey respondents, detailing their geographical distribution, industry sectors, company revenue sizes, and the number of full-time treasury staff employed.
Survey, Demographics, Region, Industry, Revenue
false
Market Analysis and Trends
Professional Services
Multiple Chart
Deloitte
Add to my slides
Remove from favorites
Contains two pie charts, one showing the distribution of organization sizes and the other showing the sectors of the respondent organizations, with distinct colors for each category.
Market Analysis and Trends
Professional Services
Provides demographic data of the survey respondents, including organization size ranging from less than 50 employees to more than 500, and sectors such as financial services, manufacturing, and healthcare. The slide helps in understanding the diversity and background of the survey participants.
Survey, Demographics, Respondents, Organization size, Sectors
false
Market Analysis and Trends
Professional Services
Multiple Chart
PwC/Strategy&
Add to my slides
Remove from favorites
The slide features a central title, a portrait of a woman to the left, and two sets of column charts on the right displaying percentages.
Market Analysis and Trends
Professional Services
The slide depicts anticipated changes in customer demand and company profits over a series of months in 2020, highlighting trends in economic sentiments derived from survey data.
Survey, Economic, Demand, Profits, Trends
false
Market Analysis and Trends
Professional Services
Multiple Chart
McKinsey
Add to my slides
Remove from favorites
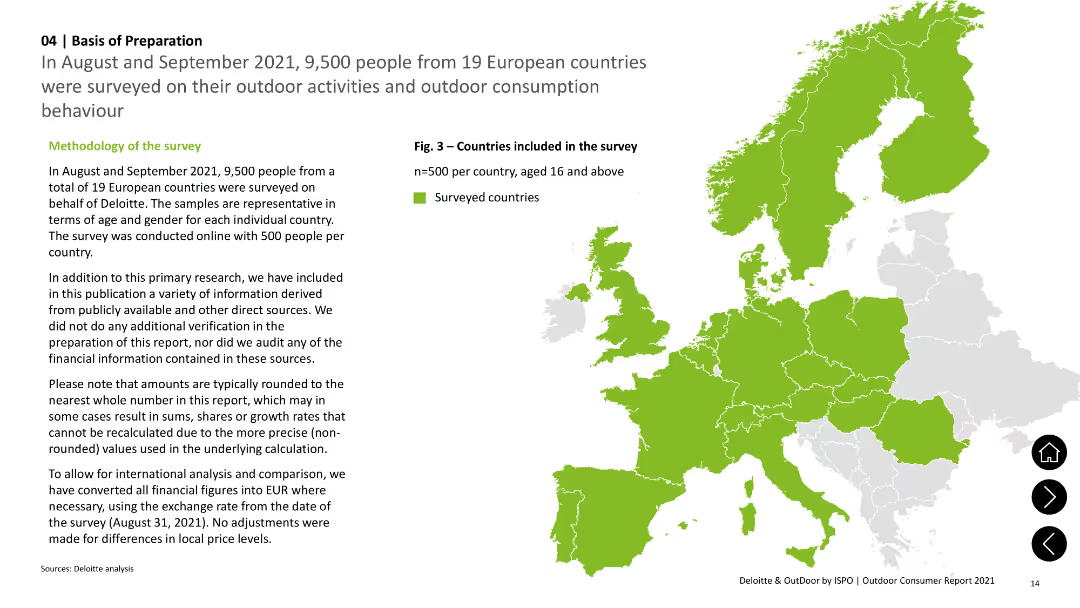
This slide has a map highlighting surveyed countries and text explaining the methodology. It uses green highlights for surveyed regions and white for others.
Market Analysis and Trends
Consumer Goods
Describes the methodology of a survey conducted in 19 European countries, detailing the number of respondents and the process used.
Survey, Methodology, Europe, Respondents, Market Research
false
Market Analysis and Trends
Consumer Goods
Graphic
Deloitte
Add to my slides
Remove from favorites
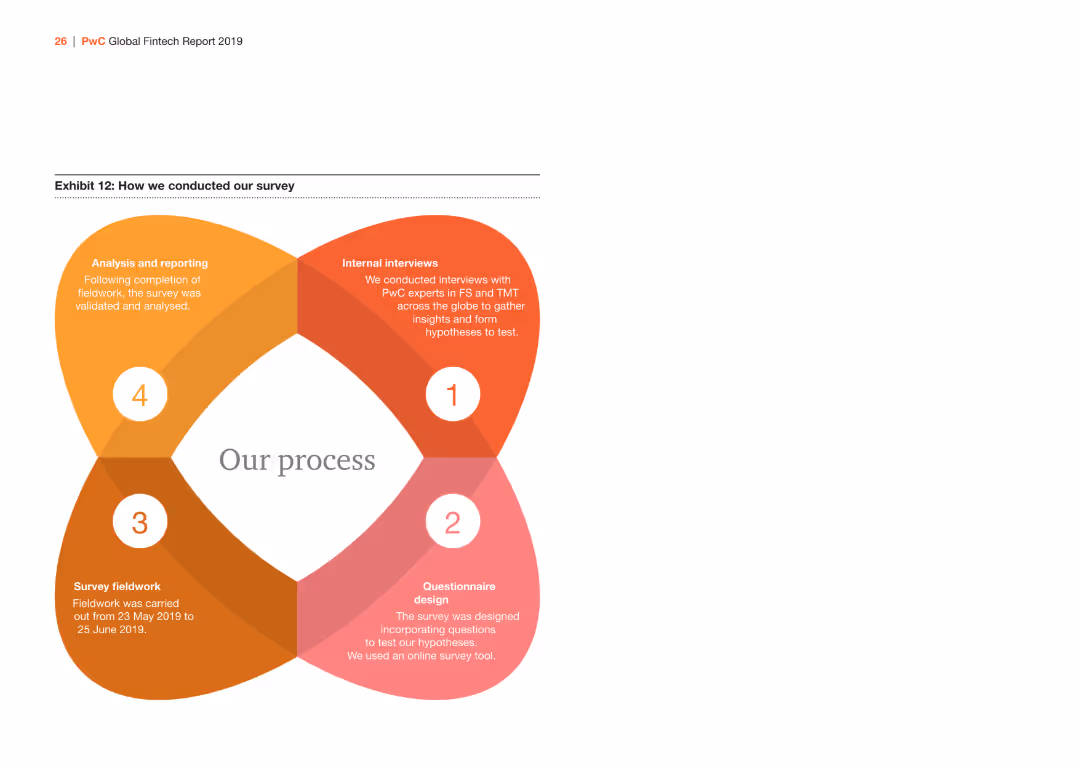
This slide includes a circular diagram with four interconnected sections, representing the steps of the survey process. Each section is color-coded and labeled with the steps involved.
Market Analysis and Trends
Financial Services
It outlines the process of how the survey was conducted, including internal interviews, questionnaire design, fieldwork, and analysis and reporting stages.
Survey, Methodology, Process, Diagram, Research
false
Market Analysis and Trends
Financial Services
Vertical Flow
PwC/Strategy&
Add to my slides
Remove from favorites
The slide includes pie and a table with labels. The pie chart divides participants by economic sector (B2B Product, B2B Services, B2C Product, B2C Services), while the column chart segments them by industry, illustrating the diversity of the survey participants.
Market Analysis and Trends
Professional Services
This slide provides a breakdown of survey participants by economic and industry sectors, highlighting the representation across various fields. It is useful for understanding the demographic spread of the survey, which can influence the interpretation of its results.
Survey, Participants, Demographics, Industry Sectors, Economic Sectors
false
Market Analysis and Trends
Professional Services
Mixed Chart
Deloitte
Add to my slides
Remove from favorites
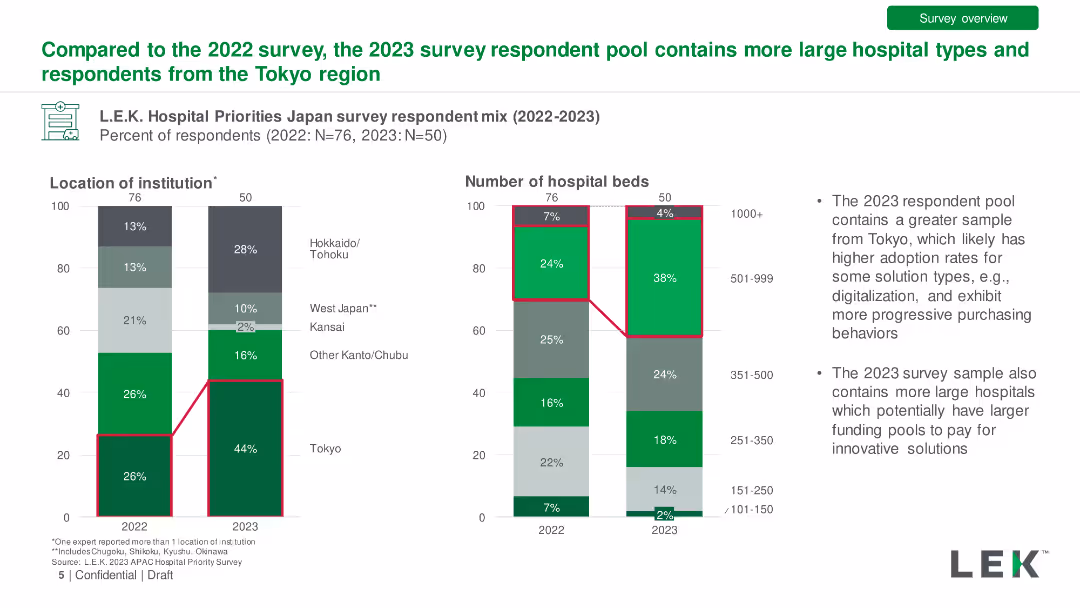
Bar charts comparing survey respondent mix by location and hospital size for 2022 and 2023. Detailed with respondent percentages.
Market Analysis and Trends
Healthcare & Pharmaceuticals
Analysis of the differences in respondent demographics between 2022 and 2023 surveys, highlighting increased participation from larger hospitals and Tokyo.
Survey, Respondent Mix, Hospital Size, Tokyo, Comparison
false
Market Analysis and Trends
Healthcare & Pharmaceuticals
Multiple Chart
LEK
Add to my slides
Remove from favorites
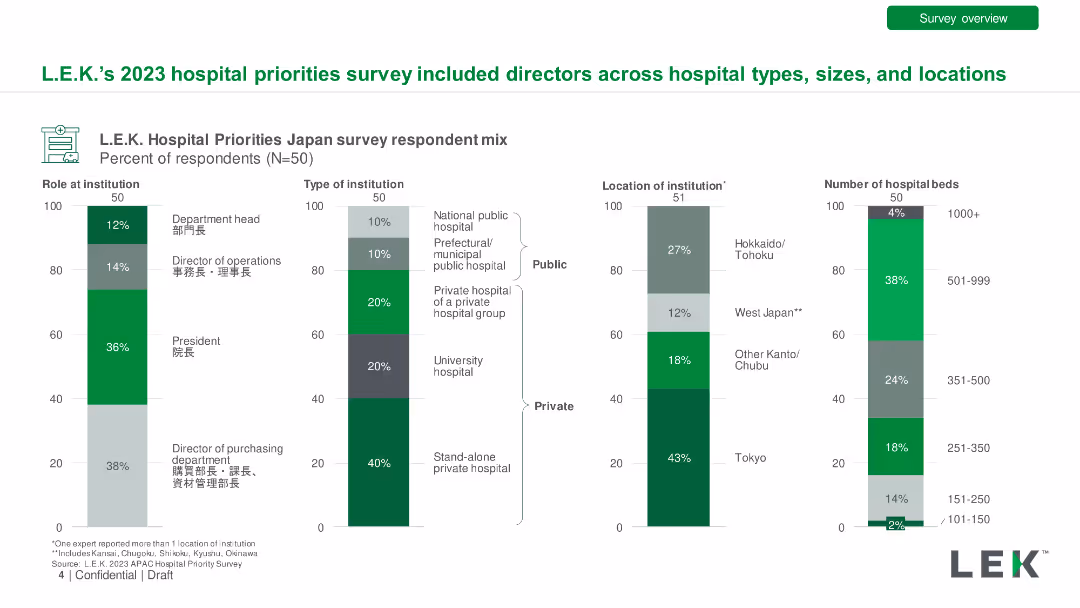
Multiple bar charts showing survey respondent mix by role, type of institution, location, and number of hospital beds. Detailed and colorful.
Market Analysis and Trends
Healthcare & Pharmaceuticals
Presentation of the respondent demographics from L.E.K.'s 2023 hospital priorities survey, including roles, hospital types, locations, and sizes.
Survey, Respondents, Hospital Types, Locations, Demographics
false
Market Analysis and Trends
Healthcare & Pharmaceuticals
Multiple Chart
LEK
Add to my slides
Remove from favorites
Pie chart, color-coded, small text
Market Analysis and Trends
Professional Services
Summarizes demographic data of survey respondents
Survey, demographics, business leaders
false
Market Analysis and Trends
Professional Services
Mixed Chart
Deloitte
Add to my slides
Remove from favorites
Slide offers a pie chart and demographic details of a survey, including age, gender, and location distribution of respondents.
Industry Overview
Government & Public Sector
Provides an overview of the survey demographics and methodology used in the National Community Hubs Program evaluation in Belgium.
Survey, demographics, methodology, NCHP, Belgium
false
Industry Overview
Government & Public Sector
Multiple Chart
Deloitte
Add to my slides
Remove from favorites
The slide contains an explanatory text about the survey, a world map showing survey participant locations, and pie charts representing company sizes and sectors.
Market Analysis and Trends
Professional Services
Overview of the survey methodology, participant demographics, and data collection timeline.
Survey, methodology, demographics, data collection, participant locations
false
Market Analysis and Trends
Professional Services
Mixed Chart
EY
Add to my slides
Remove from favorites
Various pie charts and maps showing the composition of survey respondents by jurisdiction, title/role, revenue, and industry sectors.
Market Analysis and Trends
Professional Services
This slide provides an overview of survey respondents' profiles, including their jurisdiction, revenue, roles, and industry sectors, offering insights into the survey's demographic.
Survey, respondents, jurisdiction, revenue, roles, industry, composition, demographics, analysis, profile
false
Market Analysis and Trends
Professional Services
Multiple Chart
EY
Add to my slides
Remove from favorites
The slide presents a comparative column chart depicting the survival rates of US non-financial companies based on their resilience ratings.
Risk Assessment and Management
Financial Services
Demonstrates the survival disparity between companies with high resilience versus those with low resilience over a 19-year period.
Survival rate, Resilience, US companies, Comparative analysis
false
Risk Assessment and Management
Financial Services
Single Chart
Bain
Add to my slides
Remove from favorites
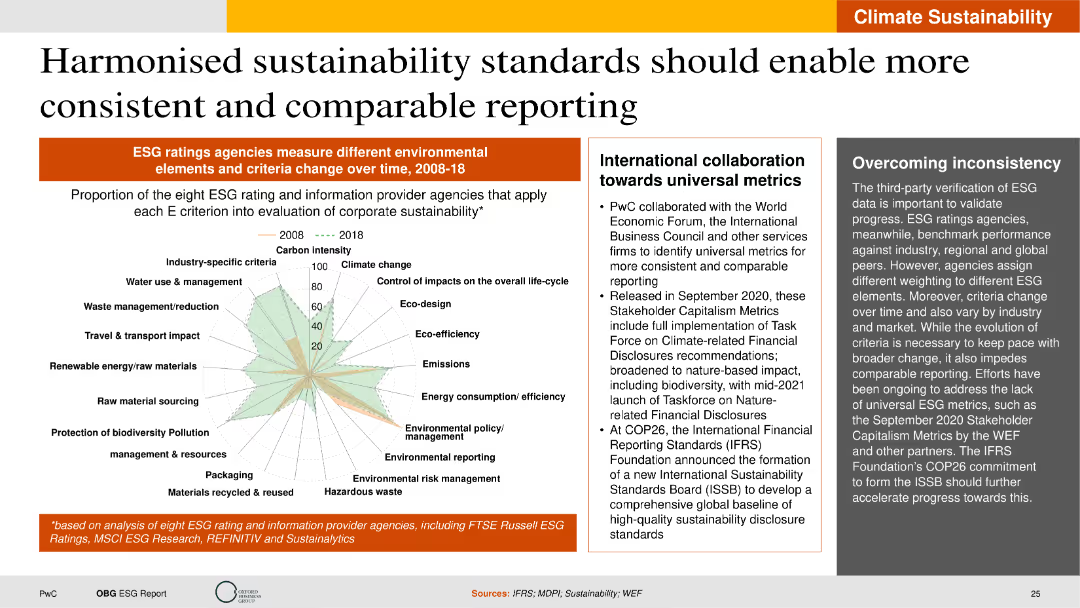
The slide features a radar chart and text boxes, providing a comprehensive view of changes in ESG rating criteria and international collaboration efforts. The layout is clear and structured.
Regulatory and Compliance
Environmental Services & Sustainability
This slide discusses the need for harmonized sustainability standards to improve the consistency and comparability of ESG reporting. It presents a radar chart showing changes in ESG rating criteria over time and outlines international collaboration efforts towards universal metrics. The slide emphasizes the importance of standardized methodologies for validating and comparing ESG performance across different industries and regions.
Sustainability standards, ESG reporting, international collaboration, universal metrics
false
Regulatory and Compliance
Environmental Services & Sustainability
Mixed Chart
PwC/Strategy&
Add to my slides
Remove from favorites
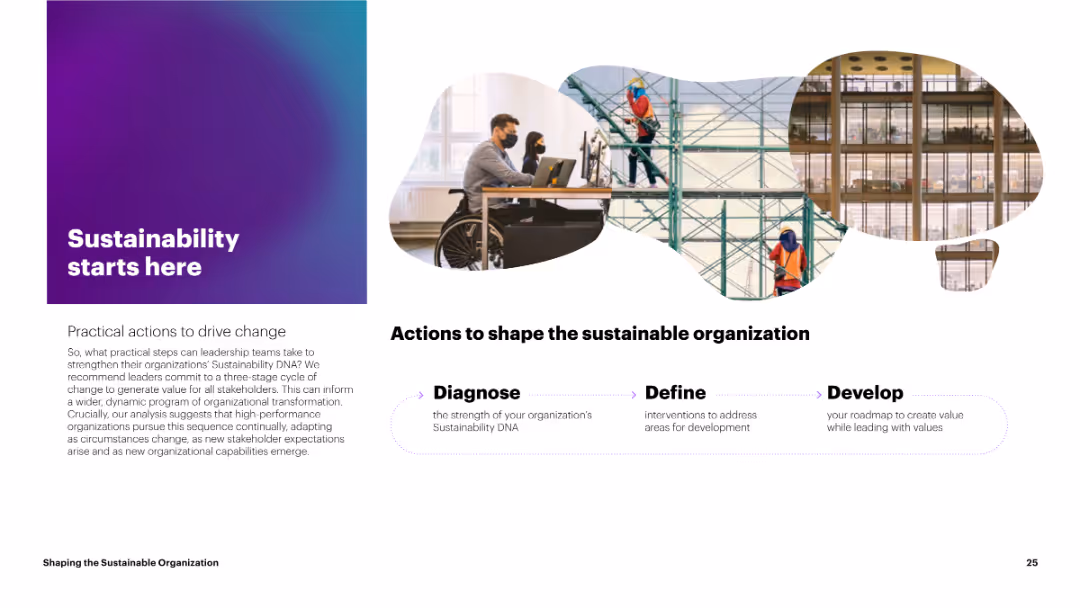
The slide includes a visually appealing gradient background with an image of professionals working, along with text outlining practical actions for sustainability. The layout is clean, with a balance of images and text.
Strategic Planning
Environmental Services & Sustainability
The slide outlines practical actions to drive change for strengthening sustainability in organizations. It emphasizes a three-stage cycle: Diagnose, Define, and Develop, aiming for continuous improvement and adaptation to new stakeholder expectations.
Sustainability, Actions, Change, Strategy, Improvement
false
Strategic Planning
Environmental Services & Sustainability
Linear Flow
Accenture
Add to my slides
Remove from favorites
This slide has a list of six attributes with corresponding checkmarks on the left, in a blue and white theme. There's a dark blue header and footer with the page number at the bottom right.
Strategic Planning
Financial Services
This slide explains the unique aspects of a sustainability bond, including its issuance framework, scope, use of proceeds, and reporting. It aligns with ICMA guidelines and is relevant for presenting to stakeholders or investors, emphasizing the organization's commitment to sustainable finance and adherence to international standards, and can be used in strategy meetings or financial briefings.
Sustainability, Bonds, ICMA, Reporting, Finance, Guidelines, Impact, Allocation
false
Strategic Planning
Financial Services
Table
Goldman Sachs
Add to my slides
Remove from favorites
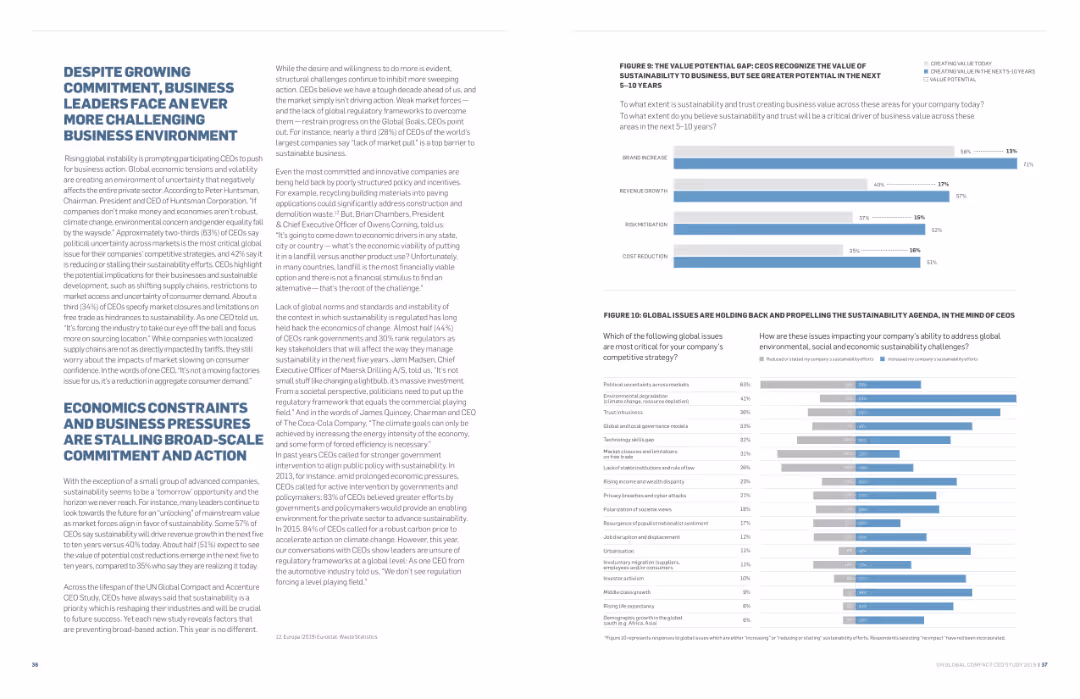
The slide contains a significant amount of text and two column charts. The charts depict the value potential gap and global issues impacting sustainability efforts.
Risk Assessment and Management
Financial Services
The slide addresses the increasing challenges business leaders face in committing to sustainability due to economic and market uncertainties. It provides survey data on sustainability and risk management.
Sustainability, Business Challenges, Risk Management, Economic Uncertainty, Survey Data, Financial Services
false
Risk Assessment and Management
Financial Services
Multiple Chart
Accenture
Add to my slides
Remove from favorites
Slide includes a bar chart comparing perceived benefits of sustainability efforts between leaders and laggards in various business aspects, using green and lighter green bars, with percentages and annotations.
Market Analysis and Trends
Environmental Services & Sustainability
The slide outlines perceived business impacts of environmental sustainability efforts, comparing leaders to laggards across several operational and strategic metrics.
Sustainability, Business Impact, Leaders vs. Laggards, Environmental Strategies, Operational Impact, Strategic Impact
false
Market Analysis and Trends
Environmental Services & Sustainability
Mixed Chart
Deloitte
Add to my slides
Remove from favorites
The slide is visually divided into three main sections, each with a header, image, and bulleted text describing key sustainability efforts by Seatruim.
Strategic Planning
Energy & Utilities
Outlines the three pillars of Seatruim’s sustainability strategy, emphasizing their commitments to responsible business operations, sustainable engineering, and community engagement. Can be used to communicate the company's sustainability initiatives and commitments.
Sustainability, Business, Engineering, Community, Strategy
false
Strategic Planning
Energy & Utilities
Header Horizontal
Morgan Stanley
Add to my slides
Remove from favorites
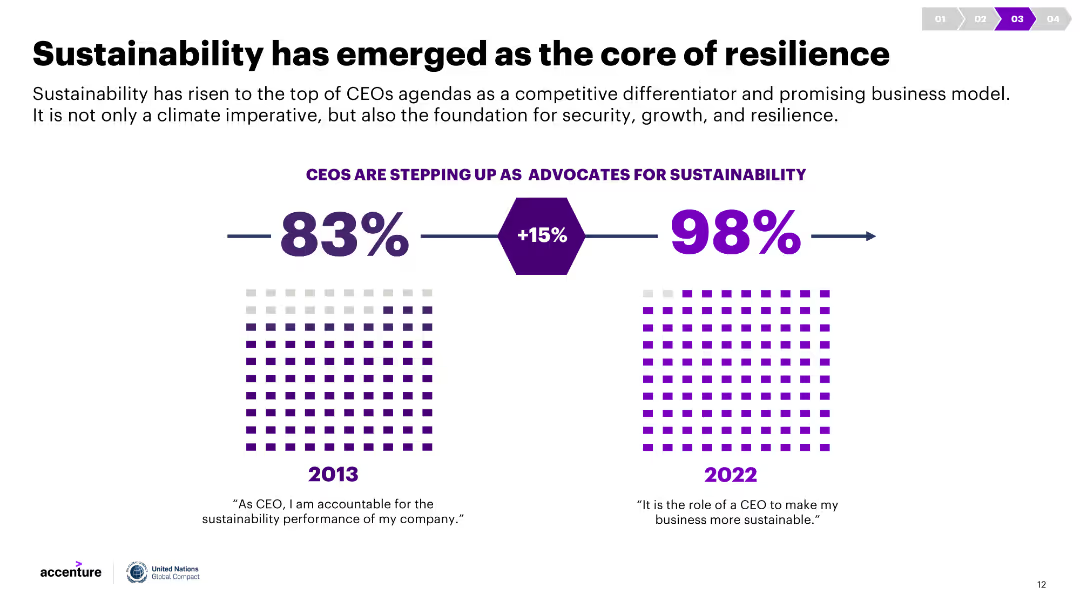
A slide with statistical data comparing CEOs' advocacy for sustainability between 2013 and 2022, using percentage values and visual graphics. Commentary discusses the implications.
Strategic Planning
Environmental Services & Sustainability
The slide illustrates the growing importance of sustainability among CEOs, showing a significant increase in advocacy from 2013 to 2022 and positioning sustainability as a core business strategy.
Sustainability, CEO advocacy, business strategy, resilience, statistics
false
Strategic Planning
Environmental Services & Sustainability
Single Chart
Accenture
Add to my slides
Remove from favorites
This slide features a circular diagram divided into various sectors representing strategic business directions, surrounded by four case studies positioned in each quadrant, each with a logo, a short description, and associated strategic goals.
Strategic Planning
Consumer Goods
The slide showcases how four companies (CHR Hansen, Arla, Faerch, Carlsberg) leverage strategic directions to create business value from sustainable development goals (SDGs). Each quadrant emphasizes a different strategy such as diversity and inclusion, CSR due diligence, product development sustainability, and minimizing carbon footprint.
Sustainability, CSR, Diversity, Product Development, Carbon Footprint
false
Strategic Planning
Consumer Goods
Diagram
McKinsey
Add to my slides
Remove from favorites
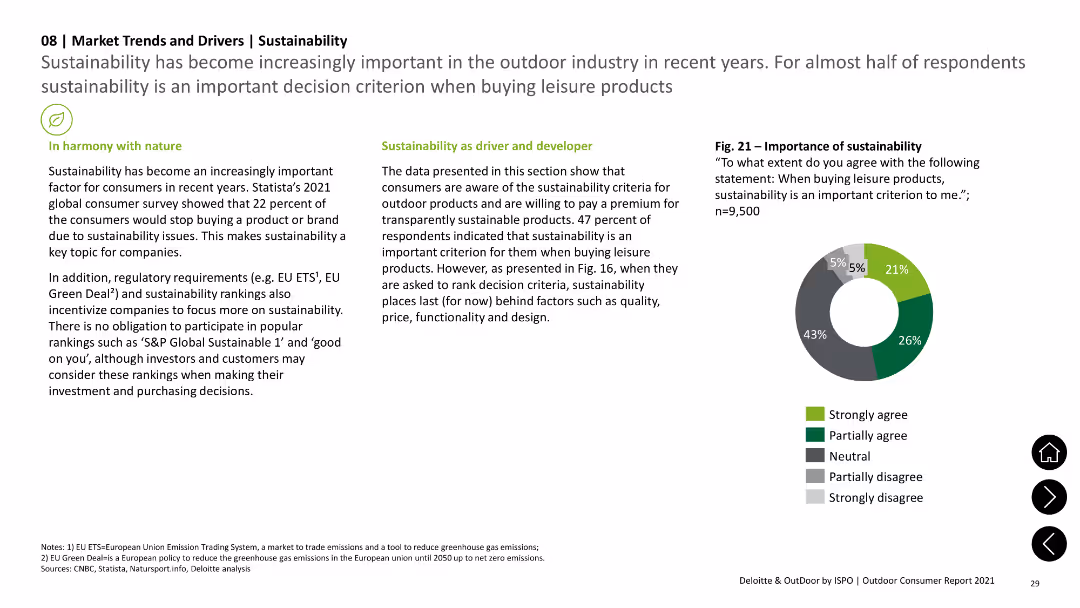
Includes pie chart showing agreement levels on the importance of sustainability in buying decisions, with supporting text on trends and regulations.
Technology and Digital Transformation
Environmental Services & Sustainability
Highlights the importance of sustainability in consumer decision-making and the impact of regulatory requirements on corporate focus on sustainability.
Sustainability, Consumer, Trends, Regulations, Importance
false
Technology and Digital Transformation
Environmental Services & Sustainability
Mixed Chart
Deloitte
Add to my slides
Remove from favorites
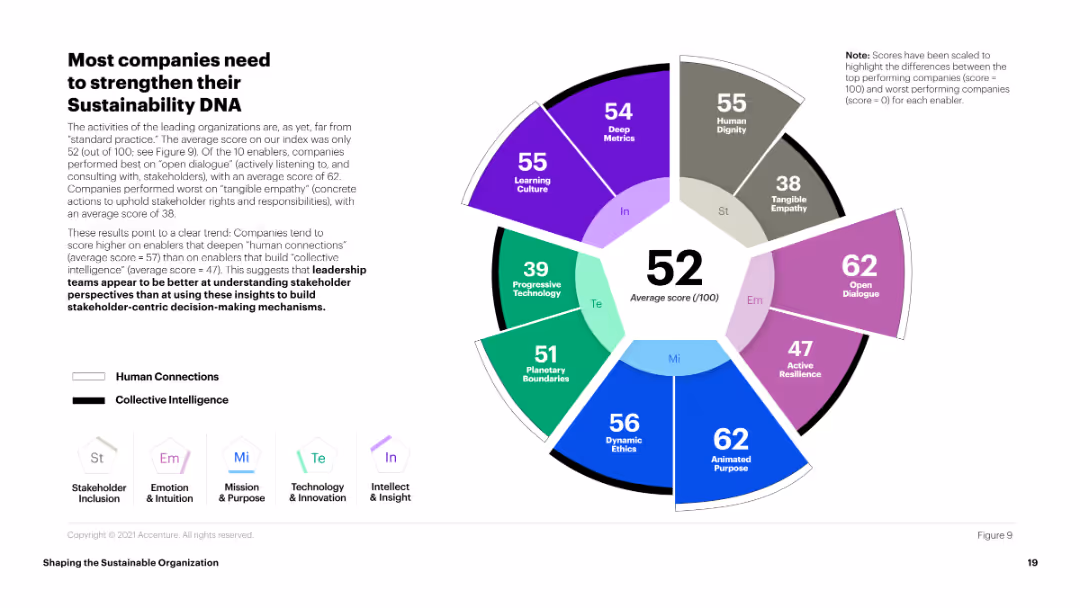
This slide features a circular chart with various segments, each representing different scores related to sustainability metrics. The chart uses color coding to differentiate between metrics and includes detailed annotations.
Market Analysis and Trends
Environmental Services & Sustainability
The slide highlights the average scores of companies on sustainability metrics, emphasizing the need for organizations to improve their sustainability practices. It suggests that companies focus more on human connections over collective intelligence.
Sustainability, DNA, Metrics, Companies, Analysis
false
Market Analysis and Trends
Environmental Services & Sustainability
Mixed Chart
Accenture
Add to my slides
Remove from favorites
Features column chart displaying sustainable finance volumes and a list of policies and achievements, clearly depicting growth and initiatives with a focus on environmental sustainability.
Regulatory and Compliance
Financial Services
Highlights Deutsche Bank's sustainability efforts in Q2 2023, including increased sustainable finance volumes and various ESG achievements, such as green bond issuances and policy updates.
Sustainability, ESG achievements, sustainable finance, green bonds, policy updates, Deutsche Bank, Q2 2023
false
Regulatory and Compliance
Financial Services
Mixed Chart
Deutsche Bank
Add to my slides
Remove from favorites
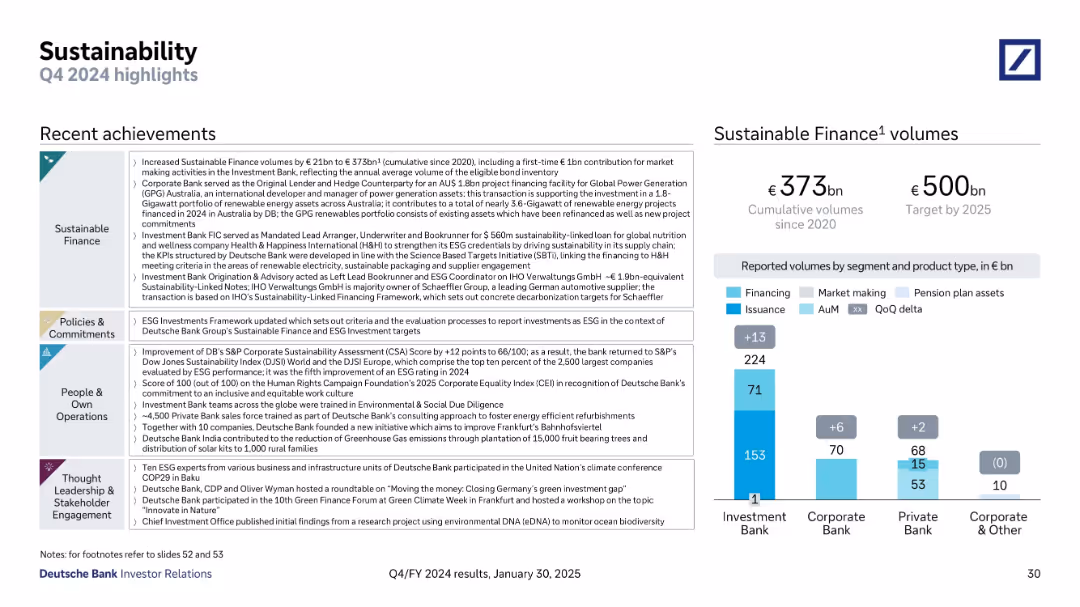
Multi-section text layout on the left; bar chart on the right showing sustainable finance volumes
Financial Performance
Financial Services
The slide summarizes Deutsche Bank’s sustainability initiatives, including €373bn in cumulative sustainable finance volumes, ESG framework enhancements, and environmental & social contributions. The right-hand chart shows volume contributions by business segment.
Sustainability, ESG, Finance Volumes, Climate, Renewable Energy
false
Financial Performance
Financial Services
Mixed Chart
Deutsche Bank
Add to my slides
Remove from favorites
A timeline highlighting key milestones in sustainability, with bullet points on either side summarizing major initiatives and achievements.
Strategic Planning
Financial Services
This slide traces the company's history of sustainability leadership, featuring milestones such as environmental policy framework and clean energy investments, underlining the firm's long-term commitment to environmental and social governance.
Sustainability, Environmental Policy, Clean Energy, Social Governance, Corporate Responsibility
false
Strategic Planning
Financial Services
Linear Flow
Goldman Sachs
Add to my slides
Remove from favorites
This slide uses multiple lists and a large bar chart detailing sustainable finance volumes and targets.
Regulatory and Compliance
Environmental Services & Sustainability
Covering sustainability efforts and achievements, this slide details increased finance volumes, partnerships, and strategic sustainability initiatives. It is useful for stakeholders and regulatory bodies interested in corporate environmental responsibilities and progress towards sustainability goals, including long-term financial commitments to sustainability-linked projects and reporting on environmental, social, and governance (ESG) criteria.
Sustainability, Finance, ESG, Partnerships, Regulatory Compliance
false
Regulatory and Compliance
Environmental Services & Sustainability
Mixed Chart
Deutsche Bank
Add to my slides
Remove from favorites
Previous
Next
You don't have any favorites yet.
Please wait loading your favorites slides...
Create a FREE account to continue browsing
Receive Instant Access to 1,000+ slides from companies like McKinsey, Google, and Goldman Sachs
First Name
Last Name
Email
Password
I agree to all
Terms & Privacy Policy
Thank you! Your submission has been received!
Oops! Something went wrong while submitting the form.
Have an account?
Sign in
Upgrade to PRO to Save slides
Advanced Search and Filters
Access to 15,000+ slides
Access to Category Pages
Save/Bookmark Slides
PowerPoint Template Library
Pick a Plan
MONTHLY
$12/month
Billed every month, Cancel anytime.
YEARLY
$9/year
Billed $108 annually, Cancel anytime.
Checkout for $12/month
Checkout for $108/yr
Secured by Stripe | AES-256 bit encryption