My Account
My Slides
Search by Category
Pricing
Templates
View All Templates
Download Template Slides
✦ AI Search
Feedback
Login
Logout
Get Started
Browse all Slides
Browse all Slides
Create a FREE Account
Instant access to 1,000+ real slides from top companies like McKinsey, BCG, Goldman Sachs, Google and many more!
First Name
Last Name
Email
Password
I agree to all
Terms & Privacy Policy
Thank you! Your submission has been received!
Oops! Something went wrong while submitting the form.
Have an account?
Sign in
Saved Slides
Total No. of slides saved
0
↻ Refresh
✖ Clear all
A final slide in the disruption series, maintaining a consistent design with the previous slides. The text is organized in two columns, complemented by simple tech iconography. The white, blue, and black color scheme keeps the focus on the content.
Strategic Planning
Technology & Software
Concluding the series on technology-driven disruptions, this slide summarizes the transformative effects on strategy, organization, and operations, providing a high-level view of the strategic considerations necessary to navigate the evolving tech landscape. It is intended for presentations that aim to synthesize and summarize key points from a detailed discussion on cross-industry technological impacts.
Technology, Disruption, Strategy, Summary, Transformative, Organization, Operations, Considerations
false
Strategic Planning
Technology & Software
Header Vertical
McKinsey
Add to my slides
Remove from favorites
Flowcharts and column charts showing technology improvement.
Technology and Digital Transformation
Financial Services
Details improvements in electronic offerings with specific performance metrics.
Technology, Enhancements, Strategy, Performance Metrics, Financial Services
false
Technology and Digital Transformation
Financial Services
Mixed Chart
Barclays
Add to my slides
Remove from favorites
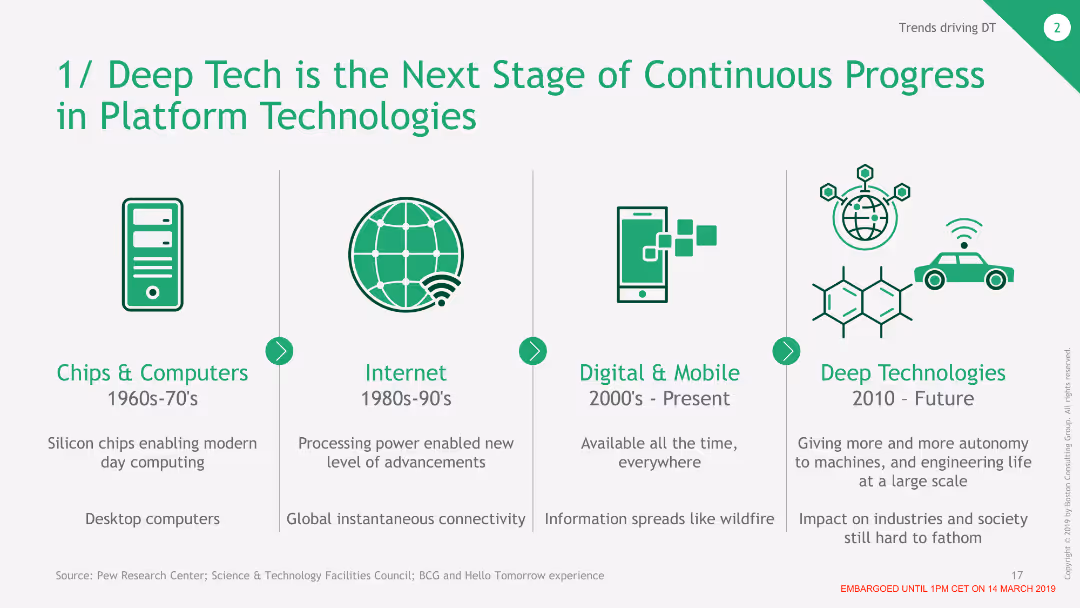
The slide contains four columns each with a graphical icon at the top and explanatory text below. The four columns are evenly spaced, each representing a different technological era.
Market Analysis and Trends
Technology & Software
This slide explains the evolution of platform technologies from the 1960s to the present and predicts future trends. It highlights key developments in chips, the internet, mobile tech, and deep technologies.
Technology, Evolution, Internet, Mobile, Chips
false
Market Analysis and Trends
Technology & Software
Pillar
BCG
Add to my slides
Remove from favorites
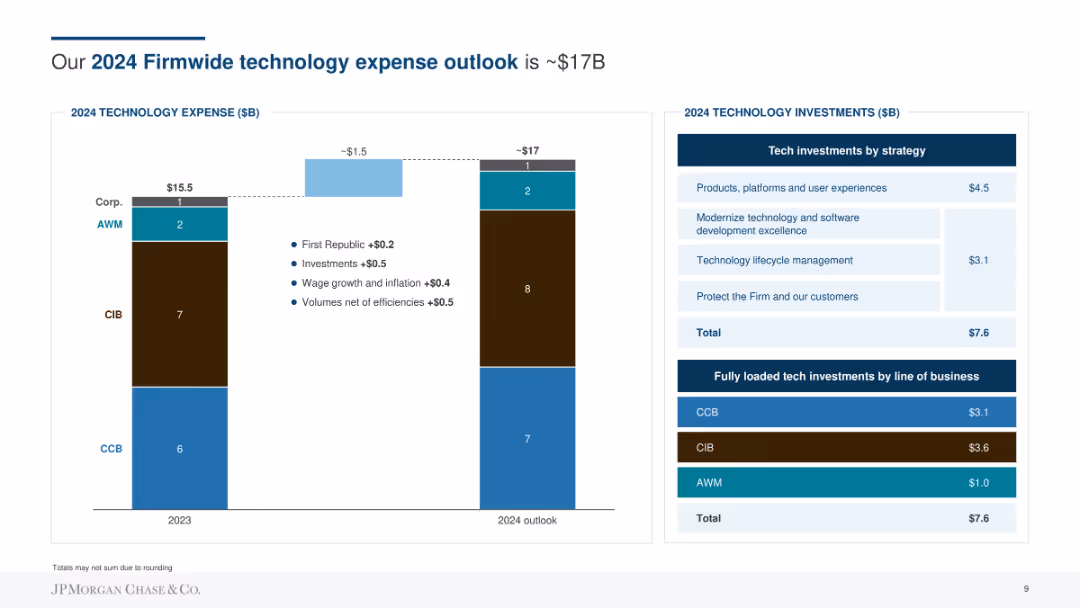
Column chart comparing 2023 and 2024 technology expenses, with breakdowns for AWM, CIB, CCB, and Corp. Includes a detailed side panel with tech investment strategies. Shows a projected increase to ~$17B.
Financial Performance
Financial Services
Provides an outlook for 2024 technology expenses expected to be around $17B. Breaks down investments by strategy, including products, modernization, and protection efforts.
Technology, Expense, Investment, Strategy, Modernization, Protection, Financial
false
Financial Performance
Financial Services
Mixed Chart
JP Morgan
Add to my slides
Remove from favorites
The slide features multiple column charts, a line graph, and various text annotations. Two primary colors, blue and grey, dominate the charts. The slide layout is clean with a balance between graphics and text information.
Financial Performance
Financial Services
This slide shows the total technology expense growth of a financial firm, highlighting the drivers such as investments and volumes. The aim is to depict investment strategies and projected outcomes, which would be of interest to investors or company stakeholders. It breaks down expenses by categories and shows CAGR (compound annual growth rate).
Technology, Expenses, CAGR, Investment, Finance
false
Financial Performance
Financial Services
Mixed Chart
JP Morgan
Add to my slides
Remove from favorites
This slide features a bar chart with horizontal bars showcasing various technologies and their impact on foodservice over the next five years, with percentages and changes.
Market Analysis and Trends
Hospitality & Tourism
The slide discusses key technologies influencing the foodservice industry, including online ordering, AI, and automation, highlighting their potential impact over the next five years.
Technology, Foodservice, Innovation, AI, Automation
false
Market Analysis and Trends
Hospitality & Tourism
Mixed Chart
Deloitte
Add to my slides
Remove from favorites
This slide features two line charts comparing angel & seed and series A funding in technology from 2005 to 2017. It uses a blue and green color scheme and contains a legend, axis labels, and a note.
Market Analysis and Trends
Technology & Software
This slide shows the trend of increasing average funding round sizes in the technology sector over time, with specific focus on early stages and series A funding, suitable for financial and market trend analysis.
Technology, Funding, Trend, Series A, Angel & Seed
false
Market Analysis and Trends
Technology & Software
Multiple Chart
Oliver Wyman
Add to my slides
Remove from favorites
This slide features a complex graph tracking GDP changes across countries with reference to industrial revolutions. The bold title is complemented by a timeline and legend. Design is data-heavy, with an inset quote and photo on the top right. The blue and black color scheme maintains a professional appearance.
Financial Performance
Technology & Software
Highlighting the economic impact of technological advancements, this slide provides a historical perspective by correlating GDP growth with industrial revolutions. It presents a data-driven analysis ideal for discussions on technology’s role in economic development and the potential future implications of the ongoing Fourth Industrial Revolution. This could be used to support investment strategies or policy-making in tech sectors.
Technology, GDP, Economic Impact, Data Analysis, Industrial Revolution, Growth, Historical, Investment
true
Financial Performance
Technology & Software
Mixed Chart
McKinsey
Add to my slides
Remove from favorites
The slide is a content slide with a blend of text and a column chart. It features a background image of buses with an overlay text box. The right side has a column chart with four sectors listed vertically.
Market Analysis and Trends
Government & Public Sector
The slide discusses the role of governments in supporting technological innovation to achieve net-zero targets. It emphasizes the balance between regulation and investment and highlights major carbon emitters in 2050, advocating for the adoption of breakthrough technologies to aid decarbonization efforts.
Technology, Government, Net-zero, Decarbonization, Emissions
false
Market Analysis and Trends
Government & Public Sector
Mixed Chart
EY
Add to my slides
Remove from favorites
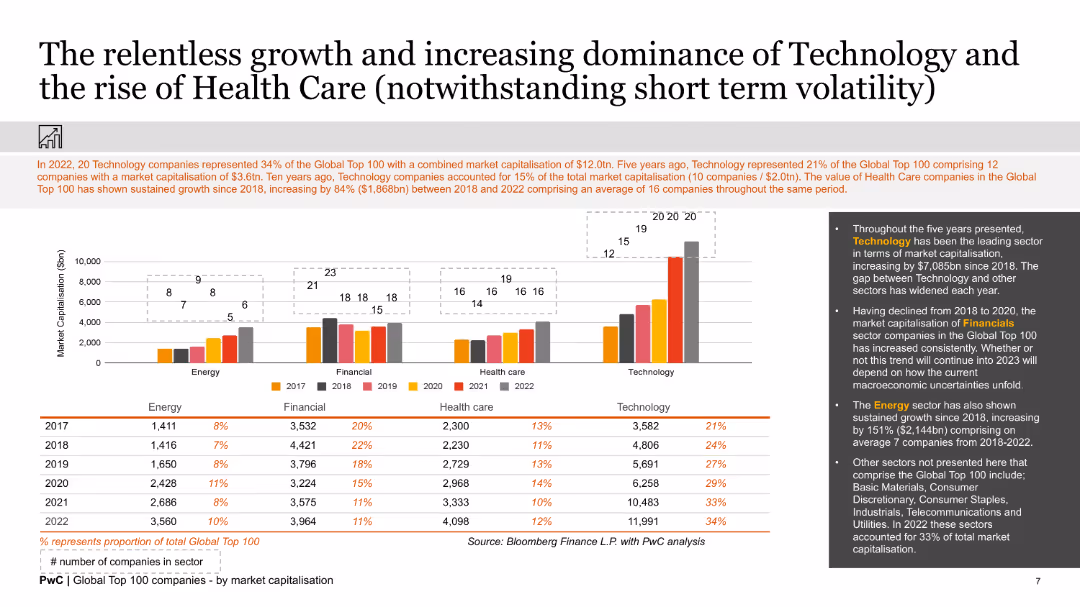
This slide features a column chart illustrating the market capitalization of various sectors from 2017 to 2022. The sectors included are Energy, Financial, Health Care, and Technology. The chart is color-coded by year.
Market Analysis and Trends
Technology & Software
The slide highlights the growth in market capitalization for Technology and Health Care sectors over five years. It shows a sustained increase in the Technology sector's market cap, indicating its growing dominance compared to other sectors.
Technology, Healthcare, Market Capitalization, Growth, Trends, Analysis, Column Chart, Sectors, Financial Performance, Historical Data
false
Market Analysis and Trends
Technology & Software
Mixed Chart
PwC/Strategy&
Add to my slides
Remove from favorites
The slide combines text with a central diagram that connects drilling, receiving real-time information, and accurate subsurface data. It features a quotation for a personal touch and provides a concise visual representation of the company's technological focus.
Technology and Digital Transformation
Industrial & Manufacturing
The slide explains how the company's technologies enhance drilling and data analysis, used to highlight innovation in operational technologies and their impact on cost-effective operations.
Technology, Innovation, Drilling, Data Analysis, Cost-Effective
false
Technology and Digital Transformation
Industrial & Manufacturing
Framework
Morgan Stanley
Add to my slides
Remove from favorites
The slide has two main sections; one is a column chart showing 'Technology and Product Investments,' with future outlook annotations, and the other is a text section detailing the impacts of these investments. The visual elements are clearly divided, using contrasting colors and icons to denote different aspects of technology development.
Technology and Digital Transformation
Technology & Software
This slide presents the financial commitments made towards technology and product development, alongside the tangible impacts of such investments on business operations and customer experience. It's utilized for illustrating the company's dedication to innovation and the concrete benefits derived from investments in modernization, likely intended for investor or stakeholder presentations.
Technology, Investment, Innovation, Digital Transformation, Impact, Business Value, Customer Experience
false
Technology and Digital Transformation
Technology & Software
Mixed Chart
JP Morgan
Add to my slides
Remove from favorites
Simple text layout with supporting graphics representing scales of impact and technical maturity, and organizational fit. The design emphasizes readability and clarity.
Investment Analysis
Technology & Software
Exploring the criteria for technological investments, this slide prompts strategic reflection on the timing, scale of impact, and organizational fit of tech trends. Ideal for guiding executives in making informed investment decisions, it underscores the importance of aligning technology strategy with the business model and the market stage.
Technology, Investment, Strategy, Impact, Maturity, Organization, Business Alignment
true
Investment Analysis
Technology & Software
Header Horizontal
McKinsey
Add to my slides
Remove from favorites
Diagram and pie charts comparing platform usage between China and the US
Market Analysis and Trends
Technology & Software
Highlights platform consolidation in China, with a significant share held by Tencent
Technology, Platform Usage, China, Tencent, Comparison
false
Market Analysis and Trends
Technology & Software
Multiple Chart
BCG
Add to my slides
Remove from favorites
A comprehensive matrix categorizes various technologies based on their industry applicability and technical maturity. The layout is structured with color-coded labels and momentum indicators. This detailed diagram slide uses shades of blue and black for a professional tech-focused theme.
Strategic Planning
Technology & Software
This slide prioritizes over forty individual technologies by their maturity, industry impact, and momentum, serving as a strategic planning tool for tech investments and innovation focus. It breaks down complex tech ecosystems into accessible visual information, which could be invaluable for executives and industry specialists in decision-making processes.
Technology, Prioritization, Matrix, Innovation, Strategy, Impact, Industry, Maturity, Momentum, Planning
true
Strategic Planning
Technology & Software
Single Chart
McKinsey
Add to my slides
Remove from favorites
Slide features three columns labeled "As-Is," "Blend," and "Best of Breed," detailing procurement technology strategies. Includes bullet points on benefits and trade-offs, and logos from various tech companies at the bottom.
Technology and Digital Transformation
Technology & Software
Discusses the evolution of procurement technology strategies across three models: full replacement, hybrid approach, and integration of best-in-class technology, emphasizing the transition from generic to specialized solutions.
Technology, Procurement, Integration, Evolution, Strategy
false
Technology and Digital Transformation
Technology & Software
Table
Kearney
Add to my slides
Remove from favorites
The slide contrasts two key aspects: 'Superior Technology' and 'Broad Product Offering' with bullet points and icons. There's also a sidebar detailing 'Superior Technology and Automation' with specific service features highlighted.
Technology and Digital Transformation
Financial Services
Spotlights the competitive edge in technology and product offerings, detailing the trading technology, broad market access, and cost-effective rates. The slide aims to convince the audience of the company's technological superiority and extensive market coverage.
Technology, Product Offering, Trading, Market Access, Cost-Effectiveness
false
Technology and Digital Transformation
Financial Services
Diagram
Goldman Sachs
Add to my slides
Remove from favorites
A line graph showing the percentage agreement over time (2013-2021) that technical progress is destroying lives, with trends per country.
Market Analysis and Trends
Technology & Software
This slide examines the growing concern about technology, indicating the percentage of people who agree that technology is harmful, from 2013 to 2021.
Technology, Progress, Concern, Trends, Countries
false
Market Analysis and Trends
Technology & Software
Mixed Chart
IPSOS
Add to my slides
Remove from favorites
This slide includes bullet points highlighting company achievements and a column chart depicting consistent revenue growth.
Industry Overview
Technology & Software
It offers a snapshot of a technology company’s market position and financial growth, probably for investor relations or strategic review.
Technology, Revenue Growth, Financial Services, Market Position, Client Retention, Users
false
Industry Overview
Technology & Software
Mixed Chart
Goldman Sachs
Add to my slides
Remove from favorites
Two line graphs, one dashed, illustrate Series B & C funding and secondary market trends over time. There's a significant spike in secondary market data for 2017.
Investment Analysis
Technology & Software
The slide presents data on the sharp increase in secondary-market funding round sizes for technology in 2017, emphasizing the growth in mega rounds and key investments. Suitable for discussions on market shifts and investment strategies.
Technology, Secondary Market, Series B, Series C, Investment
false
Investment Analysis
Technology & Software
Multiple Chart
Oliver Wyman
Add to my slides
Remove from favorites
Graphical layout with bar charts comparing technology in use and deployment across various domains.
Technology and Digital Transformation
Technology & Software
Slide depicts technology usage and deployment statistics, emphasizing the higher adoption rate of hybrid work technologies.
Technology, Statistics, Hybrid Work, Data Analysis
false
Technology and Digital Transformation
Technology & Software
Single Chart
EY
Add to my slides
Remove from favorites
This slide is organized into four key areas of technological strategy, each represented by an icon and supported by bullet points detailing specific accomplishments and objectives. The use of color coding helps to differentiate between areas, and the clear layout aids in conveying complex information efficiently.
Technology and Digital Transformation
Technology & Software
Slide 1 outlines JPMorgan Chase & Co.'s ongoing execution of its technology strategy, highlighting advancements in product offerings, development capabilities, data insights, and cybersecurity measures.
Technology, Strategy, Product Development, Cybersecurity, Data Insights, AI/ML, Cloud Computing
false
Technology and Digital Transformation
Technology & Software
Header Horizontal
JP Morgan
Add to my slides
Remove from favorites
The slide juxtaposes seven technology icons against black space, with a text section on the left. The visual is sleek and modern, utilizing monochrome icons that are indicative of the tech industry. The composition is clean, with a focus on both the graphical elements and the informational text.
Technology and Digital Transformation
Technology & Software
This slide breaks down seven cross-industry and three industry-specific technology trends based on prioritized technologies, offering a snapshot of critical areas for future development. It's a concise visual and textual depiction that can serve as a discussion starter in presentations aimed at exploring the intersection of these technologies with various industry needs.
Technology, Trends, Future, Development, Industry, Prioritization, Cross-Industry, Specific, Snapshot
false
Technology and Digital Transformation
Technology & Software
Table
McKinsey
Add to my slides
Remove from favorites
The slide is text-heavy, presenting significant statistical insights related to technological impacts up to 2050. It features percentages and predictions, with a clean white and black contrast design. Minimal use of blue adds a subtle touch of color. The layout is straightforward, focusing the viewer's attention on the data provided.
Technology and Digital Transformation
Technology & Software
This slide provides statistical insights into how technology trends could reshape markets and industries over the coming decades, focusing on automation, connectivity, infrastructure, and computing advancements. The concise, fact-rich content is designed to inform strategic decision-making in technology investments and policy planning, suitable for stakeholders looking for a data-centric perspective on the future of tech in global markets.
Technology, Trends, Market Reshaping, Industry, Future, Automation, Connectivity, Data, Statistics
false
Technology and Digital Transformation
Technology & Software
Graphic
McKinsey
Add to my slides
Remove from favorites
The slide presents a silhouette of a person's head with a digital overlay, alongside vertical lines converging into a bright focal point. The background is dark with a blue tint, accentuating the digital motif.
Industry Overview
Technology & Software
The title slide for McKinsey's technology trends report, providing a thematic introduction to discussions on evolving tech trends in 2022.
Technology, Trends, Outlook, 2022, Report, Digital, Innovation, Future, McKinsey
true
Industry Overview
Technology & Software
Title
McKinsey
Add to my slides
Remove from favorites
The slide includes a bar chart showing the percentage of global IPOs by sector and the number and proceeds of IPOs for 2022 compared to 2021.
Market Analysis and Trends
Financial Services
Shows the dominance of the technology sector in IPO volume and the leading role of the energy sector in IPO proceeds in 2022.
Technology, energy, IPO, sector comparison, 2022
false
Market Analysis and Trends
Financial Services
Multiple Chart
EY
Add to my slides
Remove from favorites
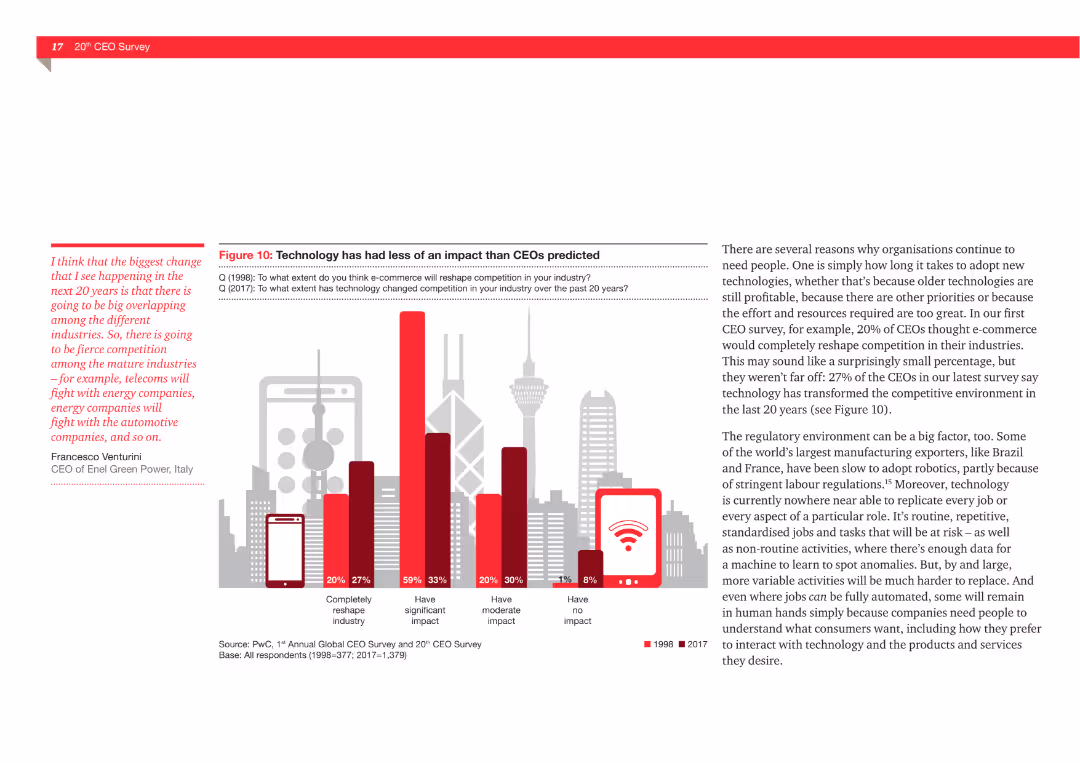
The slide features a column chart comparing CEOs' predictions from 1998 and 2017 about the impact of technology on competition, with categories like "significant impact" and "no impact."
Market Analysis and Trends
Technology & Software
This slide illustrates how CEOs' predictions about the impact of technology on competition have changed from 1998 to 2017. It shows that while many expected significant changes, the actual impact has been more moderate than anticipated.
Technology, impact, competition, predictions, CEOs, market analysis, trends
false
Market Analysis and Trends
Technology & Software
Mixed Chart
PwC/Strategy&
Add to my slides
Remove from favorites
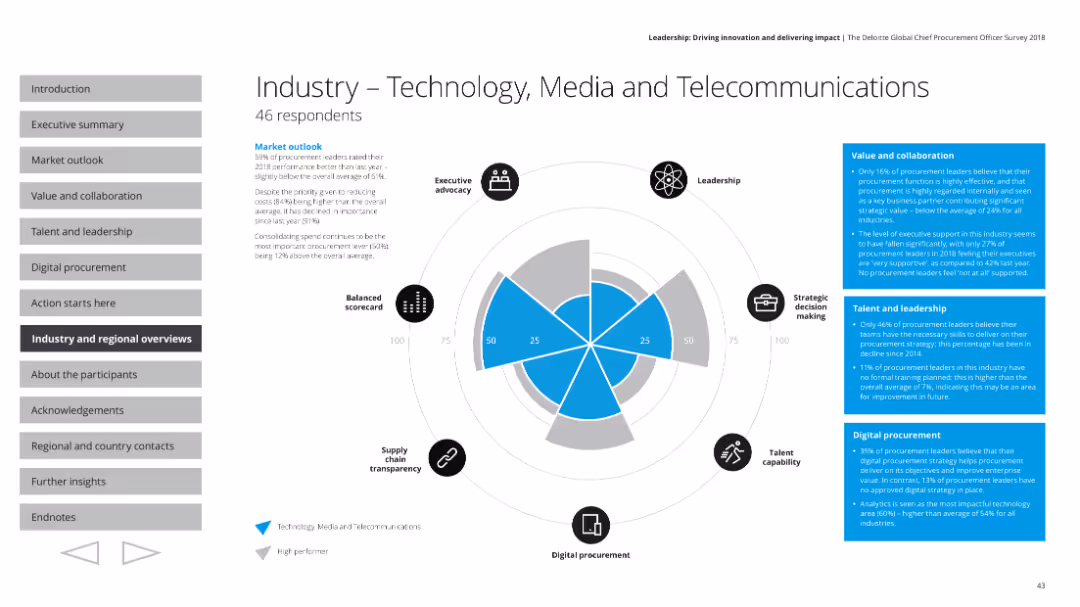
This slide features a radar chart with various performance metrics, accompanied by text boxes containing survey results and small icons for different performance aspects.
Industry Overview
Technology & Software
The slide provides an overview of the technology, media, and telecommunications industry's procurement performance from a survey. It covers executive advocacy, leadership, strategic decision making, talent capability, digital procurement, and supply chain transparency, with a market outlook and specific metrics on value, collaboration, talent, and leadership.
Technology, media, telecommunications, procurement, radar chart
false
Industry Overview
Technology & Software
Mixed Chart
Deloitte
Add to my slides
Remove from favorites
Three circular diagrams, percentage figures, green theme
Technology and Digital Transformation
Technology & Software
Discusses readiness and impact of technology in business
Technology, readiness, business impact
false
Technology and Digital Transformation
Technology & Software
Multiple Chart
Deloitte
Add to my slides
Remove from favorites
The slide has a dark background with a highlighted yellow text box containing a quote. It includes a question and four circular charts with percentages showing responses.
Technology and Digital Transformation
Healthcare & Pharmaceuticals
The slide discusses Australian consumers' openness to personalized medicine, genetic testing, and non-urgent care in retail locations, using wearables, and sensors.
Technology-enhanced care, personalized medicine, genetic testing, wearables, Australia
false
Technology and Digital Transformation
Healthcare & Pharmaceuticals
Mixed Chart
EY
Add to my slides
Remove from favorites
The slide has a dark background, a yellow text box for the quote, and a question followed by four circular charts with percentages showing consumer preparedness for tech care.
Technology and Digital Transformation
Healthcare & Pharmaceuticals
This slide discusses Canadian consumers' openness to personalized medicine, genetic testing, and non-urgent care in retail locations, using wearables, and sensors.
Technology-enhanced care, personalized medicine, genetic testing, wearables, Canada
false
Technology and Digital Transformation
Healthcare & Pharmaceuticals
Mixed Chart
EY
Add to my slides
Remove from favorites
Features a vertical bar chart comparing potential business and societal impacts with a detailed legend and value breakdowns. Visual elements are well-organized for clear data presentation.
Market Analysis and Trends
Telecommunications
Analyzes the potential $2 trillion value from digitalization in telecommunications, detailing impacts on different digital themes and societal benefits.
Telecommunications, Digitalization, Societal Impact, Business Value, Emissions Reduction
false
Market Analysis and Trends
Telecommunications
Mixed Chart
Accenture
Add to my slides
Remove from favorites
This slide presents a bar chart and a stacked area chart. The color palette is purple and gray, showing statistics on the nbn™ network's reach and data downloads in Australia.
Industry Overview
Telecommunications
The slide depicts the growth in the nbn™ network's home broadband plans and data downloads, indicating the network's significant role in Australia's internet connectivity.
Telecommunications, Internet, nbn™, Australia, Data Downloads, Home Broadband, Connectivity, Growth, Market Share, Network
false
Industry Overview
Telecommunications
Multiple Chart
Accenture
Add to my slides
Remove from favorites
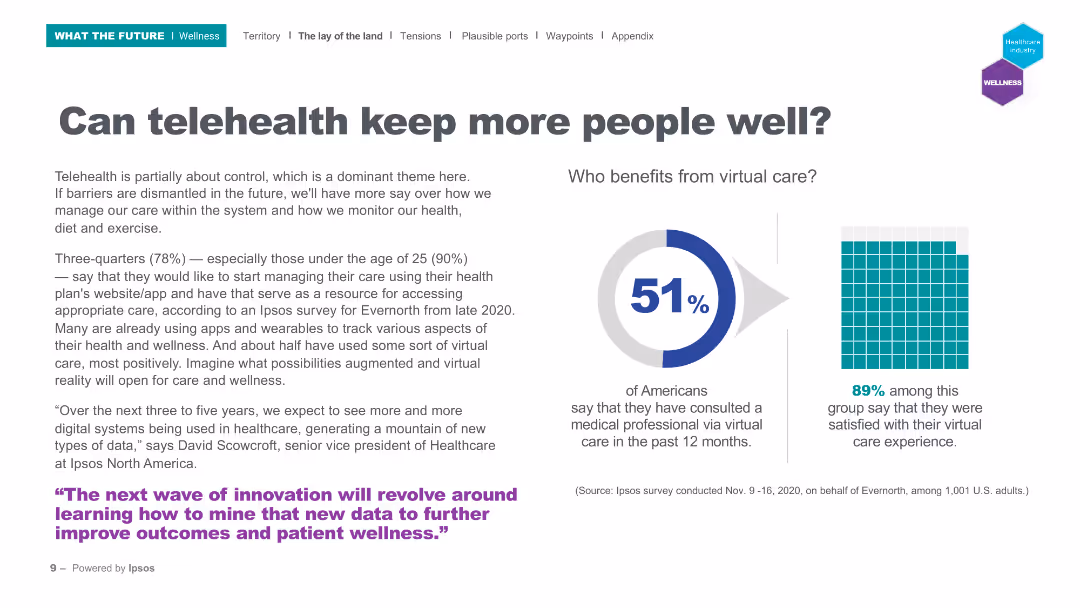
The slide includes a pie chart showing the percentage of Americans who have used virtual care and a grid chart on satisfaction with virtual care.
Technology and Digital Transformation
Healthcare & Pharmaceuticals
This slide discusses the adoption of telehealth, with 51% of Americans having used virtual care and 89% of those users being satisfied. It emphasizes the potential of telehealth to improve patient wellness.
Telehealth, virtual care, patient satisfaction, digital health, wellness
false
Technology and Digital Transformation
Healthcare & Pharmaceuticals
Mixed Chart
IPSOS
Add to my slides
Remove from favorites
Features a central circular diagram with Telemedicine at the core, surrounded by four connected circles representing different sectors. The slide uses a clean and simple design with blue and grey colors.
Market Analysis and Trends
Healthcare & Pharmaceuticals
The slide discusses the rapid expansion and commercial interest in Telemedicine platforms during the COVID-19 pandemic, highlighting partnerships and market consolidation as key trends.
Telemedicine, COVID-19, Expansion, Partnerships, Market Consolidation, Healthcare, Platforms, Commercial Interest, Trends, Land Grab
false
Market Analysis and Trends
Healthcare & Pharmaceuticals
Mixed Chart
Bain
Add to my slides
Remove from favorites
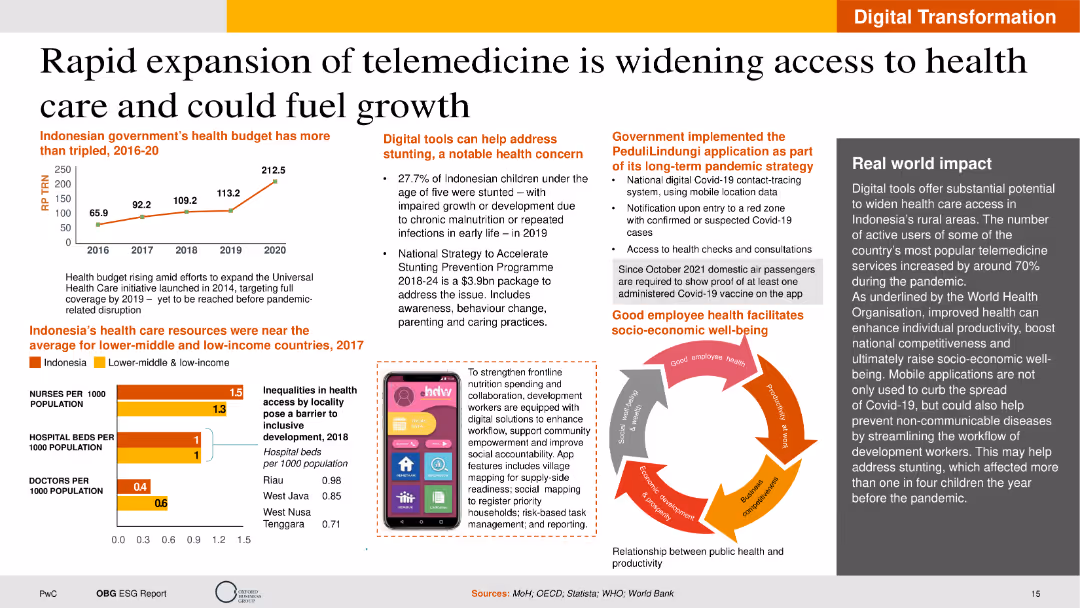
The slide features text sections on telemedicine growth, a line chart of the health budget, and an infographic on healthcare resources. The layout is visually engaging with a balanced mix of text and graphics.
Technology and Digital Transformation
Healthcare & Pharmaceuticals
This slide discusses the growth of telemedicine in Indonesia, focusing on healthcare access improvement, budget increases, and digital tools to address health concerns. It provides insights into the potential benefits of telemedicine for socio-economic development.
Telemedicine, Healthcare, Digital Tools, Indonesia, Growth
false
Technology and Digital Transformation
Healthcare & Pharmaceuticals
Multiple Chart
PwC/Strategy&
Add to my slides
Remove from favorites
The slide has a color-coded, segmented arrow graphic that illustrates various contributions of the Tempest program. The design is professional, using a mix of red, black, and white color scheme with clear, bold fonts and highlighted numerical data. The layout is moderately dense with text and graphical elements.
Industry Overview
Government & Public Sector
This slide provides an overview of the Tempest programme’s economic impact, job creation, and regional contribution from 2021 to 2050. It is used to demonstrate the significance of a government defense project in terms of economic and employment benefits.
Tempest programme, GDP contribution, employment, economic impact, long-term value, productivity, regional benefits
false
Industry Overview
Government & Public Sector
Diagram
PwC/Strategy&
Add to my slides
Remove from favorites
The slide is cleanly laid out with three distinct sections. On the left, a red box contains key terminology with bullet points. The central area outlines the structure of the report with headers and text. The right side lists other sections of the report in a similar format.
Strategic Planning
Industrial & Manufacturing
The slide breaks down the structure of a report on the economic contribution of the Tempest programme using Input-Output modelling. It introduces key terminology and outlines the wider impact of the programme including R&D spillover effects and skills development.
Tempest programme, economic contribution, GVA, R&D spillover, skills development, report structure, input-output modelling
false
Strategic Planning
Industrial & Manufacturing
Boxed
PwC/Strategy&
Add to my slides
Remove from favorites
The layout features a title at the top, a main text body on the left, and a smaller text section on the right. The lower half visualizes a timeline using an arrow, indicating progress from 2021 to 2050. The design is neat and conveys progression.
Market Analysis and Trends
Government & Public Sector
Discussing the economic impact of the Tempest program from 2021 to 2050, the slide details stages from concept to service entry, with predictions on GVA and employment contributions. Ideal for discussing long-term economic strategies or defense-related economic forecasting.
Tempest, Economic Impact, GVA, Employment, 2050, UK Defense
false
Market Analysis and Trends
Government & Public Sector
Linear Flow
PwC/Strategy&
Add to my slides
Remove from favorites
Predominantly text-based with red highlighted sections, and bullet points to break up the information. Infographics and strategic icons accentuate key points.
Technology and Digital Transformation
Government & Public Sector
This slide outlines the contributions of the Tempest programme to the UK’s R&D and defence, highlighting economic benefits, collaboration, and innovation across sectors.
Tempest, R&D, defence, innovation, UK, economy, collaboration, sectors, development
false
Technology and Digital Transformation
Government & Public Sector
Text Only
PwC/Strategy&
Add to my slides
Remove from favorites
A text-heavy slide that incorporates a bar graph, showing the increasing percentage share of the Tempest programme in UK Combat Air activities. The use of red to denote the data is effective, and the overall design is clean and straightforward.
Market Analysis and Trends
Industrial & Manufacturing
Analyzes the growth in employment and GVA contributions of the Tempest programme over time, forecasting its increasing significance in the Combat Air sector.
Tempest, UK Combat Air, employment, GVA, growth, forecast, economic contribution, market share
false
Market Analysis and Trends
Industrial & Manufacturing
Mixed Chart
PwC/Strategy&
Add to my slides
Remove from favorites
Features icons and descriptive boxes outlining wider contributions, with a straightforward, moderate design complexity.
Strategic Planning
Industrial & Manufacturing
The slide illustrates various wider contributions of the Tempest programme, such as skill spillovers, R&D spillovers, and regional development, aligning with government objectives.
Tempest, development, government, UK
false
Strategic Planning
Industrial & Manufacturing
Header Vertical
PwC/Strategy&
Add to my slides
Remove from favorites
A data-rich slide with multiple bar graphs representing regional economic impacts. The slide is text-heavy with key statistics highlighted.
Technology and Digital Transformation
Government & Public Sector
Focuses on the economic contribution of the Tempest programme to various UK regions, presenting data and graphs on regional impact and productivity.
Tempest, economic contribution, UK, regions, impact, productivity, data
false
Technology and Digital Transformation
Government & Public Sector
Multiple Chart
PwC/Strategy&
Add to my slides
Remove from favorites
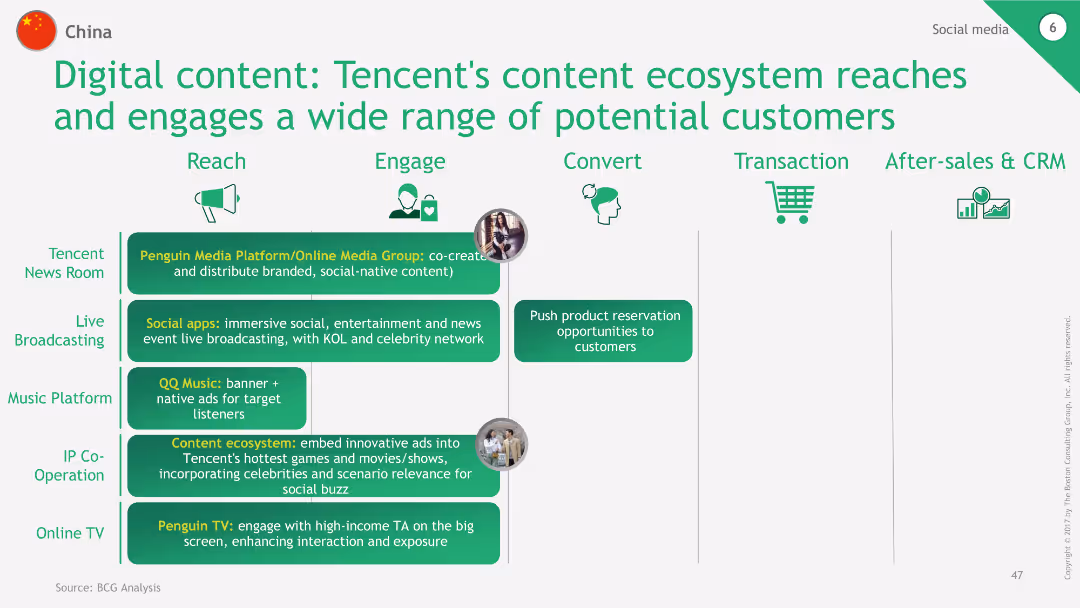
The slide uses a process flow diagram to show Tencent's content ecosystem, highlighting platforms like Penguin Media, Live Broadcasting, QQ Music, and Penguin TV. It demonstrates how these platforms reach, engage, and convert customers, ending with transaction and after-sales & CRM stages.
Technology and Digital Transformation
Consumer Goods
This slide demonstrates the wide reach and engagement of Tencent's content ecosystem, showing how various platforms and services interact with customers through different stages of the shopping journey, from reach to after-sales.
Tencent, content ecosystem, engagement, conversion, CRM
false
Technology and Digital Transformation
Consumer Goods
Table
BCG
Add to my slides
Remove from favorites
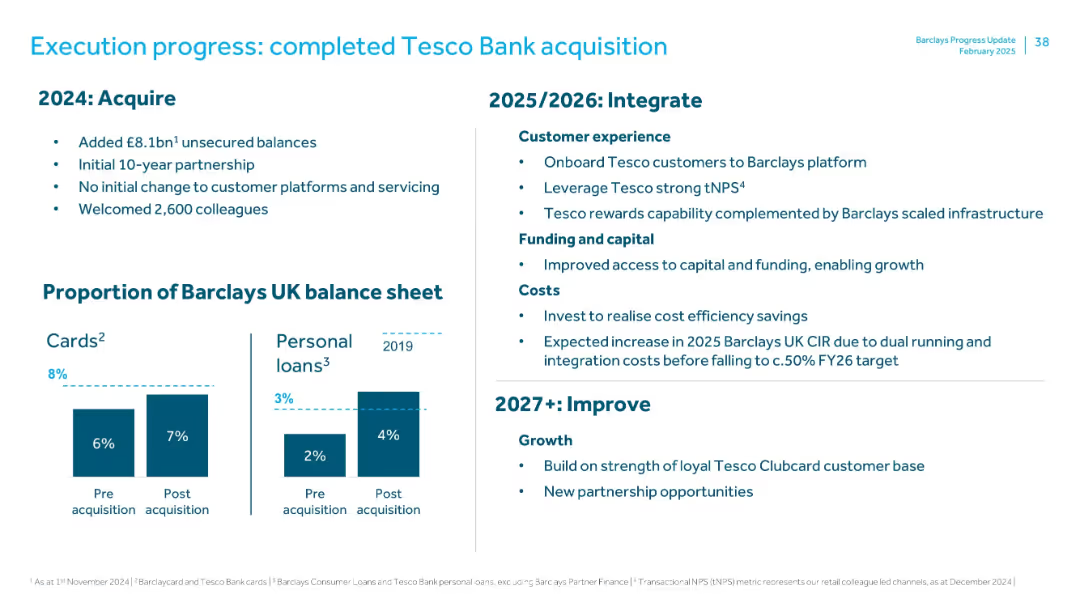
Split layout with bullet points on left, timeline structure on right, and bar charts at bottom. Clean, corporate design.
Mergers and Acquisitions
Financial Services
Details the acquisition of Tesco Bank by Barclays, including key metrics from 2024 (e.g., £8.1bn unsecured balances, 2,600 employees onboarded), integration plans for 2025–2026 (customer experience, capital, and cost considerations), and future improvements (growth, new partnerships). Also includes balance sheet impact visuals.
Tesco Bank, acquisition, integration, balance sheet, Barclays, M&A, unsecured debt, tNPS, CIR
false
Mergers and Acquisitions
Financial Services
Mixed Chart
Barclays
Add to my slides
Remove from favorites
The slide has a title at the top with three column charts in blue and grey, denoting percentages. It includes three sources: Google, TEMASEK, BAIN & COMPANY. The layout is clean with text labels for each chart.
Market Analysis and Trends
Technology & Software
This slide presents data on the growth of digital consumers in Thailand, including internet service adoption, continuity post-COVID-19, and average hours spent online. Ideal for discussing market potential and consumer behavior trends.
Thailand, Digital Consumers, Internet Economy Services, COVID-19, Usage Hours, Market Analysis, Growth, User Engagement, Consumer Trends
false
Market Analysis and Trends
Technology & Software
Multiple Chart
Bain
Add to my slides
Remove from favorites
The slide features multiple column charts showing growth in different sectors of Thailand's digital economy with forecast data. It's color-coded for clarity.
Market Analysis and Trends
Technology & Software
Shows the anticipated impact of travel recovery on Thailand's digital economy, suggesting a significant push towards growth by 2025.
Thailand, Digital Economy, Travel Recovery, Growth Impact, E-commerce, Online Travel, Transport, Food, 2025
false
Market Analysis and Trends
Technology & Software
Multiple Chart
Bain
Add to my slides
Remove from favorites
Divided into two sections, the left side presents column charts for e-Commerce, and the right side shows column charts for Transport & Food and Online Media. The slide utilizes shades of blue, with clear labels and percentage changes. Bain Analysis source.
Market Analysis and Trends
Technology & Software
Highlights how e-Commerce growth compensates for travel sector losses in Thailand, offering insights for strategic adjustments in business models post-pandemic.
Thailand, E-Commerce Growth, Travel Decline, Sector Comparison, Digital Economy, COVID-19 Impact, Market Strategy, Adaptation, Resilience
false
Market Analysis and Trends
Technology & Software
Multiple Chart
Bain
Add to my slides
Remove from favorites
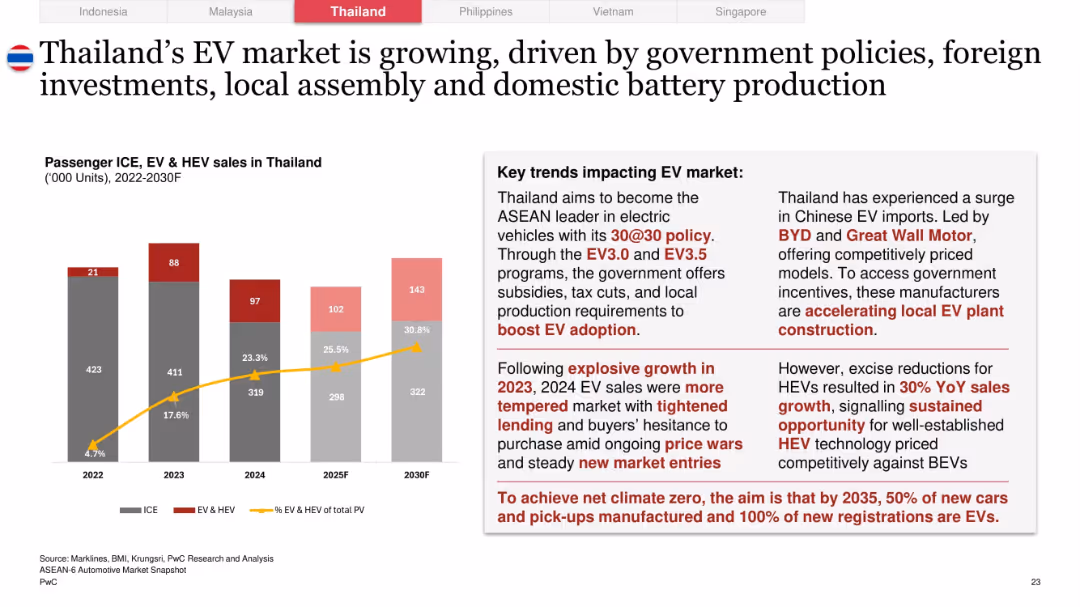
Left section features bar and line graph for EV/ICE trends 2022–2030F; right section has detailed narrative on EV policies and challenges
Technology and Digital Transformation
Industrial & Manufacturing
Thailand’s EV market sees strong growth in 2023, with 30% EV target by 2030. Government subsidies, local production, and rising Chinese imports fuel the transition. Market cooling in 2024 due to price sensitivity and lending tightness is noted.
Thailand, EV policy, BEV vs HEV, 30@30, Chinese EVs, BYD, price sensitivity, local assembly, carbon goals
false
Technology and Digital Transformation
Industrial & Manufacturing
Mixed Chart
PwC/Strategy&
Add to my slides
Remove from favorites
The slide has a clear column chart with historical data for 2015 & 2019 and projected for 2020 & 2025. Minimal text is present with a source citation at the bottom. Colors are used to distinguish between years, and percentage growth is indicated above columns.
Market Analysis and Trends
Technology & Software
The slide represents the growth of Thailand's internet economy, showing a significant increase from 2015 to a forecast for 2025. The focus is on the e-commerce sector's contribution to the economy with a CAGR indication.
Thailand, Internet Economy, Growth, E-commerce, CAGR, Projection, Analysis, 2015, 2025, Bain Analysis
false
Market Analysis and Trends
Technology & Software
Single Chart
Bain
Add to my slides
Remove from favorites
Contains a sequence of blue column charts representing deal value across years, with a title at the top and a key indicating the number of deals. Source includes industry reports and Bain Analysis.
Investment Analysis
Financial Services
Showcases the increasing investment in Thailand's Internet sector, useful for stakeholders analyzing the funding landscape and identifying investment trends.
Thailand, Internet Sector, Investment Trends, Deal Value, Market Analysis, Funding Landscape, Venture Capital, Financial Growth, Sector Analysis
false
Investment Analysis
Financial Services
Single Chart
Bain
Add to my slides
Remove from favorites
Image of a temple with accompanying text about PromptPay, Thailand's instant payment system, and a line chart showing growth in transactions.
Market Analysis and Trends
Financial Services
Details the rapid growth and adoption of PromptPay in Thailand, emphasizing its impact on payment methods and transaction values.
Thailand, PromptPay, payments, growth, transactions, financial, services, instant, system
false
Market Analysis and Trends
Financial Services
Mixed Chart
PwC/Strategy&
Add to my slides
Remove from favorites
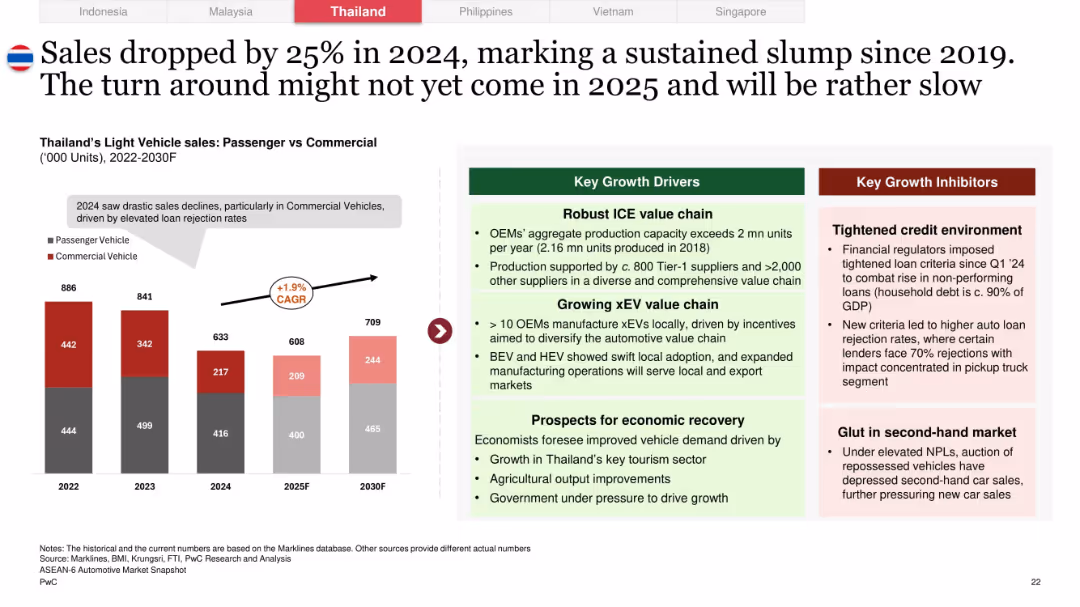
Side-by-side format: bar chart showing passenger vs commercial vehicle sales 2022–2030F, growth factors and inhibitors in colored boxes
Market Analysis and Trends
Industrial & Manufacturing
Shows a 25% decline in Thailand’s auto sales for 2024, with commercial vehicle drop being most severe. Key reasons include high loan rejections and tight credit. Growth opportunities lie in a robust ICE value chain, EV manufacturing, and macroeconomic recovery.
Thailand, automotive slump, credit risk, ICE value chain, vehicle sales forecast, pickup trucks, CAGR, EV transition
false
Market Analysis and Trends
Industrial & Manufacturing
Mixed Chart
PwC/Strategy&
Add to my slides
Remove from favorites
Slide features multiple infographics, including a column chart and a detailed roadmap. The design is dense with data, focusing on Thailand's environmental strategies and challenges.
Regulatory and Compliance
Energy & Utilities
Analyzes Thailand's environmental strategies and the required government actions to meet carbon reduction goals, highlighting the roles of infrastructure and fiscal policies.
Thailand, carbon reduction, environmental policy, government strategy, infrastructure
false
Regulatory and Compliance
Energy & Utilities
Mixed Chart
Bain
Add to my slides
Remove from favorites
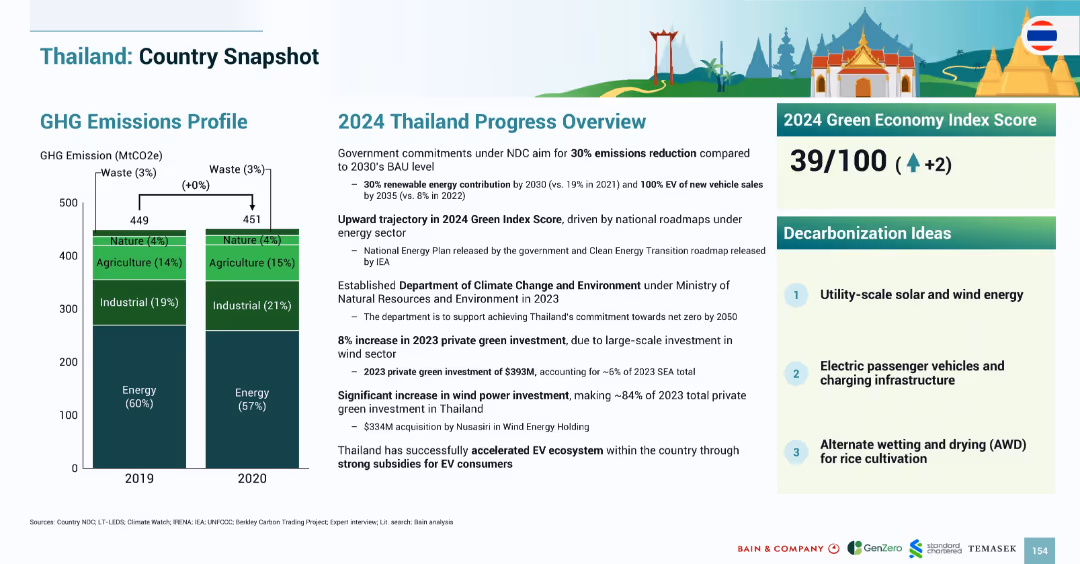
Layout mirrors previous country snapshots with emissions bar chart, 2024 progress narrative, index score, and decarbonization ideas.
Strategic Planning
Government & Public Sector
Thailand’s emissions profile remained stable between 2019–2020. The 2024 Green Index Score increased to 39/100. Green investments reached $393M in 2023, driven by wind power. Strategies emphasize EV adoption, utility-scale renewables, and rice cultivation water management.
Thailand, emissions, EV, wind power, solar, agriculture, AWD, 2024, Green Index
false
Strategic Planning
Government & Public Sector
Mixed Chart
Bain
Add to my slides
Remove from favorites
Contains several small images of agricultural activities, solar panels, and wind turbines, accompanied by text blocks and bullet points summarizing the investment environment in Thailand.
Market Analysis and Trends
Energy & Utilities
Provides insights into Thailand's agricultural, solar, wind energy, and electric mobility sectors, emphasizing government and financial support.
Thailand, farming, solar, wind, electric mobility, government support
false
Market Analysis and Trends
Energy & Utilities
Header Horizontal
Bain
Add to my slides
Remove from favorites
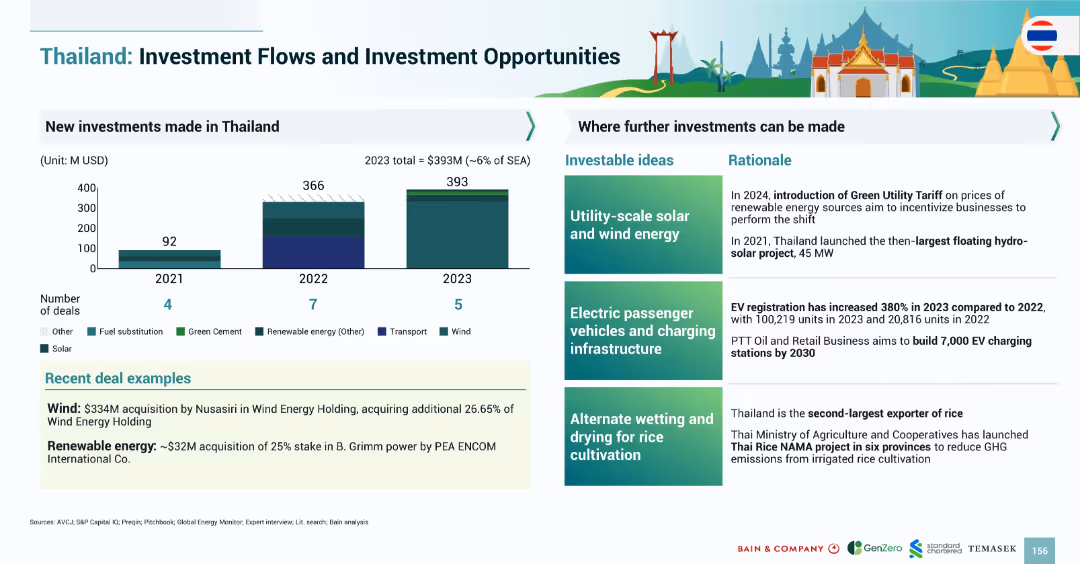
Split layout: bar chart (left) showing new investments (2021–2023), and right section with investment ideas and rationale; colorful, infographic style.
Investment Analysis
Environmental Services & Sustainability
The slide details new investments in Thailand's renewable energy and related sectors from 2021–2023. It identifies key areas for future investment, including solar/wind energy, EV infrastructure, and rice cultivation methods, supported by rationale and recent deals.
Thailand, investment, renewable energy, solar, wind, EV infrastructure, agriculture, floating solar, charging stations
false
Investment Analysis
Environmental Services & Sustainability
Mixed Chart
Bain
Add to my slides
Remove from favorites
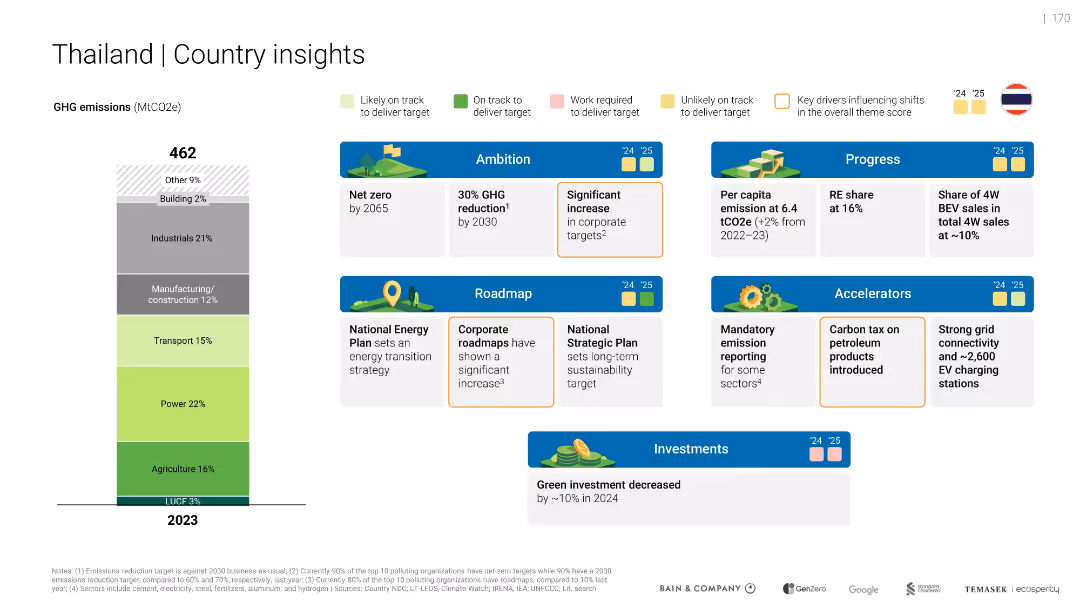
Vertical emissions bar and structured layout of “Ambition”, “Progress”, “Roadmap”, and “Accelerators” sections. Color-coded performance markers and icons.
Strategic Planning
Government & Public Sector
Shows Thailand’s 2023 emissions by sector and outlines policy actions, targets, and performance in green initiatives. Highlights mixed progress toward targets and mentions a 10% green investment decrease in 2024.
Thailand, net zero, roadmap, emission reporting, investment drop
false
Strategic Planning
Government & Public Sector
Mixed Chart
Bain
Add to my slides
Remove from favorites
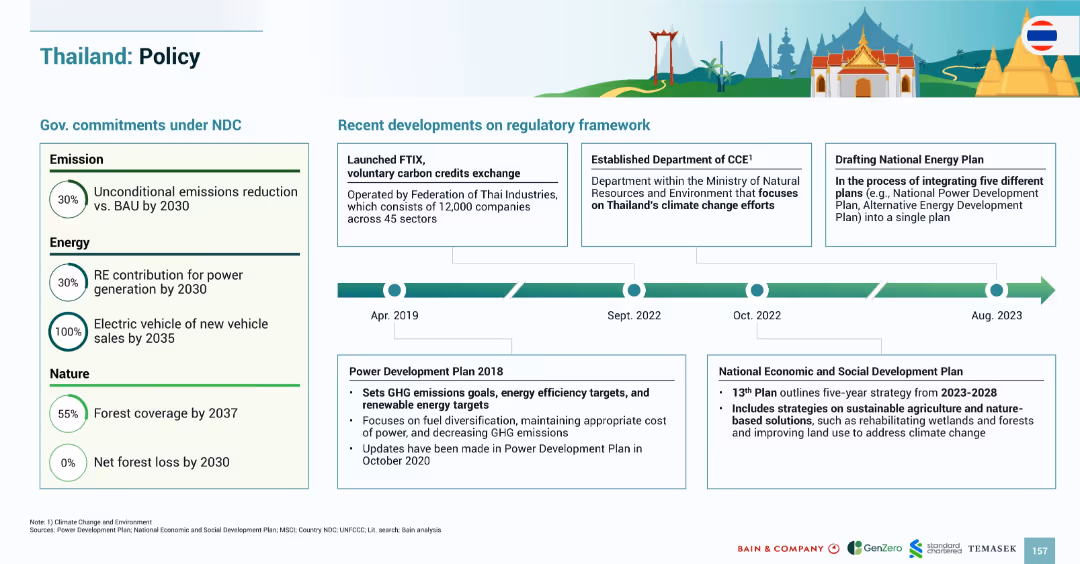
Two-part layout: government commitments on the left, regulatory developments on the right with timeline (2018–2023); clean, infographic design.
Regulatory and Compliance
Government & Public Sector
Summarizes Thailand’s climate-related policy framework. It outlines commitments under the NDC in emissions, energy, and forest conservation, and highlights key regulatory milestones including carbon credit exchange and integrated energy planning efforts.
Thailand, policy, carbon credits, renewable energy, electric vehicles, forest conservation, emissions, regulation
false
Regulatory and Compliance
Government & Public Sector
Mixed Chart
Bain
Add to my slides
Remove from favorites
The slide features multiple data visualizations including a mekko chart showing investment flows by theme, and smaller logos and text elements detailing investor activity and examples.
Investment Analysis
Energy & Utilities
Discusses investment trends in Thailand focusing on renewable energy and infrastructure, highlighting specific deals and active investors.
Thailand, renewable energy, infrastructure, investment, bar chart
false
Investment Analysis
Energy & Utilities
Single Chart
Bain
Add to my slides
Remove from favorites
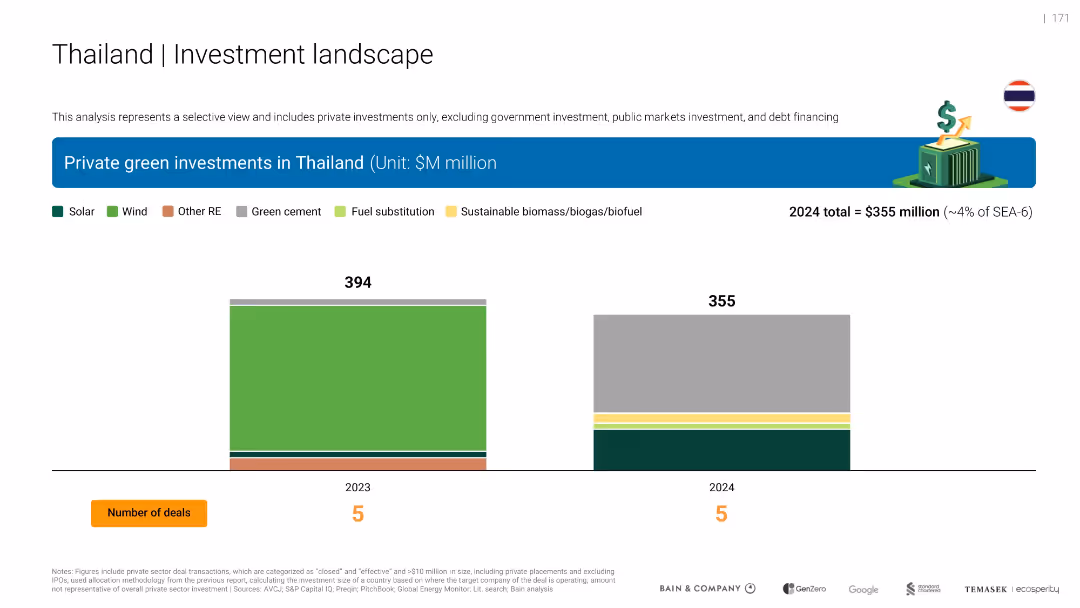
Dual bar chart for 2023 and 2024 green private investments in Thailand, broken down by solar, wind, and other RE. Color-coded bars and number of deals included.
Investment Analysis
Environmental Services & Sustainability
Compares Thailand’s private green investments from 2023 ($394M) to 2024 ($355M), showing a slight decline. Investment sectors include solar, wind, biomass, and cement. Each year had 5 deals.
Thailand, solar, wind, RE, investment decline, biomass, cement, 2024
false
Investment Analysis
Environmental Services & Sustainability
Single Chart
Bain
Add to my slides
Remove from favorites
Shows a column chart depicting the growth in assets under management for thematic equity funds, alongside a list of fund offerings and key differentiators.
Product and Service Analysis
Financial Services
The slide presents the launch and growth of a thematic equity fund family, emphasizing fund performance and the strategic approach to equity selection.
Thematic Equity, Fund Family, Assets Under Management, Equity Funds, Performance
false
Product and Service Analysis
Financial Services
Mixed Chart
Credit Suisse
Add to my slides
Remove from favorites
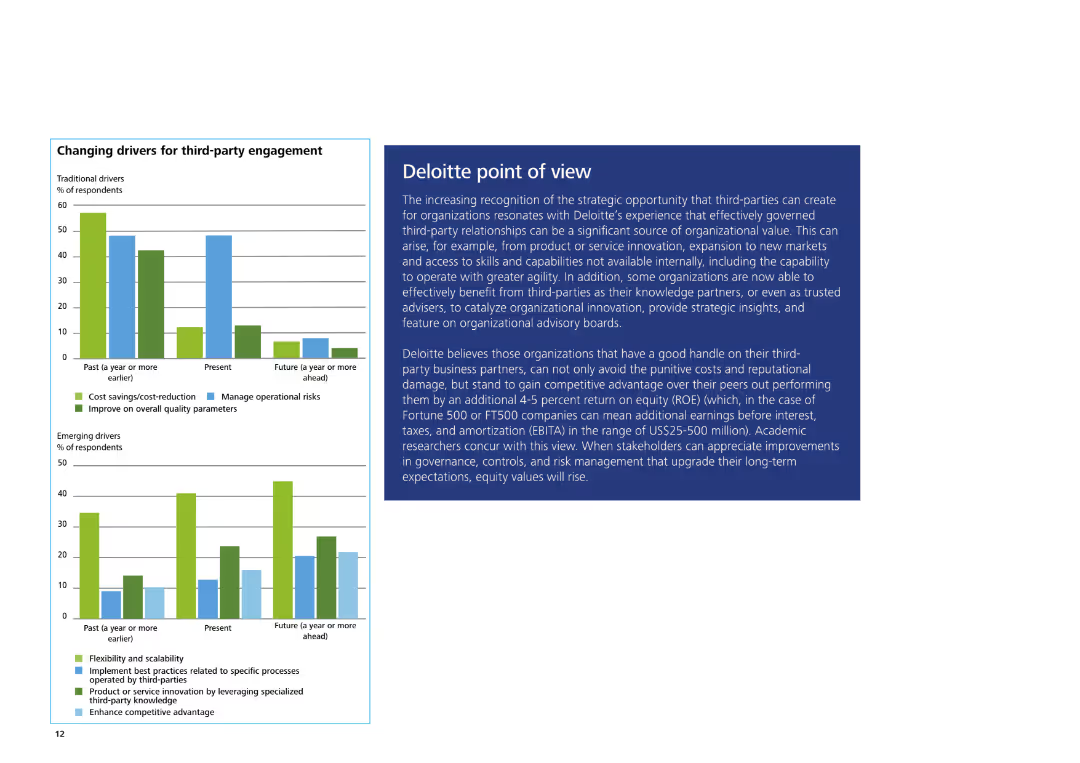
The slide features a column chart on the left showing traditional and emerging drivers for third-party engagement. On the right, there is a text box with Deloitte's POV.
Strategic Planning
Professional Services
The slide explains Deloitte's view on the strategic opportunities of third-party engagement, highlighting benefits, competitive advantage, and key organizational insights.
Third-party engagement, Deloitte, strategic opportunities, competitive advantage, organizational insights
false
Strategic Planning
Professional Services
Multiple Chart
Deloitte
Add to my slides
Remove from favorites
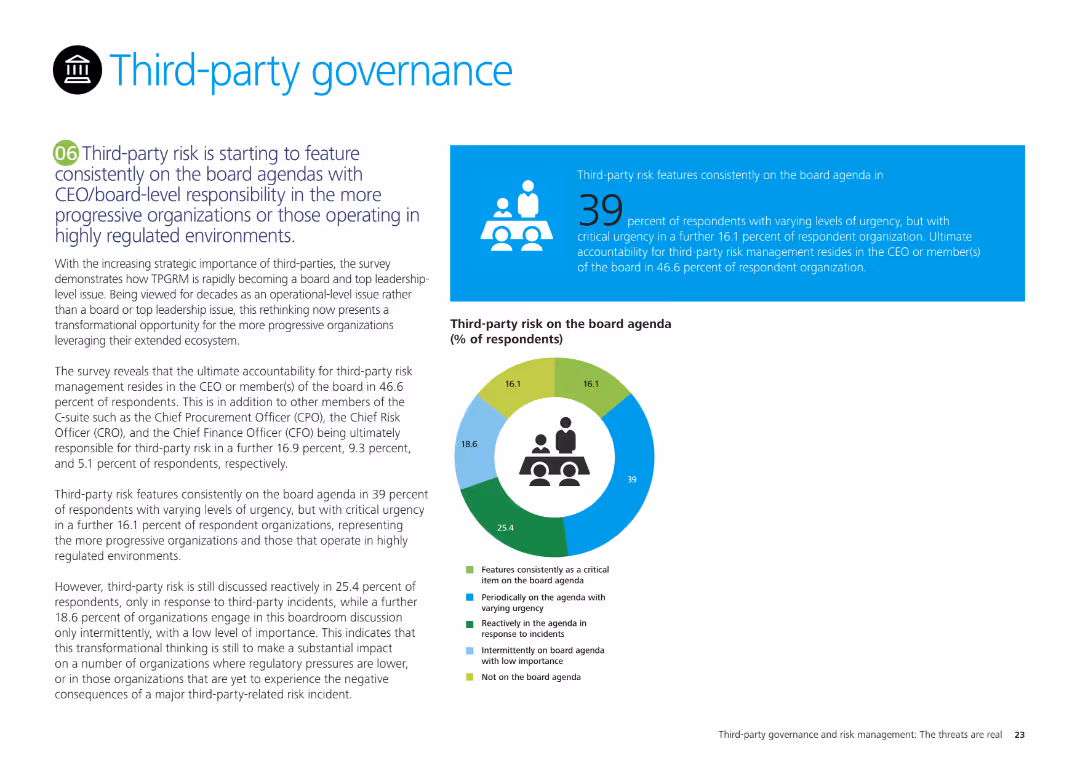
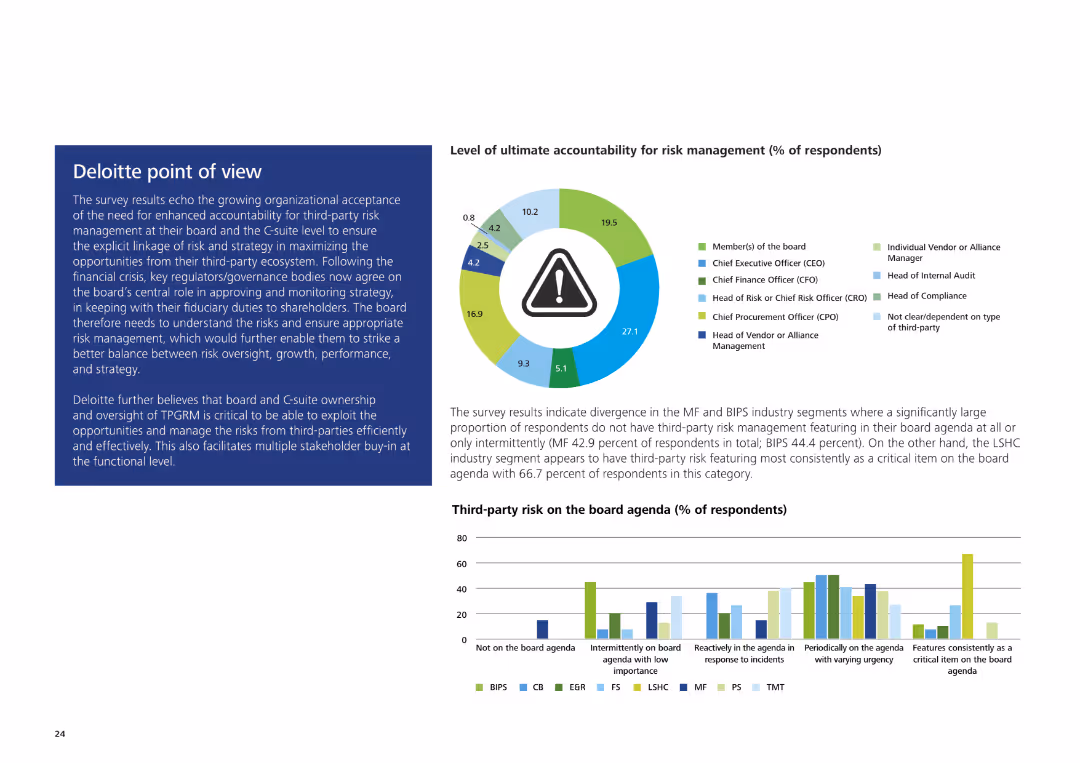
The slide features a pie chart showing the percentage of third-party risk on board agendas and a text box discussing third-party governance trends.
Regulatory and Compliance
Professional Services
It highlights the growing importance of third-party risk in board agendas, detailing survey results on the frequency and urgency of third-party risk discussions at the board level.
Third-party governance, board agendas, risk management, survey results, compliance
false
Regulatory and Compliance
Professional Services
Mixed Chart
Deloitte
Add to my slides
Remove from favorites
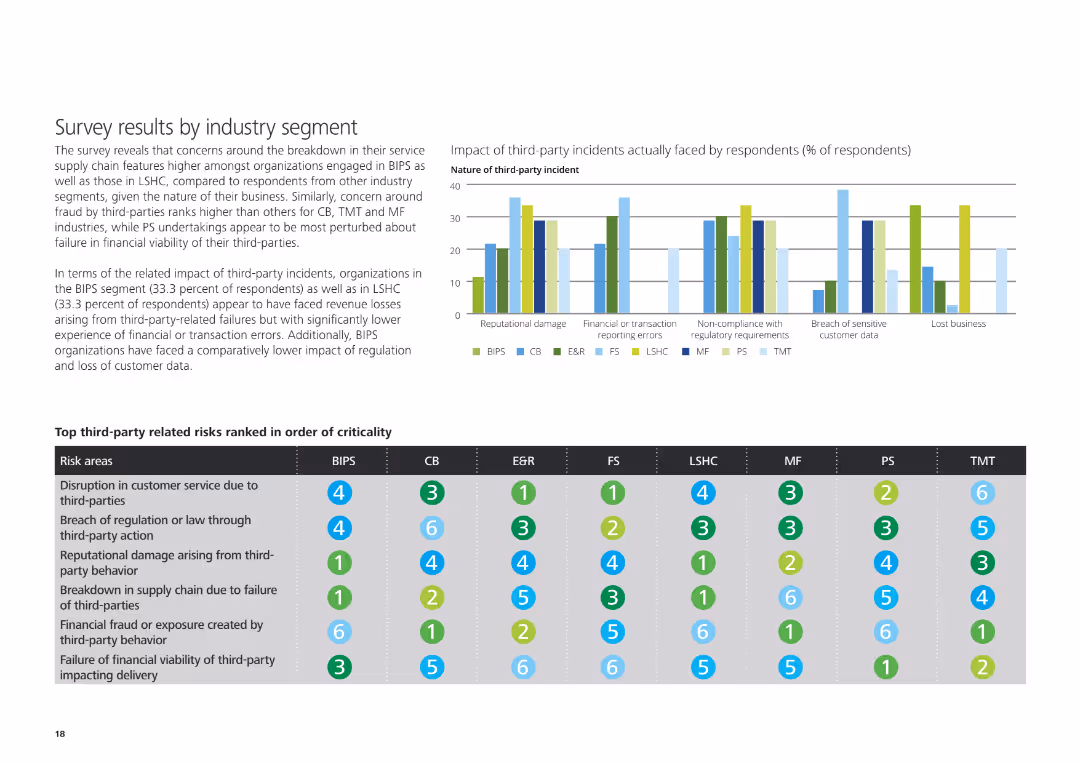
The slide features a column chart on the left showing the impact of third-party incidents, and a table below ranking top third-party risks by industry segment.
Risk Assessment and Management
Professional Services
The slide reveals survey results about the impact of third-party incidents and lists top third-party related risks ranked by criticality across different industry segments.
Third-party incidents, impact, risks, industry segment, survey results
false
Risk Assessment and Management
Professional Services
Mixed Chart
Deloitte
Add to my slides
Remove from favorites
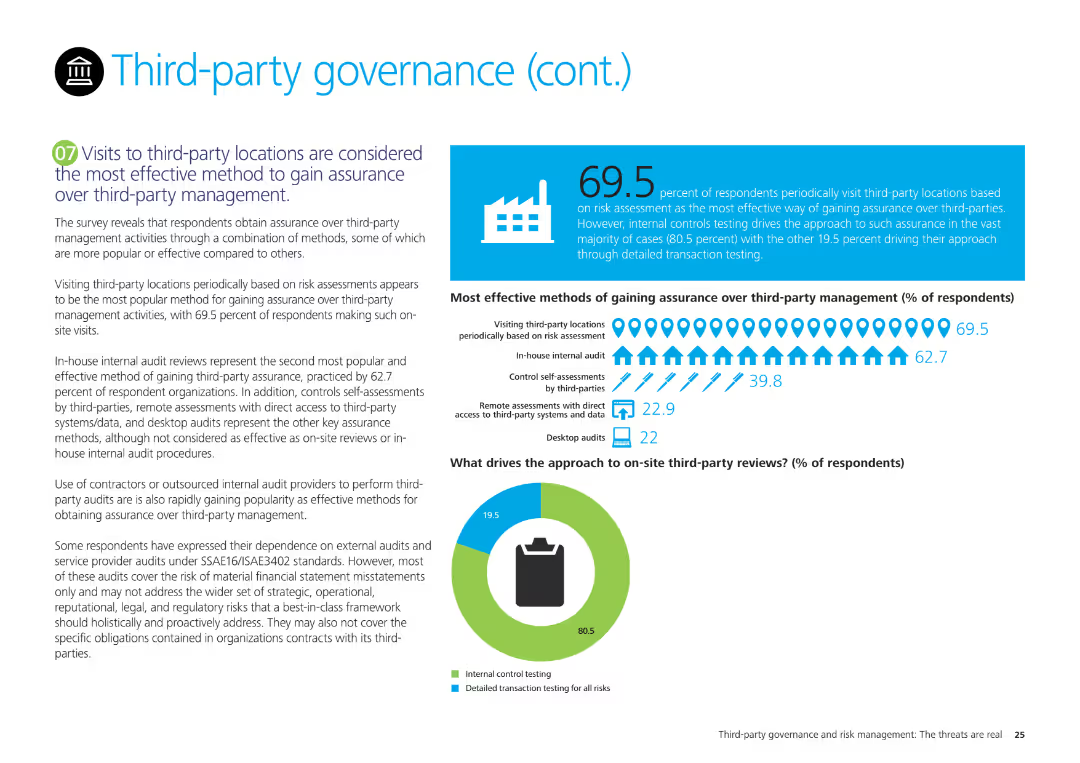
The slide features a pie chart on third-party review approaches and a column chart on methods for gaining assurance over third-party management, with explanatory text.
Regulatory and Compliance
Professional Services
It examines survey results on the most effective methods for gaining assurance over third-party management, emphasizing site visits, internal audits, and controls self-assessments.
Third-party management, assurance, survey results, site visits, internal audits, controls self-assessments
false
Regulatory and Compliance
Professional Services
Mixed Chart
Deloitte
Add to my slides
Remove from favorites
The slide includes a pie chart showing levels of ultimate accountability for risk management and a text box with Deloitte's analysis on the right.
Strategic Planning
Professional Services
The slide discusses survey results about organizational acceptance of third-party risk management accountability at the board and C-suite levels, emphasizing strategic opportunities.
Third-party risk management, accountability, Deloitte, board level, C-suite, strategic opportunities
false
Strategic Planning
Professional Services
Multiple Chart
Deloitte
Add to my slides
Remove from favorites
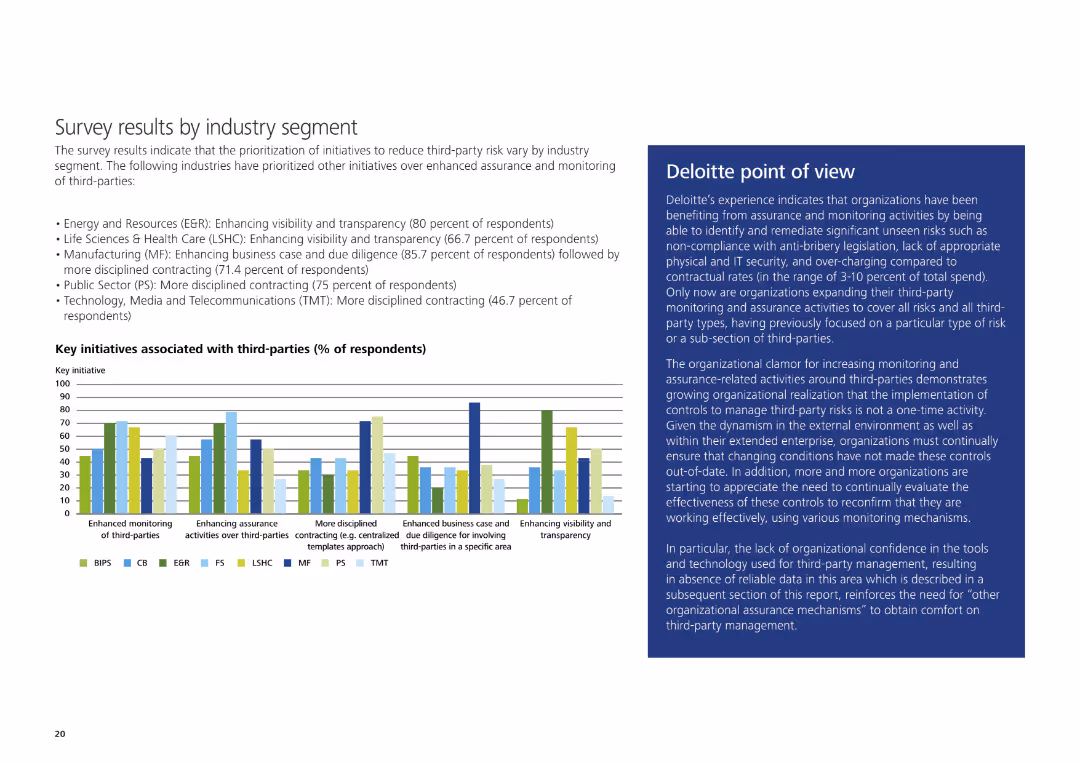
The slide includes a column chart displaying key initiatives associated with third-parties by industry segment and a text box with Deloitte's point of view on the right.
Market Analysis and Trends
Professional Services
It presents survey results on prioritization of initiatives to reduce third-party risk by industry segment, along with Deloitte's insights on third-party monitoring and assurance.
Third-party risk, key initiatives, industry segment, Deloitte, monitoring, assurance
false
Market Analysis and Trends
Professional Services
Mixed Chart
Deloitte
Add to my slides
Remove from favorites
Features a column chart with green and blue bars showing the use of third-party cyber services across various categories, like cyber cloud and infrastructure security.
Technology and Digital Transformation
Technology & Software
Discusses reliance on third-party cyber services, emphasizing the benefits and complexities of using external vendors for various cyber needs, supported by survey data.
Third-party services, cyber cloud, infrastructure security, data protection, vendor reliance
false
Technology and Digital Transformation
Technology & Software
Single Chart
Deloitte
Add to my slides
Remove from favorites
The slide features a column chart with green, blue, and dark gray bars indicating value seen from third-party cyber services across different categories.
Risk Assessment and Management
Technology & Software
Examines the value derived from third-party cyber services, emphasizing data protection, infrastructure security, and vendor management, supported by survey data.
Third-party services, vendor management, data protection, infrastructure security, cyber strategy
false
Risk Assessment and Management
Technology & Software
Mixed Chart
Deloitte
Add to my slides
Remove from favorites
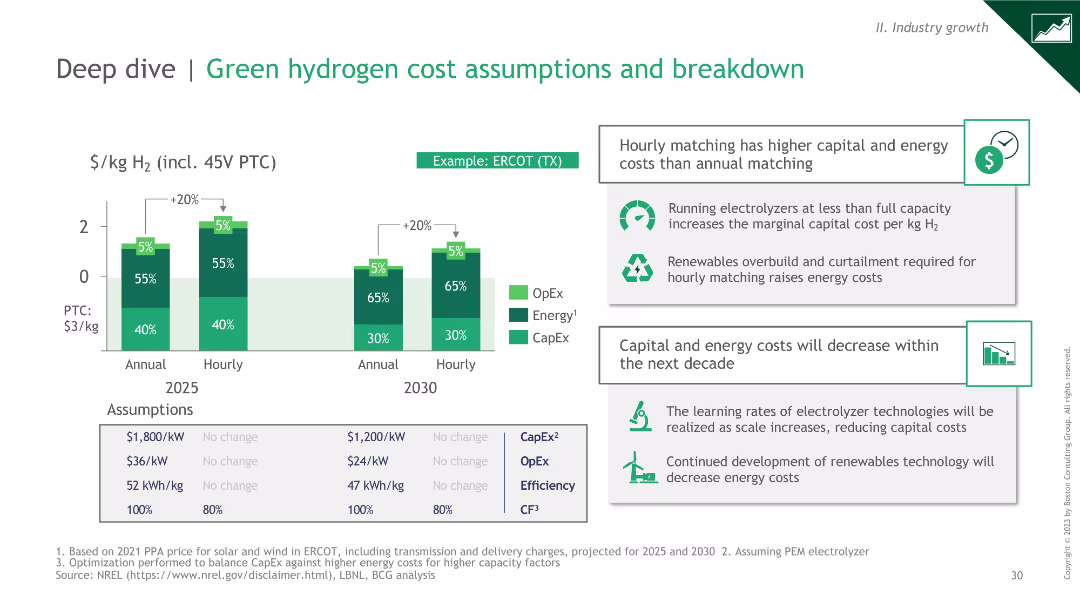
Column charts comparing OpEx, Energy, and CapEx for annual vs hourly matching in 2025 and 2030. Includes text boxes with insights on cost assumptions and learning rates.
Technology and Digital Transformation
Energy & Utilities
Column charts comparing OpEx, Energy, and CapEx for annual vs hourly matching in 2025 and 2030. Includes text boxes with insights on cost assumptions and learning rates.
This slide analyzes green hydrogen cost assumptions, focusing on the differences in costs between annual and hourly matching. It highlights key insights and future cost reductions.
false
Technology and Digital Transformation
Energy & Utilities
Mixed Chart
BCG
Add to my slides
Remove from favorites
Market Analysis and Trends
Financial Performance
Technology & Software
Slide includes a variety of column charts showing the projected growth of Indonesia's digital economy by sector. The color blue is predominantly used to highlight the future forecast.
This slide projects the robust growth of Indonesia's digital economy by 2025, focusing on the e-commerce sector despite broader macroeconomic challenges.
false
Financial Performance
Technology & Software
Multiple Chart
Bain
Add to my slides
Remove from favorites
Column charts show the development of the Tier 1 leverage ratio and changes in leverage exposure from 3Q22 to 4Q22.
Financial Performance
Financial Services
Describes the improvement in the Tier 1 leverage ratio due to capital raises and deleveraging, indicating strengthened financial leverage.
Tier 1 leverage, financial leverage, capital raises, deleveraging, banking metrics
false
Financial Performance
Financial Services
Multiple Chart
Credit Suisse
Add to my slides
Remove from favorites
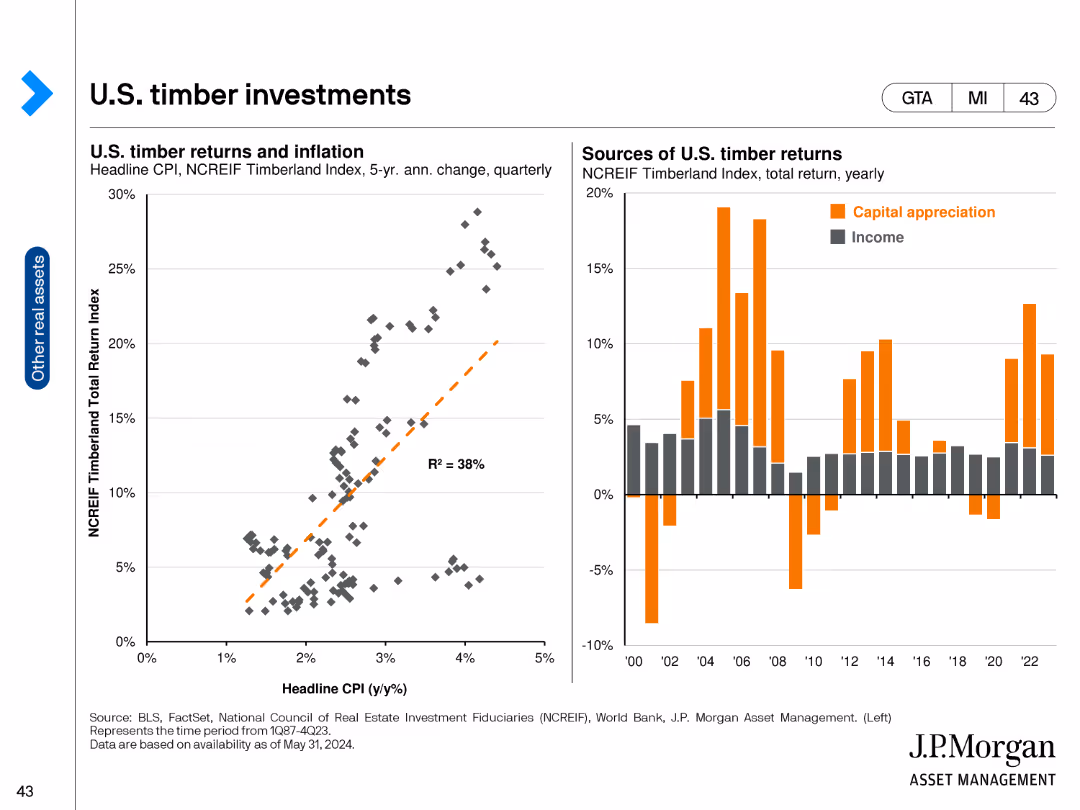
The slide contains two charts: a scatter plot on the left showing the relationship between U.S. timber returns and inflation, and a bar chart on the right displaying the sources of U.S. timber returns (capital appreciation and income) annually. The scatter plot includes a trend line, while the bar chart uses vertical bars in two colors to differentiate the sources of returns.
Investment Analysis
Real Estate & Construction
This slide examines the U.S. timber market, focusing on the relationship between timber returns and inflation, and detailing the annual sources of returns from timber investments. It is designed to provide insights for investors interested in timber as an asset class.
Timber investments, inflation, capital appreciation, income, asset class, investment analysis, U.S. timber market
false
Investment Analysis
Real Estate & Construction
Multiple Chart
JP Morgan
Add to my slides
Remove from favorites
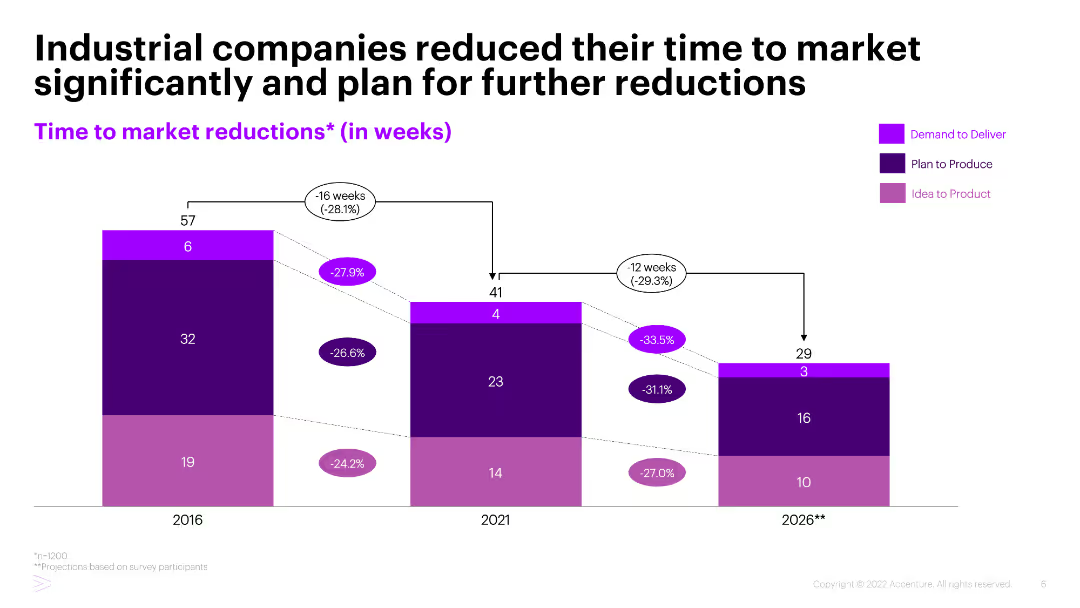
Stacked column chart showing time to market reductions in weeks from 2016 to 2026, divided into three processes: Demand to Deliver, Plan to Produce, and Idea to Product.
Performance Metrics and KPIs
Industrial & Manufacturing
The slide presents data on the reduction of time to market for industrial companies, with significant decreases observed and further reductions planned by 2026, segmented by process stages.
Time to market, Industrial companies, Performance metrics, KPIs, Process improvement
false
Performance Metrics and KPIs
Industrial & Manufacturing
Single Chart
Accenture
Add to my slides
Remove from favorites
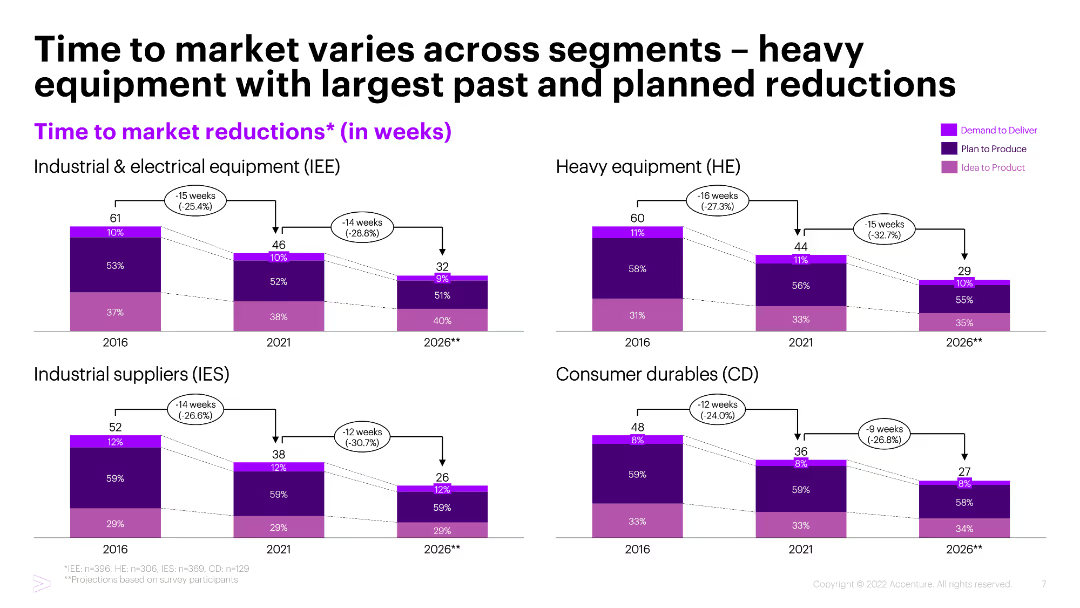
Four stacked column charts showing time to market reductions in weeks across different segments: Industrial & Electrical Equipment, Heavy Equipment, Industrial Suppliers, Consumer Durables.
Performance Metrics and KPIs
Industrial & Manufacturing
The slide compares time to market reductions across various industrial segments, highlighting heavy equipment as having the largest past and planned reductions.
Time to market, Industrial segments, Heavy equipment, Performance metrics, KPIs
false
Performance Metrics and KPIs
Industrial & Manufacturing
Multiple Chart
Accenture
Add to my slides
Remove from favorites
This slide is a visual timeline from 2017 to 2020, showing major milestones and events in the company’s history. It uses a green arrow to depict progress over time, with text boxes providing details on key initiatives and changes.
Strategic Planning
Financial Services
The slide outlines the company’s strategic journey, showcasing major milestones such as acquisitions and corporate changes. It is useful for illustrating a company's evolution, strategy execution, and future plans.
Timeline, Strategic Journey, Milestones, Company Evolution, Future Plans
false
Strategic Planning
Financial Services
Linear Flow
Morgan Stanley
Add to my slides
Remove from favorites
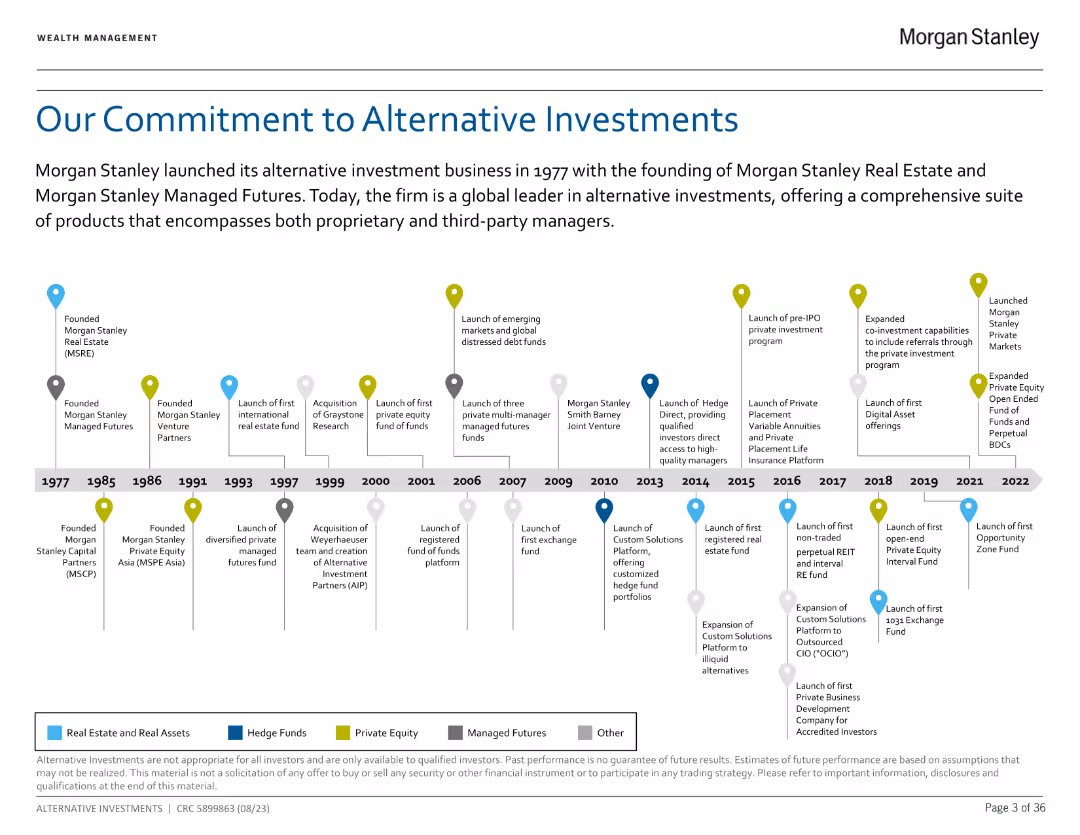
A timeline chart detailing Morgan Stanley's milestones in alternative investments from 1977 to 2022.
Strategic Planning
Financial Services
Summarizes key events and achievements in the firm's history related to alternative investment products.
Timeline, milestones, investments, history
false
Strategic Planning
Financial Services
Linear Flow
Morgan Stanley
Add to my slides
Remove from favorites
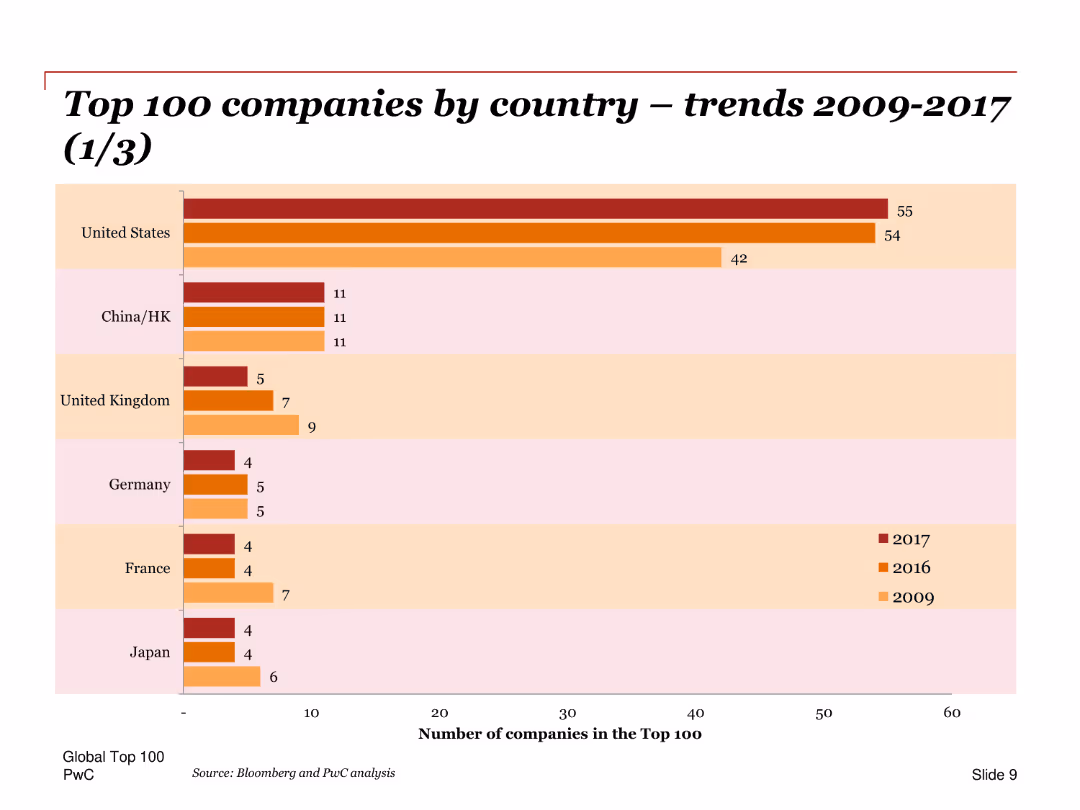
A bar chart comparing the number of top 100 companies by country for the years 2009, 2016, and 2017, with emphasis on changes over time.
Market Analysis and Trends
Financial Services
Compares the number of companies in the top 100 across different countries, highlighting the dominance of the United States and trends in other key regions like China and Europe.
Top 100 companies, countries, trends, bar chart, United States, China, Europe, comparison, changes
false
Market Analysis and Trends
Financial Services
Single Chart
PwC/Strategy&
Add to my slides
Remove from favorites
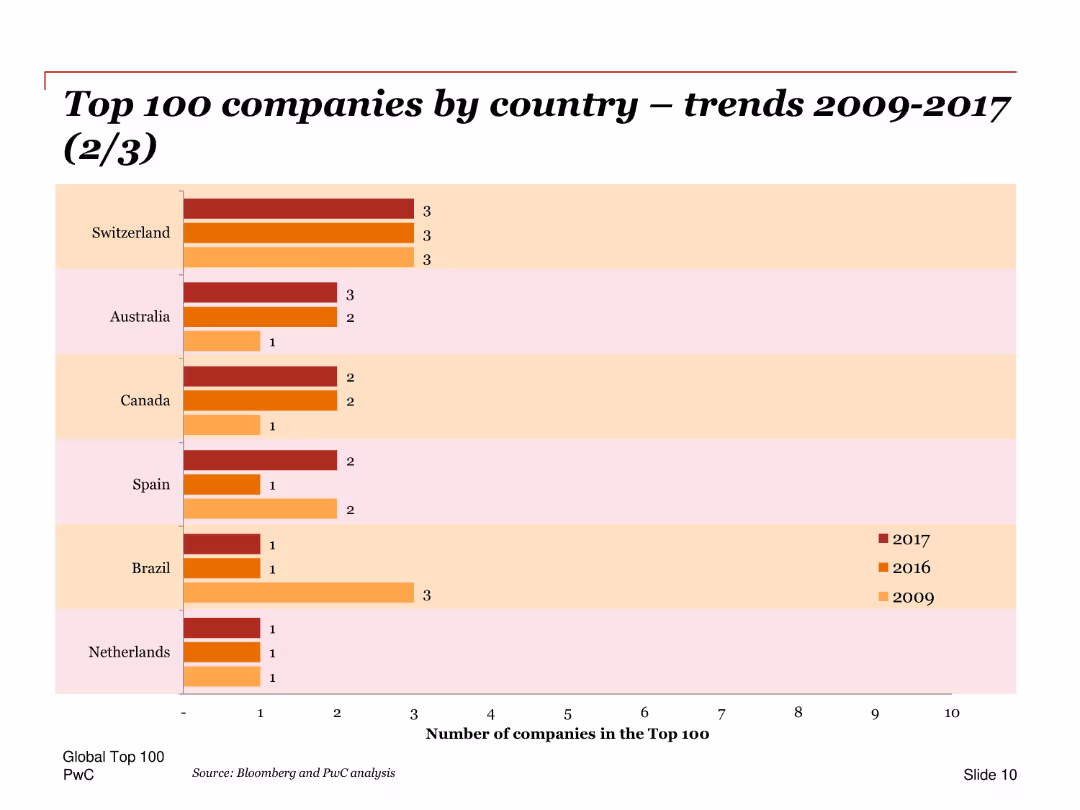
A bar chart showing the number of top 100 companies from Switzerland, Australia, Canada, Spain, Brazil, and Netherlands for the years 2009, 2016, and 2017. The bars are horizontal, indicating the companies’ counts per year per country.
Market Analysis and Trends
Financial Services
This slide displays the distribution of the top 100 companies by country over the years 2009, 2016, and 2017. It provides insights into the trends in different countries’ representation in the top 100 companies list, showing changes over time.
Top 100, companies, trends, countries, years, distribution, bar chart, financial analysis
false
Market Analysis and Trends
Financial Services
Single Chart
PwC/Strategy&
Add to my slides
Remove from favorites
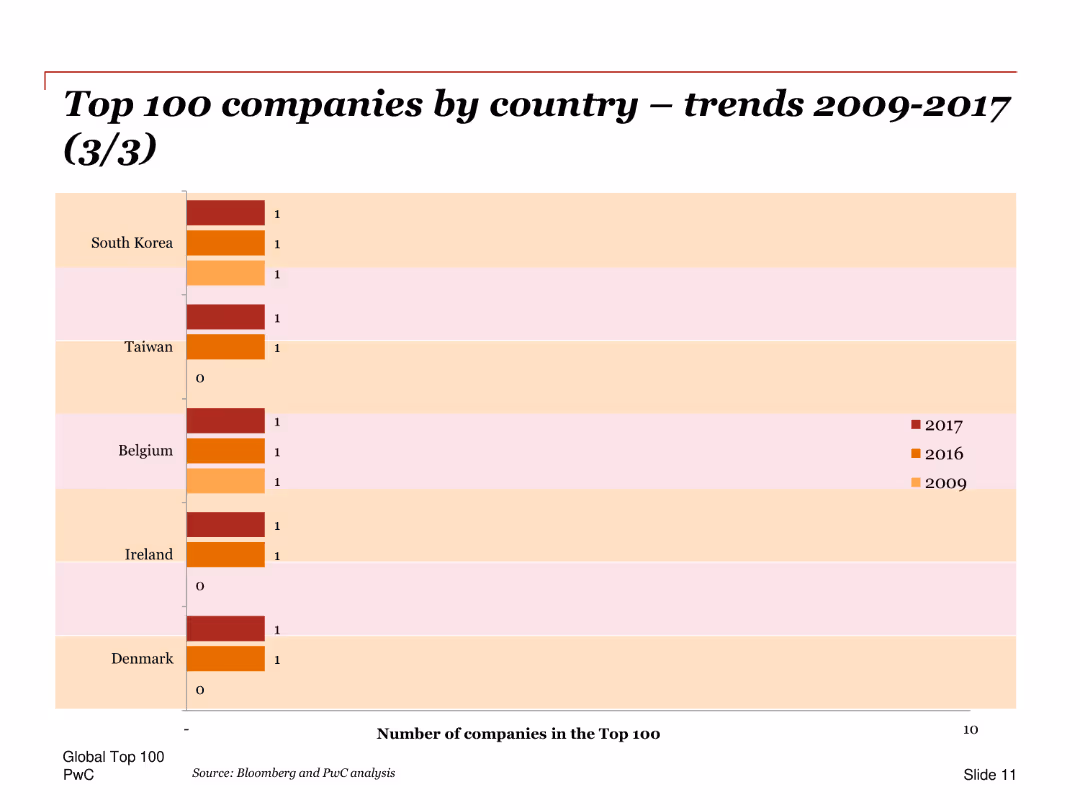
A bar chart showing the number of top 100 companies from South Korea, Taiwan, Belgium, Ireland, and Denmark for the years 2009, 2016, and 2017. The bars are horizontal, indicating the companies’ counts per year per country.
Market Analysis and Trends
Financial Services
This slide highlights the changes in the number of top 100 companies from South Korea, Taiwan, Belgium, Ireland, and Denmark over the years 2009, 2016, and 2017. It provides a comparative analysis of these countries’ standings in the top 100 companies list.
Top 100, companies, trends, countries, years, distribution, bar chart, financial analysis
false
Market Analysis and Trends
Financial Services
Single Chart
PwC/Strategy&
Add to my slides
Remove from favorites
The slide shows a column chart listing the top issues facing Canada, with a focus on housing.
Market Analysis and Trends
Real Estate & Construction
It highlights the top concerns in Ontario at the end of 2020, with housing affordability and availability as significant issues.
Top issues, Canada, housing, affordability, availability, Ontario, concerns, 2020, coronavirus, economy
false
Market Analysis and Trends
Real Estate & Construction
Single Chart
IPSOS
Add to my slides
Remove from favorites
The slide contrasts the success rates and expected financial outcomes of different reinvention approaches, with deep purple tones for higher success and lighter for less. It includes bar charts and descriptive text, providing a clear visual differentiation between groups.
Strategic Planning
Professional Services
Analyzes the relationship between the adoption of Total Enterprise Reinvention and the accelerated financial success, using comparative data to showcase the potential outcomes for reinventors versus transformers and optimizers.
Total Enterprise Reinvention, Financial Success, Comparative Analysis, Business Case, Incremental Revenue, Balance Sheet, Cost Reduction, Outcome Expectations
false
Strategic Planning
Professional Services
Multiple Chart
Accenture
Add to my slides
Remove from favorites
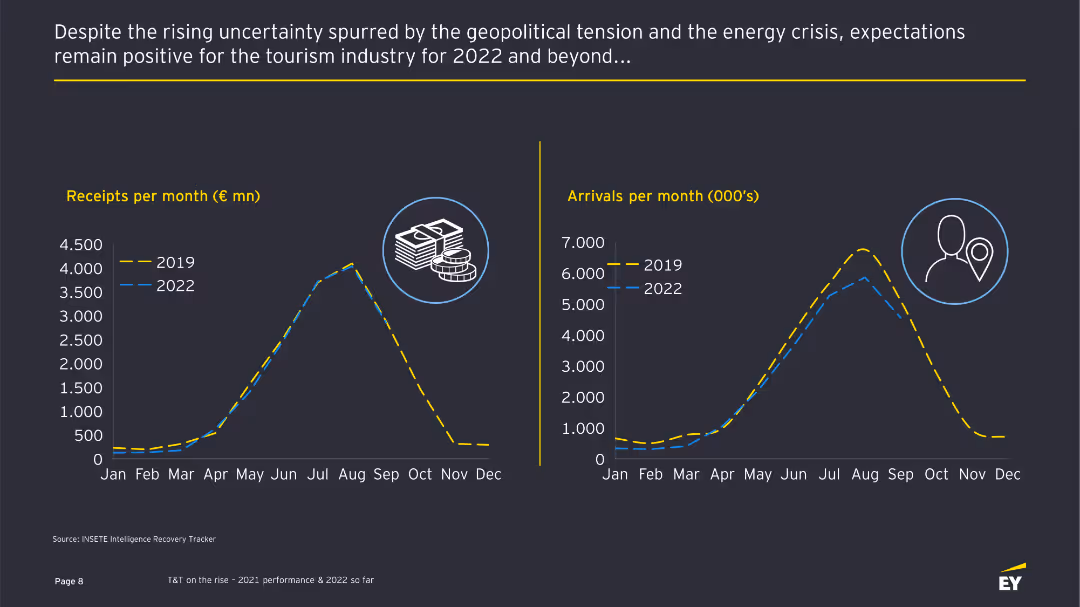
The slide features two line charts comparing monthly receipts and arrivals in 2019 and 2022, accompanied by text describing the positive expectations despite geopolitical tensions.
Market Analysis and Trends
Hospitality & Tourism
This slide shows a positive outlook for the tourism industry in 2022, comparing monthly receipts and arrivals with those of 2019 and discussing the industry's resilience.
Tourism industry, expectations, line charts, market trends, financial data
false
Market Analysis and Trends
Hospitality & Tourism
Multiple Chart
EY
Add to my slides
Remove from favorites
Depicts a stacked column chart showing international arrivals by destination with Europe highlighted against the rest of the world.
Market Analysis and Trends
Hospitality & Tourism
Highlights Europe's dominant position in global tourism, showing the distribution of international arrivals with specific emphasis on top European destinations.
Tourism, Europe, Global arrivals, Market analysis, Travel industry
false
Market Analysis and Trends
Hospitality & Tourism
Multiple Chart
Bain
Add to my slides
Remove from favorites
Contains segmented column charts showing direct and indirect contributions of tourism to the GDP and employment in Europe.
Strategic Planning
Hospitality & Tourism
Examines the direct and indirect economic impacts of tourism in Europe, including contributions to GDP and employment figures.
Tourism, GDP, Employment, Economic impact, Europe
false
Strategic Planning
Hospitality & Tourism
Mixed Chart
Bain
Add to my slides
Remove from favorites
Displays growth percentages in luxury goods shopping among tourists in Europe with column charts. Bars are colored differently to represent various countries like France and Italy.
Market Analysis and Trends
Retail & E-commerce
Provides an overview of the impact of the strong Euro on tourist shopping in Europe, showing changes in tax-free shopping growth rates for luxury goods between 2017 and 2018 in major European markets.
Tourism, Shopping Trends, Europe, Luxury Goods, Currency
false
Market Analysis and Trends
Retail & E-commerce
Single Chart
Bain
Add to my slides
Remove from favorites
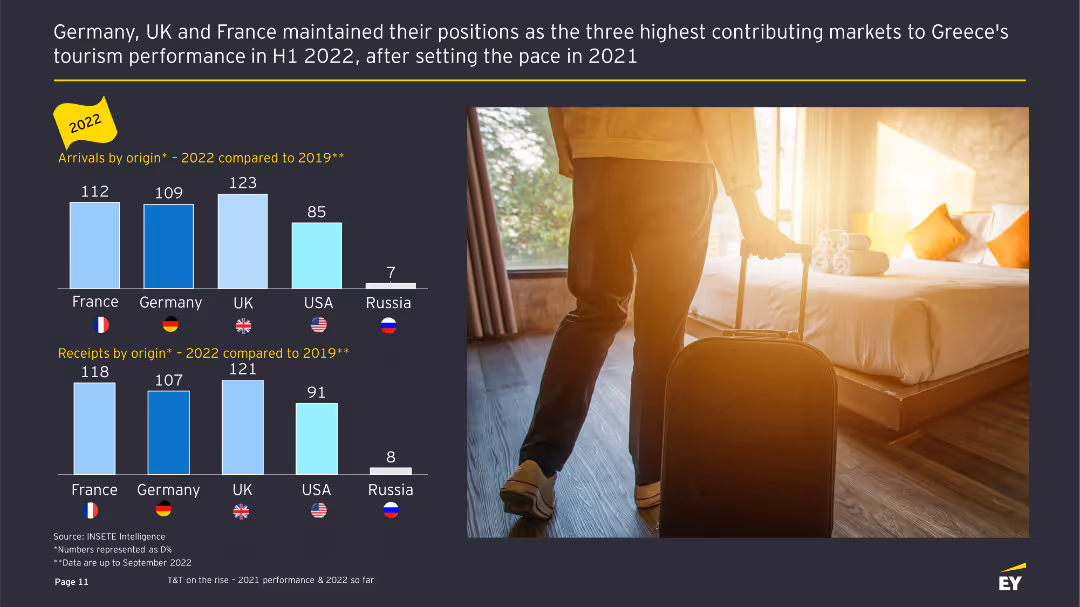
The slide includes bar charts showing tourist arrivals and receipts by origin in 2022 compared to 2019, with a contextual image of a traveler.
Market Analysis and Trends
Hospitality & Tourism
This slide compares tourist arrivals and receipts by origin in 2022 with those of 2019, focusing on the top contributing countries and providing visual context.
Tourist arrivals, receipts, 2022 comparison, market analysis, tourism trends
false
Market Analysis and Trends
Hospitality & Tourism
Multiple Chart
EY
Add to my slides
Remove from favorites
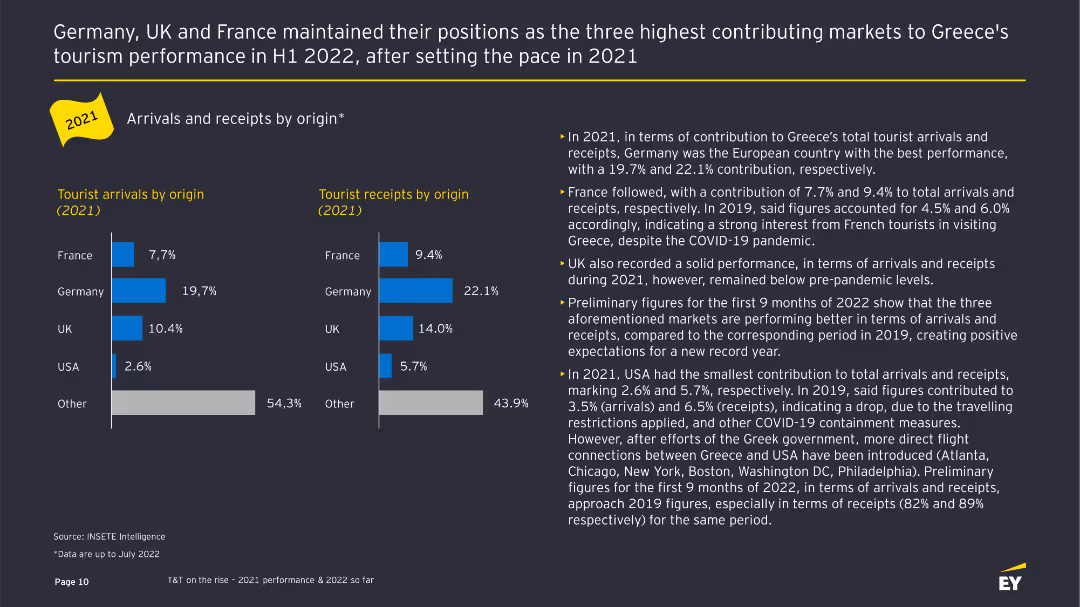
The slide displays bar charts comparing tourist arrivals and receipts by origin in 2021, with supporting text detailing performance by country.
Customer and Market Segmentation
Hospitality & Tourism
This slide analyzes the contributions of different countries to Greece's tourist arrivals and receipts in 2021, highlighting key markets like Germany, France, and the UK.
Tourist arrivals, receipts, market segmentation, country comparison, bar charts
false
Customer and Market Segmentation
Hospitality & Tourism
Multiple Chart
EY
Add to my slides
Remove from favorites
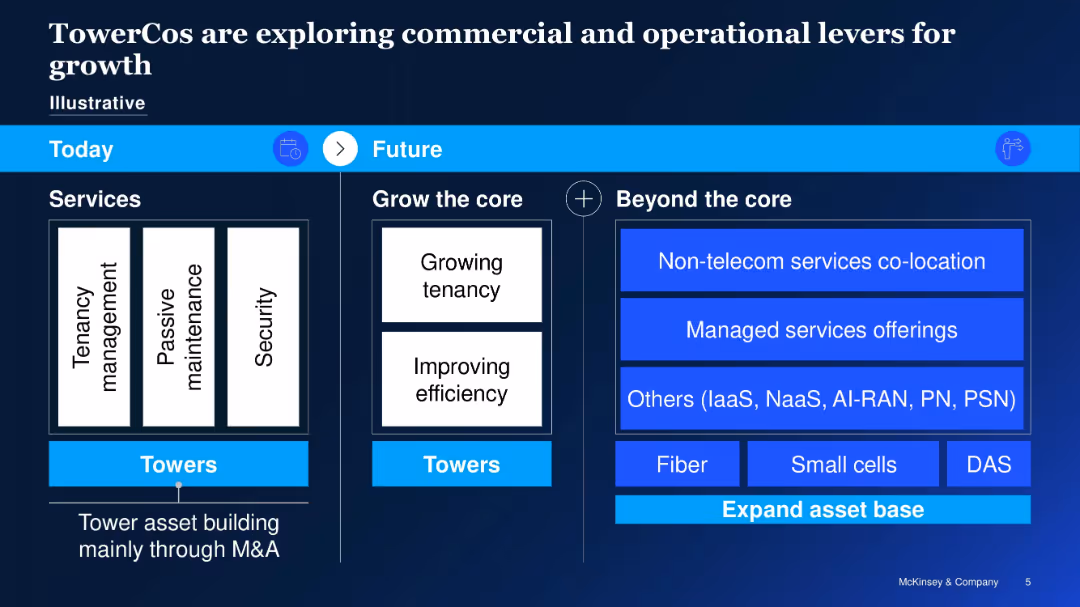
Side-by-side "Today vs Future" layout; organized boxes to show services and strategy evolution
Operational Efficiency
Telecommunications
Shows strategic roadmap for tower companies, from M&A-focused asset building to broader growth through tenancy, efficiency, and expansion into new services like managed services and small cells.
TowerCos, strategy, operations, future growth, tenancy, fiber, DAS, small cells, managed services
false
Operational Efficiency
Telecommunications
Table
McKinsey
Add to my slides
Remove from favorites
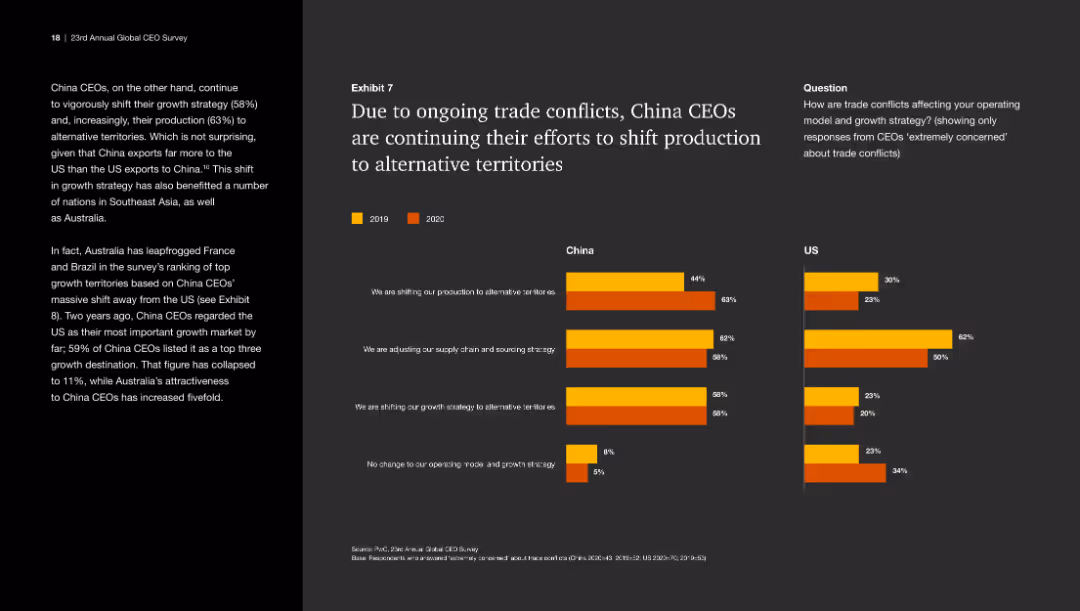
Features bar charts comparing the responses of China and US CEOs regarding adjustments due to trade conflicts. The data is neatly organized, with each response category color-coded for quick reference and comparison.
Risk Assessment and Management
Financial Services
This slide compares the strategic responses of CEOs in China and the US to trade conflicts, highlighting shifts in production and supply chain strategies. It is useful for assessing the impact of geopolitical risks on business strategies.
Trade conflicts, CEO strategies, Production shift, Supply chain adjustments, Geopolitical impact, Market strategy
false
Risk Assessment and Management
Financial Services
Multiple Chart
PwC/Strategy&
Add to my slides
Remove from favorites
This slide includes a bar chart comparing responses from China and US CEOs in 2019 and 2020. The bar chart uses different colors to represent the years and is moderately complex.
Risk Assessment and Management
Industrial & Manufacturing
The slide discusses how trade conflicts are influencing China CEOs to shift production to alternative territories and adjust supply chain strategies.
Trade conflicts, production shift, China CEOs, US CEOs, supply chain
false
Risk Assessment and Management
Industrial & Manufacturing
Multiple Chart
PwC/Strategy&
Add to my slides
Remove from favorites
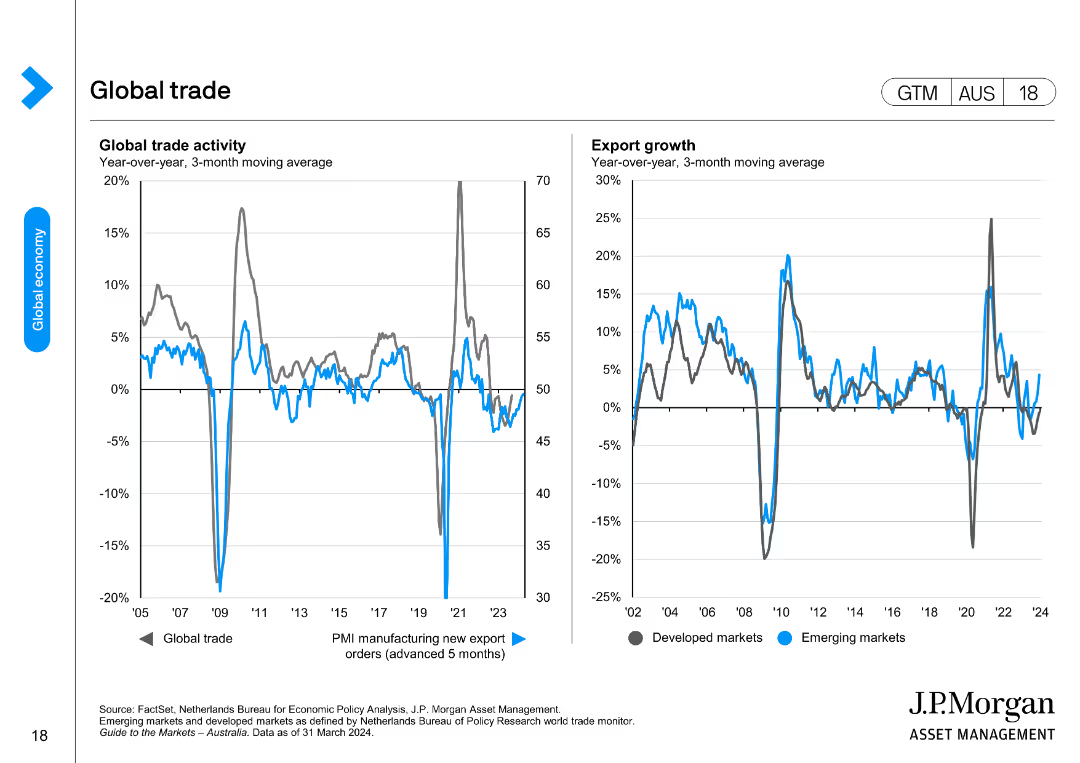
The slide features two line charts. The left chart shows global trade activity year-over-year percentage change and the PMI manufacturing new export orders. The right chart displays export growth rates for developed and emerging markets from 2002 to 2024.
Market Analysis and Trends
Transportation & Logistics
This slide analyzes global trade activity and export growth trends, useful for understanding international trade dynamics and economic conditions in both developed and emerging markets.
Trade, Export, Growth, Global, Markets
false
Market Analysis and Trends
Transportation & Logistics
Multiple Chart
JP Morgan
Add to my slides
Remove from favorites
Multiple line charts detailing the trade volume with Russia and the impact of geopolitical events.
Strategic Planning
Transportation & Logistics
Analyzes the shift in trade and corporate strategy in response to geopolitical tensions involving Russia.
Trade, Russia, Geopolitical, Strategy, Logistics, Transportation, Volume, Impact
false
Strategic Planning
Transportation & Logistics
Multiple Chart
PwC/Strategy&
Add to my slides
Remove from favorites
Two charts: one shows the share of US imports by country/region, and the other presents real interest rates by developed and emerging markets.
Market Analysis and Trends
Financial Services
This slide examines trade dynamics focusing on US import shares from various regions and compares real interest rates across developed and emerging markets. Used for trade analysis and economic policy review.
Trade, US imports, real interest rates, EM, DM
false
Market Analysis and Trends
Financial Services
Multiple Chart
JP Morgan
Add to my slides
Remove from favorites
The slide includes a column chart showing the frequency of crypto asset trading among participants. Each column represents different trading frequencies.
Market Analysis and Trends
Financial Services
This slide displays the frequency at which participants traded crypto assets over the past year, ranging from daily to never.
Trading frequency, crypto, assets, participants, analysis
false
Market Analysis and Trends
Financial Services
Mixed Chart
IPSOS
Add to my slides
Remove from favorites
The slide features a central diagram with layered elements labeled "ALGORITHMS," "SMART ORDER ROUTERS," and "DIRECT MARKET ACCESS," representing a trading platform. Surrounding this are various inputs and outputs labeled with terms such as "Systematic Clients," "Fundamental Hedge Funds," and "Broker Dealers" on one side, and "External Liquidity" sources like "Exchanges" and "Dark Pools" on the other. The design is moderately complex with a focus on connectivity and flow between elements.
Market Analysis and Trends
Financial Services
The slide presents an overview of a trading platform's strength in execution within global markets. It details the systematic process from clients and funds through smart order routing and algorithms, to access various liquidity sources, both internal and external. This slide is likely used to explain how a trading platform integrates different market participants and liquidity sources to optimize trading execution.
Trading, Liquidity, Algorithms, Execution, Markets, Platform, Clients, Funds, Broker-Dealers, Exchanges
false
Market Analysis and Trends
Financial Services
Diagram
Goldman Sachs
Add to my slides
Remove from favorites
The slide features a large header in bold type, two bar graphs comparing ASEAN and OECD firms in terms of formal training offerings, and the number of training hours per employee. The layout is split into two sections with dark and light blue bars representing different regions. There are two callout boxes with recommendations at the bottom.
Market Analysis and Trends
Education & Training
The slide contrasts the percentage of firms offering formal training and the number of training hours per employee between ASEAN and OECD countries. It advocates for government intervention to increase corporate training programs. The aim is to facilitate a competitive edge for companies by ensuring training compliance, particularly in digital skill areas, over a 5-year growth target.
Training, ASEAN, OECD, Government Policy, Corporate Training, Digital Skills, Formal Training, Employee Development, Competitiveness, Growth Target
false
Market Analysis and Trends
Education & Training
Multiple Chart
Kearney
Add to my slides
Remove from favorites
The slide is split into two sections, with a list of platform features on the left and customer testimonials on the right. It has a blue header and footer, with a page number at the bottom right.
Technology and Digital Transformation
Financial Services
This slide presents transaction banking as a modern digital platform, highlighting its features and client satisfaction quotes. It emphasizes digital onboarding, payment automation, and accolades, suitable for presentations focused on digital transformation in banking, client experience, and service innovation, showcasing the technological advances and customer-centric focus of the presenter's transaction banking services.
Transaction Banking, Digital Onboarding, Automation, Client Experience, Innovation, Awards
false
Technology and Digital Transformation
Financial Services
Header Horizontal
Goldman Sachs
Add to my slides
Remove from favorites
Visual elements include a Venn diagram linking market opportunities to franchise benefits, accompanied by a list of attributes on the right that underline the strong client value proposition.
Product and Service Analysis
Financial Services
Addressing new market opportunities, this slide illustrates how small market shares in the transaction banking sector can lead to significant economic gains. It links potential benefits to the company's broader strategy, highlighting attributes such as analytics, modern tools, and scalable customization, which align with the firm’s transaction banking offerings.
Transaction Banking, Market Opportunity, Strategy, Client Value, Innovation
false
Product and Service Analysis
Financial Services
Table
Goldman Sachs
Add to my slides
Remove from favorites
Previous
Next
You don't have any favorites yet.
Please wait loading your favorites slides...
Create a FREE account to continue browsing
Receive Instant Access to 1,000+ slides from companies like McKinsey, Google, and Goldman Sachs
First Name
Last Name
Email
Password
I agree to all
Terms & Privacy Policy
Thank you! Your submission has been received!
Oops! Something went wrong while submitting the form.
Have an account?
Sign in
Upgrade to PRO to Save slides
Advanced Search and Filters
Access to 15,000+ slides
Access to Category Pages
Save/Bookmark Slides
PowerPoint Template Library
Pick a Plan
MONTHLY
$12/month
Billed every month, Cancel anytime.
YEARLY
$9/year
Billed $108 annually, Cancel anytime.
Checkout for $12/month
Checkout for $108/yr
Secured by Stripe | AES-256 bit encryption