My Account
My Slides
Search by Category
Pricing
Templates
View All Templates
Download Template Slides
✦ AI Search
Feedback
Login
Logout
Get Started
Browse all Slides
Browse all Slides
Create a FREE Account
Instant access to 1,000+ real slides from top companies like McKinsey, BCG, Goldman Sachs, Google and many more!
First Name
Last Name
Email
Password
I agree to all
Terms & Privacy Policy
Thank you! Your submission has been received!
Oops! Something went wrong while submitting the form.
Have an account?
Sign in
Saved Slides
Total No. of slides saved
0
↻ Refresh
✖ Clear all
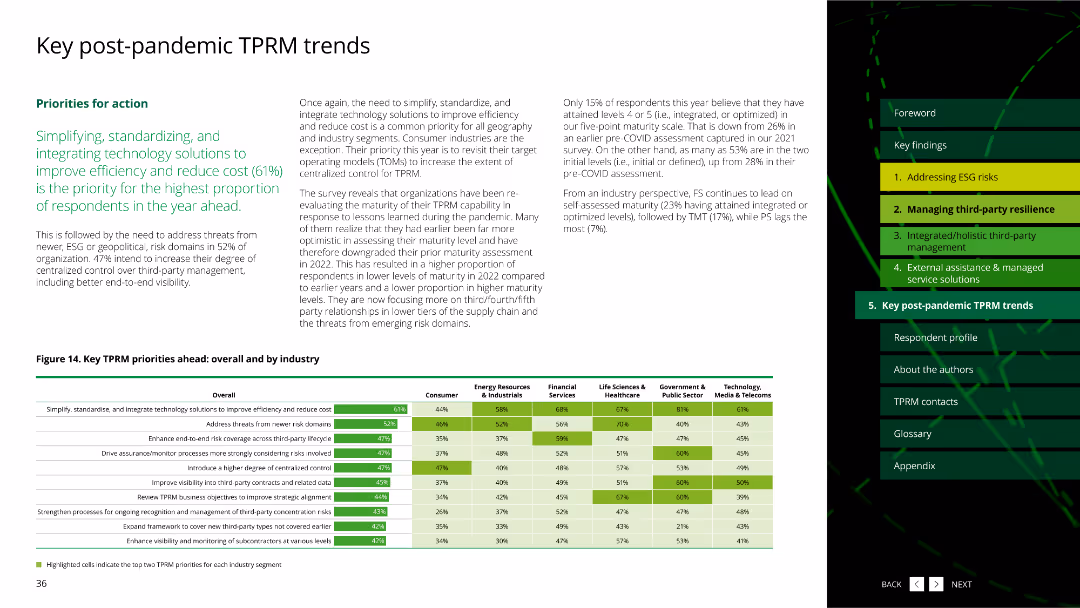
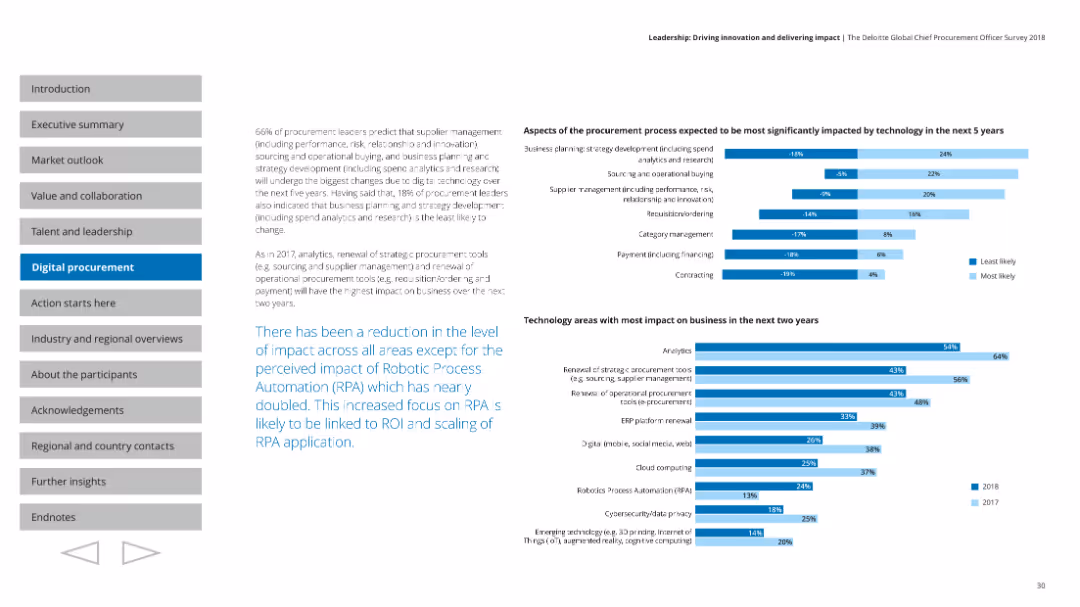
The slide includes a column chart and a detailed table, showing key TPRM priorities ahead by overall and by industry.
Market Analysis and Trends
Professional Services
It outlines the priorities for TPRM post-pandemic, focusing on simplifying, standardizing, and integrating technology solutions to improve efficiency and reduce costs.
TPRM priorities, post-pandemic, column chart, table, technology solutions, professional services
false
Market Analysis and Trends
Professional Services
Mixed Chart
Deloitte
Add to my slides
Remove from favorites
The slide features column charts about organizational priorities in widening the scope of TPRM into related areas.
Strategic Planning
Professional Services
This slide discusses the priorities of organizations in expanding third-party risk management to related functional areas.
TPRM, priorities, scope, functional areas, survey
false
Strategic Planning
Professional Services
Multiple Chart
Deloitte
Add to my slides
Remove from favorites
This slide features a line chart showing TRREB sales and new listings forecast from 1988 to 2021 (F). Sales are in blue, and new listings are in gray, with future forecasts marked.
Market Analysis and Trends
Real Estate & Construction
The slide forecasts TRREB MLS® system sales and new listings, providing insights into future market conditions and trends based on historical data.
TRREB, MLS, sales forecast, new listings, market outlook
false
Market Analysis and Trends
Real Estate & Construction
Single Chart
IPSOS
Add to my slides
Remove from favorites
This slide features a line chart showing the TRREB average price forecast from 1988 to 2021 (F). The line is blue, indicating a projected rise in average prices.
Market Analysis and Trends
Real Estate & Construction
The slide forecasts the average price trend for TRREB MLS® system, providing insights into future pricing dynamics based on historical data trends.
TRREB, average price, price forecast, line chart, pricing trends
false
Market Analysis and Trends
Real Estate & Construction
Single Chart
IPSOS
Add to my slides
Remove from favorites
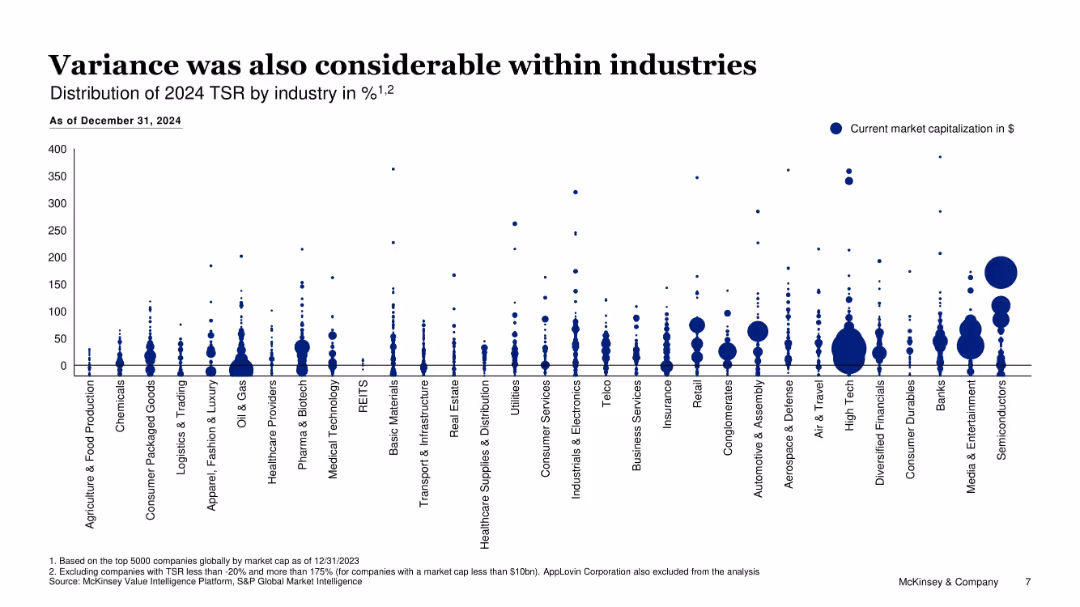
Bubble chart showing TSR distribution by industry with bubble size for market cap
Performance Metrics and KPIs
Financial Services
Shows intrasectional TSR variability within industries for 2024, suggesting dispersion in company performance despite sector trends; large bubbles show capital concentration.
TSR distribution, market cap, industry analysis, dispersion, company performance
false
Performance Metrics and KPIs
Financial Services
Single Chart
McKinsey
Add to my slides
Remove from favorites
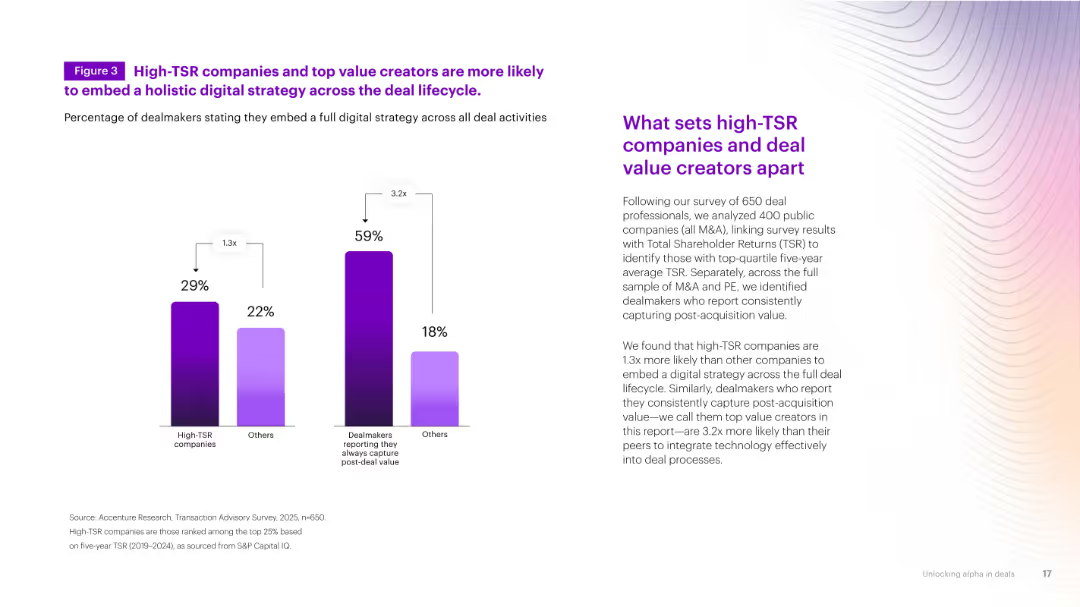
Dual bar chart comparing high-TSR vs. other companies in digital strategy embedding. Accompanied by explanatory paragraph on the right. Gradient background.
Performance Metrics and KPIs
Financial Services
Shows that high-TSR firms are significantly more likely to embed digital strategies and consistently capture post-deal value. Supports the case for digital transformation in M&A.
TSR, digital strategy, post-deal, performance, transformation
false
Performance Metrics and KPIs
Financial Services
Mixed Chart
Accenture
Add to my slides
Remove from favorites
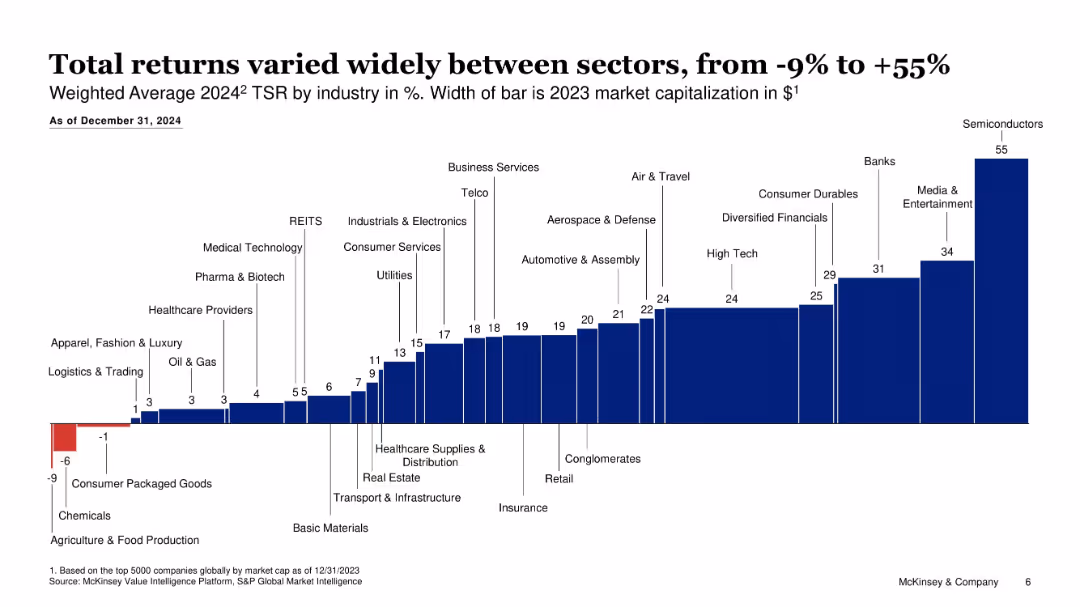
Horizontal bar chart ordered by sector TSR with width indicating market cap
Financial Performance
Financial Services
Analyzes 2024 TSR by sector, with semiconductors leading at 55% and consumer packaged goods underperforming at -6%; reveals broad variance across sectors.
TSR, industry returns, sector performance, capital markets, variance, semiconductors
false
Financial Performance
Financial Services
Single Chart
McKinsey
Add to my slides
Remove from favorites
A multi-line graph comparing revenue against media spend in different channels, emphasizing superior returns from TV advertising with numbered key insights.
Investment Analysis
Media & Entertainment
Focuses on the comparative ROI from various media channels, particularly highlighting the efficiency of TV advertising in generating higher returns.
TV advertising, media channels, ROI, investment returns, comparative analysis
false
Investment Analysis
Media & Entertainment
Mixed Chart
Accenture
Add to my slides
Remove from favorites
Slide displays column charts comparing global and Indian TV advertising revenues from 2020 to 2025, noting significant growth in India.
Market Analysis and Trends
Media & Entertainment
Discusses the global and Indian growth rates in TV advertising revenues, projecting strong future growth, especially in India.
TV advertising, revenue growth, India, global market, 2025 forecast, advertising industry
false
Market Analysis and Trends
Media & Entertainment
Multiple Chart
PwC/Strategy&
Add to my slides
Remove from favorites
A pie chart illustrating the percentage of U.S. TV screen consumption hours by category in January 2022. The chart includes segments for Streaming, Cable, Broadcast, and Other, with additional breakdowns for specific streaming services.
Market Analysis and Trends
Media & Entertainment
This slide depicts the share of TV screen consumption hours in the U.S. for January 2022, showing that streaming accounts for 29% of total consumption. It includes detailed percentages for major streaming platforms like Netflix, YouTube, Hulu, and others.
TV consumption, streaming, market share, U.S. TV, January 2022
false
Market Analysis and Trends
Media & Entertainment
Single Chart
Nielsen
Add to my slides
Remove from favorites
Displays a series of column charts with the central red column highlighting a 23% increase in sales ROI for TV, contrasted with other media channels showing a decrease or less increase.
Market Analysis and Trends
Media & Entertainment
Analyzes the impact of attributing sales ROI to specific media channels, with a focus on the significant increase seen in TV media spend.
TV media, sales ROI, media channels, attributed returns, increase
false
Market Analysis and Trends
Media & Entertainment
Single Chart
Accenture
Add to my slides
Remove from favorites
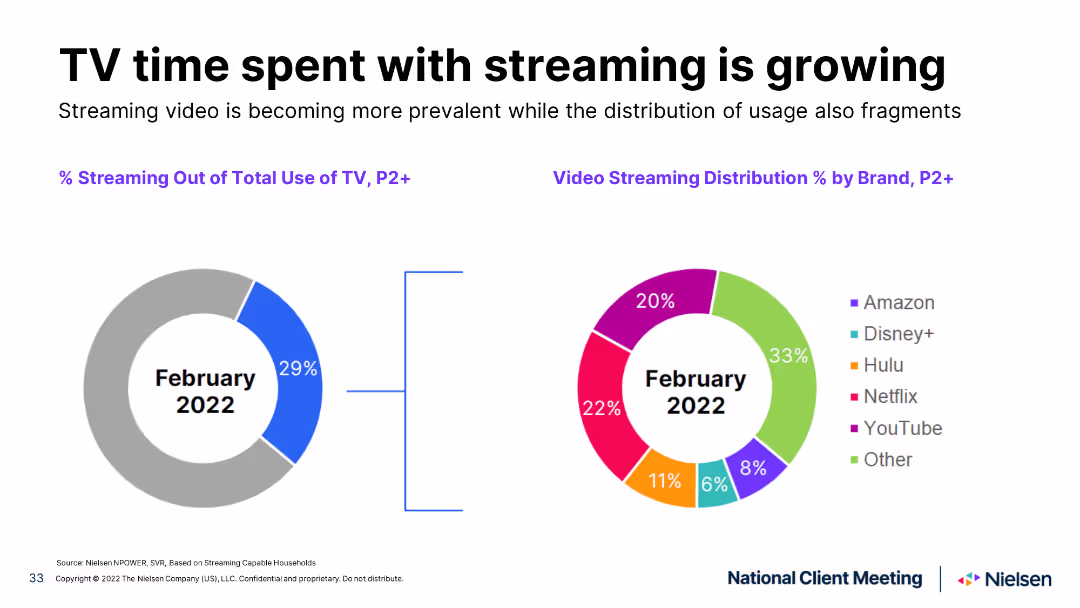
Pie chart slide comparing the percentage of TV time spent streaming in February 2021 and February 2022, with distinct color segments for different streaming services.
Market Analysis and Trends
Media & Entertainment
Compares the growth in TV streaming time over a year, showing an increase in streaming's share and the distribution across various services.
TV streaming, growth, comparison, streaming services, time spent
false
Market Analysis and Trends
Media & Entertainment
Multiple Chart
Nielsen
Add to my slides
Remove from favorites
Pie chart slide showing the percentage of TV time spent streaming in February 2021 and February 2022, with distinct color segments for different streaming services.
Market Analysis and Trends
Media & Entertainment
Illustrates the increase in TV streaming time and the changing distribution among streaming services over a year, highlighting trends.
TV streaming, growth, comparison, streaming services, trends
false
Market Analysis and Trends
Media & Entertainment
Multiple Chart
Nielsen
Add to my slides
Remove from favorites
A stacked column chart showing total TV reach composition by viewing source and ad model for P2+ over a year, highlighting a shift away from linear TV.
Market Analysis and Trends
Media & Entertainment
The slide illustrates a 10% year-over-year increase in viewers not tuning into any form of linear TV, with AVOD becoming more complementary to SVOD consumption.
TV, viewers, linear TV, AVOD, SVOD
false
Market Analysis and Trends
Media & Entertainment
Mixed Chart
Nielsen
Add to my slides
Remove from favorites
The slide has basic visual complexity with a text-based list that outlines the sections of a report. The design is straightforward and utilitarian, with a clean white background and clear, readable fonts.
Technology and Digital Transformation
Industrial & Manufacturing
The slide provides an agenda or table of contents for a report on process automation, detailing the various segments to be covered. It gives viewers a clear structure of the topics that will be discussed, such as industry views, megatrend impacts, and market profitability.
Table of contents, Report structure, Automation, Industry segments
false
Technology and Digital Transformation
Industrial & Manufacturing
Agenda
LEK
Add to my slides
Remove from favorites
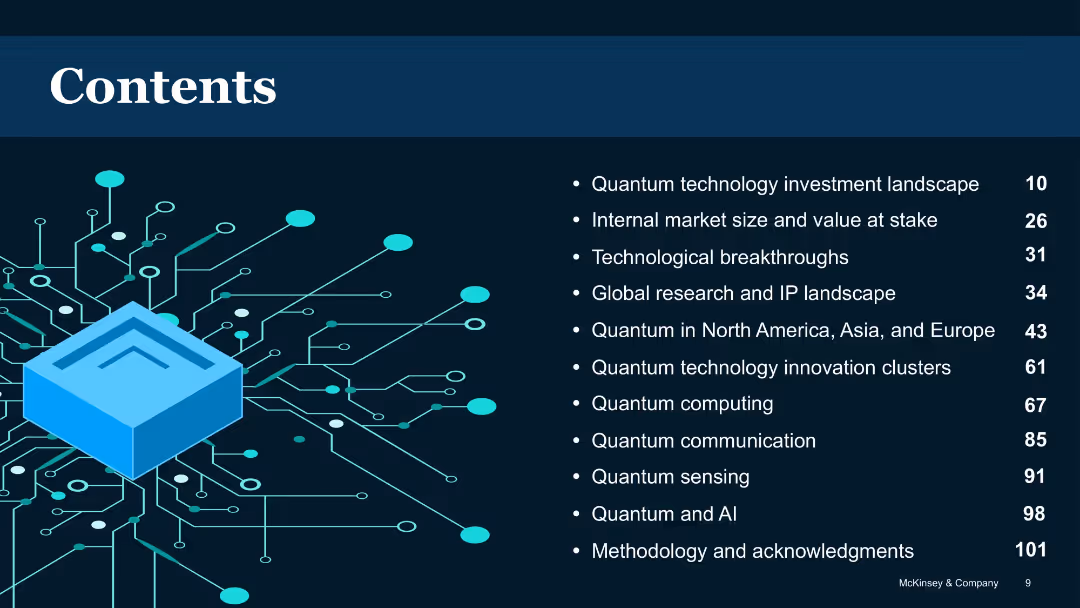
Dark background with blue circuit illustration and list-style table of contents
Industry Overview
Artificial Intelligence
Provides a structured overview of the report’s sections, including topics like investment landscape, technological breakthroughs, global perspectives, and specific quantum technologies like computing, sensing, and communication.
Table of contents, report structure, quantum sections, chapter list
false
Industry Overview
Artificial Intelligence
Agenda
McKinsey
Add to my slides
Remove from favorites
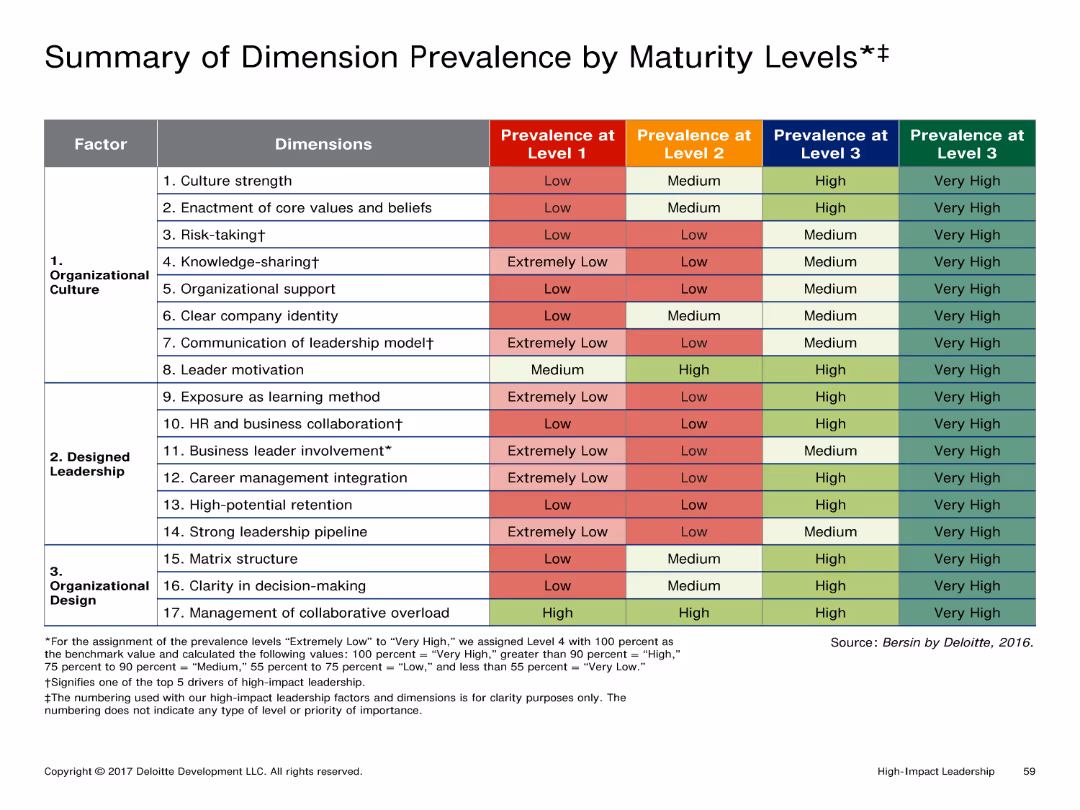
Table showing the prevalence of various dimensions by maturity levels (Low, Medium, High, Very High). The table is color-coded for easy visual differentiation.
Performance Metrics and KPIs
Professional Services
Summarizes how different organizational dimensions are prevalent at various maturity levels, useful for assessing organizational development stages.
Table, dimension prevalence, maturity levels, color-coded
false
Performance Metrics and KPIs
Professional Services
Table
Deloitte
Add to my slides
Remove from favorites
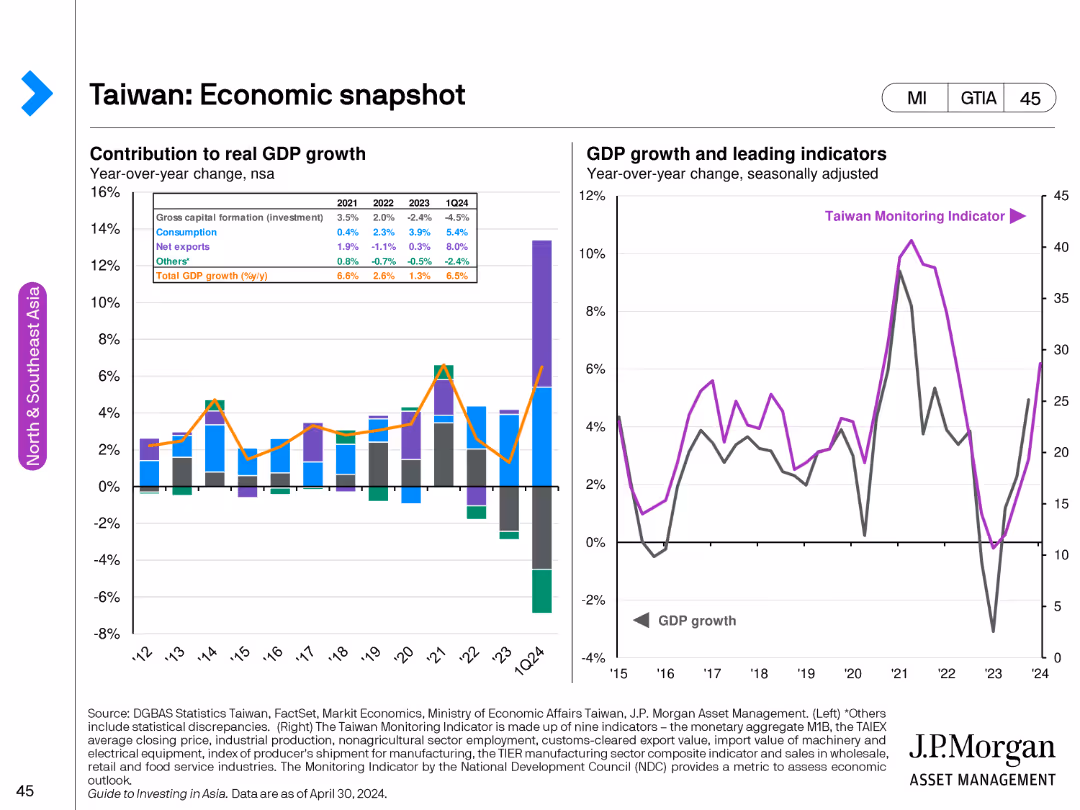
The left side has a stacked column chart showing the contribution to Taiwan's GDP growth by different components from 2012 to 2024F. The right side has a line graph comparing GDP growth and the Taiwan Monitoring Indicator.
Market Analysis and Trends
Financial Services
This slide presents an economic overview of Taiwan, showing detailed components of GDP growth and key economic indicators to assess the country's economic health.
Taiwan, GDP growth, economic indicators, market analysis, Taiwan Monitoring Indicator
false
Market Analysis and Trends
Financial Services
Multiple Chart
JP Morgan
Add to my slides
Remove from favorites
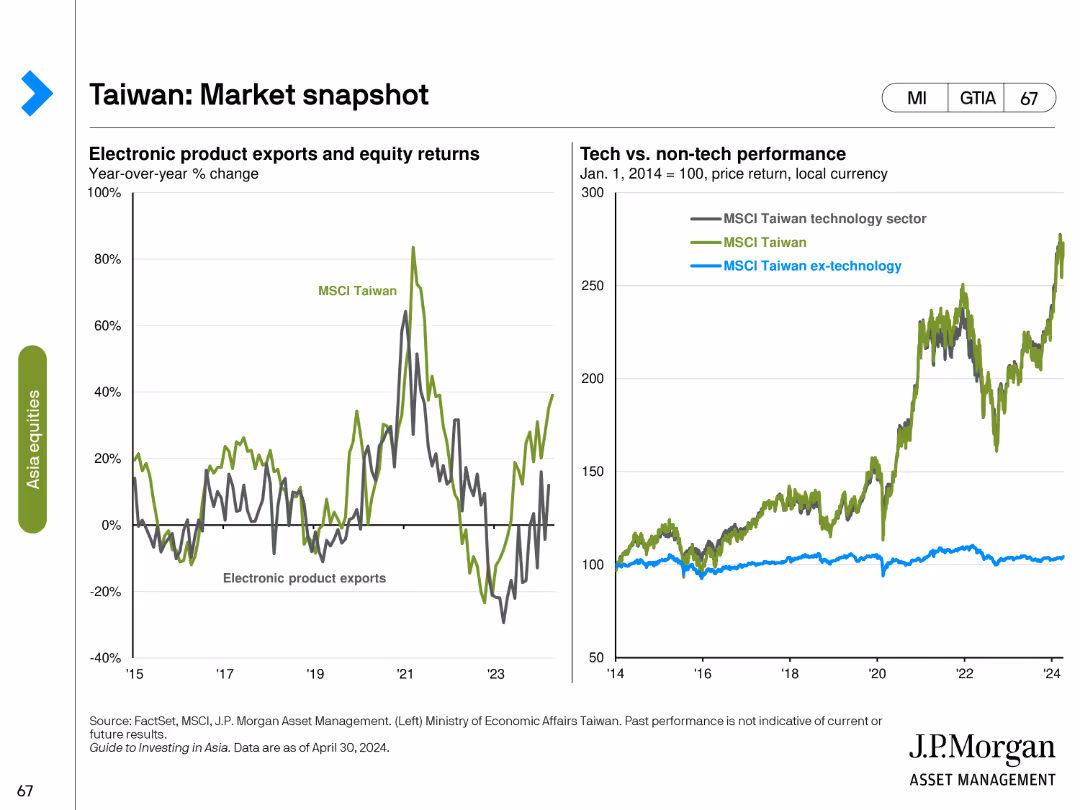
This slide includes two line charts: one showing electronic product exports and equity returns, and the other showing the performance of the MSCI Taiwan technology sector versus non-technology sectors.
Market Analysis and Trends
Financial Services
The slide provides an overview of Taiwan's market, focusing on the relationship between electronic product exports and equity returns, and comparing the performance of technology and non-technology sectors to identify key market drivers.
Taiwan, market snapshot, electronic exports, equity returns, MSCI Taiwan, technology sector, non-technology, market drivers, financial analysis, market overview
false
Market Analysis and Trends
Financial Services
Multiple Chart
JP Morgan
Add to my slides
Remove from favorites
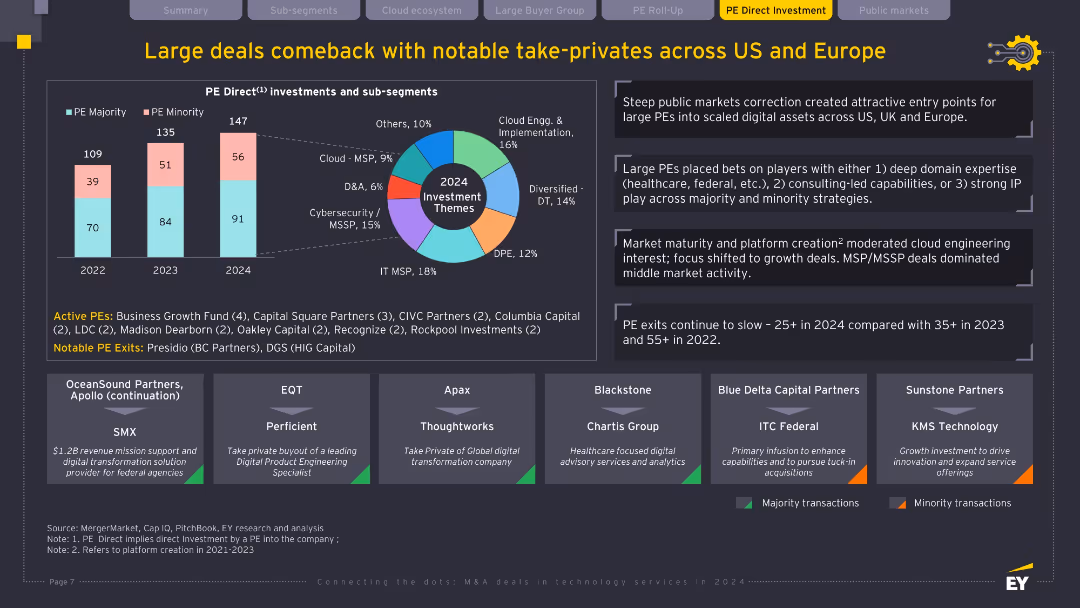
Bar chart, pie chart, textual insights, and deal highlights in labeled boxes; follows same visual style as prior slide with structured data and insights.
Mergers and Acquisitions
Technology & Software
This slide covers the resurgence of large PE deals, particularly take-privates in 2024. It highlights key investment sub-segments and strategic focuses such as cloud engineering and domain expertise. The chart shows the shift in PE majority/minority deals, while the text emphasizes market timing, domain-driven investments, and notable exits, pointing to a maturing market for direct investments.
Take-private, PE direct investment, IT MSP, cybersecurity, exits, platform creation
false
Mergers and Acquisitions
Technology & Software
Multiple Chart
EY
Add to my slides
Remove from favorites
A clean layout with multiple text boxes summarizing key takeaways, including advertiser objectives, channel measurement, and data challenges. Each box contains a brief summary and a small icon representing the concept.
Strategic Planning
Media & Entertainment
This slide provides key takeaways on brand awareness, measurement, and data strategies. It emphasizes the importance of leveraging multiple channels and addressing data challenges to enhance marketing effectiveness.
Takeaways, Strategy, Brand, Measurement, Data
false
Strategic Planning
Media & Entertainment
Multiple Chart
Nielsen
Add to my slides
Remove from favorites
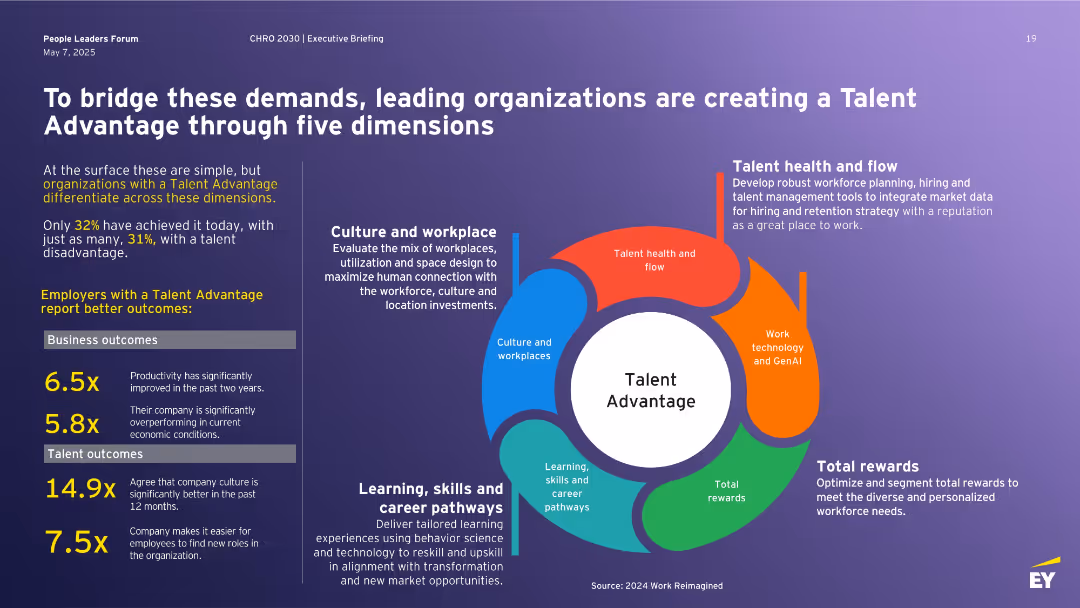
Left block of stats and outcomes; right side features a circular infographic with five dimensions of Talent Advantage: culture, learning, rewards, health, and tech.
Human Resources and Talent Management
Professional Services
Describes how leading companies build a Talent Advantage across five dimensions to address workforce challenges. Includes stats on performance outcomes for talent-advantaged firms and emphasizes the strategic value of culture, learning pathways, reward systems, technology, and workforce planning to stay competitive.
Talent Advantage, workforce strategy, learning, rewards, culture, technology, retention
false
Human Resources and Talent Management
Professional Services
Vertical Flow
EY
Add to my slides
Remove from favorites
Slide with a mixed bar and column chart and lists detailing aspects of work-from-home programs and staffing strategies in contact centers. Colors vary between green shades for clarity.
Human Resources and Talent Management
Professional Services
Explores talent management strategies within global contact centers, focusing on work-from-home programs and responses to staffing shortages.
Talent Management, Work-From-Home, Staffing Strategies, Contact Centers, Global Trends, Human Resources
false
Human Resources and Talent Management
Professional Services
Multiple Chart
Deloitte
Add to my slides
Remove from favorites
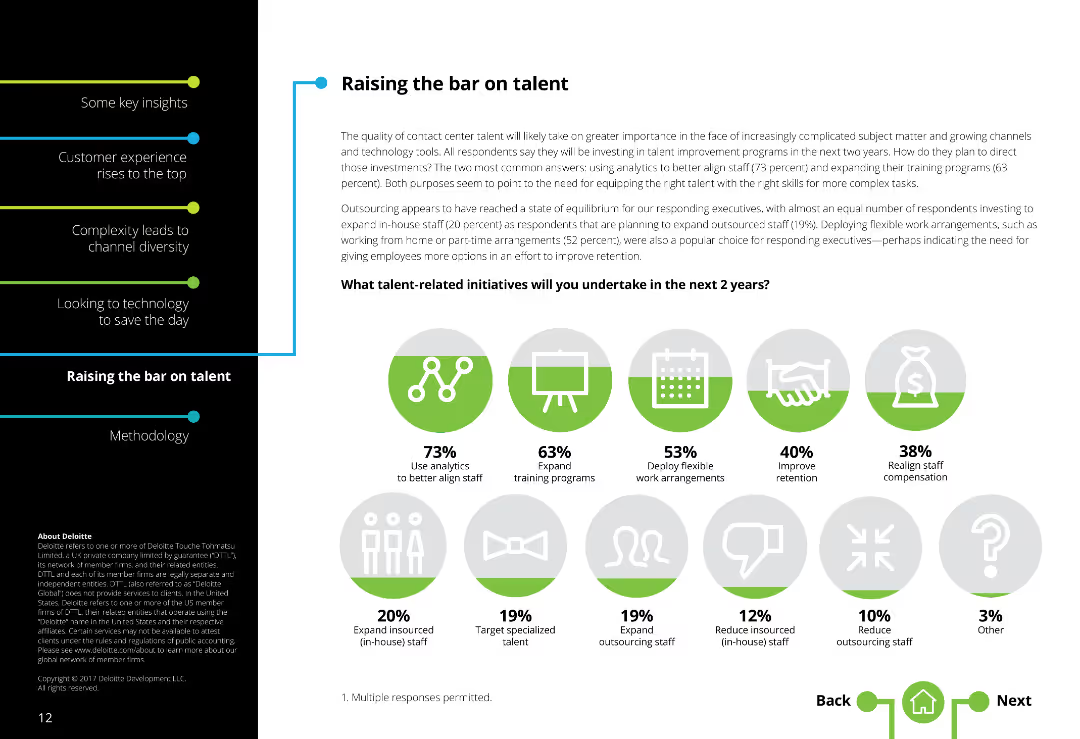
Two-column layout with text on the left and icons representing various talent initiatives on the right. Text density is moderate.
Market Analysis and Trends
Professional Services
Discusses initiatives for improving talent in contact centers, such as using analytics for staff, expanding training programs, and deploying flexible work arrangements.
Talent management, Contact centers, Analytics, Training programs, Flexible work arrangements, Staff improvement
false
Market Analysis and Trends
Professional Services
Mixed Chart
Deloitte
Add to my slides
Remove from favorites
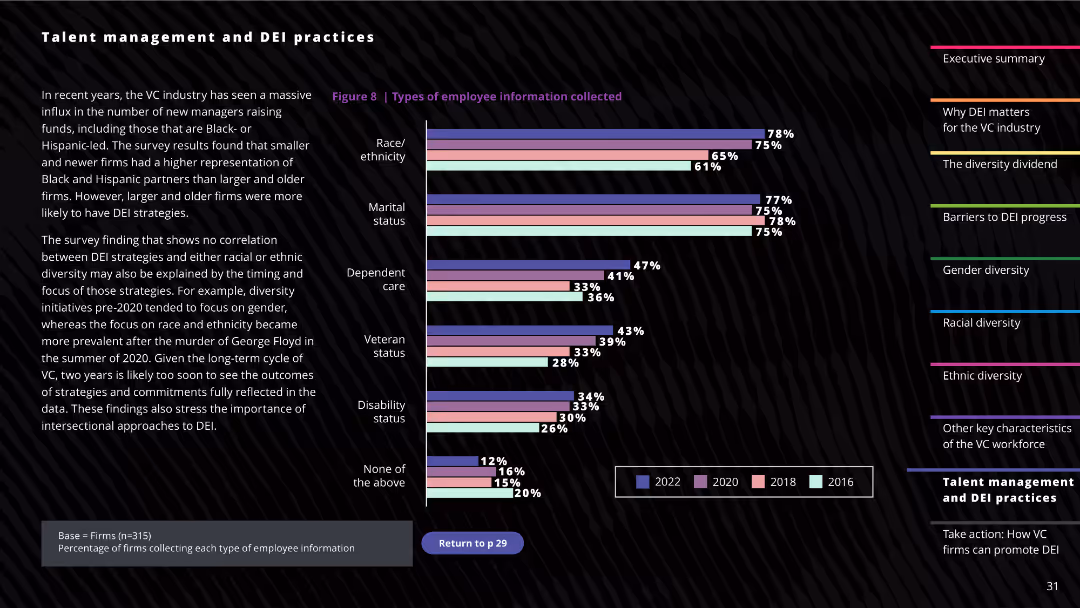
The slide contains a column chart showing the types of employee information collected by firms, such as race/ethnicity, marital status, and veteran status. Textual descriptions and notes on the importance of DEI practices are included.
Human Resources and Talent Management
Professional Services
This slide presents data on the types of demographic information collected by firms to support DEI practices, highlighting the increasing focus on race, ethnicity, and other diversity factors within the workforce.
Talent management, DEI practices, Employee information, Workforce diversity, Demographic data
false
Human Resources and Talent Management
Professional Services
Mixed Chart
Deloitte
Add to my slides
Remove from favorites
Slide contains multiple bar charts. The layout is clean with blue and gray color scheme, minimal text outside the charts.
Human Resources and Talent Management
Professional Services
Discusses strategies and challenges in talent management within GBS, highlighting key initiatives and challenges with talent retention and acquisition.
Talent management, GBS, initiatives, challenges, retention
false
Human Resources and Talent Management
Professional Services
Multiple Chart
Deloitte
Add to my slides
Remove from favorites
Contains stats on talent acquisition and diversity spotlight, presented in a two-column layout. It's clear with a corporate blue and gray color palette.
Human Resources and Talent Management
Financial Services
This slide emphasizes Goldman Sachs' commitment to talent development and diversity, sharing figures on partner promotions and diversity increases, potentially used in HR presentations or recruitment campaigns to exhibit the company's values and performance culture.
Talent management, diversity, human resources, Goldman Sachs, culture
false
Human Resources and Talent Management
Financial Services
Boxed
Goldman Sachs
Add to my slides
Remove from favorites
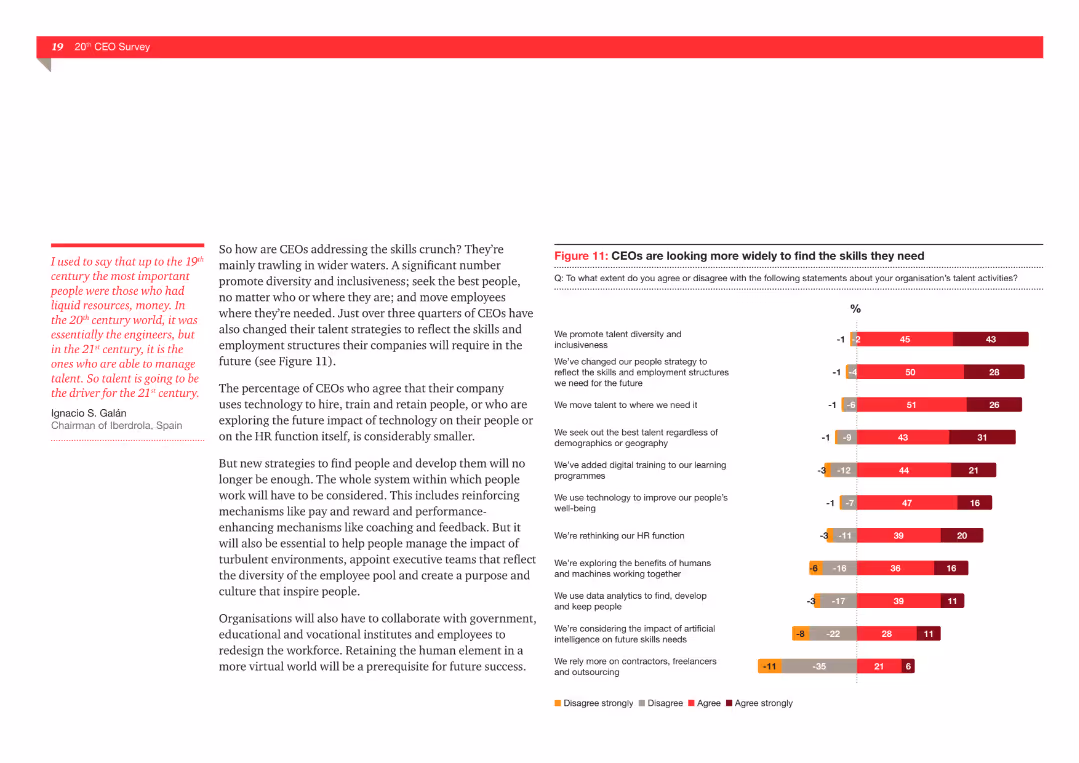
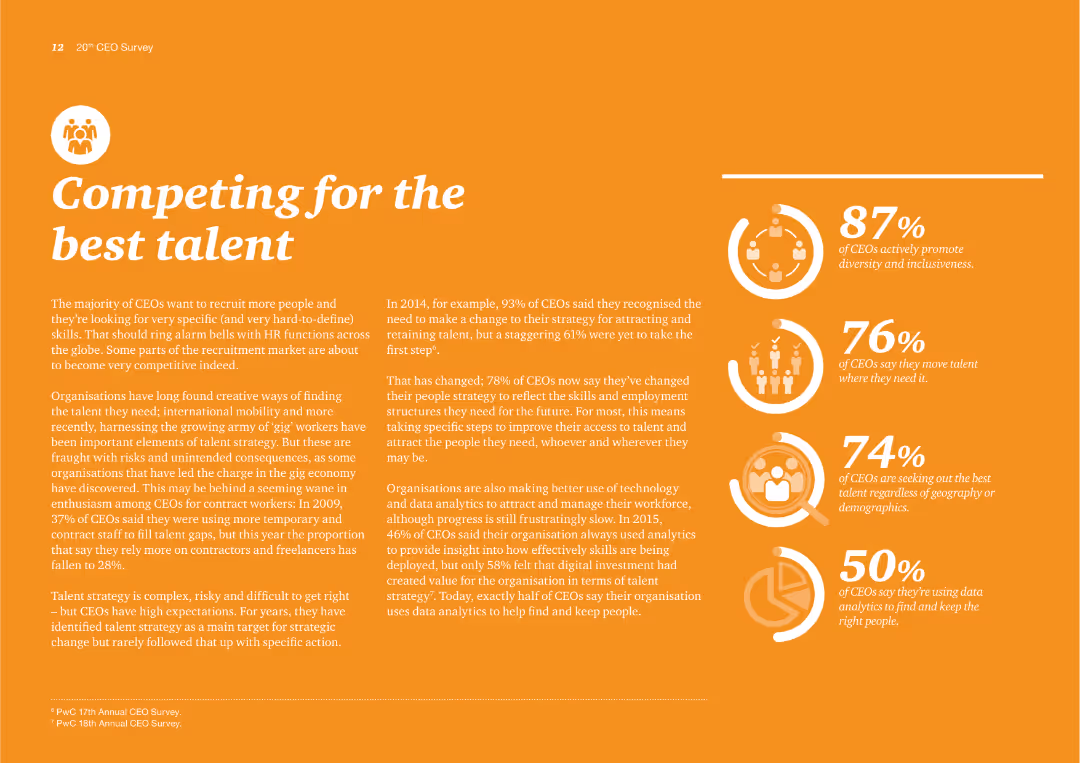
The slide presents a column chart showing the percentage of CEOs agreeing with various statements about their organization's talent activities, such as promoting diversity and using technology to improve well-being.
Human Resources and Talent Management
Professional Services
This slide explores the extent to which CEOs agree or disagree with various talent management strategies, including promoting diversity, changing people strategy, and using technology for employee well-being.
Talent management, diversity, technology, well-being, CEOs, recruitment, HR strategies
false
Human Resources and Talent Management
Professional Services
Mixed Chart
PwC/Strategy&
Add to my slides
Remove from favorites
A column chart and bullet points showing sentiments of skilled workers feeling underqualified to apply for multinational jobs.
Human Resources and Talent Management
Professional Services
Discusses the challenges and opportunities for multinational companies in tapping into underutilized skilled talent pools.
Talent pools, skilled workers, multinational hiring, job application challenges
false
Human Resources and Talent Management
Professional Services
Mixed Chart
Accenture
Add to my slides
Remove from favorites
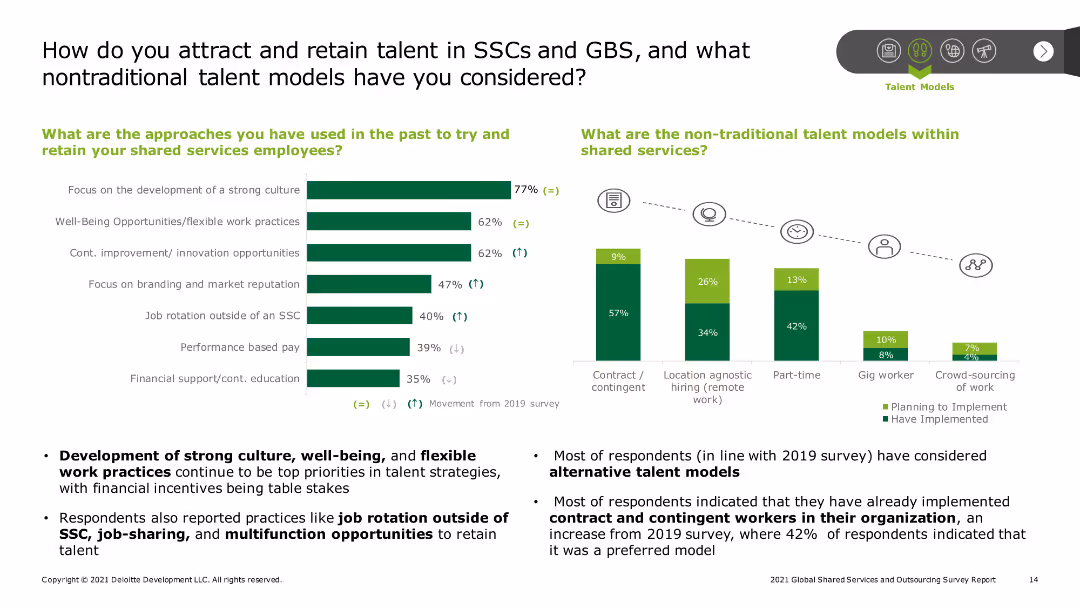
The slide contains a column chart on the left displaying various approaches for talent retention and a bar chart on the right depicting the non-traditional talent models within shared services. Text descriptions highlight key statistics and findings.
Human Resources and Talent Management
Professional Services
The slide discusses strategies for attracting and retaining talent in Shared Services Centers (SSCs) and Global Business Services (GBS), including traditional and non-traditional models. Key points include development of strong culture and flexible work practices.
Talent retention, SSC, GBS, flexible work, non-traditional models
false
Human Resources and Talent Management
Professional Services
Multiple Chart
Deloitte
Add to my slides
Remove from favorites
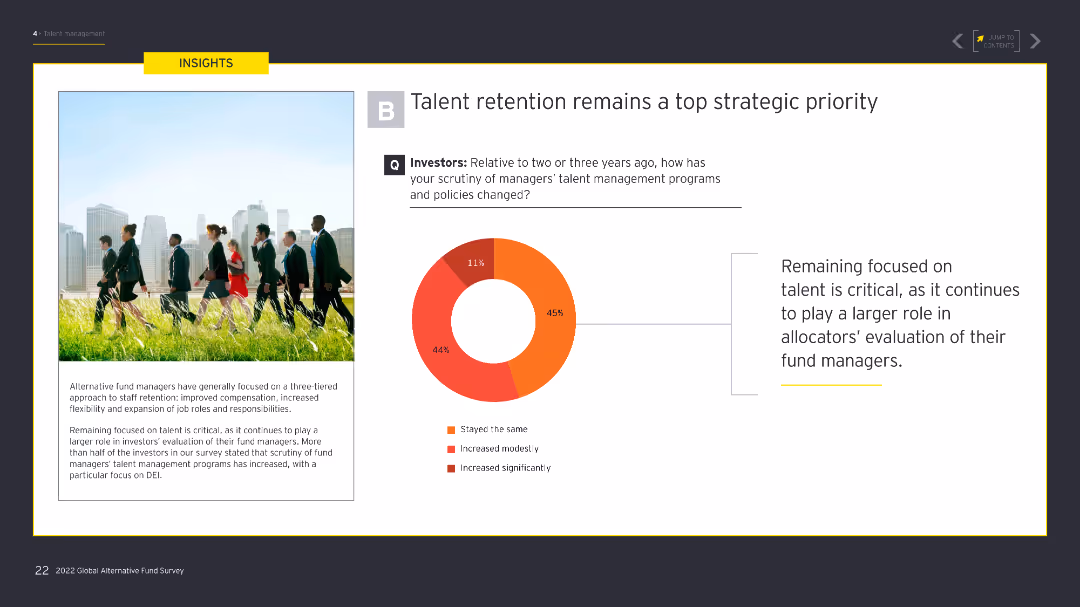
The slide contains a donut chart showing the level of scrutiny investors have on managers' talent management programs. The left side has an image of professionals walking in a park. The donut chart uses shades of red and orange to indicate different levels of scrutiny.
Human Resources and Talent Management
Financial Services
The slide emphasizes the increased focus on talent retention among investors, showing that scrutiny of talent management programs has grown significantly over the past few years, reflecting its strategic importance.
Talent retention, investor scrutiny, DEI, talent management, strategic priority
false
Human Resources and Talent Management
Financial Services
Mixed Chart
EY
Add to my slides
Remove from favorites
Contains a mix of text and bar charts, detailing reasons for job satisfaction and factors that attract Gen Zs and millennials to employers.
Human Resources and Talent Management
Professional Services
The slide discusses strategies for employers to attract and retain Gen Z and millennial talent, focusing on key factors like work-life balance, learning opportunities, and salary. It includes supporting bar charts showing the importance of these factors.
Talent retention, job satisfaction, employers, Gen Z, millennials
false
Human Resources and Talent Management
Professional Services
Mixed Chart
Deloitte
Add to my slides
Remove from favorites
The slide features a column chart depicting managers' top three talent management priorities. On the left side, there is an image of a group of professionals in a meeting. The chart uses a mix of orange and red shades to represent different priorities.
Human Resources and Talent Management
Financial Services
The slide highlights that retaining talent is the top priority for managers, followed by hiring/recruiting and ensuring an inclusive culture. It shows that talent retention is critical, particularly in EMEA and Asia-Pacific regions.
Talent retention, recruiting, inclusive culture, diversity, hybrid work, employee productivity
false
Human Resources and Talent Management
Financial Services
Mixed Chart
EY
Add to my slides
Remove from favorites
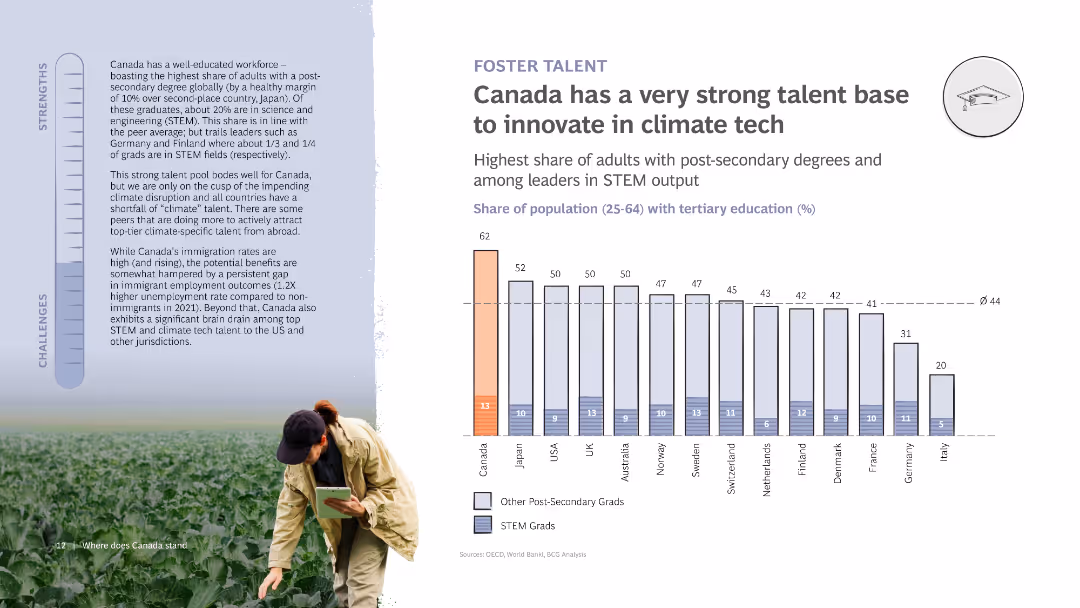
The slide features a column chart comparing tertiary education levels in various countries. It includes a photo of a person in a field, a strengths and challenges bar, and detailed text discussing Canada's educational strengths.
Human Resources and Talent Management
Education & Training
Discusses Canada's strong educational base for climate tech innovation, highlighting high post-secondary education rates and STEM graduates. Includes challenges in immigration rates and talent retention.
Talent, Innovation, Climate tech, Education, Canada
false
Human Resources and Talent Management
Education & Training
Mixed Chart
BCG
Add to my slides
Remove from favorites
White background with a single purple column chart on talent confidence in NYC
Human Resources and Talent Management
Technology & Software
It shows the confidence levels of companies in securing tech skills from New York City's talent pool
Talent, NYC, Confidence, Tech Skills, Workforce
false
Human Resources and Talent Management
Technology & Software
Multiple Chart
Accenture
Add to my slides
Remove from favorites
Orange background with percentage statistics on CEO actions: promoting diversity, moving talent, seeking talent, and using data analytics. Text discusses recruitment trends and challenges.
Human Resources and Talent Management
Professional Services
The slide details CEO strategies for attracting and retaining talent, highlighting diversity, mobility, and data analytics in talent management practices.
Talent, Recruitment, CEOs, Diversity, Mobility, Data analytics, Talent management, Strategies, Trends, Challenges
false
Human Resources and Talent Management
Professional Services
Multiple Chart
PwC/Strategy&
Add to my slides
Remove from favorites
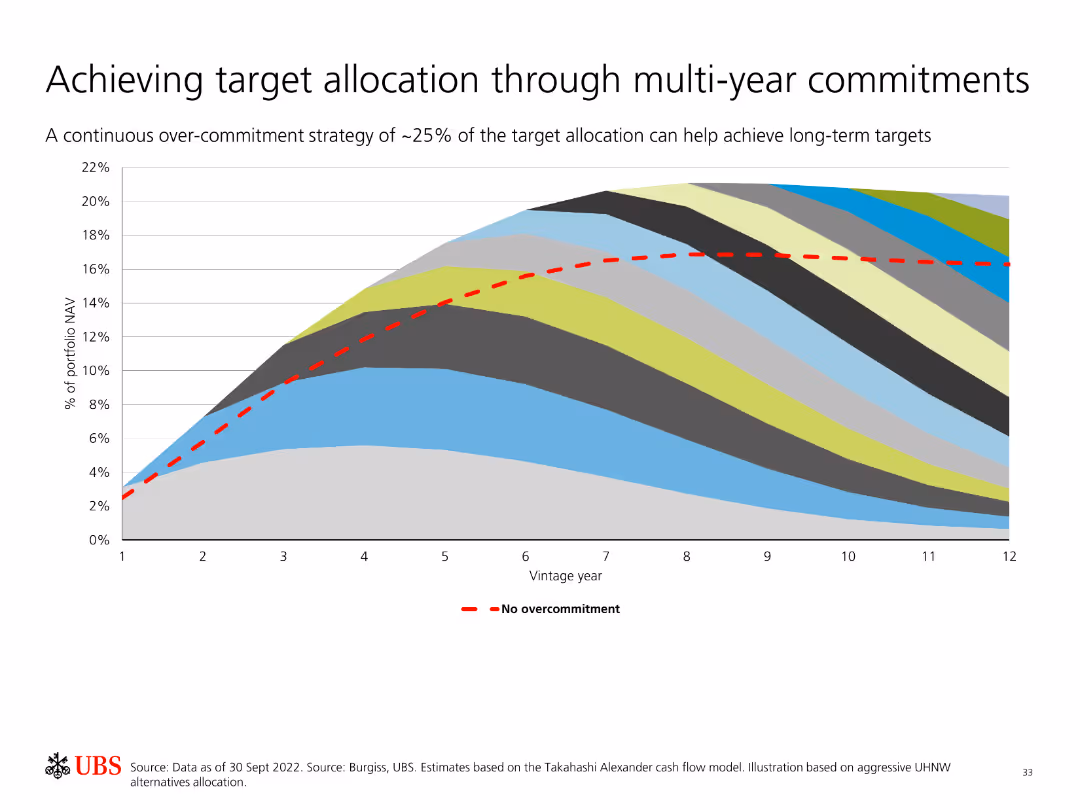
Features an area chart showing portfolio NAV over vintage years with a continuous over-commitment strategy compared to no overcommitment.
Strategic Planning
Financial Services
Discusses the benefits of a continuous over-commitment strategy to achieve target portfolio allocation over multiple years, using historical data for illustration.
Target Allocation, Multi-Year Commitments, Portfolio NAV, Over-Commitment, Strategy, Investment, Analysis, Historical Data, Planning
false
Strategic Planning
Financial Services
Single Chart
UBS
Add to my slides
Remove from favorites
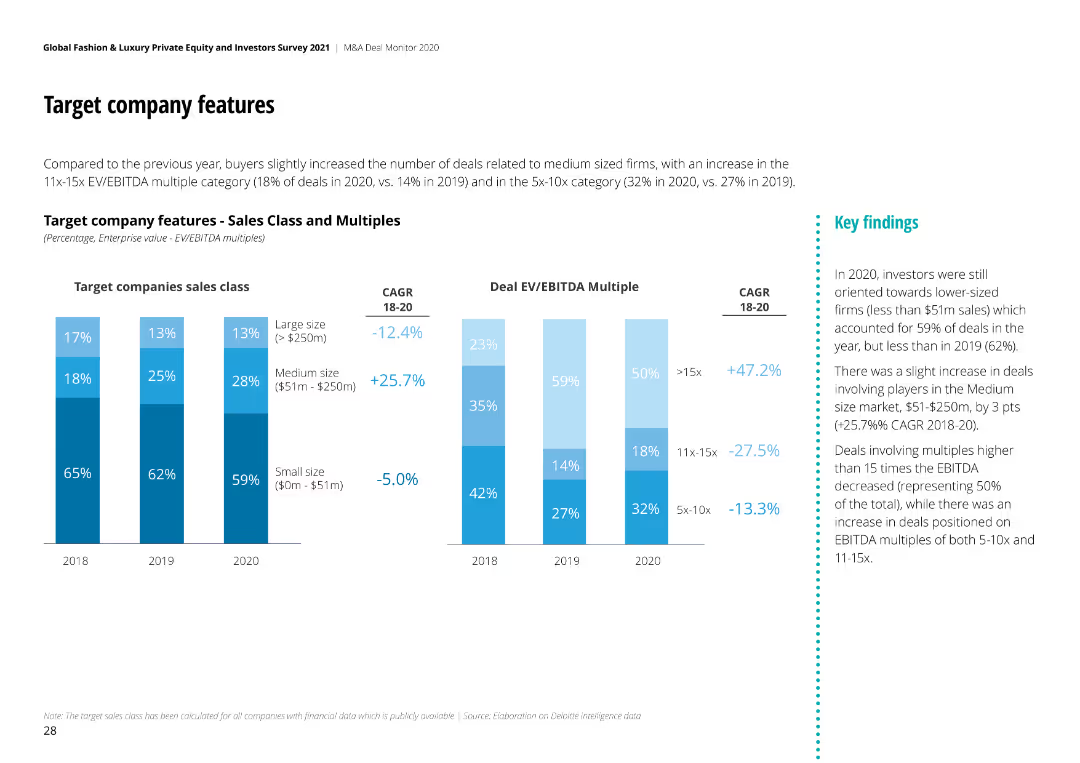
The slide shows bar charts comparing target company features by sales class and deal EV/EBITDA multiples for 2018-2020.
Investment Analysis
Consumer Goods
It examines features of target companies in M&A deals, focusing on sales class and valuation multiples over three years.
Target Company, Sales Class, EV/EBITDA, M&A, 2020
false
Investment Analysis
Consumer Goods
Multiple Chart
Deloitte
Add to my slides
Remove from favorites
Bar charts, color-coded data, comparative analysis.
Financial Performance
Financial Services
Outlines progress towards business targets and the financial returns for shareholders.
Targets, returns, growth, investment banking, equity, overhead, discipline, finance
false
Financial Performance
Financial Services
Table
JP Morgan
Add to my slides
Remove from favorites
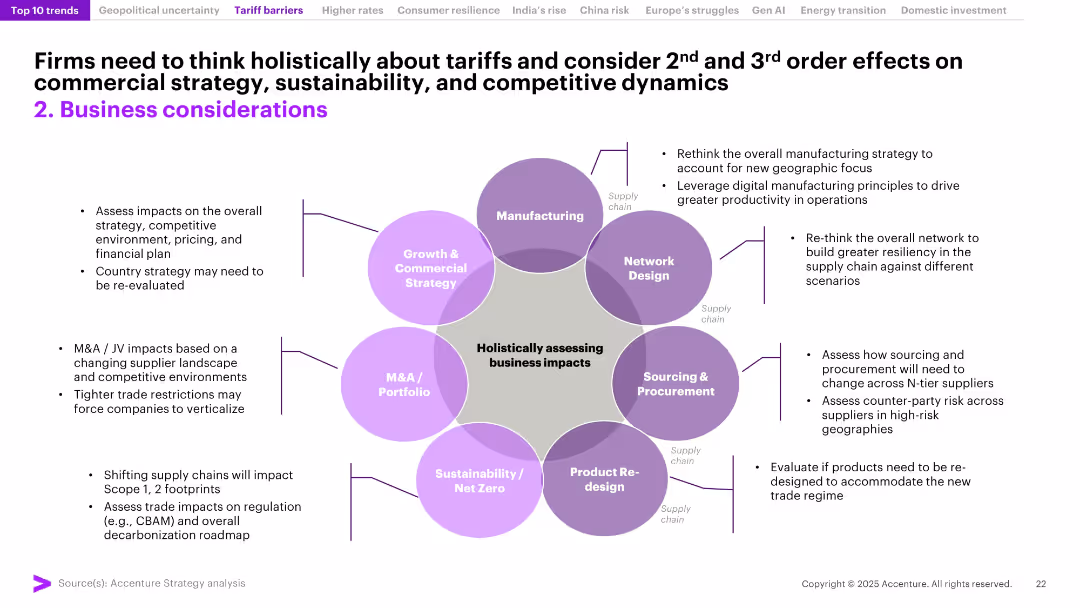
Central circular framework with six connected business functions, each surrounded by detailed impacts of tariffs. Clean, strategy-style slide with purple highlights.
Regulatory and Compliance
Professional Services
This slide emphasizes the second- and third-order impacts of tariffs on key business areas such as supply chains, procurement, sustainability, and manufacturing. Encourages firms to re-evaluate strategies across their operations in response to trade and tariff shifts.
Tariffs, Supply Chain, Strategy, Compliance, Procurement, M&A, Net Zero, Business Impact, 2025, Trade Risk
false
Regulatory and Compliance
Professional Services
Framework
Accenture
Add to my slides
Remove from favorites
Includes line charts showing tax revenue and household consumption over time under low and high growth scenarios. Text explains fiscal and consumption benefits.
Financial Performance
Energy & Utilities
Explains how increased oil and gas investment can bolster tax revenues and household spending, with detailed projections under different growth scenarios.
Tax Revenue, Household Consumption, Economic Growth, Oil and Gas, Investment, Fiscal Impact, Western Australia
false
Financial Performance
Energy & Utilities
Multiple Chart
EY
Add to my slides
Remove from favorites
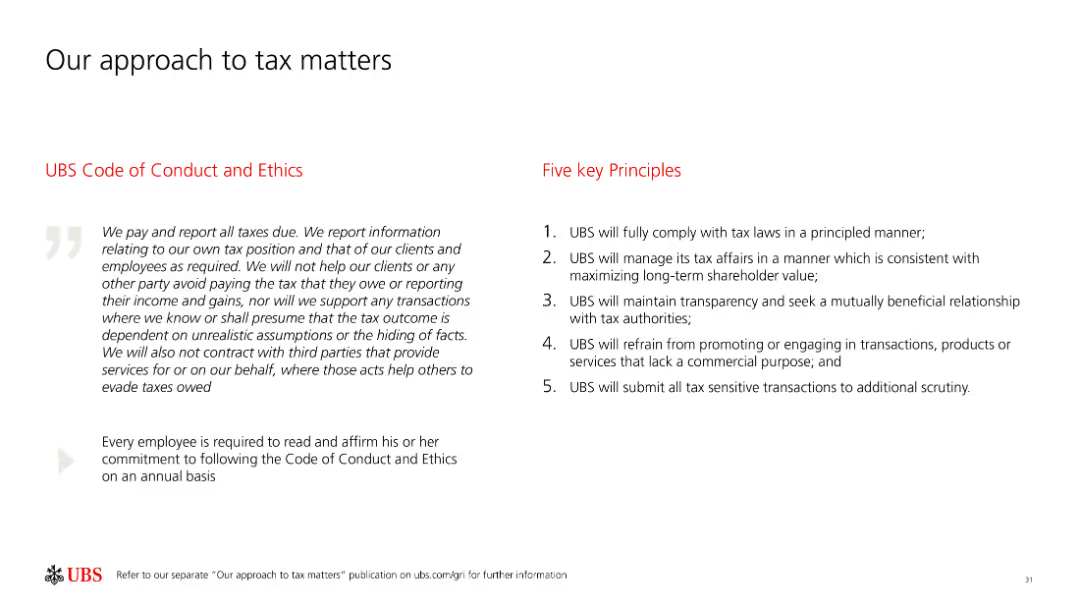
The slide presents text outlining UBS's Code of Conduct and Ethics along with five key principles related to tax compliance and ethical tax practices.
Regulatory and Compliance
Financial Services
It outlines UBS's approach to tax compliance, emphasizing ethical practices, transparency, and adherence to tax laws through a clear code of conduct and guiding principles.
Tax compliance, UBS, ethics, transparency, principles
false
Regulatory and Compliance
Financial Services
Header Horizontal
UBS
Add to my slides
Remove from favorites
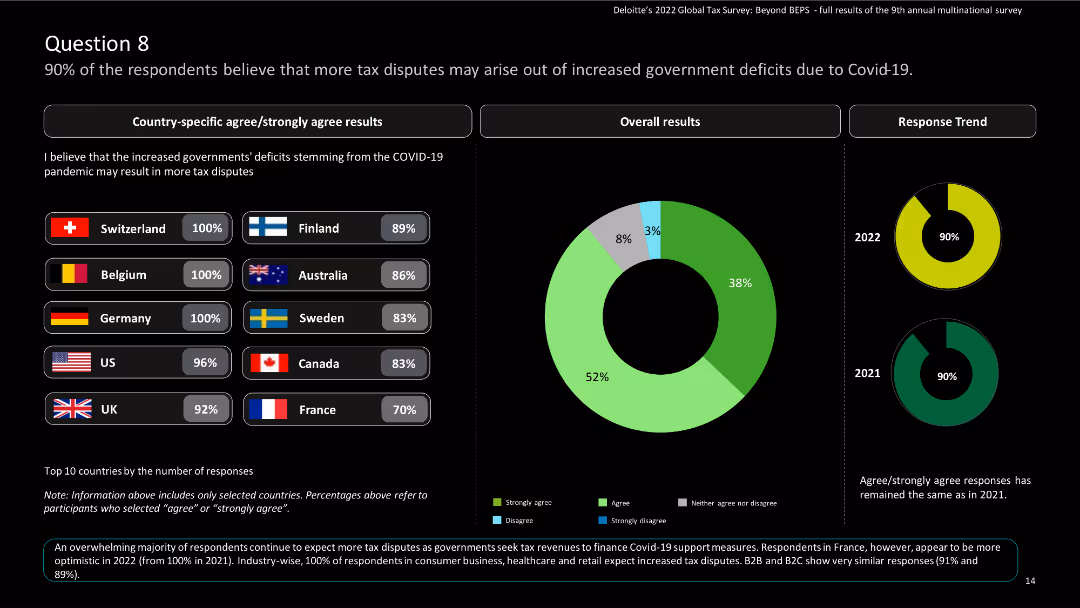
The slide features country-specific results and a pie chart showing overall results and response trend results over the years.
Regulatory and Compliance
Financial Services
The slide emphasizes the expectation of increased tax disputes due to government deficits caused by COVID-19.
Tax disputes, government deficits, COVID-19, global tax, Deloitte, agree, strongly agree, survey, multinational
false
Regulatory and Compliance
Financial Services
Multiple Chart
Deloitte
Add to my slides
Remove from favorites
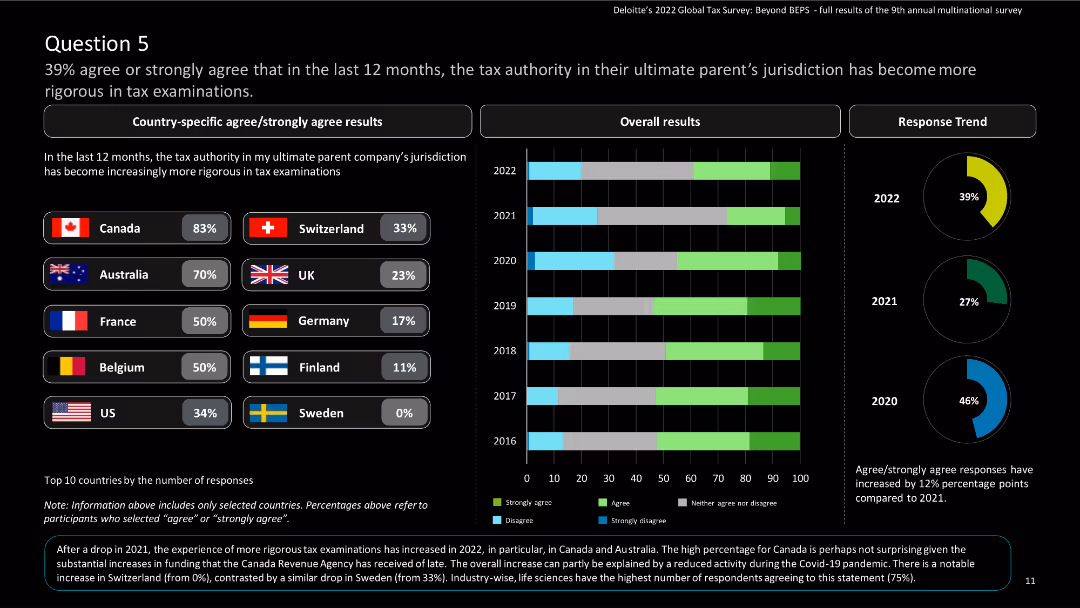
The slide features country-specific results and a column chart showing overall and response trend results over the years.
Regulatory and Compliance
Financial Services
The slide highlights the increasing rigor of tax examinations by the tax authority in the parent company’s jurisdiction.
Tax examinations, rigor, global tax, Deloitte, agree, strongly agree, survey, multinational
false
Regulatory and Compliance
Financial Services
Multiple Chart
Deloitte
Add to my slides
Remove from favorites
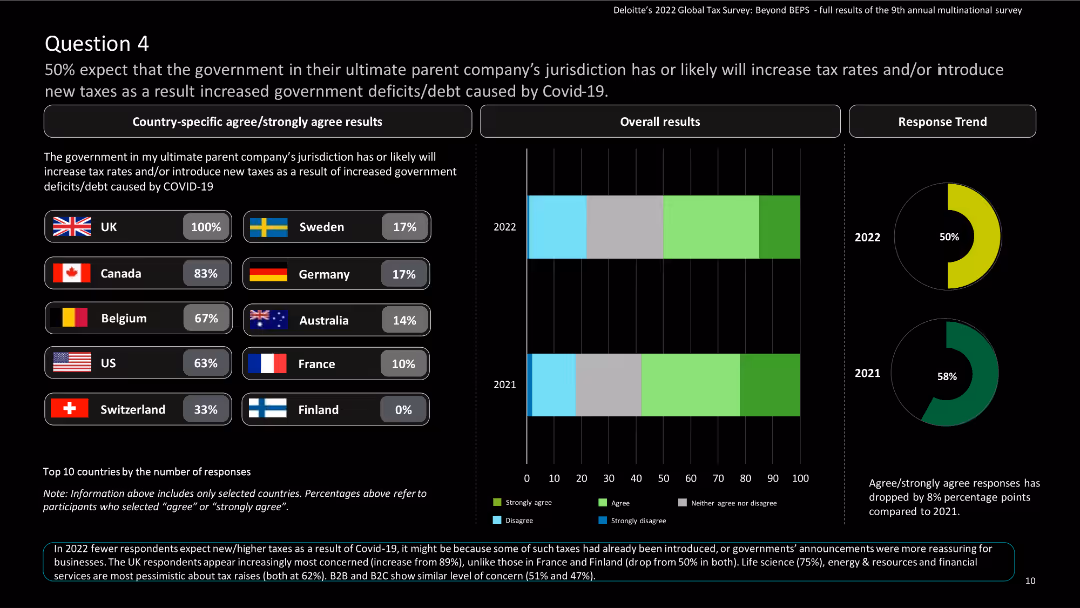
The slide features country-specific results and a column chart showing overall and response trend results over the years.
Regulatory and Compliance
Financial Services
The slide discusses the expectation of increased tax rates due to government deficits caused by COVID-19.
Tax rates, government deficits, COVID-19, global tax, Deloitte, agree, strongly agree, survey, multinational
false
Regulatory and Compliance
Financial Services
Multiple Chart
Deloitte
Add to my slides
Remove from favorites
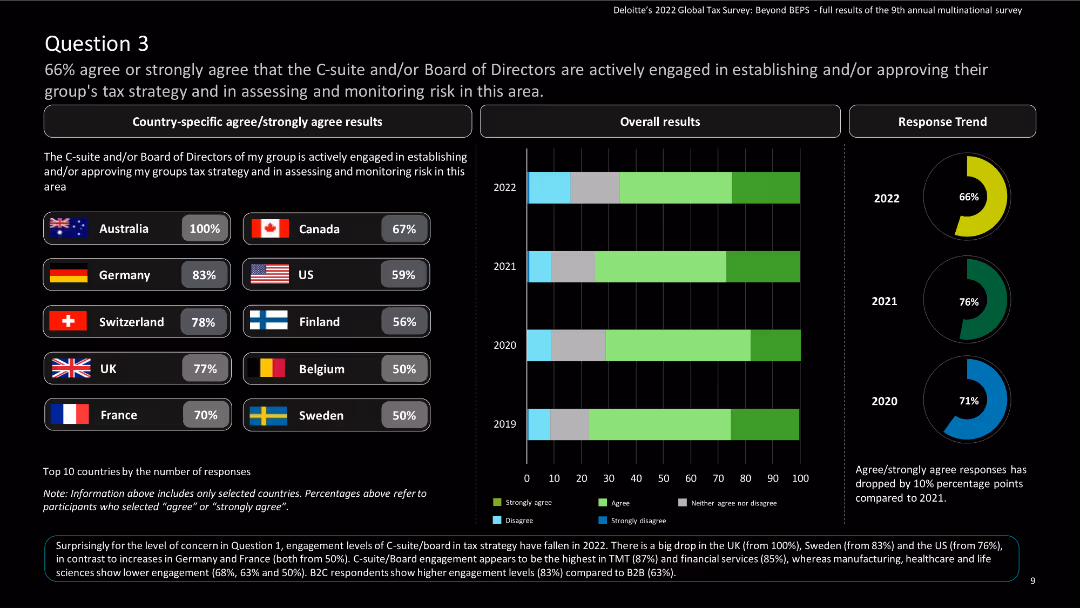
The slide features country-specific results and a column chart showing overall and response trend results over the years.
Regulatory and Compliance
Financial Services
The slide highlights C-suite and board engagement in tax strategy and monitoring risk, indicating high engagement in most countries.
Tax strategy, risk monitoring, C-suite, board engagement, global tax, Deloitte, agree, strongly agree, survey, multinational
false
Regulatory and Compliance
Financial Services
Multiple Chart
Deloitte
Add to my slides
Remove from favorites
Incorporates icons and split arrows to visualize proposed changes in tax regulations for 2018, focusing on manufacturing, economic zones, and individual tax brackets.
Regulatory and Compliance
Government & Public Sector
Details proposed tax amendments in Namibia and their expected revenue impacts, essential for stakeholders in policy-making and fiscal planning. The slide outlines changes aimed at enhancing revenue through adjustments in tax structures.
Tax, Amendments, Revenue, Policy, Law
false
Regulatory and Compliance
Government & Public Sector
Framework
PwC/Strategy&
Add to my slides
Remove from favorites
This slide displays a comparative column chart of corporate tax rates across multiple Southern African countries, color-coded by country.
Competitive Landscape
Government & Public Sector
Compares corporate tax rates between Namibia and its neighboring countries to evaluate Namibia's competitive position in attracting business investments relative to regional peers.
Tax, Corporate, Comparison, Africa
false
Competitive Landscape
Government & Public Sector
Single Chart
PwC/Strategy&
Add to my slides
Remove from favorites
Details tax service offerings along the M&A lifecycle with a structured flowchart that links stages from Funds formation to Exit planning.
Investment Analysis
Professional Services
Explores the comprehensive tax services provided by Alvarez & Marsal throughout the M&A lifecycle, ensuring tax efficiency from start to finish.
Tax, M&A, Lifecycle, Services, Planning
false
Investment Analysis
Professional Services
Table
Alvarez & Marsal
Add to my slides
Remove from favorites
Displays a bar chart with vertical bars showing different tax categories, including VAT, corporate tax, and customs, with colors distinguishing the tax types.
Regulatory and Compliance
Government & Public Sector
The slide provides a detailed composition of tax revenue sources, quantifying each category such as VAT, individual income tax, and corporate tax. It highlights the fiscal landscape's dependence on various tax revenues, useful for policy analysis and economic planning.
Tax, Revenue, Fiscal analysis, Government, Budget
false
Regulatory and Compliance
Government & Public Sector
Single Chart
PwC/Strategy&
Add to my slides
Remove from favorites
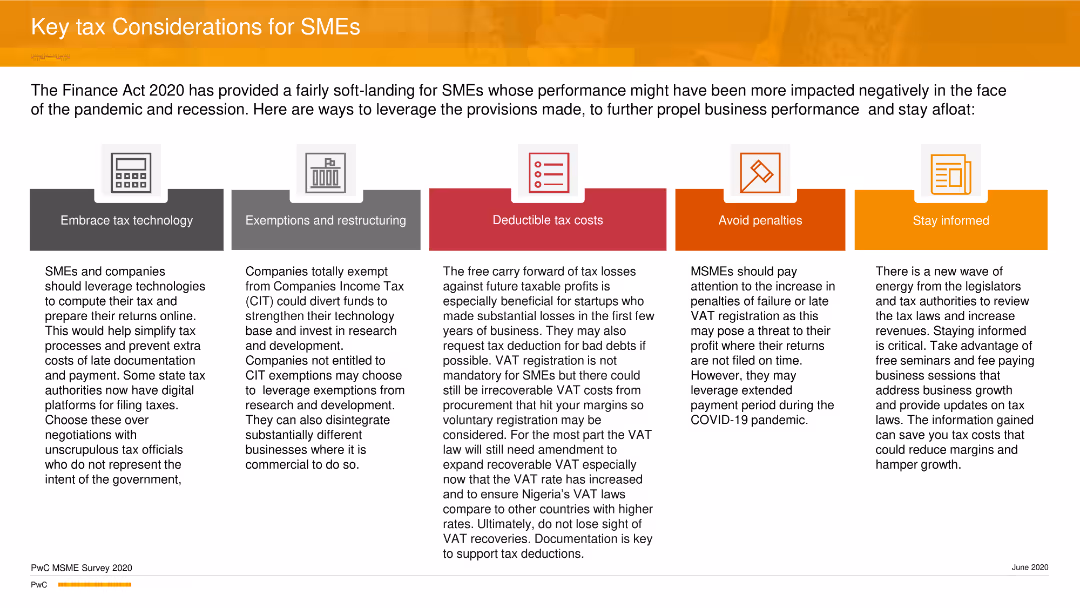
The slide features five icons representing key tax considerations: technology, exemptions, deductible costs, penalties, and staying informed.
Strategic Planning
Financial Services
The slide offers strategic tax considerations for SMEs, focusing on leveraging technology, understanding exemptions, managing deductible costs, avoiding penalties, and staying informed about tax laws to improve business performance during the pandemic and recession.
Tax, SMEs, Strategy, Planning, Business, PwC
false
Strategic Planning
Financial Services
Pillar
PwC/Strategy&
Add to my slides
Remove from favorites
Content slide with numbered sections and a central figure showing various tax and legal implications, with green and blue text and icons.
Regulatory and Compliance
Financial Services
This slide discusses the tax, social security, and legal implications of remote work, covering topics like shifting tax costs, increased tax risk, payroll reporting requirements, and compliance management.
Tax, legal, compliance, social security, remote work
false
Regulatory and Compliance
Financial Services
Diagram
Deloitte
Add to my slides
Remove from favorites
Left side features text discussing tax and regulatory frameworks, while the right side has a vertical bar chart showing expectations of Greece's attractiveness.
Regulatory and Compliance
Government & Public Sector
Analysis of how Greece can improve its investment appeal through modernizing tax and regulatory frameworks, addressing concerns, and simplifying processes.
Tax, regulatory framework, investment, Greece, compliance
false
Regulatory and Compliance
Government & Public Sector
Mixed Chart
EY
Add to my slides
Remove from favorites
The slide includes three connected diagrams representing taxable, tax-deferred, and tax-exempt assets with descriptions of their tax implications.
Financial Performance
Financial Services
The slide details different tax treatment categories for investment accounts, explaining the tax benefits and considerations of each type.
Taxable, Tax-deferred, Tax-exempt, Investment, Tax
false
Financial Performance
Financial Services
Diagram
UBS
Add to my slides
Remove from favorites
Slide with comparative column chart showing corporate income tax rates across ASEAN countries. Professional layout with a focus on clear data presentation.
Regulatory and Compliance
Financial Services
Discusses the changes in corporate income tax in the Philippines and compares it with other ASEAN countries, relevant for financial analysis.
Taxation, ASEAN, Philippines, corporate tax, comparative analysis
false
Regulatory and Compliance
Financial Services
Mixed Chart
Deloitte
Add to my slides
Remove from favorites
The slide shows a packet of cigarettes broken down into cost components (VAT, excise duty, actual cost) alongside a column chart displaying the number of cigarettes per cost component.
Regulatory and Compliance
Government & Public Sector
Explains the taxation and cost structure of cigarettes with a detailed graphical breakdown of each component's financial contribution to the total cost.
Taxation, cigarettes, VAT, excise duty, consumer cost
false
Regulatory and Compliance
Government & Public Sector
Mixed Chart
PwC/Strategy&
Add to my slides
Remove from favorites
The slide features a horizontal bar chart illustrating challenges in tax payment, such as multiple taxes and lack of coordination. An image of a woman with glasses is on the right side.
Regulatory and Compliance
Financial Services
It highlights the specific tax-related challenges businesses face, with multiple taxes and levies, and lack of coordination between federal and state tax agencies being prominent. It elaborates on the systemic issues in Nigeria's tax system.
Taxes, Challenges, Compliance, Coordination, PwC
false
Regulatory and Compliance
Financial Services
Mixed Chart
PwC/Strategy&
Add to my slides
Remove from favorites
A vertical column chart ranks the difficulty of compliance with various taxes and fees. An image of a man with glasses is featured on the right side.
Regulatory and Compliance
Financial Services
The slide examines the challenges MSMEs face in complying with different taxes, highlighting local government levies and company income tax as the most problematic. It discusses the reasons behind these difficulties.
Taxes, Compliance, MSMEs, Business, PwC
false
Regulatory and Compliance
Financial Services
Mixed Chart
PwC/Strategy&
Add to my slides
Remove from favorites
Slide with a pie chart detailing the breakdown of tax revenue sources such as income, customs, and excise taxes. No property taxes are shown, indicating a specific fiscal focus.
Financial Performance
Government & Public Sector
Analyzes Namibia's tax revenue composition for 2018/19, showing major contributions from income taxes and customs. The slide aids in understanding the emphasis on indirect taxation and customs duties in the country's revenue structure.
Taxes, Income, Customs, Indirect, Revenue
false
Financial Performance
Government & Public Sector
Single Chart
PwC/Strategy&
Add to my slides
Remove from favorites
The slide includes a vertical column chart showing the percentage of income/profits taken up by taxes/levies. An image of a man with a tablet is on the right side.
Financial Performance
Financial Services
It discusses the percentage of income or profits that businesses allocate to taxes and levies, with 49% of SMEs paying between 20-40%. It also highlights the impact of local government charges on overall tax compliance.
Taxes, Income, Profits, Business, PwC
false
Financial Performance
Financial Services
Mixed Chart
PwC/Strategy&
Add to my slides
Remove from favorites
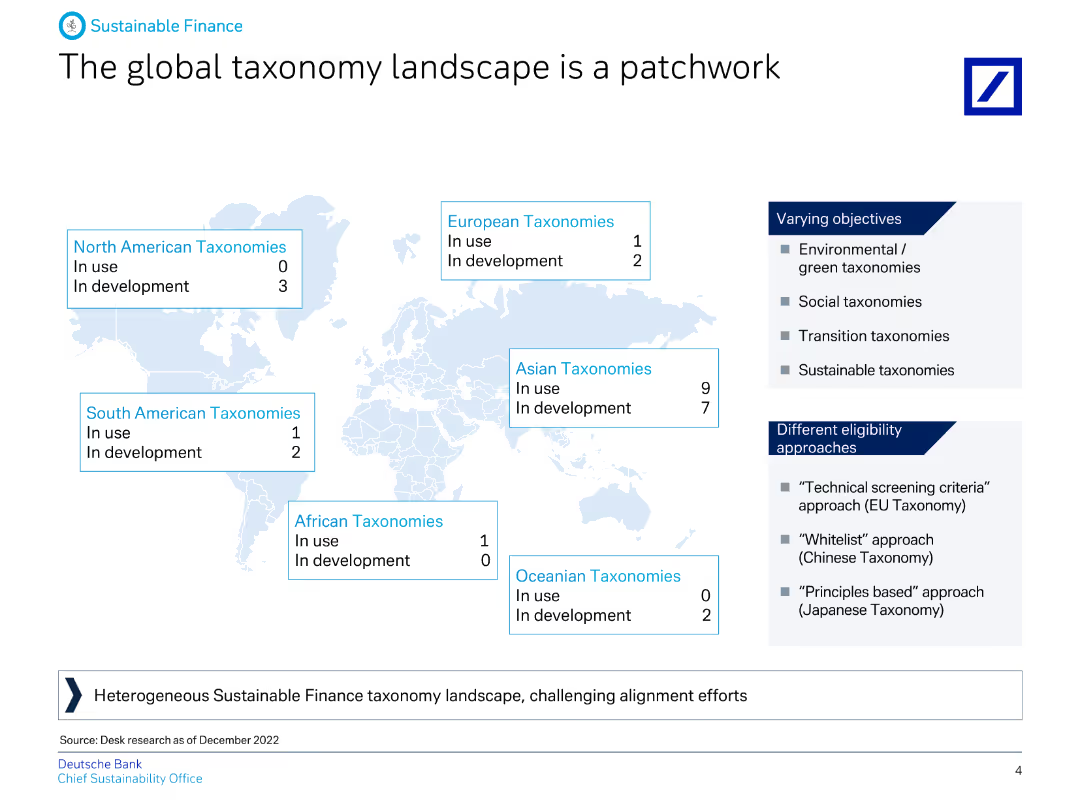
Features a world map showing the status of taxonomies in different regions, with accompanying text explaining the varying objectives and eligibility approaches.
Market Analysis and Trends
Financial Services
This slide provides an overview of the global taxonomy landscape, detailing the status and development of taxonomies in different regions and their varying objectives.
Taxonomy, global, finance, ESG, regions, objectives, eligibility, banking, sustainability, landscape
false
Market Analysis and Trends
Financial Services
Graphic
Deutsche Bank
Add to my slides
Remove from favorites
Features a central hexagon with various team effectiveness traits surrounded by related icons, a circle graph, and two small bar charts depicting related statistics.
Human Resources and Talent Management
Professional Services
Discussing top team effectiveness, this slide provides a framework for building a capable leadership team aligned with SDG goals. It underscores the importance of strategic alignment, stakeholder perspective, and interpersonal interactions to foster an effective, sustainable leadership environment.
Team Effectiveness, Leadership, SDGs, Strategic Alignment, Stakeholder Engagement
false
Human Resources and Talent Management
Professional Services
Multiple Chart
McKinsey
Add to my slides
Remove from favorites
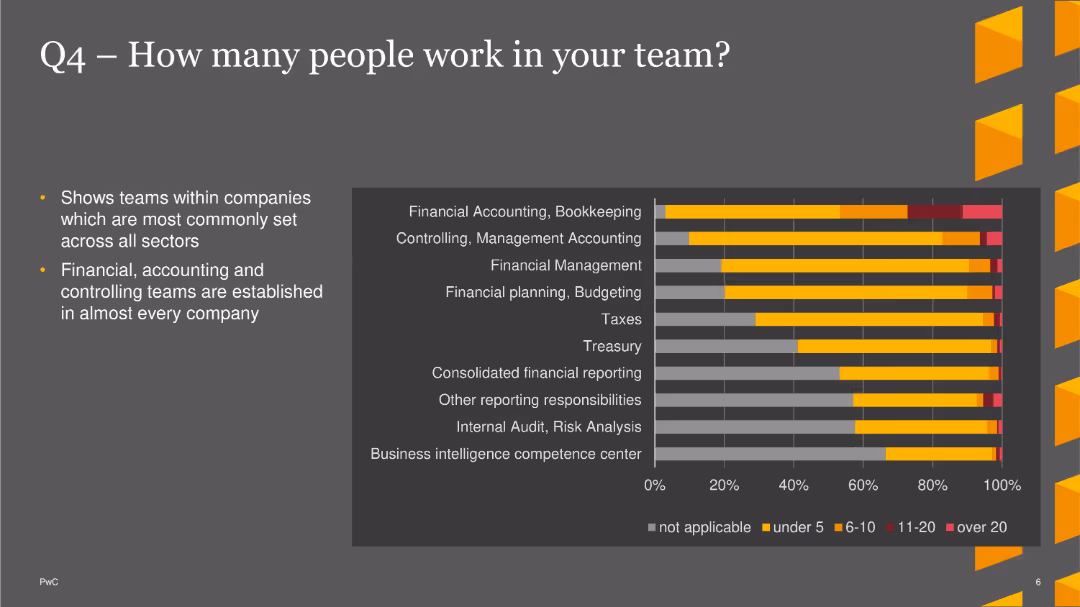
The slide features a bar chart showing the number of people in different teams across various sectors, highlighting common team sizes.
Market Analysis and Trends
Financial Services
This slide shows that financial, accounting, and controlling teams are common across companies, with detailed distribution of team sizes.
Team Size, Financial, Accounting, Bar Chart, PwC, Survey, 2022
false
Market Analysis and Trends
Financial Services
Mixed Chart
PwC/Strategy&
Add to my slides
Remove from favorites
The slide outlines team, category, and supplier excellence pillars with icons and a diagram of Kearney's House of Purchasing and SupplySM.
Human Resources and Talent Management
Professional Services
It describes the pillars for sustained procurement performance, highlighting the roles of team excellence, category excellence, and supplier excellence.
Team excellence, category excellence, supplier excellence, procurement, performance, talent
false
Human Resources and Talent Management
Professional Services
Diagram
Kearney
Add to my slides
Remove from favorites
The slide outlines team, category, and supplier excellence pillars with icons and a diagram of Kearney's House of Purchasing and SupplySM.
Human Resources and Talent Management
Professional Services
It describes the pillars for sustained procurement performance, highlighting the roles of team excellence, category excellence, and supplier excellence.
Team excellence, category excellence, supplier excellence, procurement, performance, talent
false
Human Resources and Talent Management
Professional Services
Header Vertical
Kearney
Add to my slides
Remove from favorites
The slide contrasts fintech, metaverse, healthtech, and edtech sectors with lists of top drivers and barriers, and a feature image of a woman using a smartphone.
Market Analysis and Trends
Technology & Software
Highlights the main drivers and barriers to adoption for new technologies like e-wallets, AR, VR, and online courses, essential for strategic planning.
Tech Adoption, Drivers, Barriers, Fintech, Metaverse, Healthtech, Edtech, Strategic Planning
false
Market Analysis and Trends
Technology & Software
Table
Bain
Add to my slides
Remove from favorites
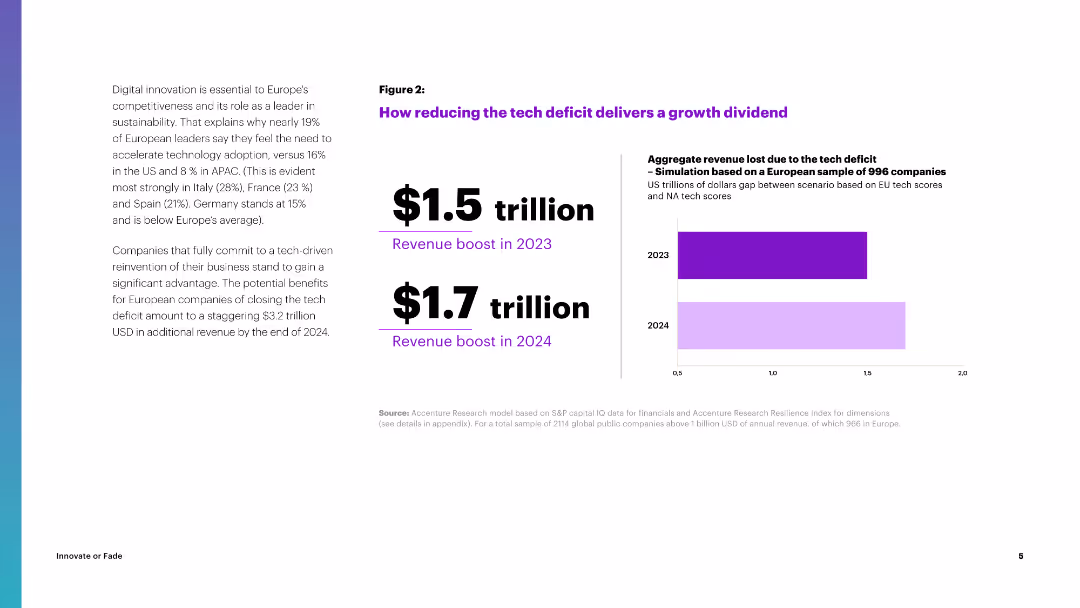
The slide features a column chart illustrating the projected revenue boost from reducing the tech deficit in Europe, with figures for 2023 and 2024.
Strategic Planning
Financial Services
It explains the potential revenue gains from reducing the tech deficit in Europe, projecting significant financial benefits by 2024, emphasizing the importance of tech adoption.
Tech Deficit, Revenue, Growth, Europe, Financial Benefits
false
Strategic Planning
Financial Services
Mixed Chart
Accenture
Add to my slides
Remove from favorites
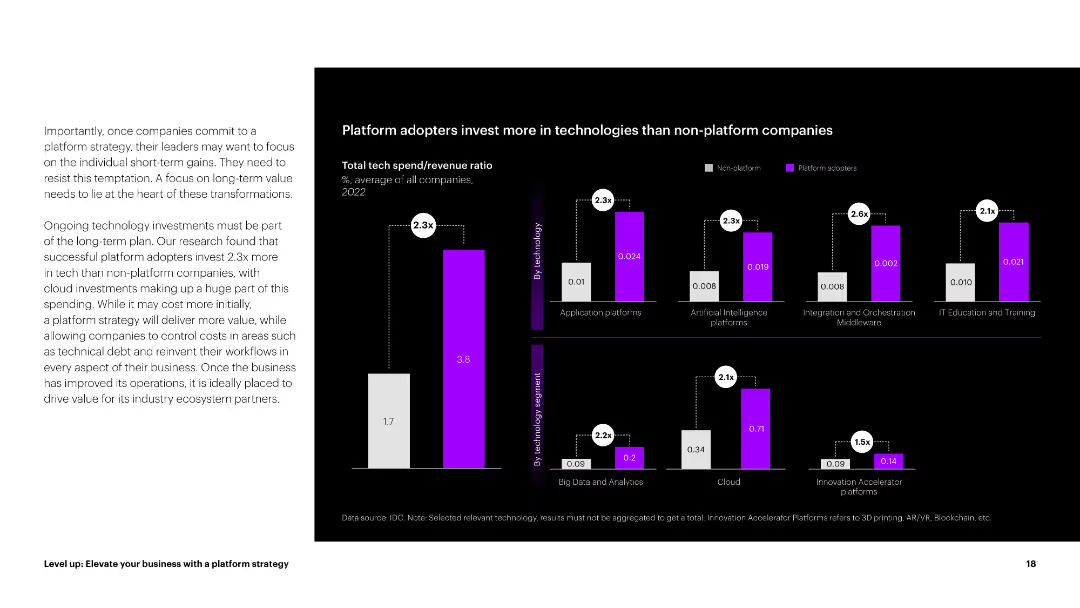
White background with black and purple column charts comparing tech investment ratios
Investment Analysis
Technology & Software
It compares the technology investment ratios of platform adopters to non-platform companies
Tech Investment, Ratios, Platform, Non-Platform, Technology Spend
false
Investment Analysis
Technology & Software
Mixed Chart
Accenture
Add to my slides
Remove from favorites
A column chart showing the percentage of companies with tech-fluent C-suite and board members. Text elaborates on the importance of tech-savvy leadership in addressing business challenges.
Organizational Structure and Change
Technology & Software
The slide emphasizes the significance of having tech-fluent leadership in the C-suite and board, supported by a column chart comparing tech mindset metrics.
Tech Mindset, Leadership, C-suite, Board, Business Challenges
false
Organizational Structure and Change
Technology & Software
Mixed Chart
Accenture
Add to my slides
Remove from favorites
White background with purple column charts showing tech hiring trends
Human Resources and Talent Management
Technology & Software
The slide discusses tech hiring trends for 2023, focusing on demand and changes in degree requirements
Tech Talent, Hiring Trends, Workforce, Degree Requirements, Restructuring
false
Human Resources and Talent Management
Technology & Software
Multiple Chart
Accenture
Add to my slides
Remove from favorites
Features a detailed map of the UK highlighting major tech hubs outside London. Includes numerical data points and specific locations marked to emphasize the concentration of tech sectors.
Market Analysis and Trends
Technology & Software
Analyzes the distribution and growth of high-tech ecosystems across the UK, with a specific focus on cities like Edinburgh, Manchester, and Leeds. It highlights the number of high-growth companies in each city.
Tech hubs, UK, ecosystems
false
Market Analysis and Trends
Technology & Software
Mixed Chart
Barclays
Add to my slides
Remove from favorites
Slide features a bar chart illustrating equity deals by investor in Edinburgh's tech sector. Includes key investor names and deal counts.
Investment Analysis
Technology & Software
Reviews key investors in Edinburgh's tech sector from 2011 to 2020, highlighting their contributions in terms of deal counts and support to the tech ecosystem. Focuses on major investors like Scottish Enterprise.
Tech investment, Edinburgh, investors
false
Investment Analysis
Technology & Software
Mixed Chart
Barclays
Add to my slides
Remove from favorites
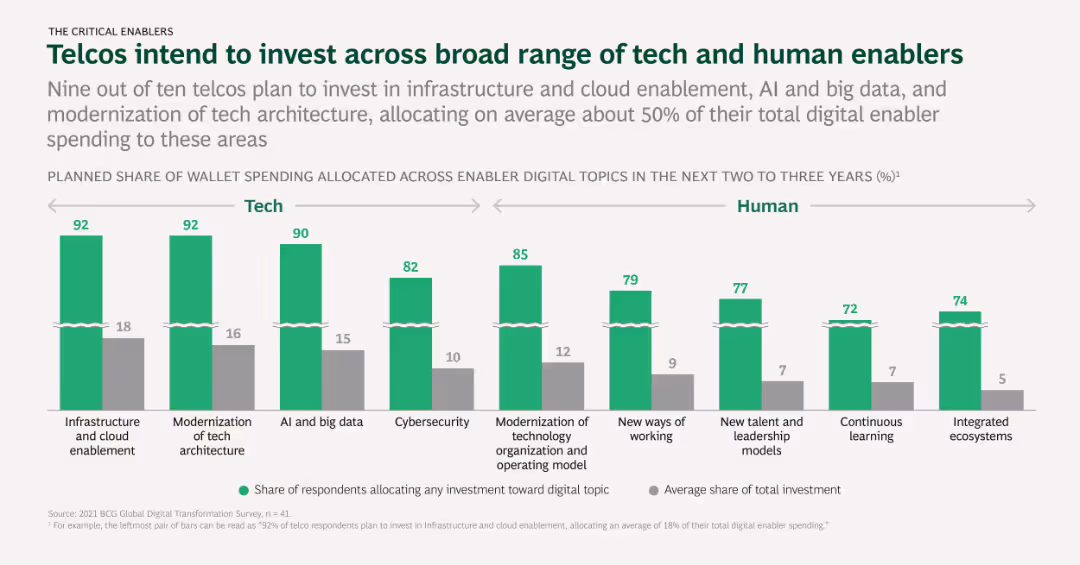
Column chart illustrating telcos' planned investments across tech and human enablers, with percentages indicating allocation and average investment shares.
Investment Analysis
Telecommunications
The slide presents telcos' planned investments in various tech and human enablers over the next two to three years, such as AI, big data, and talent development.
Tech investment, Human enablers, AI, Big data, Talent development
false
Investment Analysis
Telecommunications
Mixed Chart
BCG
Add to my slides
Remove from favorites
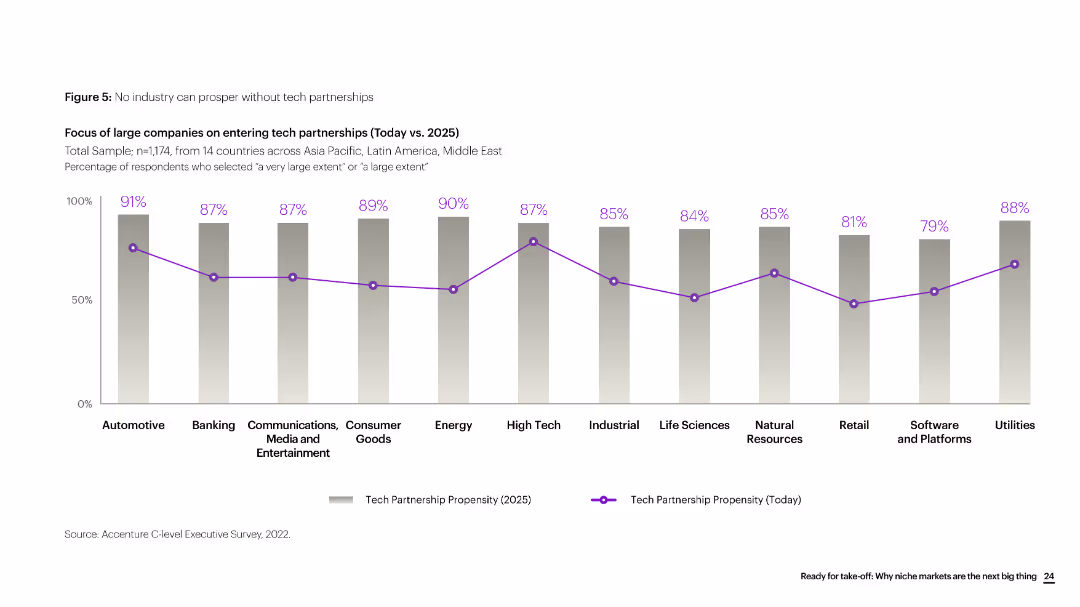
Column chart showing the percentage of companies in various industries with a propensity for tech partnerships today vs. in 2025.
Market Analysis and Trends
Technology & Software
Analysis of companies' focus on tech partnerships across different industries, comparing current data with future predictions for 2025.
Tech partnerships, industries, trends, analysis, 2025, comparison, future predictions, technology, market analysis, survey
false
Market Analysis and Trends
Technology & Software
Single Chart
Accenture
Add to my slides
Remove from favorites
The slide features a 3D block diagram representing the common tech stack for IPSOS services, with labels indicating different product elements and shared platform elements.
Technology and Digital Transformation
Technology & Software
The slide describes the common technology stack used by IPSOS for various services, highlighting the shared platform elements and unique product elements like SIMSTORE and Knowledge Panel.
Tech stack, IPSOS, services, platform, elements, SIMSTORE, Knowledge Panel, digital, common, products
false
Technology and Digital Transformation
Technology & Software
Diagram
IPSOS
Add to my slides
Remove from favorites
A bar chart showing the percentage distribution of tech-forward companies across various industries. Text discusses the representation of tech-forward companies in different sectors.
Market Analysis and Trends
Technology & Software
The slide provides an analysis of how tech-forward companies are distributed across multiple industries, with a bar chart highlighting sector representation.
Tech-Forward, Industry Distribution, Sector Analysis, Representation, Trends
false
Market Analysis and Trends
Technology & Software
Mixed Chart
Accenture
Add to my slides
Remove from favorites
Various column charts comparing financial performance metrics (ROIC, shareholder return, resilience index) between tech-forward companies and others. Text explains these performance advantages.
Performance Metrics and KPIs
Technology & Software
The slide compares the performance of tech-forward companies to their peers, highlighting superior financial metrics and resilience.
Tech-Forward, Performance, Financial Metrics, Resilience, Comparison
false
Performance Metrics and KPIs
Technology & Software
Multiple Chart
Accenture
Add to my slides
Remove from favorites
Line chart showing the GDP per capita from 1820 to 2020 for various regions, segmented by different technological ages (e.g., Industrial Revolution, Age of ICT).
Technology and Digital Transformation
Technology & Software
This slide tracks the historical development of GDP per capita in various regions alongside major technological breakthroughs from the Industrial Revolution to Industry 4.0. It underscores the significant impact of technological advancements on economic growth and prosperity.
Technological Breakthroughs, GDP, Historical Development
false
Technology and Digital Transformation
Technology & Software
Mixed Chart
Roland Berger
Add to my slides
Remove from favorites
Rocket-shaped diagram with five steps explaining how emerging countries can increase their technological competitiveness. Text details each step, from FDI to robust educational systems.
Technology and Digital Transformation
Technology & Software
The slide outlines a five-step approach for emerging countries to enhance their technological competitiveness. It emphasizes the role of FDI, capital inflows, robust educational systems, and sectoral supply chains in transforming these countries into competitive innovation leaders.
Technological Competitiveness, Emerging Countries, FDI
false
Technology and Digital Transformation
Technology & Software
Vertical Flow
Roland Berger
Add to my slides
Remove from favorites
Line chart showing the global risks landscape for technological risks, plotting impact versus likelihood.
Technology and Digital Transformation
Technology & Software
The slide presents a global risk assessment for technological advancements, highlighting the perceived risks and their impact versus likelihood. It focuses on the different risk perceptions between generations, particularly regarding tech advances, digital power concentration, and digital inequality.
Technological Risk, Risk Perception, Innovations
false
Technology and Digital Transformation
Technology & Software
Mixed Chart
Roland Berger
Add to my slides
Remove from favorites
The slide presents a vertical bar chart showing survey responses on the concern that technological progress is destroying lives across various countries.
Market Analysis and Trends
Technology & Software
The slide displays survey data reflecting global concerns about the negative impacts of technological progress on daily life.
Technological progress, global survey, public opinion, technology concerns, survey
false
Market Analysis and Trends
Technology & Software
Multiple Chart
IPSOS
Add to my slides
Remove from favorites
A column chart showing the reduction in cost per private transaction over time, with significant drops from the prototype stage to Nightfall introduction and further with batching. Includes bullet points about the technological progress and regulatory compliance features.
Technology and Digital Transformation
Technology & Software
Details the technological advancements made in reducing transaction costs on public blockchains, highlighting significant milestones and the role of regulatory compliance.
Technological progress, private transactions, business agreements, public blockchains, cost reduction, regulatory compliance
false
Technology and Digital Transformation
Technology & Software
Mixed Chart
EY
Add to my slides
Remove from favorites
Bar chart showing the number of years until 25% of the US population adopted various technologies, from electricity to tablets. Text discusses the increasing speed of technology adoption over time.
Technology and Digital Transformation
Technology & Software
The slide presents the accelerating pace of technology adoption in the US, comparing different technologies' adoption rates from the late 19th century to the present. It emphasizes how the faster adoption of new technologies is crucial for driving economic growth and adapting to rapid changes in the tech landscape.
Technology Adoption, US, Speed, Economic Growth
false
Technology and Digital Transformation
Technology & Software
Mixed Chart
Roland Berger
Add to my slides
Remove from favorites
A grid layout with icons and text describes different technology implementation strategies. The design is instructional, with clear delineation between the models and a blue and black color scheme for readability.
Technology and Digital Transformation
Professional Services
This slide examines four archetypes of technology implementation within organizations. It's pivotal for leadership discussions about technology adoption, indicating the necessity for a strategic fit with existing business models and highlighting how ecosystems can facilitate technology integration.
Technology Implementation, Strategy, Business Model, Ecosystems, Organizational Fit
false
Technology and Digital Transformation
Professional Services
Header Horizontal
McKinsey
Add to my slides
Remove from favorites
This slide displays a technology portfolio applicable across the mining value chain. It uses icons and a curved line to represent the exploration to extraction process, flanked by images and text explaining the technology use at each stage.
Product and Service Analysis
Industrial & Manufacturing
The slide provides an overview of technology applications throughout the mining process, suitable for discussing product breadth and the value each technology brings at different stages.
Technology Portfolio, Mining, Value Chain, Applications, Product Breadth
false
Product and Service Analysis
Industrial & Manufacturing
Diagram
Morgan Stanley
Add to my slides
Remove from favorites
The slide displays a column chart showing the progression of IT spend over four years, split into categories such as 'Core Infrastructure & Modernization', 'Risk and Information Security', and 'Business-Driven'. Adjacent to the chart is a list of bullet points elaborating on each category.
Financial Performance
Financial Services
Communicates Northern Trust's IT budget allocation, with an emphasis on foundational and business-driven applications. It provides financial insights into how resources are being distributed for client experience, risk management, and core infrastructure, intending to inform stakeholders of investment focuses and priorities.
Technology Spend, Infrastructure, Security, Business-Driven, CAGR
false
Financial Performance
Financial Services
Mixed Chart
Morgan Stanley
Add to my slides
Remove from favorites
A layered diagram slide, detailed with icons and labels. It presents a technology stack with an integrated model including Client Interaction, Orchestration, and Core Processing layers.
Technology and Digital Transformation
Technology & Software
Describes the structure of J.P.Morgan's payment business's technology stack and the components that enable their service offerings.
Technology Stack, Payments, J.P.Morgan, Integration, Engineering, Fintech Partnerships
false
Technology and Digital Transformation
Technology & Software
Table
JP Morgan
Add to my slides
Remove from favorites
This title slide showcases a sophisticated design with geometric cloud and edge computing icons over a dark blue background, emphasizing the topic of cloud and edge computing for the year 2022.
Technology and Digital Transformation
Technology & Software
Introducing McKinsey's 2022 Technology Trends, the slide is designed to set the stage for a detailed discussion on cloud and edge computing, highlighting it as a significant subject in the current technological landscape.
Technology Trends, Cloud Computing, Edge Computing, 2022
false
Technology and Digital Transformation
Technology & Software
Title
McKinsey
Add to my slides
Remove from favorites
Features a heat map-like graphic illustrating the varied impact of tech trends across sectors. The design is data-centric, color-coded for ease of interpretation.
Technology and Digital Transformation
Technology & Software
This data-rich slide compares the influence of various technology trends across multiple sectors, essential for industry analysis sessions where strategic decisions are based on tech trend impacts. It visually communicates where businesses should focus their technological advancements and R&D efforts.
Technology Trends, Impact, Heat Map, Sectors, Analysis, Data Visualization, R&D, Strategic Focus
false
Technology and Digital Transformation
Technology & Software
Single Chart
McKinsey
Add to my slides
Remove from favorites
The slide presents a line chart showing technology adoption rates in US households over time, color-coded by technology type. Key observations about the impact of world events on technology adoption are summarized on the right.
Market Analysis and Trends
Technology & Software
This slide examines the historical trends in technology adoption among US households, noting that major world events generally do not hinder technological progress, with some delays observed during WWII.
Technology adoption, US households, historical trends, world events, resilience
false
Market Analysis and Trends
Technology & Software
Mixed Chart
EY
Add to my slides
Remove from favorites
Two-column layout with text on the left and a column chart illustrating challenges on the right. There is moderate text density.
Market Analysis and Trends
Technology & Software
Highlights challenges in implementing strategic investments in contact centers, such as system integration, change management, and budget constraints.
Technology challenges, Contact centers, System integration, Change management, Budget constraints, Strategic investments
false
Market Analysis and Trends
Technology & Software
Single Chart
Deloitte
Add to my slides
Remove from favorites
The slide features vertical bar charts comparing survey responses by age groups on their concerns about technology and internet reliance.
Market Analysis and Trends
Technology & Software
The slide presents data showing that younger people are more likely to express concerns about technology and their dependency on the internet.
Technology concerns, age groups, internet reliance, public opinion, survey
false
Market Analysis and Trends
Technology & Software
Multiple Chart
IPSOS
Add to my slides
Remove from favorites
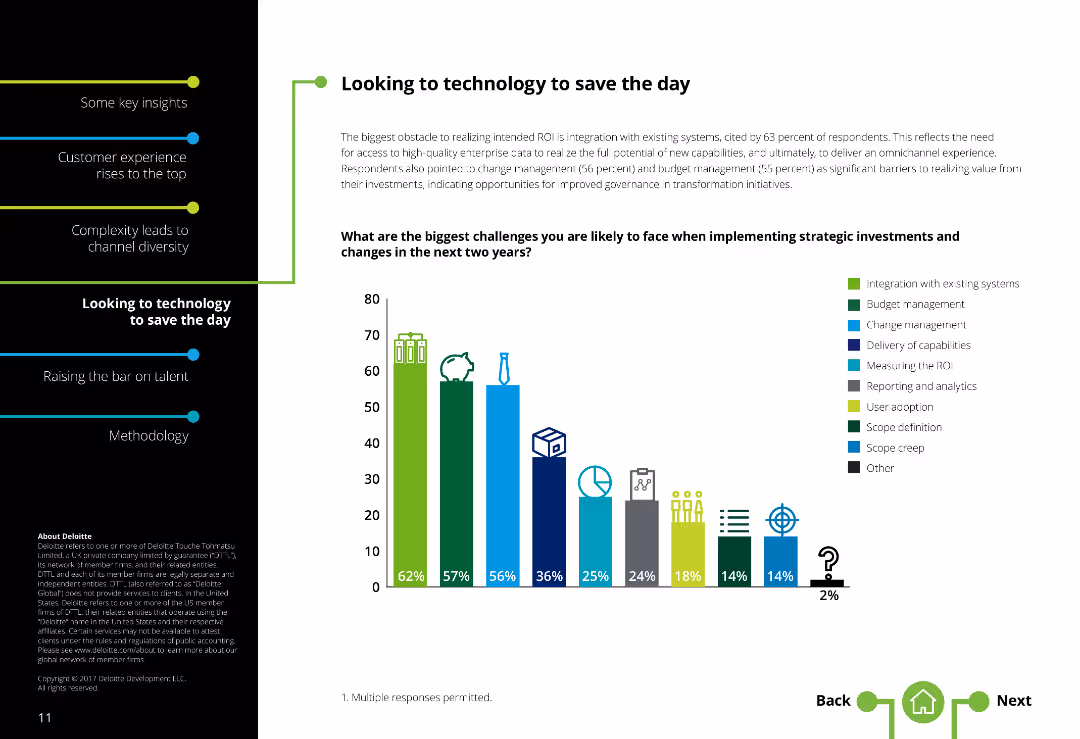
The slide presents multiple column charts detailing aspects of procurement processes and technology areas with the most business impact in the next two years.
Technology and Digital Transformation
Professional Services
Discusses the reduction in impact across areas except for the increased impact of Robotic Process Automation (RPA) on business processes.
Technology impact, business, RPA, analytics, future trends
false
Technology and Digital Transformation
Professional Services
Multiple Chart
Deloitte
Add to my slides
Remove from favorites
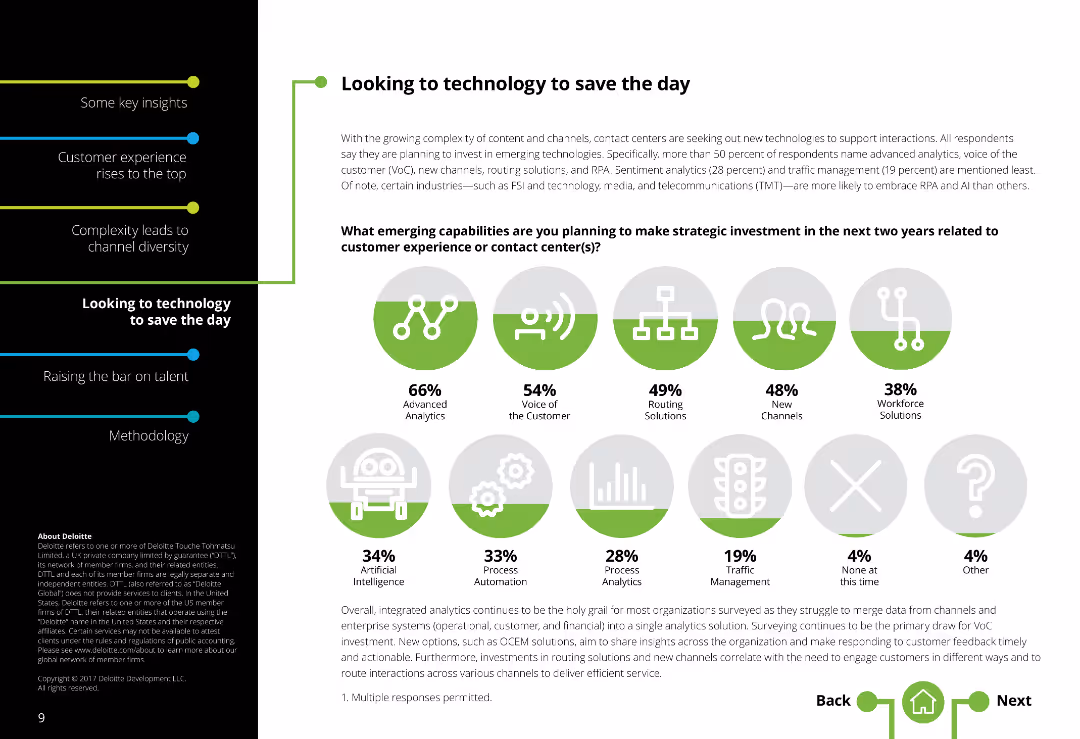
Two-column layout with text on the left and a series of icons representing emerging capabilities on the right. Moderately dense text.
Market Analysis and Trends
Technology & Software
Discusses emerging technologies and strategic investments in contact centers, focusing on analytics, voice of the customer, routing solutions, and workforce solutions.
Technology investments, Contact centers, Emerging technologies, Analytics, Voice of customer, Routing solutions, Workforce solutions
false
Market Analysis and Trends
Technology & Software
Mixed Chart
Deloitte
Add to my slides
Remove from favorites
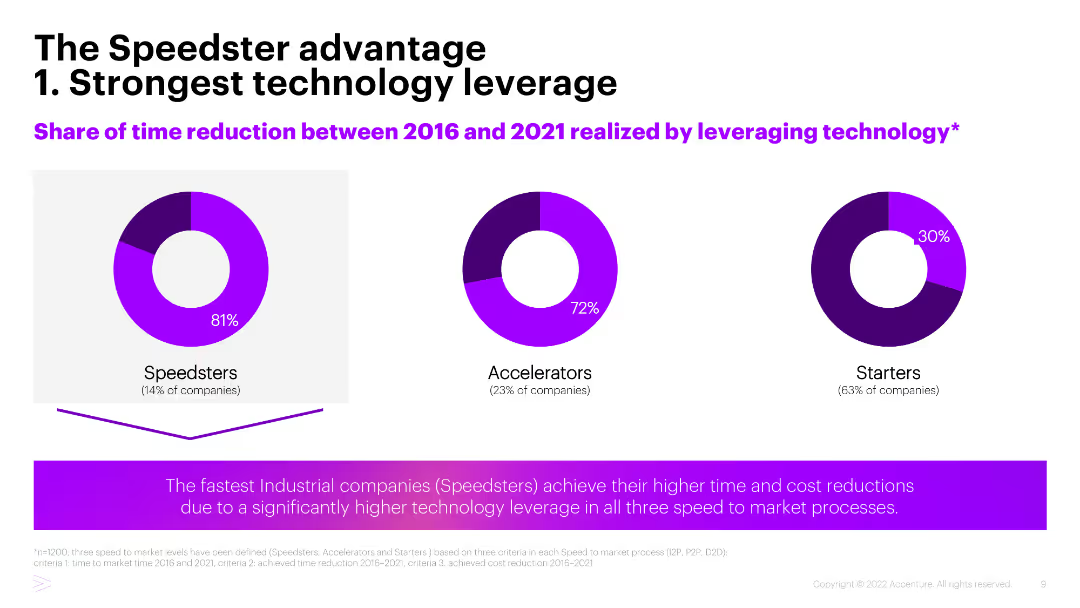
Three pie charts showing the share of time reduction between 2016 and 2021 realized by leveraging technology among Speedsters, Accelerators, and Starters.
Technology and Digital Transformation
Industrial & Manufacturing
This slide illustrates the advantage of industrial companies categorized as Speedsters in leveraging technology for significant time and cost reductions between 2016 and 2021.
Technology leverage, Time reduction, Speedsters, Industrial companies, Digital transformation
false
Technology and Digital Transformation
Industrial & Manufacturing
Multiple Chart
Accenture
Add to my slides
Remove from favorites
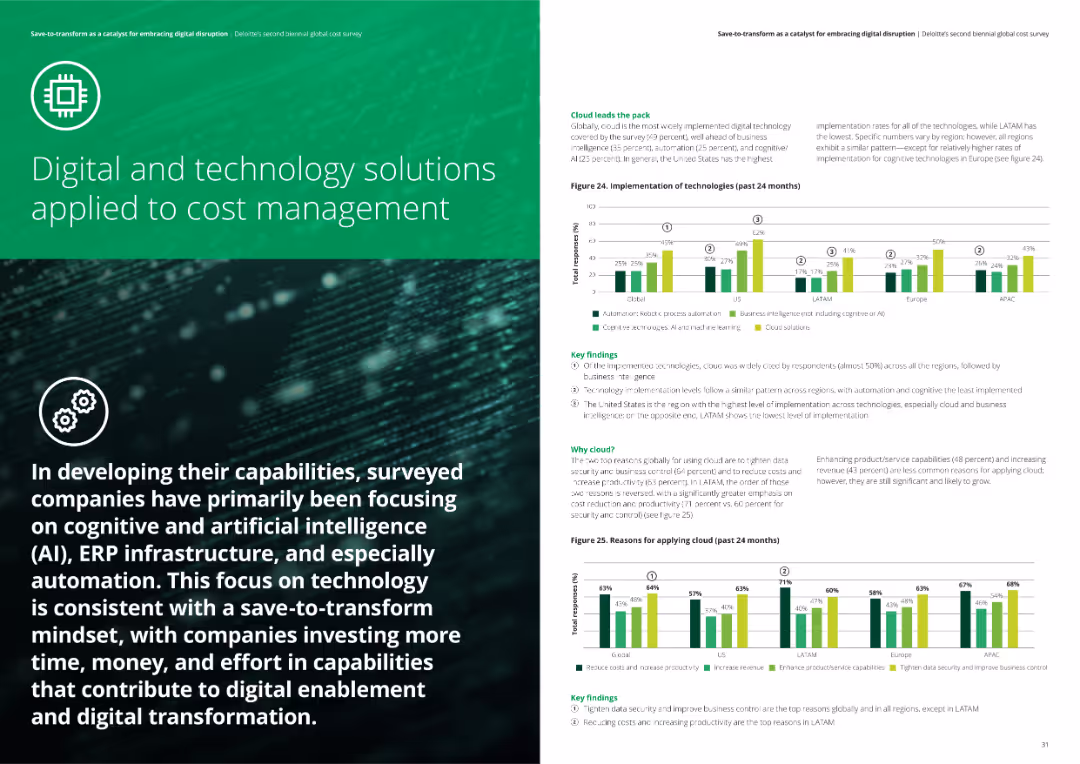
The slide has two column charts showing the implementation of technologies and reasons for applying cloud solutions over the past 24 months across different regions.
Technology and Digital Transformation
Financial Services
The slide focuses on the adoption of digital and technology solutions, particularly cloud solutions, cognitive and AI technologies, and their impact on cost management practices.
Technology solutions, cloud adoption, digital transformation, analysis, financial services
false
Technology and Digital Transformation
Financial Services
Multiple Chart
Deloitte
Add to my slides
Remove from favorites
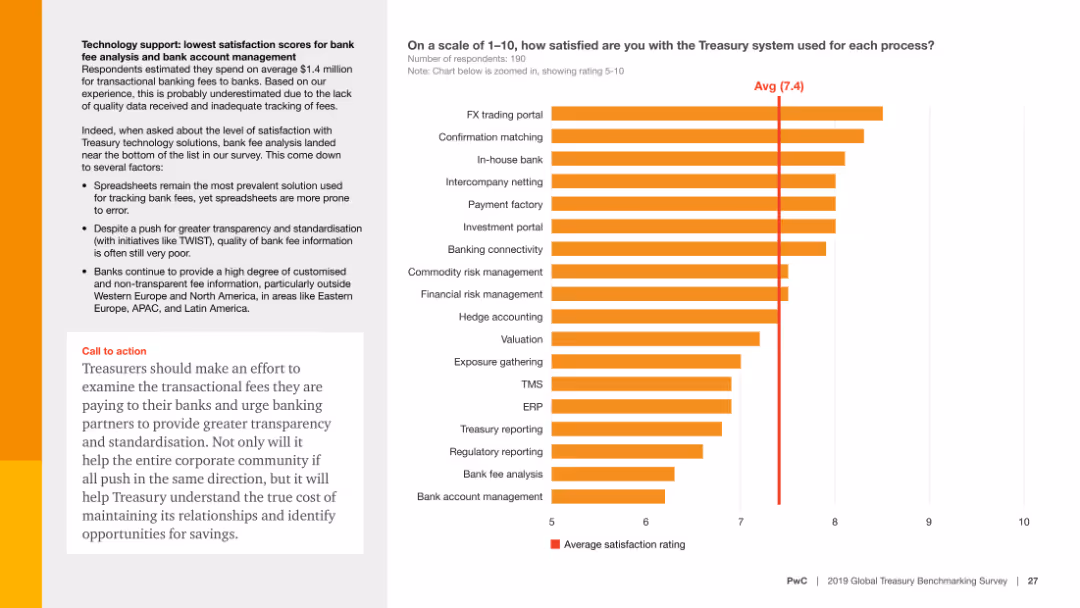
The slide includes a column chart showing satisfaction scores for different treasury processes and a text box with analysis and a call to action. The average satisfaction rating is highlighted.
Customer and Market Segmentation
Financial Services
The slide presents data on treasury satisfaction scores, highlighting low satisfaction in bank fee analysis and bank account management, and urges treasurers to push for greater transparency and standardization in their processes.
Technology support, satisfaction scores, treasury, bank fees, account management, financial services, transparency, standardization, customer feedback, survey
false
Customer and Market Segmentation
Financial Services
Mixed Chart
PwC/Strategy&
Add to my slides
Remove from favorites
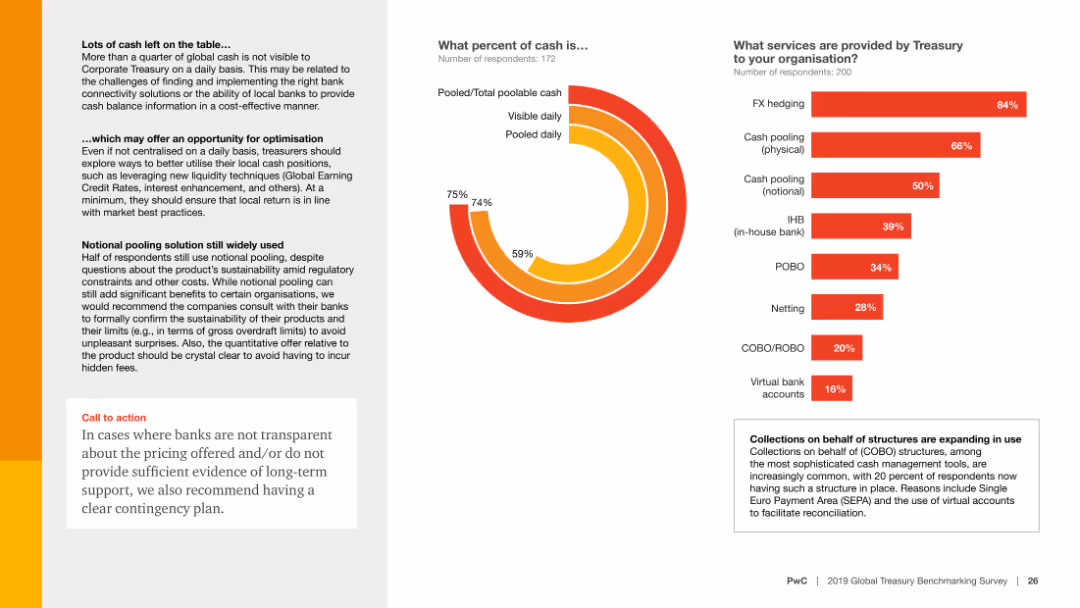
Features a column chart showing satisfaction scores for various Treasury processes. Text elaborates on the challenges with bank fee analysis and management.
Technology and Digital Transformation
Financial Services
Highlights the dissatisfaction with bank fee analysis and bank account management among treasurers, advocating for better transparency and standardized information.
Technology support, satisfaction, bank fees, transparency, standardization
false
Technology and Digital Transformation
Financial Services
Multiple Chart
PwC/Strategy&
Add to my slides
Remove from favorites
Cover slide with title, McKinsey logo, and abstract tech design elements, featuring a tablet displaying graphs.
Industry Overview
Technology & Software
Title slide for a presentation on technology trends, specifically focusing on the industrialization of machine learning.
Technology trends, McKinsey, machine learning, title slide
false
Industry Overview
Technology & Software
Title
McKinsey
Add to my slides
Remove from favorites
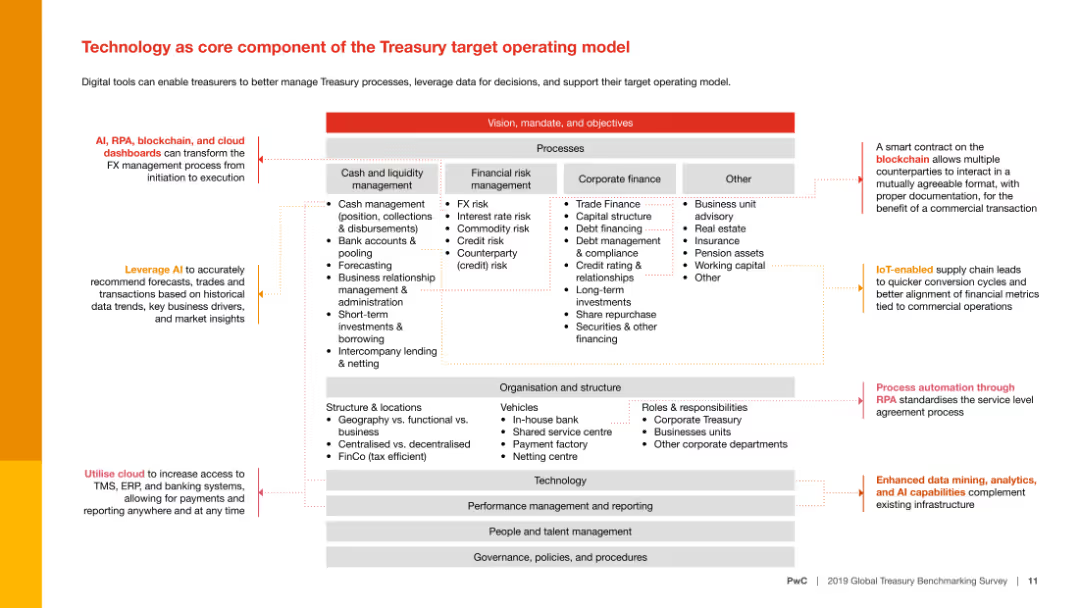
A complex slide with a diagram displaying different processes within the Treasury target operating model. It includes various elements such as arrows and text blocks.
Technology and Digital Transformation
Financial Services
This slide discusses how technology, including AI, RPA, blockchain, and cloud dashboards, can enhance Treasury processes and support decision-making.
Technology, AI, RPA, blockchain, cloud, Treasury
false
Technology and Digital Transformation
Financial Services
Diagram
PwC/Strategy&
Add to my slides
Remove from favorites
Previous
Next
You don't have any favorites yet.
Please wait loading your favorites slides...
Create a FREE account to continue browsing
Receive Instant Access to 1,000+ slides from companies like McKinsey, Google, and Goldman Sachs
First Name
Last Name
Email
Password
I agree to all
Terms & Privacy Policy
Thank you! Your submission has been received!
Oops! Something went wrong while submitting the form.
Have an account?
Sign in
Upgrade to PRO to Save slides
Advanced Search and Filters
Access to 15,000+ slides
Access to Category Pages
Save/Bookmark Slides
PowerPoint Template Library
Pick a Plan
MONTHLY
$12/month
Billed every month, Cancel anytime.
YEARLY
$9/year
Billed $108 annually, Cancel anytime.
Checkout for $12/month
Checkout for $108/yr
Secured by Stripe | AES-256 bit encryption