My Account
My Slides
Search by Category
Pricing
Templates
View All Templates
Download Template Slides
✦ AI Search
Feedback
Login
Logout
Get Started
Browse all Slides
Browse all Slides
Create a FREE Account
Instant access to 1,000+ real slides from top companies like McKinsey, BCG, Goldman Sachs, Google and many more!
First Name
Last Name
Email
Password
I agree to all
Terms & Privacy Policy
Thank you! Your submission has been received!
Oops! Something went wrong while submitting the form.
Have an account?
Sign in
Saved Slides
Total No. of slides saved
0
↻ Refresh
✖ Clear all
The slide features text and icons representing different client segments and services offered. Sections provide details on corporate and personal banking.
Strategic Planning
Financial Services
This slide describes UBS's balanced mix of personal and corporate banking, highlighting the client base and services offered.
UBS, Banking, Client Segments, Services, Strategic Planning
false
Strategic Planning
Financial Services
Multiple Chart
UBS
Add to my slides
Remove from favorites
Three vertical column charts showing CET1 capital development, risk-weighted assets, and leverage ratio denominator for Q3-Q4 2023.
Financial Performance
Financial Services
Analyzes UBS Group AG's CET1 capital changes, risk-weighted assets, and leverage ratio denominator, providing insights into financial health.
UBS, CET1, capital, RWA, LRD, risk-weighted assets, leverage ratio, financial health, analysis
false
Financial Performance
Financial Services
Multiple Chart
UBS
Add to my slides
Remove from favorites
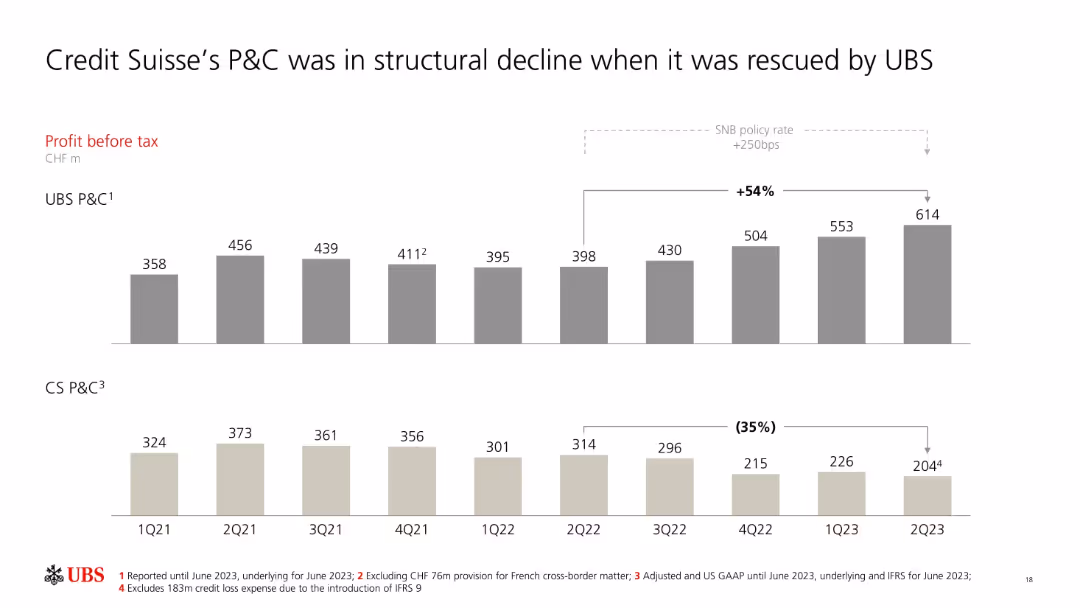
Dual bar chart comparing UBS and CS P&C profit before tax over 9 quarters.
Client Case Studies
Financial Services
The chart shows diverging performance trends between UBS and CS in their P&C segments. UBS’s profits rose steadily while CS experienced a 35% decline, emphasizing the rationale for UBS’s acquisition and integration efforts.
UBS, CS, profit before tax, P&C, structural decline, acquisition, integration, financial performance
false
Client Case Studies
Financial Services
Multiple Chart
UBS
Add to my slides
Remove from favorites
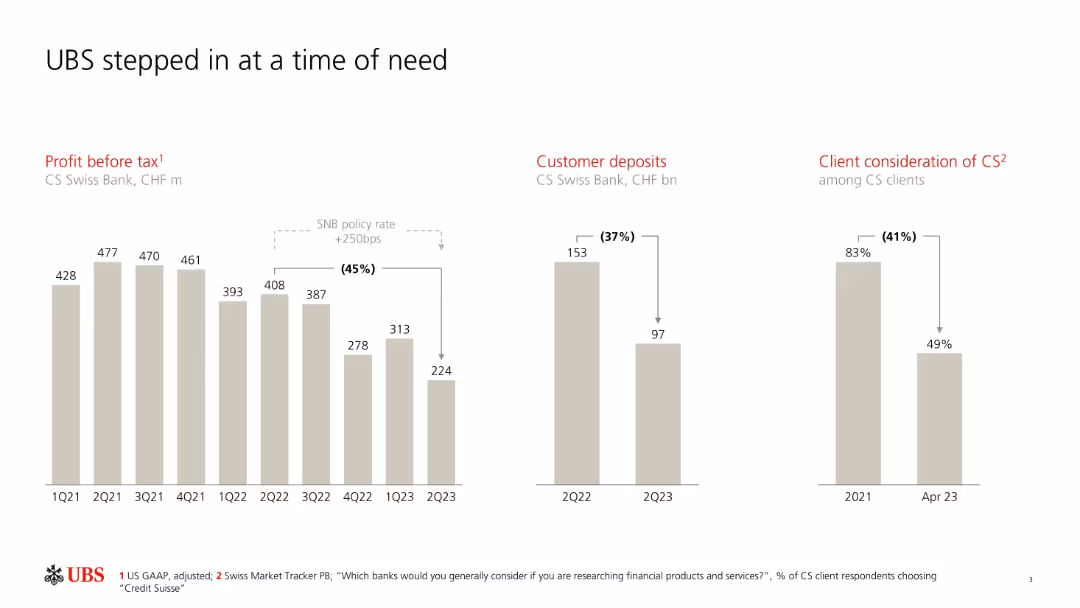
Three-panel layout; bar charts on profit before tax, customer deposits, and client consideration.
Client Case Studies
Financial Services
The slide depicts Credit Suisse's decline in profitability, customer deposits, and client trust leading up to UBS’s intervention. It emphasizes steep declines during 2022–2023 and underscores UBS's role in stabilizing the situation.
UBS, Credit Suisse, customer deposits, client trust, acquisition, Swiss bank, profit before tax
false
Client Case Studies
Financial Services
Multiple Chart
UBS
Add to my slides
Remove from favorites
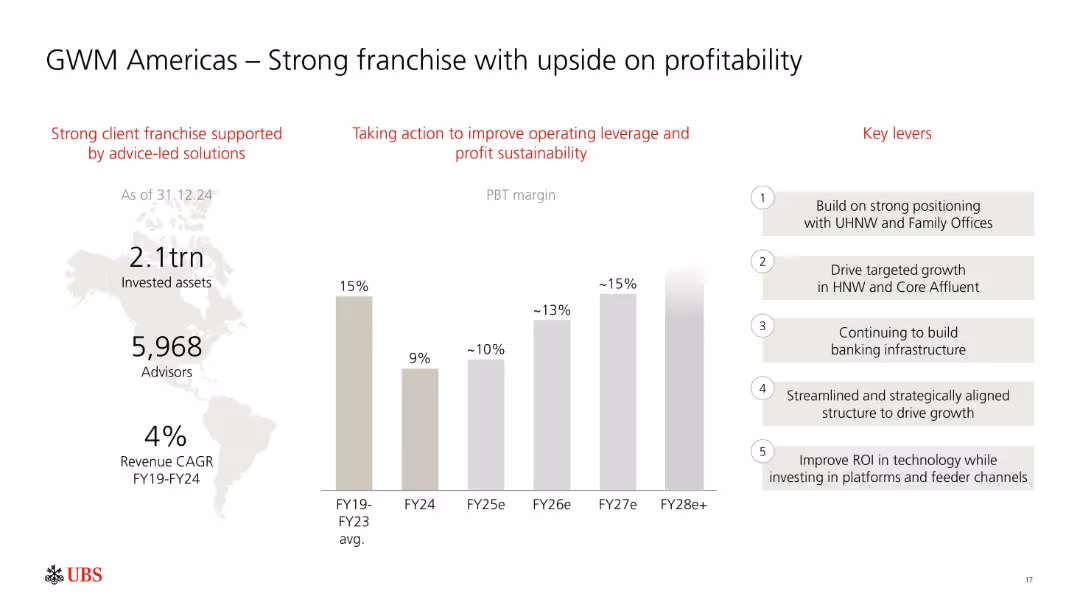
Three-column layout: infographic on left, PBT margin bar chart in center, and key levers on right. Red headings and grayscale bars.
Sales and Business Development
Financial Services
Focuses on UBS’s GWM Americas business, showing consistent PBT margin growth potential from FY24 to FY28e. Lists key strategic levers like HNW growth, infrastructure, and ROI-driven tech investments.
UBS, GWM Americas, profitability, PBT margin, high-net-worth, growth strategy, advisory, assets, FY28
false
Sales and Business Development
Financial Services
Mixed Chart
UBS
Add to my slides
Remove from favorites
Detailed organizational structure diagram showing the hierarchy and relationship between UBS Group AG and its subsidiaries. Simple color scheme and layout for clarity.
Organizational Structure and Change
Financial Services
Shows the merger plan of Credit Suisse AG into UBS AG in 2024, detailing the structure and entities involved as of 30 September 2023.
UBS, Group Structure, Credit Suisse, Merger, Subsidiaries
false
Organizational Structure and Change
Financial Services
Diagram
UBS
Add to my slides
Remove from favorites
The slide features a mix of text and icons illustrating growth strategies. Sections discuss personal banking, digital capabilities, and corporate clients.
Strategic Planning
Financial Services
This slide outlines UBS's strategies for driving efficient growth, focusing on client acquisition, digital capabilities, and market expertise.
UBS, Growth, Strategy, Digital Capabilities, Client Acquisition
false
Strategic Planning
Financial Services
Linear Flow
UBS
Add to my slides
Remove from favorites
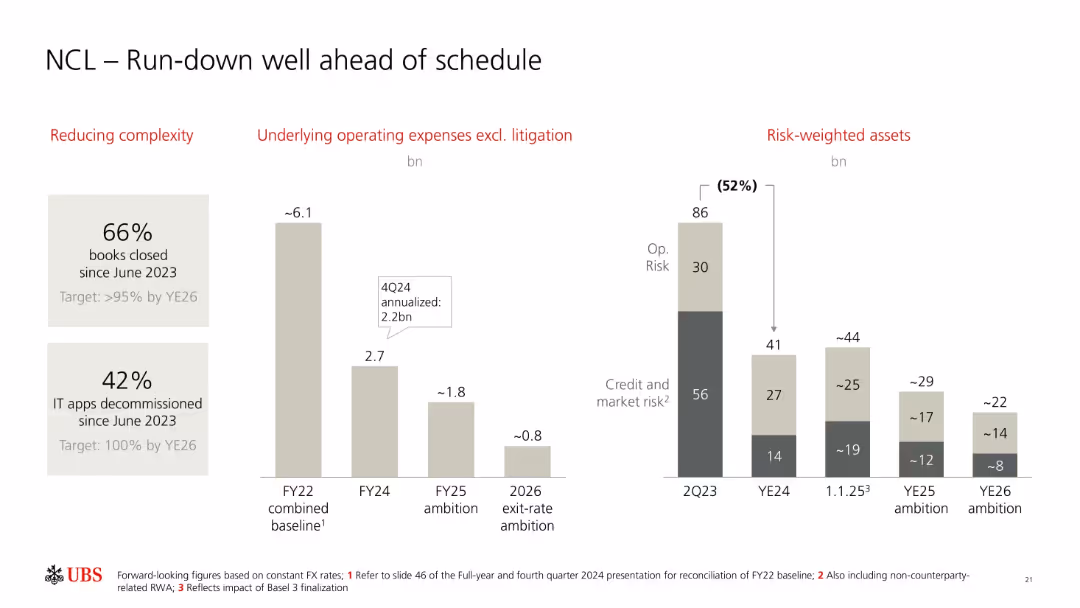
Three vertical bar chart sections showing complexity reduction, operating expenses, and RWA declines. Large numeric callouts and brief annotations.
Operational Efficiency
Financial Services
Highlights UBS’s progress in reducing non-core and legacy (NCL) complexity, operating expenses, and risk-weighted assets. Includes targets for FY25 and YE26 and progress on IT decommissioning and book closures.
UBS, NCL, run-down, complexity, RWA, operating expenses, FY25, YE26, decommissioning, risk management
false
Operational Efficiency
Financial Services
Multiple Chart
UBS
Add to my slides
Remove from favorites
The slide contains a circular diagram illustrating partnerships and areas of collaboration. Text sections describe client types and collaborative services.
Strategic Planning
Financial Services
This slide emphasizes UBS's partnership approach, detailing various client types and areas of collaboration to deliver comprehensive services.
UBS, Partnerships, Collaboration, Client Services, Strategy
false
Strategic Planning
Financial Services
Diagram
UBS
Add to my slides
Remove from favorites
The slide displays column charts comparing income splits and ambition targets. Text sections detail revenue growth strategies and income projections.
Financial Performance
Financial Services
This slide highlights UBS's strategies for growing revenues, emphasizing the importance of recurring and transaction income and future income projections.
UBS, Revenue Growth, Income, Strategy, Financial Projections
false
Financial Performance
Financial Services
Multiple Chart
UBS
Add to my slides
Remove from favorites
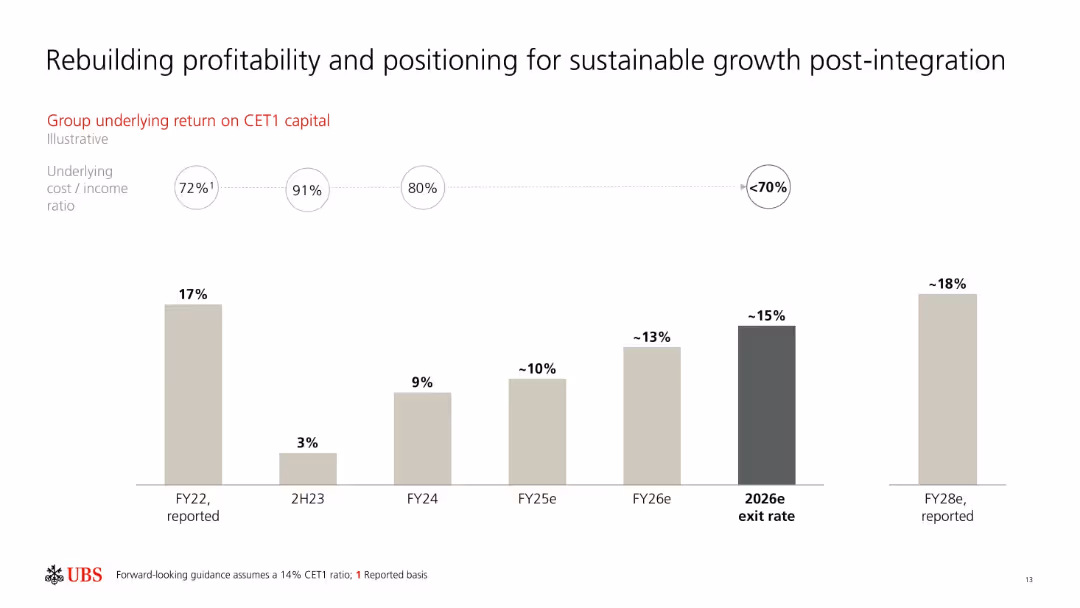
Column chart showing RoCET1 progression from FY22 to FY28e with cost/income ratios labeled above. Monochromatic beige and gray tones.
Strategic Planning
Financial Services
Tracks UBS’s RoCET1 from 17% in FY22 to a projected 18% in FY28. Emphasizes recovery from a dip in 2H23 and the role of integration in supporting long-term sustainable growth and lower cost/income ratios.
UBS, RoCET1, integration, growth, profitability, FY28, cost/income, return on capital, financial forecast
false
Strategic Planning
Financial Services
Single Chart
UBS
Add to my slides
Remove from favorites
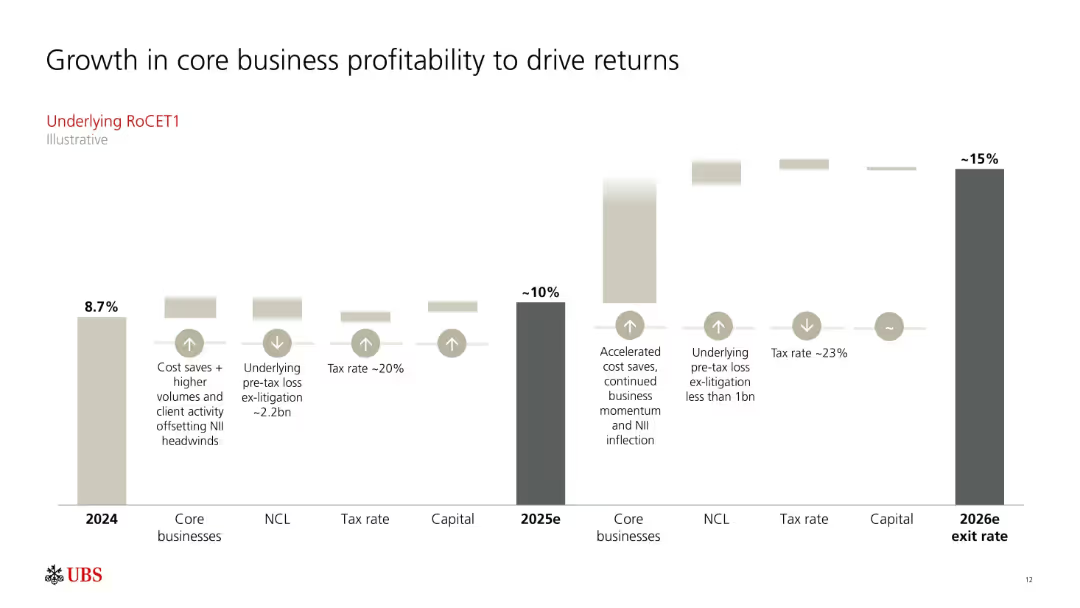
Waterfall-style chart projecting RoCET1 progression from 2024 (8.7%) to 2026 (~15%) exit rate with factors contributing to growth.
Strategic Planning
Financial Services
Illustrates UBS’s planned increase in underlying RoCET1 to ~15% by 2026 through core business growth, cost savings, and tax management. Each driver is annotated with expected quantitative and qualitative impacts.
UBS, RoCET1, profitability, growth drivers, core business, tax rate, financial return, 2026 projection
false
Strategic Planning
Financial Services
Single Chart
UBS
Add to my slides
Remove from favorites
The slide features comparative metrics such as GDP per capita, exports, public debt, and gross financial assets per capita. Text sections highlight UBS's market leadership in personal and corporate banking.
Industry Overview
Financial Services
This slide emphasizes UBS's leadership position in Switzerland's banking sector, supported by key financial metrics and market share data.
UBS, Switzerland, Banking, Market Leader, Financial Metrics
false
Industry Overview
Financial Services
Mixed Chart
UBS
Add to my slides
Remove from favorites
Displays a balance sheet with vertical column charts of assets and liabilities as of Q4 2023, along with a coverage ratio indicator.
Financial Performance
Financial Services
Presents UBS Group AG's balance sheet for Q4 2023, detailing various asset and liability components and the overall coverage ratio.
UBS, balance sheet, assets, liabilities, coverage ratio, financial, performance, Q4 2023, analysis
false
Financial Performance
Financial Services
Multiple Chart
UBS
Add to my slides
Remove from favorites
Features two vertical column charts displaying issuances and redemptions from 2023-2027+, alongside a list of recent funding activities.
Investment Analysis
Financial Services
Analyzes UBS Group AG's capital market activities, including bond issuances and redemptions, funding plans, and strategies for future issuances.
UBS, bonds, issuances, redemptions, funding, capital markets, investment, diversification, maturity
false
Investment Analysis
Financial Services
Mixed Chart
UBS
Add to my slides
Remove from favorites
This slide features two vertical column charts. The left chart shows UBS Group AG capital development from 2023-2026, with different capital components.
Financial Performance
Financial Services
Discusses UBS Group AG's strong capital position, future CET1 ratios, funding cost savings, and expected capital ratios post-Credit Suisse merger.
UBS, capital, CET1, funding, Credit Suisse, ratios, development, financial, performance, bank
false
Financial Performance
Financial Services
Multiple Chart
UBS
Add to my slides
Remove from favorites
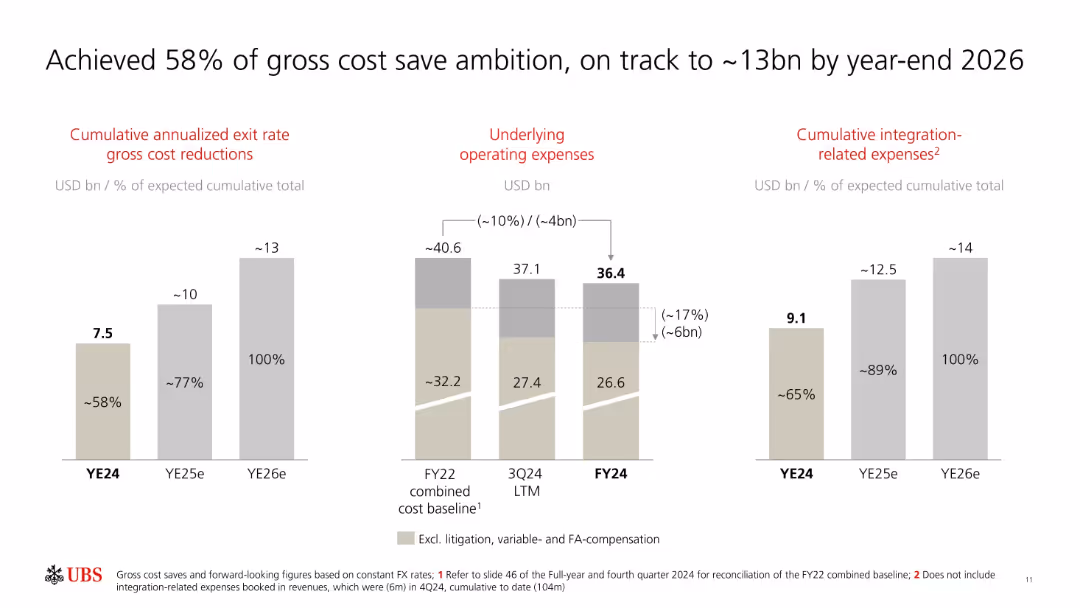
Three sets of vertical bar charts for cumulative cost savings, operating expenses, and integration-related costs. Data is shown by year.
Operational Efficiency
Financial Services
UBS reports achieving 58% of its cost save target by YE24 and projects reaching 13bn in savings by YE26. The slide details declines in operating expenses and outlines cumulative integration costs.
UBS, cost savings, integration, operating expenses, YE24, YE26, targets, financial strategy, efficiency
false
Operational Efficiency
Financial Services
Multiple Chart
UBS
Add to my slides
Remove from favorites
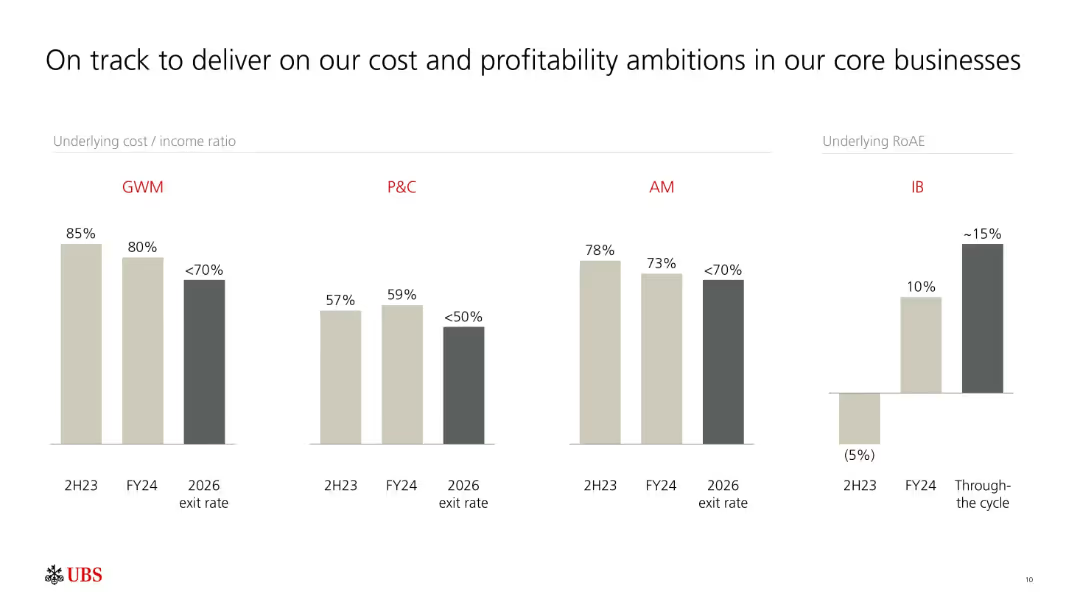
Multiple grouped bar charts comparing cost/income ratios and RoAE across business units (GWM, P&C, AM, IB). Color-coded by year and projection.
Performance Metrics and KPIs
Financial Services
Provides an overview of UBS’s progress in lowering cost/income ratios and improving RoAE across core business units. Forecasts continued improvement by 2026, aiming for sustainable profitability.
UBS, cost-income ratio, RoAE, profitability, core business, GWM, P&C, AM, IB, projections
false
Performance Metrics and KPIs
Financial Services
Single Chart
UBS
Add to my slides
Remove from favorites
Comparison table of credit ratings for holding companies from Moody’s, S&P, and Fitch as of February 2024.
Competitive Landscape
Financial Services
Compares credit ratings of holding companies, highlighting UBS's position relative to other financial institutions.
UBS, credit ratings, holding company, Moody’s, S&P, Fitch, competitive, landscape, financial
false
Competitive Landscape
Financial Services
Table
UBS
Add to my slides
Remove from favorites
Features a comparison table of credit ratings from Moody’s, S&P, and Fitch for various banks as of February 2024.
Competitive Landscape
Financial Services
Compares long-term senior unsecured debt credit ratings of UBS and its peers across major rating agencies.
UBS, credit ratings, peer comparison, Moody’s, S&P, Fitch, competitive, landscape, debt
false
Competitive Landscape
Financial Services
Table
UBS
Add to my slides
Remove from favorites
Three pie charts showing UBS Group's deposit base composition by type, currency, and client segment as of Q3 2023.
Customer and Market Segmentation
Financial Services
Analyzes UBS Group's diversified deposit base, including types of deposits, currency distribution, and client segments.
UBS, deposits, diversification, type, currency, client segment, analysis, composition, market
false
Customer and Market Segmentation
Financial Services
Multiple Chart
UBS
Add to my slides
Remove from favorites
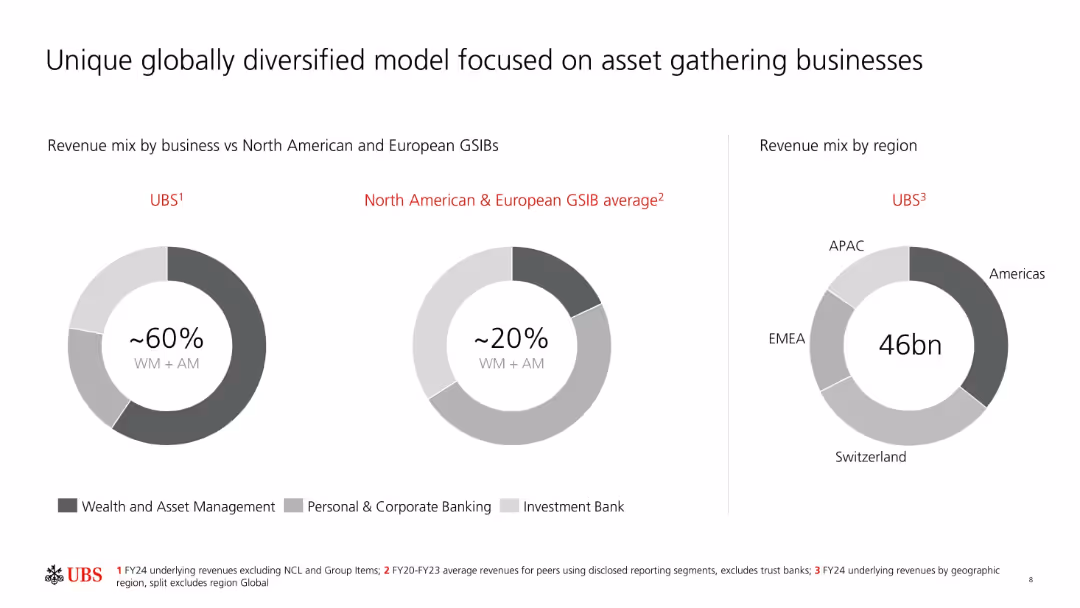
Three donut charts showing revenue mix by business and region, comparing UBS to GSIB averages. Minimalist design with gray tones.
Market Analysis and Trends
Financial Services
Compares UBS’s business model and revenue composition to GSIB averages, emphasizing UBS's 60% revenue share from wealth & asset management. The regional revenue breakdown highlights UBS’s global reach and diversified model.
UBS, diversification, revenue mix, GSIB, asset management, investment banking, APAC, EMEA, Americas
false
Market Analysis and Trends
Financial Services
Single Chart
UBS
Add to my slides
Remove from favorites
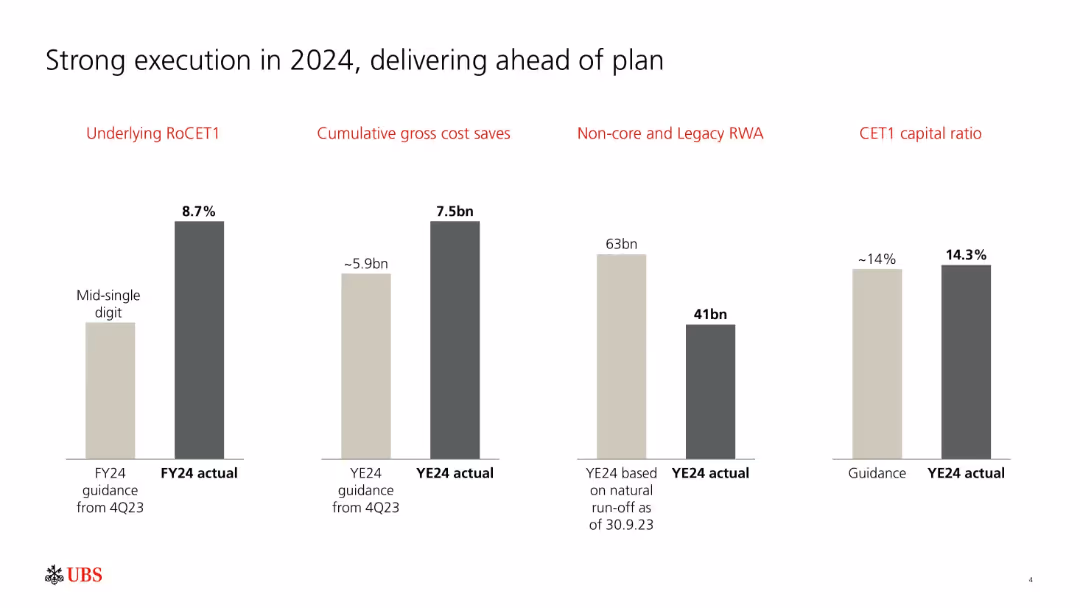
Side-by-side bar comparisons of guidance vs. actual for RoCET1, cost saves, RWA, and CET1 ratio. Gray and black color scheme with red highlights.
Strategic Planning
Financial Services
Highlights UBS’s outperformance of 2024 financial targets, including higher RoCET1 (8.7% vs. mid-single digit) and lower RWAs. It underscores efficient cost saving and a CET1 ratio exceeding guidance.
UBS, execution, RoCET1, CET1 ratio, cost savings, RWA, financial performance, FY24, guidance vs actual
false
Strategic Planning
Financial Services
Single Chart
UBS
Add to my slides
Remove from favorites
Three pie charts represent funding sources, remaining maturities, and funding by currency for UBS Group in Q4 2023.
Strategic Planning
Financial Services
Details UBS Group's funding diversification strategy, highlighting sources of funds, maturity timelines, and currency breakdowns.
UBS, funding, diversification, sources, maturity, currency, strategy, wholesale, financial
false
Strategic Planning
Financial Services
Multiple Chart
UBS
Add to my slides
Remove from favorites
Features a vertical column chart depicting liquidity coverage ratio and a text box outlining liquidity management strategies and goals.
Risk Assessment and Management
Financial Services
Discusses UBS Group AG's liquidity coverage ratio, efficiency, safety, and strategies to meet stringent Swiss liquidity requirements.
UBS, liquidity, coverage ratio, efficiency, safety, funding, management, requirements, Swiss
false
Risk Assessment and Management
Financial Services
Mixed Chart
UBS
Add to my slides
Remove from favorites
The slide showcases a structured diagram highlighting UBS's liquidity and funding framework, including stress testing, regulatory requirements, governance, and contingency planning.
Risk Assessment and Management
Financial Services
This slide outlines UBS's liquidity and funding risk management framework, detailing regulatory requirements, stress testing scenarios, and governance structures for financial stability.
UBS, liquidity, funding, risk management, regulatory requirements
false
Risk Assessment and Management
Financial Services
Framework
UBS
Add to my slides
Remove from favorites
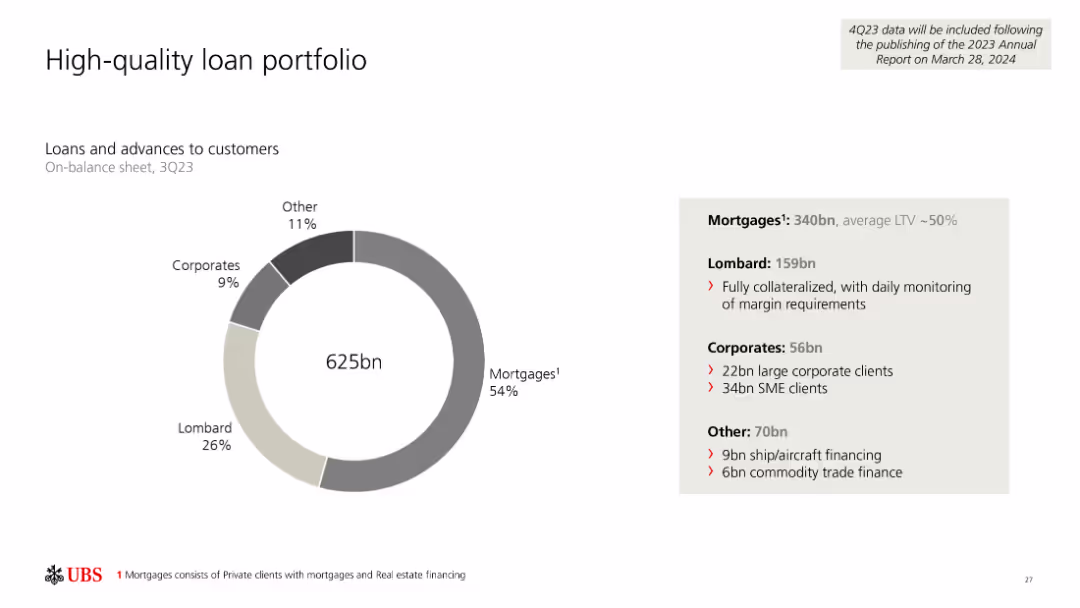
Pie chart of UBS Group's loan and advance composition, and a text box detailing various loan categories and their respective amounts.
Product and Service Analysis
Financial Services
Overview of UBS Group AG's loan portfolio, including mortgages, Lombard loans, corporate loans, and other loans with specific details.
UBS, loans, portfolio, mortgages, Lombard, corporate, analysis, high-quality, financial
false
Product and Service Analysis
Financial Services
Mixed Chart
UBS
Add to my slides
Remove from favorites
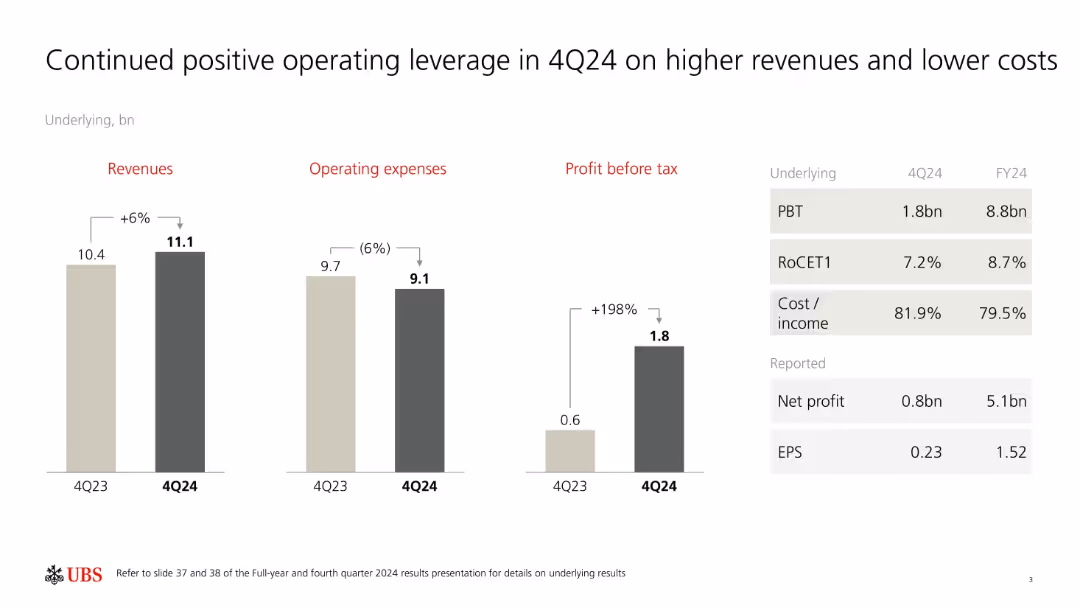
Three-bar chart clusters comparing 4Q23 vs. 4Q24 for revenues, operating expenses, and profit before tax. Supplemented by a data table on the right.
Financial Performance
Financial Services
Demonstrates improved operating leverage for UBS in Q4 2024, driven by a 6% revenue increase and a 6% cost reduction. Profit before tax jumped 198% YoY. Also shows reported net profit and EPS alongside return metrics.
UBS, operating leverage, 4Q24, revenue growth, cost reduction, profit before tax, EPS, RoCET1, cost-income
false
Financial Performance
Financial Services
Mixed Chart
UBS
Add to my slides
Remove from favorites
Column charts showing various financial results including net profit, profit before tax, negative goodwill, and integration expenses for 2Q23.
Financial Performance
Financial Services
Presents the financial results for UBS Group in 2Q23, highlighting profits, tax implications, and restructuring costs from the Credit Suisse acquisition.
UBS, profit, tax, goodwill, integration
false
Financial Performance
Financial Services
Single Chart
UBS
Add to my slides
Remove from favorites
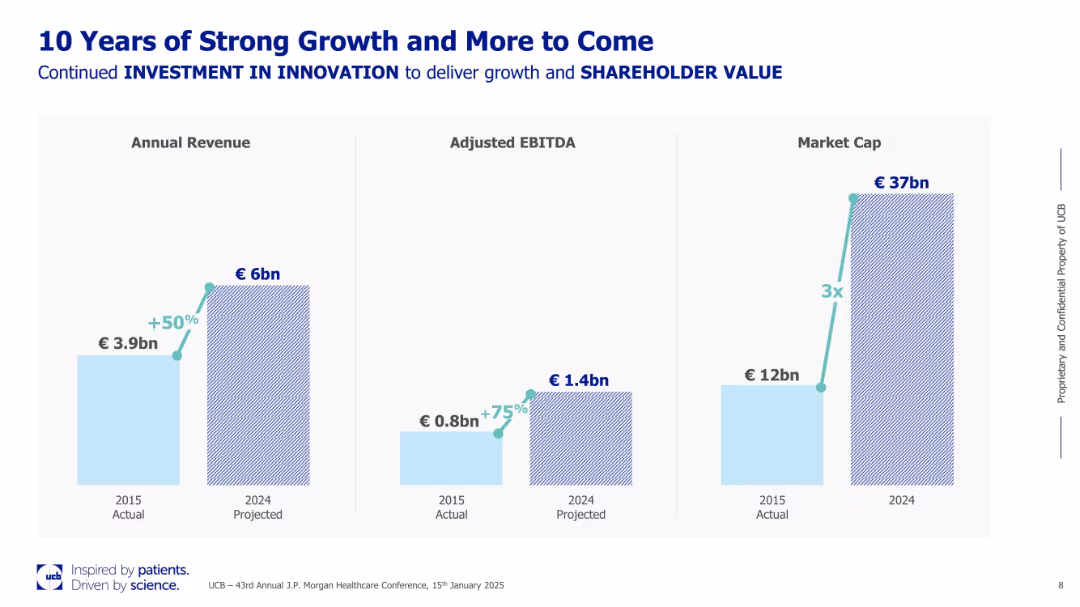
Clean, three-panel layout with bar charts for Annual Revenue, Adjusted EBITDA, and Market Cap from 2015 to 2024. Uses blue and teal color scheme. Title emphasizes innovation and shareholder value.
Financial Performance
Healthcare & Pharmaceuticals
Presents a decade of growth for UCB, showing a 50% increase in revenue, 75% rise in EBITDA, and a tripling of market cap from 2015 to 2024. The slide attributes this success to continuous innovation investment and underlines future commitment to shareholder value.
UCB, revenue growth, EBITDA, market cap, innovation, shareholder value, healthcare finances
false
Financial Performance
Healthcare & Pharmaceuticals
Single Chart
JP Morgan
Add to my slides
Remove from favorites
Bright, colorful layout with purple-red accents, bar chart of ticket sales by country, photos of fans and mascots, and two text columns explaining attendance and engagement.
Market Analysis and Trends
Hospitality & Tourism
Focused on UEFA Women’s EURO 2025, this slide analyzes ticket sales and fan engagement. It shows international reach (112 countries), top purchasing countries, and ticket sales statistics, highlighting the event’s global appeal and potential for high attendance.
UEFA, fan experience, ticket sales, international reach, engagement, audience metrics, event planning
false
Market Analysis and Trends
Hospitality & Tourism
Mixed Chart
EY
Add to my slides
Remove from favorites
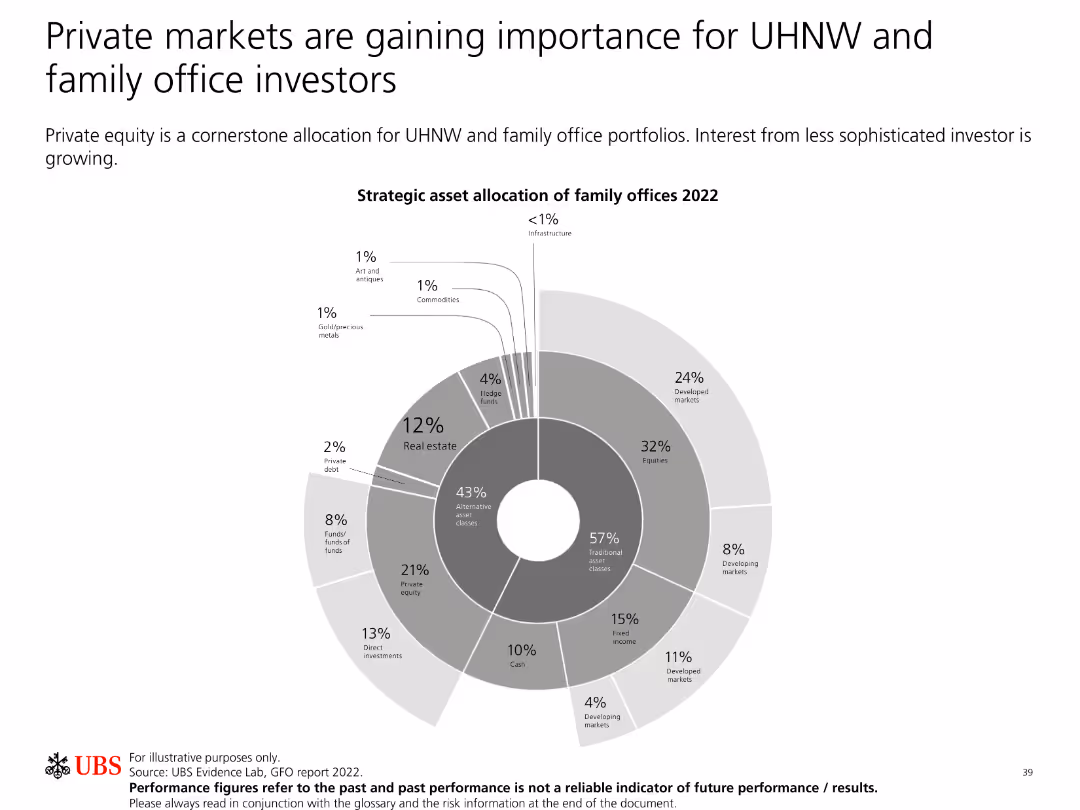
The slide features a pie chart depicting strategic asset allocation of family offices in 2022, with various segments.
Investment Analysis
Financial Services
This slide discusses the importance of private markets for ultra-high-net-worth (UHNW) and family office investors. It highlights the strategic asset allocation for 2022.
UHNW, family office, private markets, asset allocation, investment
false
Investment Analysis
Financial Services
Single Chart
UBS
Add to my slides
Remove from favorites
The slide compares client profile and needs with the Credit Suisse one-stop-shop solution. It uses icons and text to illustrate strategic UHNW client needs and how the bank consolidates holdings, monetizes wealth, and reinvests loan proceeds.
Client Case Studies
Financial Services
The slide highlights the value Credit Suisse provides to UHNW clients by addressing their asset and liability needs, focusing on wealth investment, asset diversification, and tailored solutions for consolidating and monetizing wealth.
UHNW, wealth, consolidation, monetization, diversification
false
Client Case Studies
Financial Services
Boxed
Credit Suisse
Add to my slides
Remove from favorites
This slide includes a column chart showing the growth in strategic clients' revenues and a line chart demonstrating a client's journey from IPO to asset management.
Customer and Market Segmentation
Financial Services
The slide discusses strategies for growing top clients and outlines the client journey for entrepreneurs, highlighting significant growth opportunities.
UHNWI, Entrepreneurs, Client Journey, Revenue Growth, Strategic Clients
false
Customer and Market Segmentation
Financial Services
Multiple Chart
Credit Suisse
Add to my slides
Remove from favorites
Contains column charts, world map visualization.
Market Analysis and Trends
Retail & E-commerce
Focus on ultra-high-net-worth individuals' spending.
UHNWI, luxury, Americas, APAC, 2019
false
Market Analysis and Trends
Retail & E-commerce
Multiple Chart
Bain
Add to my slides
Remove from favorites
Includes flow chart, bold text for emphasis.
Market Analysis and Trends
Retail & E-commerce
Insights into personalized luxury shopping experiences.
UHNWI, personalized, luxury, digital, VIP
false
Market Analysis and Trends
Retail & E-commerce
Linear Flow
Bain
Add to my slides
Remove from favorites
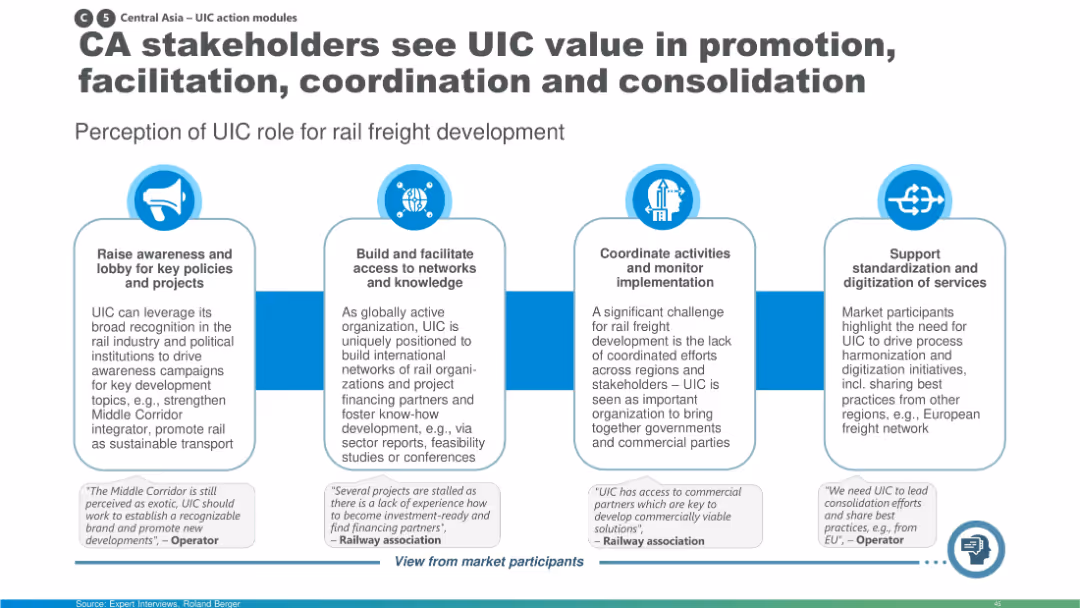
Four-column layout with icons representing actions by UIC; includes quotes from stakeholders and summary of UIC's perceived value.
Organizational Structure and Change
Transportation & Logistics
The slide presents market feedback on the role of UIC (International Union of Railways) in supporting Central Asia rail development. Stakeholders value UIC’s support in awareness-building, network access, coordination, and standardization efforts.
UIC, stakeholder input, coordination, rail development, Central Asia, rail freight
false
Organizational Structure and Change
Transportation & Logistics
Pillar
Roland Berger
Add to my slides
Remove from favorites
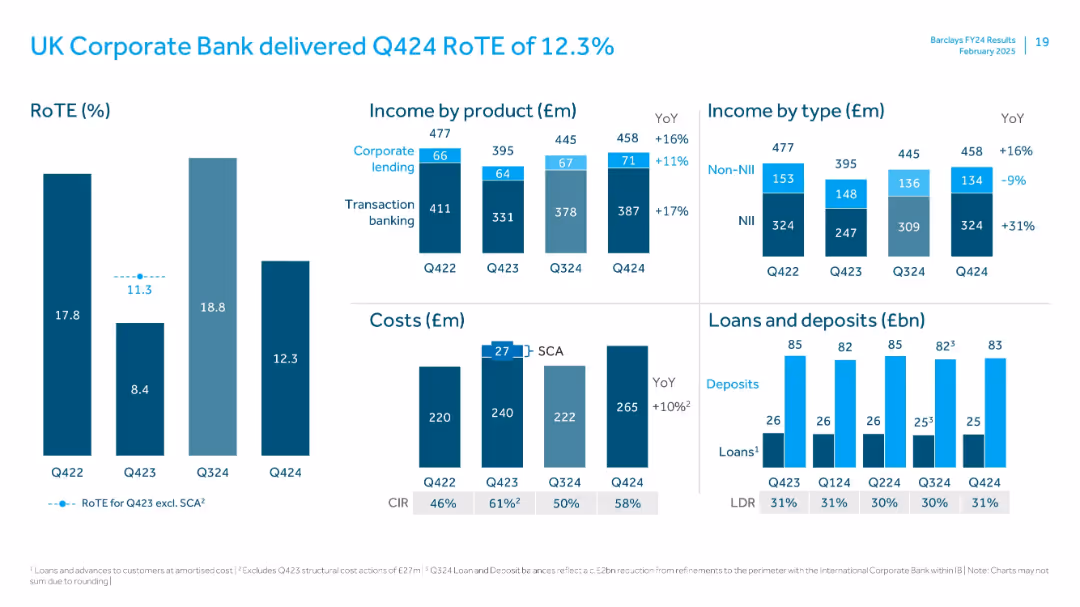
Mixed layout: bar charts for RoTE and income; waterfall and cost analysis; loans/deposits side-by-side bar comparison
Financial Performance
Financial Services
Focuses on UK Corporate Bank's Q424 financial performance. Showcases stable RoTE with YoY income growth led by transaction banking. Loan-deposit ratio and CIR analysis accompany commentary on cost trends and income types.
UK Corporate Bank, RoTE, transaction banking, loans, deposits, CIR, costs, Q424
false
Financial Performance
Financial Services
Multiple Chart
Barclays
Add to my slides
Remove from favorites
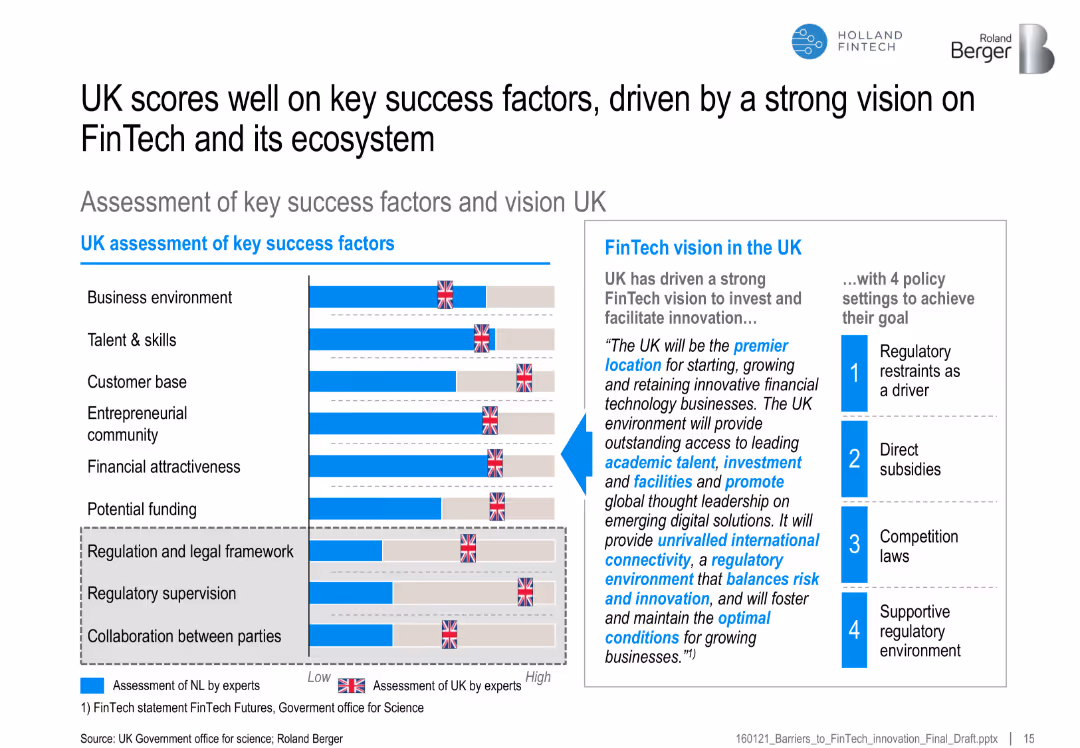
Bar chart of UK vs. benchmark on FinTech success factors, with a vision statement and four supporting policy actions
Strategic Planning
Financial Services
Highlights the UK’s strong performance across FinTech-enabling factors, backed by a clear vision and regulatory framework, promoting its position as a FinTech hub.
UK FinTech, ecosystem, regulatory vision, success factors, funding, policy, entrepreneurship, talent
false
Strategic Planning
Financial Services
Mixed Chart
Roland Berger
Add to my slides
Remove from favorites
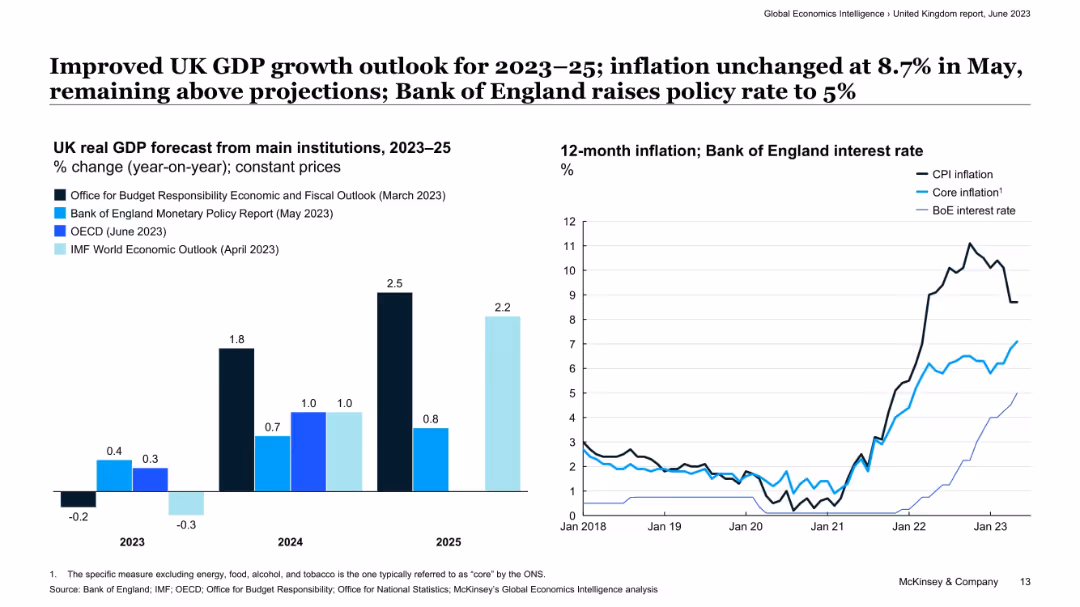
The slide features two main visual elements: a bar graph on the left side comparing UK real GDP forecasts, and a line graph on the right side displaying 12-month inflation and Bank of England interest rates. The design is moderately dense with textual annotations and a legend explaining the data sources.
Market Analysis and Trends
Financial Services
This slide presents a forecast of the UK's real GDP growth and inflation trends, showing expectations from major institutions and actual economic performance. The inflation graph shows a recent peak and the interest rates set by the Bank of England. It is likely used to communicate economic forecasts to inform financial planning or policy-making decisions.
UK GDP, Inflation, Forecast, Economic Growth, Interest Rates, Monetary Policy, Financial Outlook, Comparative Analysis
false
Market Analysis and Trends
Financial Services
Multiple Chart
McKinsey
Add to my slides
Remove from favorites
The slide contains two column charts. The left chart shows the contribution to UK real GDP growth by different sectors. The right chart displays UK Purchasing Managers' Indices (PMI) over time. The charts are detailed and use various colors to distinguish data categories.
Market Analysis and Trends
Financial Services
The slide analyzes the UK's GDP growth and business activity through sector contributions and PMI trends, essential for economic analysis and business strategy.
UK GDP, business surveys, PMI, sector growth, economic analysis
false
Market Analysis and Trends
Financial Services
Multiple Chart
JP Morgan
Add to my slides
Remove from favorites
The slide contains two charts: a line chart on the left showing UK GDP from Q4 2019 to Q4 2023, and another line chart on the right displaying 12-month inflation and Bank of England interest rate trends.
Market Analysis and Trends
Financial Services
The slide provides an analysis of the UK's economic performance, noting a 0.3% GDP decline in Q4 2023, steady CPI at 4% in January, and the Bank of England's policy rate at 5.25%. It is used to assess economic health and monetary policy impact.
UK GDP, inflation, interest rate, Bank of England, economic performance
false
Market Analysis and Trends
Financial Services
Multiple Chart
McKinsey
Add to my slides
Remove from favorites
Features a map of the UK with key points listed about market growth, emphasizing the UK's strengths such as regulatory environment and London as a financial centre.
Market Analysis and Trends
Financial Services
The slide argues for the strategic timing of expanding financial operations in the UK, emphasizing national economic resilience, strong regulatory frameworks, and London’s role as a global financial hub, supporting a strategic business decision for market expansion.
UK Market, Growth, Strategy, Financial Hub
false
Market Analysis and Trends
Financial Services
Graphic
Barclays
Add to my slides
Remove from favorites
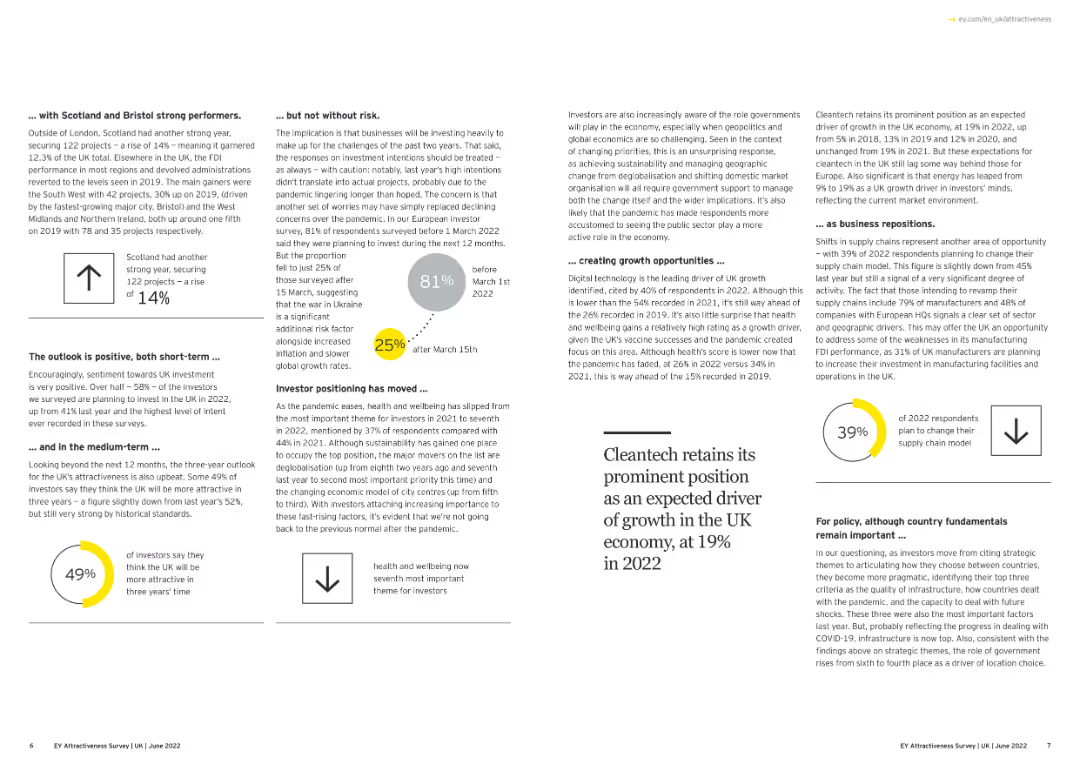
A combination of text and simple visual elements summarizing investment trends in specific UK regions.
Market Analysis and Trends
Financial Services
The slide outlines the performance of different UK regions in attracting FDI, noting the strength of Scotland and Bristol, the cautious investor sentiment, emerging growth opportunities, and the shifting investor focus towards sustainability and health and wellbeing.
UK Regions, FDI, Investment Trends, Regional Performance
false
Market Analysis and Trends
Financial Services
Multiple Chart
EY
Add to my slides
Remove from favorites
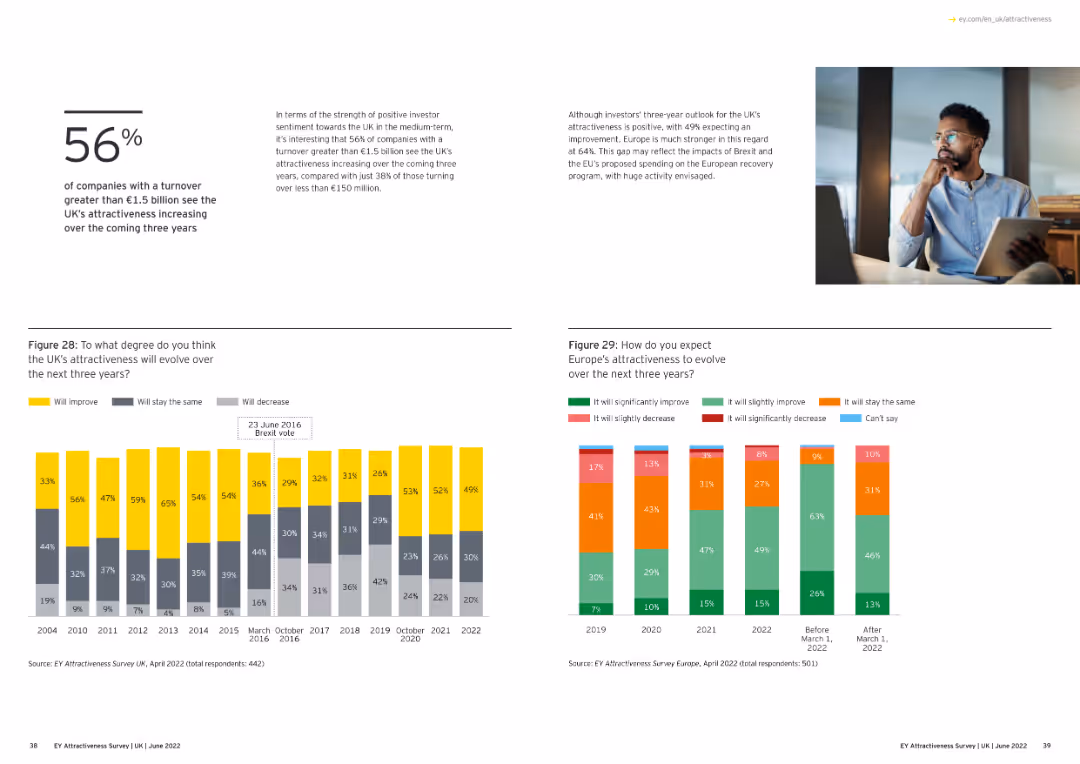
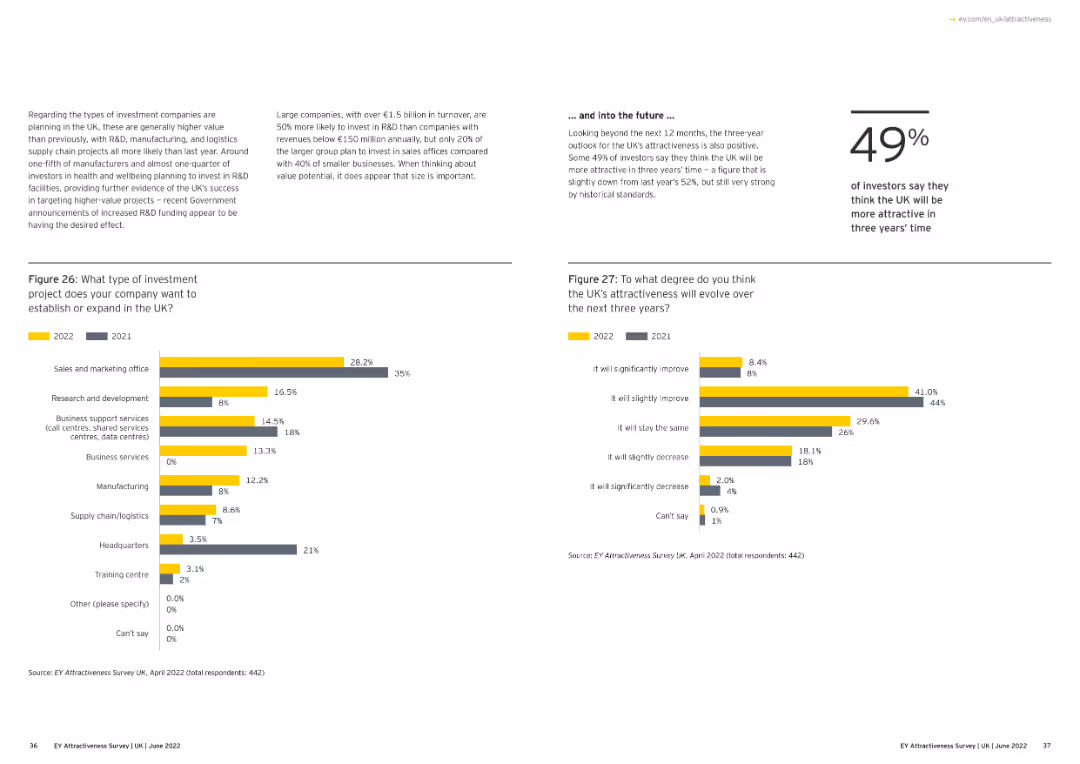
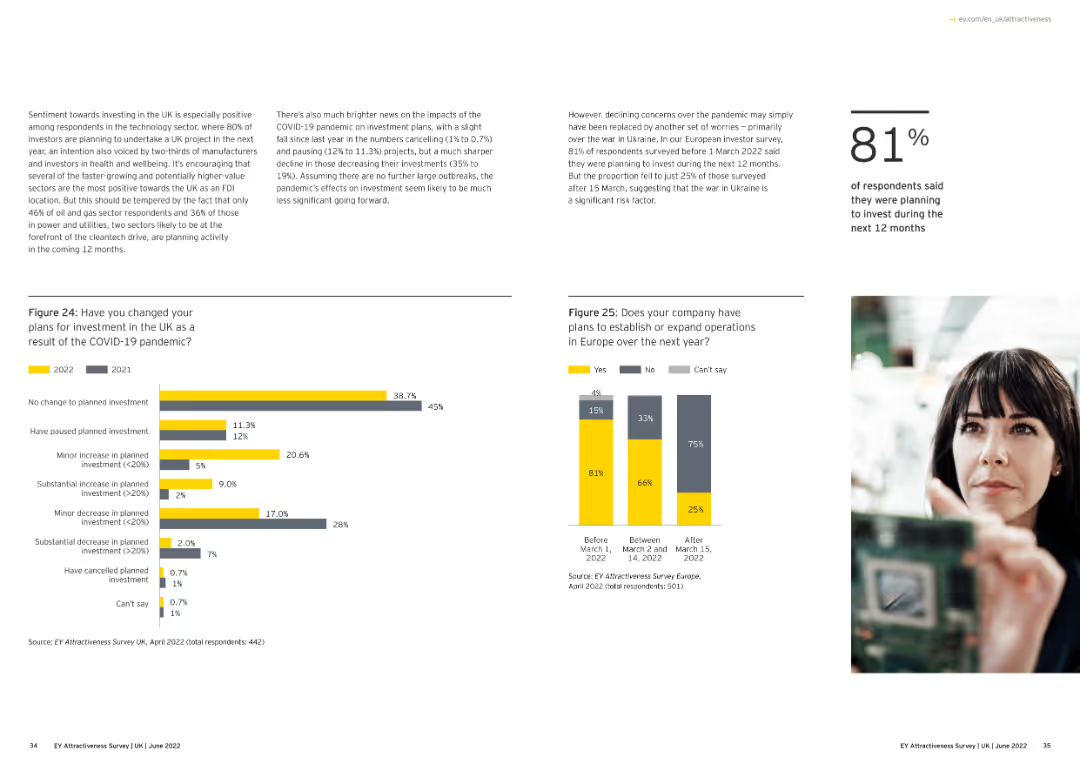
The slide contains text, a column chart, and a photo. The column chart shows data from 2010 to 2022, with yellow, gray, and black segments indicating various responses.
Market Analysis and Trends
Financial Services
The slide presents the attractiveness of the UK and Europe for investors, with detailed statistics and trends from surveys.
UK attractiveness, investor sentiment, survey, column chart, Europe
false
Market Analysis and Trends
Financial Services
Multiple Chart
EY
Add to my slides
Remove from favorites
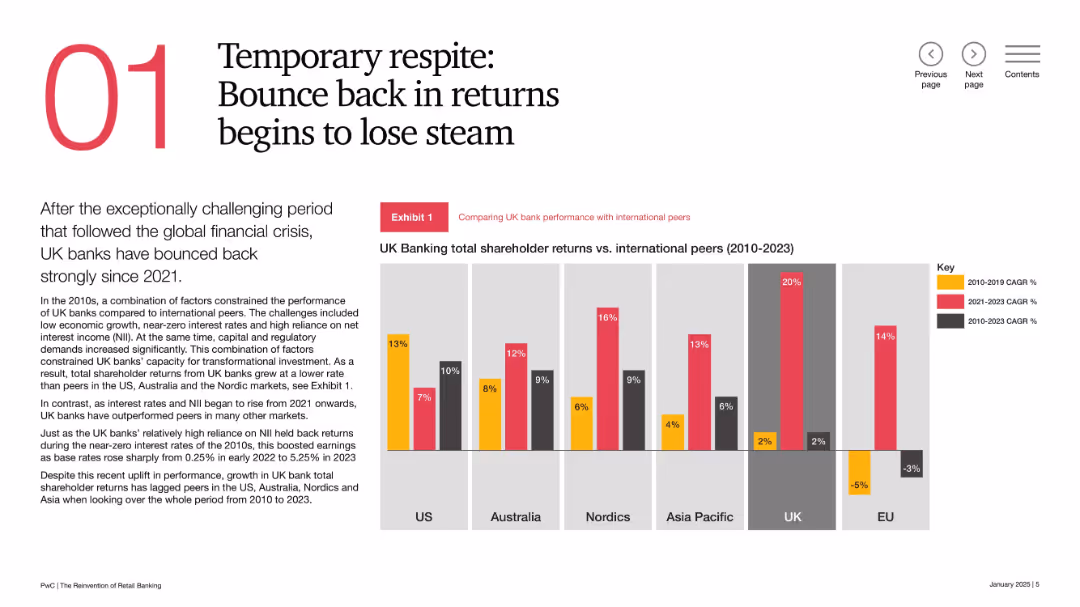
Split layout with large numeral “01”, narrative text block, and vertical bar chart comparing shareholder returns across regions; color-coded CAGR segments.
Financial Performance
Financial Services
This slide reviews the performance of UK banks vs. international peers from 2010–2023. While UK banks rebounded post-2021, they still trail in overall shareholder returns. Strong recent returns have been driven by rising interest rates, but momentum may be weakening.
UK banks, shareholder returns, international comparison, financial recovery, interest rates, CAGR, performance trends, banking sector
false
Financial Performance
Financial Services
Mixed Chart
PwC/Strategy&
Add to my slides
Remove from favorites
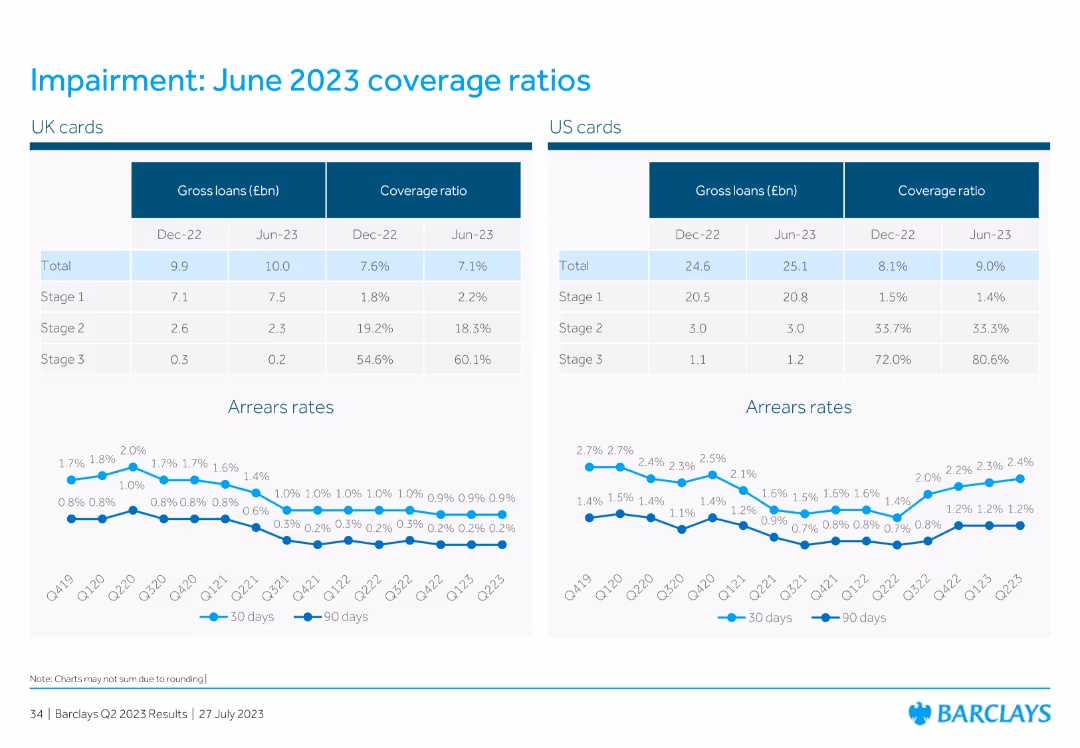
This slide displays two tables comparing UK and US cards for gross loans and coverage ratios for Dec 2022 and Jun 2023. Below the tables, there are two line charts showing arrears rates for 30 days and 90 days for both regions.
Financial Performance
Financial Services
The slide compares the coverage ratios and gross loans of UK and US cards for Dec 2022 and Jun 2023. It includes line charts to show the arrears rates over several quarters, providing insight into the financial health of these assets.
UK cards, US cards, gross loans, coverage ratio, arrears rates
false
Financial Performance
Financial Services
Multiple Chart
Barclays
Add to my slides
Remove from favorites
Displays a bar chart showing the leading city destinations of UK investment projects, excluding London, for 2020 and 2021.
Market Analysis and Trends
Financial Services
This slide highlights the top cities in the UK, excluding London, that attracted investment projects in 2020 and 2021, showing the comparative data.
UK cities, investment projects, 2020-21, bar chart
false
Market Analysis and Trends
Financial Services
Multiple Chart
EY
Add to my slides
Remove from favorites
Two-panel layout with bar chart (left) of GDP forecasts and line chart (right) of CPI, core inflation, and BoE interest rate.
Strategic Planning
Financial Services
The slide outlines improved GDP growth forecasts for the UK over the 2023–2025 period, along with persistent inflation pressures. It shows the Bank of England’s policy rate hike to manage inflation, while core inflation trends remain elevated, suggesting monetary tightening is expected to continue.
UK economy, GDP growth, inflation, interest rate, monetary policy, Bank of England, CPI, economic forecast
false
Strategic Planning
Financial Services
Multiple Chart
McKinsey
Add to my slides
Remove from favorites
The slide includes three line charts depicting UK y/y real GDP (2017-27F), UK unemployment and employment (2018-23), and UK y/y headline CPI (2004-25F). The charts are detailed, with future projections and supporting explanations in the text.
Market Analysis and Trends
Financial Services
This slide analyzes the UK economic outlook for 2024, highlighting constraints on growth due to household income, housing activity, and capital expenditures despite easing inflation. It provides insights into GDP, employment, and inflation trends.
UK economy, GDP, unemployment, CPI, growth constraints
false
Market Analysis and Trends
Financial Services
Multiple Chart
EY
Add to my slides
Remove from favorites
The slide features a large pie chart with centered text, multiple bullet points, and two high-resolution images. The layout is dense with a blend of text and visuals.
Industry Overview
Industrial & Manufacturing
The slide presents the economic benefits of the Tempest programme, emphasizing the development of critical skills and investment in R&D within the UK. It serves as a detailed informational piece to stakeholders about the programme's broader impacts on the economy.
UK economy, R&D, critical skills, Tempest programme, STEM careers, Catapult networks, high-skilled jobs, technology integrators, innovation culture
false
Industry Overview
Industrial & Manufacturing
Text Only
PwC/Strategy&
Add to my slides
Remove from favorites
This slide includes two column charts. The left chart shows UK mortgage rates over time for different loan-to-value ratios. The right chart presents UK housing market trends, including house prices and sales to stock ratio. The charts are clear with detailed annotations.
Market Analysis and Trends
Financial Services
This slide examines the UK housing market by analyzing mortgage rates, house prices, and market trends, useful for real estate market analysis and financial planning.
UK housing market, mortgage rates, house prices, sales to stock ratio, real estate
false
Market Analysis and Trends
Financial Services
Multiple Chart
JP Morgan
Add to my slides
Remove from favorites
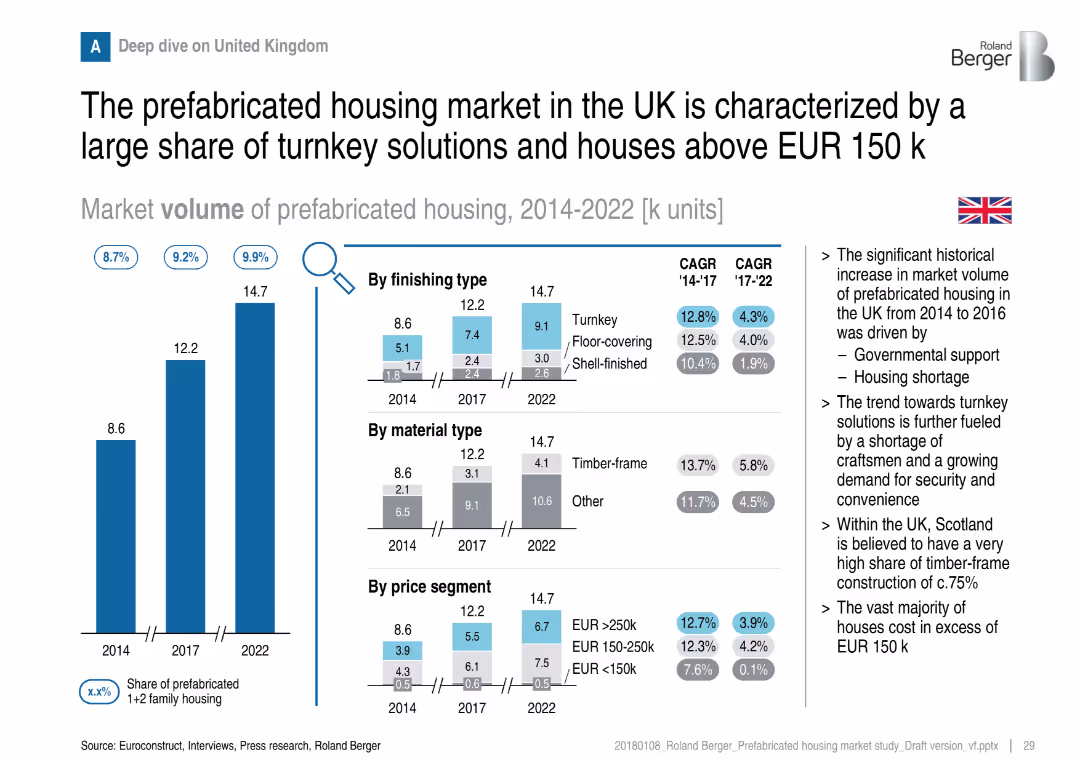
Vertical bars with detailed breakdowns by finishing type, material, and price; flag and notes on right
Customer and Market Segmentation
Real Estate & Construction
A deep dive into the UK market shows a strong preference for turnkey solutions and higher-value homes. Government support and housing shortages have driven growth. Timber-frame construction and higher price segments dominate.
UK housing, turnkey, timber-frame, pricing, prefabricated, market growth, segmentation
false
Customer and Market Segmentation
Real Estate & Construction
Multiple Chart
Roland Berger
Add to my slides
Remove from favorites
The slide features two column charts. The left chart shows the UK unemployment rate and wage growth over time. The right chart presents labor force participation rates for the US, Eurozone, and UK. The data is well-segmented and color-coded.
Market Analysis and Trends
Financial Services
This slide provides insights into the UK labor market, focusing on unemployment, wage growth, and labor force participation rates, essential for labor market analysis.
UK labor market, unemployment, wage growth, labor force participation, economic trends
false
Market Analysis and Trends
Financial Services
Multiple Chart
JP Morgan
Add to my slides
Remove from favorites
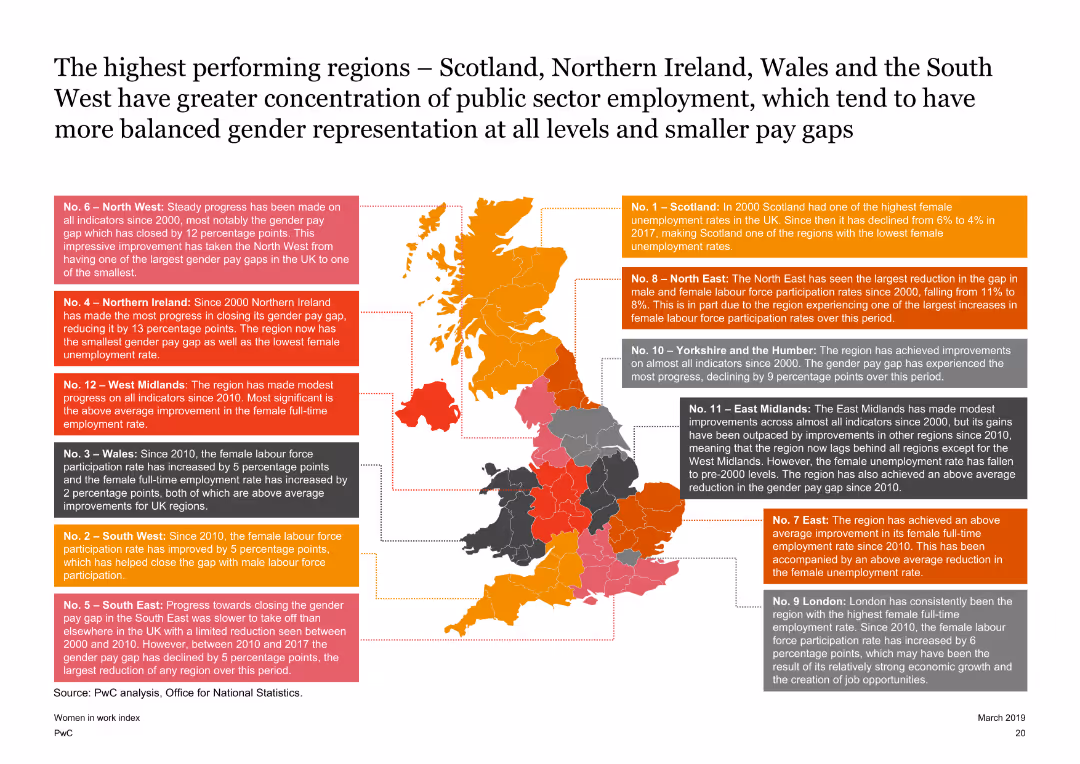
Features a map of the UK with highlighted regions and text boxes explaining the performance of each region on the Women in Work Index. The slide is detailed with a clear visual representation of regional data.
Market Analysis and Trends
Government & Public Sector
Highlights the top-performing regions in the UK on the Women in Work Index, such as Scotland and Northern Ireland, discussing their progress in female labor force participation and gender pay gap reduction since 2000.
UK map, regional performance, gender pay gap, female labor force participation
false
Market Analysis and Trends
Government & Public Sector
Graphic
PwC/Strategy&
Add to my slides
Remove from favorites
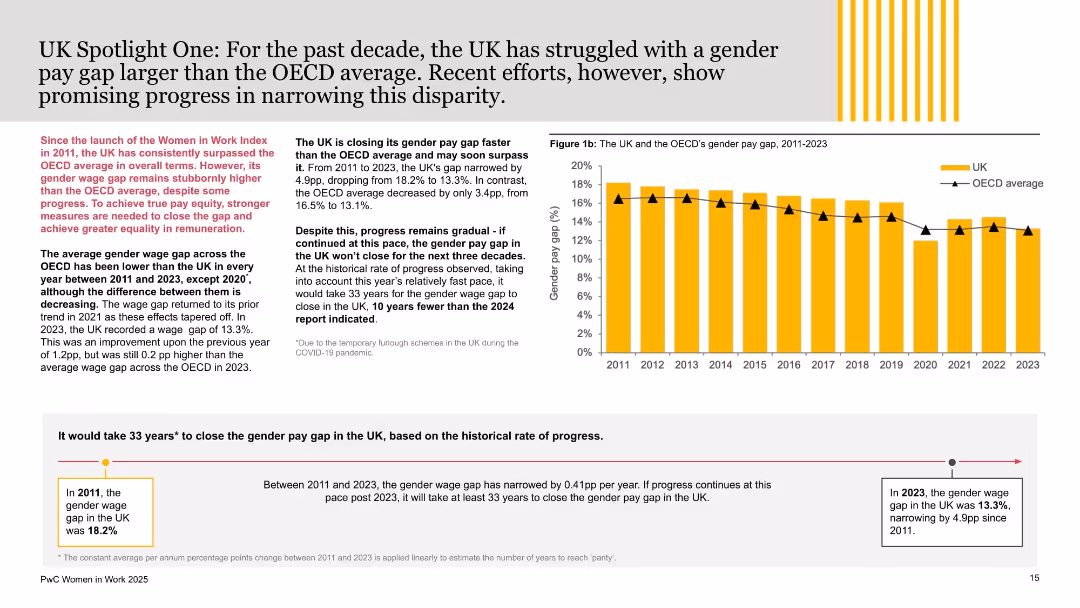
Mix of bar chart and annotated analysis; UK and OECD gender pay gap from 2011 to 2023 charted with narrative on progress and future projections.
Regulatory and Compliance
Government & Public Sector
This slide focuses on the UK’s gender pay gap, showing a reduction from 18.2% in 2011 to 13.3% in 2023. Despite progress, the UK still lags behind the OECD average. The projection estimates it would take 33 more years to reach parity if trends persist.
UK pay gap, gender disparity, OECD comparison, remuneration equity, wage trends, PwC report, policy, gender equality, parity forecast, employment
false
Regulatory and Compliance
Government & Public Sector
Mixed Chart
PwC/Strategy&
Add to my slides
Remove from favorites
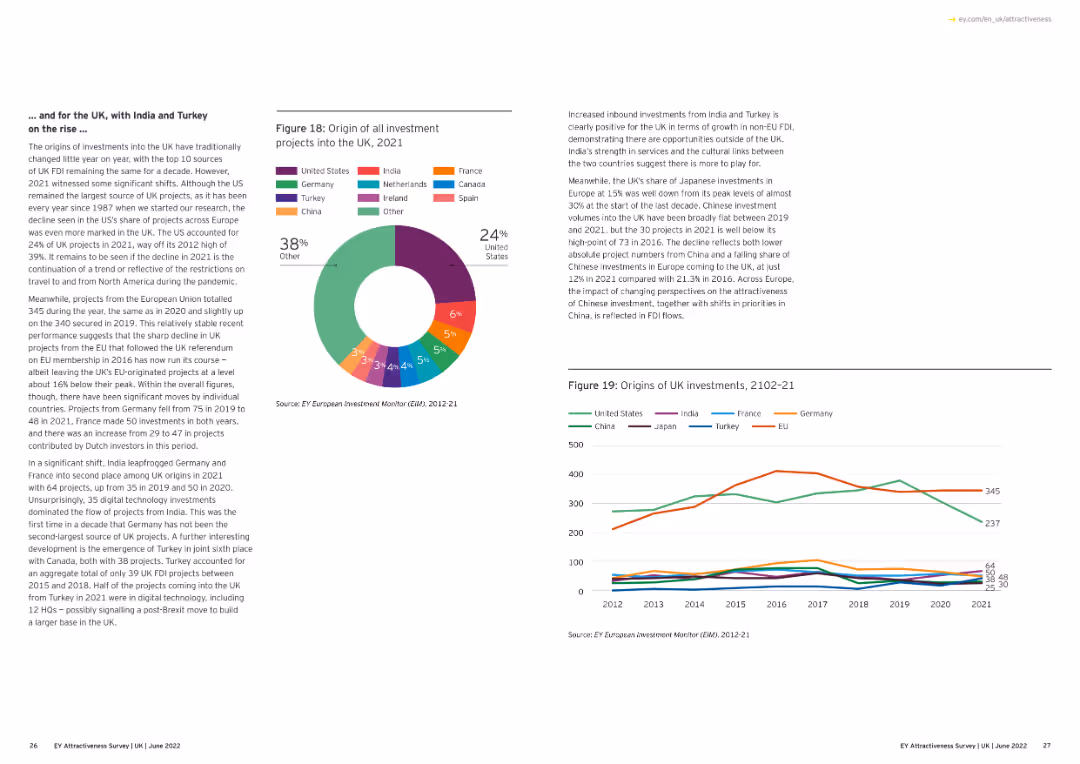
The slide shows a line chart detailing UK projects by activity from 2012 to 2021, with lines for different types of activities like business services, sales.
Market Analysis and Trends
Financial Services
This slide provides an overview of the distribution of UK projects by activity over the past decade, highlighting changes in business focus and investment.
UK projects, activity, business services, 2012-21
false
Market Analysis and Trends
Financial Services
Multiple Chart
EY
Add to my slides
Remove from favorites
Features a bar chart comparing the regional and devolved administration destinations of UK projects in 2020 and 2021.
Market Analysis and Trends
Financial Services
This slide presents data on the distribution of UK investment projects across various regions and devolved administrations, showing year-on-year changes.
UK projects, regions, devolved administration, 2020-21
false
Market Analysis and Trends
Financial Services
Multiple Chart
EY
Add to my slides
Remove from favorites
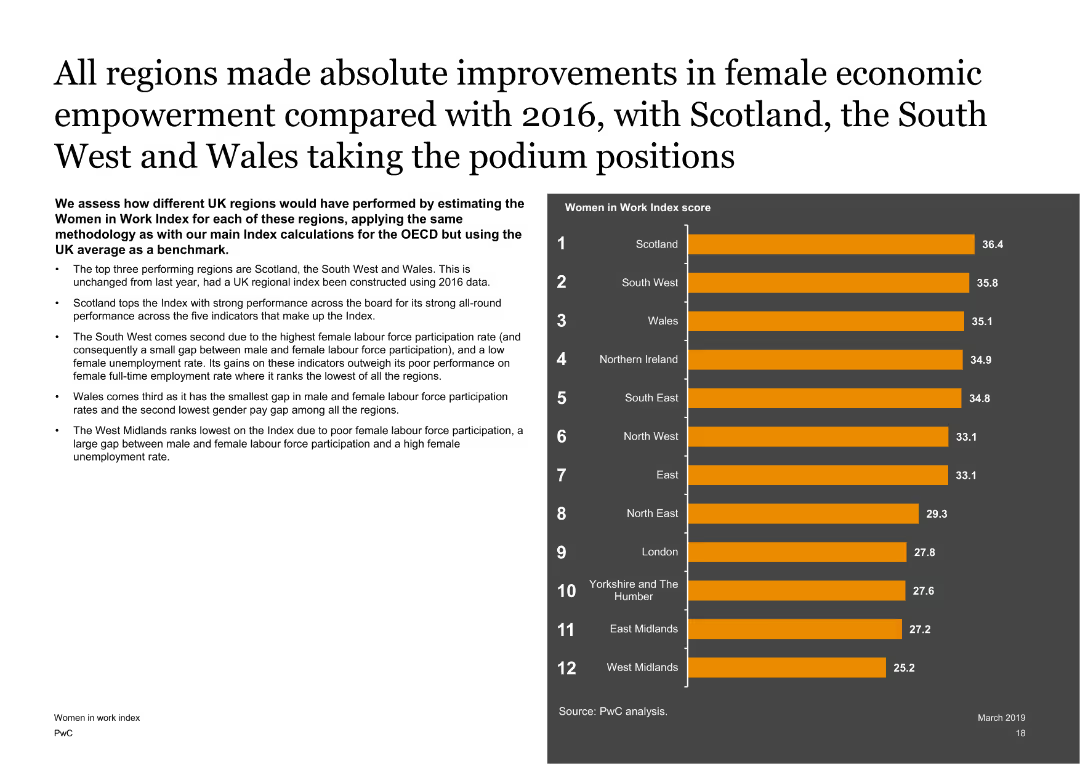
Features a text on the left with a column chart on the right showing Women in Work Index scores for different UK regions. The slide is visually balanced with clear regional comparisons.
Market Analysis and Trends
Government & Public Sector
Assesses the performance of different UK regions on the Women in Work Index, highlighting the top-performing regions like Scotland, the South West, and Wales, and discussing the factors contributing to their scores.
UK regions, Women in Work Index, economic empowerment, regional analysis
false
Market Analysis and Trends
Government & Public Sector
Mixed Chart
PwC/Strategy&
Add to my slides
Remove from favorites
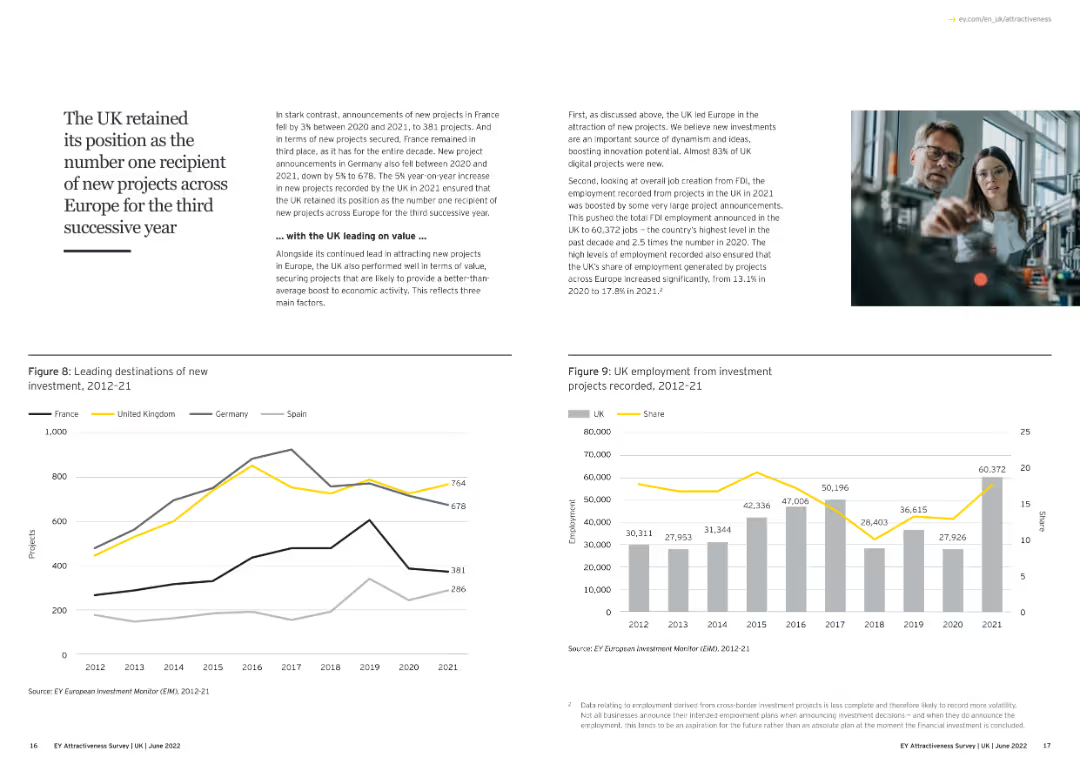
Text and line chart showing the UK's leading position in new investment projects in Europe.
Market Analysis and Trends
Financial Services
The slide highlights the UK's continued leadership in attracting new FDI projects across Europe for the third successive year, emphasizing the economic benefits and job creation resulting from these investments.
UK, FDI, Leadership, New Projects, Economic Benefits
false
Market Analysis and Trends
Financial Services
Multiple Chart
EY
Add to my slides
Remove from favorites
The slide features a title, two column charts for GDP projections, and a combined line and column chart for inflation and interest rates.
Financial Performance
Financial Services
This slide presents forecasts for UK's GDP growth and inflation rates, alongside historical Bank of England interest rates, useful for financial analysis.
UK, GDP, inflation, forecast, Bank of England, interest rate, economic, analysis, projections
false
Financial Performance
Financial Services
Multiple Chart
McKinsey
Add to my slides
Remove from favorites
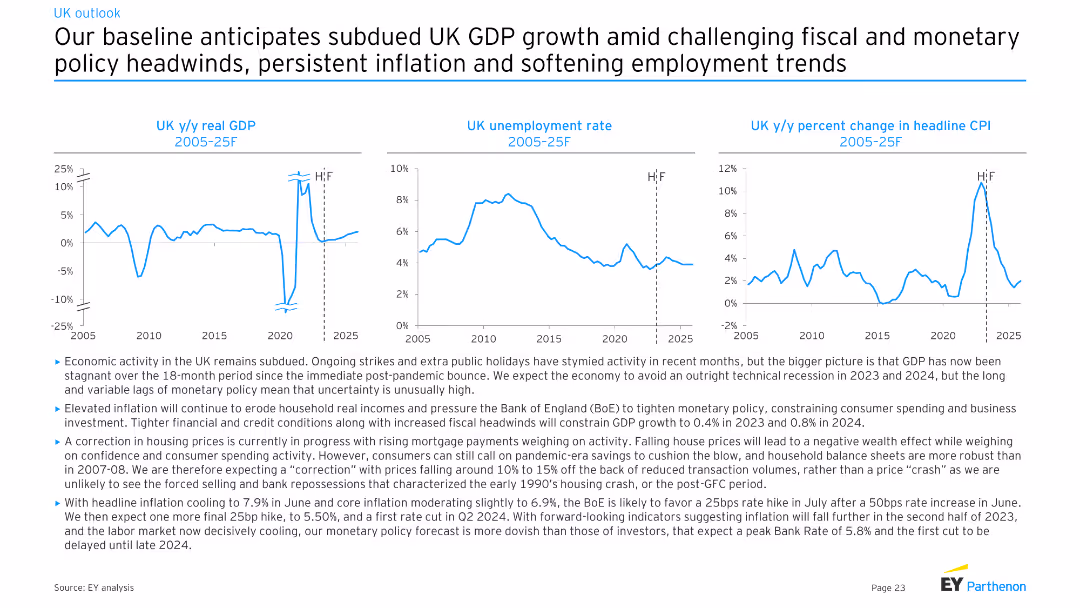
Three line charts depicting UK y/y real GDP, UK unemployment rate, and UK y/y percent change in headline CPI from 2005-25F. Moderate complexity with clear visual representations for economic trends analysis.
Market Analysis and Trends
Financial Services
The slide provides an economic forecast for the UK, projecting subdued GDP growth, persistent inflation, and softening employment trends. It discusses the effects of fiscal and monetary policies, as well as ongoing strikes and public holidays on economic activity.
UK, GDP, unemployment, CPI, forecast
false
Market Analysis and Trends
Financial Services
Multiple Chart
EY
Add to my slides
Remove from favorites
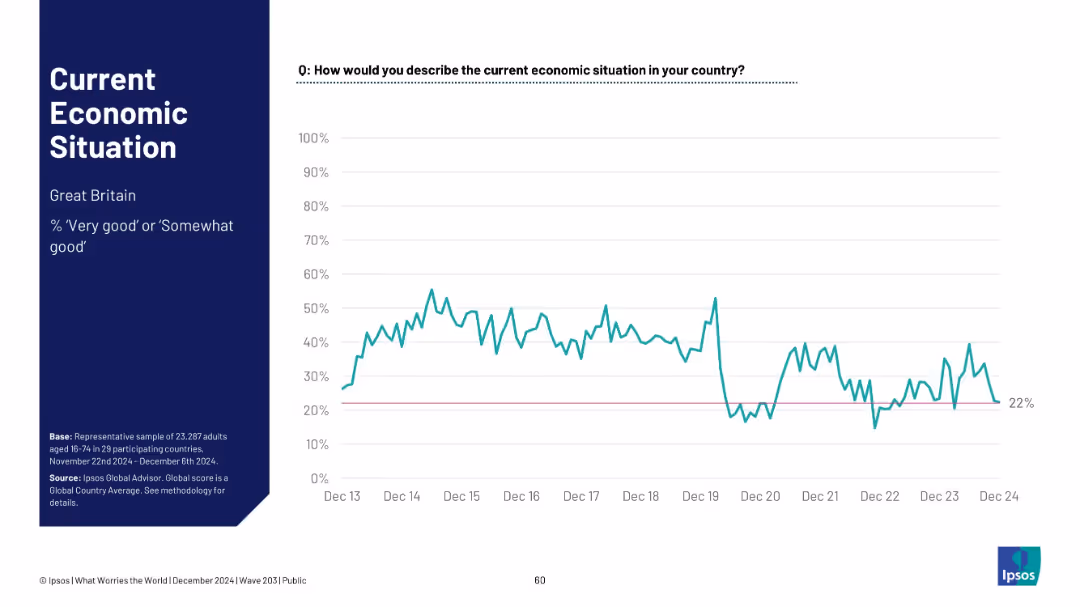
Timeline chart for Great Britain; shows fluctuation and recent dip; pink baseline at 22%.
Market Analysis and Trends
Financial Services
Great Britain’s economic sentiment is at 22%, showing considerable variability since 2013. The chart indicates a recent dip, reinforcing a low economic outlook.
UK, Great Britain, Ipsos, sentiment analysis, timeline, economic perception, 2024 low, public opinion, volatility
false
Market Analysis and Trends
Financial Services
Mixed Chart
IPSOS
Add to my slides
Remove from favorites
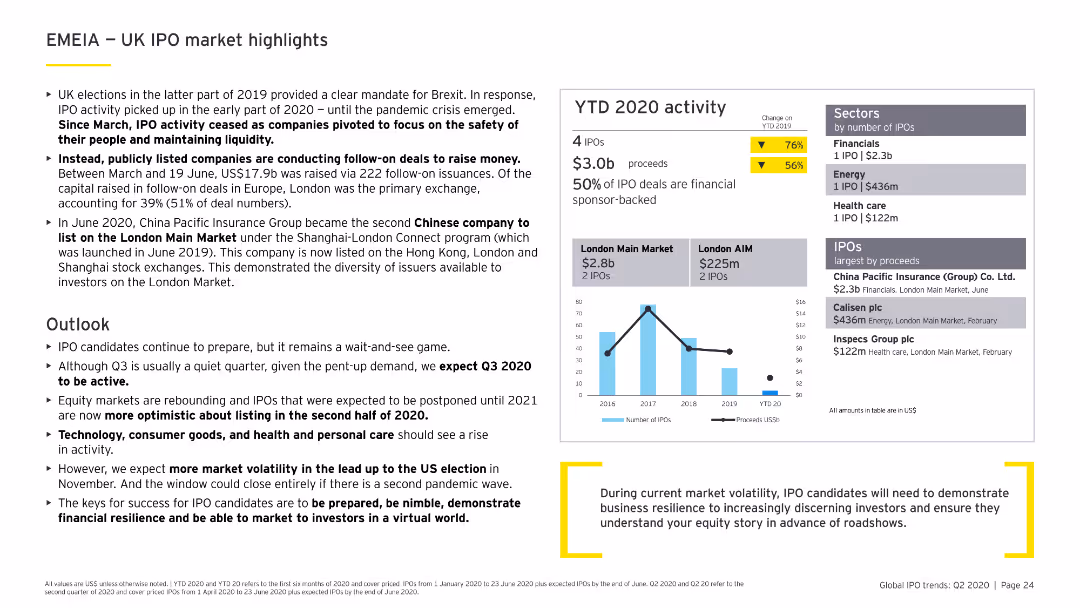
Features column charts, data tables, and bullet points. The slide is moderately dense with a clear layout, focusing on the UK's IPO market activities and highlights.
Market Analysis and Trends
Financial Services
Discusses the impact of Brexit and COVID-19 on the UK IPO market, including sector performance, major IPOs, and future market expectations for the latter half of 2020.
UK, IPO, Brexit, COVID-19, market highlights
false
Market Analysis and Trends
Financial Services
Multiple Chart
EY
Add to my slides
Remove from favorites
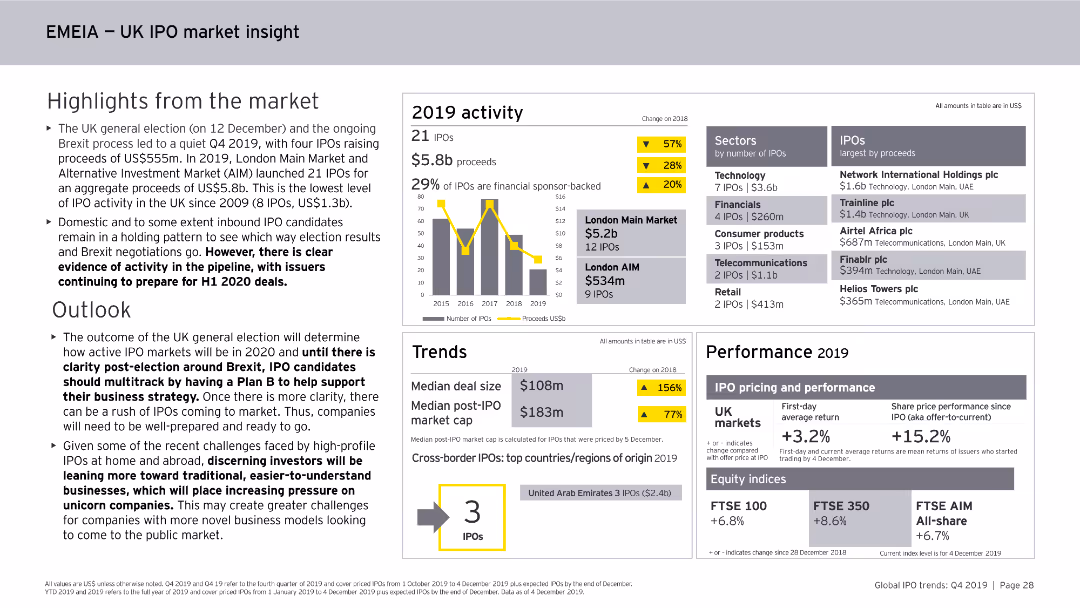
This slide features column charts, numerical data points, and textual highlights. It focuses on the UK IPO market within the EMEIA region, covering activity levels, sectors, and performance metrics for 2019.
Market Analysis and Trends
Financial Services
The slide summarizes the UK IPO market within the EMEIA region for 2019, noting the number of IPOs, proceeds, sector activity, performance metrics, and the outlook for 2020.
UK, IPO, EMEIA, Market Analysis, Financial Services, Trends, Activity, Sectors, 2019
false
Market Analysis and Trends
Financial Services
Mixed Chart
EY
Add to my slides
Remove from favorites
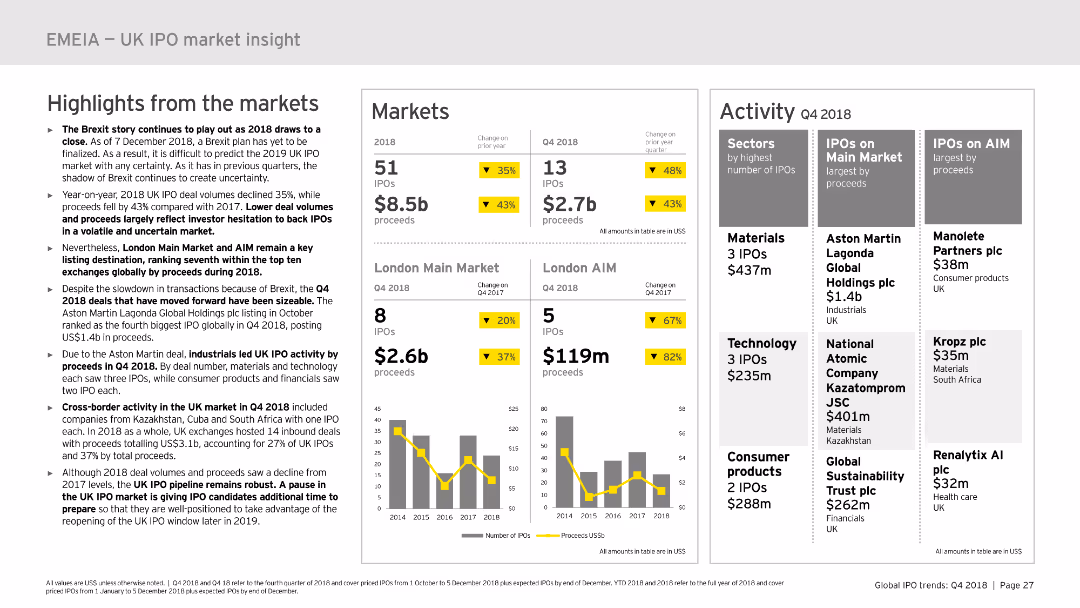
This slide includes multiple sections: highlights from the market, markets, and activity. It uses column charts and data tables to present IPO data and market performance in the UK. The layout is detailed, offering a clear and structured overview of the market insights.
Market Analysis and Trends
Financial Services
Provides insights into the UK IPO market in 2018, including market highlights, performance data, and activity details. Useful for market analysis and strategic planning in the financial sector.
UK, IPO, market insight, performance, trends
false
Market Analysis and Trends
Financial Services
Multiple Chart
EY
Add to my slides
Remove from favorites
This slide features two line charts illustrating UK CPI inflation rates over several years, comparing the traditional core inflation with core excluding COVID-impacted sectors. The orange dashed line represents the traditional core, while the blue line shows the core excluding COVID-impacted sectors.
Market Analysis and Trends
Financial Services
This slide dissects the recent rise in UK inflation by differentiating between traditional core inflation and core inflation excluding sectors impacted by COVID-19. It can be used to discuss the nuances of inflation measurement and the pandemic's specific effects on economic indicators.
UK, Inflation, CPI, COVID-19 Impact, Economic Analysis, Sector Comparison, Line Chart
false
Market Analysis and Trends
Financial Services
Single Chart
JP Morgan
Add to my slides
Remove from favorites
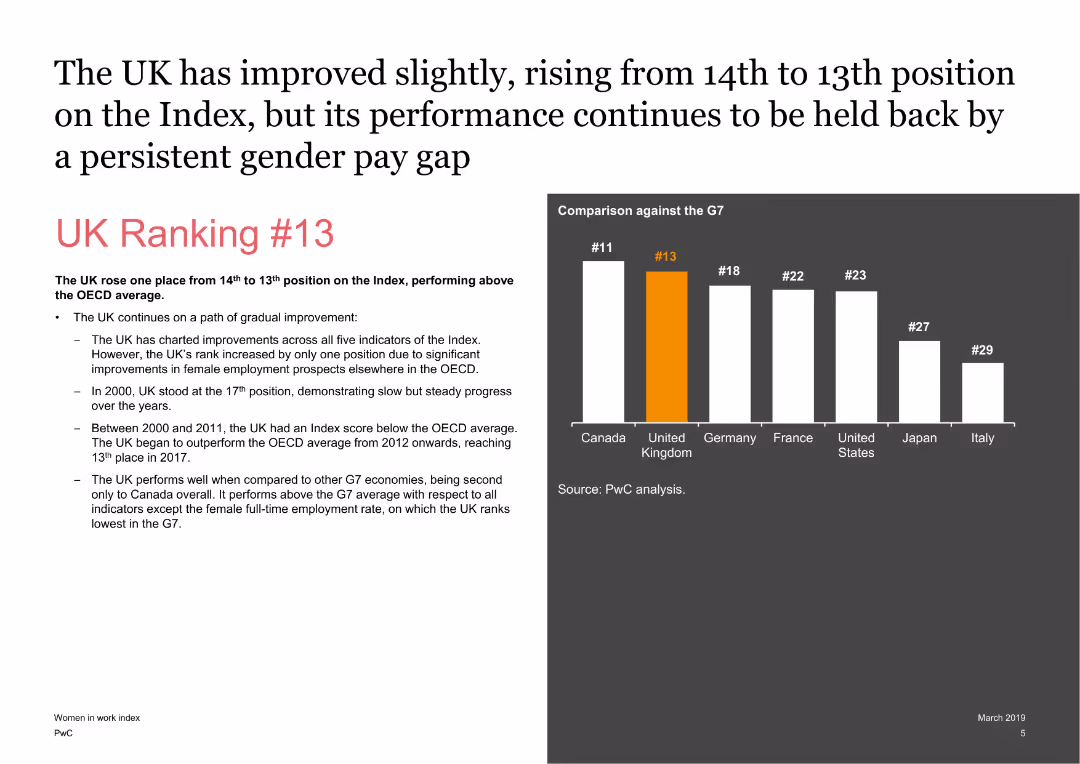
The slide features a mix of text and a column chart comparing the UK’s ranking with other G7 countries. The text highlights key points about the UK's position in the index and its performance over time.
Market Analysis and Trends
Financial Services
It discusses the UK’s improvement in the ranking on the Women in Work Index, highlighting the UK's performance compared to other G7 countries and factors influencing its ranking.
UK, Ranking, G7, Performance, Index, Analysis
false
Market Analysis and Trends
Financial Services
Mixed Chart
PwC/Strategy&
Add to my slides
Remove from favorites
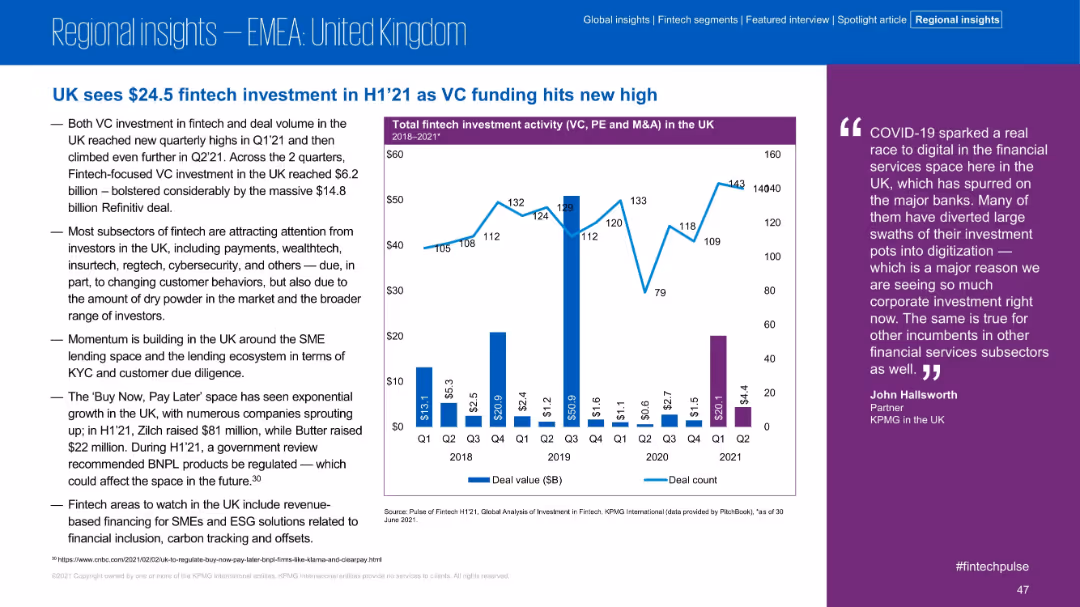
Left-aligned bullet points with right-side chart and quote; purple-accented chart shows total fintech investment in the UK from 2018 to 2021. Clean, professional layout.
Market Analysis and Trends
Financial Services
The slide highlights the UK's record fintech investment of $24.5B in H1 2021. VC activity and deal volume hit new highs due to large deals, especially the $14.8B Refinitiv transaction. Commentary includes insights on subsectors like insurtech and BNPL.
UK, VC, Fintech, H1 2021, BNPL, Insurtech, Refinitiv, Investment Volume, Trends
false
Market Analysis and Trends
Financial Services
Mixed Chart
KPMG
Add to my slides
Remove from favorites
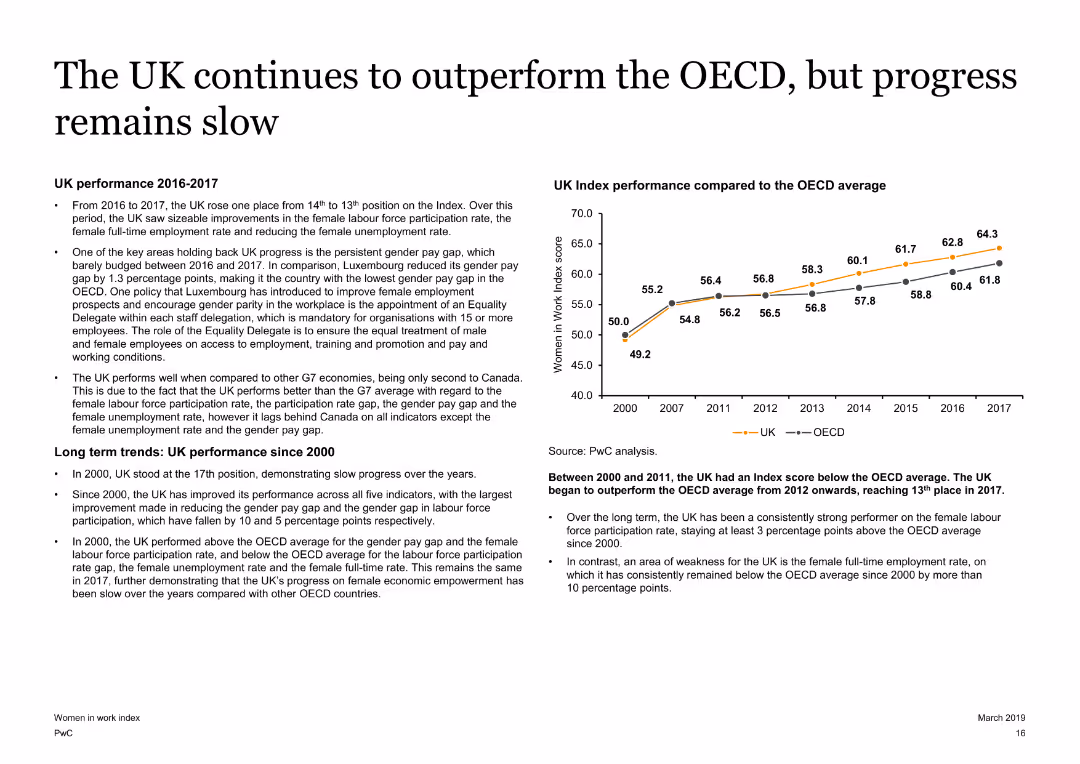
A slide with text on the left and a line chart on the right. The line chart compares the UK Index performance with the OECD average from 2000 to 2017. The slide has a moderate amount of text and visual elements.
Market Analysis and Trends
Government & Public Sector
Analyzes the UK's performance on the Women in Work Index, showing improvements over time and comparing it with the OECD average. Highlights key factors affecting progress, such as the gender pay gap and female labor force participation rates.
UK, Women in Work Index, OECD, gender pay gap, labor force participation
false
Market Analysis and Trends
Government & Public Sector
Mixed Chart
PwC/Strategy&
Add to my slides
Remove from favorites
Column charts showing NPL ratios, loan loss provisions, and Stage 2 loans for top UK banks.
Risk Assessment and Management
Financial Services
Analyzes NPL ratios and provisions of major UK banks, highlighting risk management strategies and trends.
UK, banks, NPL, risk, management
false
Risk Assessment and Management
Financial Services
Multiple Chart
Deloitte
Add to my slides
Remove from favorites
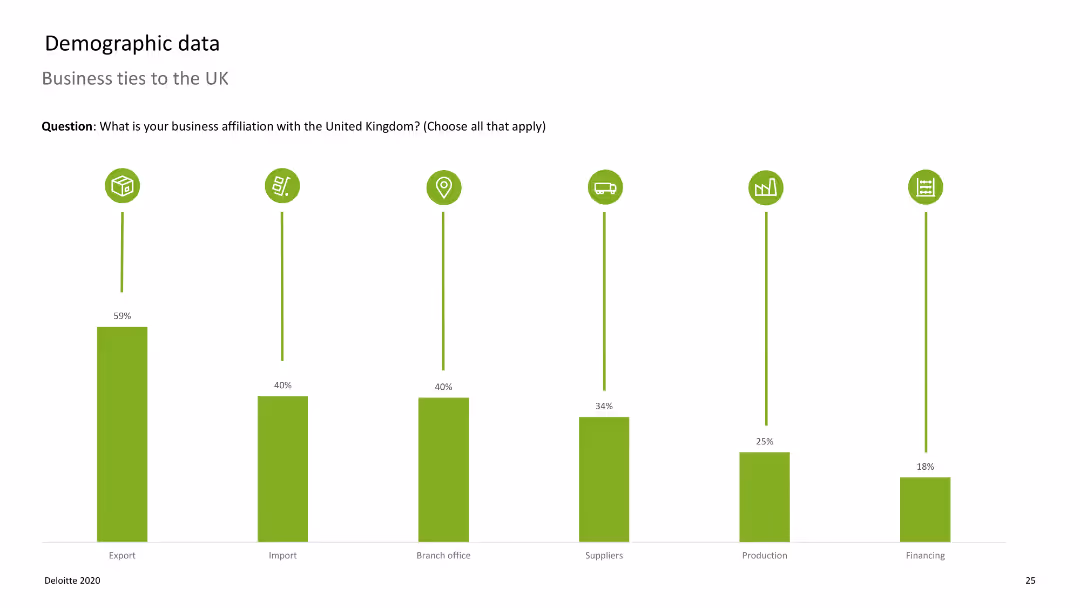
Bar chart displaying business affiliations with the UK, with vertical bars representing different affiliations.
Market Analysis and Trends
Professional Services
Shows the extent of business ties companies have with the UK, such as exports, imports, and branch offices.
UK, business ties, exports, imports, affiliations
false
Market Analysis and Trends
Professional Services
Single Chart
Deloitte
Add to my slides
Remove from favorites
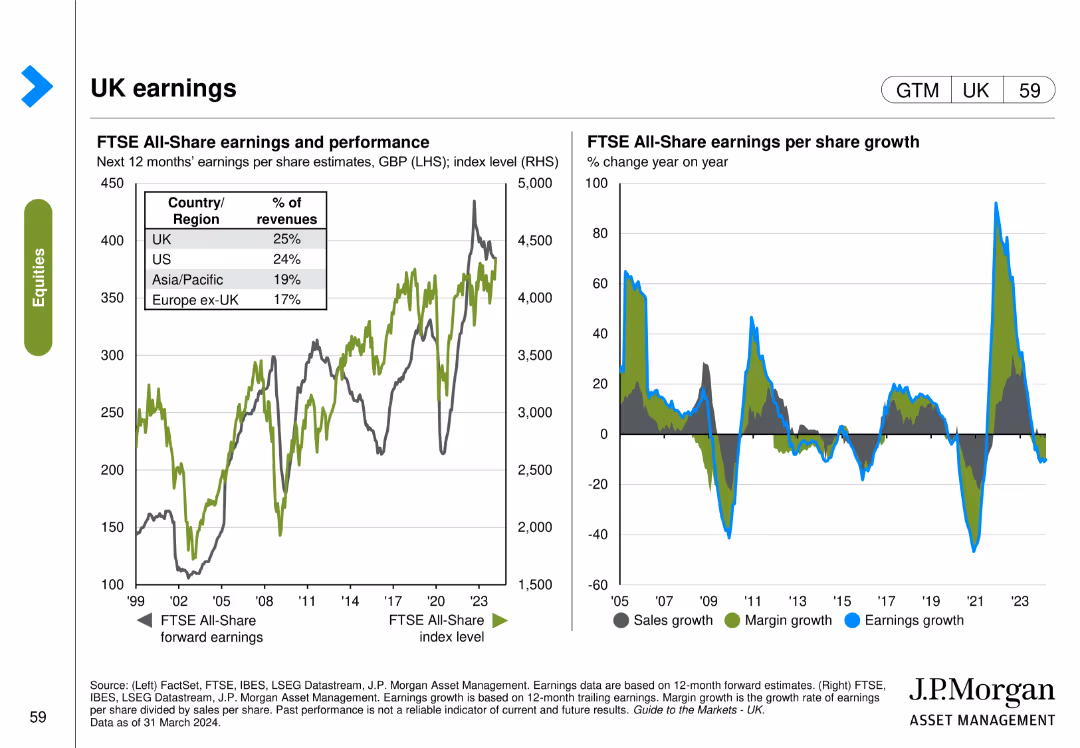
This slide contains two line charts. The first chart shows the FTSE All-Share earnings and performance over time. The second chart depicts the FTSE All-Share earnings per share growth year on year.
Financial Performance
Financial Services
The slide analyzes the FTSE All-Share earnings performance and growth, providing insights into the financial performance and trends within the UK market.
UK, earnings, FTSE, All-Share, performance, growth, financial, analysis
false
Financial Performance
Financial Services
Multiple Chart
JP Morgan
Add to my slides
Remove from favorites
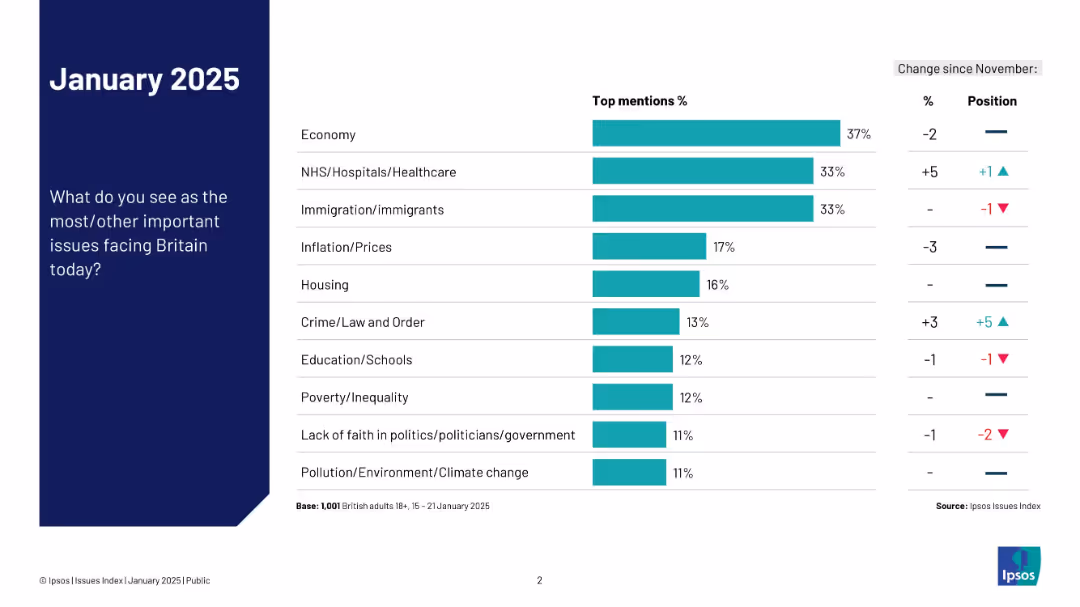
Left-aligned title and question; right side features a horizontal bar chart ranking top national concerns
Market Analysis and Trends
Government & Public Sector
The slide ranks the most pressing issues in Britain as of January 2025, with economy, NHS, and immigration topping the list. It includes change indicators from November and position shifts.
UK, economy, NHS, immigration, top issues, public opinion, priorities, Ipsos, change, survey
false
Market Analysis and Trends
Government & Public Sector
Mixed Chart
IPSOS
Add to my slides
Remove from favorites
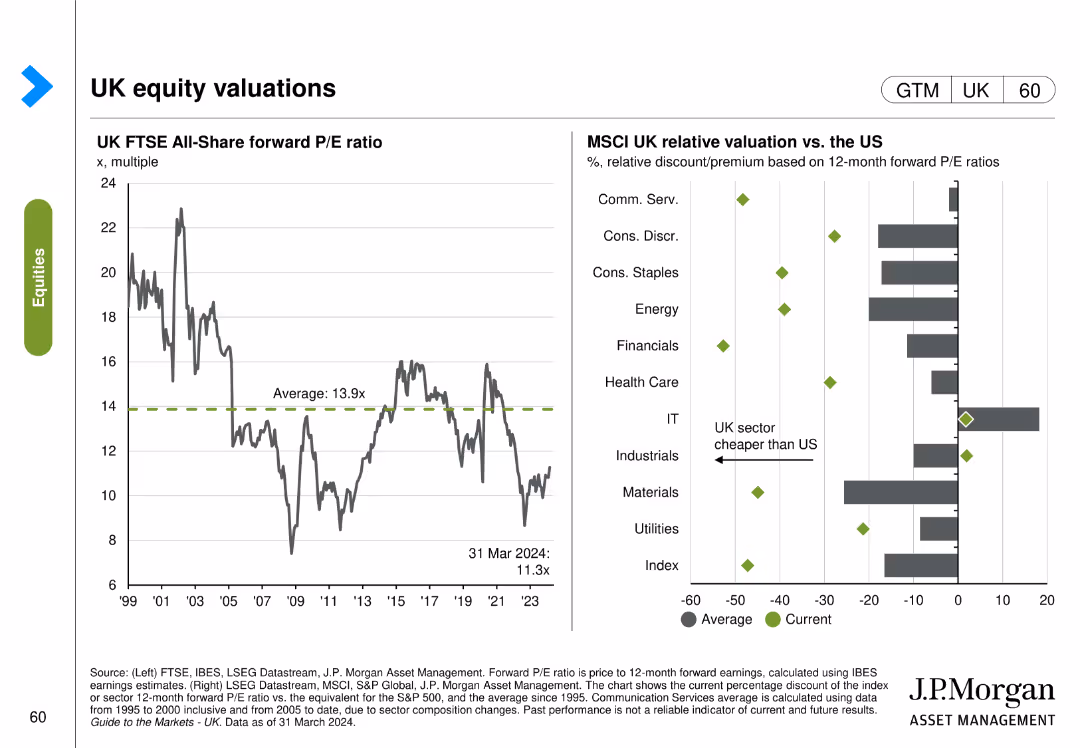
This slide includes two column charts. The first chart shows the UK FTSE All-Share forward P/E ratio over time. The second chart compares MSCI UK relative valuation vs. the US across different sectors.
Investment Analysis
Financial Services
The slide provides an analysis of the UK FTSE All-Share forward P/E ratio and its relative valuation compared to the US, aiding in investment decisions.
UK, equity, valuations, FTSE, MSCI, P/E ratio, US, comparison
false
Investment Analysis
Financial Services
Multiple Chart
JP Morgan
Add to my slides
Remove from favorites
Line chart comparing UK core goods versus services prices from 1988 to the present. Two lines, one for services (orange) and one for core goods (blue), show different growth trajectories with a clear upward trend for services.
Market Analysis and Trends
Financial Services
Demonstrates the differential inflation trends for goods and services in the UK, suggesting globalization's influence on price levels. This may inform investment strategies and economic policies.
UK, inflation, core goods, services prices, globalization, economic trends, market analysis, line chart, index level, J.P. Morgan.
false
Market Analysis and Trends
Financial Services
Single Chart
JP Morgan
Add to my slides
Remove from favorites
The slide features a line chart comparing expected reductions in UK government spending. It includes commentary and implications for corporates.
Regulatory and Compliance
Government & Public Sector
This slide examines the potential contraction in UK public services spending due to government tax cuts. It discusses the impacts on businesses and household finances.
UK, public spending, government policy, financial analysis, regulatory impact
false
Regulatory and Compliance
Government & Public Sector
Mixed Chart
Accenture
Add to my slides
Remove from favorites
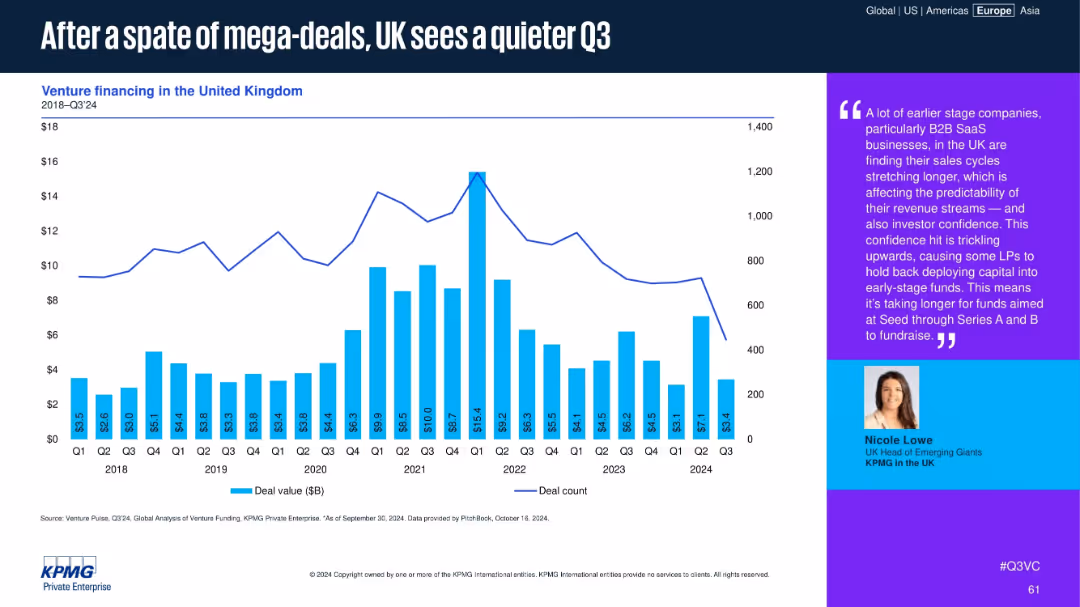
Bar chart overlaid with a line graph showing venture financing deal value and count in the UK from 2018 to Q3 2024. Commentary on the right side with expert quote and photo.
Market Analysis and Trends
Financial Services
UK venture financing shows a notable Q3 slowdown after previous mega-deals, especially among early-stage B2B SaaS firms. The commentary highlights LP hesitancy and longer fundraising cycles amid uncertain revenue predictability.
UK, venture financing, SaaS, deal volume, early-stage, LP confidence, Q3 slowdown, fundraising, seed funds, Series A
false
Market Analysis and Trends
Financial Services
Mixed Chart
KPMG
Add to my slides
Remove from favorites
Tabular format with icons, topics, and bullet-point summaries under a consistent column layout; uses white, red, black, and grey color blocks to distinguish topic categories.
Regulatory and Compliance
Government & Public Sector
This slide outlines several cooperative agreements between the UK and EU across sectors like fishing, farming, carbon trading, and defense. It emphasizes reduced red tape, reciprocal access, and restoration of quotas to pre-Brexit norms.
UK-EU agreement, regulatory cooperation, red tape, sectoral deals, fishing, farming, defense, steel, mobility scheme, SPS standards
false
Regulatory and Compliance
Government & Public Sector
Table
PwC/Strategy&
Add to my slides
Remove from favorites
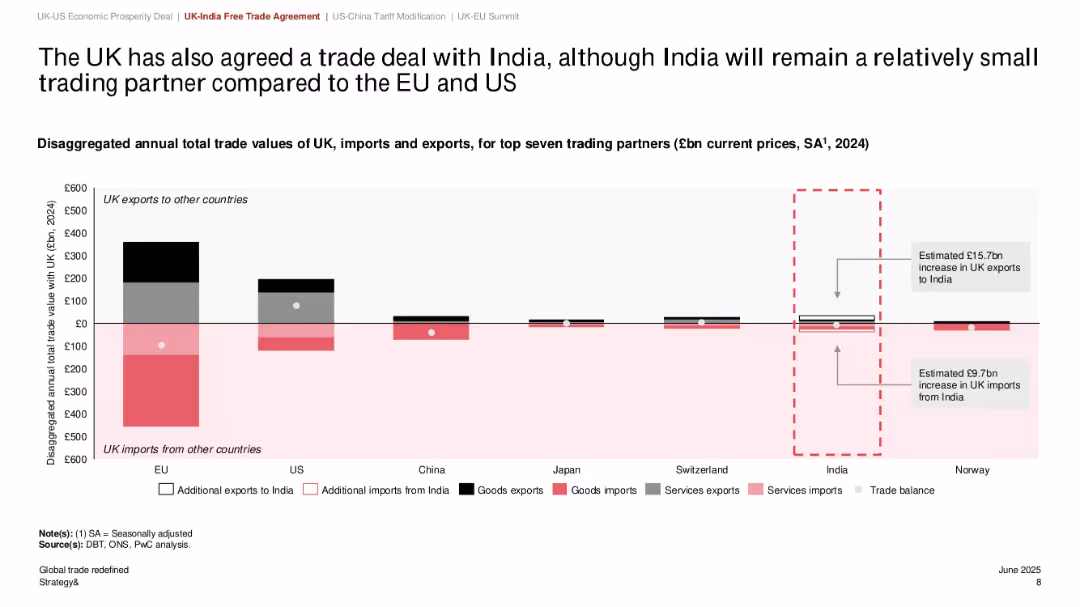
Bar chart comparing trade value with seven major countries; India trade section highlighted; use of black/red/gray with dotted annotation boxes
Strategic Planning
Government & Public Sector
The slide outlines the UK's trade relationships with major countries, emphasizing a new trade deal with India. Though India remains a small trade partner compared to the EU and US, the deal is expected to add £15.7bn in UK exports and £9.7bn in imports. The chart helps position India's role within the UK's overall trade strategy.
UK-India trade, exports, imports, trade agreement, economic relations, top partners, global strategy
false
Strategic Planning
Government & Public Sector
Single Chart
PwC/Strategy&
Add to my slides
Remove from favorites
Left-aligned text summary with bold headings; large central pie chart on right; three major callouts; minimal clutter; black/red/gray palette
Regulatory and Compliance
Government & Public Sector
The slide explains the impact of the UK-US Economic Prosperity Deal on UK exports. It shows that less than 25% of UK goods exports are covered under reduced tariffs, with over 60% still facing a 10% tariff. The deal primarily benefits motor vehicle exporters and reduces tariffs from over 25% to 10%, supporting UK manufacturers heavily reliant on US markets.
UK-US trade deal, tariffs, motor vehicles, economic impact, exports, regulatory change, UK manufacturers
false
Regulatory and Compliance
Government & Public Sector
Mixed Chart
PwC/Strategy&
Add to my slides
Remove from favorites
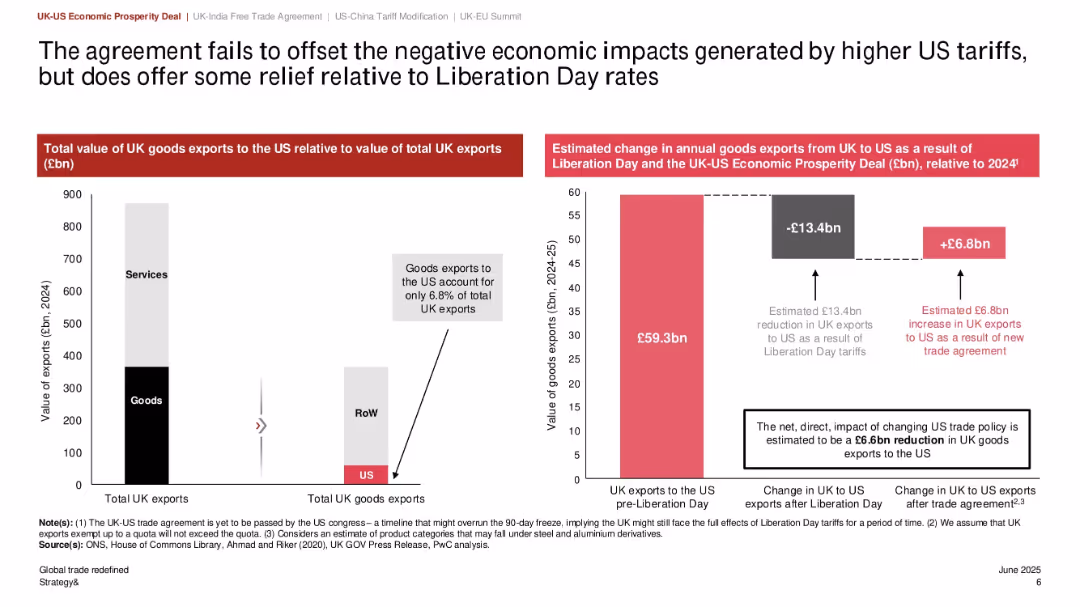
Dual bar charts: left shows export distribution, right shows economic impact; central column explains estimated changes in exports; clear numeric callouts
Regulatory and Compliance
Government & Public Sector
This slide quantifies the impact of the UK-US trade agreement, showing a net loss of £6.6bn in UK exports to the US even after accounting for gains from the new deal. It also emphasizes that UK goods exports to the US make up only 6.8% of total exports, highlighting limited trade dependency.
UK-US trade, export value, tariff policy, economic impact, Liberation Day, trade deficit, goods exports
false
Regulatory and Compliance
Government & Public Sector
Multiple Chart
PwC/Strategy&
Add to my slides
Remove from favorites
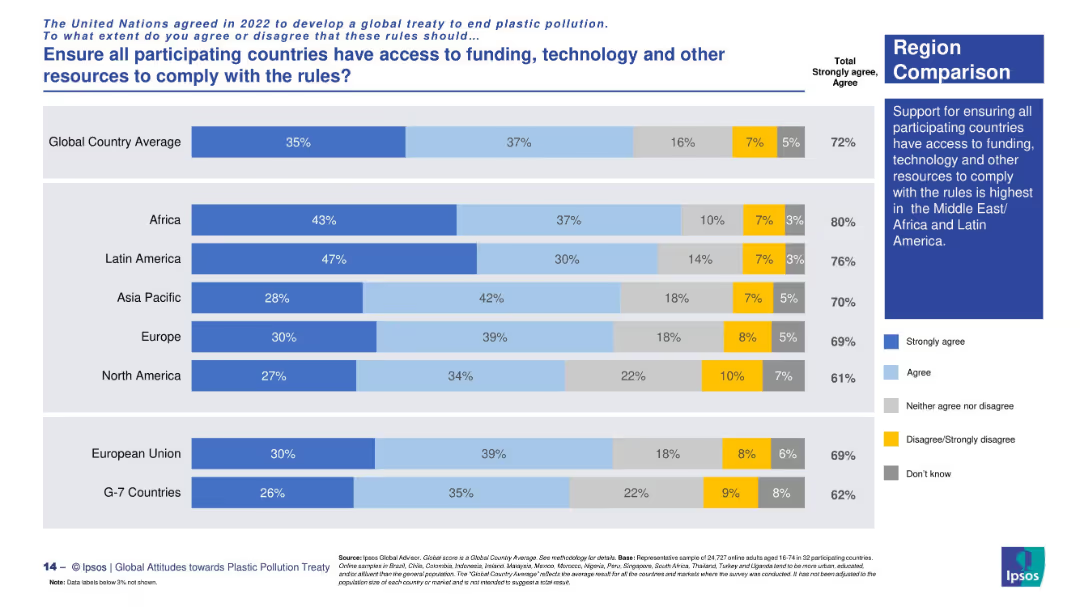
Horizontal bar chart with region-based comparison. Uses five-color segmented bars to represent opinion distribution across global regions. A text box on the right summarizes key insight.
Regulatory and Compliance
Government & Public Sector
This slide shows regional public opinion on ensuring equitable access to funding, technology, and other resources to help countries comply with UN plastic pollution treaty rules. Africa and Latin America show the strongest support.
UN treaty, plastic pollution, regional support, funding access, technology equity, Africa, Latin America, compliance support
false
Regulatory and Compliance
Government & Public Sector
Mixed Chart
IPSOS
Add to my slides
Remove from favorites
Visually vibrant slide with icons representing each of the UN Sustainable Development Goals, accompanied by descriptive texts highlighting their importance and goals.
Market Analysis and Trends
Government & Public Sector
Provides an overview of the UN Sustainable Development Goals, highlighting their scope and the global consensus on values aimed at achieving a sustainable future for all.
UN, SDGs, global, development, goals, sustainability, future, consensus, values, society
false
Market Analysis and Trends
Government & Public Sector
Table
Roland Berger
Add to my slides
Remove from favorites
The slide features logos of example companies next to their respective technology impact descriptions. A clean and professional design, with balanced text and imagery.
Client Case Studies
Transportation & Logistics
Provides examples of companies in various industries that have created significant impact through the adoption and implementation of mobility technologies.
UPS, BMW, Deutsche Telekom, E.ON, innovation, case studies, fuel savings, safety improvements
false
Client Case Studies
Transportation & Logistics
Header Vertical
McKinsey
Add to my slides
Remove from favorites
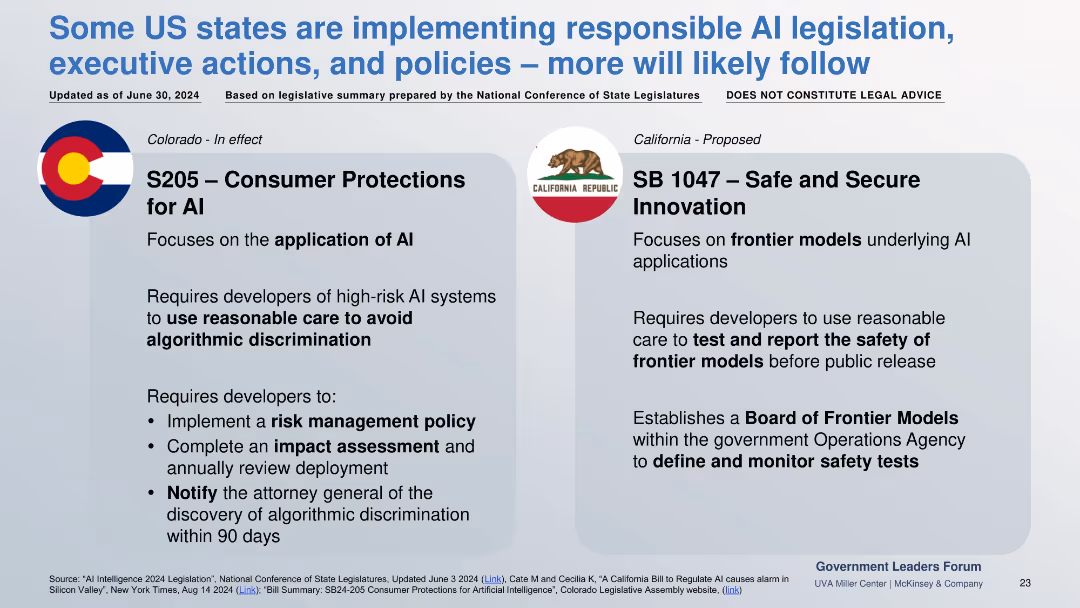
Two-column comparison of enacted (Colorado) and proposed (California) AI laws, each with regulatory focus and developer requirements.
Regulatory and Compliance
Government & Public Sector
Focuses on U.S. state-level AI laws. Colorado mandates discrimination risk controls in AI applications; California proposes safety testing and oversight for frontier models.
US AI law, frontier models, algorithmic bias, risk policy, S205, SB1047
false
Regulatory and Compliance
Government & Public Sector
Pillar
McKinsey
Add to my slides
Remove from favorites
Multi-section layout with pie charts, bar chart, and supporting bullet points; visually divides analysis by loan type, office risk, and CLP trends.
Risk Assessment and Management
Financial Services
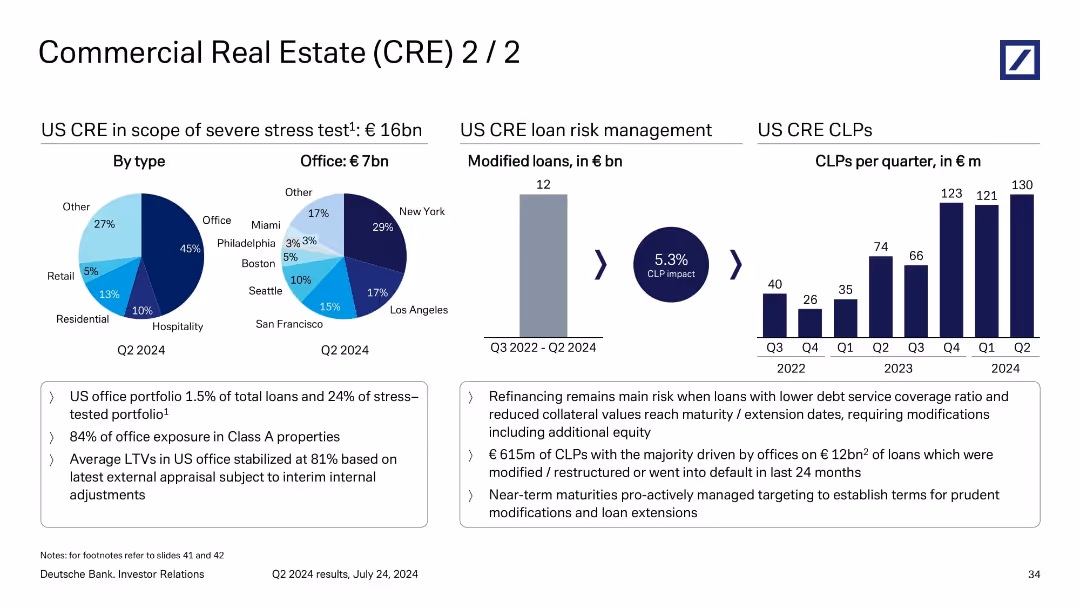
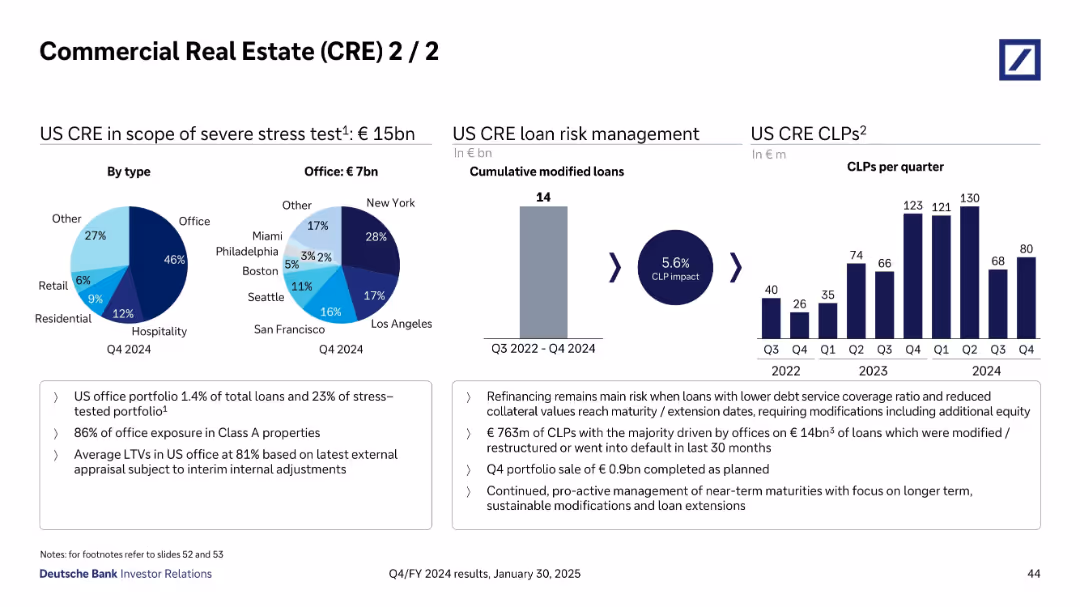
This slide delves deeper into US CRE loan risks, particularly the €16bn under stress testing, of which €7bn are office-related. It tracks €615m of CLPs linked to €12bn of restructured or defaulted office loans. A chart shows rising CLPs per quarter, emphasizing risk from refinancing and lower collateral values.
US CRE, CLP impact, refinancing risk, loan modification, office exposure
false
Risk Assessment and Management
Financial Services
Multiple Chart
Deutsche Bank
Add to my slides
Remove from favorites
Left section includes two pie charts, middle has a vertical bar chart, right features bar chart of CLPs per quarter and bullet point notes at bottom.
Risk Assessment and Management
Financial Services
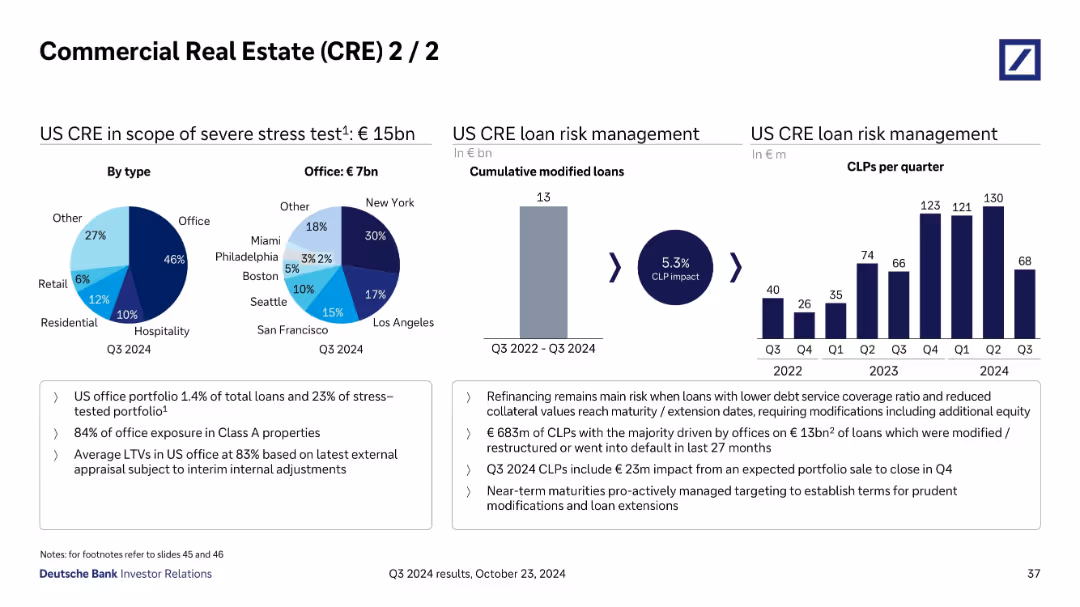
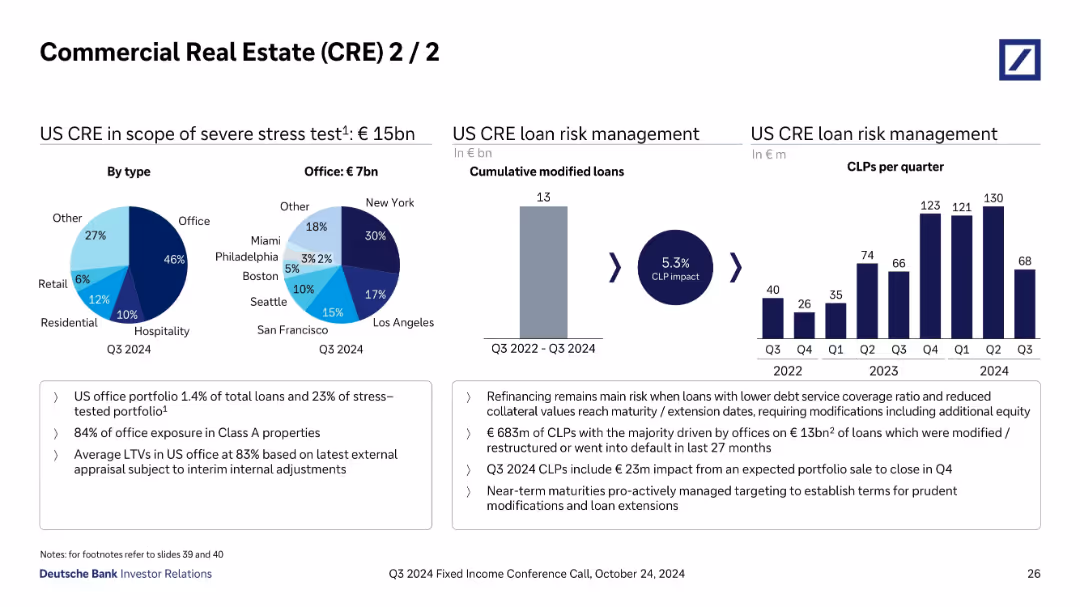
Focuses on €15bn in US CRE stress-tested loans with detailed breakdown by type and geography. Discusses risk management, CLPs of €683m from modified/restructured loans, and emphasizes risks from low debt service coverage and portfolio maturities.
US CRE, CLPs, Risk Management, Office Loans, Stress Testing, Loan Types
false
Risk Assessment and Management
Financial Services
Multiple Chart
Deutsche Bank
Add to my slides
Remove from favorites
Series of pie and bar charts visualizing US CRE stress test exposure, modified loans, and CLPs over time; supported by key risk notes.
Risk Assessment and Management
Financial Services
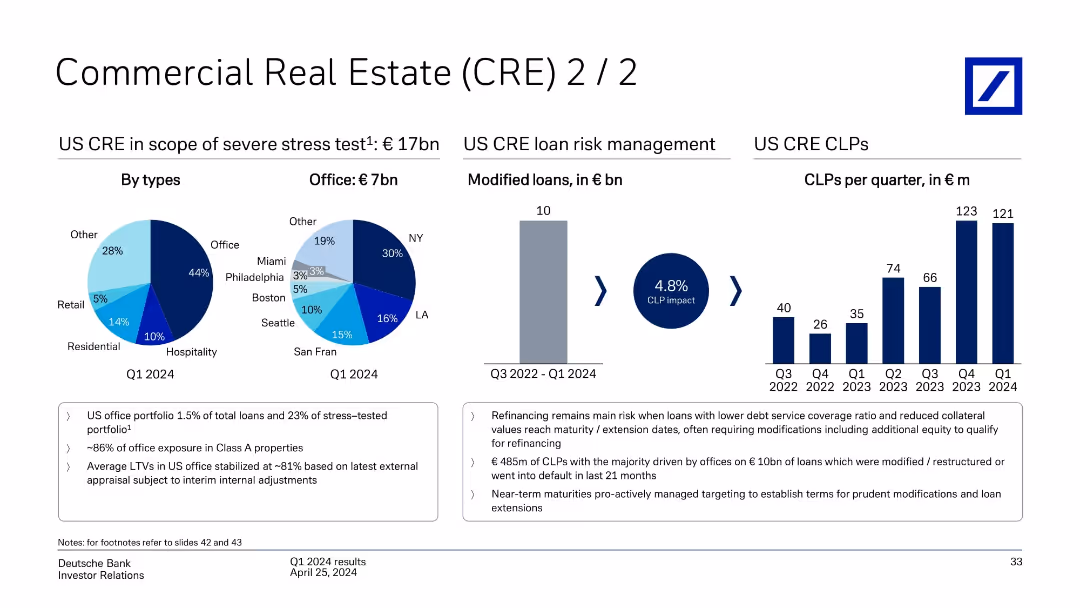
Focuses on €17bn US CRE exposure under stress testing, dominated by office loans (44%). Regional breakdown of office loans and trend of cumulative loan loss provisions (CLPs) from Q3 2022–Q1 2024 are shown. Emphasis is placed on refinancing risk, Class A property exposure, and modification efforts.
US CRE, loan loss provisions, refinancing, CLP impact, Class A office, Deutsche Bank
false
Risk Assessment and Management
Financial Services
Multiple Chart
Deutsche Bank
Add to my slides
Remove from favorites
Left section shows pie charts for US CRE by type and office distribution; middle shows bar chart of cumulative modified loans; right shows quarterly CLPs bar chart.
Risk Assessment and Management
Financial Services
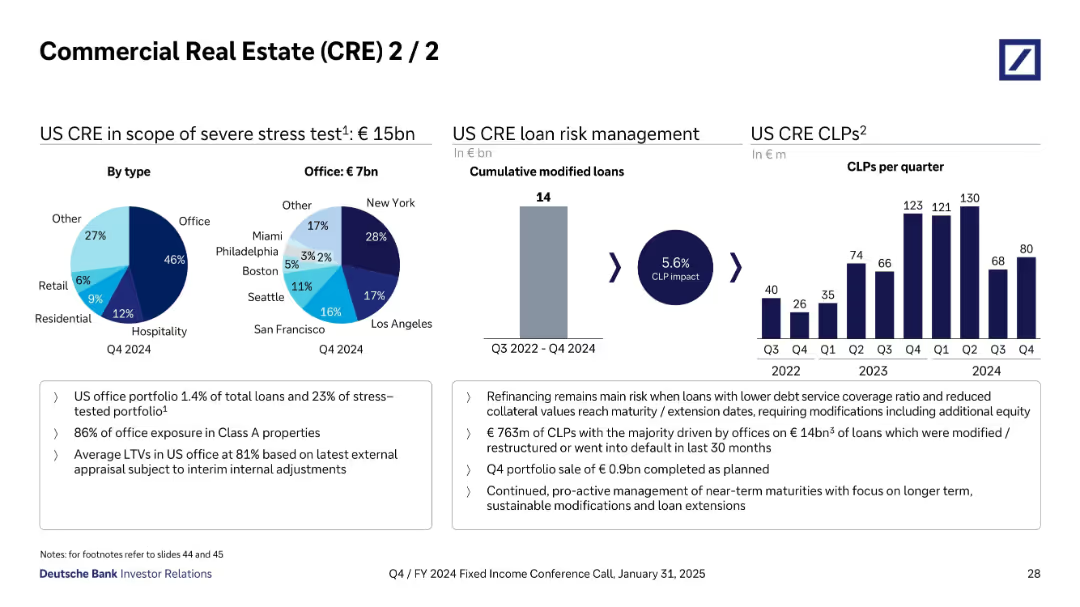
Focuses on US CRE stress exposure (€15bn), especially US office loans (€7bn) with significant risk in cities like NYC and LA. Emphasizes loan modifications and €763m CLPs driven by refinancing risk and office default trends.
US CRE, loan modifications, CLP, stress test, office, refinancing, defaults
false
Risk Assessment and Management
Financial Services
Multiple Chart
Deutsche Bank
Add to my slides
Remove from favorites
Pie charts and bar charts showing breakdown of US CRE by property type and location; risk metrics on the right
Investment Analysis
Financial Services
Deep dive into €15bn US CRE stress-tested loans, focusing on offices, especially in major US cities. Highlights a 5.6% CLP impact over time and shows historical quarterly CLPs. Risk is mainly from refinancing and low coverage ratios; risk mitigation strategies are actively pursued.
US CRE, office loans, CLPs, refinancing risk, stress test, risk exposure
false
Investment Analysis
Financial Services
Multiple Chart
Deutsche Bank
Add to my slides
Remove from favorites
Multiple pie charts and bar graphs showing US CRE exposure and CLPs per quarter; callouts highlight risk management strategies.
Risk Assessment and Management
Financial Services
Continuation of CRE risk analysis, focusing on €15bn US portfolio. Emphasizes refinancing risk and mitigation through portfolio sales and modifications. Shows CLP evolution over time, peaking in Q1/Q2 2024. Notably, New York leads in exposure with high concentration in office properties.
US CRE, refinancing, CLPs, stress test, office risk, Deutsche Bank, Q3 2024
false
Risk Assessment and Management
Financial Services
Multiple Chart
Deutsche Bank
Add to my slides
Remove from favorites
Includes column charts showing quarterly data on loan loss rates and reserve builds alongside delinquency rates, underpinned by a detailed analysis of the credit card sector.
Risk Assessment and Management
Financial Services
Analyzes trends in credit card delinquencies and reserve strategies in the US, offering insights into risk management and market conditions.
US Cards, delinquencies, loan loss, market trends, reserve build, credit management, financial risk, Barclays
false
Risk Assessment and Management
Financial Services
Multiple Chart
Barclays
Add to my slides
Remove from favorites
Multi-panel slide with bar charts for RoTE, income type, costs, receivables, and funding. Uses blue shades for categories, with gray annotations and YoY metrics. Compact, data-dense format.
Financial Performance
Financial Services
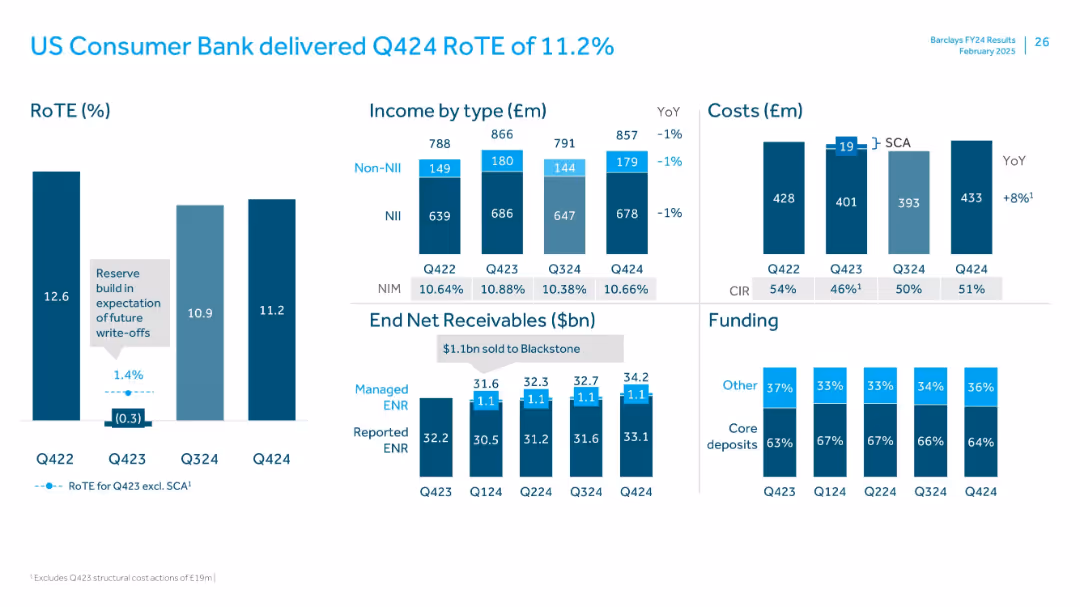
The slide shows consistent US Consumer Bank performance with RoTE at 11.2% for Q4 2024. Income, costs, receivables, and funding sources are compared across quarters. Managed ENR remained steady, and core deposits dominated funding.
US Consumer Bank, RoTE, income, costs, ENR, funding, Q4 2024, deposits
false
Financial Performance
Financial Services
Multiple Chart
Barclays
Add to my slides
Remove from favorites
Key metrics table (2021–2024), color-coded with emphasis on 2024 and 2026 targets; blue and white minimalist layout
Financial Performance
Financial Services
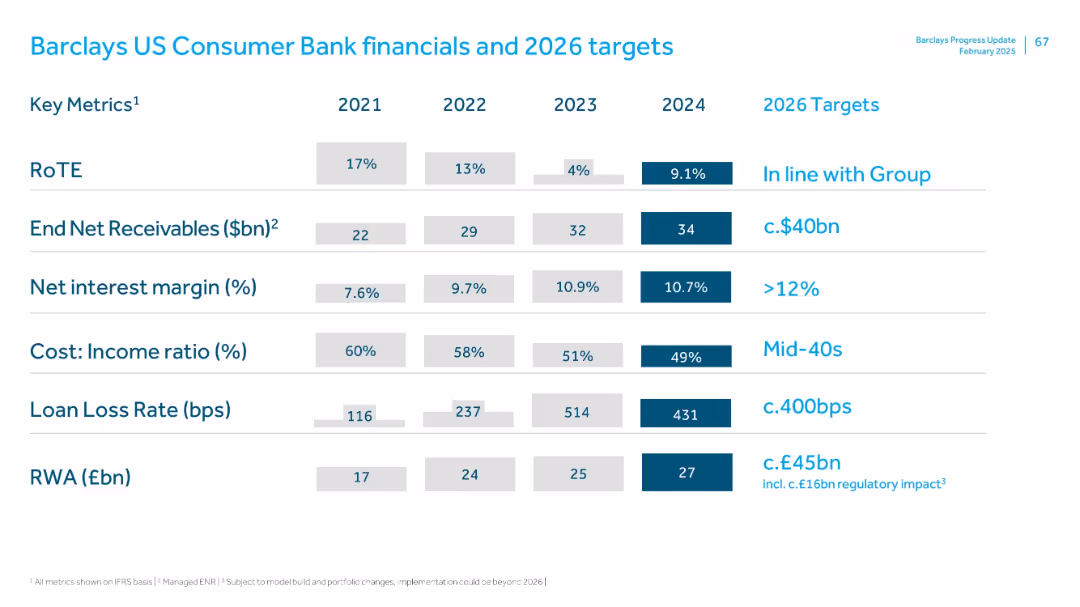
The slide reviews US Consumer Bank metrics like RoTE, net receivables, net interest margin, cost-income ratio, loan loss rate, and RWA. 2026 targets aim for margin >12%, lower cost ratios, and manageable loan loss rates. Consistent growth in net receivables and RWA is shown.
US Consumer Bank, receivables, net interest margin, RoTE, loan loss, RWA
false
Financial Performance
Financial Services
Single Chart
Barclays
Add to my slides
Remove from favorites
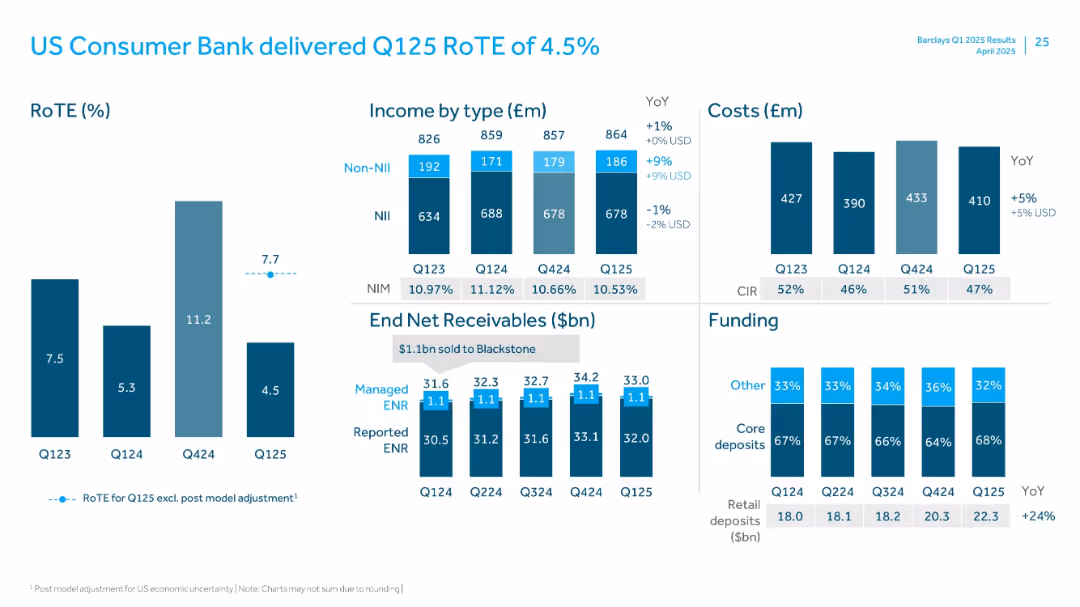
Visuals include RoTE bars, income breakdown, cost bars, ENR trend, and deposit funding mix.
Financial Performance
Financial Services
Analyzes performance of US Consumer Bank with a low RoTE of 4.5%. Contains income and cost breakdowns, net receivables trend, and funding mix. Retail deposits up 24% YoY. Includes post-model adjustment commentary.
US Consumer, RoTE, ENR, Retail Deposits, Income, NIM, Non-NII, Q125
false
Financial Performance
Financial Services
Multiple Chart
Barclays
Add to my slides
Remove from favorites
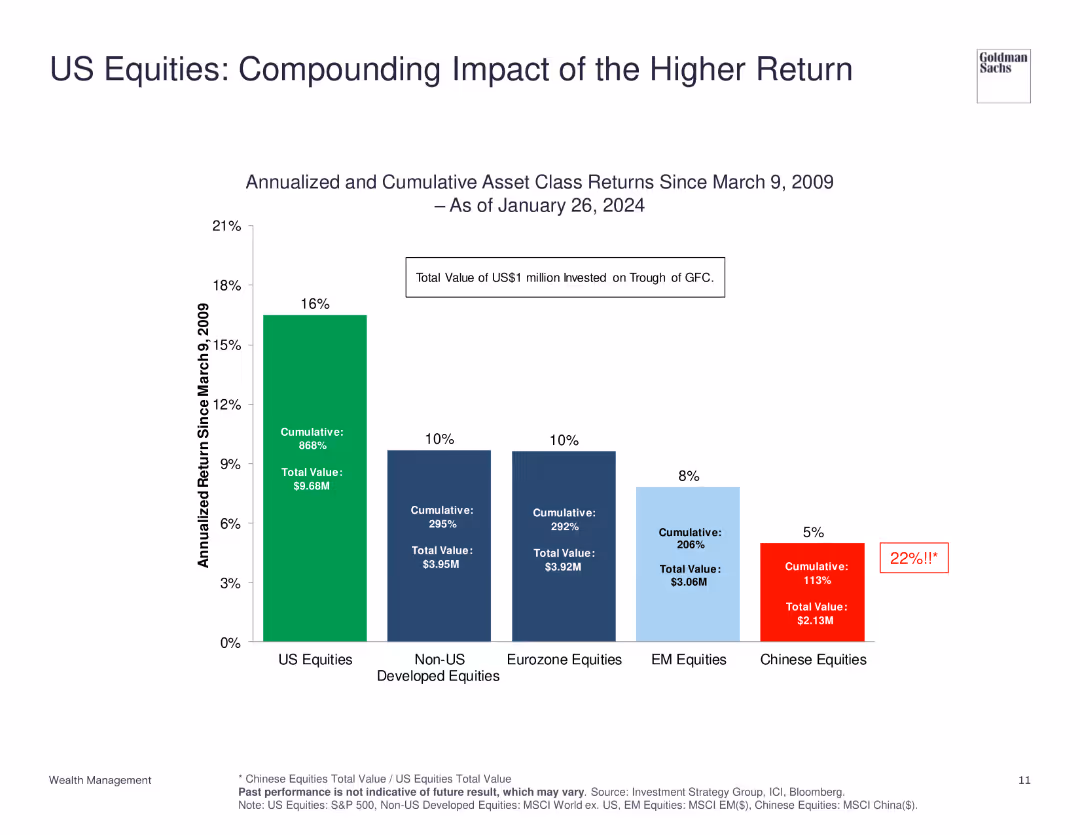
The slide shows a column chart comparing the annualized and cumulative returns of various equity markets since 2009, with US equities highlighted.
Financial Performance
Financial Services
The slide illustrates the superior performance of US equities compared to other markets, showing both annualized and cumulative returns to emphasize the compounding impact of higher returns.
US Equities, Returns, Performance, Market, Comparison
false
Financial Performance
Financial Services
Single Chart
Goldman Sachs
Add to my slides
Remove from favorites
The slide features a column chart showing contributions to US real GDP growth by various components and a line chart of US Purchasing Managers’ Indices (PMI) for manufacturing and services sectors.
Market Analysis and Trends
Financial Services
This slide analyzes US GDP growth contributions and PMI trends, providing a comprehensive view of the country's economic performance and business activity.
US GDP, business surveys, economic performance, PMI, growth components
false
Market Analysis and Trends
Financial Services
Multiple Chart
JP Morgan
Add to my slides
Remove from favorites
The slide includes a column chart tracking the number of IPOs and proceeds from 2019 to 2023 and a table summarizing cross-border IPO listings on US exchanges.
Market Analysis and Trends
Financial Services
This slide discusses the growth in the US IPO market, highlighting increased listings, proceeds, and improved after-market performance. It also covers cross-border deals and their contribution to the market.
US IPO market, cross-border deals, market growth, financial performance, IPO trends
false
Market Analysis and Trends
Financial Services
Multiple Chart
EY
Add to my slides
Remove from favorites
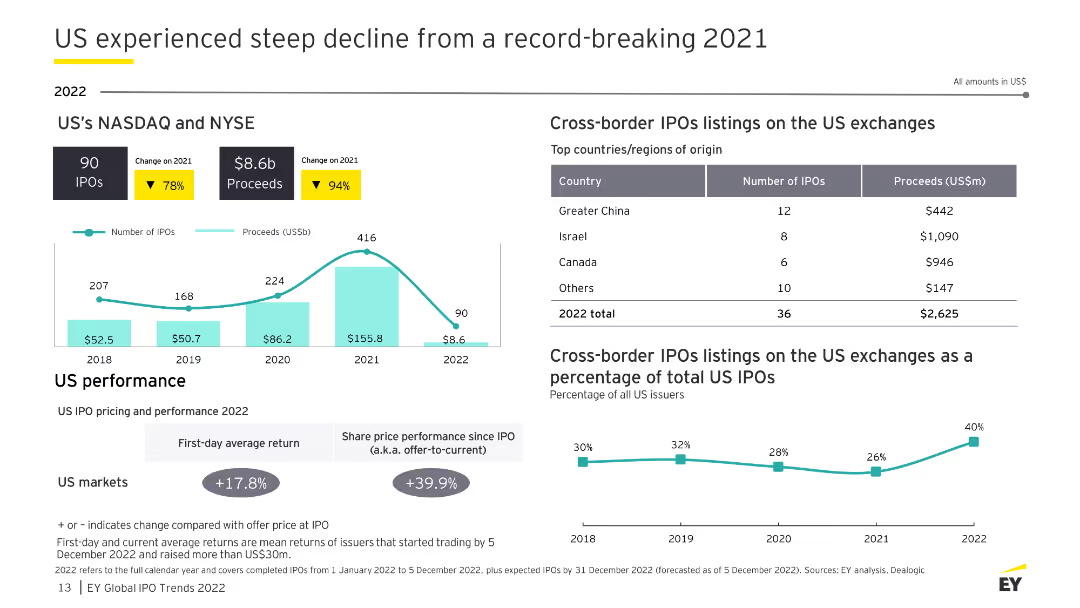
This slide presents data on the US IPO market's steep decline in 2022 with column charts and percentage changes. It includes cross-border IPO data and performance metrics.
Market Analysis and Trends
Financial Services
The slide highlights a significant decline in US IPOs from a record-breaking 2021, with detailed data on IPO performance, cross-border listings, and share price performance since IPO.
US IPO, decline, cross-border, performance, 2022
false
Market Analysis and Trends
Financial Services
Multiple Chart
EY
Add to my slides
Remove from favorites
Previous
Next
You don't have any favorites yet.
Please wait loading your favorites slides...
Create a FREE account to continue browsing
Receive Instant Access to 1,000+ slides from companies like McKinsey, Google, and Goldman Sachs
First Name
Last Name
Email
Password
I agree to all
Terms & Privacy Policy
Thank you! Your submission has been received!
Oops! Something went wrong while submitting the form.
Have an account?
Sign in
Upgrade to PRO to Save slides
Advanced Search and Filters
Access to 15,000+ slides
Access to Category Pages
Save/Bookmark Slides
PowerPoint Template Library
Pick a Plan
MONTHLY
$12/month
Billed every month, Cancel anytime.
YEARLY
$9/year
Billed $108 annually, Cancel anytime.
Checkout for $12/month
Checkout for $108/yr
Secured by Stripe | AES-256 bit encryption