My Account
My Slides
Search by Category
Pricing
Templates
View All Templates
Download Template Slides
✦ AI Search
Feedback
Login
Logout
Get Started
Browse all Slides
Browse all Slides
Create a FREE Account
Instant access to 1,000+ real slides from top companies like McKinsey, BCG, Goldman Sachs, Google and many more!
First Name
Last Name
Email
Password
I agree to all
Terms & Privacy Policy
Thank you! Your submission has been received!
Oops! Something went wrong while submitting the form.
Have an account?
Sign in
Saved Slides
Total No. of slides saved
0
↻ Refresh
✖ Clear all
This slide features multiple bar graphs comparing digital platforms, financial services, and tools. A side note provides statistics on digital platform reliance, with a vibrant color scheme and clear text.
Market Analysis and Trends
Technology & Software
The slide analyzes the increasing tech-savviness of digital merchants in Vietnam and their expected future reliance on digital platforms and tools. It highlights the critical role of digital platforms during the pandemic.
Vietnam, Digital Merchants, Tech-Savvy, Future, Digital Platforms, Financial Services, Tools, Pandemic, Survival, Growth
false
Market Analysis and Trends
Technology & Software
Multiple Chart
Bain
Add to my slides
Remove from favorites
Two maps of Vietnam, one highlighting e-commerce demand and the other supply density, with green and blue shading. Each map points to Hanoi, Danang, and HCM City. Source information includes Google and Bain Analysis.
Market Analysis and Trends
Technology & Software
Analyzes digital participation across Vietnam's top metro cities, showing demand and supply dynamics in e-commerce, beneficial for regional market strategies and investment considerations.
Vietnam, Digital Participation, E-Commerce Demand, Supply Density, Metro Cities, Market Analysis, Geographic Trends, Consumer Behavior, Investment Insights
false
Market Analysis and Trends
Technology & Software
Multiple Chart
Bain
Add to my slides
Remove from favorites
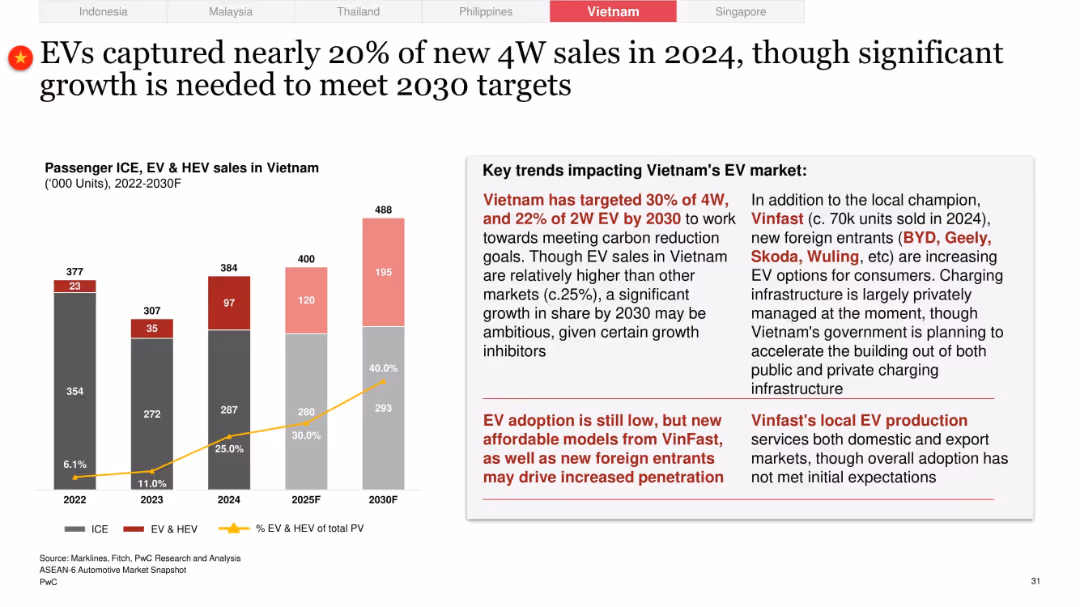
EV/ICE bar and line graph dominates left; right section has red-highlighted EV market commentary and stats
Technology and Digital Transformation
Industrial & Manufacturing
Vietnam's EV share hit ~20% in 2024 with a goal of 30% by 2030. The slide credits VinFast and foreign OEMs like BYD and Geely, but notes infrastructure and cost challenges. Adoption remains below expectations despite policy and private sector support.
Vietnam, EV market, VinFast, BYD, Skoda, infrastructure, foreign entrants, 30% target, 4W vs 2W EVs
false
Technology and Digital Transformation
Industrial & Manufacturing
Mixed Chart
PwC/Strategy&
Add to my slides
Remove from favorites
This slide includes comparative data in blue bar charts and two columns with demographics and geographical segmentation. It provides a contrast in online spending between HVUs and non-HVUs in Vietnam. Source includes Bain analysis.
Market Analysis and Trends
Technology & Software
The slide compares online spending habits of high-value users (HVUs) to non-HVUs in Vietnam, useful for understanding consumer segmentation and targeting strategies in the digital economy.
Vietnam, High-Value Users, Consumer Spending, Digital Economy, Online Spend, Demographic Analysis, Geographic Segmentation, Market Research, Spending Habits
false
Market Analysis and Trends
Technology & Software
Multiple Chart
Bain
Add to my slides
Remove from favorites
This slide displays a stacked column chart with annotations for half-yearly data points from 2019 to H1 2023. It uses grayscale for different sectors with a clear legend. Deal count numbers are presented at the bottom.
Investment Analysis
Financial Services
Shows private funding trends in Vietnam for different sectors, indicating a small increase in H1 2023. It suggests a focus on nascent sectors, hinting at emerging investment areas.
Vietnam, Private Funding, H1 2023, Investment Trends, Nascent Sectors, Deal Count, Travel, Digital Media, E-commerce
false
Investment Analysis
Financial Services
Single Chart
Bain
Add to my slides
Remove from favorites
The slide includes bar graphs and bullet points, contrasting SEA average with Vietnam in media usage and intent to use services like e-commerce and transport. The color scheme is blue and grey, with clear demarcation between different categories. Each bar graph is accompanied by percentage values and annotations for clarity.
Market Analysis and Trends
Technology & Software
This slide provides an in-depth look at digital consumer behavior in Vietnam, including media usage frequency and service adoption rates. It’s valuable for understanding consumer trends in the digital space, and could be used to inform strategic decisions for businesses targeting Vietnamese digital users.
Vietnam, digital consumers, media usage, e-commerce, transport, service adoption, SEA, consumer trends
false
Market Analysis and Trends
Technology & Software
Multiple Chart
Bain
Add to my slides
Remove from favorites
This slide presents column charts comparing growth in e-Commerce, Transport & Food, and Online Media sectors, with annotations indicating percentage changes and future projections. Layout is balanced with clear headers.
Market Analysis and Trends
Technology & Software
The slide provides a comparative analysis of sector growth in Vietnam, with e-Commerce, Transport & Food, and Online Media seeing growth, while Online Travel decreases. Projected growth rates up to 2025 are also displayed.
Vietnam, e-Commerce, Growth, Projections, Sector Analysis
false
Market Analysis and Trends
Technology & Software
Multiple Chart
Bain
Add to my slides
Remove from favorites
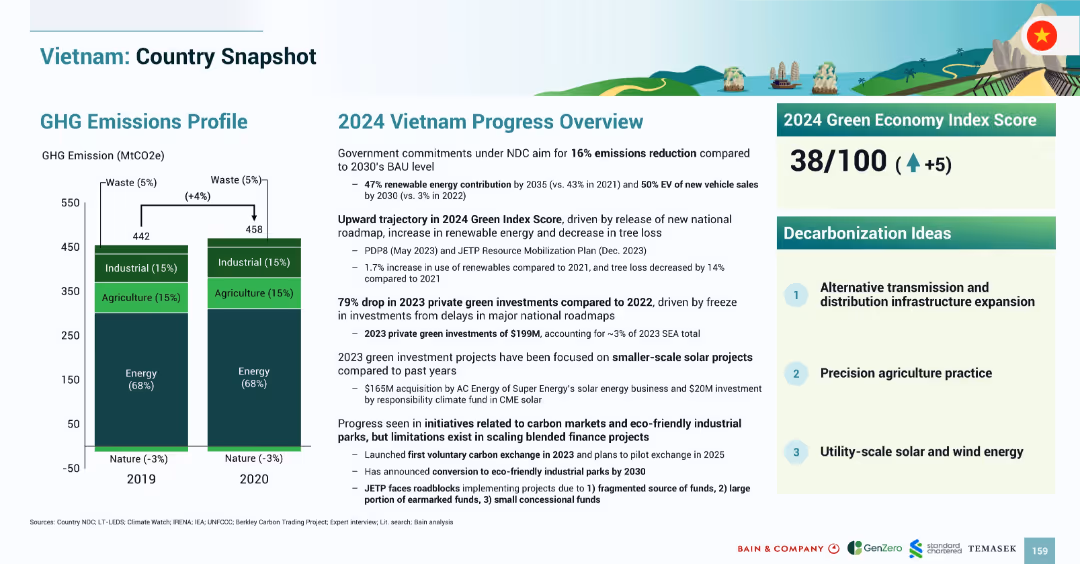
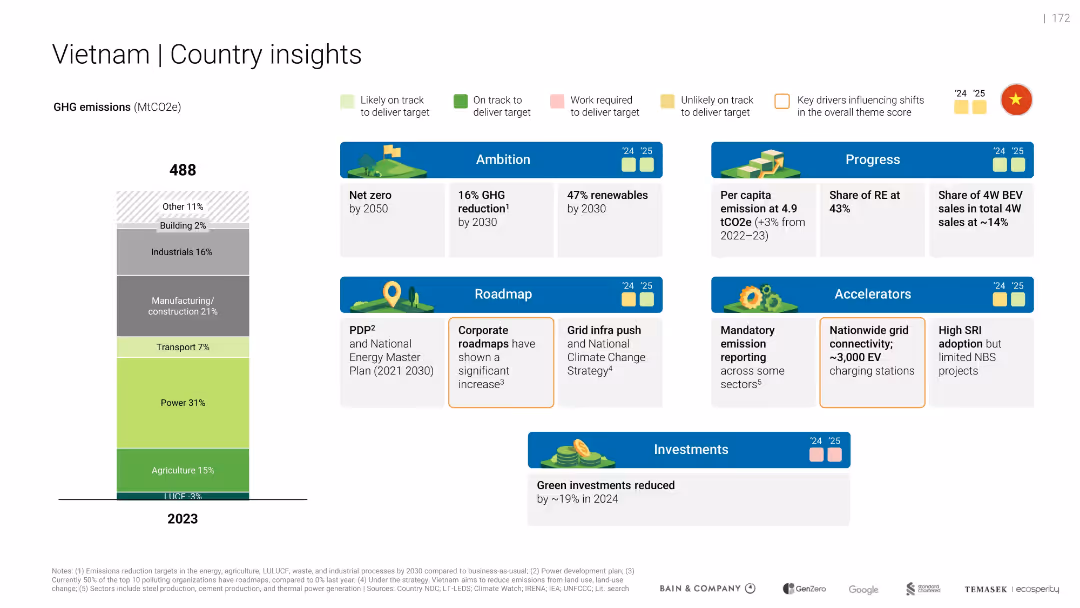
Multi-column layout: emissions chart (left), progress overview (center), green economy index and investment ideas (right); colorful and visual-heavy.
Industry Overview
Government & Public Sector
Presents a snapshot of Vietnam’s GHG emissions by sector, government progress on climate goals, and a moderate improvement in the Green Economy Index. Highlights investment projects and challenges in private funding and renewable project execution.
Vietnam, emissions, energy, investment, green index, decarbonization, agriculture, solar, carbon market
false
Industry Overview
Government & Public Sector
Mixed Chart
Bain
Add to my slides
Remove from favorites
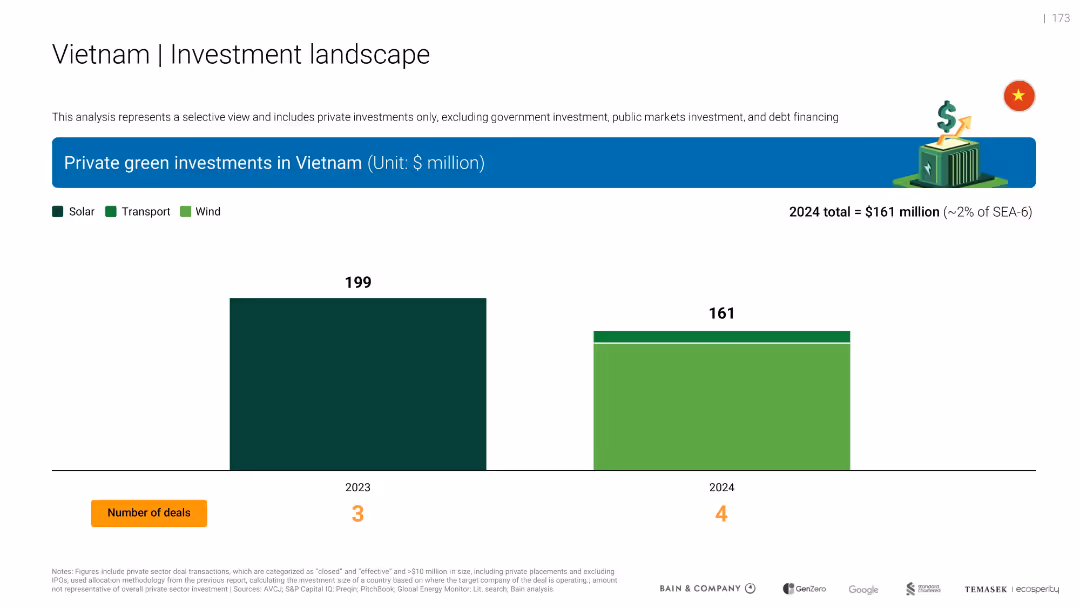
Bar chart comparing private green investments in Vietnam for 2023 and 2024, categorized by Solar, Transport, and Wind. Includes number of deals and icons.
Investment Analysis
Environmental Services & Sustainability
This slide visualizes private green investments in Vietnam, showing a decrease from $199M in 2023 to $161M in 2024. It segments investments into solar, transport, and wind, and notes 4 deals in 2024 versus 3 in 2023.
Vietnam, green investments, solar, transport, wind, 2024, deals, chart
false
Investment Analysis
Environmental Services & Sustainability
Single Chart
Bain
Add to my slides
Remove from favorites
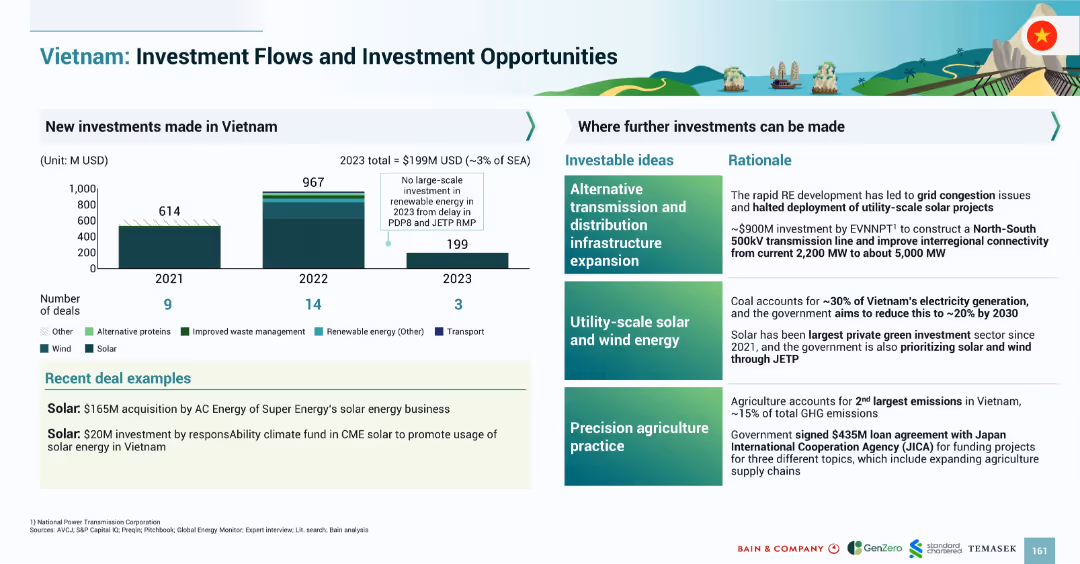
Split layout: investment bar chart (left) for 2021–2023; right side shows investment ideas and rationale; structured infographic style.
Investment Analysis
Environmental Services & Sustainability
Outlines private investments in Vietnam’s energy and sustainability sectors (2021–2023), with sharp drop in 2023. Provides rationale for future investment in grid upgrades, renewables, and agriculture. Highlights two recent solar-focused deals.
Vietnam, investment, energy, solar, wind, infrastructure, agriculture, renewable projects
false
Investment Analysis
Environmental Services & Sustainability
Mixed Chart
Bain
Add to my slides
Remove from favorites
Emissions bar by sector for 2023, and segmented boxes for ambition, roadmap, progress, accelerators, and investments with icons and color-coded indicators.
Strategic Planning
Government & Public Sector
Details Vietnam’s emissions sources and outlines 2030 and 2050 green goals. Emphasizes RE targets, national strategies, and infrastructure plans. Indicates a ~19% decline in green investment for 2024.
Vietnam, net zero, RE, roadmap, grid infra, investment drop
false
Strategic Planning
Government & Public Sector
Mixed Chart
Bain
Add to my slides
Remove from favorites
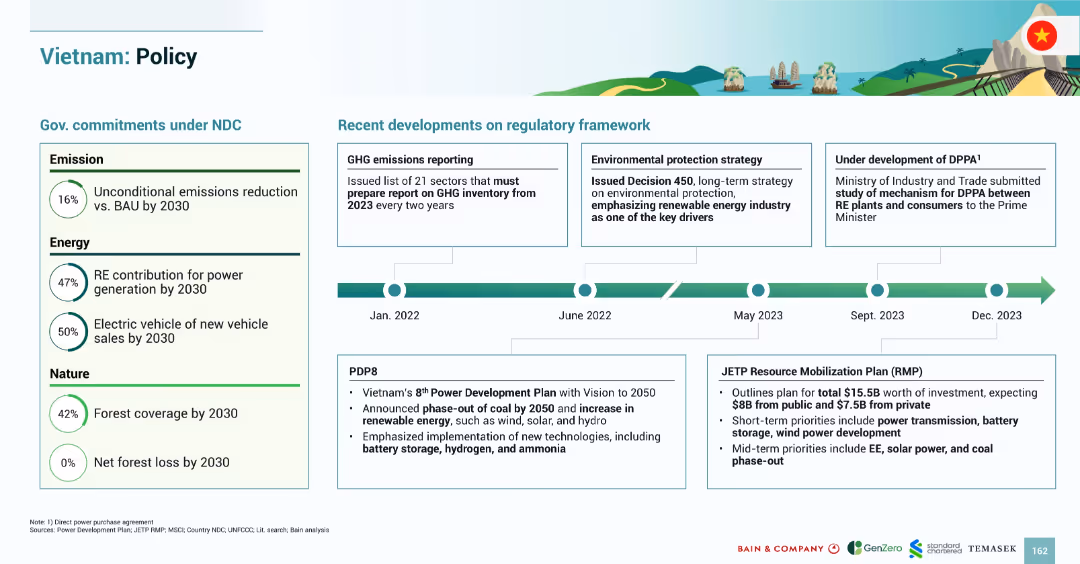
Two-part layout: government NDC commitments on the left, regulatory framework timeline (2022–2023) on the right; clean and structured.
Regulatory and Compliance
Government & Public Sector
Covers Vietnam’s emission, energy, and nature-related climate goals under NDCs, and outlines the policy progress including GHG reporting, power development plans (PDP8), and the $15.5B Just Energy Transition Partnership (JETP) Resource Mobilization Plan.
Vietnam, policy, PDP8, JETP, emissions, forest, EV, renewables, GHG inventory
false
Regulatory and Compliance
Government & Public Sector
Mixed Chart
Bain
Add to my slides
Remove from favorites
Includes a complex layout with a column chart, text annotations, icons indicating outlook, and a detailed breakdown of governmental commitments and recommended actions.
Regulatory and Compliance
Energy & Utilities
Examines Vietnam's climate goals and strategies, discussing emissions profiles, government commitments, and suggested actions for clearer energy policies.
Vietnam, renewable energy, government, emissions, climate policy
false
Regulatory and Compliance
Energy & Utilities
Mixed Chart
Bain
Add to my slides
Remove from favorites
Features a mekko chart analyzing investment flows by theme in Vietnam, alongside icons and smaller charts detailing types of investments and key investors.
Investment Analysis
Energy & Utilities
Discusses Vietnam's investment trends in solar and wind energy, with a focus on government support and mobility projects.
Vietnam, solar, wind, government support, investments
false
Investment Analysis
Energy & Utilities
Single Chart
Bain
Add to my slides
Remove from favorites
The slide displays a stylized image of a sailing boat on blue waters with mountains in the background, under a bright yellow sun. The Vietnamese flag is visible on the boat, and a lighthouse stands on a green landmass. The graphical elements are simplistic, making it visually clear and uncluttered. The country name "Vietnam" is boldly placed.
Industry Overview
Hospitality & Tourism
The slide is a visual representation meant to showcase Vietnam, likely to be used in a context of discussing tourism, hospitality, or geographical overviews. The image conveys a sense of place and is likely to engage an audience with an interest in the region or in travel-related topics.
Vietnam, tourism, sailing, lighthouse, hospitality, travel, geography, image representation
false
Industry Overview
Hospitality & Tourism
Title
Bain
Add to my slides
Remove from favorites
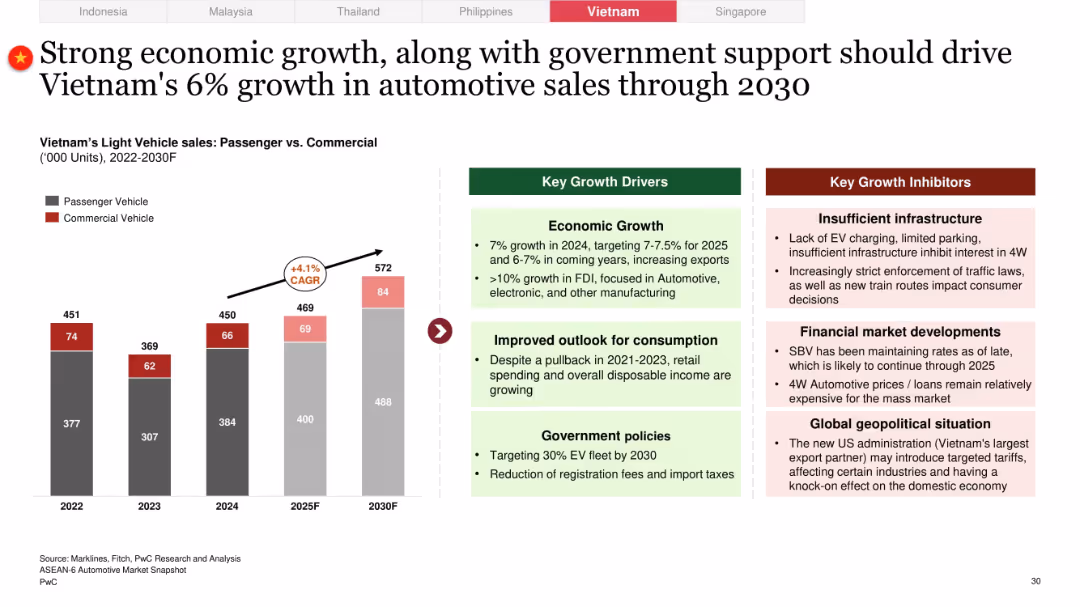
Typical two-part layout with bar graph showing PV/CV sales from 2022 to 2030 and growth/inhibitor boxes on the right
Market Analysis and Trends
Industrial & Manufacturing
Vietnam anticipates steady 6% CAGR in automotive sales, driven by FDI, growing consumption, and policy support. Key inhibitors include weak infrastructure, financing constraints, and global geopolitical risks.
Vietnam, vehicle sales, FDI, consumption outlook, infrastructure gaps, auto lending, CAGR forecast
false
Market Analysis and Trends
Industrial & Manufacturing
Mixed Chart
PwC/Strategy&
Add to my slides
Remove from favorites
Complex slide with multiple images of wind turbines, solar panels, and EVs, combined with detailed text blocks and icons highlighting investment potentials.
Market Analysis and Trends
Energy & Utilities
Analyzes the investment potential in Vietnam for wind power and electric mobility, citing structural and environmental benefits.
Vietnam, wind power, electric mobility, investment potential
false
Market Analysis and Trends
Energy & Utilities
Header Horizontal
Bain
Add to my slides
Remove from favorites
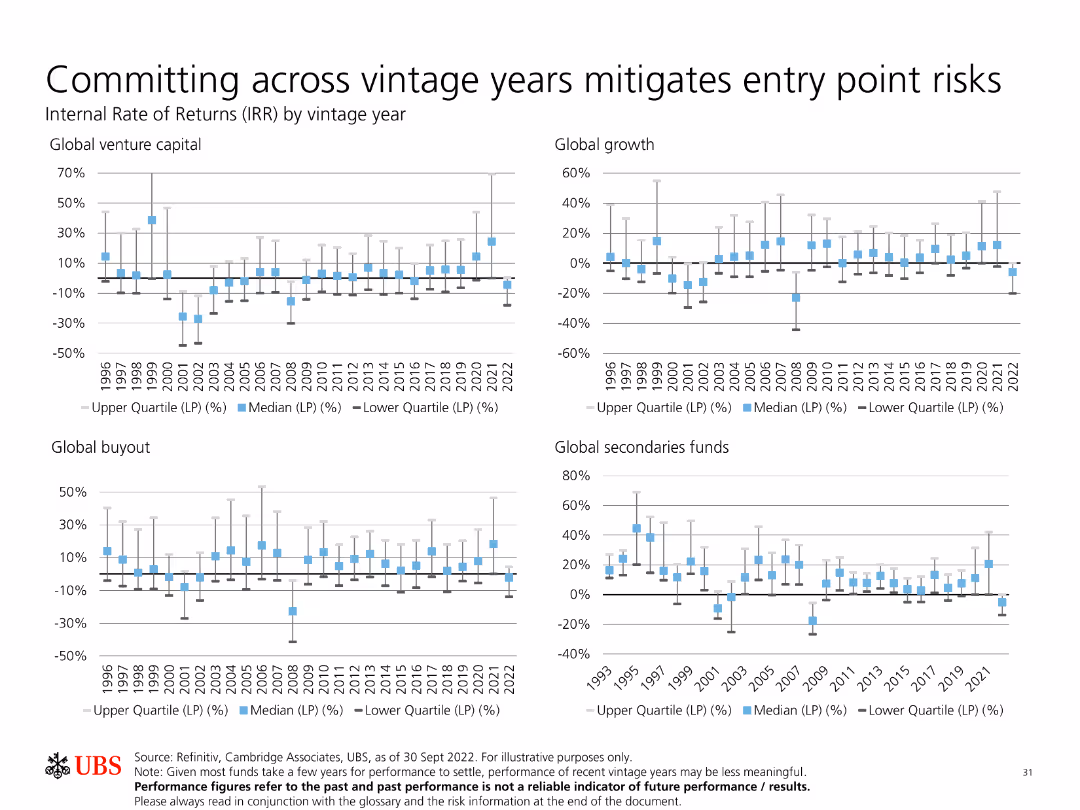
Features multiple column charts showing internal rate of returns (IRR) by vintage year for different types of funds like global venture capital and global buyout.
Risk Assessment and Management
Financial Services
Analyzes how committing investments across different vintage years can mitigate entry point risks, using historical IRR data for various fund types.
Vintage Years, IRR, Investment, Risk Mitigation, Global Funds, Venture Capital, Buyout, Analysis, Historical Data
false
Risk Assessment and Management
Financial Services
Multiple Chart
UBS
Add to my slides
Remove from favorites
The slide features a dark background with a prominent yellow text box containing a quote. Below, there is a question and four circular charts with percentages.
Customer and Market Segmentation
Healthcare & Pharmaceuticals
The slide presents data on Australian consumers' willingness to switch to virtual consultations for various reasons such as prescription renewal, discussing test results, etc.
Virtual consultations, healthcare, convenience, consumer behavior, Australia
false
Customer and Market Segmentation
Healthcare & Pharmaceuticals
Mixed Chart
EY
Add to my slides
Remove from favorites
The slide uses a dark background with a yellow-highlighted quote. It includes a question and four circular charts with percentages showing consumer responses.
Customer and Market Segmentation
Healthcare & Pharmaceuticals
The slide presents data on Canadian consumers' willingness to switch to virtual consultations for reasons like prescription renewal and discussing test results.
Virtual consultations, healthcare, convenience, consumer behavior, Canada
false
Customer and Market Segmentation
Healthcare & Pharmaceuticals
Mixed Chart
EY
Add to my slides
Remove from favorites
The slide has a dark background, a yellow text box for the quote, and a question followed by a bar chart illustrating percentages of consumers' openness to virtual care.
Customer and Market Segmentation
Healthcare & Pharmaceuticals
The slide discusses Canadian consumers' willingness to consider switching to virtual primary care consultations instead of in-person visits.
Virtual primary care, healthcare, consumer behavior, openness, Canada
false
Customer and Market Segmentation
Healthcare & Pharmaceuticals
Mixed Chart
EY
Add to my slides
Remove from favorites
A set of bar charts representing the preferences for virtual socialization by age groups, using shades of purple.
Market Analysis and Trends
Retail & E-commerce
Highlights the trend of virtual socialization across various age groups, reflecting technology's role in maintaining social connections during periods of reduced physical interaction.
Virtual socializing, Age groups, Technology role, Social connections, Interaction trends, Bar charts, Media, Telecommunications
false
Market Analysis and Trends
Retail & E-commerce
Multiple Chart
Accenture
Add to my slides
Remove from favorites
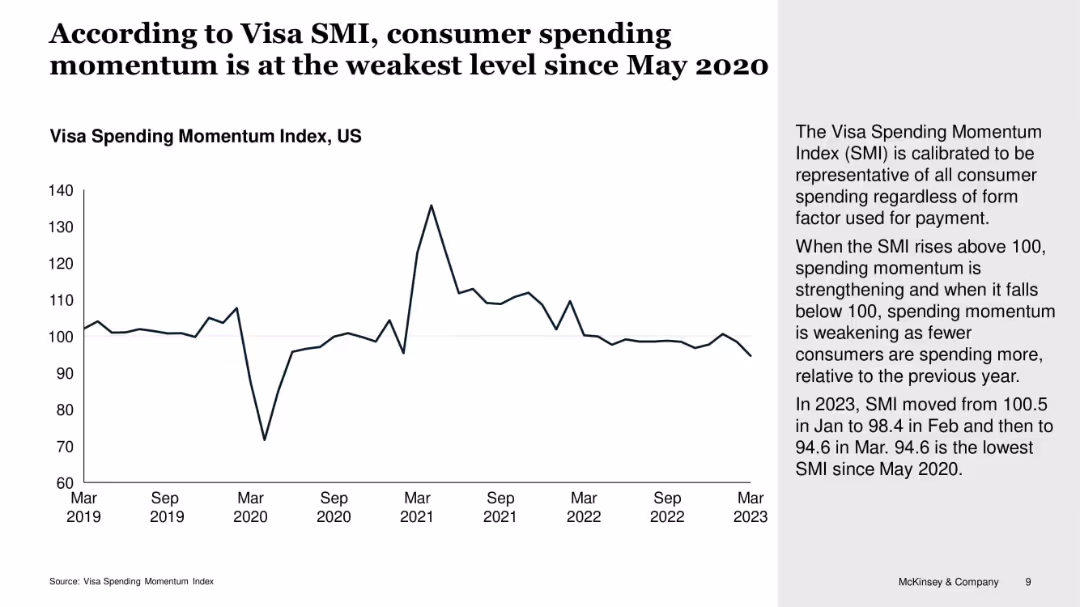
Line chart showing Visa Spending Momentum Index (SMI) from 2019–2023 with side commentary
Market Analysis and Trends
Financial Services
This slide focuses on the Visa Spending Momentum Index (SMI), showing a decline in early 2023 to its lowest level since May 2020. The drop suggests weakening consumer sentiment and reduced spending activity. SMI values below 100 signal deteriorating momentum in consumer expenditures.
Visa SMI, consumer momentum, spending, decline, sentiment, economic indicator, index
false
Market Analysis and Trends
Financial Services
Mixed Chart
McKinsey
Add to my slides
Remove from favorites
The slide includes three distinct sections with icons representing vision, governance, and teamwork. Each section includes bullet points summarizing key activities and strategic approaches in a straightforward layout.
Organizational Structure and Change
Industrial & Manufacturing
Discusses how a transformation team can improve outcomes and enable circular business models by clarifying, aligning, and measuring changes. It highlights the roles of vision, governance, and the transformation team itself.
Vision, Governance, Transformation, Strategy, Teamwork
false
Organizational Structure and Change
Industrial & Manufacturing
Table
Accenture
Add to my slides
Remove from favorites
An interface screenshot of a blockchain visualization tool with key features listed: block explorer, data visualization, and exportable data. The slide describes how the tool enhances visibility across complex networks and supports various assets.
Technology and Digital Transformation
Technology & Software
Introduces a new tool for visualizing blockchain transactions, aimed at improving global visibility and data analysis capabilities for audit and forensics teams.
Visualization tool, blockchain, audit, forensics, global visibility, data visualization, exportable data, complex networks
false
Technology and Digital Transformation
Technology & Software
Mixed Chart
EY
Add to my slides
Remove from favorites
The slide contains column charts showing the progression of Equifax's Vitality Index over several years, emphasizing new product introductions and their impact on the index.
Performance Metrics and KPIs
Financial Services
This slide presents the performance of Equifax in terms of its Vitality Index, highlighting the success of new product introductions and their impact on company performance and strategic direction.
Vitality Index, performance, product introductions, Equifax
false
Performance Metrics and KPIs
Financial Services
Mixed Chart
Barclays
Add to my slides
Remove from favorites
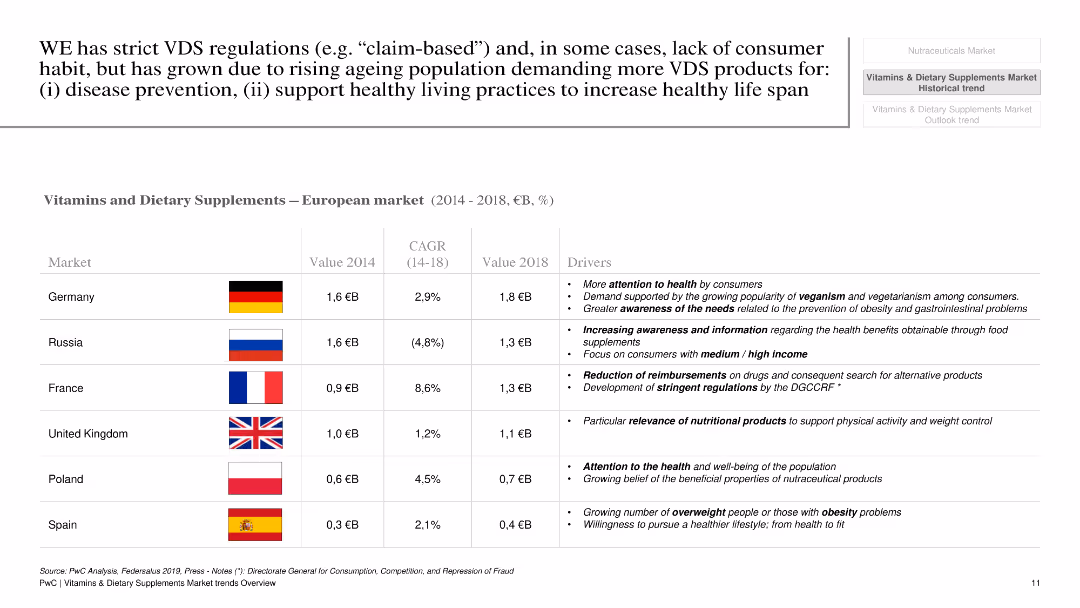
The slide features a white background with a table comparing market values and CAGR of vitamins and dietary supplements in various European countries.
Market Analysis and Trends
Healthcare & Pharmaceuticals
This slide provides an overview of the European market for vitamins and dietary supplements, including market values, growth rates, and key drivers for different countries.
Vitamins, dietary supplements, Europe, market values, growth, CAGR, countries, healthcare, pharmaceuticals
false
Market Analysis and Trends
Healthcare & Pharmaceuticals
Table
PwC/Strategy&
Add to my slides
Remove from favorites
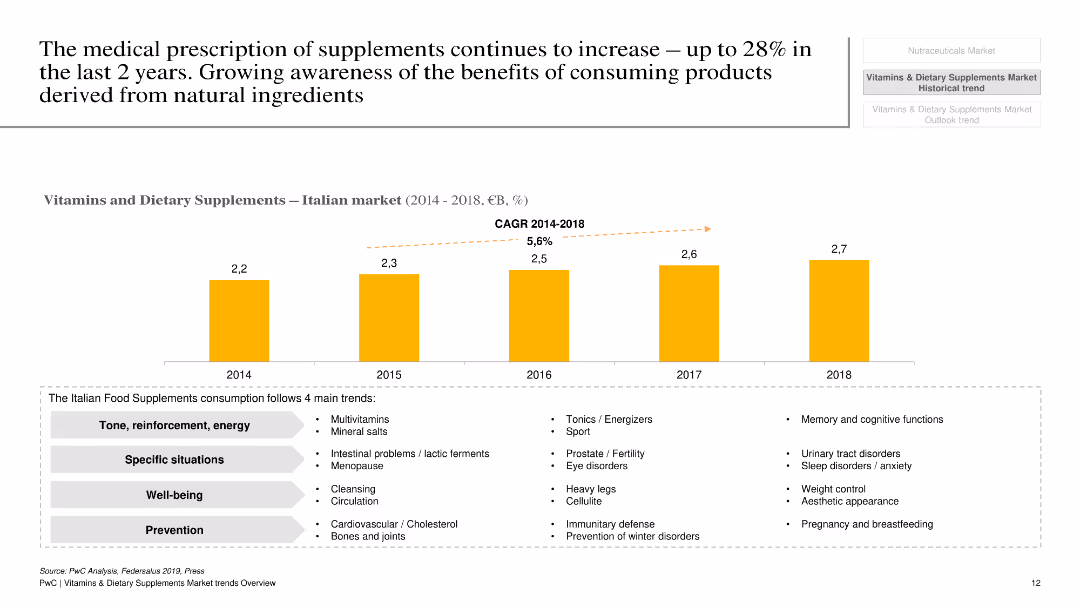
The slide has a white background with a column chart showing market growth of vitamins and dietary supplements in Italy from 2014 to 2018, along with key trends.
Market Analysis and Trends
Healthcare & Pharmaceuticals
This slide presents the growth of the vitamins and dietary supplements market in Italy, highlighting key trends, growth rate, and market drivers.
Vitamins, dietary supplements, Italy, market growth, trends, healthcare, pharmaceuticals, analysis, growth rate
false
Market Analysis and Trends
Healthcare & Pharmaceuticals
Mixed Chart
PwC/Strategy&
Add to my slides
Remove from favorites
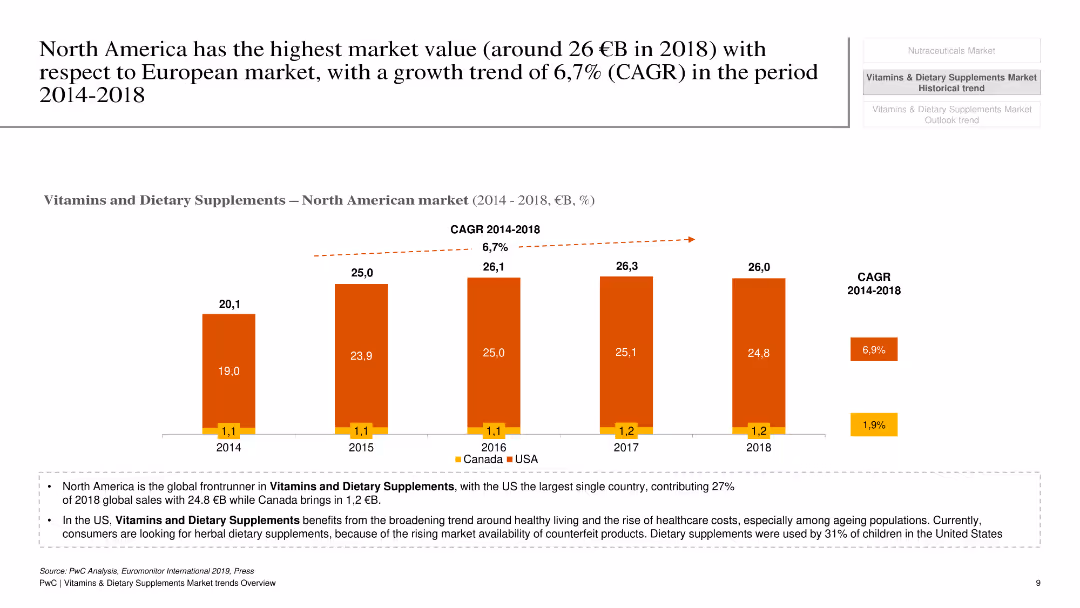
The slide features a white background with a column chart comparing the market value of vitamins and dietary supplements in North America from 2014 to 2018.
Market Analysis and Trends
Healthcare & Pharmaceuticals
This slide compares the market value and growth trends of vitamins and dietary supplements in North America, highlighting key insights and CAGR.
Vitamins, dietary supplements, North America, market value, growth, CAGR, healthcare, pharmaceuticals, trends
false
Market Analysis and Trends
Healthcare & Pharmaceuticals
Mixed Chart
PwC/Strategy&
Add to my slides
Remove from favorites
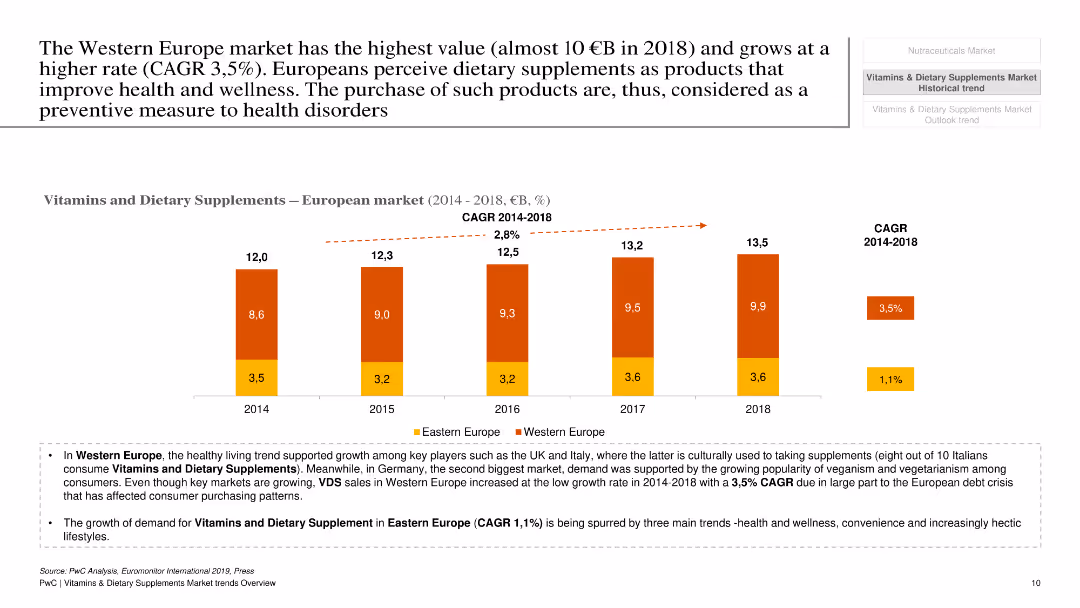
The slide has a white background with a column chart showing market value and growth rates of vitamins and dietary supplements in Western Europe from 2014 to 2018.
Market Analysis and Trends
Healthcare & Pharmaceuticals
This slide examines the market value and growth rate of vitamins and dietary supplements in Western Europe, focusing on key drivers and trends.
Vitamins, dietary supplements, Western Europe, market value, growth, trends, healthcare, pharmaceuticals, analysis
false
Market Analysis and Trends
Healthcare & Pharmaceuticals
Mixed Chart
PwC/Strategy&
Add to my slides
Remove from favorites
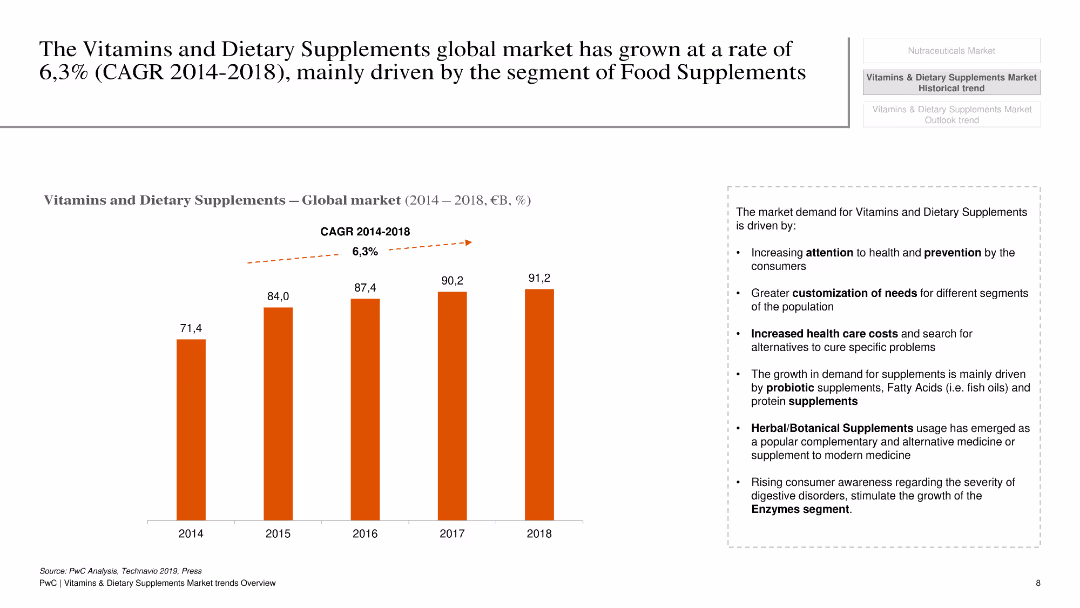
The slide has a white background with a column chart showing global market growth of vitamins and dietary supplements from 2014 to 2018.
Market Analysis and Trends
Healthcare & Pharmaceuticals
This slide presents the growth rate of the global market for vitamins and dietary supplements, highlighting the CAGR and key growth drivers.
Vitamins, dietary supplements, market growth, CAGR, global, healthcare, pharmaceuticals, trends, analysis
false
Market Analysis and Trends
Healthcare & Pharmaceuticals
Mixed Chart
PwC/Strategy&
Add to my slides
Remove from favorites
The slide features a large image at the top left with text on the right, including a trend assessment with bar charts.
Technology and Digital Transformation
Retail & E-commerce
Discusses voice commerce, highlighting the use of smart speakers and voice commands to enhance online shopping experiences.
Voice Commerce, Smart Speakers, Voice Commands, Retail, Shopping, AI, Personalization, Customer Interaction
false
Technology and Digital Transformation
Retail & E-commerce
Mixed Chart
Deloitte
Add to my slides
Remove from favorites
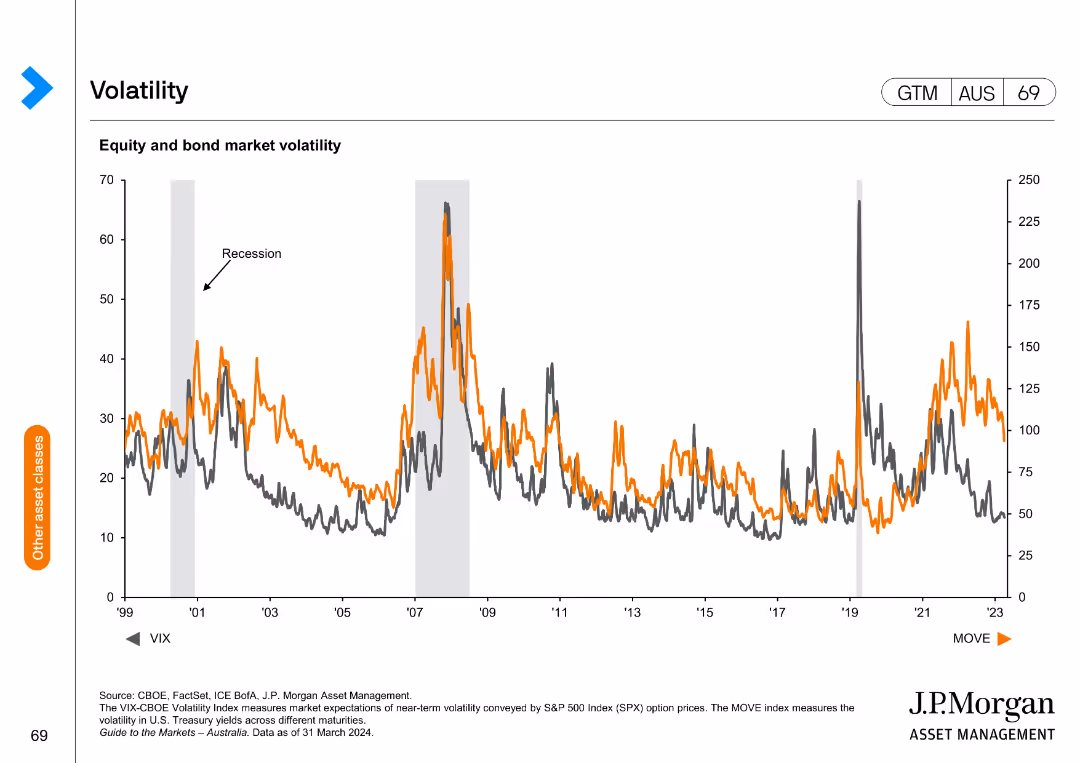
The slide contains a line chart showing equity and bond market volatility, with the VIX and MOVE indexes highlighted. The chart covers the period from 1999 to 2023.
Risk Assessment and Management
Financial Services
This slide analyzes market volatility through VIX and MOVE indexes, helping in risk assessment and understanding market fluctuations.
Volatility, VIX, MOVE index, market analysis, risk assessment, financial markets, equity, bond market
false
Risk Assessment and Management
Financial Services
Single Chart
JP Morgan
Add to my slides
Remove from favorites
Three line charts comparing cumulative real wage gaps between nominal wages and consumer prices (CPI) for the US, UK, and Euro area, showing persistent inflation outpacing wage growth and resulting in wage catchup pressures.
Market Analysis and Trends
Professional Services
This slide highlights the persistent real pay gaps over the past two years in the US, UK, and Euro area, suggesting ongoing labor cost pressures as workers seek to restore lost purchasing power due to inflation.
Wage Gap, Inflation, Labor Costs, Real Wages, Purchasing Power
false
Market Analysis and Trends
Professional Services
Multiple Chart
Accenture
Add to my slides
Remove from favorites
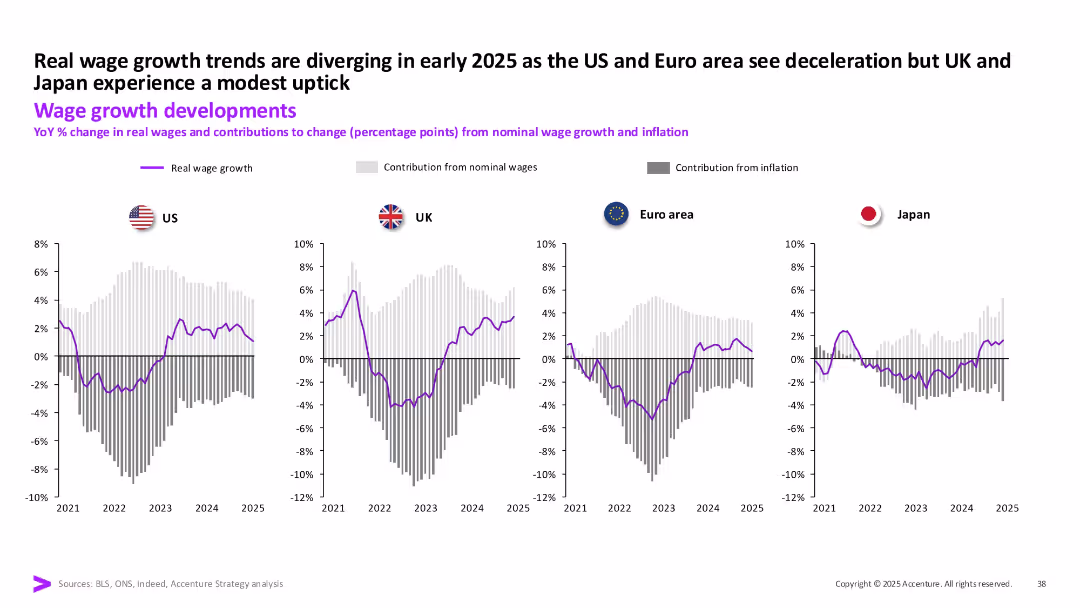
Bar and line charts for US, UK, Euro area, and Japan showing YoY real wage growth and breakdown of nominal wage and inflation contributions.
Financial Performance
Professional Services
Real wage growth patterns diverge in early 2025: UK and Japan show moderate upticks, while the US and Euro Area see a slowdown. Visualizes how inflation and nominal wages influence real wage changes.
Wage Growth, Inflation, Real Wages, Contributions, Economic Trends, 2025
false
Financial Performance
Professional Services
Multiple Chart
Accenture
Add to my slides
Remove from favorites
Scatter plot showing the 'Ability to Technically Automate' against 'Hourly Wage' with highlighted positions like 'File clerks' and 'Chief executives', indicating a wide range across wage levels.
Financial Performance
Industrial & Manufacturing
Discusses the correlation between the technical potential for automation and wage levels, highlighting how both high and low-wage jobs can be significantly automated.
Wages, Automation, Job Security, Income Levels, Analysis
false
Financial Performance
Industrial & Manufacturing
Single Chart
McKinsey
Add to my slides
Remove from favorites
The slide contains a list with checkmarks showcasing assets and innovations in the card industry, complemented with icons representing digital and physical payments. It is structured for easy readability and distinction between unique assets and continuous innovation efforts.
Strategic Planning
Financial Services
This slide emphasizes the unique assets and innovative strides of a card franchise, underlining factors like unmatched scale and top-of-wallet share. It serves as a benchmark for companies aiming to enhance their market positioning through innovation.
Wallet share, Innovation, Industry assets, Branded cards, Loyalty program, Digital payments
false
Strategic Planning
Financial Services
Table
JP Morgan
Add to my slides
Remove from favorites
This slide presents two column charts: one showing the breakdown of the warehouse automation market by end markets (e-commerce, grocery, apparel, etc.) and another by geography (U.S., China, Germany, etc.). It includes textual analysis of the market shares and growth trends.
Market Analysis and Trends
Industrial & Manufacturing
The slide analyzes the warehouse automation market by end markets and geography, highlighting the dominance of the U.S., China, and Germany, and the significant contributions of sectors like e-commerce and grocery.
Warehouse Automation, Market Breakdown, End Markets, Geography, E-commerce, Grocery, Apparel, U.S., China, Germany
false
Market Analysis and Trends
Industrial & Manufacturing
Mixed Chart
LEK
Add to my slides
Remove from favorites
This slide includes a column chart showing the growth forecast of the global warehouse automation market from 2016 to 2027. It also provides key drivers for this growth, such as the shift to online purchasing, globalization of supply chains, and new business models like Robots-as-a-Service (RaaS).
Market Analysis and Trends
Industrial & Manufacturing
The slide projects the rapid growth of the global warehouse automation market, driven by factors such as online purchasing trends, supply chain globalization, and new business models like RaaS, with a forecast to reach $34B by 2027.
Warehouse Automation, Market Growth, Online Purchasing, Supply Chains, Robots-as-a-Service, Market Forecast, Global Trends
false
Market Analysis and Trends
Industrial & Manufacturing
Mixed Chart
LEK
Add to my slides
Remove from favorites
This slide features a flowchart diagram depicting the various stakeholders in the warehouse automation value chain, including components providers, solution providers, integrators, consultants, and end users. It highlights the forecast demand for automation in different end markets like e-commerce, food & beverage, apparel, and general merchandise.
Technology and Digital Transformation
Industrial & Manufacturing
The slide outlines the stakeholders involved in warehouse automation, detailing components providers, solution providers, integrators, consultants, and end users, along with the forecast demand for automation in various end markets.
Warehouse Automation, Value Chain, Stakeholders, Components Providers, Solution Providers, Integrators, Consultants, End Users, Forecast Demand
false
Technology and Digital Transformation
Industrial & Manufacturing
Linear Flow
LEK
Add to my slides
Remove from favorites
The slide contains a mix of text and icons describing primary end markets, demand drivers, and outlook for the waste and recycling segment.
Market Analysis and Trends
Environmental Services & Sustainability
It details the resilience of the waste and recycling segment against commercial volume reduction, highlighting residential, commercial, and industrial demand.
Waste, recycling, demand, commercial, residential, industrial, segment, outlook, primary markets
false
Market Analysis and Trends
Environmental Services & Sustainability
Table
LEK
Add to my slides
Remove from favorites
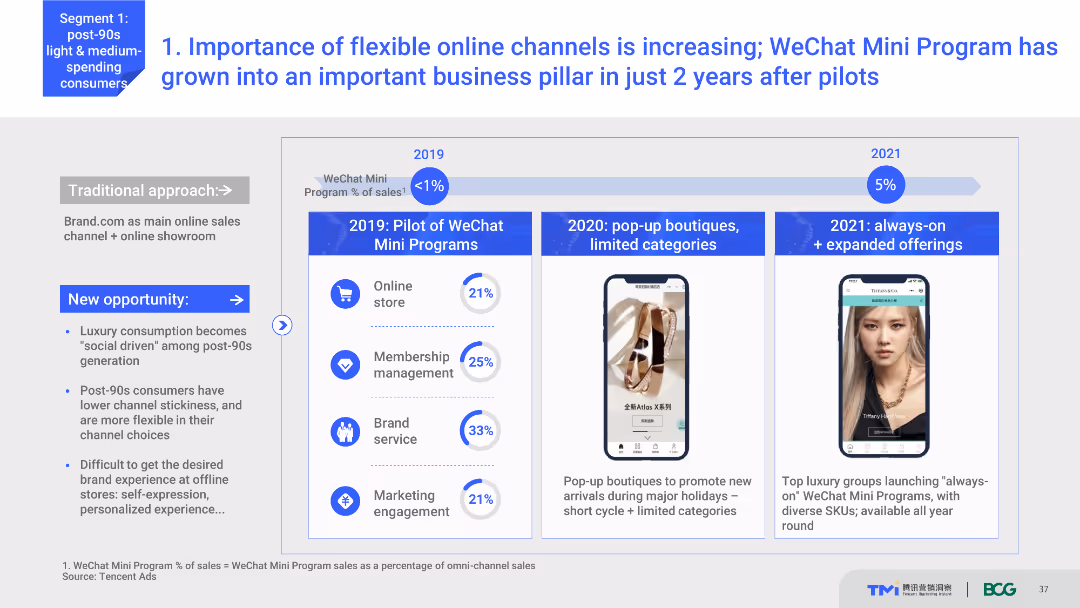
Timeline chart showing the growth of WeChat Mini Programs from 2019 to 2021. Includes key milestones like the introduction of pop-up boutiques and expanded offerings. Text explains the significance of these developments.
Technology and Digital Transformation
Retail & E-commerce
Discusses the growing importance of flexible online channels like WeChat Mini Programs for luxury brands. Shows the timeline of their implementation and growth, highlighting key milestones and their impact on business.
WeChat Mini Programs, online channels, luxury brands, digital transformation, business growth
false
Technology and Digital Transformation
Retail & E-commerce
Mixed Chart
BCG
Add to my slides
Remove from favorites
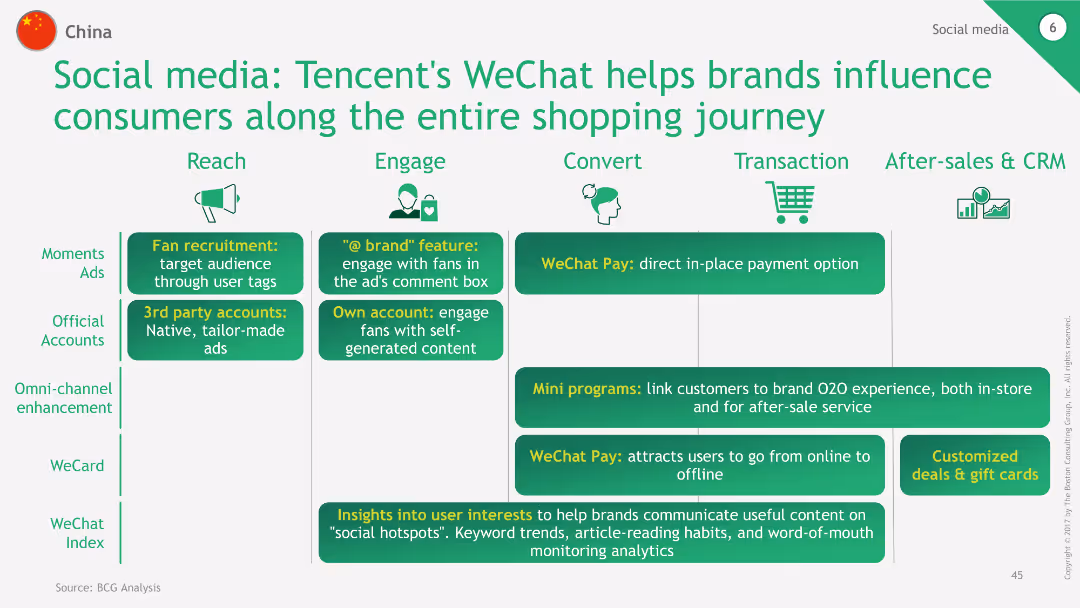
The slide features a process flow diagram illustrating how Tencent's WeChat influences the entire shopping journey from Reach, Engage, Convert, Transaction, to After-sales & CRM. Each stage lists specific WeChat features like Moments Ads, Fan recruitment, WeChat Pay, and Mini programs.
Technology and Digital Transformation
Consumer Goods
This slide outlines Tencent's WeChat capabilities across different stages of the shopping journey, from initial reach and engagement to conversion and after-sales services, showcasing the platform's comprehensive influence on consumer behavior.
WeChat, Tencent, shopping journey, social media, engagement
false
Technology and Digital Transformation
Consumer Goods
Table
BCG
Add to my slides
Remove from favorites
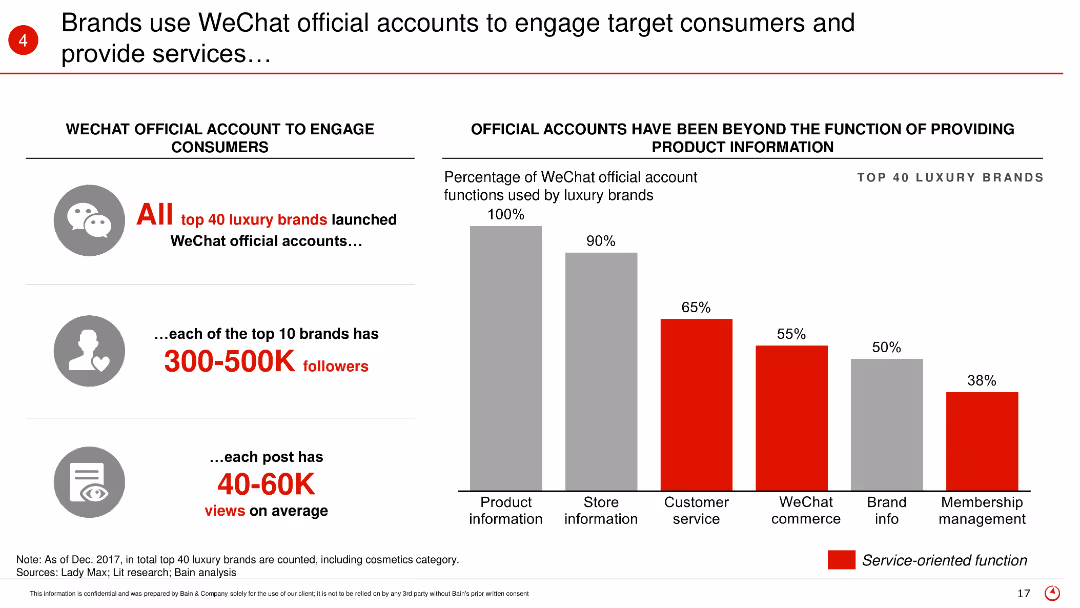
The slide features graphs showing the engagement metrics of WeChat official accounts by top luxury brands, including follower counts and post views. Additional bar charts illustrate the functions used by these accounts.
Customer and Market Segmentation
Retail & E-commerce
This slide explains how luxury brands are leveraging WeChat official accounts to engage with consumers, providing product information, customer service, and more, with substantial follower engagement metrics.
WeChat, luxury brands, consumer engagement, social media, digital strategy
false
Customer and Market Segmentation
Retail & E-commerce
Mixed Chart
Bain
Add to my slides
Remove from favorites
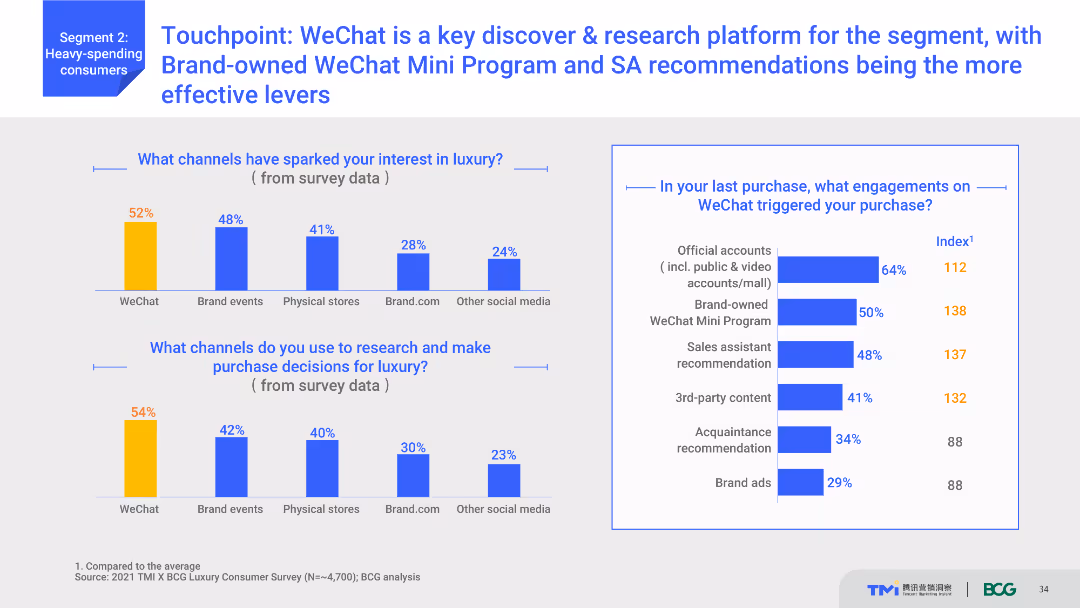
Column charts illustrating channels that spark interest in luxury and research channels, with a focus on WeChat. Additional text highlights specific engagements on WeChat that trigger purchases.
Strategic Planning
Media & Entertainment
Highlights WeChat as a crucial platform for discovery and research among luxury consumers. Shows which WeChat engagements (like Mini Programs and SA recommendations) are most effective in triggering purchases.
WeChat, social media, luxury research, consumer engagement, Mini Programs
false
Strategic Planning
Media & Entertainment
Multiple Chart
BCG
Add to my slides
Remove from favorites
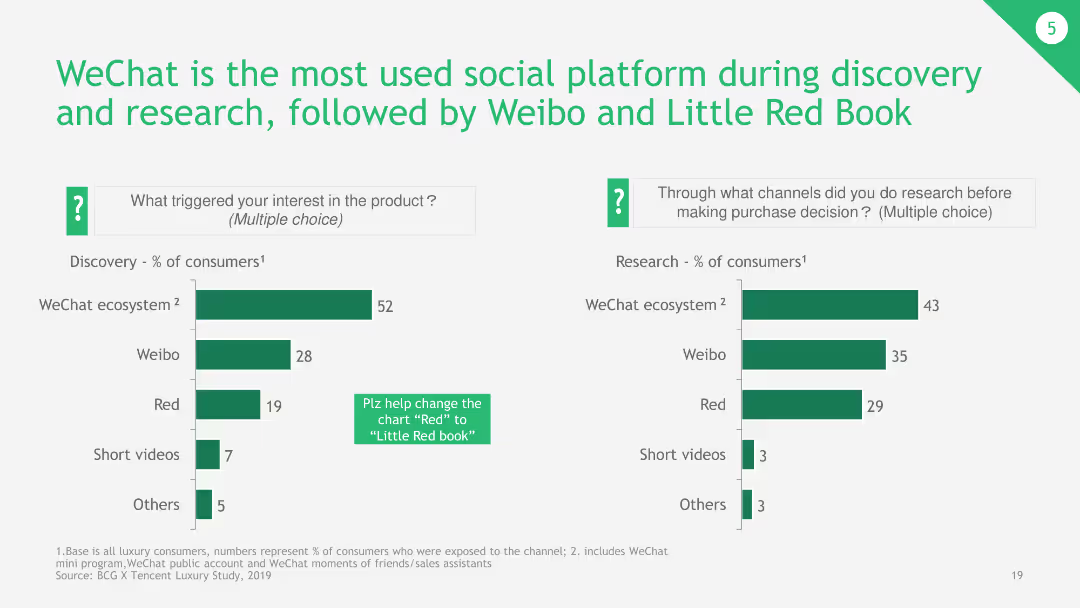
The slide contains bar charts showing percentages of consumers using various social platforms for discovery and research. It also has explanatory notes on usage.
Market Analysis and Trends
Telecommunications
The slide explains the dominance of WeChat as the primary social platform for consumer discovery and research, with comparative data on Weibo and Little Red Book, showing their respective user engagement rates.
WeChat, social platform, discovery, research, Weibo, Little Red Book
false
Market Analysis and Trends
Telecommunications
Multiple Chart
BCG
Add to my slides
Remove from favorites
Contains multiple graphical representations, including two doughnut charts for client balances and net income distribution, and text boxes with bullet points summarizing key information and accolades.
Industry Overview
Financial Services
The slide summarizes Bank of America's wealth management capabilities, industry leadership, and digital innovation awards. It shows the client balance distribution and the company's net income segmentation.
Wealth Management, Client Balances, Net Income, Industry Leadership, Digital Innovation, Advisors, Households, GWIM Revenue
false
Industry Overview
Financial Services
Multiple Chart
Morgan Stanley
Add to my slides
Remove from favorites
The slide presents a series of column charts on revenue, net income, and return on capital, using a blue color scheme. The graphics are accompanied by bullet points with key financial metrics.
Financial Performance
Financial Services
This slide exhibits the solid financial results of Global Wealth & Investment Management with revenue, net income, and return on capital figures over a four-year period.
Wealth Management, Revenue, Net Income, Return on Capital, Financial Results, Pre-tax Margin, Capital Efficiency
false
Financial Performance
Financial Services
Multiple Chart
Morgan Stanley
Add to my slides
Remove from favorites
Diagram and text layout showing partnerships and acquisitions.
Strategic Planning
Financial Services
Outlines how recent acquisitions will influence U.S. wealth management, detailing cross-asset class tax-loss harvesting and comprehensive workplace solutions.
Wealth Management, Tax-Loss, Acquisition
false
Strategic Planning
Financial Services
Diagram
JP Morgan
Add to my slides
Remove from favorites
A bar extends across the slide, segmented into various client categories with associated market sizes and wealth management share, presented in a clear, hierarchical manner. The design is simple with a blue color scheme.
Financial Performance
Financial Services
Details the firm's market approach for different client segments across the wealth spectrum, from ultra-high net worth to mass affluent, indicating potential for market expansion.
Wealth Spectrum, Client Segmentation, Market Share
false
Financial Performance
Financial Services
Table
Goldman Sachs
Add to my slides
Remove from favorites
The slide contains several rectangular callout boxes with icons, a column chart, and text descriptions. It uses a blue and white color palette and has a balanced distribution of visuals and text.
Strategic Planning
Financial Services
Outlines a strategic plan for a wealth franchise, detailing service offerings like full-service, remote advice, and self-directed investing. It serves to illustrate the comprehensive approach to client service across multiple channels, aimed at capturing a larger share of the investment wallet.
Wealth franchise, Strategic plan, Service offerings, Investment, Channels
false
Strategic Planning
Financial Services
Mixed Chart
JP Morgan
Add to my slides
Remove from favorites
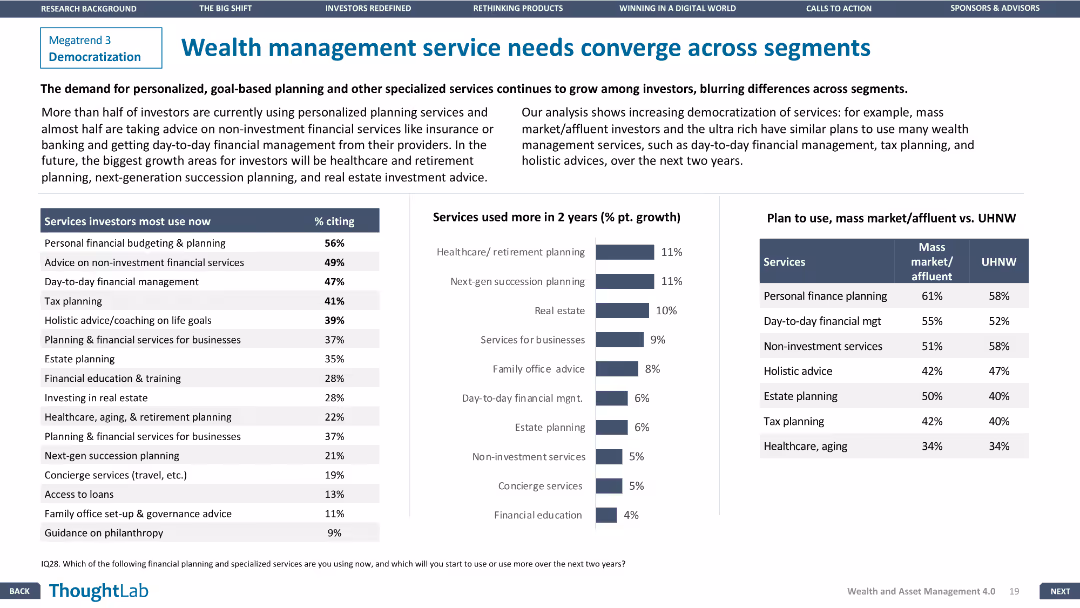
The slide features a column chart of services investors use now vs. in 2 years and a comparison table for mass market vs. UHNW plans.
Customer and Market Segmentation
Financial Services
The slide explores the convergence of wealth management services across different investor segments, highlighting growing demands for personalized services.
Wealth management, Service convergence, Financial Services, Segmentation, Personalized services
false
Customer and Market Segmentation
Financial Services
Mixed Chart
Deloitte
Add to my slides
Remove from favorites
Combines U.S. map, column chart, and bullet points to discuss growth strategies in wealth management.
Sales and Business Development
Financial Services
Details JPMorgan's approach to capturing U.S. wealth management market potential, highlighting growth from digital solutions and advisors.
Wealth management, US market, growth opportunity, digital solutions, client advisors, market capture
false
Sales and Business Development
Financial Services
Mixed Chart
JP Morgan
Add to my slides
Remove from favorites
Column charts and pie charts showing private banking and asset management metrics, including AuM, PTI, and industry growth.
Strategic Planning
Financial Services
Presents IWM’s performance in wealth and asset management, highlighting industry growth, assets under management, and profitability.
Wealth management, asset management, IWM, AuM, PTI
false
Strategic Planning
Financial Services
Multiple Chart
Credit Suisse
Add to my slides
Remove from favorites
Multiple tables and column charts showing revenues, profit before tax, and cost/income ratio across different periods.
Financial Performance
Financial Services
Details total revenues, net interest income, recurring fees, transaction income, and profit before tax for Q3 2022.
Wealth management, revenue, profit, cost/income ratio, UBS, financial performance, 3Q22, net interest income
false
Financial Performance
Financial Services
Multiple Chart
UBS
Add to my slides
Remove from favorites
The slide displays three sets of column charts showing changes in fee-based assets, loans, and deposits over time. Two shades of blue are used to differentiate between 2015 and 1Q’21 figures, with percentages indicating growth. Each set has two columns representing different business sectors. Annotations highlight rankings and industry positions.
Financial Performance
Financial Services
This slide shows the strategic growth of a wealth management business with a focus on fee-based assets, loans, and deposits. It emphasizes the company's industry-leading positions and substantial growth percentages over six years, suggesting a solid market presence and financial health.
Wealth management, strategic growth, fee-based assets, loans, deposits, industry ranking, financial health, market presence, business growth, performance analysis
false
Financial Performance
Financial Services
Multiple Chart
Morgan Stanley
Add to my slides
Remove from favorites
A slide with mobile UI mockups, a laptop image, and iconography. It's visually dense with a mix of screenshots and text descriptions, adhering to a corporate blue color scheme.
Technology and Digital Transformation
Financial Services
Describes a new platform for managing finances with tools for a consolidated view, personalized planning, and advisor collaboration. This slide is used to present an upcoming digital tool, illustrating its features like consolidation, personalization, and real-time integration for wealth management.
Wealth planning, Digital tool, Personalization, Integration, Finances
false
Technology and Digital Transformation
Financial Services
Graphic
JP Morgan
Add to my slides
Remove from favorites
This slide contains multiple vertical bar graphs with color coding for Millennials and Gen Z. It also includes a text block explaining the context of the data.
Market Analysis and Trends
Financial Services
Illustrates Millennials and Gen Z's perceptions of the factors contributing to wealth inequality and their views on systemic barriers.
Wealth, Inequality, Millennials, Gen Z, Survey, Systemic, Barriers, Executive Pay, Education
false
Market Analysis and Trends
Financial Services
Multiple Chart
Deloitte
Add to my slides
Remove from favorites
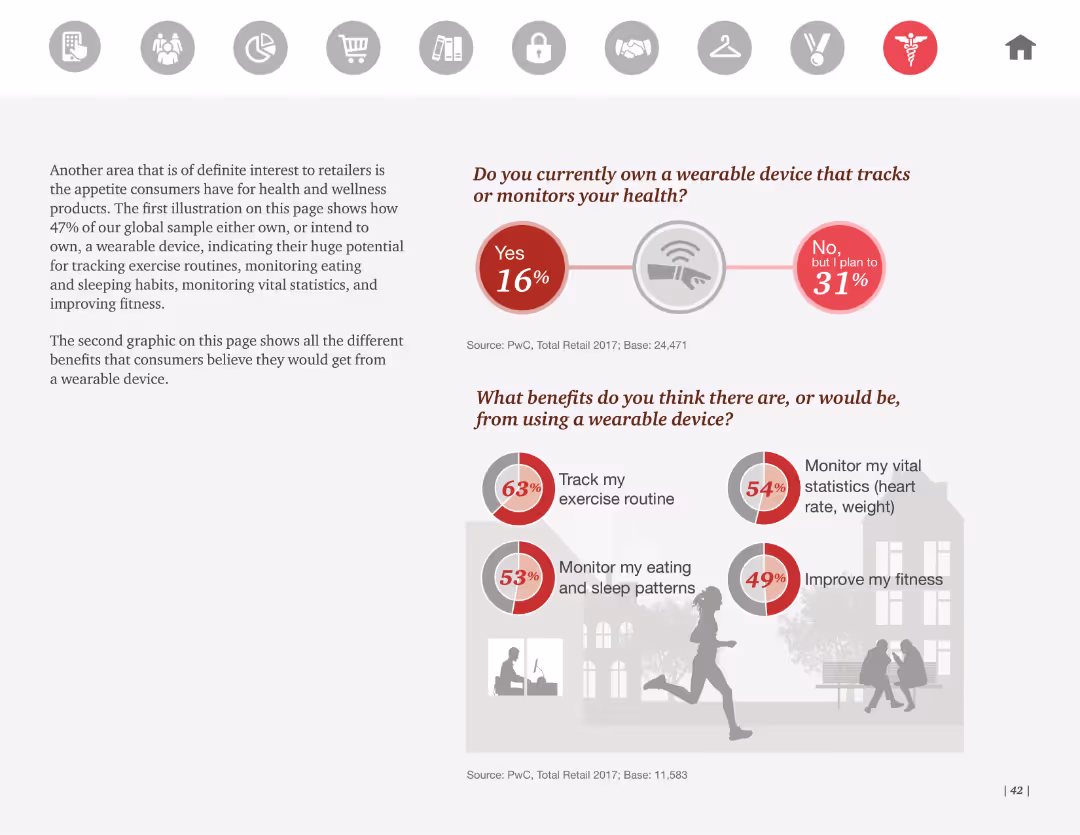
The slide features two circular graphs and supporting text about wearable health devices. It includes an illustration of a person running and a figure indicating the potential benefits of using these devices.
Market Analysis and Trends
Healthcare & Pharmaceuticals
This slide highlights that 16% of consumers currently own wearable health devices, with 31% planning to buy one. It discusses the benefits of wearables, such as tracking exercise routines, monitoring vital statistics, and improving fitness.
Wearable devices, health monitoring, consumer behavior, fitness tracking, survey
false
Market Analysis and Trends
Healthcare & Pharmaceuticals
Mixed Chart
PwC/Strategy&
Add to my slides
Remove from favorites
This slide contrasts the phases of the web: Web 1.0, Web 2.0, and Web 3.0 through text blocks and iconic representations for each stage (e.g., HTTP, Google Chrome, Ethereum logo), arranged in a clear, horizontal timeline format.
Technology and Digital Transformation
Technology & Software
Details the transitions and characteristics of Web 1.0, Web 2.0, and Web 3.0, highlighting shifts in data management and user interaction. It discusses the move from decentralized to centralized, and back to decentralized frameworks.
Web 1.0, Web 2.0, Web 3.0, decentralized, digital services
false
Technology and Digital Transformation
Technology & Software
Linear Flow
McKinsey
Add to my slides
Remove from favorites
Modern building image on a blue-toned background listing topics such as blockchain fundamentals and commercial applications of Web 3 technologies.
Strategic Planning
Technology & Software
Serves as an agenda slide for a presentation on Web 3 and digital assets, outlining the scope and sequence of topics to be covered, from blockchain technology to its commercial applications.
Web 3, digital assets, blockchain, agenda, technologies
false
Strategic Planning
Technology & Software
Agenda
McKinsey
Add to my slides
Remove from favorites
Includes examples and visuals of NFTs, digital identities, and Metaverse platforms, emphasizing their roles and applications.
Technology and Digital Transformation
Technology & Software
Highlights the emerging technologies of NFTs and Metaverse, explaining their impact on digital identity and virtual experiences.
Web 3.0, NFT, Metaverse, Digital Identity, Platforms
false
Technology and Digital Transformation
Technology & Software
Linear Flow
McKinsey
Add to my slides
Remove from favorites
Side-by-side comparison of Web2 and Web3, with visual elements and text to illustrate differences.
Technology and Digital Transformation
Technology & Software
Explains the transition from Web2 to Web3, including shifts in data ownership, business models, and technological infrastructure.
Web2 vs Web3, tech trend, data ownership, business model, technical infrastructure
false
Technology and Digital Transformation
Technology & Software
Boxed
McKinsey
Add to my slides
Remove from favorites
Graphs and statistics showing the growth in talent and capital investment in Web3.
Market Analysis and Trends
Technology & Software
Highlights the significant growth in the number of developers and capital investment in Web3 over recent years.
Web3 growth, talent increase, capital investment, market analysis
false
Market Analysis and Trends
Technology & Software
Multiple Chart
McKinsey
Add to my slides
Remove from favorites
Slide with icons and bullet points, outlining the reasons for leadership to consider Web3 impacts.
Technology and Digital Transformation
Technology & Software
Discusses the implications of Web3 on business models, innovation, access and inclusion, and customer experience.
Web3 implications, leadership, business model disruption, innovation, inclusion
false
Technology and Digital Transformation
Technology & Software
Pillar
McKinsey
Add to my slides
Remove from favorites
This slide has a complex layout, divided into three main sections with headers and explanatory text below each section. It features two columns of text-based lists, a matrix of labeled squares, and footnotes. The design is blue and white with high contrast.
Industry Overview
Technology & Software
The slide provides an overview of significant technologies and areas of interest within Web3, including applications, technologies, and digital assets like DeFi, gaming, and the metaverse. It’s structured to educate on the foundational aspects of Web3 and how they're employed across different domains.
Web3, DeFi, Metaverse, Digital Assets, Technology
false
Industry Overview
Technology & Software
Header Vertical
McKinsey
Add to my slides
Remove from favorites
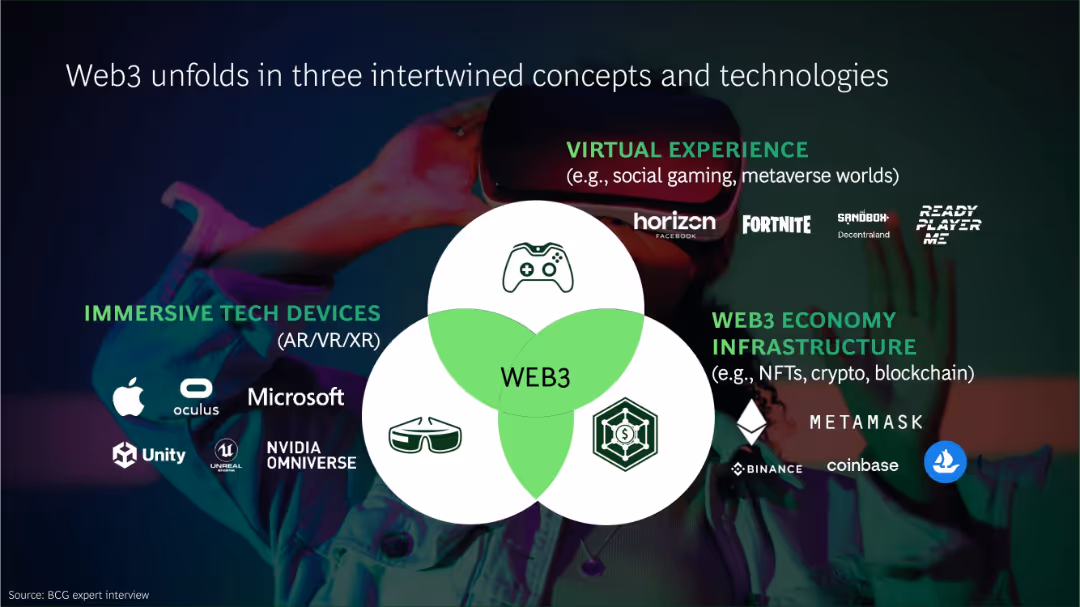
Venn diagram with three labeled segments surrounded by logos and icons of relevant platforms and companies
Technology and Digital Transformation
Technology & Software
Web3 is described as a convergence of immersive tech devices (AR/VR/XR), virtual experiences (e.g., gaming), and blockchain infrastructure. Major platforms and players like Meta, Microsoft, and Binance are highlighted. The slide emphasizes interconnected tech driving next-gen digital experiences.
Web3, blockchain, immersive tech, AR/VR, metaverse, virtual experience, NFTs, crypto
false
Technology and Digital Transformation
Technology & Software
Framework
BCG
Add to my slides
Remove from favorites
Clean layout with tiered blocks diagramming the layers of Web3 technology—Blockchain, Smart Contracts, Digital Assets, and their applications in areas like DeFi and Gaming. Colored in blue shades with icons.
Technology and Digital Transformation
Technology & Software
Explains the structure of Web3 technologies starting from basic blockchain through to various applications like gaming and insurance. Useful for explaining foundational technology and its potential applications.
Web3, blockchain, smart contracts, digital assets, applications
false
Technology and Digital Transformation
Technology & Software
Table
McKinsey
Add to my slides
Remove from favorites
Title slide introducing the Web3 section of the 2022 technology trends report.
Technology and Digital Transformation
Professional Services
Acts as the cover page for the Web3 section of the McKinsey Technology Trends Outlook 2022 report.
Web3, technology trends, 2022 outlook, digital identity
false
Technology and Digital Transformation
Professional Services
Title
McKinsey
Add to my slides
Remove from favorites
Slide displays a bar chart with blue bars, listing percentages of VC interest in Web3 areas. Accompanied by quotes on the right side against a gray backdrop. The chart is a column chart, not a bar chart.
Investment Analysis
Technology & Software
Focuses on the growing interest in Web3 sectors among VCs, showing the percentage of VCs investing in areas like privacy, DeFi, and blockchain, with expectations for the future.
Web3, venture capital, investment, privacy, DeFi, blockchain, DAOs, Metaverse, crypto, NFTs
false
Investment Analysis
Technology & Software
Single Chart
Bain
Add to my slides
Remove from favorites
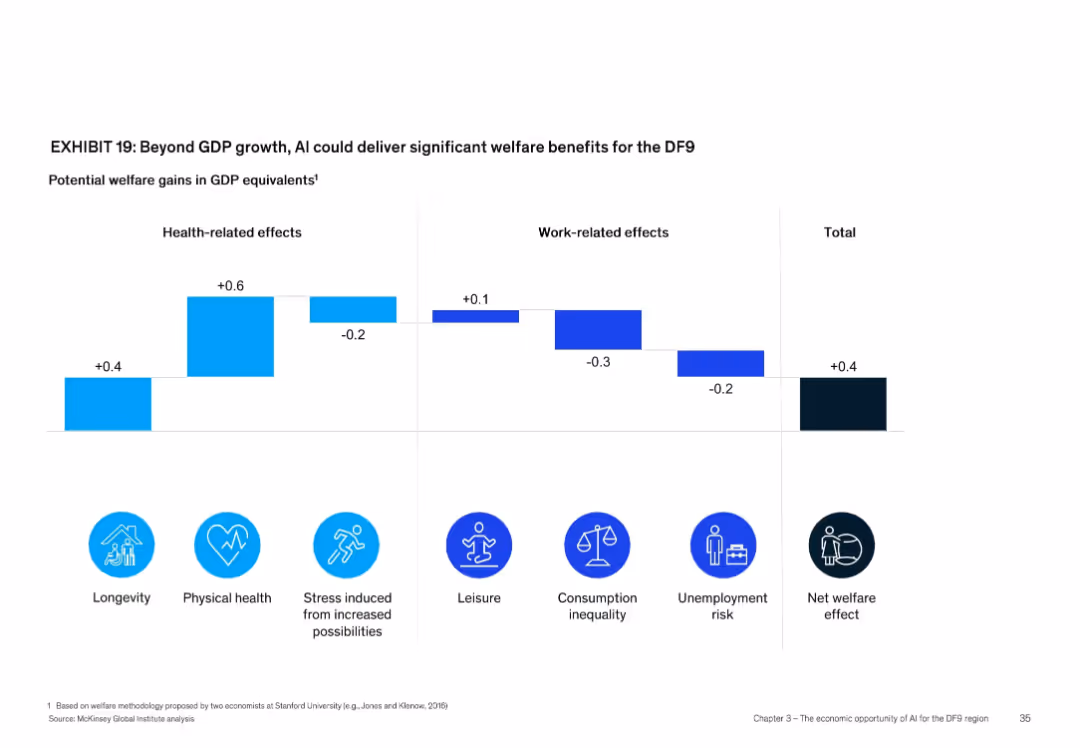
Horizontal bar chart with icons below, categorized into health/work effects and total impact
Strategic Planning
Artificial Intelligence
The slide illustrates AI’s welfare effects for DF9, showing positive gains in longevity (+0.4) and physical health (+0.6) but negative impacts like stress (-0.2) and unemployment risk (-0.2). The net welfare effect is +0.4 in GDP equivalents.
Welfare, longevity, unemployment, stress, GDP equivalent, AI effects
false
Strategic Planning
Artificial Intelligence
Single Chart
McKinsey
Add to my slides
Remove from favorites
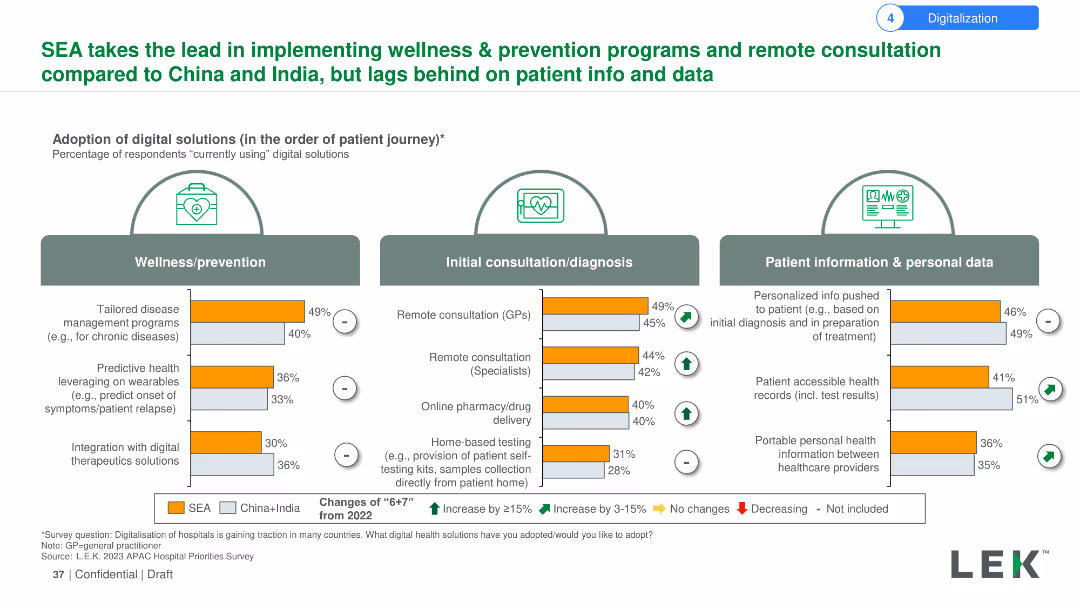
Column chart showing the adoption of digital health solutions in wellness and prevention, initial consultation/diagnosis, and patient info & personal data.
Technology and Digital Transformation
Healthcare & Pharmaceuticals
This slide compares the adoption of digital health solutions in SEA, China, and India, focusing on wellness programs, consultations, and patient data.
Wellness programs, digital health, SEA, China, India, patient data
false
Technology and Digital Transformation
Healthcare & Pharmaceuticals
Multiple Chart
LEK
Add to my slides
Remove from favorites
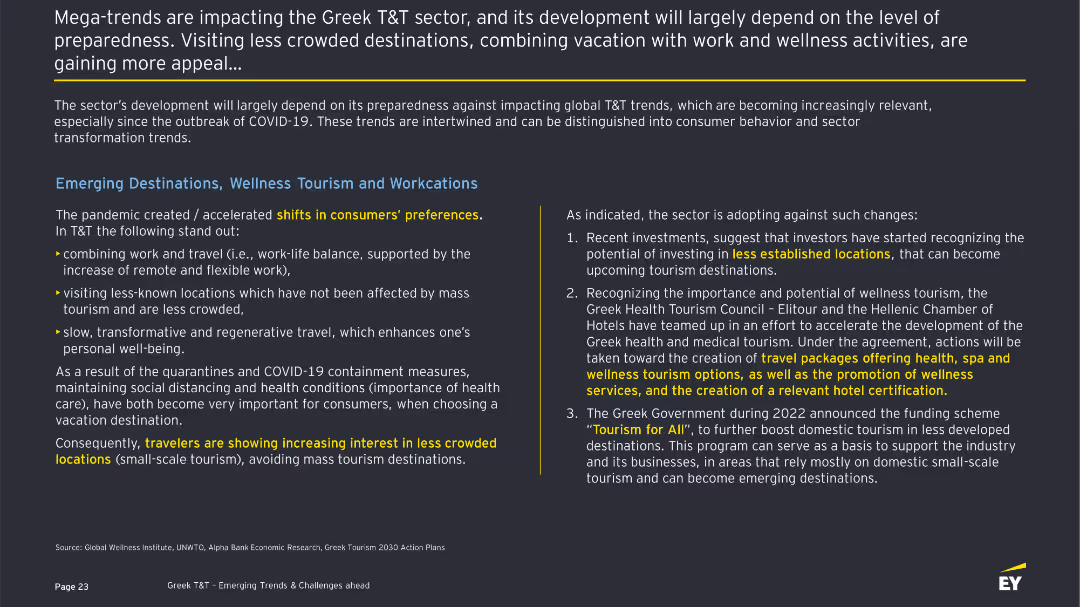
The slide discusses mega-trends impacting the Greek T&T sector, highlighting shifts in consumer preferences towards less crowded destinations, wellness tourism, and workcations. It includes bullet points and a summary of sector preparedness.
Strategic Planning
Hospitality & Tourism
Describes the impact of COVID-19 on consumer preferences in the T&T sector, with a focus on wellness tourism and workcations. It outlines key trends such as remote work, less crowded destinations, and the importance of health and safety measures.
Wellness, Workcations, Tourism, COVID-19, Trends
false
Strategic Planning
Hospitality & Tourism
Header Horizontal
EY
Add to my slides
Remove from favorites
The slide discusses mega-trends impacting the Greek T&T sector, highlighting shifts in consumer preferences towards less crowded destinations, wellness tourism, and workcations. It includes bullet points and a summary of sector preparedness.
Strategic Planning
Hospitality & Tourism
Describes the impact of COVID-19 on consumer preferences in the T&T sector, with a focus on wellness tourism and workcations. It outlines key trends such as remote work, less crowded destinations, and the importance of health and safety measures.
Wellness, Workcations, Tourism, COVID-19, Trends
false
Strategic Planning
Hospitality & Tourism
Mixed Chart
EY
Add to my slides
Remove from favorites
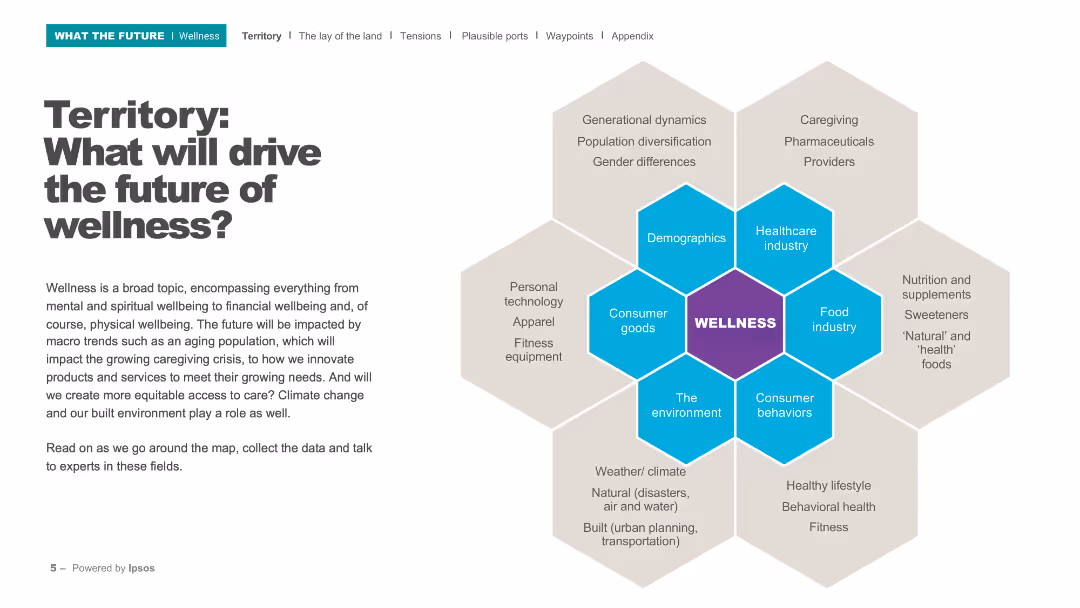
This slide contains a hexagonal diagram with 'Wellness' at the center, surrounded by key drivers such as demographics, healthcare industry, consumer goods, and the environment.
Strategic Planning
Healthcare & Pharmaceuticals
The slide outlines the various factors that will shape the future of wellness, including demographic shifts, technological advancements, and environmental factors. It sets the stage for a discussion on wellness trends.
Wellness, future trends, demographics, healthcare, environment
false
Strategic Planning
Healthcare & Pharmaceuticals
Diagram
IPSOS
Add to my slides
Remove from favorites
The slide uses a combination of bar charts and icons to show the adoption rates of digital solutions in wellness/prevention, initial consultation/diagnosis, and patient information/personal data. Changes from 2022 are indicated with arrows and symbols.
Market Analysis and Trends
Healthcare & Pharmaceuticals
The slide showcases SEA's leadership in adopting wellness and prevention programs and remote consultations compared to China and India. It highlights the percentage changes in digital solutions adoption rates from 2022 for different stages of the patient journey.
Wellness, prevention, remote consultation, digital solutions, SEA, China, India, adoption, patient journey, comparison
false
Market Analysis and Trends
Healthcare & Pharmaceuticals
Multiple Chart
LEK
Add to my slides
Remove from favorites
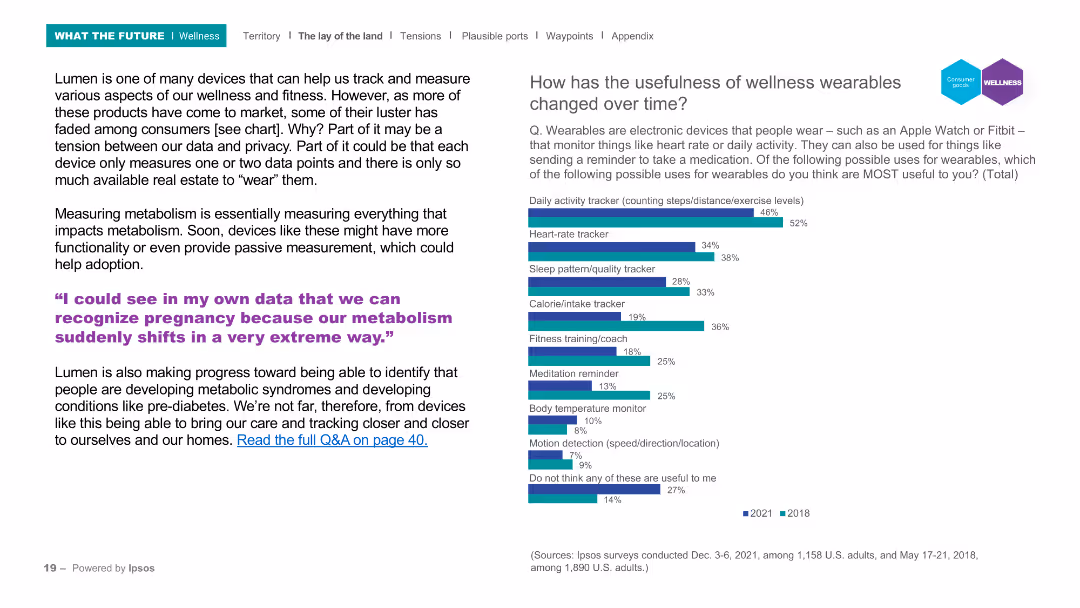
The slide includes a header, a background image, and two main sections: a text block on the left and a column chart on the right. The column chart compares the perceived usefulness of various wellness wearable features from 2018 and 2021, with a focus on features like activity tracking and heart rate monitoring.
Product and Service Analysis
Healthcare & Pharmaceuticals
Discusses the evolution and adoption of wellness wearables, highlighting their increasing functionality and the balance between data privacy and usefulness. The column chart illustrates changes in the perceived usefulness of wellness wearables over time, focusing on features such as activity tracking and heart rate monitoring.
Wellness, wearables, activity tracking, heart rate, survey
false
Product and Service Analysis
Healthcare & Pharmaceuticals
Mixed Chart
IPSOS
Add to my slides
Remove from favorites
The slide contains a line chart comparing the volume of wheat exports from Canada, Australia, and Ukraine from 1999 to 2018. It also includes key data points and CAGR.
Market Analysis and Trends
Agriculture & Food Production
The slide illustrates the significant growth in wheat exports from Ukraine compared to Canada and Australia, with data highlighting Ukraine's competitive edge in recent years.
Wheat exports, Canada, Australia, Ukraine, CAGR, market trends, export volume, agriculture, food production, growth rate
false
Market Analysis and Trends
Agriculture & Food Production
Mixed Chart
LEK
Add to my slides
Remove from favorites
The slide features a line chart showing wheat production volumes for Canada, Australia, and Ukraine, with annotations explaining the volatility and growth rates.
Market Analysis and Trends
Agriculture & Food Production
The slide explains the volatility in Australian wheat production compared to Canada and Ukraine, emphasizing the factors contributing to slower growth in Australia.
Wheat production, volatility, Australia, Canada, Ukraine, growth rate, agriculture, food production, market trends
false
Market Analysis and Trends
Agriculture & Food Production
Mixed Chart
LEK
Add to my slides
Remove from favorites
This slide includes a map of Australia showing grain production regions and a list of major crops with percentages of total production.
Industry Overview
Agriculture & Food Production
The slide provides an overview of grain production in Australia, emphasizing that wheat is the predominant crop and detailing the production regions and other major crops.
Wheat, Grain, Production, Australia, Crops
false
Industry Overview
Agriculture & Food Production
Graphic
LEK
Add to my slides
Remove from favorites
The slide features a column chart comparing the components of delivered cost of wheat into Indonesia from different states and countries, with percentages.
Market Analysis and Trends
Transportation & Logistics
This slide presents a column chart showing the breakdown of wheat delivery costs into Indonesia, comparing Australia with other countries like Ukraine and Canada.
Wheat, Transport, Costs, Indonesia, Comparison
false
Market Analysis and Trends
Transportation & Logistics
Single Chart
LEK
Add to my slides
Remove from favorites
A circular diagram in the center with categories of wholesale payment services, text to the left, and a list of client types segmented into 'Corporates' and 'Financial Institutions' to the right.
Industry Overview
Financial Services
The slide shows the range of wholesale payment services offered and the diversity of clients served, useful for illustrating company capabilities in financial services.
Wholesale Payments, Clients, Corporates, Financial Institutions, Commercial Card, Treasury, Trade Finance
false
Industry Overview
Financial Services
Linear Flow
JP Morgan
Add to my slides
Remove from favorites
Central diagram showing wholesale payments and related business areas, with text boxes for client benefits and infrastructure.
Operational Efficiency
Financial Services
Explains the wholesale payments business, client payment facilitation, and the support of a shared infrastructure.
Wholesale Payments, Treasury Services, Merchant Acquiring, Trade Finance, Digital Infrastructure
false
Operational Efficiency
Financial Services
Framework
JP Morgan
Add to my slides
Remove from favorites
Bar graph showing total sales by segment, monochromatic color scheme, and source citation.
Market Analysis and Trends
Financial Services
Demonstrates the size and sector opportunities within the US wholesale distribution market.
Wholesale, Distribution, Market Size, Sales, Sectors, Opportunities
false
Market Analysis and Trends
Financial Services
Single Chart
EY
Add to my slides
Remove from favorites
Contains bar charts showing willingness to travel for business post-COVID-19 by generation, area, sector, and job level.
Market Analysis and Trends
Professional Services
Explores the willingness of employees to travel for business across different demographics, including generation, geographical area, sector, and job level.
Willingness to travel, Generation, Area, Sector, Job level
false
Market Analysis and Trends
Professional Services
Multiple Chart
EY
Add to my slides
Remove from favorites
This slide contains two pie charts and two column charts displaying various percentages of employee characteristics related to willingness to travel post-COVID-19.
Market Analysis and Trends
Professional Services
Highlights employee willingness to travel for business post-COVID-19, focusing on productivity measurement, job satisfaction, gender differences, and leadership roles.
Willingness to travel, Job satisfaction, Productivity, Gender differences, Leadership roles
false
Market Analysis and Trends
Professional Services
Multiple Chart
EY
Add to my slides
Remove from favorites
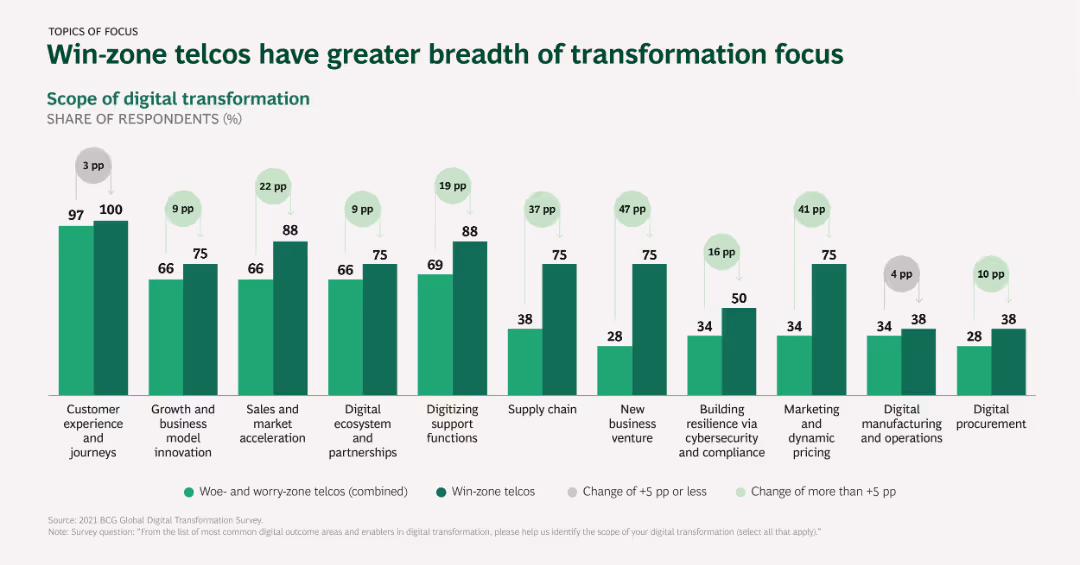
The slide presents a column chart comparing the breadth of digital transformation focus areas between win-zone and woe/worry-zone telcos, with significant differences highlighted.
Market Analysis and Trends
Telecommunications
This slide compares the scope of digital transformation initiatives between win-zone telcos and those in the worry/woe zones, indicating broader transformation focus among win-zone telcos.
Win-zone telcos, Transformation focus, Digital initiatives, Comparative analysis
false
Market Analysis and Trends
Telecommunications
Single Chart
BCG
Add to my slides
Remove from favorites
Timeline and bar chart showing the expected period for commercialization of various offshore wind technology innovations from 2015 to 2045.
Technology and Digital Transformation
Energy & Utilities
This slide details innovations in offshore wind technology, highlighting the potential for next-generation turbines and floating foundations to drive growth in the wind energy sector. It outlines the timeline for commercialization of various technological advancements in wind energy.
Wind Energy, Offshore Technology, Turbines
false
Technology and Digital Transformation
Energy & Utilities
Mixed Chart
Roland Berger
Add to my slides
Remove from favorites
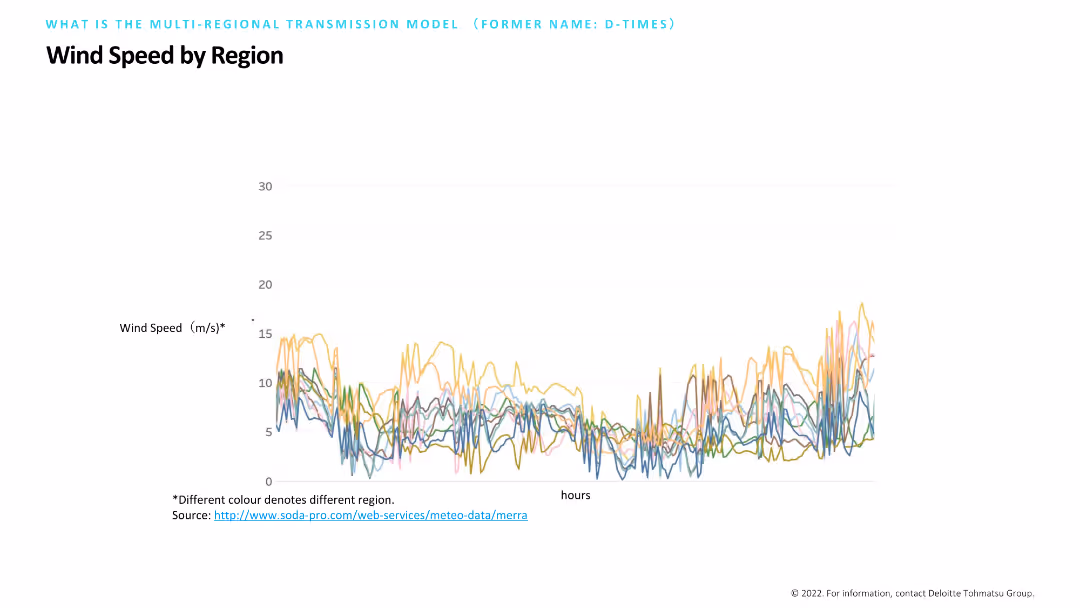
Contains a line chart with multiple colored lines representing wind speed variations across different regions over time. The chart is labeled with wind speed on the Y-axis and hours on the X-axis, with a note indicating the source of data.
Market Analysis and Trends
Environmental Services & Sustainability
Illustrates wind speed variations by region, using a line chart to track changes over time. This data visualization helps in analyzing regional wind patterns, essential for renewable energy planning and assessing the viability of wind power projects.
Wind Speed, Region, Data, Renewable, Analysis
false
Market Analysis and Trends
Environmental Services & Sustainability
Single Chart
Deloitte
Add to my slides
Remove from favorites
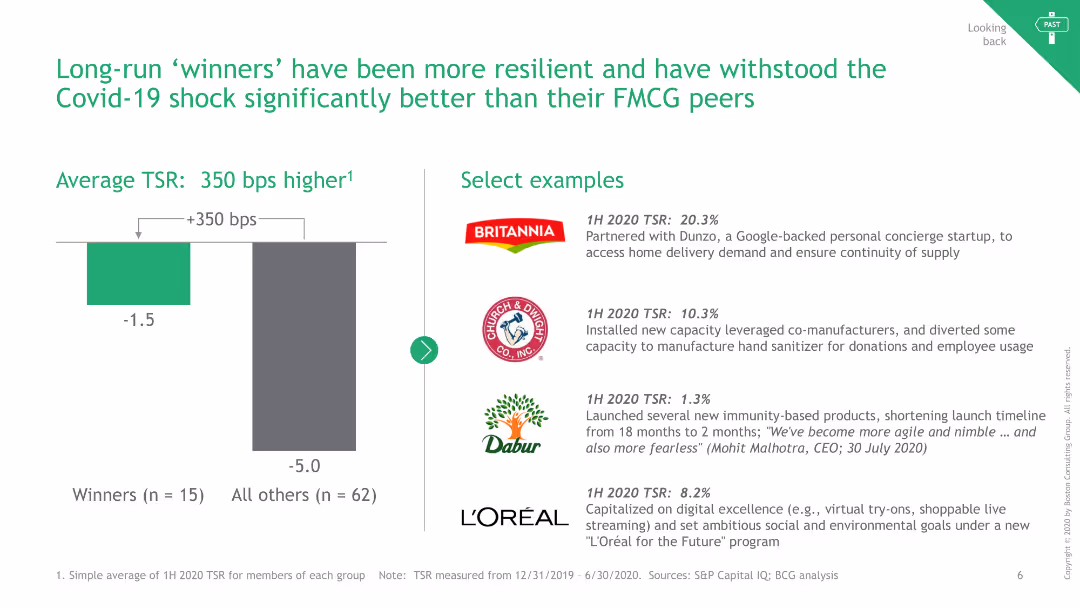
The slide includes a bar chart comparing TSR of winners vs. others and lists select examples of resilient companies.
Strategic Planning
Consumer Goods
It shows how long-run winners have outperformed others during the Covid-19 shock, with examples from different companies.
Winners, TSR, Resilience, Covid-19, Examples
false
Strategic Planning
Consumer Goods
Mixed Chart
BCG
Add to my slides
Remove from favorites
Slide has multiple blocks and stacks of colored squares, each representing different aspects of work. This is complemented by text describing work architecture and optimization.
Technology and Digital Transformation
Professional Services
Outlines an analytical approach to work architecture in the context of talent optimization. Can be used for discussions on role analysis and organizational design.
Work Architecture, Talent Optimization, Analysis
false
Technology and Digital Transformation
Professional Services
Header Horizontal
Deloitte
Add to my slides
Remove from favorites
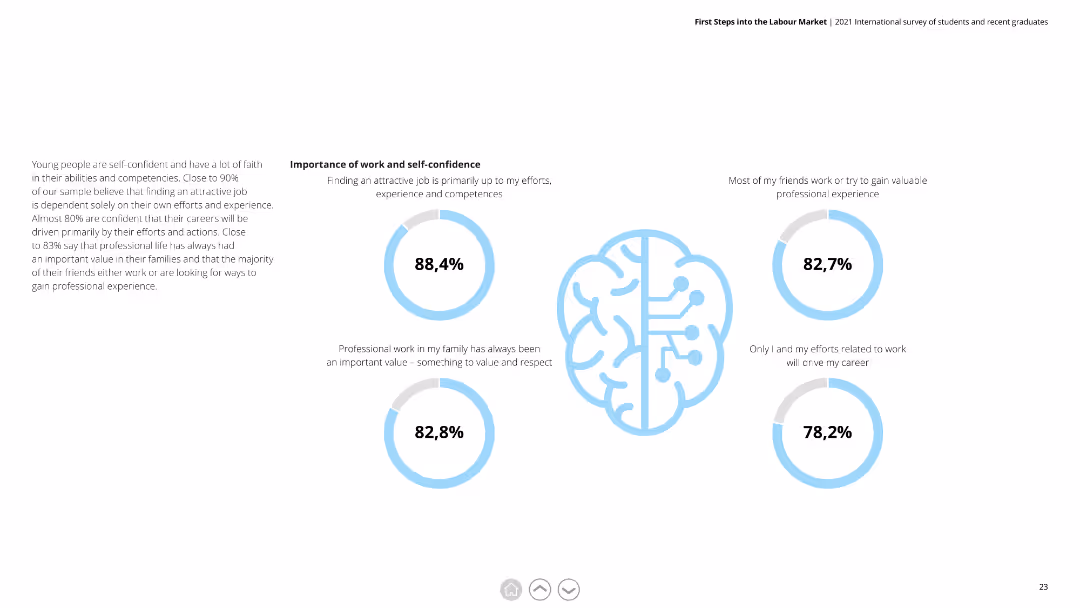
Circular diagrams showing percentages related to the importance of work and self-confidence among respondents.
Market Analysis and Trends
Professional Services
Illustrates the high level of confidence respondents have in their ability to find attractive jobs and the value they place on professional work.
Work Importance, Self-Confidence, Professional Work, Jobs, Respondents
false
Market Analysis and Trends
Professional Services
Multiple Chart
Deloitte
Add to my slides
Remove from favorites
The slide showcases a bar graph with strategies being adopted post-pandemic, ranging from enclosed to open workspaces. Darker bars indicate a greater number of spaces, lighter bars represent fewer spaces, and a yellow line signifies uncertainty.
Strategic Planning
Professional Services
Strategic workplace adaptations are outlined, suggesting a focus on collaboration and flexibility. The chart reflects corporate strategic planning in response to changing work patterns.
Work Models, Strategic Planning, Collaboration, Workplace Design, Pandemic Response
false
Strategic Planning
Professional Services
Single Chart
EY
Add to my slides
Remove from favorites
Image-focused slide with a professional woman holding a tablet, with smaller pie chart graphics indicating statistical data on employment trends.
Strategic Planning
Professional Services
A visual narrative reflecting modern work trends, emphasizing the shift towards portfolio careers and diversified employment strategies as predicted by HR professionals.
Work Trends, Mobility, Careers, HR, Diversification
false
Strategic Planning
Professional Services
Mixed Chart
PwC/Strategy&
Add to my slides
Remove from favorites
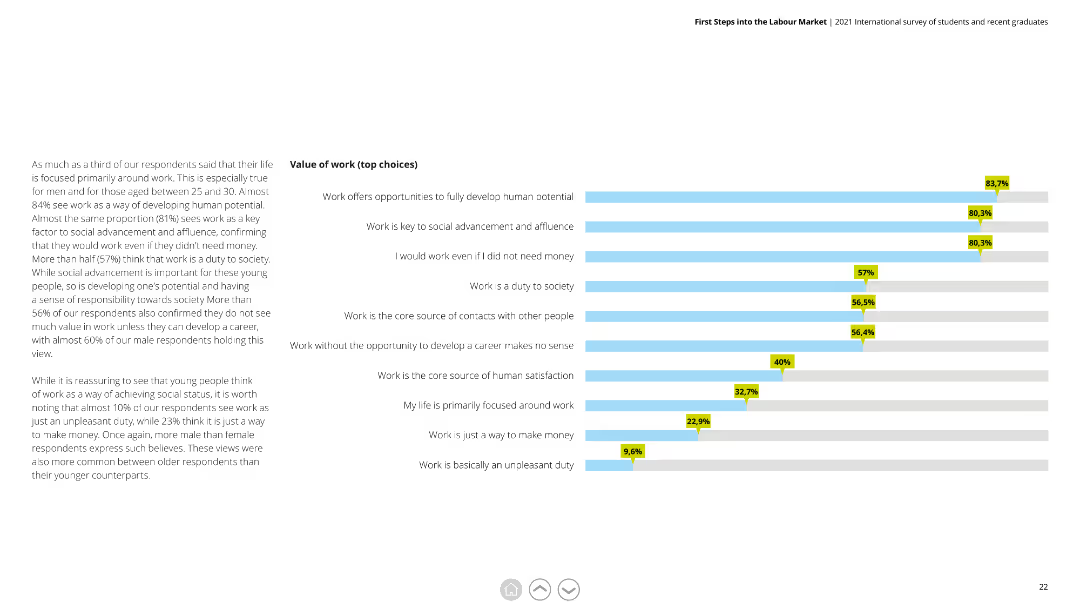
A horizontal bar chart (bar chart) showing top choices for the value of work, with bars for each option and percentage labels.
Market Analysis and Trends
Professional Services
Analyzes what respondents value most about work, highlighting aspects like human potential development and social advancement.
Work Value, Choices, Human Potential, Social Advancement, Respondents
false
Market Analysis and Trends
Professional Services
Mixed Chart
Deloitte
Add to my slides
Remove from favorites
The slide contains a column chart showing the importance of various aspects like family, work, hobbies, and exercise to Gen Zs and Millennials. It uses a clear layout with balanced text and visual elements.
Human Resources and Talent Management
Professional Services
This slide emphasizes the importance of work in the identity of Gen Zs and Millennials while highlighting the paramount importance of achieving work/life balance. It presents data on what aspects are most important to their sense of identity.
Work identity, balance, Gen Z, Millennials, importance
false
Human Resources and Talent Management
Professional Services
Mixed Chart
Deloitte
Add to my slides
Remove from favorites
Text and visual indicators (percentage gaps, agreement bars) showing divergence in views between employees and employers on work preferences.
Human Resources and Talent Management
Professional Services
This slide highlights the differences in perceptions between employees and employers regarding new work preferences, including hybrid work, flexibility, travel, and productivity.
Work preferences, divergence, employee, employer, hybrid work, flexibility, percentage gaps
false
Human Resources and Talent Management
Professional Services
Multiple Chart
EY
Add to my slides
Remove from favorites
Text dominant layout with small pie charts in red and grey tones. There's a distinct contrast between the 'Orange World' text section and statistical data side.
Strategic Planning
Professional Services
The slide explores the move towards a more autonomous, fragmented network of operations, highlighting changes in employment structures and the rise of freelance work.
Work, Autonomy, Freelance, Employment, Opportunities
false
Strategic Planning
Professional Services
Mixed Chart
PwC/Strategy&
Add to my slides
Remove from favorites
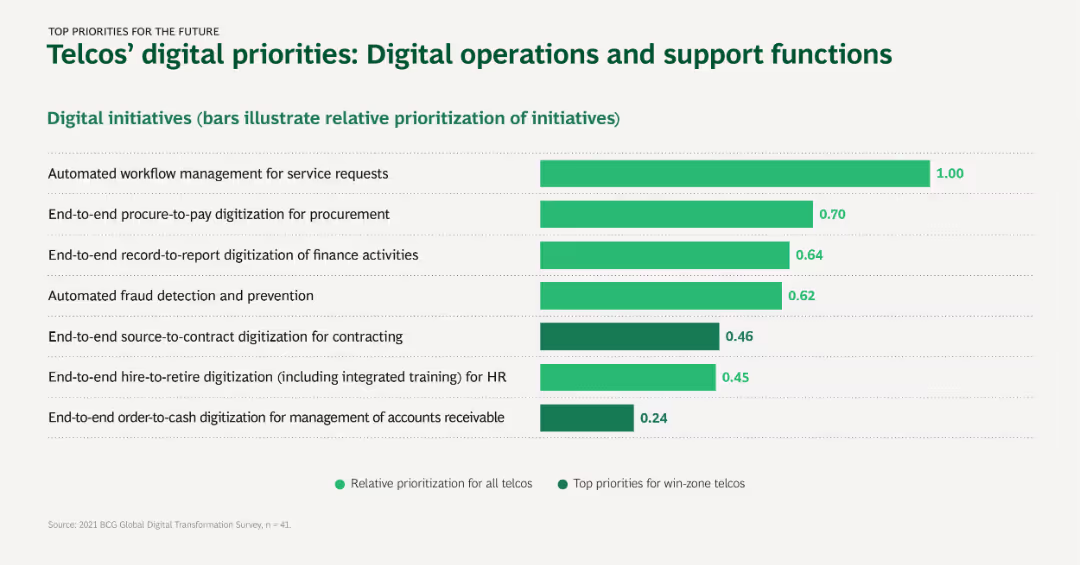
Horizontal bar chart depicting digital initiatives for improving operations and support functions, with bars showing relative prioritization and top priorities.
Operational Efficiency
Telecommunications
This slide showcases the key digital initiatives for telcos in enhancing operational efficiency and support functions, such as workflow management and fraud detection.
Workflow management, Procurement, Fraud detection, Digitization, Operational efficiency
false
Operational Efficiency
Telecommunications
Single Chart
BCG
Add to my slides
Remove from favorites
The slide features pie charts on global gender data and U.S. race/ethnicity, with captions and percentages. It is clean with a balanced mix of text and visuals.
Human Resources and Talent Management
Financial Services
Details the gender and racial composition of the workforce, providing insights into the diversity and inclusion efforts of the company.
Workforce Composition, Gender Data, Race/Ethnicity, Diversity, Inclusion
false
Human Resources and Talent Management
Financial Services
Multiple Chart
JP Morgan
Add to my slides
Remove from favorites
Previous
Next
You don't have any favorites yet.
Please wait loading your favorites slides...
Create a FREE account to continue browsing
Receive Instant Access to 1,000+ slides from companies like McKinsey, Google, and Goldman Sachs
First Name
Last Name
Email
Password
I agree to all
Terms & Privacy Policy
Thank you! Your submission has been received!
Oops! Something went wrong while submitting the form.
Have an account?
Sign in
Upgrade to PRO to Save slides
Advanced Search and Filters
Access to 15,000+ slides
Access to Category Pages
Save/Bookmark Slides
PowerPoint Template Library
Pick a Plan
MONTHLY
$12/month
Billed every month, Cancel anytime.
YEARLY
$9/year
Billed $108 annually, Cancel anytime.
Checkout for $12/month
Checkout for $108/yr
Secured by Stripe | AES-256 bit encryption