My Account
My Slides
Search by Category
Templates
View All Templates
Download Template Slides
Leave Feedback
Login
Logout
Get Started
Browse all Slides
Browse all Slides
Create a FREE Account
Instant access to 1,000+ real slides from top companies like McKinsey, BCG, Goldman Sachs, Google and many more!
First Name
Last Name
Email
Password
I agree to all
Terms & Privacy Policy
Thank you! Your submission has been received!
Oops! Something went wrong while submitting the form.
Have an account?
Sign in
Spark Your Next Big Idea with New Presentation Templates
VIEW ALL Templates
Welcome,
Welcome
PRO
Show Featured Only
Checkbox 8
Companies
Mckinsey
Bain
BCG
EY
Deloitte
Accenture
PwC/Strategy&
JP Morgan
Goldman Sachs
Morgan Stanley
Citigroup
Deutsche Bank
Barclays
LEK
KPMG
Kearney
Oliver Wyman
Booz Allen Hamilton
Gartner
IPSOS
Nielsen
Slide type
Text Only
Linear Flow
Vertical Flow
Single Chart
Header Horizontal
Mixed Chart
Header Vertical
Pillar
Multiple Chart
Graphic
Agenda
Title
Table
Framework
Industry
Technology & Software
Artificial Intelligence
Financial Services
Retail & E-commerce
Consumer Goods
Industrial & Manufacturing
Transportation & Logistics
Telecommunications
Real Estate & Construction
Hospitality & Tourism
Professional Services
Education & Training
Media & Entertainment
Agriculture & Food Production
Healthcare & Pharmaceuticals
Environmental Services & Sustainability
Government & Public Sector
Use Case
Mergers and Acquisitions
Performance Metrics and KPIs
Client Case Studies
Competitive Landscape
Corporate Finance and Valuation
Product and Service Analysis
Customer and Market Segmentation
Organizational Structure and Change
Industry Overview
Regulatory and Compliance
Risk Assessment and Management
Investment Analysis
Organizational Structure and Change
Human Resources and Talent Management
Financial Performance
Market Analysis and Trends
Sales and Business Development
Human Resources and Talent Management
Clear all
Thank you! Your submission has been received!
Oops! Something went wrong while submitting the form.
Tag
View slide
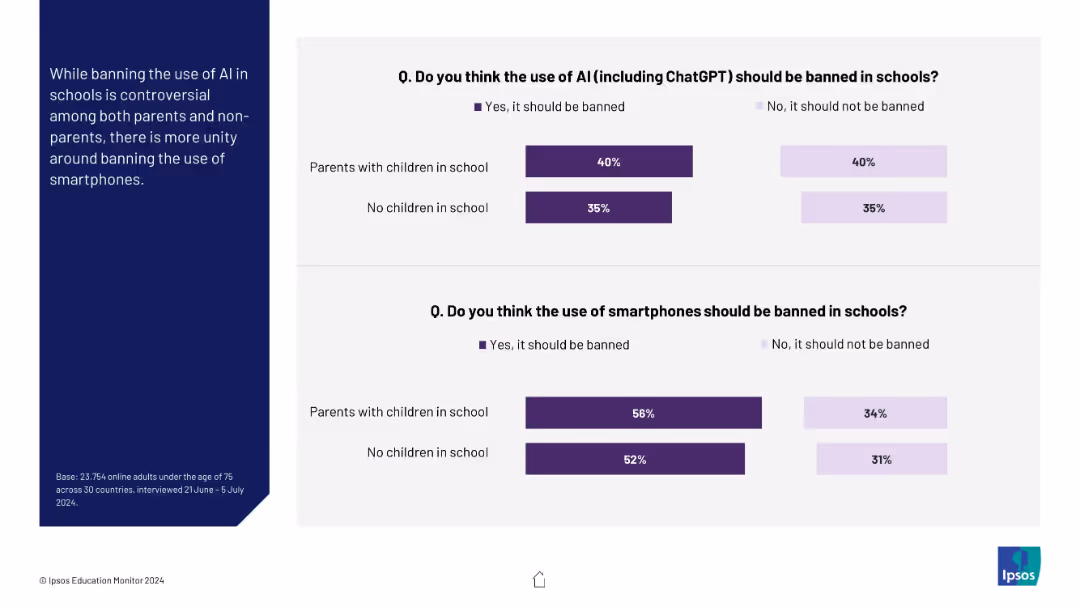
Two stacked bar charts comparing opinions of parents and non-parents on banning AI and smartphones in schools
Regulatory and Compliance
Education & Training
This slide explores attitudes toward banning AI and smartphones in schools. While opinions on banning AI are split, there is broader agreement (especially among parents) on banning smartphones.
AI, smartphones, school policy, parents, regulation, education, bans, ChatGPT
false
Regulatory and Compliance
Education & Training education-and-training
Mixed Chart
IPSOS
View slide
This slide is split into two sections: left side features a quote on a teal background, right side shows a vertical dot plot chart with green bubbles representing percentages over various years.
Technology and Digital Transformation
Technology & Software
Explores how organizations develop AI solutions over time, detailing the percentages of methods adopted based on their experience with AI, from in-house development to purchasing packaged solutions and consuming services. Discusses insights from a sector expert.
AI, solutions, development, in-house, packaged solutions, services
false
Technology and Digital Transformation
Technology & Software technology-and-software
Mixed Chart
Deloitte
View slide
The slide presents a column chart detailing perceptions of France’s support for AI transformation, with a breakdown of responses ranging from very negative to very positive, alongside strategic quotes from industry experts.
Market Analysis and Trends
Technology & Software
Focuses on the business perceptions of France's readiness to support AI advancements, highlighting both the optimism about public initiatives and concerns regarding funding and international competitiveness.
AI, support, France, public initiatives, business perception
false
Market Analysis and Trends
Technology & Software technology-and-software
Mixed Chart
Bain
View slide
Slide with a pie chart and an image of people working on computers. The chart indicates percentages of changes to talent strategies due to generative AI. The image and chart are balanced with descriptive text.
Human Resources and Talent Management
Technology & Software
This slide examines the anticipated impact of generative AI on the workforce and talent strategies. It includes predictions on the timeline for these changes and highlights the need for education on AI capabilities, signaling potential shifts in skill requirements and employment landscapes.
AI, talent, workforce, strategy, education, impact, change, skills
false
Human Resources and Talent Management
Technology & Software technology-and-software
Mixed Chart
Deloitte
View slide
Features a concentric circle diagram highlighting six capability measures of operations maturity essential for integrating AI and new technologies.
Technology and Digital Transformation
Technology & Software
Discusses the foundational to advanced operational capabilities required for embedding AI in business processes, emphasizing data and automation, AI integration, and best practices.
AI, technology, capabilities, automation, integration
false
Technology and Digital Transformation
Technology & Software technology-and-software
Table
Accenture
View slide
Includes pie charts in blue and green shades, detailing AI use in tech and media sectors.
Technology and Digital Transformation
Technology & Software
Analyzes AI use in the technology, media, and telecommunications industries, showing how AI supports various business operations and enhances customer experience, highlighting key areas like cloud pricing and customer feedback analysis.
AI, technology, media, telecommunications, operations
false
Technology and Digital Transformation
Technology & Software technology-and-software
Multiple Chart
Deloitte
View slide
Slide with heavy text and small pie charts detailing trends in acquiring AI talent and solutions. Colorful design.
Technology and Digital Transformation
Technology & Software
Discusses the convergence of technology and talent in AI strategies, highlighting how companies acquire AI capabilities through hiring or technology purchase, stressing the importance of aligning tech and talent strategies.
AI, technology, talent, acquisition, strategy
false
Technology and Digital Transformation
Technology & Software technology-and-software
Multiple Chart
Deloitte
View slide
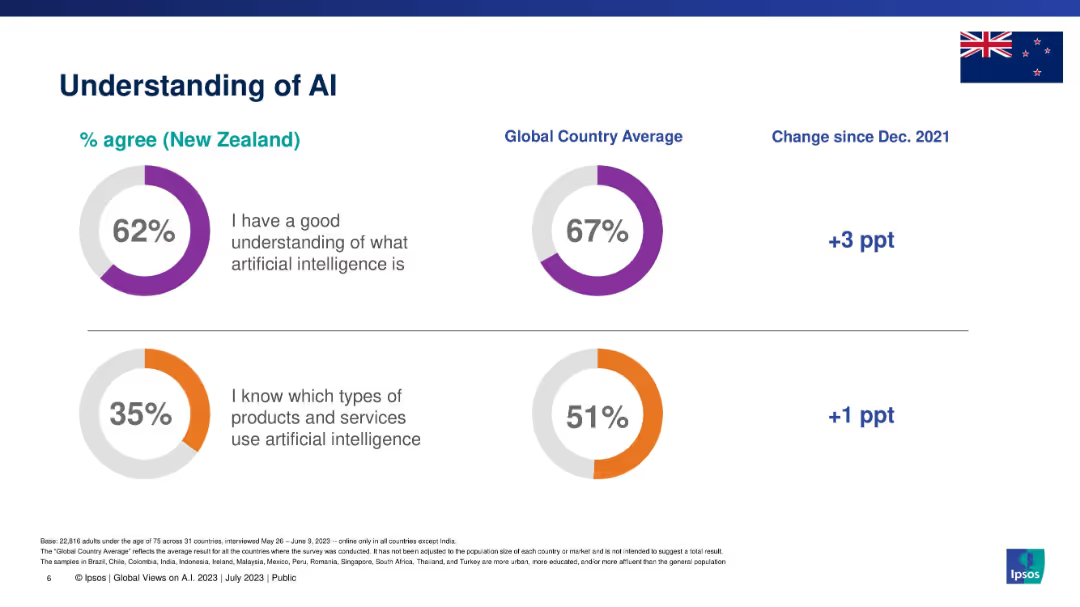
Split section layout with two circular graphs: one on AI understanding, the other on product awareness.
Industry Overview
Artificial Intelligence
This slide presents New Zealanders' understanding of AI in comparison with global averages. It measures agreement with two statements: understanding AI conceptually and knowing which products/services use AI. It also includes percentage changes since 2021.
AI, understanding, awareness, Ipsos, New Zealand, global comparison, knowledge levels
false
Industry Overview
Artificial Intelligence artificial-intelligence
Single Chart
IPSOS
View slide
Bar graphs depict percentages of AI implementation across different underwriting processes. Purple color scheme, vertical bars.
Technology and Digital Transformation
Financial Services
Discusses the roles and penetration of AI in underwriting, indicating areas with room for increased AI implementation.
AI, underwriting, technology, implementation, analytics, data processing, insight
false
Technology and Digital Transformation
Financial Services financial-services
Mixed Chart
Accenture
View slide
This slide is divided into two sections: the top section is labeled "The 'cool' part" with a 70% share of conversations, and the bottom section is labeled "The 'hard' part" with a 30% share of conversations. It includes icons and a purple shaded area representing an iceberg.
Industry Overview
Technology & Software
The slide compares state-of-the-art AI use cases with foundational capabilities, emphasizing that organizations often focus more on advanced use cases while neglecting essential foundational elements.
AI, use cases, technology, foundation, organization
false
Industry Overview
Technology & Software technology-and-software
Header Vertical
Kearney
View slide
Features a large pie chart and supporting text on workforce optimism regarding AI technologies. The design is clean, with green highlights that draw attention to key statistics, facilitating an easy understanding of the data.
Technology and Digital Transformation
Technology & Software
Discusses the positive impact of AI on workforce performance and job satisfaction, noting that 82% of respondents see a beneficial impact. This slide is pertinent for discussions on human resources strategies in tech industries.
AI, workforce optimization, job satisfaction, performance enhancement, human resources, tech industries, impact analysis
false
Technology and Digital Transformation
Technology & Software technology-and-software
Mixed Chart
Deloitte
View slide
Slide features multiple pie charts, and informational text. Predominant colors are blue and grey.
Market Analysis and Trends
Technology & Software
Discusses gaps in harnessing AI to optimize workforce, including leadership roles and investment in AI, contrasting organizations that are advancing in these areas with those that are not.
AI, workforce, leadership, investment, optimization
false
Market Analysis and Trends
Technology & Software technology-and-software
Multiple Chart
Deloitte
View slide
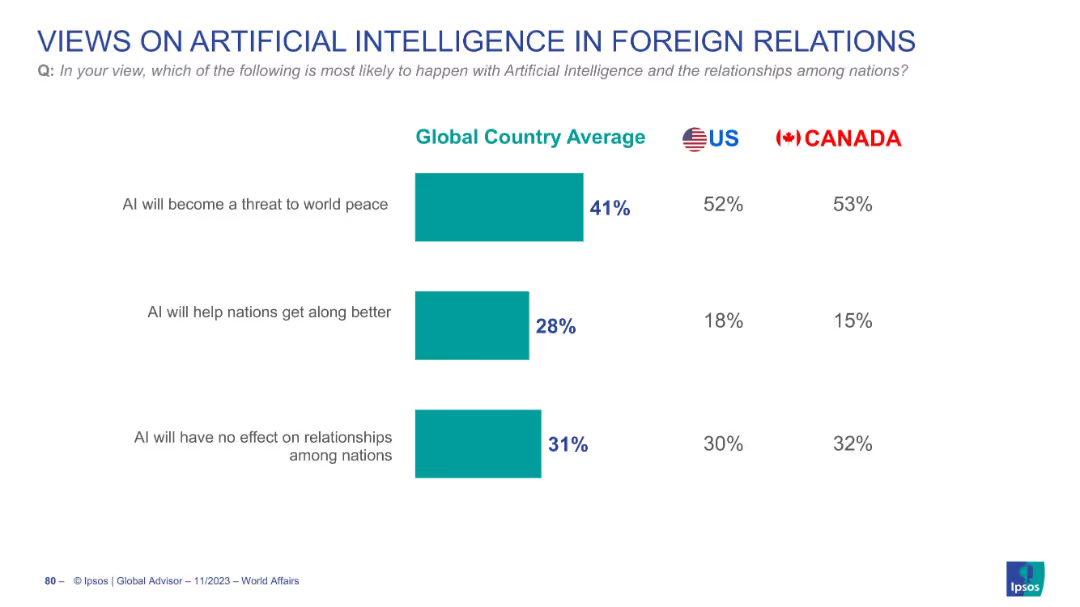
Horizontal bar chart with three response categories and percentages shown for Global Average, US, and Canada
Market Analysis and Trends
Artificial Intelligence
The slide presents survey results about perceptions of AI's effect on foreign relations. Most respondents believe AI will become a threat to world peace, especially in US and Canada.
AI, world peace, foreign relations, public opinion, global survey, US, Canada, Ipsos
false
Market Analysis and Trends
Artificial Intelligence artificial-intelligence
Single Chart
IPSOS
View slide
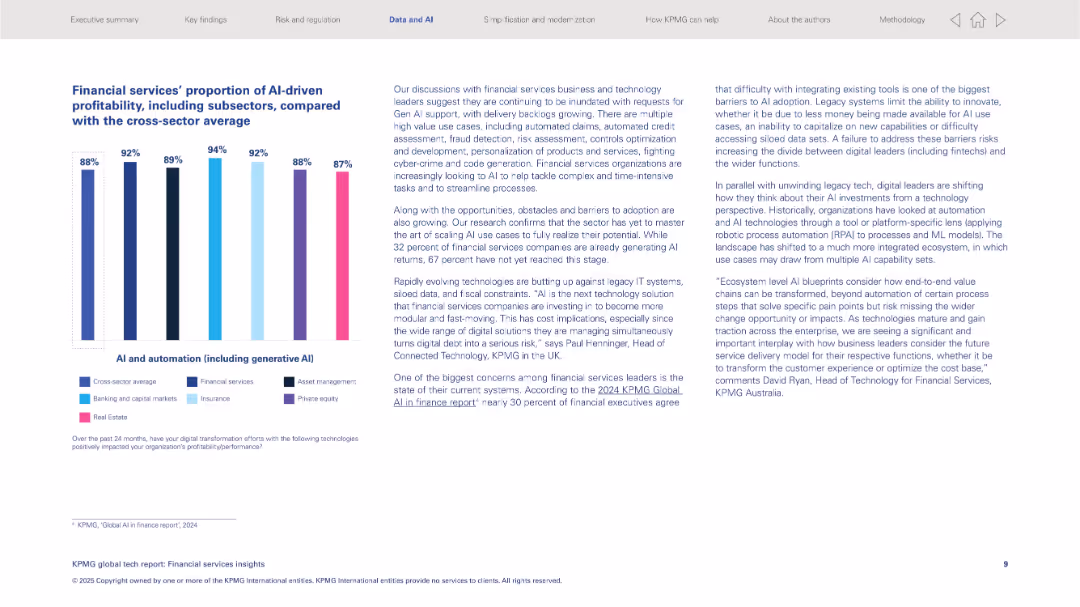
Left: vertical bar chart comparing AI-driven profitability across sectors. Right: detailed paragraph insights.
Technology and Digital Transformation
Financial Services
Presents comparative AI-driven profitability across financial subsectors, noting financial services are advanced but still face challenges with AI scaling. Emphasizes rapid tech evolution and integrated ecosystems as essential to digital leadership.
AI-driven profitability, banking, fintech, tech debt, scaling AI, digital leaders, automation
false
Technology and Digital Transformation
Financial Services financial-services
Mixed Chart
KPMG
View slide
The slide presents infographics and percentages that emphasize the importance of digital enablers. Purple and grey tones are used, creating a clean and organized layout.
Strategic Planning
Technology & Software
Highlights the priorities of High Tech leaders in adopting AI/ML analytics platforms and 5G technology. It presents a case for customer-centric solutions and investment in digital enablers as a step towards innovative, tailored solutions.
AI/ML, 5G, digital enablers, High Tech, customer demand, custom solutions, sensor technologies, end device battery life, low/no code, split rendering
false
Strategic Planning
Technology & Software technology-and-software
Single Chart
Accenture
View slide
Features a flow diagram outlining four strategic steps towards enhancing MRM practices using AI/ML.
Operational Efficiency
Technology & Software
Explores the strategic steps organizations can take to integrate AI/ML into their MRM practices.
AI/ML, MRM, practices, strategy, integration
false
Operational Efficiency
Technology & Software technology-and-software
Linear Flow
PwC/Strategy&
View slide
Diagram illustrating how complex AI/ML models can be made interpretable through certain techniques.
Technology and Digital Transformation
Technology & Software
Explains techniques for making AI/ML models interpretable, aiding in understanding and trust of AI systems.
AI/ML, interpretability, models, techniques
false
Technology and Digital Transformation
Technology & Software technology-and-software
Diagram
PwC/Strategy&
View slide
This slide includes multiple column charts comparing the monthly reach of AM/FM radio versus other music services among different age groups.
Market Analysis and Trends
Media & Entertainment
The slide compares the monthly reach percentages of AM/FM radio to various streaming services, showing the dominance of radio across all age groups in the U.S.
AM/FM radio, audio reach, column chart, age groups, streaming
false
Market Analysis and Trends
Media & Entertainment media-and-entertainment
Mixed Chart
Nielsen
View slide
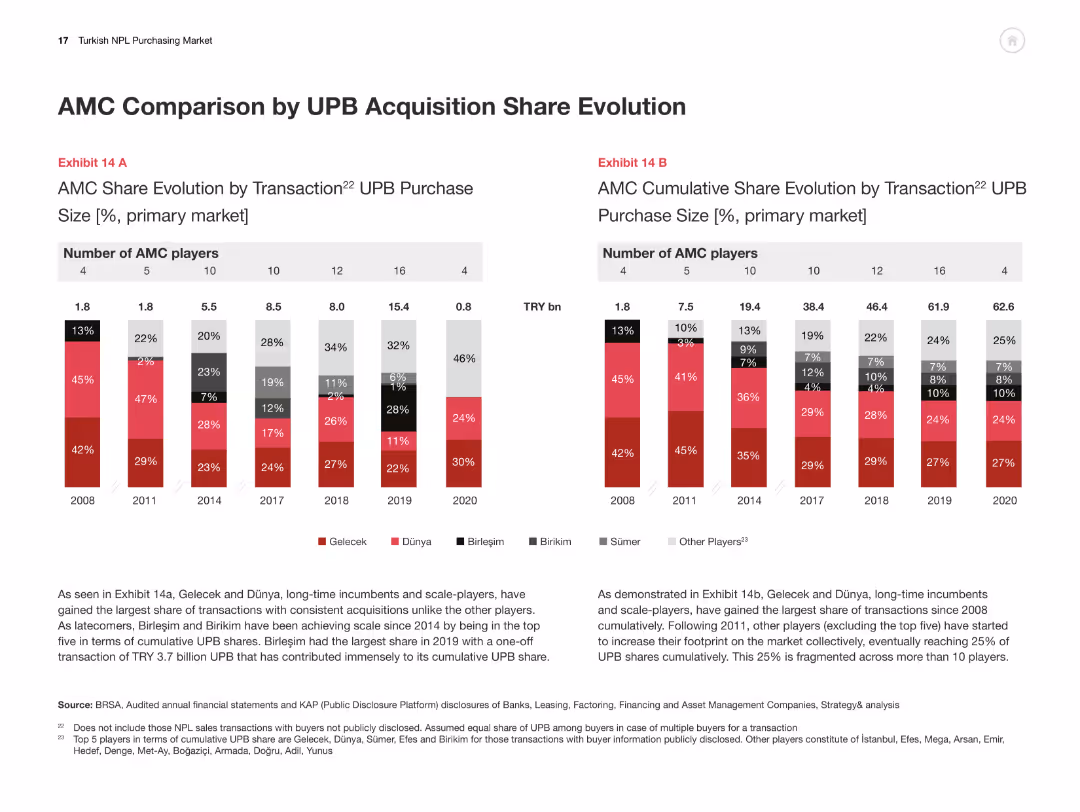
Two bar charts comparing AMC share evolution by transaction size and cumulative share from 2008-2020.
Competitive Landscape
Financial Services
This slide compares AMCs in terms of UPB acquisition share, illustrating market share changes and competitive positioning.
AMC, UPB acquisition, market share, competitive analysis, Turkey
false
Competitive Landscape
Financial Services financial-services
Multiple Chart
PwC/Strategy&
View slide
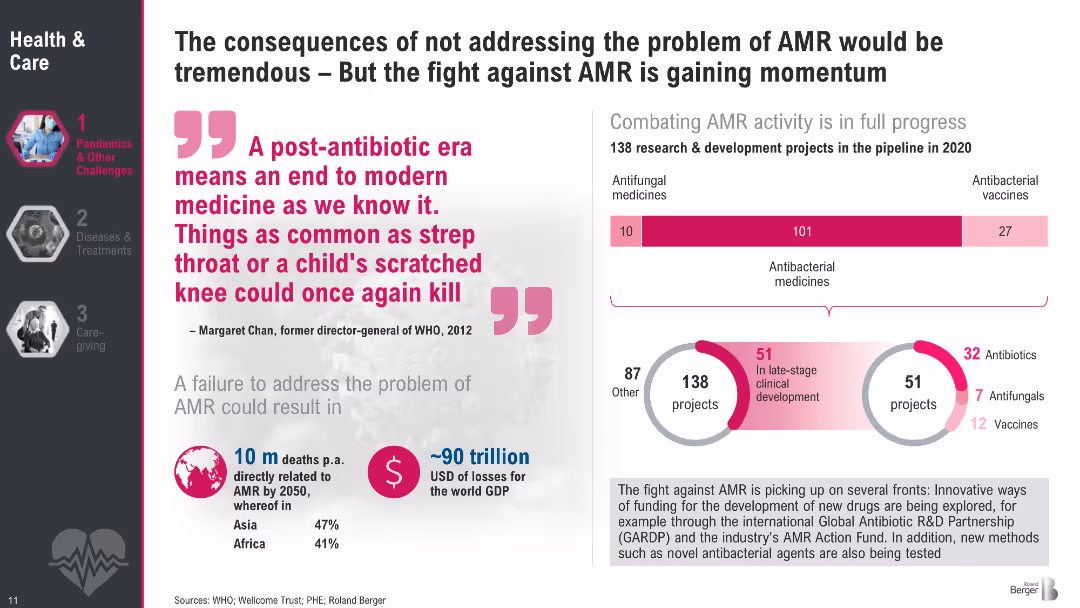
Two-section layout: left side features a large quote and key stats; right side includes two infographics—bar graph and circular breakdown—on AMR R&D activities; uses magenta and gray tones; clean visual hierarchy.
Regulatory and Compliance
Healthcare & Pharmaceuticals
Highlights the grave risks of antimicrobial resistance (AMR), including high death tolls and economic losses if left unaddressed. Emphasizes the growing momentum in R&D, with 138 projects in development. Showcases the breakdown of antifungal, antibacterial, and vaccine initiatives and promotes a sense of urgency around AMR-related healthcare investment and innovation.
AMR, antibiotics, R&D, resistance, global health, WHO, economic loss, vaccines, antibacterial, antifungal
false
Regulatory and Compliance
Healthcare & Pharmaceuticals healthcare-and-pharmaceuticals
Multiple Chart
Roland Berger
View slide
This slide features a four-part breakdown of adaptability metrics, each with an icon and description. There is a balance between text and visual elements, with green highlights for emphasis.
Technology and Digital Transformation
Professional Services
Presents four new metrics developed to assist Adaptable Organizational Network Analysis (AONA) in the professional services sector, highlighting how organizations can measure and improve their adaptability.
AONA, adaptability, metrics, innovation, organization, professional services
false
Technology and Digital Transformation
Professional Services professional-services
Pillar
Deloitte
View slide
Contains comparative column charts showing advisory and underwriting share of wallet, APAC IBCM gross revenues, and key differentiators.
Competitive Landscape
Financial Services
The slide highlights the competitive strengths of the Credit Suisse APAC IBCM franchise, including market share, revenue growth, and key differentiators in the region.
APAC IBCM, Competitive Strengths, Market Share, Revenue Growth, Differentiators
false
Competitive Landscape
Financial Services financial-services
Multiple Chart
Credit Suisse
View slide
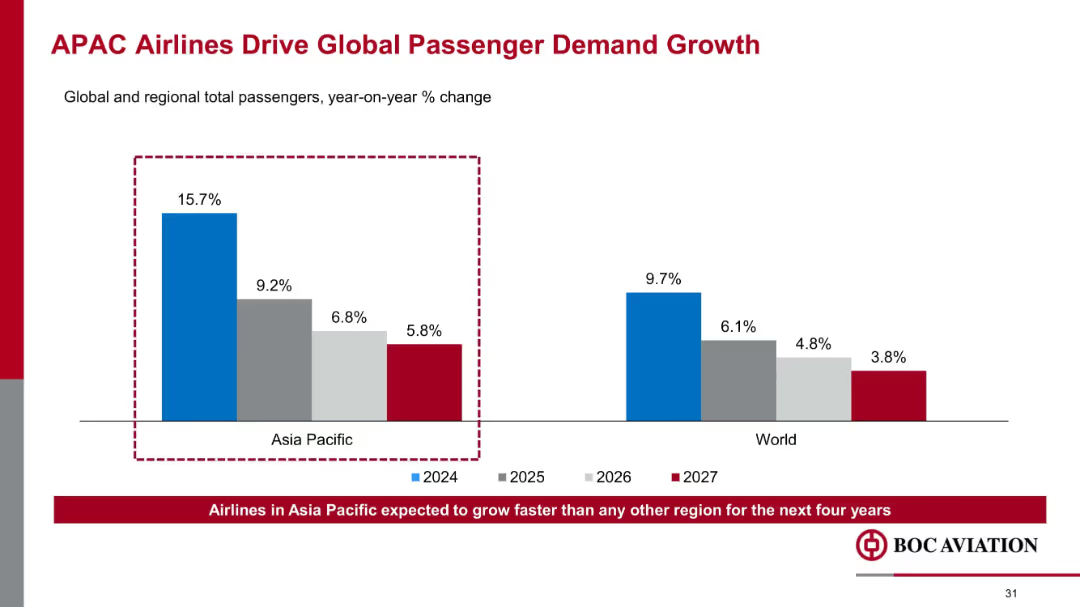
Comparative bar chart; color-coded by year and region; highlight box emphasizes Asia Pacific performance
Market Analysis and Trends
Transportation & Logistics
Projects strong growth in passenger demand across Asia-Pacific through 2027, with 2024 seeing a 15.7% YoY increase. Establishes the region as the primary driver of global air travel growth, reinforcing market opportunity focus.
APAC growth, passenger demand, global air travel, YoY change, aviation trends, Asia Pacific, demand forecast
false
Market Analysis and Trends
Transportation & Logistics transportation-and-logistics
Mixed Chart
Goldman Sachs
View slide
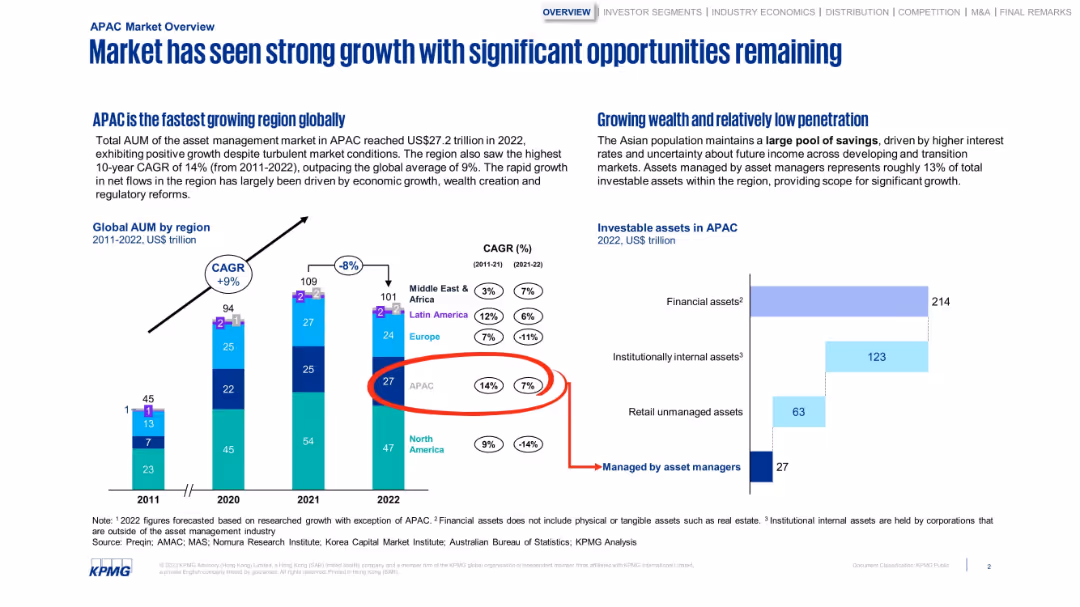
Dual-section layout with bar charts and data callouts. Emphasis on APAC growth and low penetration.
Market Analysis and Trends
Financial Services
Emphasizes the rapid growth of asset management in APAC, noting a high CAGR and wealth accumulation. Includes AUM data by region and shows untapped opportunities due to low penetration by asset managers.
APAC, AUM, market growth, asset managers, penetration, CAGR
false
Market Analysis and Trends
Financial Services financial-services
Multiple Chart
KPMG
View slide
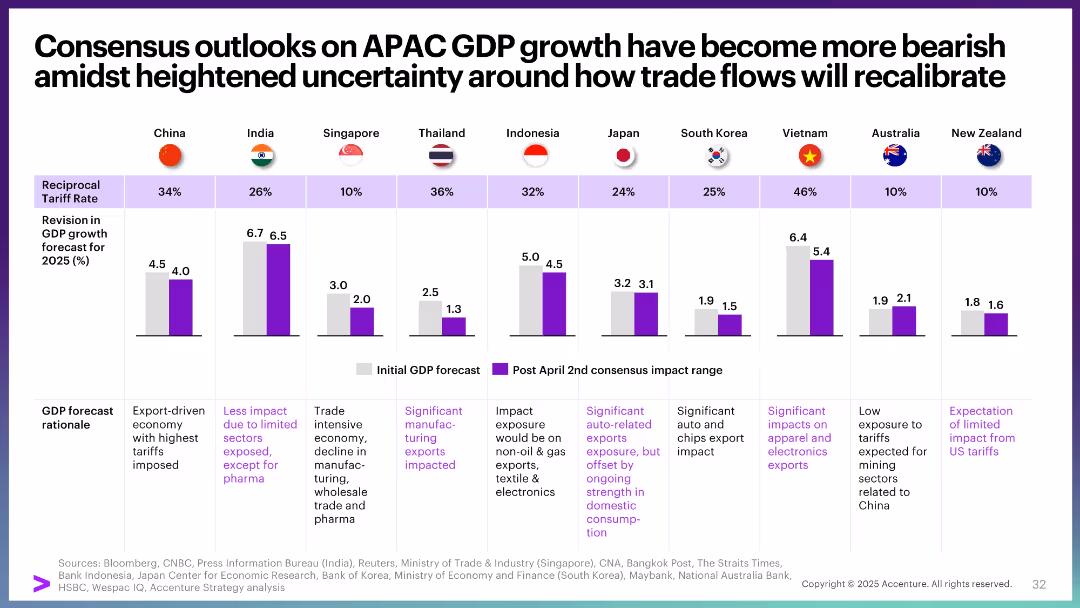
Grid of flags with GDP forecast comparisons and impact rationale. Structured into columns with visual and text elements.
Market Analysis and Trends
Government & Public Sector
This slide presents the revised GDP forecasts for major APAC economies following US tariff impacts. It contrasts initial forecasts with post-April 2nd consensus and includes rationales for impact, ranging from manufacturing dependence to sectoral sensitivities.
APAC, GDP forecast, US tariffs, Asia-Pacific, economic impact, manufacturing, trade
false
Market Analysis and Trends
Government & Public Sector government-and-public-sector
Single Chart
Accenture
View slide
The slide features a mix of tables, column charts, and text boxes to present IPO data across APAC markets.
Market Analysis and Trends
Financial Services
It highlights the number and proceeds of IPOs in the APAC region, focusing on the strong performance of Greater China and South Korea.
APAC, Greater China, South Korea, IPOs, performance
false
Market Analysis and Trends
Financial Services financial-services
Multiple Chart
EY
View slide
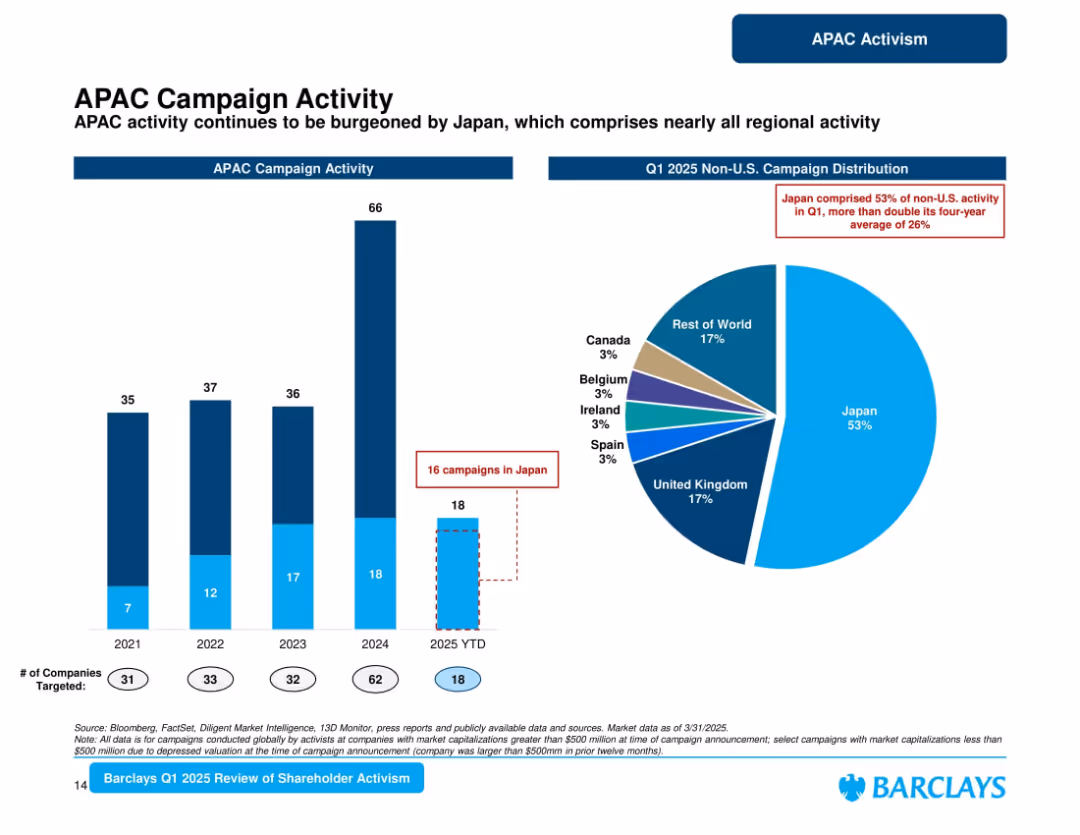
Vertical bar chart and a pie chart. Divided into left (historical trend) and right (regional share) panels. Clear blue/white style.
Market Analysis and Trends
Financial Services
Shows APAC shareholder activism from 2021 to 2025 YTD, emphasizing Japan’s growing dominance in Q1 2025, accounting for 53% of regional activity—double the four-year average. Includes campaign count and regional share pie chart.
APAC, Japan, Activism, Campaigns, Trends, Regional, Shareholder, 2025, Barclays
false
Market Analysis and Trends
Financial Services financial-services
Multiple Chart
Barclays
View slide
The slide displays a column chart showing the global foodservice market outlook by geography from 2019 to 2027, including CAGR and YoY growth rates.
Market Analysis and Trends
Hospitality & Tourism
The content predicts APAC leading market growth in foodservice, reversing a negative trend, with detailed market size and growth rates by region from 2019 to 2027.
APAC, Market Growth, Foodservice, CAGR, YoY
false
Market Analysis and Trends
Hospitality & Tourism hospitality-and-tourism
Mixed Chart
Deloitte
View slide
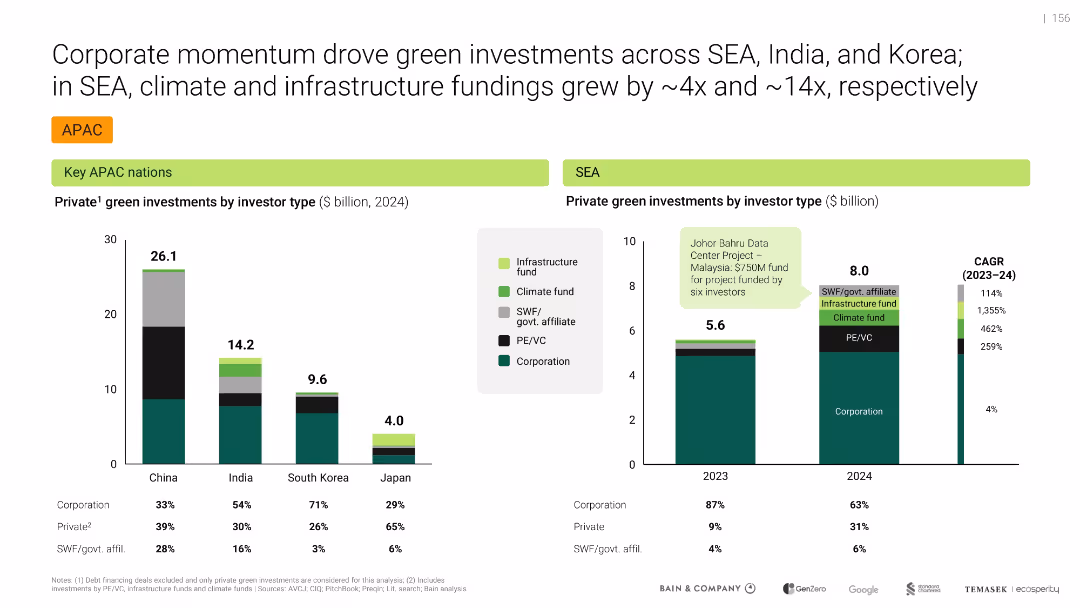
Dual bar charts for APAC and SEA investment by investor type, color-coded with clear segmentation
Investment Analysis
Environmental Services & Sustainability
Analyzes investor-type contributions to private green investments across key APAC nations and SEA. Corporate investors led in 2023; in 2024, private and government-related investors showed sharp growth, particularly in Malaysia.
APAC, SEA, Investor types, Green funding, Corporations, PE/VC, Climate funds, Infrastructure, Growth, Malaysia
false
Investment Analysis
Environmental Services & Sustainability environmental-services-and-sustainability
Multiple Chart
Bain
View slide
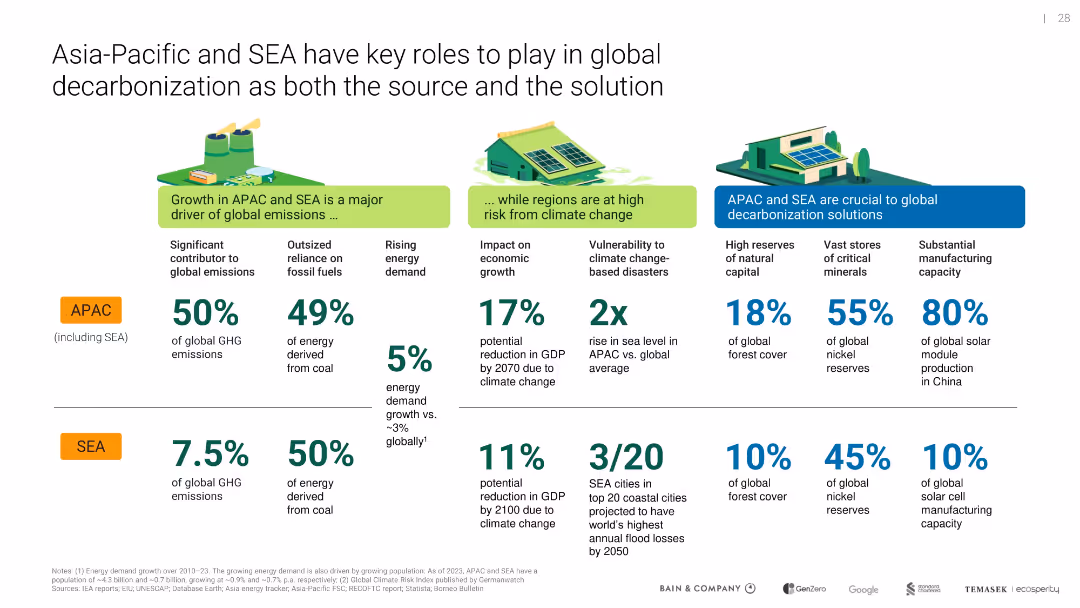
Horizontal comparison with three segments and APAC/SEA stats; infographic style with numerical emphasis and icons
Market Analysis and Trends
Environmental Services & Sustainability
Emphasizes the dual role of APAC and SEA as major GHG contributors and vital actors in decarbonization due to natural resources, critical minerals, and production capacity, reinforcing their pivotal role in the global climate agenda.
APAC, SEA, emissions, forest cover, decarbonization, minerals, solar
false
Market Analysis and Trends
Environmental Services & Sustainability environmental-services-and-sustainability
Table
Bain
Previous
Loading...
Hold On!
We are searching in our database
If nothing, comes up, please try different filters!
Column Chart
Heatmap
Chevron
Org Chart
Infographic
Callouts
Timeline
List
Graphic
Picture
Process Flow
Diagram
Paragraph
Map
Table
Framework
Subtitle
Takeaway Box
Icon
Other Chart
Radar Chart
Waterfall Chart
Mekko Chart
Pie Chart
Scatter Plot
Line Chart
Bar chart
Bullet points
Create a FREE account to continue browsing
Receive Instant Access to 1,000+ slides from companies like McKinsey, Google, and Goldman Sachs
First Name
Last Name
Email
Password
I agree to all
Terms & Privacy Policy
Thank you! Your submission has been received!
Oops! Something went wrong while submitting the form.
Have an account?
Sign in
Upgrade to PRO to Save slides
Advanced Search and Filters
Access to 15,000+ slides
Access to Category Pages
Save/Bookmark Slides
PowerPoint Template Library
Pick a Plan
MONTHLY
$12/month
Billed every month, Cancel anytime.
YEARLY
$9/year
Billed $108 annually, Cancel anytime.
Checkout for $12/month
Checkout for $108/yr
Secured by Stripe | AES-256 bit encryption