My Account
My Slides
Search by Category
Templates
View All Templates
Download Template Slides
Leave Feedback
Login
Logout
Get Started
Browse all Slides
Browse all Slides
Create a FREE Account
Instant access to 1,000+ real slides from top companies like McKinsey, BCG, Goldman Sachs, Google and many more!
First Name
Last Name
Email
Password
I agree to all
Terms & Privacy Policy
Thank you! Your submission has been received!
Oops! Something went wrong while submitting the form.
Have an account?
Sign in
Spark Your Next Big Idea with New Presentation Templates
VIEW ALL Templates
Welcome,
Welcome
PRO
Show Featured Only
Checkbox 8
Companies
Mckinsey
Bain
BCG
EY
Deloitte
Accenture
PwC/Strategy&
JP Morgan
Goldman Sachs
Morgan Stanley
Citigroup
Deutsche Bank
Barclays
LEK
KPMG
Kearney
Oliver Wyman
Booz Allen Hamilton
Gartner
IPSOS
Nielsen
Slide type
Text Only
Linear Flow
Vertical Flow
Single Chart
Header Horizontal
Mixed Chart
Header Vertical
Pillar
Multiple Chart
Graphic
Agenda
Title
Table
Framework
Industry
Technology & Software
Artificial Intelligence
Financial Services
Retail & E-commerce
Consumer Goods
Industrial & Manufacturing
Transportation & Logistics
Telecommunications
Real Estate & Construction
Hospitality & Tourism
Professional Services
Education & Training
Media & Entertainment
Agriculture & Food Production
Healthcare & Pharmaceuticals
Environmental Services & Sustainability
Government & Public Sector
Use Case
Mergers and Acquisitions
Performance Metrics and KPIs
Client Case Studies
Competitive Landscape
Corporate Finance and Valuation
Product and Service Analysis
Customer and Market Segmentation
Organizational Structure and Change
Industry Overview
Regulatory and Compliance
Risk Assessment and Management
Investment Analysis
Organizational Structure and Change
Human Resources and Talent Management
Financial Performance
Market Analysis and Trends
Sales and Business Development
Human Resources and Talent Management
Clear all
Thank you! Your submission has been received!
Oops! Something went wrong while submitting the form.
Tag
View slide
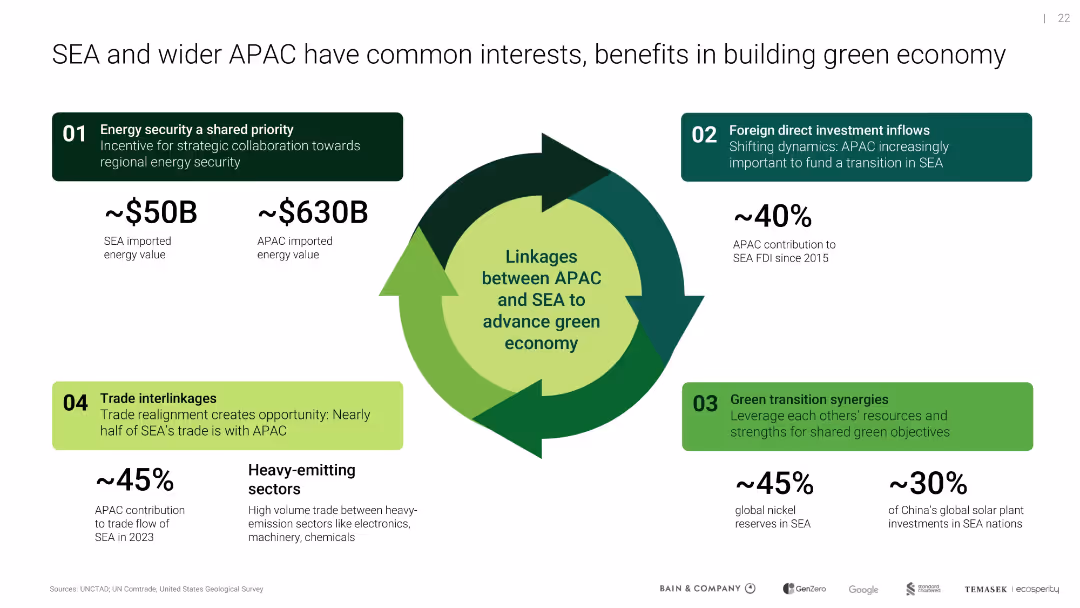
Circular flow arrow graphic surrounded by data-rich quadrants with trade, FDI, and sector stats
Industry Overview
Environmental Services & Sustainability
Demonstrates how APAC-SEA cooperation can support energy security, investment, and transition synergies via trade, FDI, and shared resources in high-emitting sectors.
APAC, SEA, green economy, energy security, FDI, trade interlinkages
false
Industry Overview
Environmental Services & Sustainability environmental-services-and-sustainability
Vertical Flow
Bain
View slide
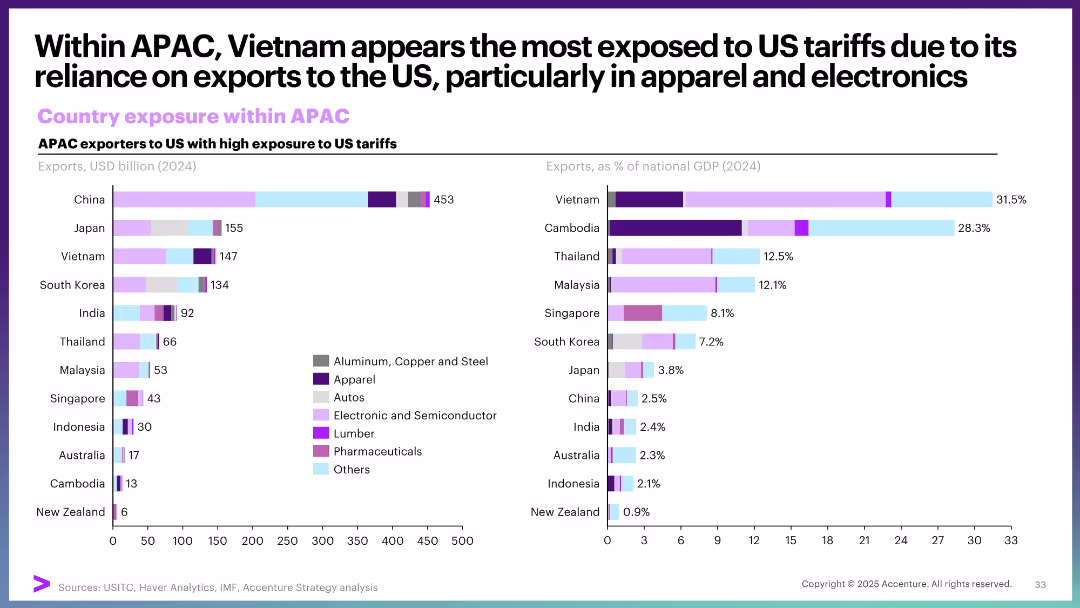
Dual bar charts: exports to US in USD and as % of GDP. Color-coded by sector with clear visual comparison.
Market Analysis and Trends
Government & Public Sector
This slide analyzes APAC countries' exposure to US tariffs, both by export volume and GDP percentage. Vietnam and Cambodia are highlighted as highly exposed due to heavy apparel and electronics exports. The chart also breaks down key sectors by color.
APAC, US tariffs, exports, exposure, apparel, electronics, GDP share, Vietnam
false
Market Analysis and Trends
Government & Public Sector government-and-public-sector
Multiple Chart
Accenture
View slide
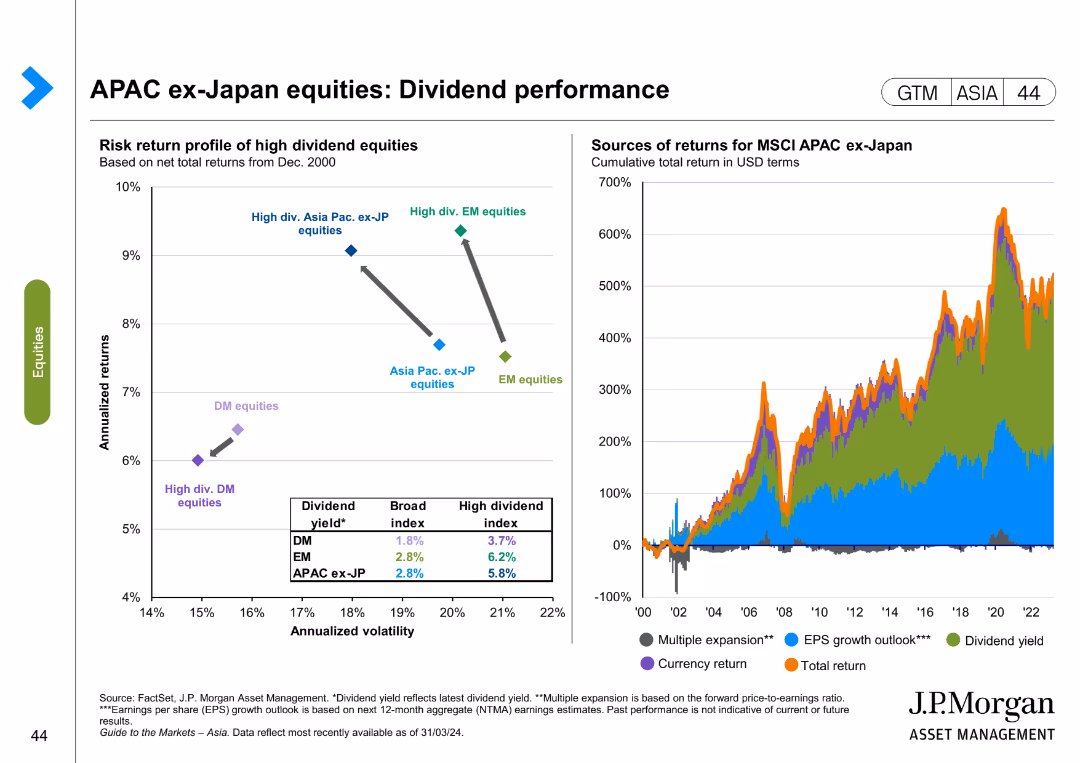
The slide includes a scatter plot showing the risk-return profile of high dividend equities and a line chart depicting sources of returns for MSCI APAC ex-Japan equities. Color coding is used to differentiate data points.
Financial Performance
Financial Services
This slide evaluates dividend performance for APAC ex-Japan equities, comparing risk-return profiles and sources of returns. It is useful for financial performance analysis and investment strategy development.
APAC, dividend performance, risk-return, equities, MSCI, financial analysis, investment strategy
false
Financial Performance
Financial Services financial-services
Multiple Chart
JP Morgan
View slide
The slide features two column charts. The first chart shows the number of companies yielding greater than 4% by yield level, and the second chart shows the number of companies yielding greater than 4% by region.
Financial Performance
Financial Services
The slide details dividend sources for APAC ex-Japan equities, highlighting the number of companies with high dividend yields by yield level and region. It is used for financial performance evaluation and dividend strategy planning.
APAC, dividend sources, yield level, region, financial performance, dividend strategy
false
Financial Performance
Financial Services financial-services
Multiple Chart
JP Morgan
View slide
The slide contains two column charts. The first chart shows earnings growth by market for 2024 and 2025, and the second chart shows earnings growth by sector. Each chart uses color coding to differentiate between years.
Financial Performance
Financial Services
This slide provides earnings growth expectations for APAC ex-Japan equities, broken down by market and sector, for the years 2024 and 2025. It is used for financial performance analysis and investment planning.
APAC, earnings growth, market, sector, 2024, 2025, financial performance, investment planning
false
Financial Performance
Financial Services financial-services
Multiple Chart
JP Morgan
View slide
The slide includes two line charts. The left chart shows earnings trends for domestic vs. export-oriented companies, while the right chart shows growth in nominal exports and earnings per share.
Market Analysis and Trends
Financial Services
This slide explores earnings trends by revenue source and exports for APAC ex-Japan equities, providing insights into market behavior and performance based on revenue derivation.
APAC, earnings trend, revenue source, exports, market behavior, performance, domestic, export-oriented
false
Market Analysis and Trends
Financial Services financial-services
Multiple Chart
JP Morgan
View slide
This slide features a mix of text and a column chart. The text is on the left side, while the chart is on the right. The chart highlights various performance optimization approaches by percentage.
Investment Analysis
Financial Services
The slide discusses different approaches APAC family offices plan to implement to optimize performance and measure success, focusing on ESG factors and sustainability initiatives.
APAC, family offices, performance, optimization, ESG
false
Investment Analysis
Financial Services financial-services
Mixed Chart
EY
View slide
The slide includes four sections with textual and visual content discussing wealth and regulation, digital transformation, risk and reputation, and strategy.
Market Analysis and Trends
Financial Services
The slide examines key concerns for family offices in the APAC region, highlighting trends in regulation, digital transformation, risk management, and strategy.
APAC, family offices, regulation, digital transformation, risk management
false
Market Analysis and Trends
Financial Services financial-services
Multiple Chart
EY
View slide
Bar chart showing percentages of APAC family offices' regulatory concerns, accompanied by text explanation.
Regulatory and Compliance
Financial Services
Discusses the concerns of APAC family offices about various regulatory issues, highlighting significant concern percentages.
APAC, family offices, regulatory issues, transparency, compliance
false
Regulatory and Compliance
Financial Services financial-services
Mixed Chart
EY
View slide
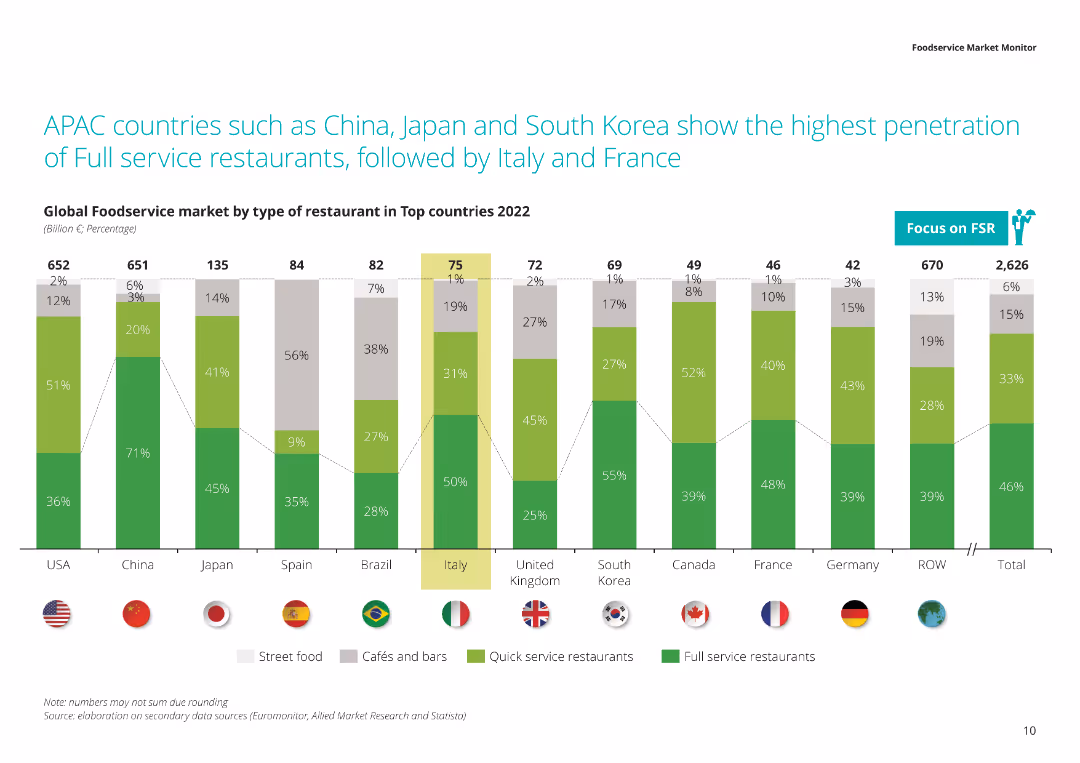
The slide shows a column chart with data on the market penetration of different types of restaurants (street food, cafés, quick service, full service) across top countries in 2022. Each country is represented by a flag.
Market Analysis and Trends
Hospitality & Tourism
This slide highlights the dominance of full-service restaurants in APAC countries compared to other regions. It shows the type of restaurants prevalent in each country and their market shares in 2022.
APAC, full service restaurants, market penetration, restaurant types, 2022 data
false
Market Analysis and Trends
Hospitality & Tourism hospitality-and-tourism
Single Chart
Deloitte
View slide
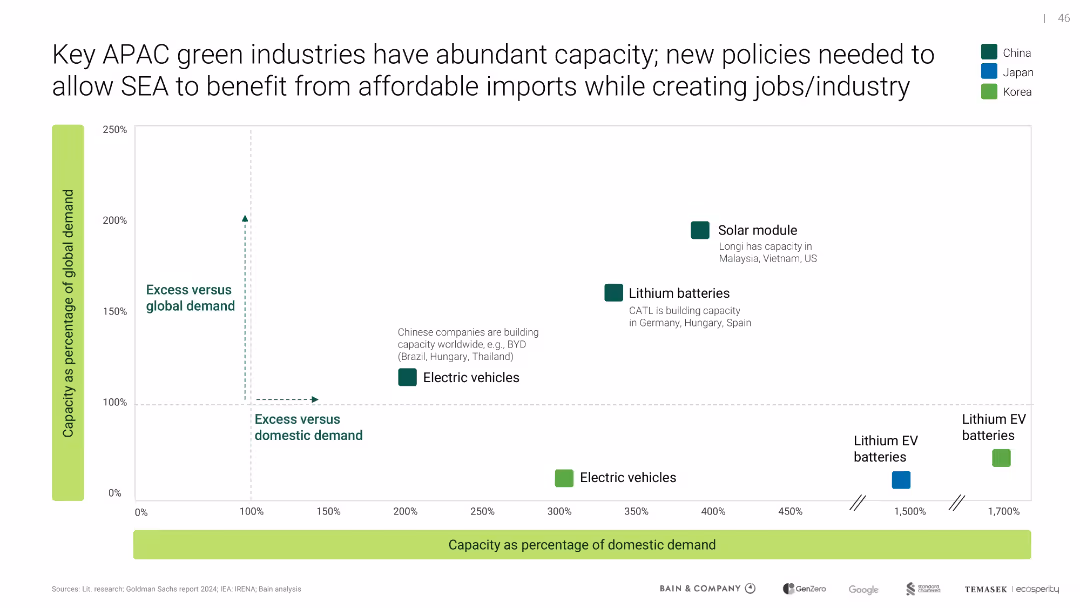
Scatter plot showing domestic vs global demand; color-coded by country (China, Japan, Korea)
Market Analysis and Trends
Artificial Intelligence
APAC countries, particularly China, have significant excess capacity in green sectors like solar modules and EV batteries. The slide argues for policy support to allow SEA to import green tech and build local industry.
APAC, green industry, overcapacity, imports, SEA, EV, solar, policy
false
Market Analysis and Trends
Artificial Intelligence artificial-intelligence
Single Chart
Bain
View slide
The slide includes multiple column charts showing the adoption of fundamental systems like EMR, billing, patient administration, and ancillary systems in hospitals across different APAC markets.
Technology and Digital Transformation
Healthcare & Pharmaceuticals
The slide details the penetration of back-end IT systems in hospitals across the APAC region, highlighting the adoption rates of electronic medical records, billing, patient administration, and ancillary systems, with Japan leading in EMR adoption.
APAC, hospitals, IT systems, EMR, billing
false
Technology and Digital Transformation
Healthcare & Pharmaceuticals healthcare-and-pharmaceuticals
Multiple Chart
LEK
View slide
The slide includes two column charts depicting revenue and asset growth in CHF bn, with notable CAGR and net new assets figures. Bullet points detail the record growth and strategic initiatives driving organic expansion in the APAC region.
Market Analysis and Trends
Financial Services
The slide showcases the strong organic growth in APAC wealth management, highlighting significant revenue and asset increases. It discusses the strategic initiatives and market conditions that have contributed to this record growth, emphasizing the region's potential.
APAC, organic growth, wealth management, revenue, assets
false
Market Analysis and Trends
Financial Services financial-services
Multiple Chart
Credit Suisse
View slide
The slide features column charts that present the adoption rates of patient-facing digital solutions in hospitals across various APAC markets, including patient information systems and remote patient monitoring.
Technology and Digital Transformation
Healthcare & Pharmaceuticals
The slide illustrates the usage of patient-facing digital solutions in hospitals across APAC, focusing on systems like patient information and booking, in-room patient systems, specialty care consultations, and remote patient monitoring.
APAC, patient-facing, digital solutions, hospitals, adoption
false
Technology and Digital Transformation
Healthcare & Pharmaceuticals healthcare-and-pharmaceuticals
Multiple Chart
LEK
View slide
The left side of the slide features a scatter plot showing the relationship between price-to-book ratio and subsequent returns, while the right side shows a line chart comparing APAC ex-Japan equity performance to the USD index.
Market Analysis and Trends
Financial Services
The slide analyzes performance drivers for APAC ex-Japan equities, focusing on price-to-book ratios and their impact on returns, as well as the relationship between equity performance and the USD index.
APAC, performance drivers, price-to-book, returns, equity performance, USD index, market analysis
false
Market Analysis and Trends
Financial Services financial-services
Multiple Chart
JP Morgan
View slide
The slide shows column charts representing the adoption rates of physician support systems, such as medication management systems and clinical decision support tools, in hospitals across different APAC regions.
Technology and Digital Transformation
Healthcare & Pharmaceuticals
The slide focuses on the adoption of physician support systems like medication management systems, clinical workflow management systems, and clinical decision support tools across hospitals in APAC, noting lower adoption rates in Japan.
APAC, physician support, hospitals, adoption, digital tools
false
Technology and Digital Transformation
Healthcare & Pharmaceuticals healthcare-and-pharmaceuticals
Multiple Chart
LEK
View slide
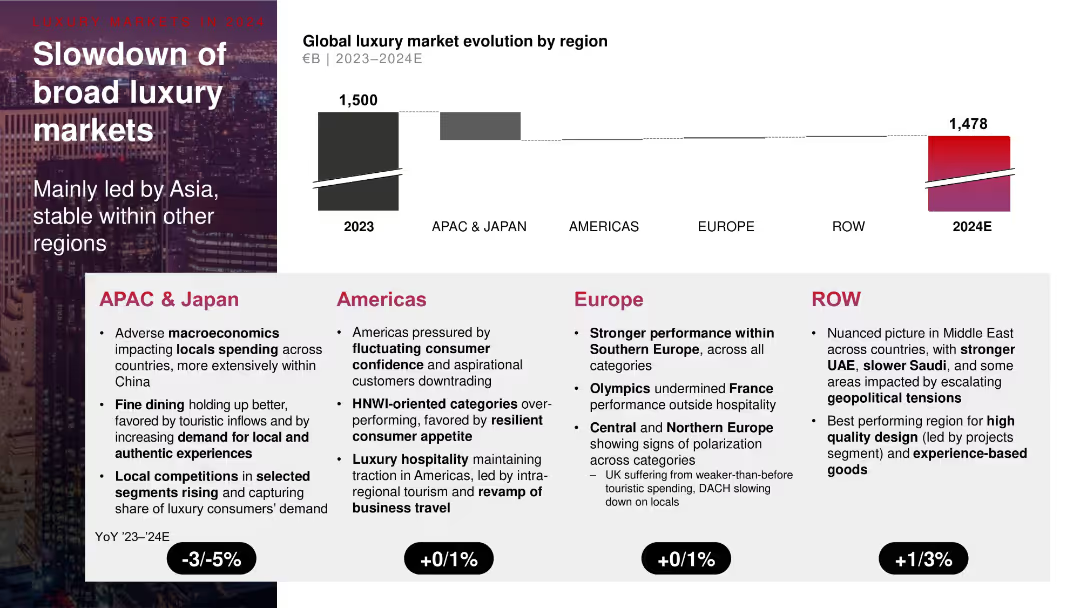
Regional breakdown of luxury market changes with a bar chart (2023 vs 2024E) and bullet insights by region. Uses black, grey, and red for contrast.
Market Analysis and Trends
Consumer Goods
Highlights geographical divergence in luxury market performance, with APAC & Japan declining due to macroeconomic pressure, while Europe and the Americas remain stable. ROW (Rest of World) sees modest growth. Bullet points describe local drivers, including tourism, consumer confidence, and regional tensions.
APAC, regional trends, luxury markets, macroeconomics, tourism, consumer confidence
false
Market Analysis and Trends
Consumer Goods consumer-goods
Mixed Chart
Bain
View slide
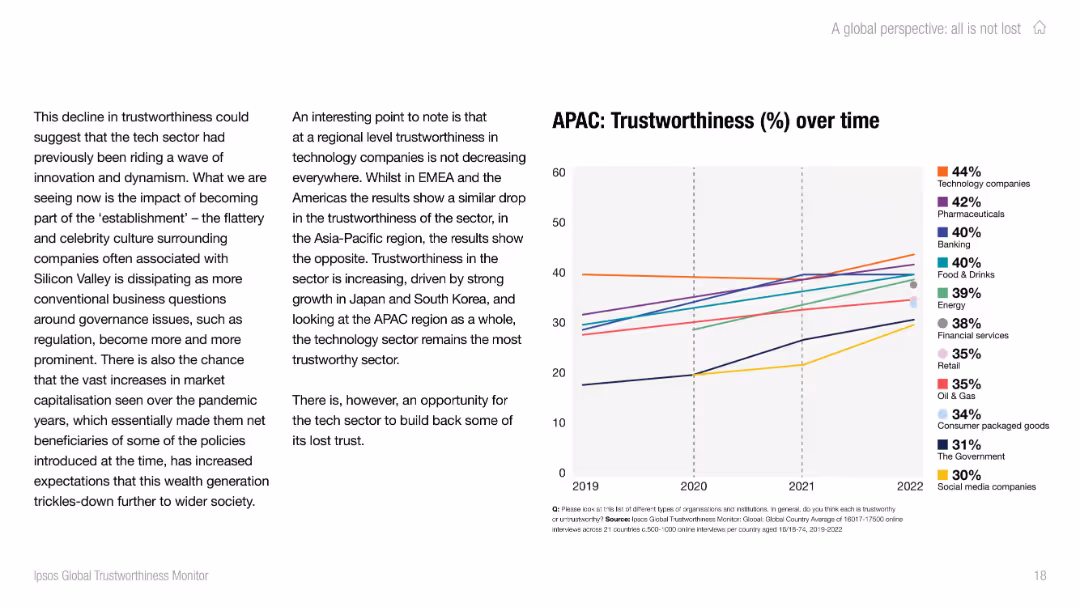
Left side presents a detailed narrative about trust trends in APAC; right side shows a line graph of trust in sectors from 2019–2022.
Market Analysis and Trends
Technology & Software
This slide focuses on the Asia-Pacific region, showing increased trust in technology companies despite global downturns. Strong growth is also observed in pharmaceuticals and food sectors. The visual highlights sector-specific trust improvements, especially in Japan and South Korea.
APAC, regional trends, trust growth, technology trust, sector comparison, public opinion, Asia data
false
Market Analysis and Trends
Technology & Software technology-and-software
Mixed Chart
IPSOS
View slide
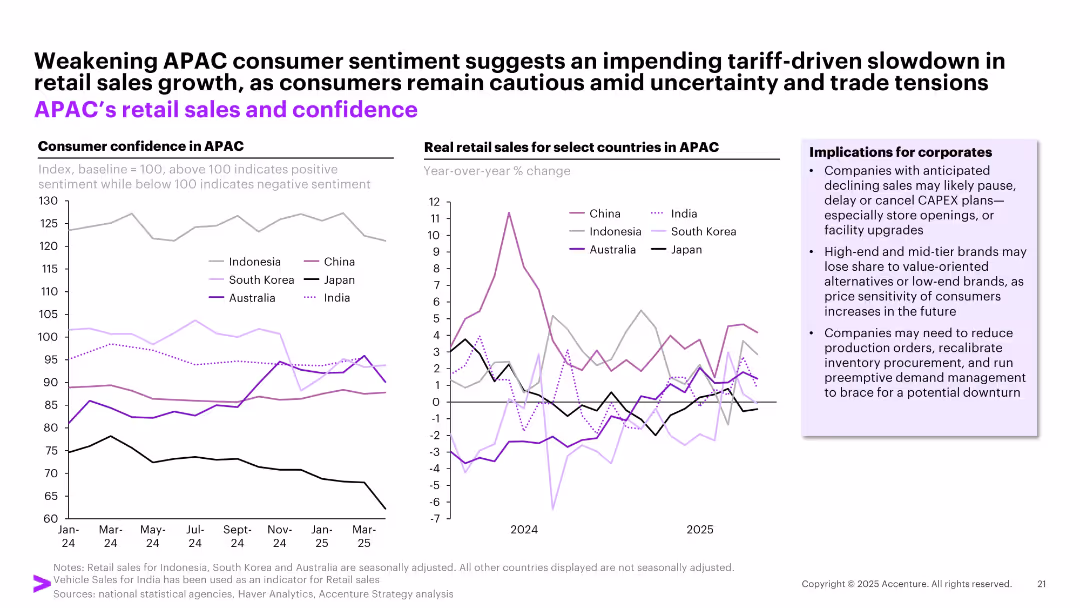
Dual-panel chart format showing consumer confidence (left) and retail sales trends (right) for select APAC countries; annotated lines and color-coded countries; side panel with corporate insights.
Market Analysis and Trends
Retail & E-commerce
This slide highlights weak consumer confidence in APAC countries, especially South Korea and China, alongside a mixed outlook for retail sales. Companies are advised to prepare for tariff-driven slowdowns and adopt flexible CAPEX and pricing strategies to address rising price sensitivity.
APAC, retail trends, consumer confidence, tariffs, inventory planning, CAPEX
false
Market Analysis and Trends
Retail & E-commerce retail-and-e-commerce
Multiple Chart
Accenture
View slide
Column chart showing the percentage of organizations currently using API management solutions, those planning to use, and those with no plans. The majority currently use API management solutions.
Operational Efficiency
Technology & Software
The slide presents statistics on the adoption of API management solutions by organizations, indicating that over two-thirds currently use these solutions, with a smaller percentage planning to adopt them in the future.
API management, adoption, organizations, statistics
false
Operational Efficiency
Technology & Software technology-and-software
Single Chart
Gartner
View slide
Column chart showing the demand projection for various API-related roles over the next 12 months, including Software Developer, DevOps Engineer, and API Engineer, with a breakdown of current roles and future plans.
Human Resources and Talent Management
Technology & Software
The slide analyzes the demand for different API-related roles in software development, indicating which roles are likely to see increased hiring and which ones will remain stable or decrease.
API roles, demand, software development, projections
false
Human Resources and Talent Management
Technology & Software technology-and-software
Single Chart
Gartner
View slide
Column chart detailing the usage plans for different types of APIs, including Internal APIs, APIs by third parties, Private APIs, and Public APIs. The chart segments into categories: No plans, Plan to use, and Currently use.
Operational Efficiency
Technology & Software
The slide presents a survey result showing the adoption rates and future plans for various types of APIs, highlighting the predominance of internal APIs and public/external APIs.
APIs, survey, internal, external, adoption
false
Operational Efficiency
Technology & Software technology-and-software
Multiple Chart
Gartner
View slide
Three-column layout comparing AR/VR impact over time, with isometric graphics of AR and VR, and a maturity level bar.
Market Analysis and Trends
Technology & Software
Discusses AR and VR trends with a timeline from near to long-term impact, focusing on the transition from enterprise to consumer use and enhanced interaction in the real world.
AR, VR, trends, enterprise, consumer, interaction, timeline
false
Market Analysis and Trends
Technology & Software technology-and-software
Header Vertical
McKinsey
View slide
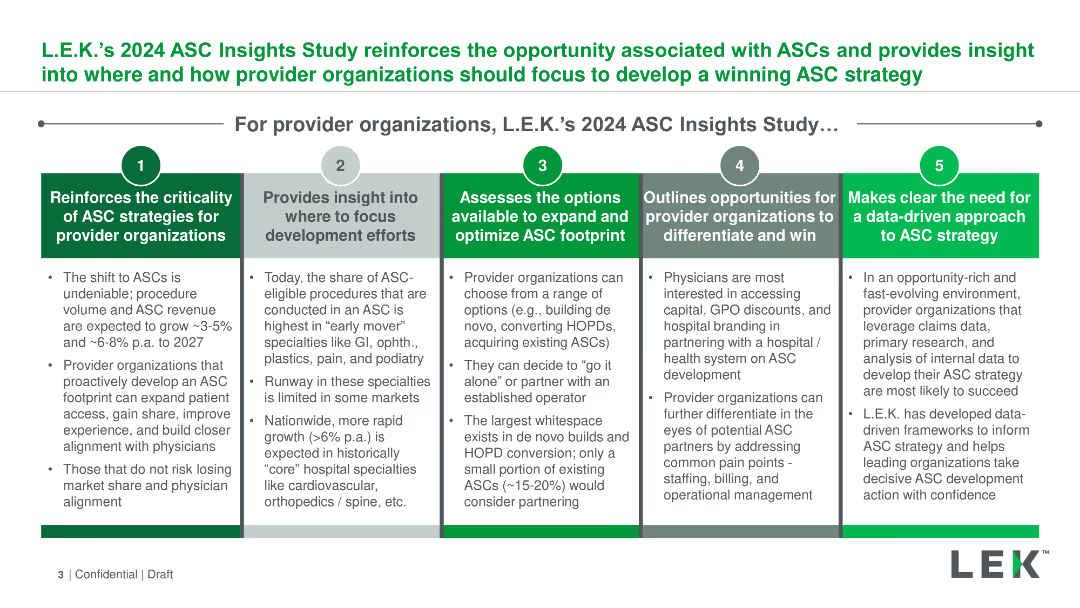
The slide has a multi-column layout with five sections highlighting key insights from the ASC Insights Study, including strategies for provider organizations and development efforts.
Strategic Planning
Healthcare & Pharmaceuticals
This slide provides a comprehensive overview of the ASC Insights Study, emphasizing the strategic importance for provider organizations to focus on ASC strategies.
ASC Insights, provider organizations, strategic planning, development, focus areas
false
Strategic Planning
Healthcare & Pharmaceuticals healthcare-and-pharmaceuticals
Linear Flow
LEK
View slide
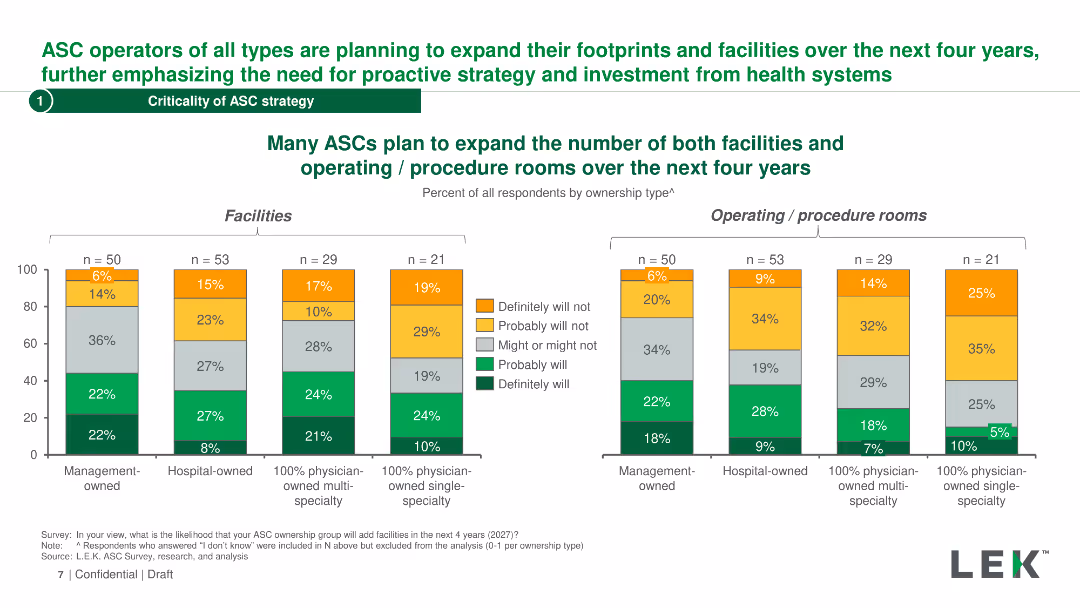
The slide contains two bar charts showing the expansion plans for ASCs in terms of facilities and operating rooms over the next four years, segmented by ownership type.
Strategic Planning
Healthcare & Pharmaceuticals
It highlights the future expansion plans for ASCs, detailing the expected growth in facilities and operating rooms, based on ownership types.
ASC expansion, facilities, operating rooms, ownership type, growth plans
false
Strategic Planning
Healthcare & Pharmaceuticals healthcare-and-pharmaceuticals
Multiple Chart
LEK
View slide
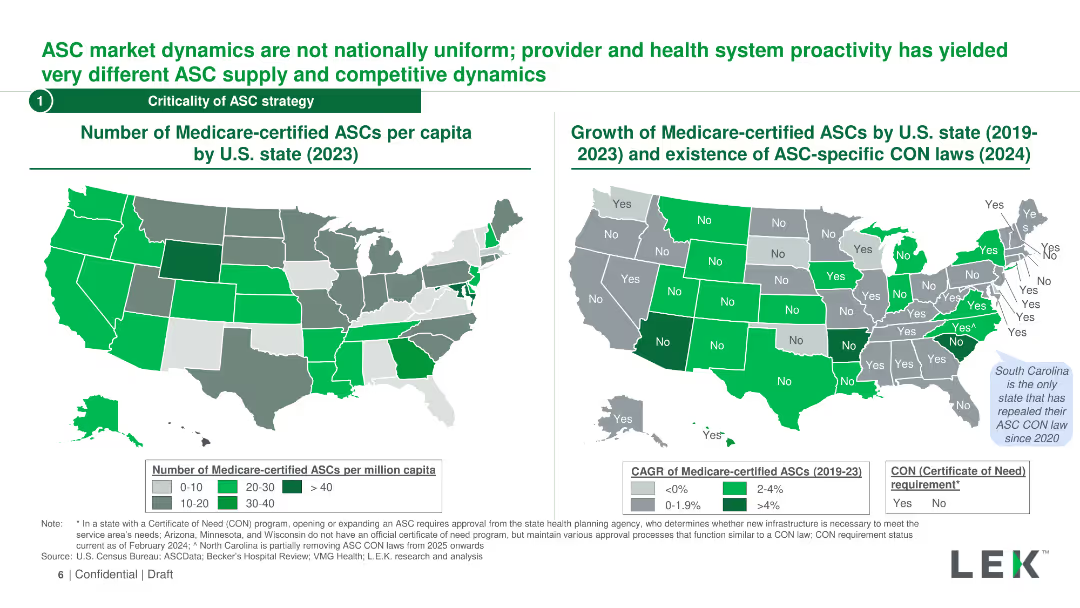
The slide displays two maps of the US, one showing the number of Medicare-certified ASCs per capita by state, and the other showing growth and CON laws from 2019-2023.
Market Analysis and Trends
Healthcare & Pharmaceuticals
This slide explores the geographic dynamics of the ASC market in the US, including the number of Medicare-certified ASCs per capita and the impact of CON laws on growth.
ASC market dynamics, Medicare, certified ASCs, CON laws, state comparisons
false
Market Analysis and Trends
Healthcare & Pharmaceuticals healthcare-and-pharmaceuticals
Graphic
LEK
View slide
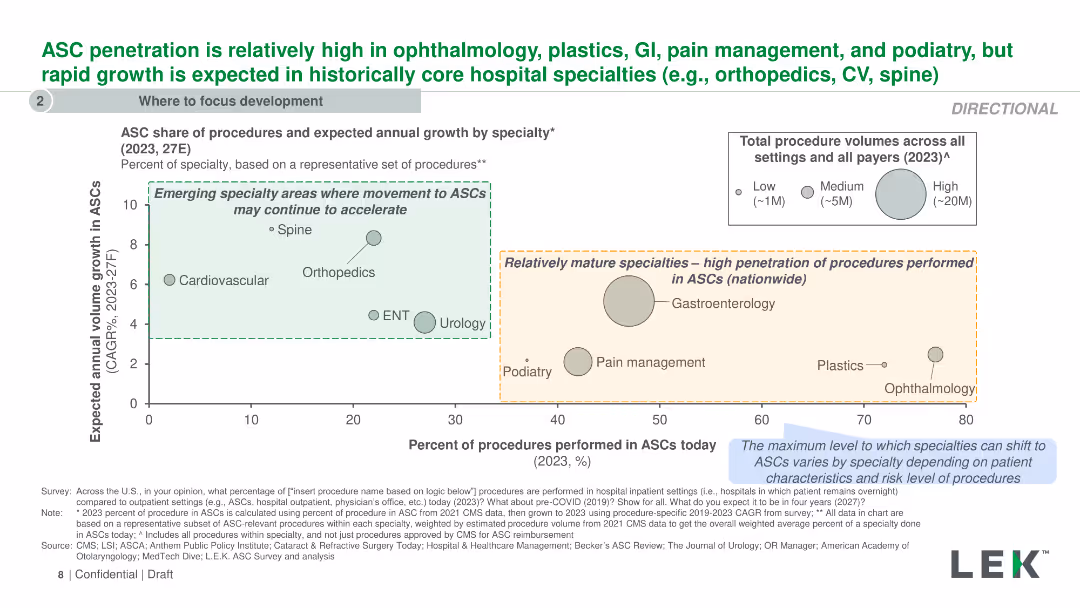
The slide features a scatter plot showing the expected annual volume growth of ASC procedures by specialty, alongside the current share of procedures performed in ASCs.
Market Analysis and Trends
Healthcare & Pharmaceuticals
This slide provides an analysis of ASC penetration across various medical specialties, projecting future growth and current procedure shares.
ASC penetration, specialty growth, procedure volume, medical specialties
false
Market Analysis and Trends
Healthcare & Pharmaceuticals healthcare-and-pharmaceuticals
Single Chart
LEK
View slide
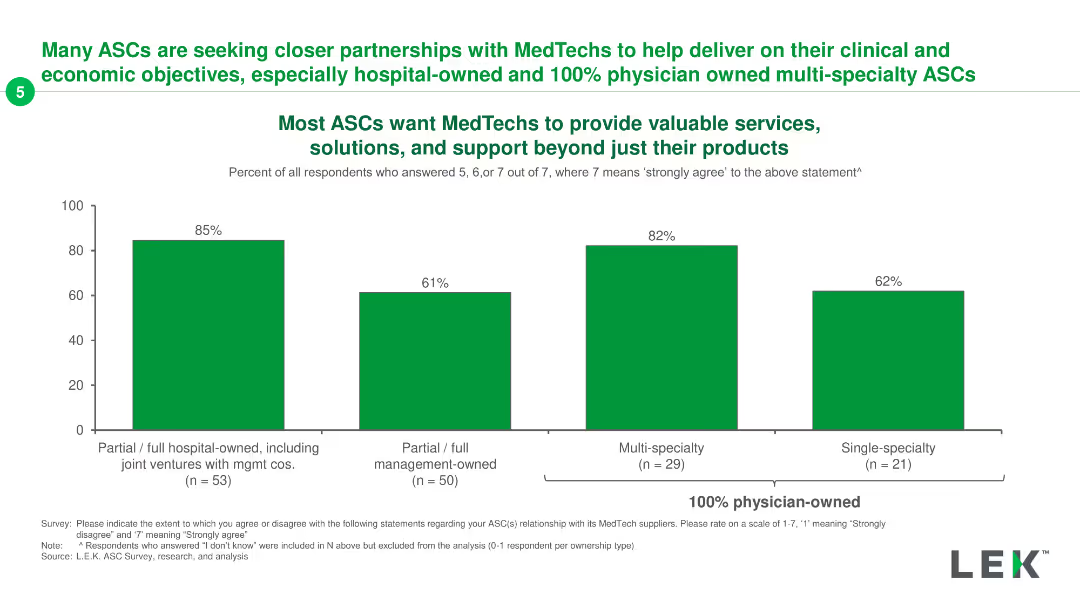
The slide includes three column charts showing ASC preferences for MedTech partnerships across different ownership models.
Client Case Studies
Healthcare & Pharmaceuticals
It presents survey data indicating the desire of ASCs for MedTech partnerships, highlighting the importance of services and support beyond just products.
ASC, MedTech, partnerships, services, survey
false
Client Case Studies
Healthcare & Pharmaceuticals healthcare-and-pharmaceuticals
Single Chart
LEK
View slide
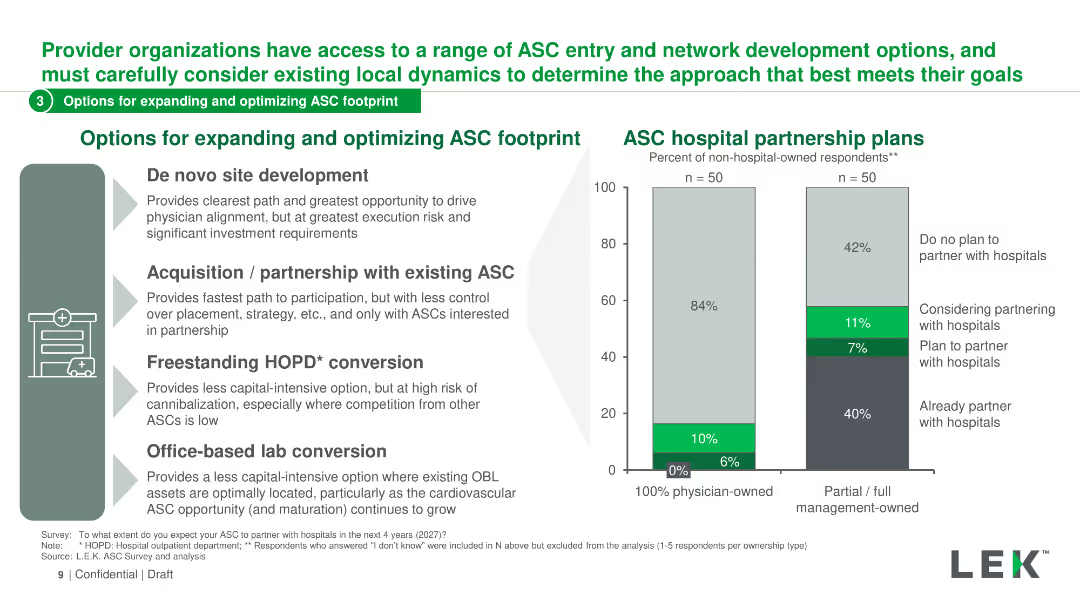
The slide features a mix of text and a column chart. The left side lists four options with icons, and the right side shows a column chart of ASC hospital partnership plans.
Strategic Planning
Healthcare & Pharmaceuticals
The slide discusses various options for expanding and optimizing the ASC footprint, including site development, partnerships, conversions, and lab conversions.
ASC, hospital, partnership, optimization, strategy
false
Strategic Planning
Healthcare & Pharmaceuticals healthcare-and-pharmaceuticals
Mixed Chart
LEK
View slide
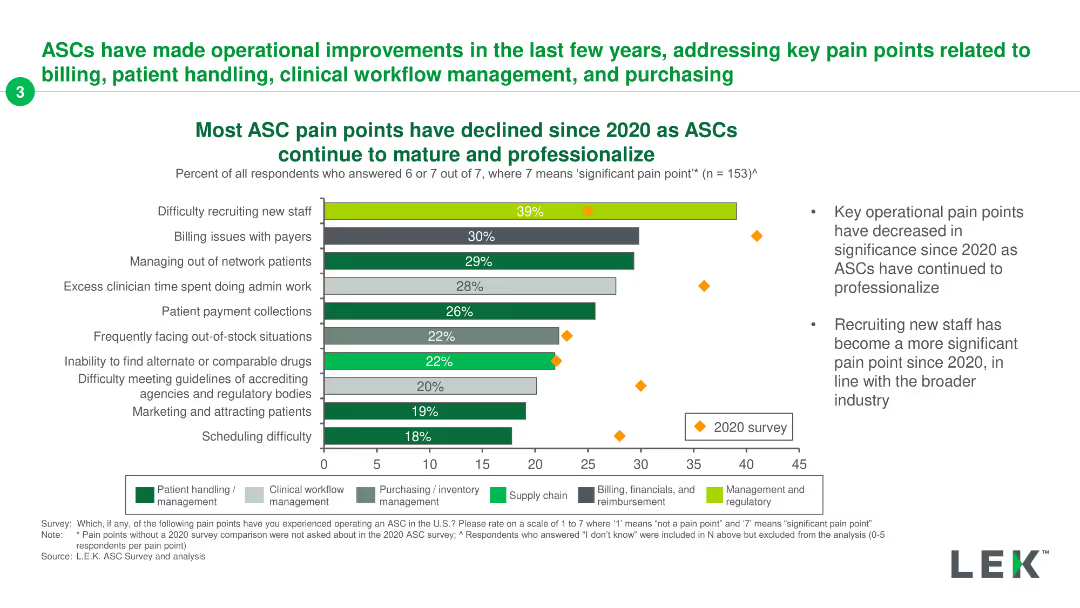
This slide shows a stacked column chart comparing ASC pain points from 2020 to recent years, categorized by different operational areas.
Operational Efficiency
Healthcare & Pharmaceuticals
It highlights the decline in operational pain points for ASCs since 2020, showing improvements in various areas such as patient handling and workflow management.
ASC, pain points, operational, improvement, decline
false
Operational Efficiency
Healthcare & Pharmaceuticals healthcare-and-pharmaceuticals
Mixed Chart
LEK
Previous
Loading...
Hold On!
We are searching in our database
If nothing, comes up, please try different filters!
Column Chart
Heatmap
Chevron
Org Chart
Infographic
Callouts
Timeline
List
Graphic
Picture
Process Flow
Diagram
Paragraph
Map
Table
Framework
Subtitle
Takeaway Box
Icon
Other Chart
Radar Chart
Waterfall Chart
Mekko Chart
Pie Chart
Scatter Plot
Line Chart
Bar chart
Bullet points
Create a FREE account to continue browsing
Receive Instant Access to 1,000+ slides from companies like McKinsey, Google, and Goldman Sachs
First Name
Last Name
Email
Password
I agree to all
Terms & Privacy Policy
Thank you! Your submission has been received!
Oops! Something went wrong while submitting the form.
Have an account?
Sign in
Upgrade to PRO to Save slides
Advanced Search and Filters
Access to 15,000+ slides
Access to Category Pages
Save/Bookmark Slides
PowerPoint Template Library
Pick a Plan
MONTHLY
$12/month
Billed every month, Cancel anytime.
YEARLY
$9/year
Billed $108 annually, Cancel anytime.
Checkout for $12/month
Checkout for $108/yr
Secured by Stripe | AES-256 bit encryption