My Account
My Slides
Search by Category
Templates
Leave Feedback
Login
Logout
Get Started
Browse all Slides
Browse all Slides
Create a FREE Account
Instant access to 1,000+ real slides from top companies like McKinsey, BCG, Goldman Sachs, Google and many more!
First Name
Last Name
Email
Password
I agree to all
Terms & Privacy Policy
Thank you! Your submission has been received!
Oops! Something went wrong while submitting the form.
Have an account?
Sign in
📢 Ready to start building slides? Check out our new template library
VIEW TEMPLATES
Welcome,
Welcome
PRO
Show Featured Only
Checkbox 8
Companies
Mckinsey
Bain
BCG
EY
Deloitte
Accenture
PwC/Strategy&
JP Morgan
Goldman Sachs
Morgan Stanley
Citigroup
Deutsche Bank
Barclays
LEK
KPMG
Kearney
Oliver Wyman
Booz Allen Hamilton
Gartner
IPSOS
Nielsen
Slide type
Text Only
Linear Flow
Vertical Flow
Single Chart
Header Horizontal
Mixed Chart
Header Vertical
Pillar
Multiple Chart
Graphic
Agenda
Title
Table
Framework
Industry
Technology & Software
Artificial Intelligence
Financial Services
Retail & E-commerce
Consumer Goods
Industrial & Manufacturing
Transportation & Logistics
Telecommunications
Real Estate & Construction
Hospitality & Tourism
Professional Services
Education & Training
Media & Entertainment
Agriculture & Food Production
Healthcare & Pharmaceuticals
Environmental Services & Sustainability
Government & Public Sector
Use Case
Mergers and Acquisitions
Performance Metrics and KPIs
Client Case Studies
Competitive Landscape
Corporate Finance and Valuation
Product and Service Analysis
Customer and Market Segmentation
Organizational Structure and Change
Industry Overview
Regulatory and Compliance
Risk Assessment and Management
Investment Analysis
Organizational Structure and Change
Human Resources and Talent Management
Financial Performance
Market Analysis and Trends
Sales and Business Development
Human Resources and Talent Management
Clear all
Thank you! Your submission has been received!
Oops! Something went wrong while submitting the form.
Tag
View slide
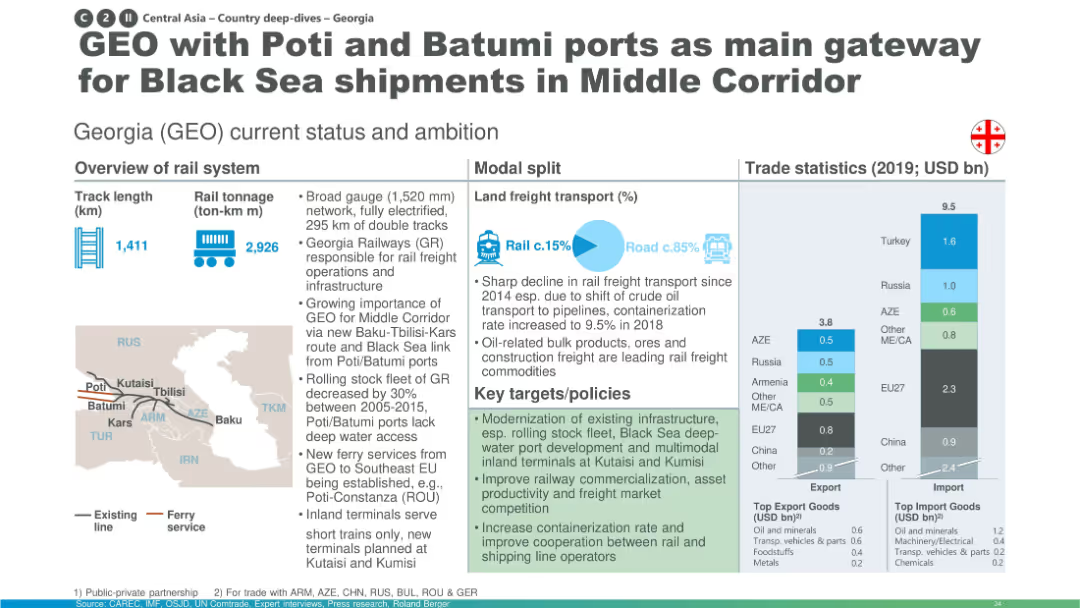
Layout mirrors previous slide: map, modal transport pie chart, and import/export bar graphs for Georgia.
Industry Overview
Transportation & Logistics
Georgia’s railway network is emphasized for its potential to serve the Middle Corridor through Black Sea ports (Poti/Batumi). It notes infrastructure challenges and targets to boost containerization and improve rail-to-sea connectivity.
Georgia, Black Sea, Poti, Batumi, Middle Corridor, freight, ports, rail connectivity
false
Industry Overview
Transportation & Logistics transportation-and-logistics
Multiple Chart
Roland Berger
View slide
This slide features a column chart comparing the perception of improvement needs across different business aspects between Global, EU, German, and Swiss companies.
Market Analysis and Trends
Professional Services
The slide visually compares organizational aspects such as talent recruitment, digitization, and agility, highlighting areas where German and Swiss companies see the most need for improvement versus European companies generally.
German companies, Swiss companies, agility, improvement, digitization
false
Market Analysis and Trends
Professional Services professional-services
Single Chart
PwC/Strategy&
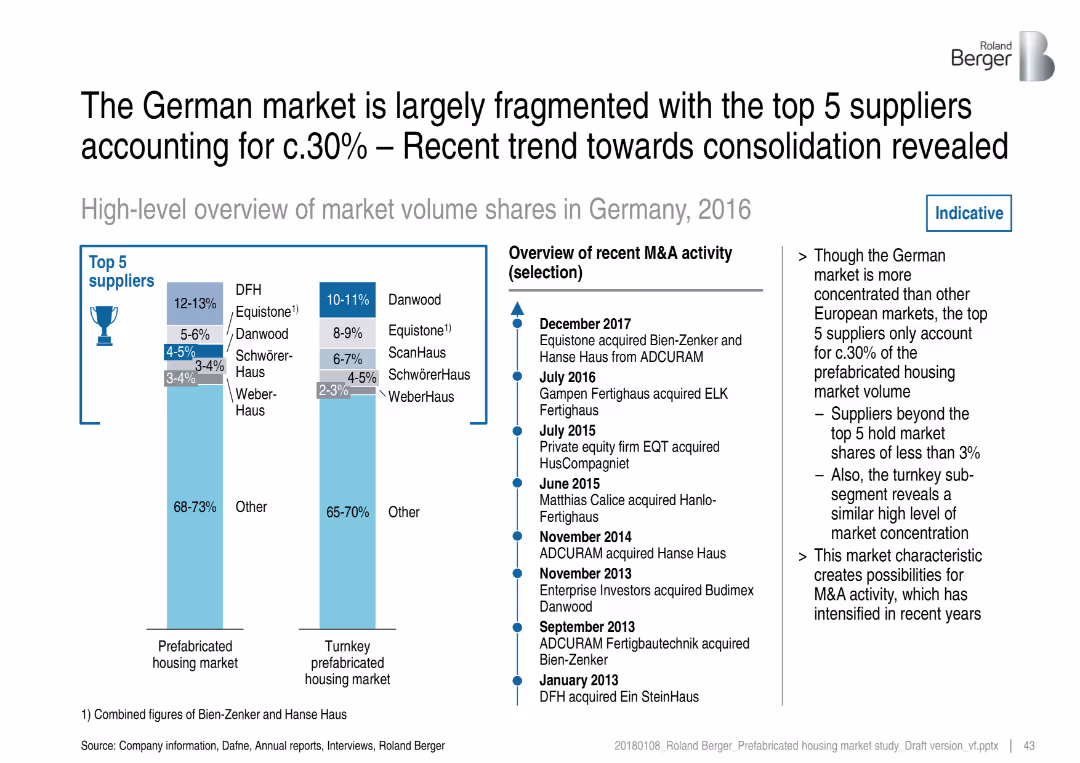
View slide
Two vertical bar charts and a timeline of M&A activity; light blue theme with clean, corporate design
Competitive Landscape
Real Estate & Construction
The slide presents a fragmented German prefab housing market where the top 5 suppliers hold only ~30% share. It includes market share breakdowns for the prefab and turnkey markets and outlines recent M&A activities, indicating industry consolidation.
German market, prefab housing, consolidation, top suppliers, Danwood, Equistone, acquisitions, market fragmentation
false
Competitive Landscape
Real Estate & Construction real-estate-and-construction
Mixed Chart
Roland Berger
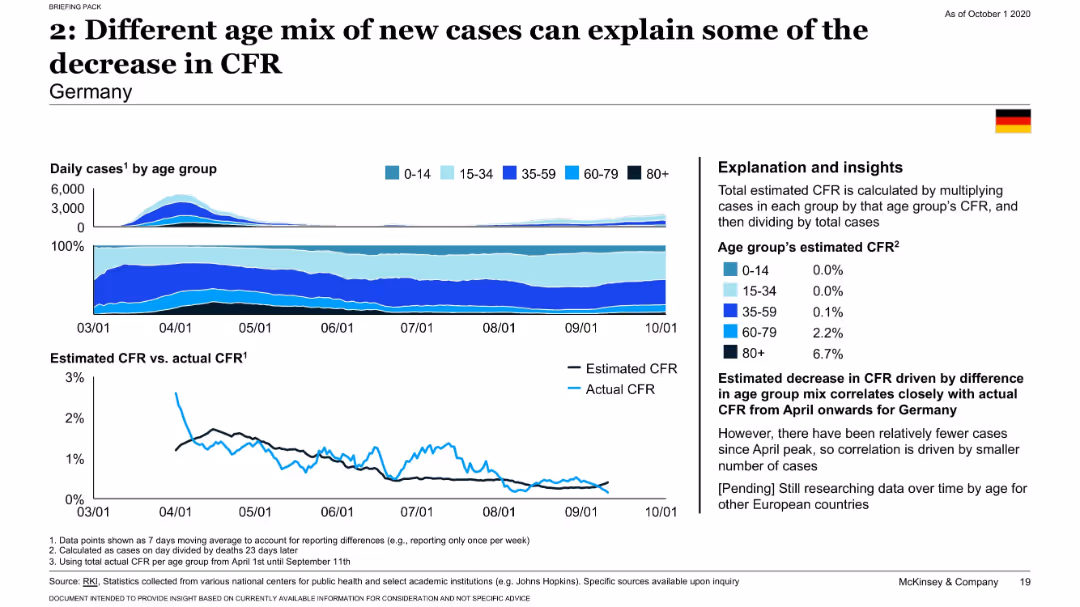
View slide
Stacked area charts showing case distribution by age and line chart comparing estimated vs actual CFR for Germany.
Risk Assessment and Management
Healthcare & Pharmaceuticals
Examines Germany’s age-disaggregated COVID-19 data to illustrate how a shift toward younger infections explains a reduction in CFR. Provides estimated CFR by age and supports findings with close correlation to actual CFR trends.
Germany, CFR, age mix, COVID-19, demographics, epidemiology
false
Risk Assessment and Management
Healthcare & Pharmaceuticals healthcare-and-pharmaceuticals
Multiple Chart
McKinsey
View slide
Three-column layout with pie chart on the left, data stats in the center, and a line graph on the right showing CLPs over time.
Financial Performance
Financial Services
Shows diversification in Germany’s €220bn loan book, dominated by Private Bank. Highlights solid fundamentals like investment grade, loan exposure per client, and low default rates. Graph shows CLP stability with temporary impacts from specific events.
Germany, CLP, Loan Diversification, Private Bank, Mortgage, Investment
false
Financial Performance
Financial Services financial-services
Multiple Chart
Deutsche Bank
View slide
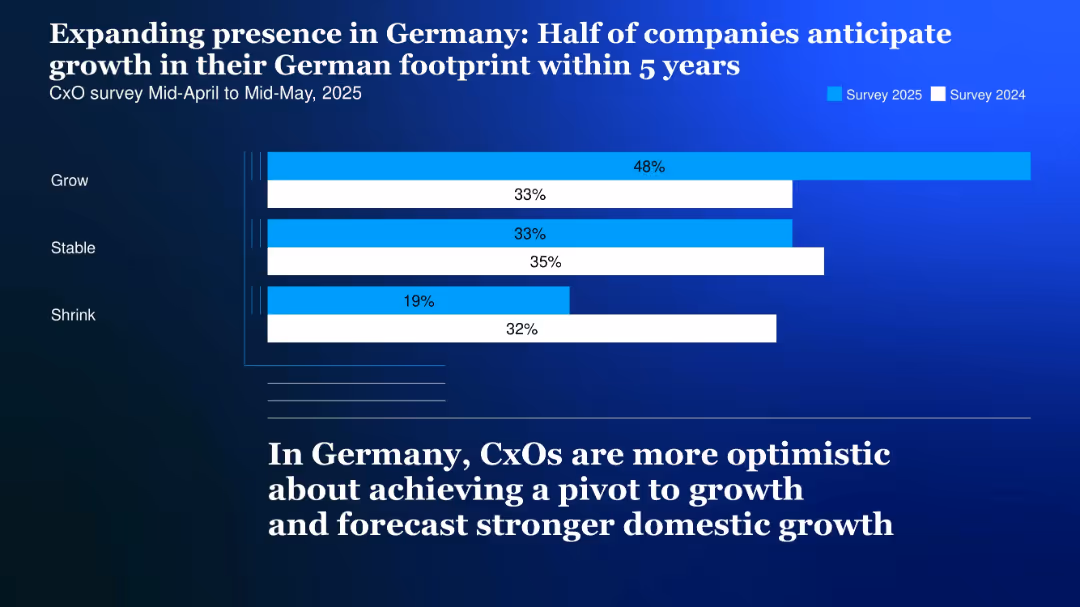
Horizontal bar chart comparing survey data from 2024 and 2025 with segmented blue bars on a dark gradient background
Market Analysis and Trends
Professional Services
The slide illustrates increasing optimism among CxOs regarding growth in Germany, with 48% forecasting expansion in their German footprint over the next 5 years.
Germany, CxO, growth, footprint, 2025, optimism, domestic market, survey, stable, shrink
false
Market Analysis and Trends
Professional Services professional-services
Single Chart
McKinsey
View slide
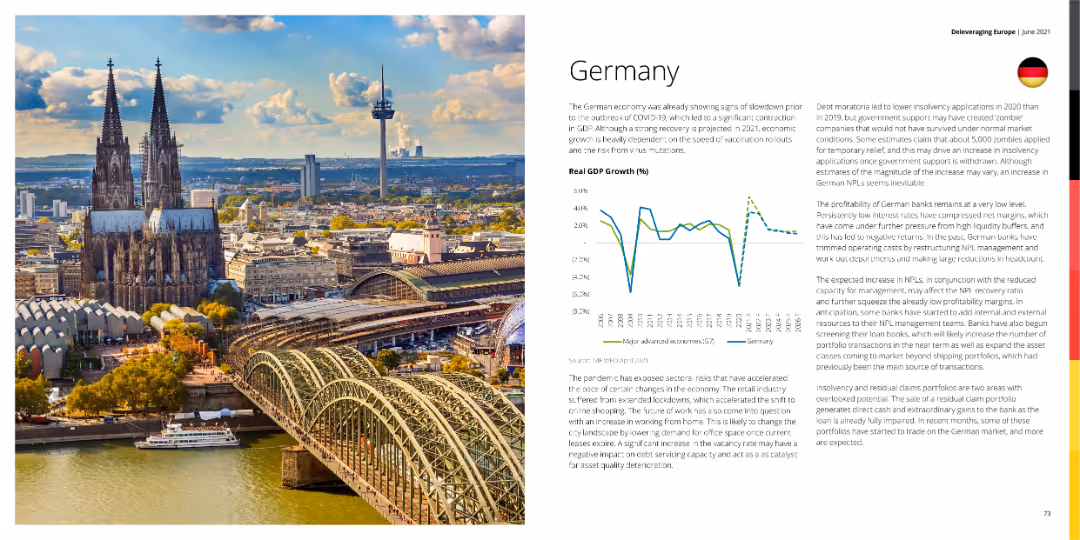
A photo of Cologne Cathedral with a graph showing Germany's GDP growth and a detailed text explanation.
Market Analysis and Trends
Financial Services
This slide discusses the economic conditions in Germany, highlighting GDP growth trends and the impact of COVID-19 on the economy.
Germany, GDP growth, economy, financial services, market analysis
false
Market Analysis and Trends
Financial Services financial-services
Mixed Chart
Deloitte
View slide
A photo of Cologne Cathedral with a graph showing Germany's GDP growth and a detailed text explanation.
Market Analysis and Trends
Financial Services
This slide discusses Germany's economic conditions, highlighting GDP growth trends and the impact of COVID-19 on the economy.
Germany, GDP growth, economy, financial services, market analysis
false
Market Analysis and Trends
Financial Services financial-services
Multiple Chart
Deloitte
View slide
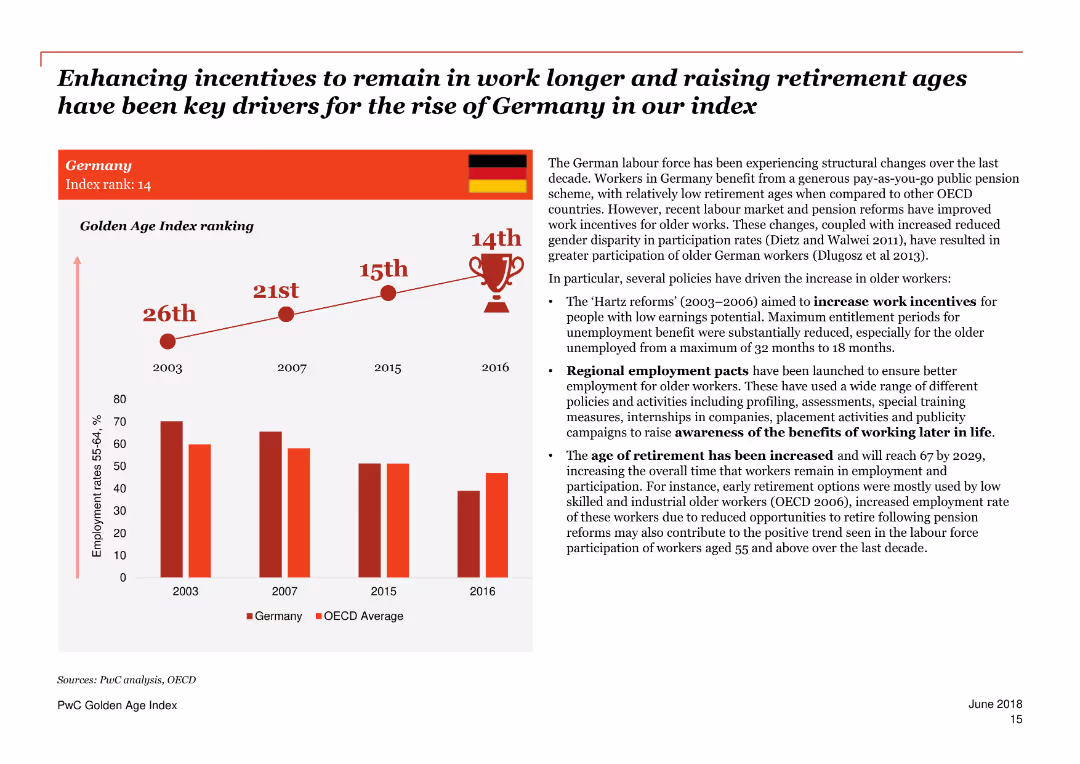
A combination of text and column charts discussing Germany's Golden Age Index ranking and key drivers.
Market Analysis and Trends
Government & Public Sector
Focuses on Germany's rise in the Golden Age Index due to incentives for longer work and higher retirement ages, and labor market reforms.
Germany, Golden Age Index, employment, incentives, retirement age, labor market reforms, drivers, older workers, policies, trends
false
Market Analysis and Trends
Government & Public Sector government-and-public-sector
Mixed Chart
PwC/Strategy&
View slide
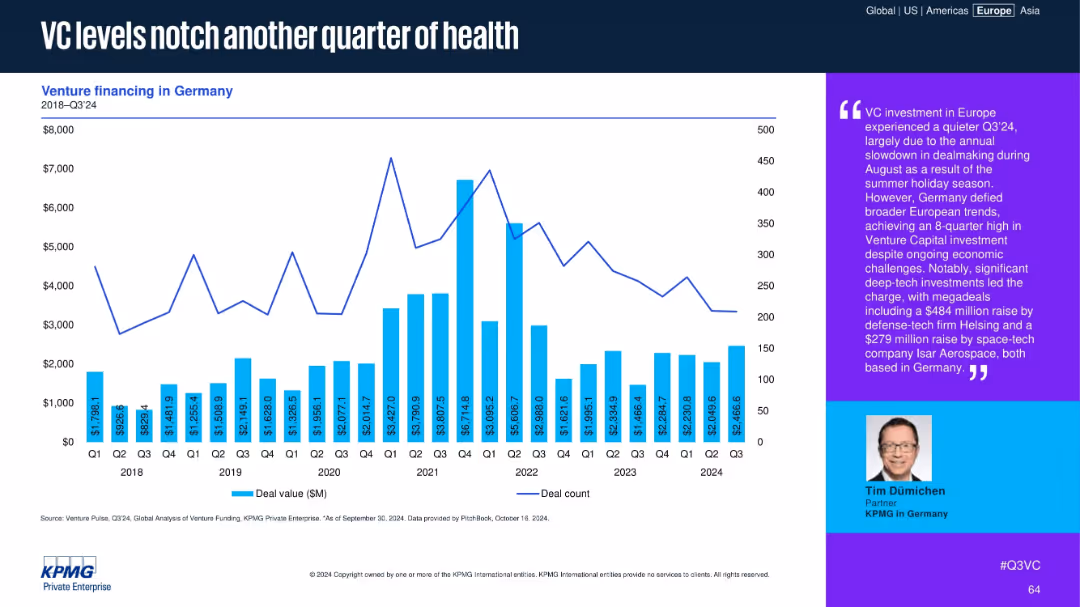
Chart with VC deal values and counts in Germany from 2018–Q3 2024. Commentary emphasizes deep-tech investments.
Market Analysis and Trends
Financial Services
Germany continues to show strong VC activity in Q3 2024, with deal volumes sustained by major investments in defense-tech and space-tech. The commentary notes an 8-quarter high despite broader European slowdowns due to summer seasonality.
Germany, VC investment, defense-tech, space-tech, deal value, Q3 2024, funding resilience, deep tech, European trend
false
Market Analysis and Trends
Financial Services financial-services
Mixed Chart
KPMG
View slide
Similar structure to UK slide: left-side commentary, right-side bar/line chart, and a quote on the far right. Blue and purple accents.
Market Analysis and Trends
Financial Services
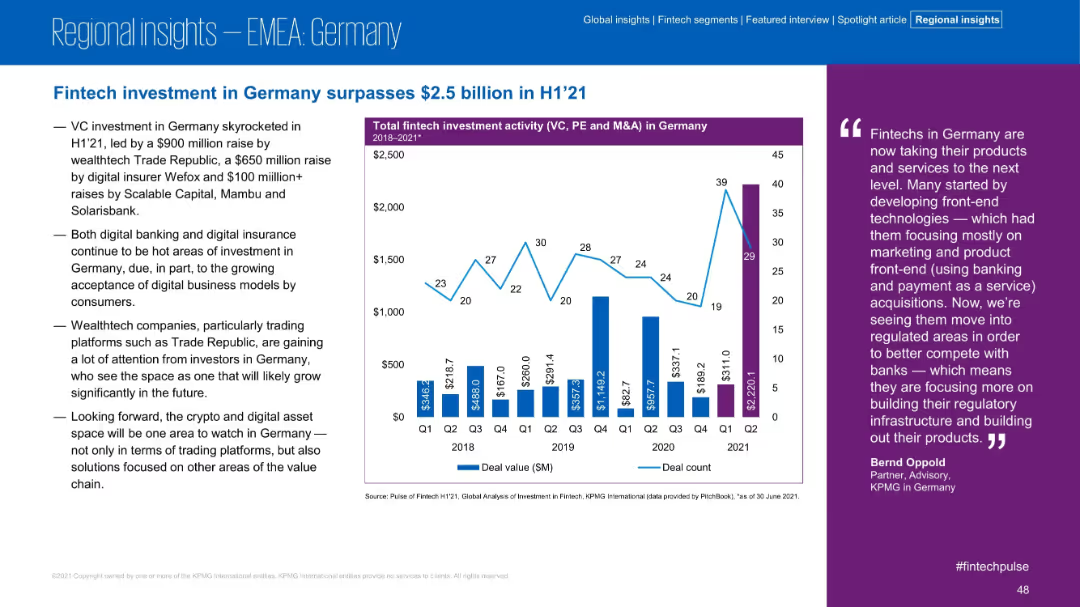
Germany saw over $2.5B in fintech investment in H1 2021, driven by large VC rounds in wealthtech and digital insurance. The slide discusses ongoing trends and the rise of regulated digital financial services.
Germany, VC, Wealthtech, Digital Insurance, H1 2021, Investment, Fintech, Growth
false
Market Analysis and Trends
Financial Services financial-services
Mixed Chart
KPMG
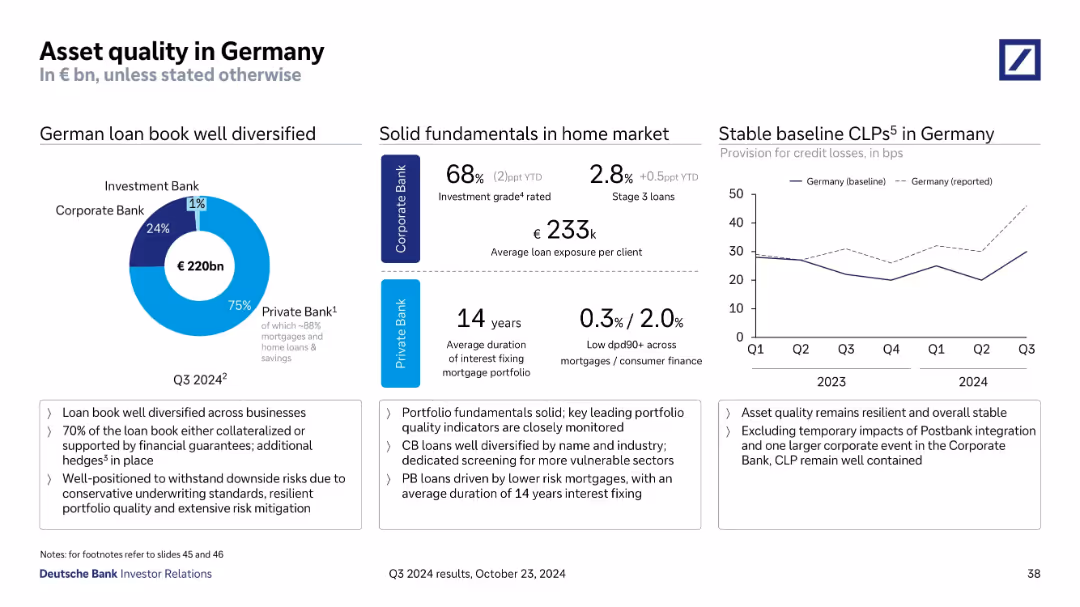
View slide
Combination of pie chart, stats blocks, and line chart; structured into three vertical sections with highlight box at bottom
Risk Assessment and Management
Financial Services
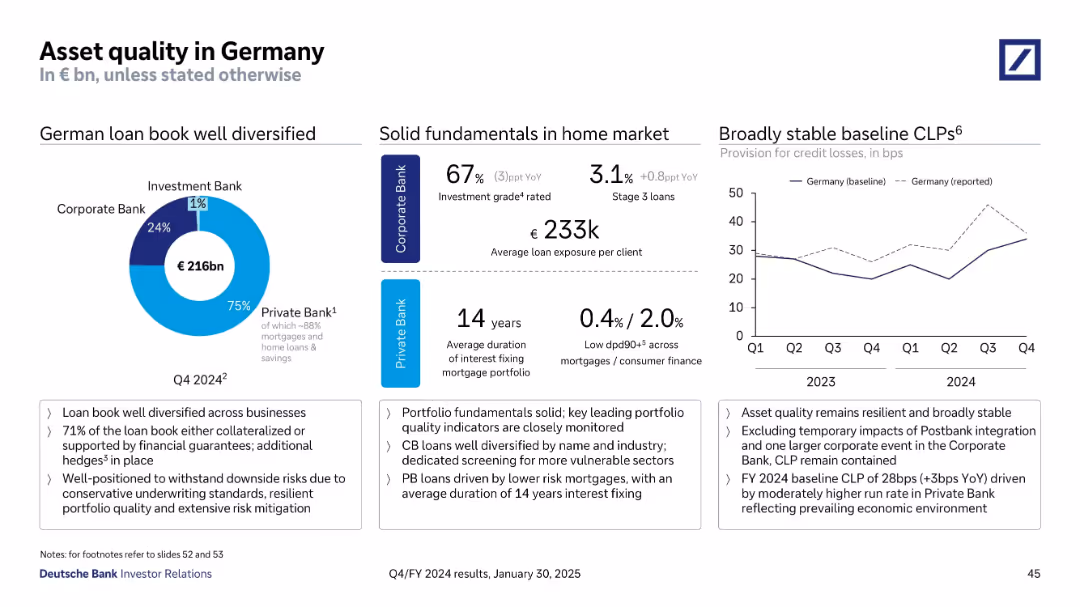
Assesses €216bn German loan book split across bank divisions, noting strong fundamentals and resilience. Loan quality indicators, interest fixing duration, and CLP rates remain stable. Conservative underwriting and hedges support portfolio quality despite macro pressures.
Germany, asset quality, CLP, mortgage, Private Bank, Corporate Bank
false
Risk Assessment and Management
Financial Services financial-services
Multiple Chart
Deutsche Bank
View slide
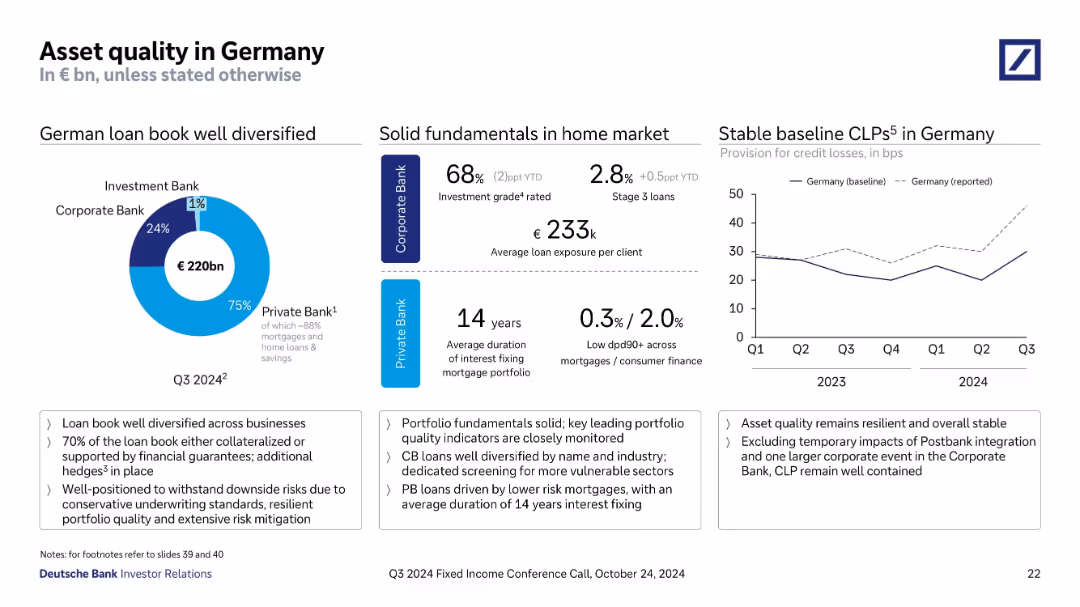
Circular chart with pie breakdown of German loan book; table of fundamentals; baseline CLPs chart.
Risk Assessment and Management
Financial Services
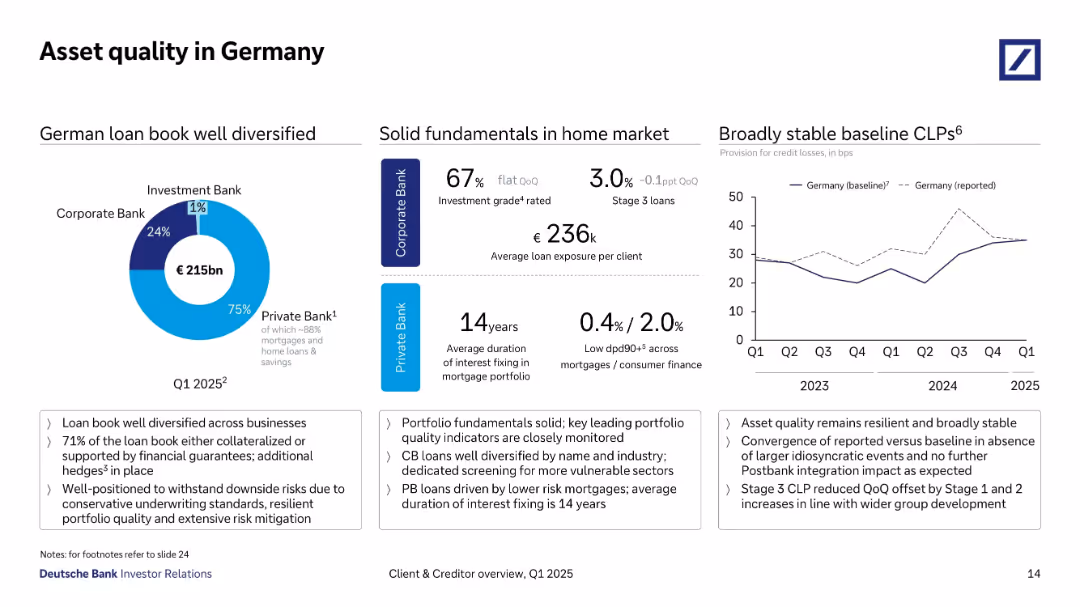
This slide analyzes asset quality in the German market, emphasizing a diversified €215bn loan portfolio primarily in the Private Bank. It includes solid fundamentals such as low dpd90+ rates, high insurance coverage, and conservative underwriting practices.
Germany, asset quality, mortgage loans, CLPs, diversification, conservative lending, loan book, Private Bank
false
Risk Assessment and Management
Financial Services financial-services
Multiple Chart
Deutsche Bank
View slide
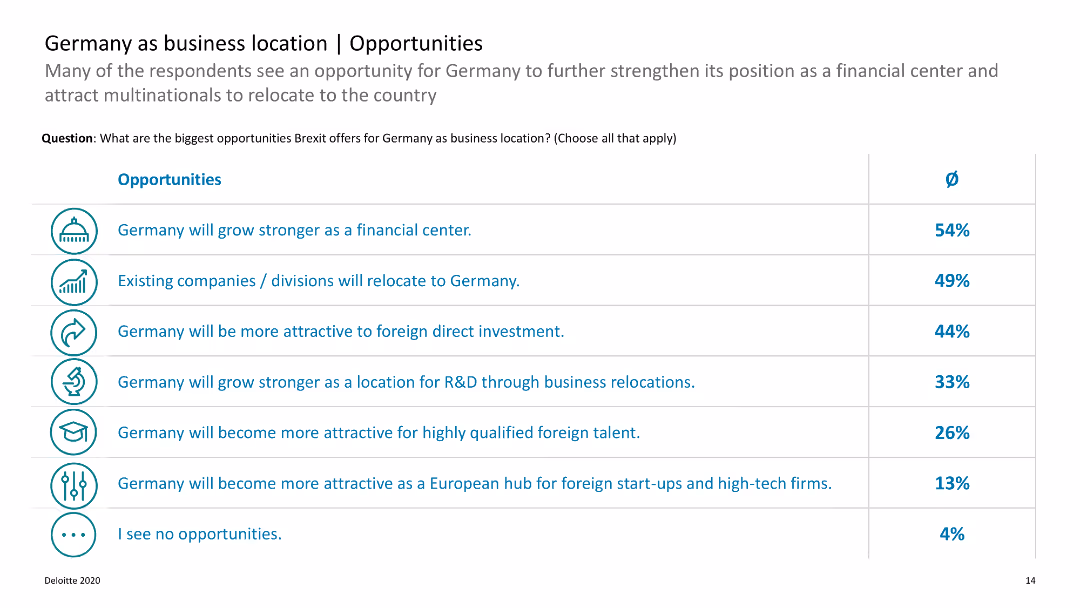
The slide features a list of opportunities with accompanying percentages. It uses icons and a horizontal layout.
Market Analysis and Trends
Financial Services
Describes various opportunities Brexit offers for Germany as a business location, focusing on sectors such as financial services and R&D.
Germany, business, Brexit, opportunities, relocation
false
Market Analysis and Trends
Financial Services financial-services
Table
Deloitte
View slide
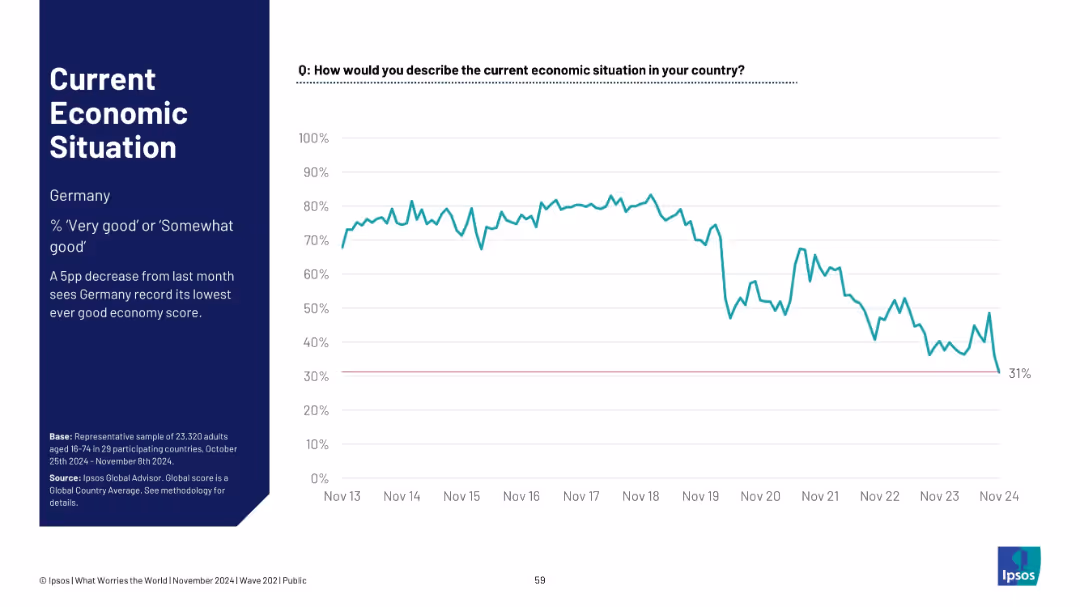
Similar layout as previous; focuses on Germany. Left panel has title and insights; right panel shows time-series graph
Market Analysis and Trends
Government & Public Sector
Germany records its lowest-ever good economy rating at 31%, with a sharp decline from stable historical highs. The graph shows public confidence waning dramatically over the decade.
Germany, economic outlook, sentiment trend, Ipsos, lowest score, public opinion, economy perception, Europe
false
Market Analysis and Trends
Government & Public Sector government-and-public-sector
Single Chart
IPSOS
View slide
Line chart tracking Germany’s perception of the economy; commentary notes all-time low.
Market Analysis and Trends
Financial Services
Germany hit a new all-time low in economic sentiment with only 27% rating the economy as good, continuing a downward trend as noted in recent months.
Germany, economic sentiment, all-time low, 2024 perception, Ipsos chart, long-term decline, public opinion
false
Market Analysis and Trends
Financial Services financial-services
Mixed Chart
IPSOS
View slide
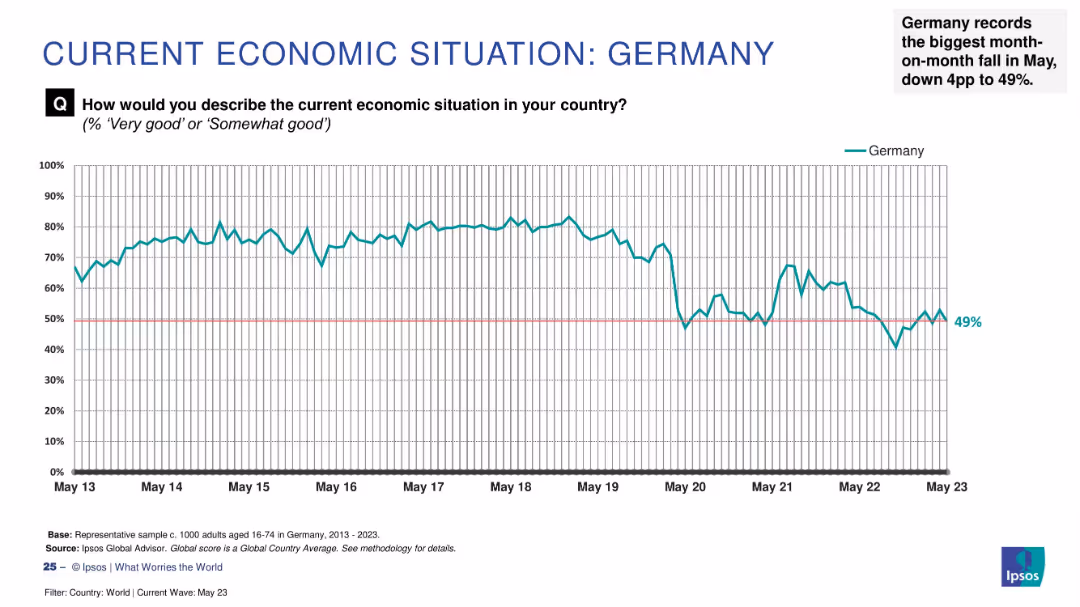
Time-series line chart of Germany’s economic sentiment (2013–2023); commentary at top right highlights trends.
Strategic Planning
Financial Services
Germany’s “good economy” rating has fallen to 49%, with a 4-point drop from the previous month. The chart shows consistent optimism until a noticeable decline post-2020. Commentary notes this is the sharpest recent fall among surveyed countries.
Germany, economy, public opinion, Ipsos, monthly change, pessimism, economic trend, financial concern
false
Strategic Planning
Financial Services financial-services
Single Chart
IPSOS
View slide
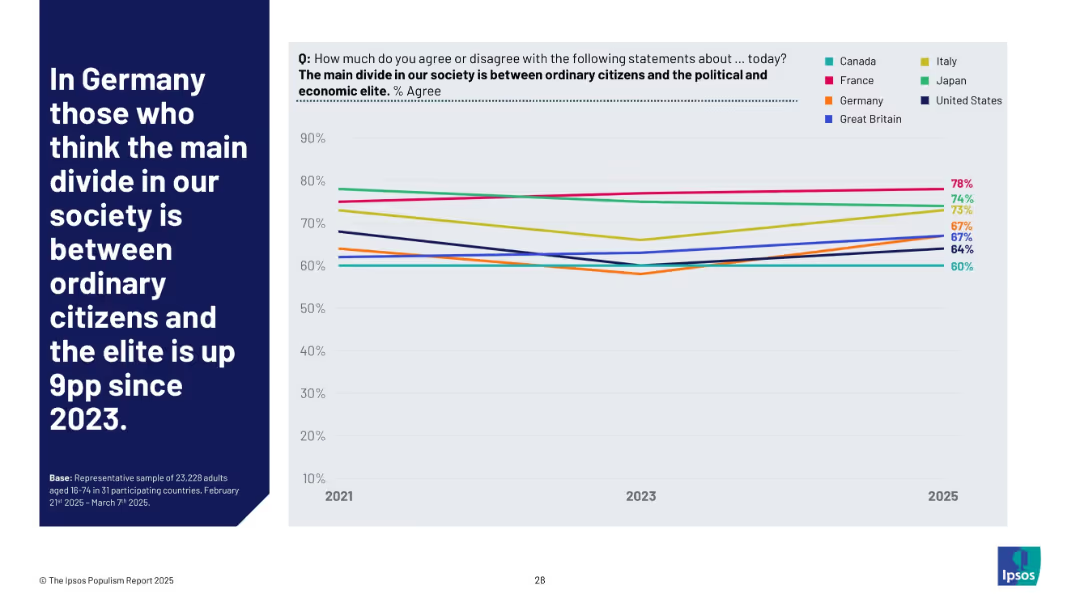
Left-aligned title text; right side shows a line chart tracking changes in Germany and peer nations for 2021–2025.
Market Analysis and Trends
Government & Public Sector
Germany has seen a 9 percentage point increase since 2023 in the belief that the main societal divide is between ordinary citizens and elites, aligning with broader populist concerns tracked globally.
Germany, elite divide, trend, societal perception, Ipsos, populism, 2025, comparison, inequality, citizens
false
Market Analysis and Trends
Government & Public Sector government-and-public-sector
Mixed Chart
IPSOS
View slide
Table layout describing key measures and commitments of Germany's Hydrogen Strategy with icons illustrating different sectors like generation and infrastructure.
Regulatory and Compliance
Energy & Utilities
Describes Germany's hydrogen strategy with an emphasis on infrastructure, partnerships, and regulations to enhance the use of hydrogen as a sustainable energy source.
Germany, hydrogen, strategy, infrastructure, partnerships, 2020-2030
false
Regulatory and Compliance
Energy & Utilities energy-and-utilities
Multiple Chart
McKinsey
View slide
Timeline showing the phases of Germany's hydrogen strategy from 2020-2050 with key targets for electrolysis capacity and infrastructure development.
Strategic Planning
Energy & Utilities
This slide covers the timeline and phases of Germany’s evolving hydrogen strategy, focusing on increasing production and infrastructure expansion.
Germany, hydrogen, strategy, timeline, 2020-2050, production, infrastructure
false
Strategic Planning
Energy & Utilities energy-and-utilities
Mixed Chart
McKinsey
View slide
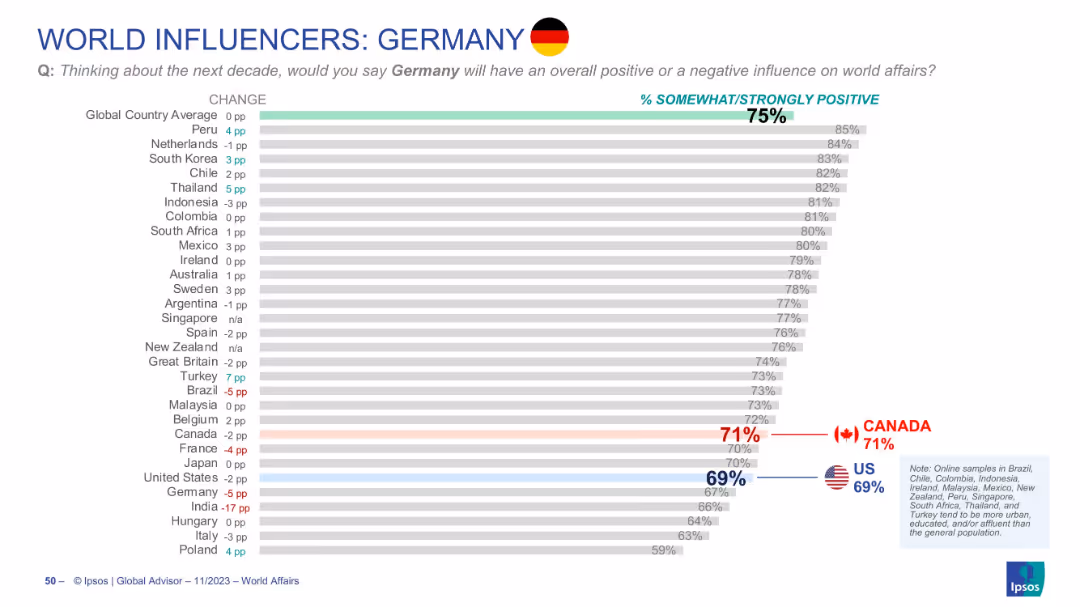
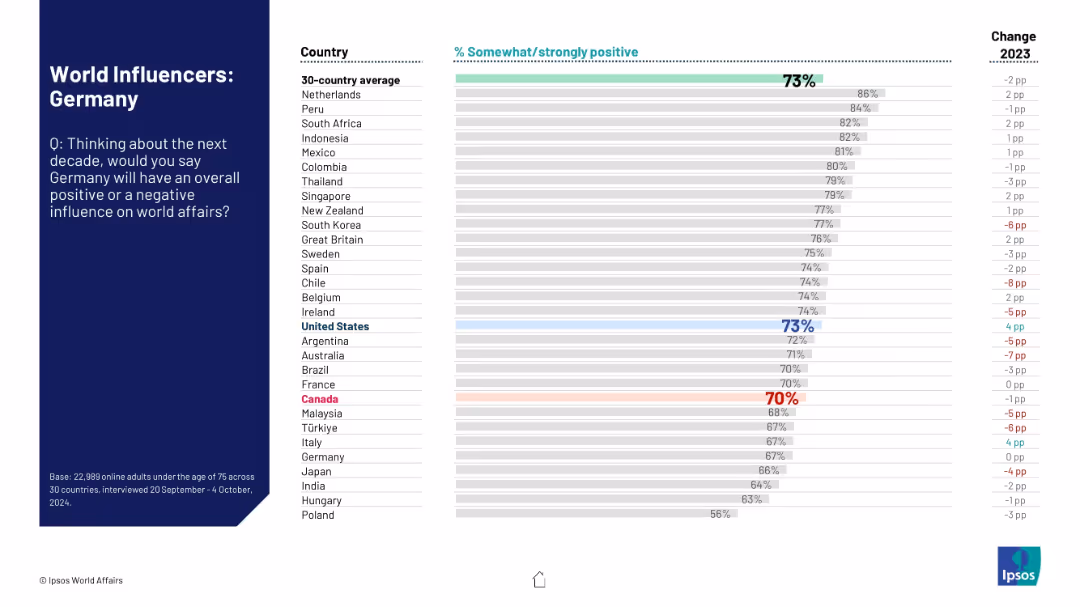
Bar chart with countries’ ratings of Germany's influence; Canada and U.S. shown with red and blue callouts
Market Analysis and Trends
Government & Public Sector
Measures how positively countries view Germany’s future influence. Germany averages 75% globally. Canada (71%) rates Germany above the U.S. (69%). Changes from prior year are also noted for each country.
Germany, influence, global perception, Canada view, US view, Ipsos, bar chart, world affairs, opinion trends, soft power
false
Market Analysis and Trends
Government & Public Sector government-and-public-sector
Single Chart
IPSOS
View slide
Same format as others in the “World Influencers” series; shows global public views on Germany’s future influence.
Strategic Planning
Government & Public Sector
The slide presents international sentiment about Germany’s role in world affairs over the next decade, with 30 countries ranked by percentage of positive response. Comparative change from 2023 is shown.
Germany, international perception, soft power, global influence, public opinion, Ipsos, strategic role, world affairs
false
Strategic Planning
Government & Public Sector government-and-public-sector
Mixed Chart
IPSOS
View slide
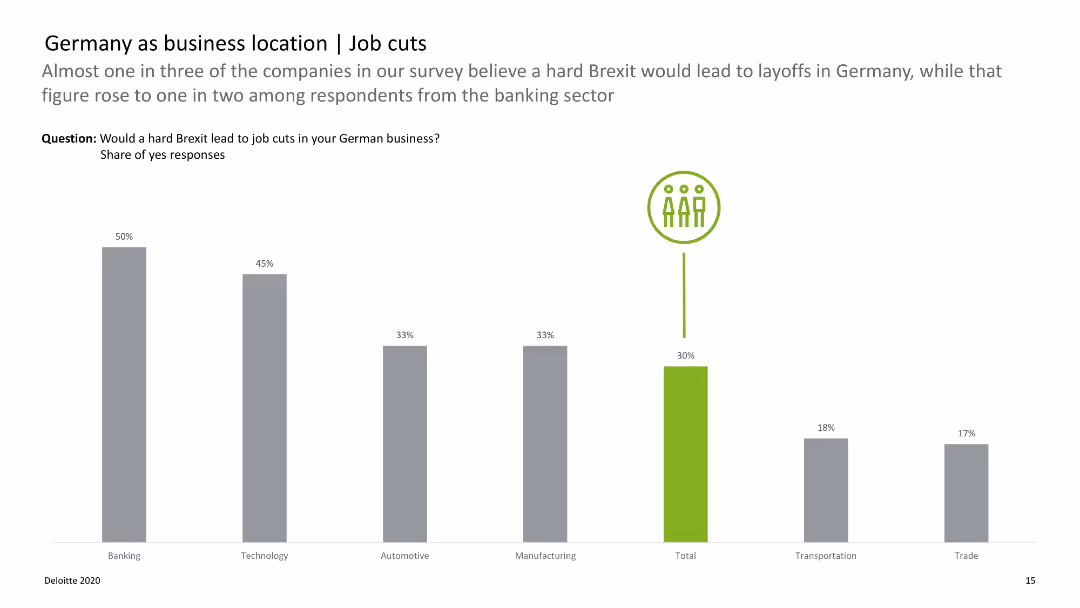
Bar chart displaying the likelihood of job cuts across various sectors due to Brexit, with color-coded bars.
Risk Assessment and Management
Financial Services
Analyzes the potential impact of a hard Brexit on job cuts in different sectors, highlighting banking and technology.
Germany, job cuts, Brexit, sectors, impact
false
Risk Assessment and Management
Financial Services financial-services
Single Chart
Deloitte
View slide
Three-part slide: donut chart for loan distribution, bar charts for fundamentals, and a line graph for credit losses; detailed text explanations.
Risk Assessment and Management
Financial Services
Focuses on Deutsche Bank’s German loan book, showing 75% in Private Bank with strong underwriting. Key metrics include low delinquency, solid corporate fundamentals, and stable credit loss provisions (CLPs), despite minor increases due to temporary factors.
Germany, loan book, asset quality, CLPs, Private Bank, Corporate Bank, Deutsche Bank
false
Risk Assessment and Management
Financial Services financial-services
Multiple Chart
Deutsche Bank
View slide
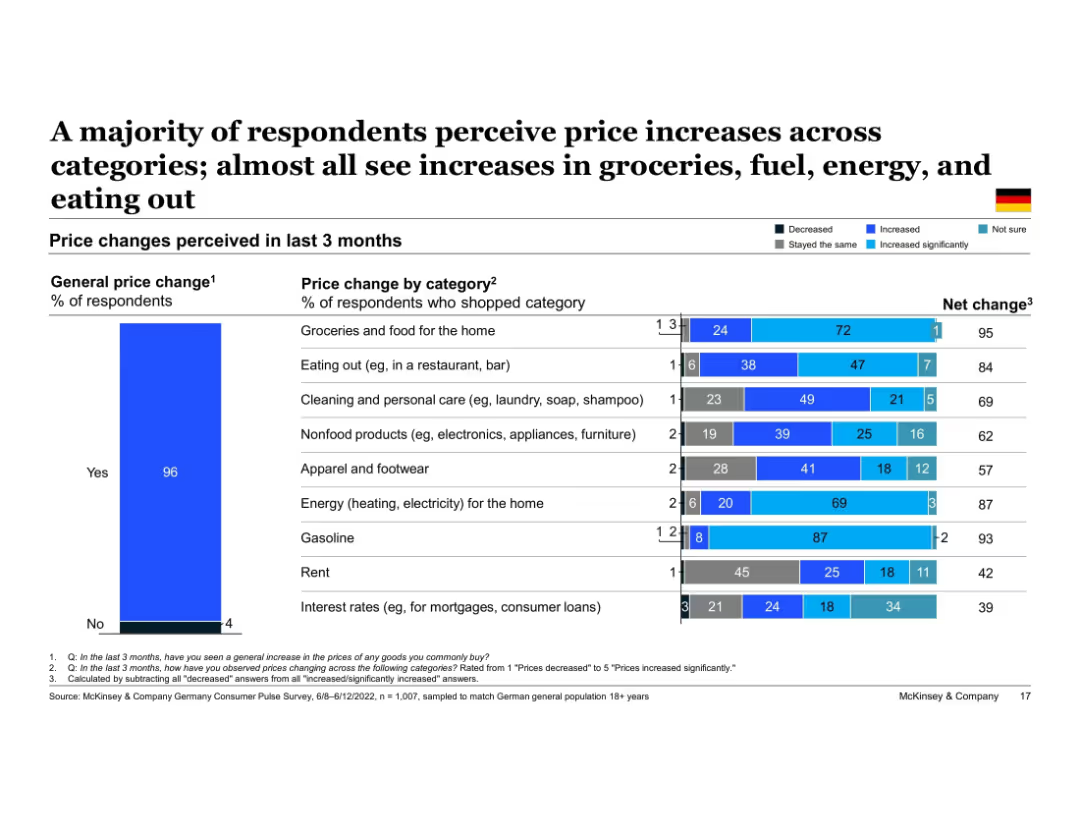
Two-part horizontal bar chart showing Germany's perceived price changes by category. Right chart breaks down responses into "Decreased," "Stayed the same," "Increased," and "Increased significantly." Left bar shows overall % perceiving general price increase.
Market Analysis and Trends
Financial Services
Most German respondents noticed price increases across multiple spending categories. Particularly high increases were reported in groceries, gasoline, and home energy. This breakdown helps identify where consumers feel inflation most directly across their recent purchases.
Germany, price changes, inflation perception, groceries, fuel, energy, spending categories, consumer insight
false
Market Analysis and Trends
Financial Services financial-services
Multiple Chart
McKinsey
View slide
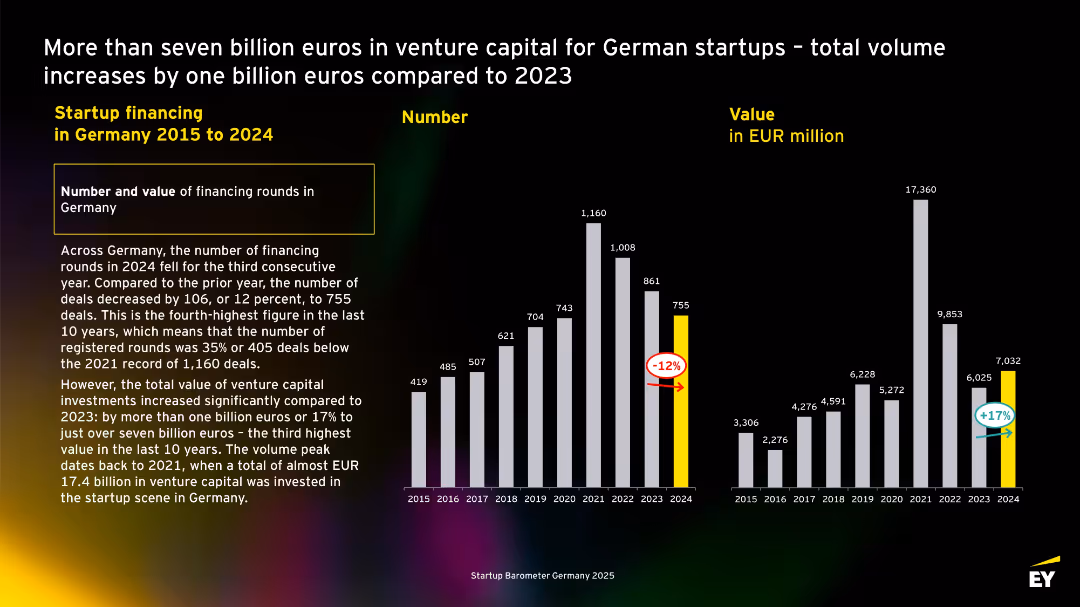
Dual bar charts comparing number and value of deals from 2015–2024. Highlighted values for 2024, black background with high contrast.
Investment Analysis
Professional Services
Highlights that while the number of startup financing rounds in Germany decreased in 2024, the total value of investments increased by 17%, signaling higher-value funding rounds despite fewer deals.
Germany, startup funding, venture capital, 2024, investment volume, deal count, EY, trends, growth, value
false
Investment Analysis
Professional Services professional-services
Multiple Chart
EY
View slide
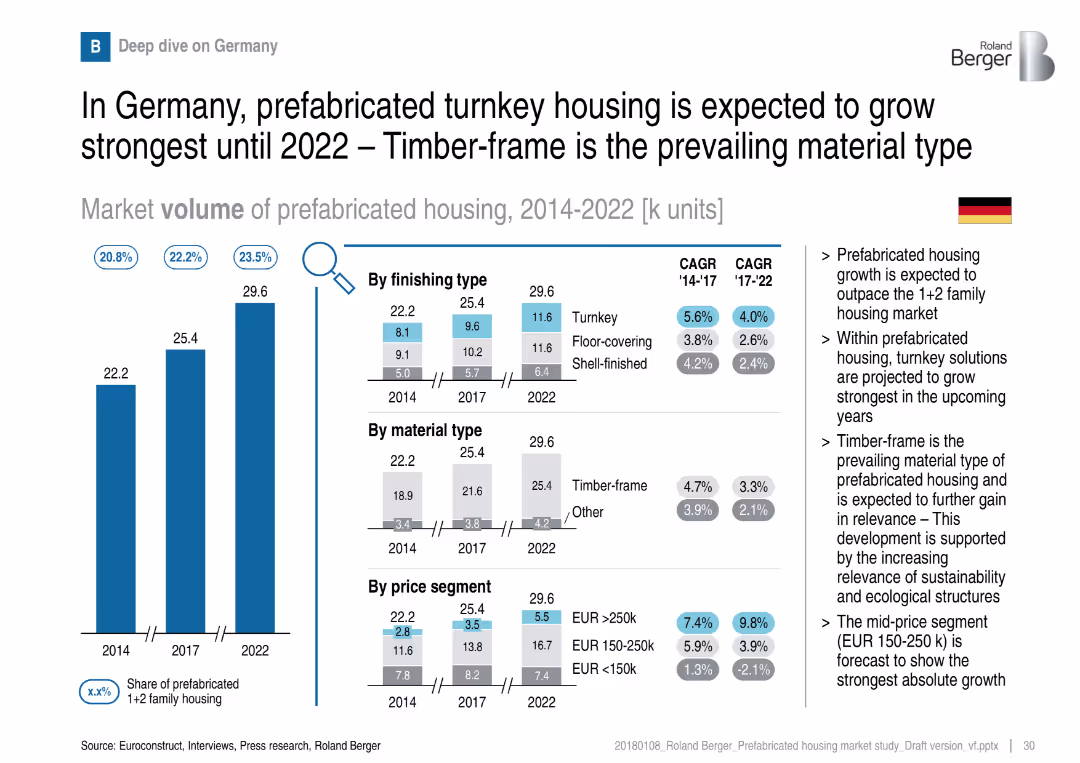
Similar layout to UK slide: volume bar chart and segmentation by finishing, material, price
Customer and Market Segmentation
Real Estate & Construction
Germany’s market is led by timber-frame construction and a high share of turnkey housing. Turnkey is projected to grow the most. Sustainability and mid-price segments are key drivers of future growth.
Germany, turnkey, timber-frame, sustainability, mid-price, prefabricated, housing market
false
Customer and Market Segmentation
Real Estate & Construction real-estate-and-construction
Multiple Chart
Roland Berger
View slide
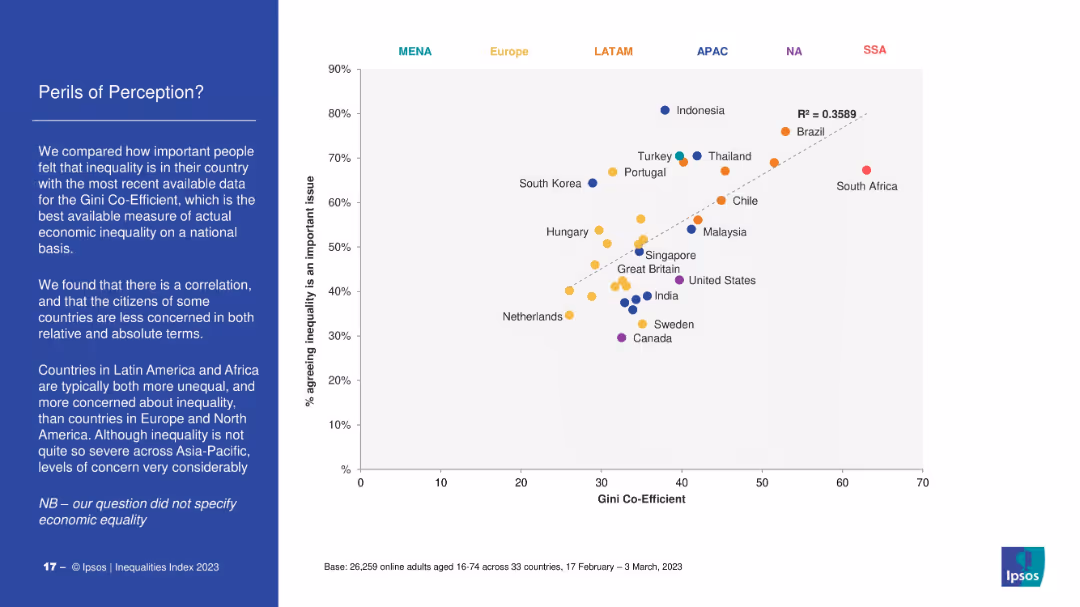
Scatter plot mapping Gini Coefficient (economic inequality) against percentage agreeing inequality is a major issue. Dotted trendline indicates correlation. Countries coded by region (color). Left-side text explains key takeaways.
Market Analysis and Trends
Government & Public Sector
The slide correlates perceived inequality with actual economic inequality (Gini coefficient). Countries in Latin America and Africa show high concern and inequality, while Europe and North America show lower concern. Highlights discrepancies in perception vs. data.
Gini coefficient, perception, inequality, economic data, Ipsos, regional comparison, Latin America, public opinion
false
Market Analysis and Trends
Government & Public Sector government-and-public-sector
Mixed Chart
IPSOS
View slide
Slide with column chart showing 'Global Banking & Markets Net Revenues' segmented by revenue types, a detailed financial results table, and highlighted textual analysis of key figures.
Financial Performance
Financial Services
Focuses on the financial results and revenue specifics of the Global Banking & Markets sector, providing insights on performance factors, investment banking fees, and revenue streams. Designed for detailed market analysis and strategic planning.
Global Banking, Market Revenue, Investment Fees, FICC, Equities, Net Revenues, Financial Performance, Market Trends
false
Financial Performance
Financial Services financial-services
Mixed Chart
Goldman Sachs
View slide
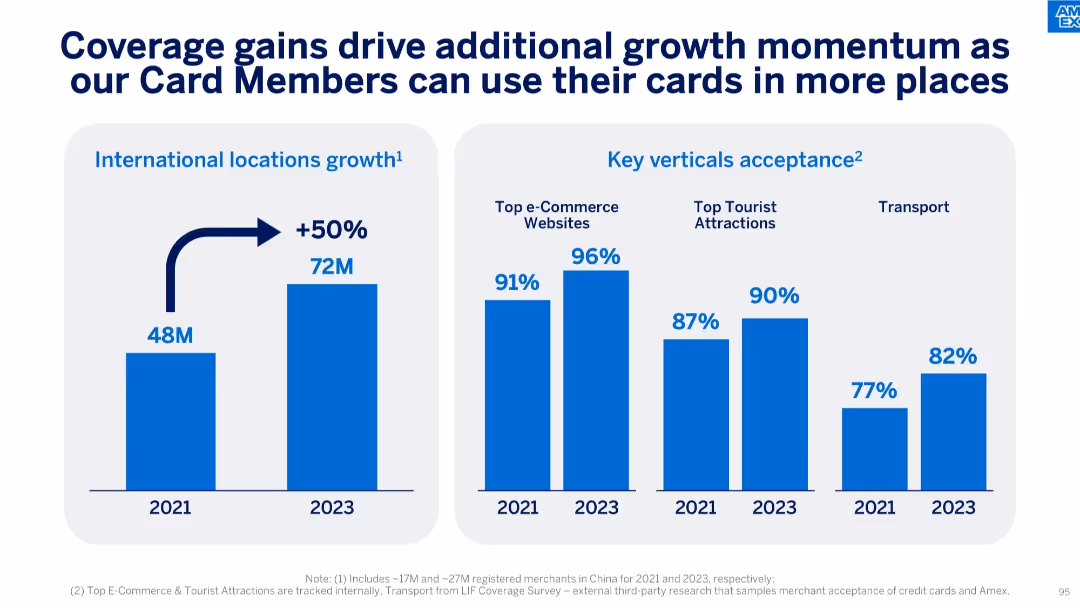
Side-by-side charts showing international location growth and acceptance in key verticals.
Strategic Planning
Financial Services
The slide highlights a 50% growth in international locations from 2021 to 2023, alongside acceptance improvements across e-commerce, tourist attractions, and transport sectors, indicating broader card usage opportunities.
Global Coverage, Card Acceptance, Growth, Locations, E-commerce, Transport, Tourism, Merchant Network
false
Strategic Planning
Financial Services financial-services
Multiple Chart
McKinsey
Previous
Loading...
Hold On!
We are searching in our database
If nothing, comes up, please try different filters!
Column Chart
Heatmap
Chevron
Org Chart
Infographic
Callouts
Timeline
List
Graphic
Picture
Process Flow
Diagram
Paragraph
Map
Table
Framework
Subtitle
Takeaway Box
Icon
Other Chart
Radar Chart
Waterfall Chart
Mekko Chart
Pie Chart
Scatter Plot
Line Chart
Bar chart
Bullet points
Create a FREE account to continue browsing
Receive Instant Access to 1,000+ slides from companies like McKinsey, Google, and Goldman Sachs
First Name
Last Name
Email
Password
I agree to all
Terms & Privacy Policy
Thank you! Your submission has been received!
Oops! Something went wrong while submitting the form.
Have an account?
Sign in
Upgrade to PRO to Save slides
Advanced Search and Filters
Access to 15,000+ slides
Access to Category Pages
Save/Bookmark Slides
PowerPoint Template Library
Pick a Plan
MONTHLY
$12/month
Billed every month, Cancel anytime.
YEARLY
$9/year
Billed $108 annually, Cancel anytime.
Checkout for $12/month
Checkout for $108/yr
Secured by Stripe | AES-256 bit encryption