My Account
My Slides
Search by Category
Templates
Leave Feedback
Login
Logout
Get Started
Browse all Slides
Browse all Slides
Create a FREE Account
Instant access to 1,000+ real slides from top companies like McKinsey, BCG, Goldman Sachs, Google and many more!
First Name
Last Name
Email
Password
I agree to all
Terms & Privacy Policy
Thank you! Your submission has been received!
Oops! Something went wrong while submitting the form.
Have an account?
Sign in
📢 Ready to start building slides? Check out our new template library
VIEW TEMPLATES
Welcome,
Welcome
PRO
Show Featured Only
Checkbox 8
Companies
Mckinsey
Bain
BCG
EY
Deloitte
Accenture
PwC/Strategy&
JP Morgan
Goldman Sachs
Morgan Stanley
Citigroup
Deutsche Bank
Barclays
LEK
KPMG
Kearney
Oliver Wyman
Booz Allen Hamilton
Gartner
IPSOS
Nielsen
Slide type
Text Only
Linear Flow
Vertical Flow
Single Chart
Header Horizontal
Mixed Chart
Header Vertical
Pillar
Multiple Chart
Graphic
Agenda
Title
Table
Framework
Industry
Technology & Software
Artificial Intelligence
Financial Services
Retail & E-commerce
Consumer Goods
Industrial & Manufacturing
Transportation & Logistics
Telecommunications
Real Estate & Construction
Hospitality & Tourism
Professional Services
Education & Training
Media & Entertainment
Agriculture & Food Production
Healthcare & Pharmaceuticals
Environmental Services & Sustainability
Government & Public Sector
Use Case
Mergers and Acquisitions
Performance Metrics and KPIs
Client Case Studies
Competitive Landscape
Corporate Finance and Valuation
Product and Service Analysis
Customer and Market Segmentation
Organizational Structure and Change
Industry Overview
Regulatory and Compliance
Risk Assessment and Management
Investment Analysis
Organizational Structure and Change
Human Resources and Talent Management
Financial Performance
Market Analysis and Trends
Sales and Business Development
Human Resources and Talent Management
Clear all
Thank you! Your submission has been received!
Oops! Something went wrong while submitting the form.
Tag
View slide
Slide with world map and pyramids representing the distribution of investment professionals, detailed with statistics, against a white and blue background.
Market Analysis and Trends
Financial Services
Showcases the global distribution of investment professionals within a firm and highlights their contribution to the firm's success.
Global Distribution, Investment Professionals, Statistics, Americas, EMEA, APAC, Tenure
false
Market Analysis and Trends
Financial Services financial-services
Table
Goldman Sachs
View slide
The slide includes a column chart showing global economic growth sentiment across various regions. Text sections provide context. The chart is central and dominates the slide.
Market Analysis and Trends
Professional Services
Reflects global CEO sentiment on economic growth, valuable for analyzing regional business outlooks and strategic planning.
Global Economy, CEO Sentiment, Growth Prospects, Pessimism
false
Market Analysis and Trends
Professional Services professional-services
Mixed Chart
PwC/Strategy&
View slide
Complex layout with multiple visual elements: a column chart, world map, icons for services, and text blocks describing performance drivers.
Financial Performance
Financial Services
Focuses on the growth of a financial platform and client value drivers, useful for illustrating a company’s market performance.
Global Equities, Client-centric, Growth, Execution, Performance
false
Financial Performance
Financial Services financial-services
Mixed Chart
Goldman Sachs
View slide
Bar graph on the slide represents global capital spending as a percentage of GDP, with an increasing trend shown in different shades of blue. Annotations provide a year-by-year breakdown.
Investment Analysis
Environmental Services & Sustainability
Describes the front-loaded nature of investment in the net-zero transition, with spending rising to a peak percentage of global GDP by 2030 before reducing again. Indicates the importance of initial investment to facilitate long-term change.
Global GDP, Capital Spending, Net-Zero, Transition, Investment, 2030
false
Investment Analysis
Environmental Services & Sustainability environmental-services-and-sustainability
Single Chart
McKinsey
View slide
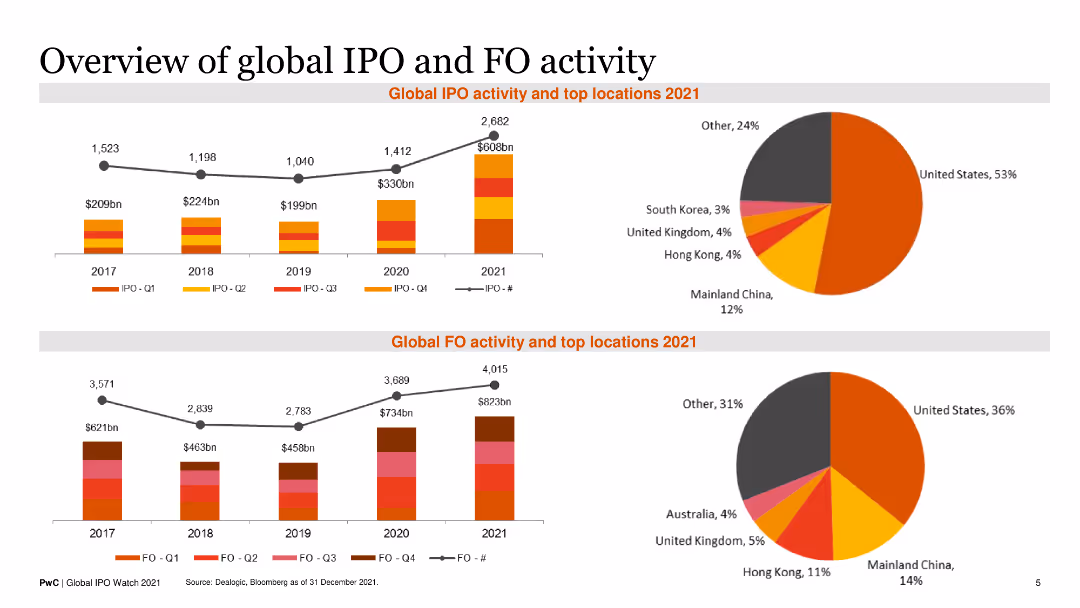
Contains two line charts showing historical IPO and FO activity with accompanying pie charts for top locations in 2021. Text blocks provide summary insights.
Financial Performance
Financial Services
It provides an overview of global IPO and FO activities over recent years, highlighting top regions and growth trends for 2021.
Global IPO, FO Activity, Historical Trends, Top Locations, 2021 Overview
false
Financial Performance
Financial Services financial-services
Multiple Chart
PwC/Strategy&
View slide
Features a bar graphs, detailing global investments with annotations and comparative investment volumes and deal counts in top countries.
Market Analysis and Trends
Agriculture & Food Production
Analyzes global FoodTech sector investments in 2020, with focus on investment volumes and deal counts in the US, China, and India. Offers insight into geographic investment distribution and key market identification for FoodTech investments.
Global Investments, FoodTech, 2020, Investment Volumes, Deal Count, Geographic Distribution
false
Market Analysis and Trends
Agriculture & Food Production agriculture-and-food-production
Mixed Chart
Accenture
View slide
A text section on the left and two pie charts on the right represent the global market size and IBKR's international customer distribution.
Market Analysis and Trends
Financial Services
The slide communicates Interactive Brokers' global reach in terms of customer distribution and market potential, using pie charts to showcase demographic and financial data.
Global Market, Interactive Brokers, Customer Distribution, Pie Charts, Addressable Market, Demographics, Financial Assets, International
false
Market Analysis and Trends
Financial Services financial-services
Multiple Chart
Goldman Sachs
View slide
The slide shows a left section with key strategic priorities and a right section with column chart depicting market share distribution. The design includes blue headers and footers, with the page number at the bottom right.
Competitive Landscape
Financial Services
This slide focuses on the presenter's client-centric approach in global markets, emphasizing strategic priorities and share gains. It includes bar graphs comparing market share over time, useful for presentations on competitive strategy, market analysis, and investment insights in the financial services sector, illustrating how the presenter has strengthened its position in global markets through client-focused strategies and share gains.
Global Markets, Client Focus, Share Gains, Strategy, Competition, Market Analysis
false
Competitive Landscape
Financial Services financial-services
Mixed Chart
Goldman Sachs
View slide
Slide includes financial results tables and a column chart showing net revenues from FICC and equities. The layout is data-heavy with a clear distinction between the segments. Blue and grey bars represent the different revenue streams.
Market Analysis and Trends
Financial Services
Analyzes the financial results in global markets, presenting year-over-year and year-to-date comparisons. Useful for evaluating market trends, and understanding performance in FICC and equities for strategic decision-making.
Global Markets, FICC, Equities, Net Revenue
false
Market Analysis and Trends
Financial Services financial-services
Mixed Chart
Goldman Sachs
View slide
Multiple pie charts, column charts showing financial data.
Strategic Planning
Financial Services
Reviews global market performance and strategies with financial targets and distribution by geography.
Global Markets, Financial Data, Performance, Strategy, Distribution, Growth
false
Strategic Planning
Financial Services financial-services
Multiple Chart
Barclays
View slide
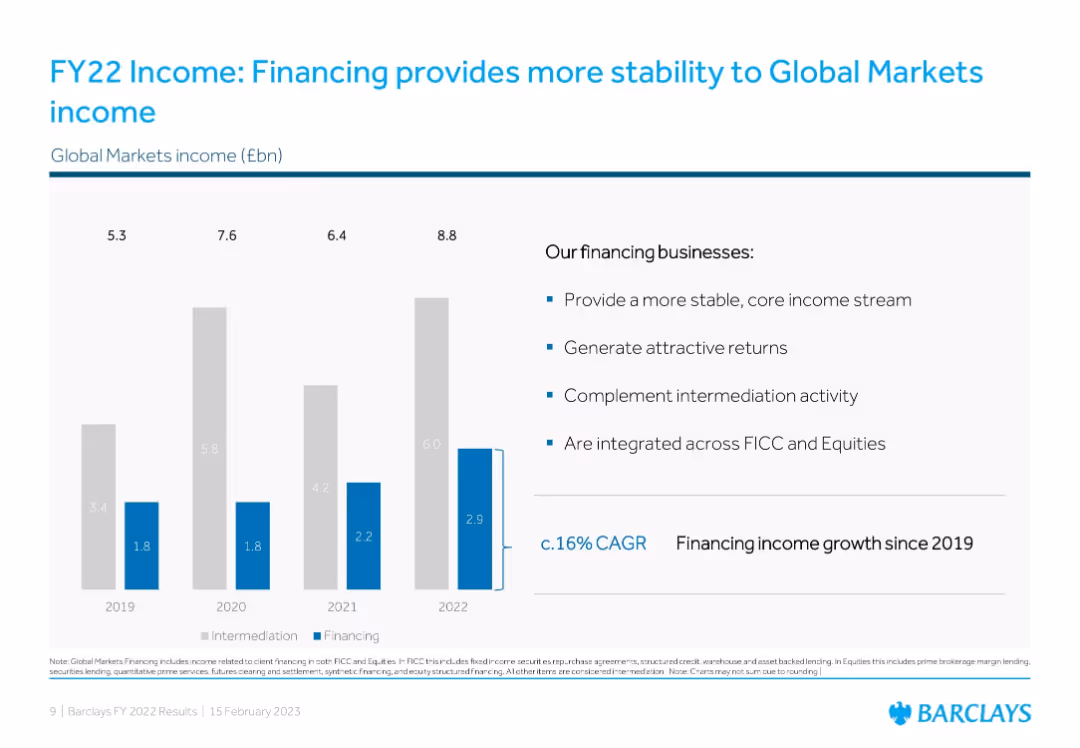
Stacked bar chart (2019–2022) with bullet insights on financing benefits
Market Analysis and Trends
Financial Services
Analyzes growth in Global Markets income from 2019 to 2022, with a focus on stable income streams from financing activities. The slide emphasizes consistent income and strategic integration of financing with intermediation functions.
Global Markets, Financing, Intermediation, Barclays, Income Stability, CAGR, Trends
false
Market Analysis and Trends
Financial Services financial-services
Mixed Chart
Barclays
View slide
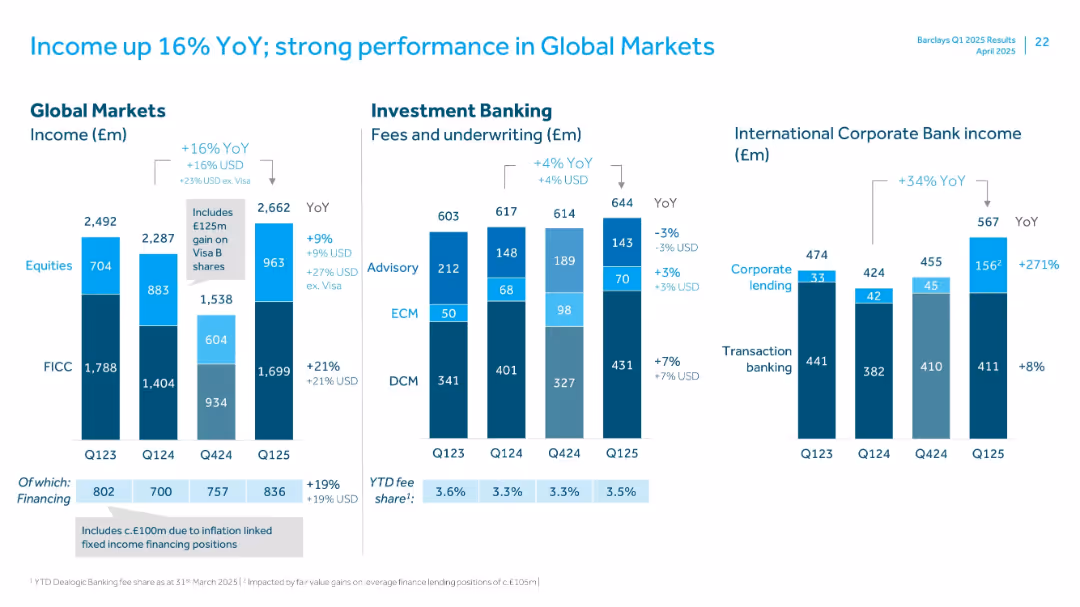
Detailed bar charts with segmented income by business lines including Global Markets and Investment Banking
Financial Performance
Financial Services
Illustrates strong income growth in Global Markets and Investment Banking with a 16% YoY rise. Highlights income sources (equities, FICC, advisory, ECM, DCM) and strong gains in International Corporate Bank.
Global Markets, YoY Income, Investment Banking, FICC, ECM, ICB, Equities, Q125
false
Financial Performance
Financial Services financial-services
Multiple Chart
Barclays
View slide
Text-heavy layout with statistical callouts and minimal icons, focusing on the global mobility of women.
Technology and Digital Transformation
Professional Services
Explains the unmet demand for female international mobility, challenges in developing inclusive global mobility programs, and the representation of women in leadership.
Global Mobility, Female Demand, Leadership, Inclusivity
false
Technology and Digital Transformation
Professional Services professional-services
Boxed
PwC/Strategy&
View slide
Features two major logos at the top, three columns with text and graphics representing global locations, transactions, and contact information.
Client Case Studies
Professional Services
Highlights a consultancy's global reach and expertise in automation, with emphasis on M&A advisory services.
Global Network, Automation, Expertise, M&A Advisory, Consulting, Global Reach
false
Client Case Studies
Professional Services professional-services
Uncategorized
LEK
View slide
A slide with two sections: a map highlighting global reach and a side panel outlining execution priorities. It includes numerical data and textual information in bullet points.
Market Analysis and Trends
Financial Services
The slide provides an overview of the firm's global network, including revenues, offices, employees, and prioritizes strategic growth areas such as advisory services and corporate footprint.
Global Network, Client Relationships, Revenues, Execution Priorities
false
Market Analysis and Trends
Financial Services financial-services
Table
Goldman Sachs
View slide
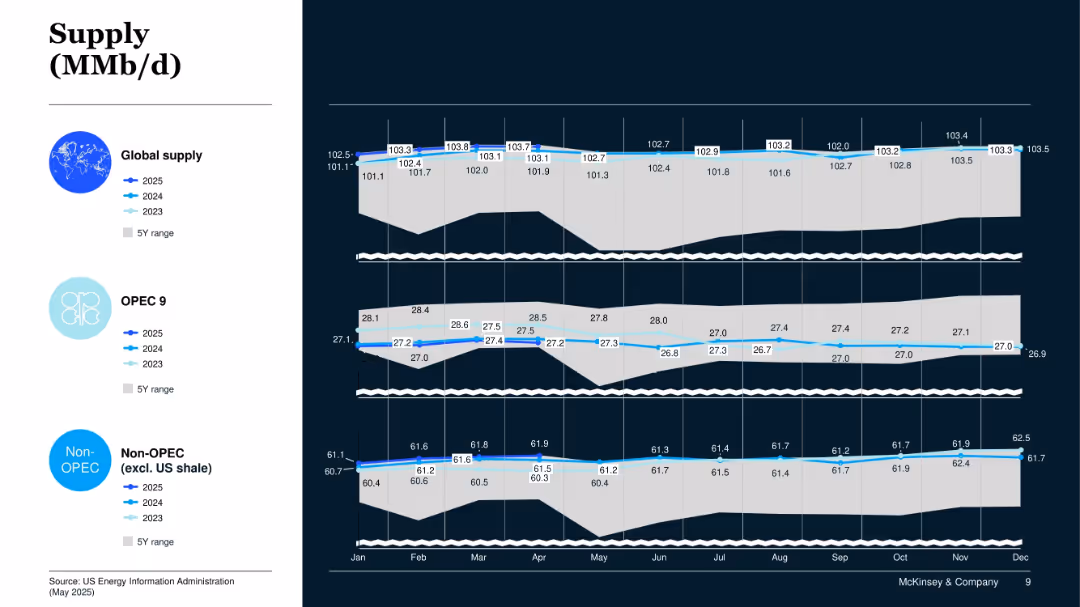
Three-panel line chart showing 2023–2025 global oil supply by global total, OPEC 9, and Non-OPEC; includes 5Y range.
Operational Efficiency
Energy & Utilities
This slide tracks supply trends from 2023 to 2025, focusing on global, OPEC 9, and Non-OPEC sources. It shows moderate growth in global output driven mainly by Non-OPEC sources.
Global Oil Supply, OPEC, Non-OPEC, Supply Trends, Production Forecast
false
Operational Efficiency
Energy & Utilities energy-and-utilities
Mixed Chart
McKinsey
View slide
Icons and bullet points outlining key milestones and future outlooks in product innovation for global payments, including virtual accounts and real-time payments, with a timeline flow on the bottom.
Product and Service Analysis
Financial Services
This slide details recent innovations in global payment products, timelines for rollouts, and future market expansion goals, suitable for product strategy and market analysis discussions.
Global Payments, Innovation, Market Expansion, Virtual Account, API
false
Product and Service Analysis
Financial Services financial-services
Table
JP Morgan
View slide
Pie charts breakdown of Unilever's 2021 turnover by product category. Pie charts showing market distribution and user base. Vibrant blue and red colors.
Industry Overview
Consumer Goods
Summary of Unilever’s global reach and turnover in 2021, highlighting its market distribution between developed and emerging markets and its extensive user base.
Global Reach, Turnover, Market Distribution, Developed Markets, Emerging Markets
false
Industry Overview
Consumer Goods consumer-goods
Multiple Chart
Deutsche Bank
View slide
Title slide with a large background image, presentation title, and date, set for an introductory slide.
Industry Overview
Professional Services
Introduces a series on global restart dynamics, indicating it's the start of a discussion on COVID-19's impact.
Global Restart, COVID-19, Pandemic, Key Dynamics, Perspectives Series
false
Industry Overview
Professional Services professional-services
Title
BCG
View slide
Includes world maps colored by region to represent international expansion, complemented by key data points about market coverage and investment banking capabilities.
Strategic Planning
Financial Services
Explores JPMorgan’s strategy to compete globally by leveraging its platform and capabilities in foreign markets, focusing on the value of foreign investments and cross-border payments.
Global Strategy, International, Banking, Investment, Market Coverage, Payments
false
Strategic Planning
Financial Services financial-services
Header Vertical
JP Morgan
View slide
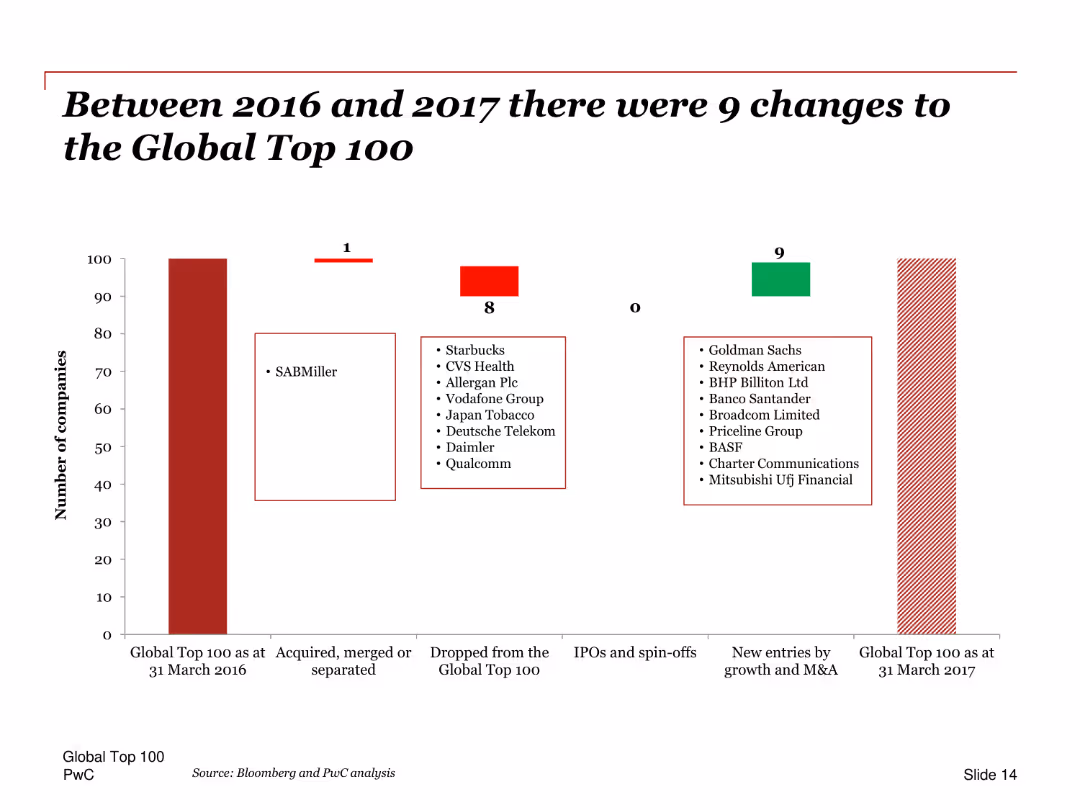
A column chart showing changes in the Global Top 100 companies between 2016 and 2017. Includes a list of companies that entered and exited the list, and those that were acquired or merged.
Competitive Landscape
Financial Services
This slide illustrates the changes in the Global Top 100 companies from 2016 to 2017, including companies that were acquired, merged, or separated, as well as new entries and exits. It provides a comprehensive overview of the dynamic shifts in the top companies.
Global Top 100, changes, 2016, 2017, acquisitions, mergers, exits, entries, column chart
false
Competitive Landscape
Financial Services financial-services
Single Chart
PwC/Strategy&
View slide
Column charts and tables showing profit before tax and other financial metrics by region for Global Wealth Management.
Financial Performance
Financial Services
Reviews the regional performance of Global Wealth Management for Q3 2022, focusing on profit and cost metrics.
Global Wealth Management, regions, financial performance, UBS, 3Q22, profit, cost/income ratio, invested assets
false
Financial Performance
Financial Services financial-services
Multiple Chart
UBS
View slide
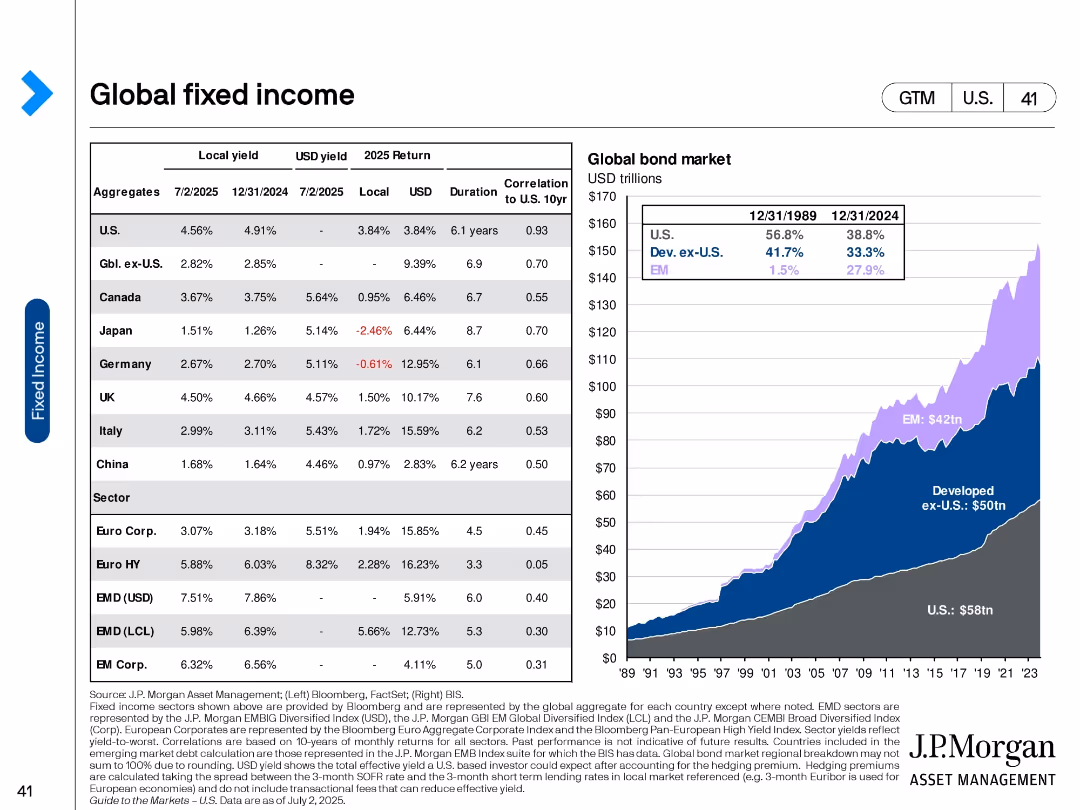
Table with returns and yields by region and sector; area chart of global bond market size over time.
Investment Analysis
Financial Services
Combines detailed bond return/yield data for key regions with a chart showing the growth of global bond markets since 1989. Highlights the dominance of U.S. and emerging market bonds and projected returns.
Global bonds, fixed income, returns, yields, emerging markets, developed markets, U.S. bonds, investment allocation
false
Investment Analysis
Financial Services financial-services
Mixed Chart
JP Morgan
View slide
The slide features a horizontal bar chart showing the change in agreement with the statement on global brands from 2021 to 2022 in various countries.
Market Analysis and Trends
Technology & Software
The slide highlights an increase in the preference for global brands over the past year across different markets.
Global brands, market preference, survey, public opinion, brand analysis
false
Market Analysis and Trends
Technology & Software technology-and-software
Mixed Chart
IPSOS
View slide
The slide includes a vertical bar chart comparing net agreement with the statement on global citizenship across various countries.
Market Analysis and Trends
Technology & Software
The slide presents survey data showing mixed feelings about global citizenship, particularly in emerging markets.
Global citizenship, emerging markets, survey, public opinion, international trends
false
Market Analysis and Trends
Technology & Software technology-and-software
Mixed Chart
IPSOS
View slide
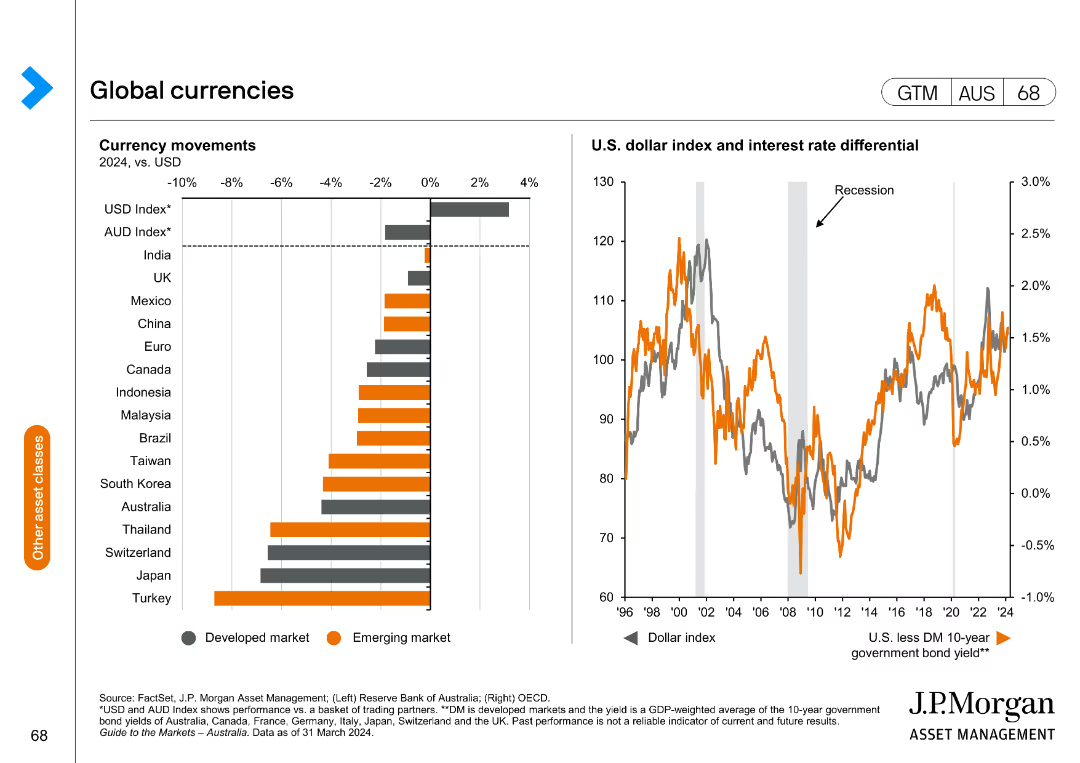
The slide features a bar chart on the left displaying currency movements in 2024 vs. USD for developed and emerging markets. The right chart is a line chart showing the U.S. dollar index and interest rate differential.
Market Analysis and Trends
Financial Services
This slide provides an analysis of global currency movements and the U.S. dollar's performance, useful for understanding currency trends and their impact on the global market.
Global currencies, USD index, interest rate, currency movements, financial analysis, developed markets, emerging markets
false
Market Analysis and Trends
Financial Services financial-services
Multiple Chart
JP Morgan
View slide
This slide features two bar charts: one showing the bond market size in value and as a percentage of GDP for various countries, and another showing the debt and bonds as a percentage of GDP by country, broken down by government, corporate, and household sectors.
Market Analysis and Trends
Financial Services
The slide analyzes the global debt and bond market, comparing the market sizes and debt levels across countries, and breaking down the types of debt to provide insights into the financial health and risks associated with different economies.
Global debt, bond market, market size, GDP, government debt, corporate debt, household debt, financial health, economic analysis, financial risks
false
Market Analysis and Trends
Financial Services financial-services
Multiple Chart
JP Morgan
View slide
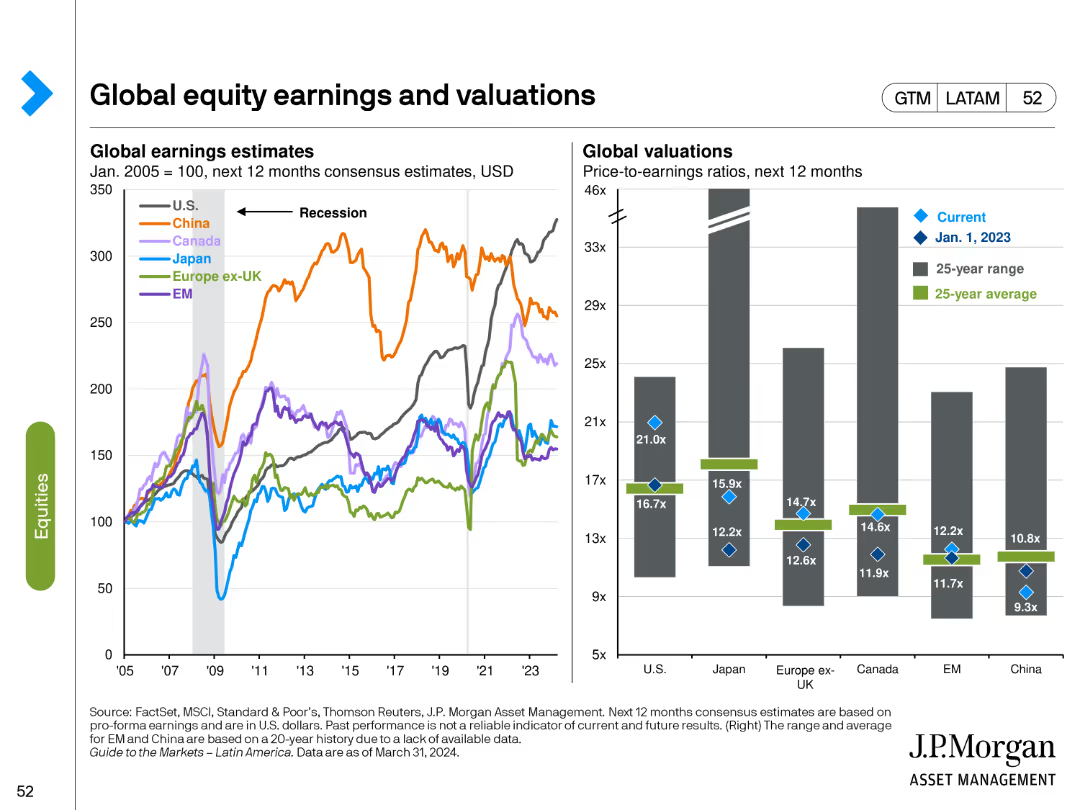
This slide includes a line chart for global earnings estimates and a bar chart for global valuations. Different colors represent various regions and time periods, highlighting trends and comparisons.
Financial Performance
Financial Services
It provides a comparison of earnings estimates and valuation metrics across global equity markets, helping to identify trends and potential investment opportunities based on relative valuations.
Global equities, earnings estimates, valuations, comparative analysis, trends
false
Financial Performance
Financial Services financial-services
Multiple Chart
JP Morgan
View slide
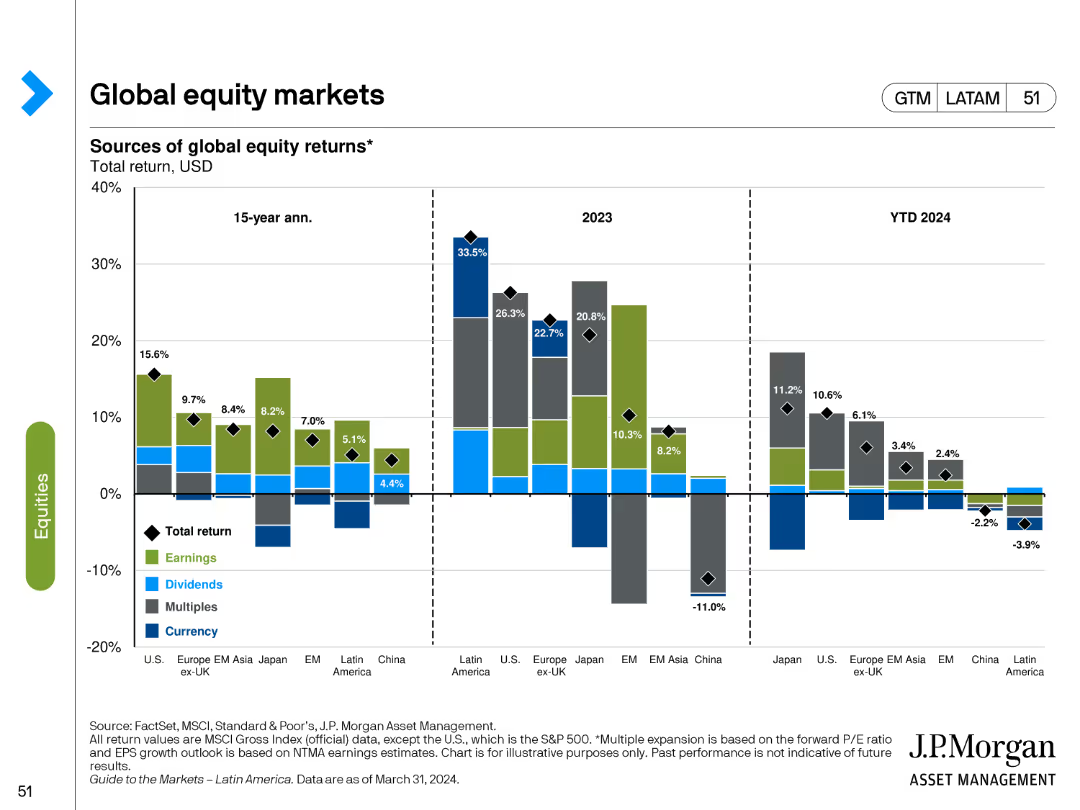
The slide features bar charts showing sources of global equity returns over different time periods. It uses various colors to represent different components of total return, such as earnings, dividends, and currency effects.
Market Analysis and Trends
Financial Services
It examines the sources of equity returns across global markets, providing insights into the factors driving performance in different regions and time frames.
Global equities, returns, earnings, dividends, currency effects
false
Market Analysis and Trends
Financial Services financial-services
Multiple Chart
JP Morgan
View slide
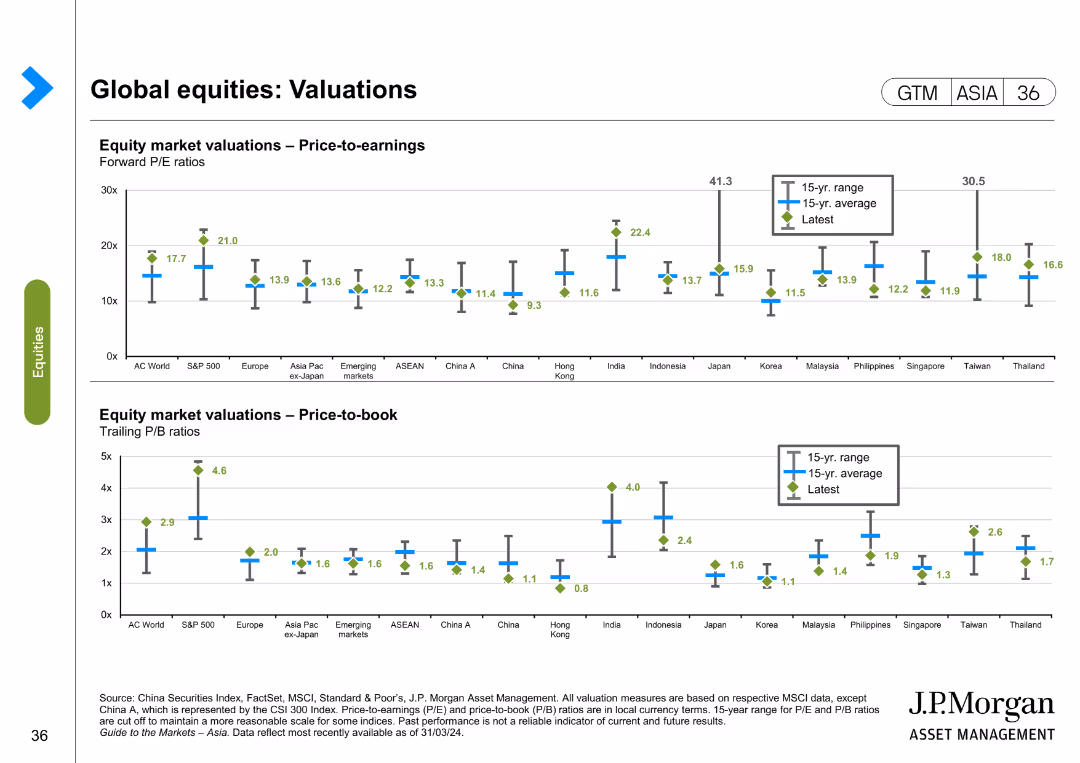
This slide contains two column charts. The first chart shows equity market valuations in terms of price-to-earnings ratios for various regions. The second chart shows price-to-book ratios. Color coding and markers represent different data points such as 15-year range, 15-year average, and the latest values.
Financial Performance
Financial Services
The slide analyzes global equity valuations through price-to-earnings and price-to-book ratios, comparing different regions to identify market trends and investment opportunities. It is used for financial performance evaluation and investment decision-making.
Global equities, valuations, price-to-earnings, price-to-book, financial markets, investment, Asia, Europe, AC World, S&P 500
false
Financial Performance
Financial Services financial-services
Multiple Chart
JP Morgan
Previous
Loading...
Hold On!
We are searching in our database
If nothing, comes up, please try different filters!
Column Chart
Heatmap
Chevron
Org Chart
Infographic
Callouts
Timeline
List
Graphic
Picture
Process Flow
Diagram
Paragraph
Map
Table
Framework
Subtitle
Takeaway Box
Icon
Other Chart
Radar Chart
Waterfall Chart
Mekko Chart
Pie Chart
Scatter Plot
Line Chart
Bar chart
Bullet points
Create a FREE account to continue browsing
Receive Instant Access to 1,000+ slides from companies like McKinsey, Google, and Goldman Sachs
First Name
Last Name
Email
Password
I agree to all
Terms & Privacy Policy
Thank you! Your submission has been received!
Oops! Something went wrong while submitting the form.
Have an account?
Sign in
Upgrade to PRO to Save slides
Advanced Search and Filters
Access to 15,000+ slides
Access to Category Pages
Save/Bookmark Slides
PowerPoint Template Library
Pick a Plan
MONTHLY
$12/month
Billed every month, Cancel anytime.
YEARLY
$9/year
Billed $108 annually, Cancel anytime.
Checkout for $12/month
Checkout for $108/yr
Secured by Stripe | AES-256 bit encryption