My Account
My Slides
Search by Category
Templates
View All Templates
Download Template Slides
Leave Feedback
Login
Logout
Get Started
Browse all Slides
Browse all Slides
Create a FREE Account
Instant access to 1,000+ real slides from top companies like McKinsey, BCG, Goldman Sachs, Google and many more!
First Name
Last Name
Email
Password
I agree to all
Terms & Privacy Policy
Thank you! Your submission has been received!
Oops! Something went wrong while submitting the form.
Have an account?
Sign in
Spark Your Next Big Idea with New Presentation Templates
VIEW ALL Templates
Welcome,
Welcome
PRO
Show Featured Only
Checkbox 8
Companies
Mckinsey
Bain
BCG
EY
Deloitte
Accenture
PwC/Strategy&
JP Morgan
Goldman Sachs
Morgan Stanley
Citigroup
Deutsche Bank
Barclays
LEK
KPMG
Kearney
Oliver Wyman
Booz Allen Hamilton
Gartner
IPSOS
Nielsen
Slide type
Text Only
Linear Flow
Vertical Flow
Single Chart
Header Horizontal
Mixed Chart
Header Vertical
Pillar
Multiple Chart
Graphic
Agenda
Title
Table
Framework
Industry
Technology & Software
Artificial Intelligence
Financial Services
Retail & E-commerce
Consumer Goods
Industrial & Manufacturing
Transportation & Logistics
Telecommunications
Real Estate & Construction
Hospitality & Tourism
Professional Services
Education & Training
Media & Entertainment
Agriculture & Food Production
Healthcare & Pharmaceuticals
Environmental Services & Sustainability
Government & Public Sector
Use Case
Mergers and Acquisitions
Performance Metrics and KPIs
Client Case Studies
Competitive Landscape
Corporate Finance and Valuation
Product and Service Analysis
Customer and Market Segmentation
Organizational Structure and Change
Industry Overview
Regulatory and Compliance
Risk Assessment and Management
Investment Analysis
Organizational Structure and Change
Human Resources and Talent Management
Financial Performance
Market Analysis and Trends
Sales and Business Development
Human Resources and Talent Management
Clear all
Thank you! Your submission has been received!
Oops! Something went wrong while submitting the form.
Tag
View slide
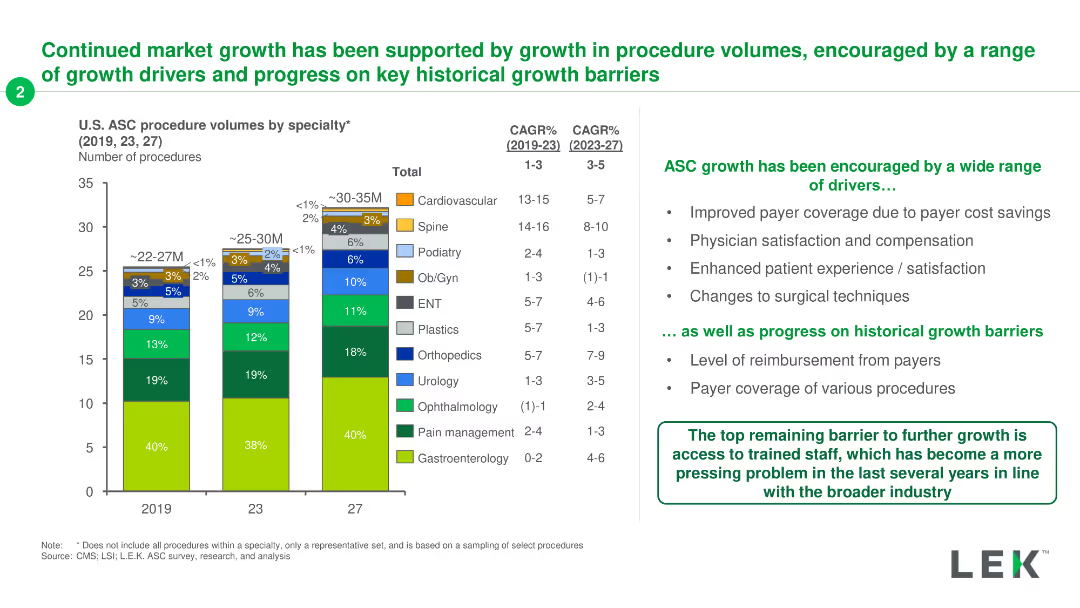
The slide features a clustered column chart showing the number of procedures by specialty from 2019 to 2027, with different colors for each specialty.
Market Analysis and Trends
Healthcare & Pharmaceuticals
It presents data on the volume of ASC procedures by specialty, including growth rates and future projections, highlighting key growth drivers and barriers.
ASC, procedure, specialty, volume, growth
false
Market Analysis and Trends
Healthcare & Pharmaceuticals healthcare-and-pharmaceuticals
Mixed Chart
LEK
View slide
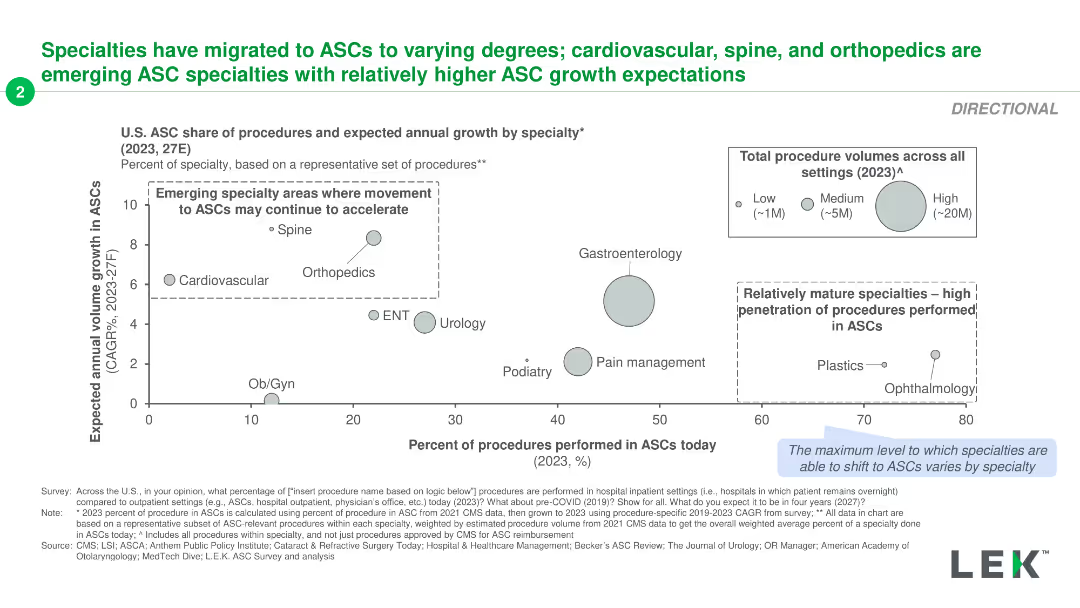
The slide contains a bubble chart mapping specialties by procedure share and expected growth, with additional commentary on migration to ASCs.
Market Analysis and Trends
Healthcare & Pharmaceuticals
It shows the share of procedures and expected annual growth for various ASC specialties, highlighting the areas with the highest growth expectations.
ASC, share, procedures, growth, specialties
false
Market Analysis and Trends
Healthcare & Pharmaceuticals healthcare-and-pharmaceuticals
Single Chart
LEK
View slide
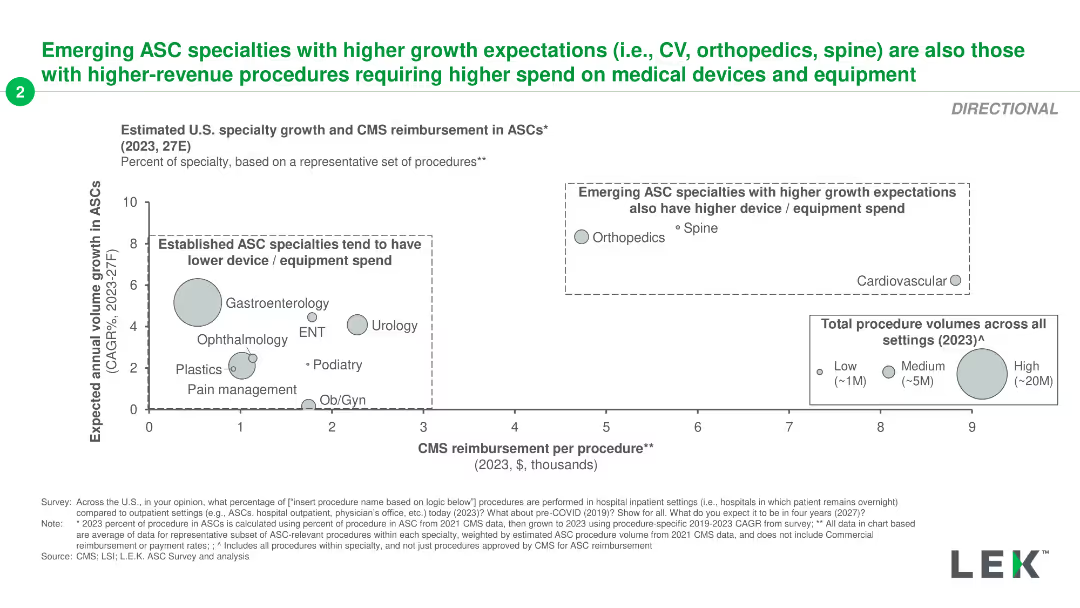
The slide features a scatter plot comparing CMS reimbursement per procedure with expected growth for different ASC specialties.
Market Analysis and Trends
Healthcare & Pharmaceuticals
It examines the relationship between CMS reimbursement and growth expectations for ASC specialties, noting higher spend for emerging specialties like orthopedics.
ASC, specialties, growth, reimbursement, CMS
false
Market Analysis and Trends
Healthcare & Pharmaceuticals healthcare-and-pharmaceuticals
Single Chart
LEK
View slide
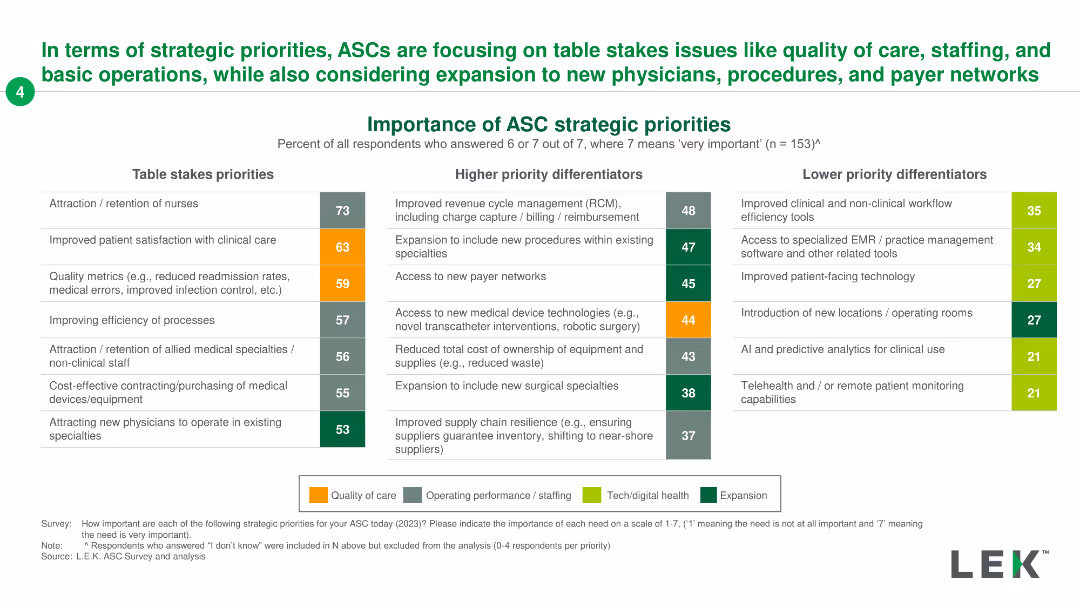
The slide features a two-column chart listing table stakes priorities and higher priority differentiators for ASC strategies, with emphasis on various operational aspects.
Strategic Planning
Healthcare & Pharmaceuticals
It outlines the strategic priorities for ASCs, emphasizing critical areas like staffing, patient care, and operational improvements, along with high-priority differentiators.
ASC, strategic, priorities, staffing, care
false
Strategic Planning
Healthcare & Pharmaceuticals healthcare-and-pharmaceuticals
Table
LEK
View slide
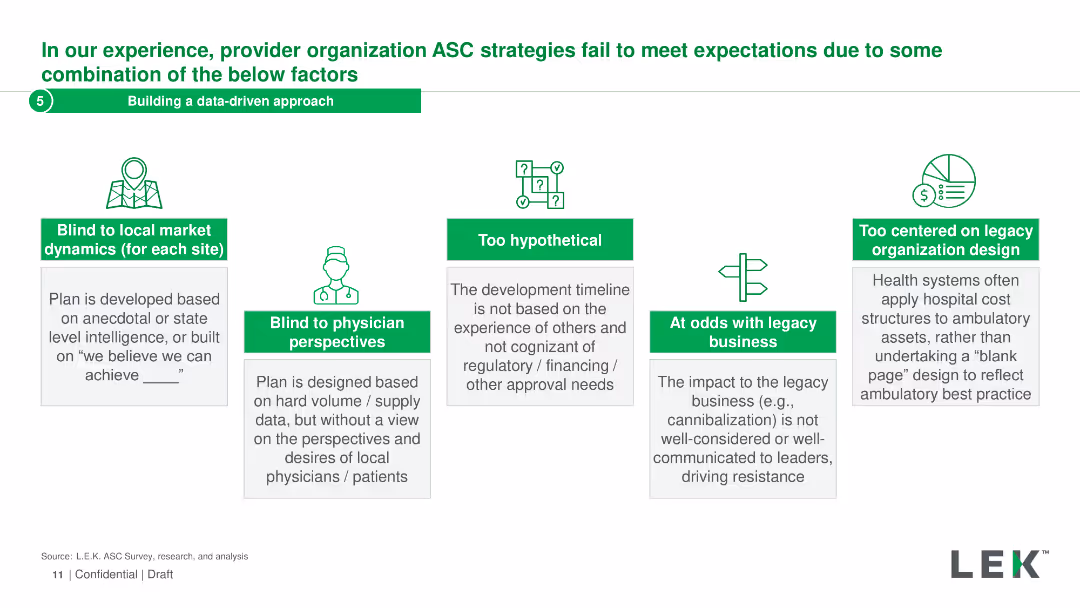
This slide has a five-column layout with icons and text explaining factors that affect ASC strategies, such as market dynamics and physician perspectives.
Operational Efficiency
Healthcare & Pharmaceuticals
It outlines the common pitfalls in ASC strategies due to various factors like ignoring market dynamics, hypothetical plans, and legacy business impacts.
ASC, strategy, data-driven, approach, pitfalls
false
Operational Efficiency
Healthcare & Pharmaceuticals healthcare-and-pharmaceuticals
Pillar
LEK
View slide
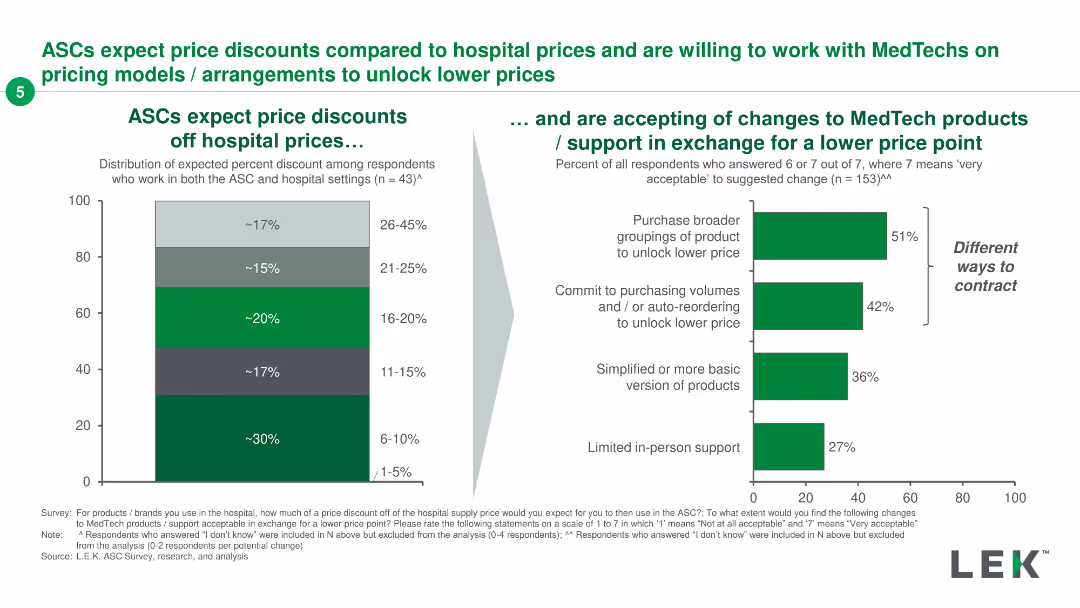
Two-part slide with a column chart showing expected price discounts off hospital prices and a horizontal bar chart detailing acceptability of changes for a lower price point.
Pricing Strategies
Healthcare & Pharmaceuticals
The slide shows expected price discounts ASCs want off hospital prices and the acceptance of changes in MedTech products/support for lower prices, emphasizing different contracting methods.
ASCs, MedTech, pricing models, discounts, price point
false
Pricing Strategies
Healthcare & Pharmaceuticals healthcare-and-pharmaceuticals
Multiple Chart
LEK
View slide
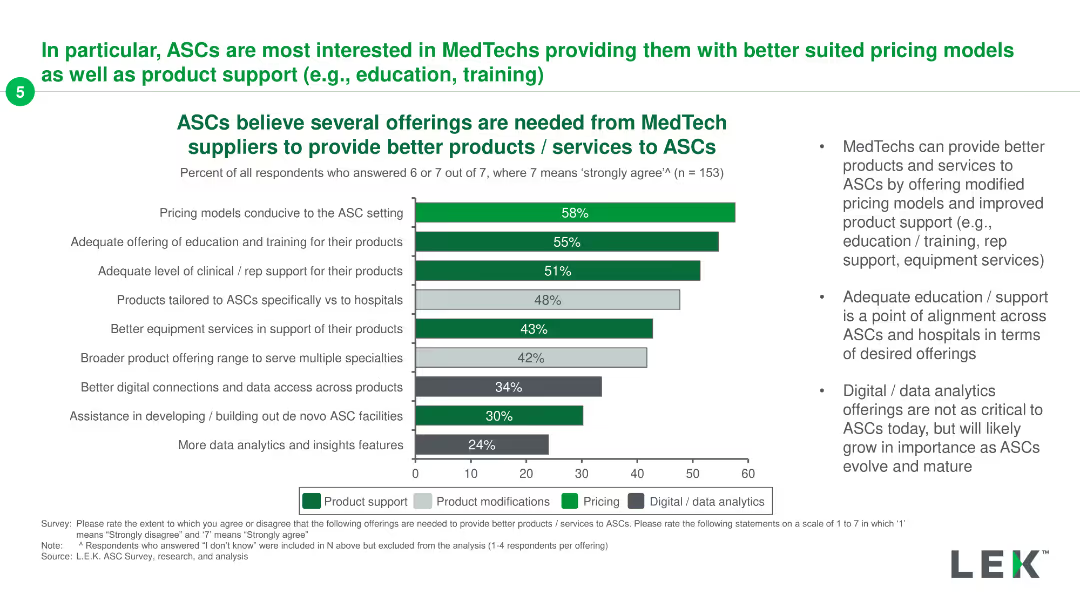
Horizontal bar chart with multiple categories like product support, product modifications, pricing, and digital/data analytics, each represented with different colored bars.
Product and Service Analysis
Healthcare & Pharmaceuticals
The slide presents survey data on what offerings ASCs need from MedTech suppliers, highlighting product support, modifications, pricing, and digital/data analytics.
ASCs, MedTech, product support, pricing, data analytics
false
Product and Service Analysis
Healthcare & Pharmaceuticals healthcare-and-pharmaceuticals
Mixed Chart
LEK
View slide
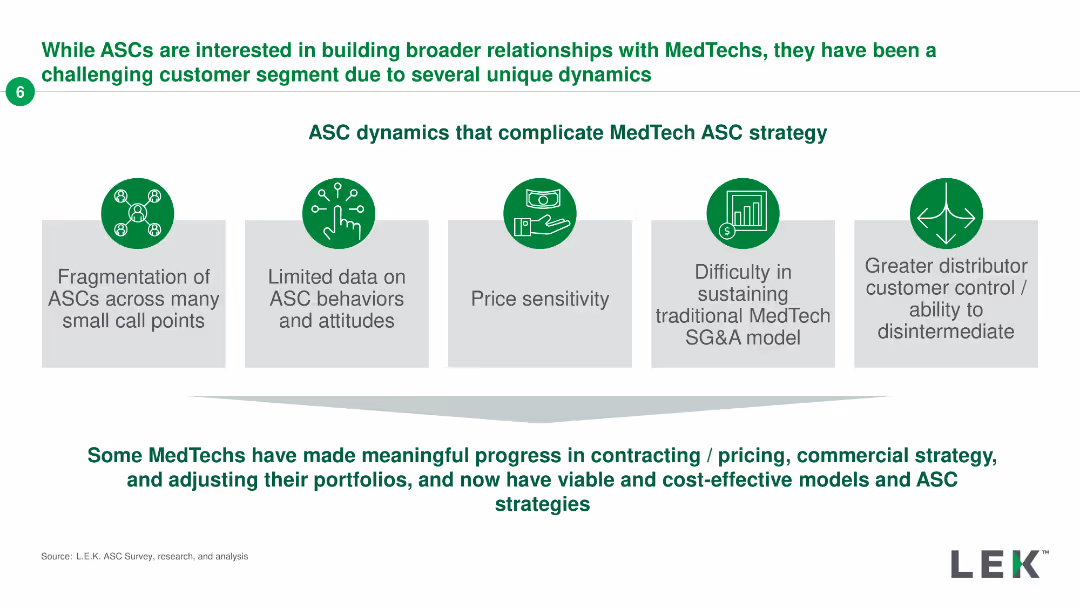
Diagram with icons and text boxes explaining ASC dynamics such as fragmentation, limited data, price sensitivity, traditional model sustainability, and distributor control.
Strategic Planning
Healthcare & Pharmaceuticals
Highlights complexities in ASC strategies for MedTechs, including fragmentation, data limitations, price sensitivity, traditional model issues, and distributor control.
ASCs, MedTech, strategy, dynamics, fragmentation
false
Strategic Planning
Healthcare & Pharmaceuticals healthcare-and-pharmaceuticals
Pillar
LEK
View slide
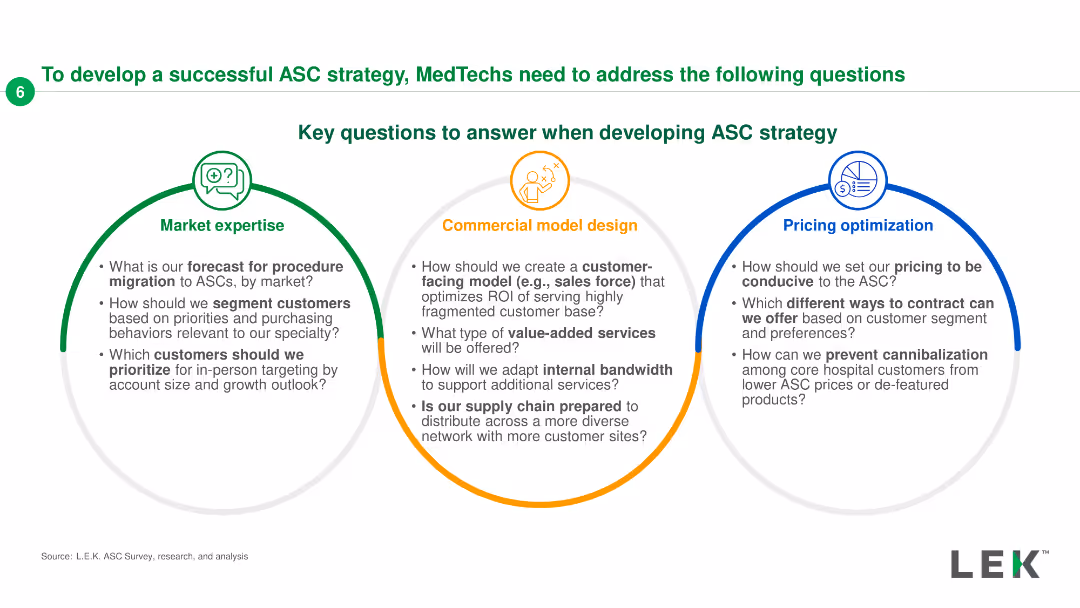
Three-section layout with icons and text, each section focusing on market expertise, commercial model design, and pricing optimization.
Strategic Planning
Healthcare & Pharmaceuticals
Provides key strategic questions for developing ASC strategies, covering market forecasting, customer segmentation, commercial model design, and pricing optimization.
ASCs, strategy, market expertise, commercial design, pricing
false
Strategic Planning
Healthcare & Pharmaceuticals healthcare-and-pharmaceuticals
Pillar
LEK
View slide
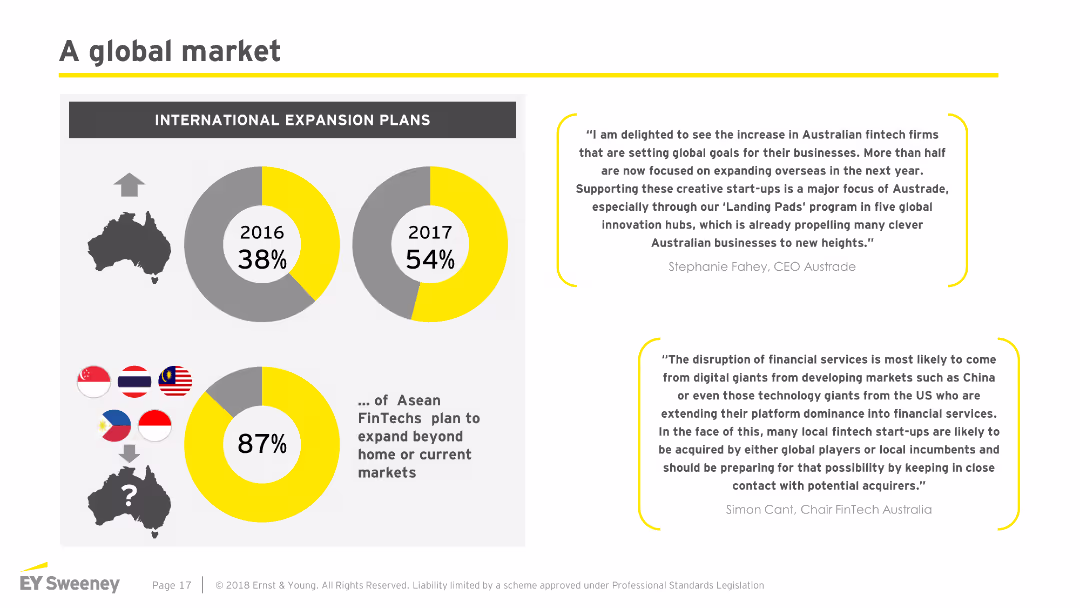
The slide features three circular graphs showing percentages of international expansion plans for ASEAN FinTechs, and two quotes.
Market Analysis and Trends
Financial Services
The slide discusses the increase in international expansion plans among ASEAN FinTech firms, highlighting statistics for 2016 and 2017, and includes expert quotes.
ASEAN, FinTech, expansion, global, market analysis, trends, international, quotes, statistics, 2017
false
Market Analysis and Trends
Financial Services financial-services
Multiple Chart
EY
View slide
The slide contains a column chart showing GDP breakdown by industry for 2023 and two bar charts. The left bar chart presents real GDP growth from 2014 to 2023, and the right bar chart shows GDP per capita for various ASEAN countries.
Market Analysis and Trends
Financial Services
This slide provides an overview of GDP growth across ASEAN countries, comparing industry contributions, real GDP growth rates, and GDP per capita to analyze regional economic performance.
ASEAN, GDP growth, industry breakdown, real GDP growth, GDP per capita
false
Market Analysis and Trends
Financial Services financial-services
Multiple Chart
JP Morgan
View slide
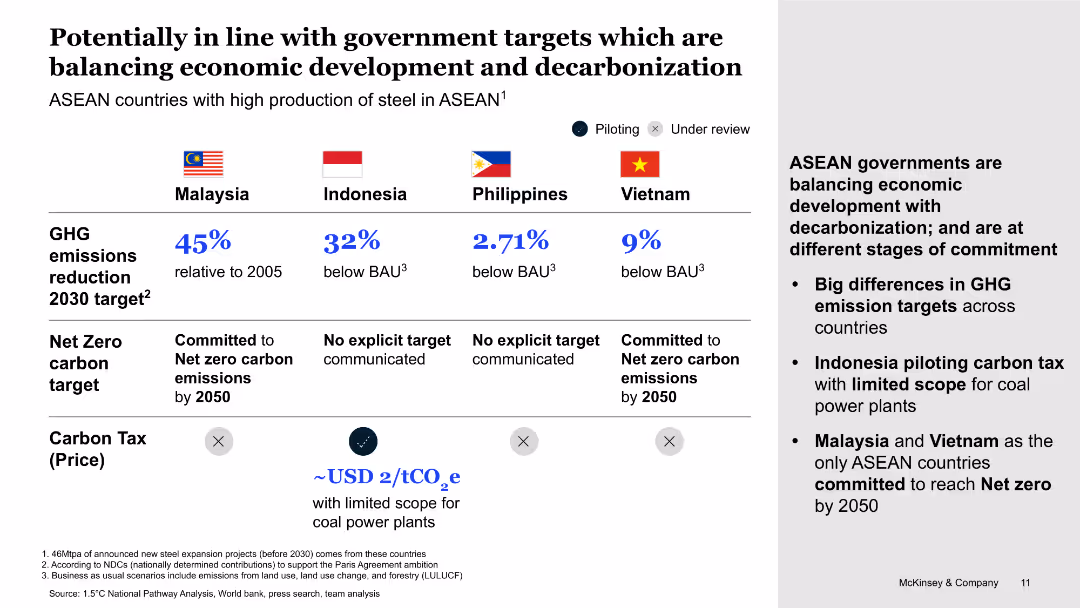
The slide features a table comparing GHG emission reduction targets, net-zero commitments, and carbon tax policies for ASEAN countries, with a descriptive sidebar.
Regulatory and Compliance
Government & Public Sector
This slide compares ASEAN countries' commitments to economic development and decarbonization, highlighting differences in GHG emission targets, net-zero goals, and carbon tax implementation.
ASEAN, economic development, decarbonization, GHG targets, carbon tax
false
Regulatory and Compliance
Government & Public Sector government-and-public-sector
Boxed
McKinsey
View slide
Three large interconnected circles with statistics and an ASEAN logo in the center against a bold red background.
Market Analysis and Trends
Financial Services
This slide projects ASEAN's economic growth, demographic details, and future outlook, with a focus on the young working population and literacy rates. It's suitable for illustrating ASEAN's potential as a growing economic power and discussing investment opportunities.
ASEAN, economic growth, demographics, young population, literacy, investment opportunities, outlook, economic power
false
Market Analysis and Trends
Financial Services financial-services
Boxed
Kearney
View slide
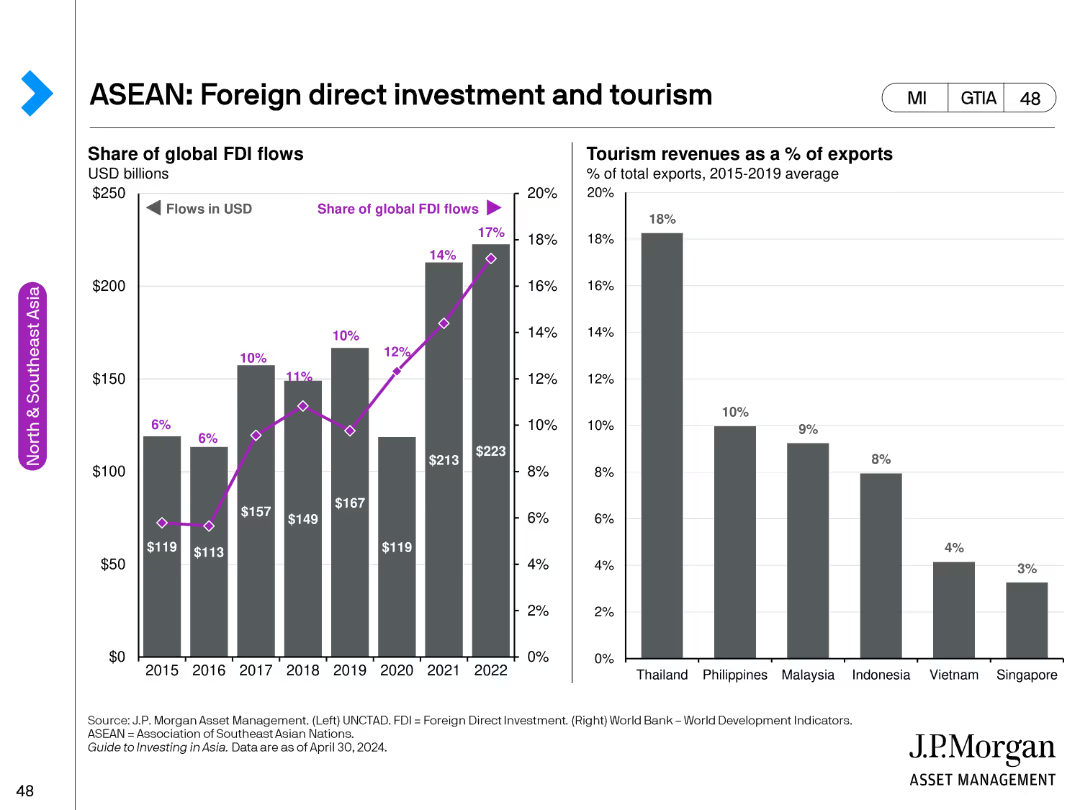
The left side of the slide features a bar chart showing the share of global FDI flows from 2015 to 2022. The right side has a bar chart depicting tourism revenues as a percentage of total exports for ASEAN countries.
Investment Analysis
Financial Services
This slide analyzes foreign direct investment trends and tourism revenues in ASEAN countries, providing insights into economic inflows and their impact on regional economies.
ASEAN, foreign direct investment, tourism, economic analysis, regional inflows
false
Investment Analysis
Financial Services financial-services
Multiple Chart
JP Morgan
View slide
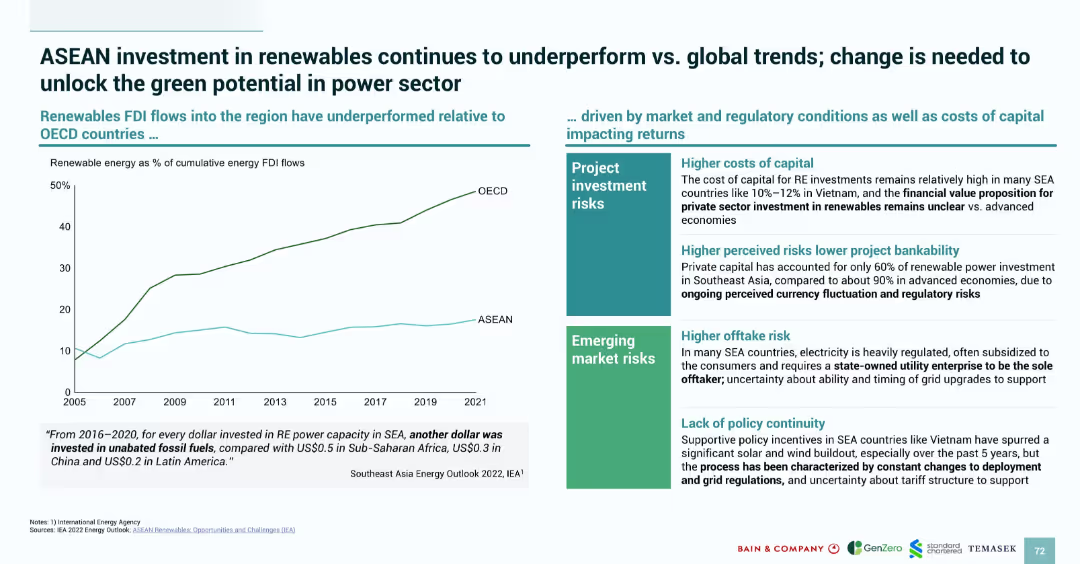
Left-aligned line graph comparing OECD and ASEAN renewable FDI flows over time; right side contains risk factors in two categories with bullet points.
Market Analysis and Trends
Energy & Utilities
Compares ASEAN renewable energy investment trends to OECD nations, showing underperformance. It attributes the gap to high costs of capital, regulatory uncertainty, offtake risks, and lack of policy continuity. Reinforces how risk perception hampers bankability of renewable projects and the need for improved regulatory clarity.
ASEAN, renewable energy, FDI, investment risk, policy continuity, regulatory risk, capital costs, energy sector, OECD
false
Market Analysis and Trends
Energy & Utilities energy-and-utilities
Mixed Chart
Bain
View slide
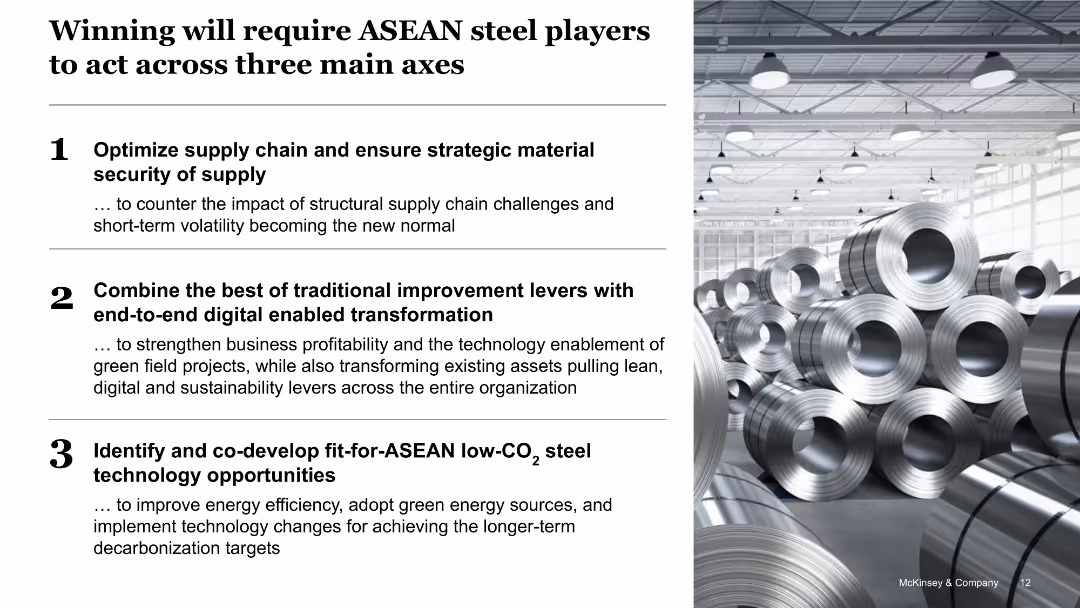
The slide has a white background with black text. It includes three numbered points and a large image of rolled steel on the right side.
Strategic Planning
Industrial & Manufacturing
The slide outlines three main strategies for ASEAN steel players: optimizing supply chain, combining traditional and digital transformation, and co-developing low-CO2 technology.
ASEAN, steel, supply chain, digital transformation, CO2 technology
false
Strategic Planning
Industrial & Manufacturing industrial-and-manufacturing
Vertical Flow
McKinsey
View slide
A vibrant, illustrative cover with bold lettering and a detailed isometric graphic depicting various business scenes.
Organizational Structure and Change
Professional Services
This cover slide introduces a playbook on talent management within the ASEAN region, emphasizing growth and scalability. It's designed to grab attention with its striking visual elements, setting the stage for a discussion on human resources and talent retention strategies.
ASEAN, talent management, growth, scale, playbook, human resources, retention, cover slide, illustration
false
Organizational Structure and Change
Professional Services professional-services
Title
Kearney
View slide
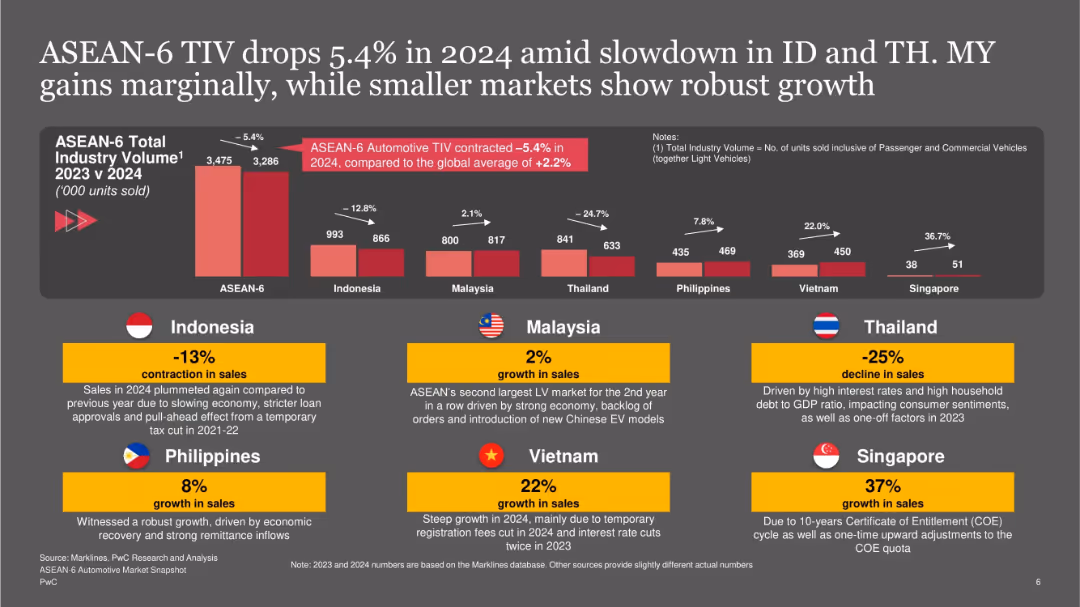
Central bar chart with red bars shows volume change by country; bottom row has yellow country boxes with growth/decline stats and explanations; dark background with bold white title.
Market Analysis and Trends
Industrial & Manufacturing
Provides a breakdown of ASEAN-6 Total Industry Volume changes from 2023 to 2024. Highlights significant contractions in Indonesia and Thailand, while countries like Vietnam and Singapore saw robust growth. It emphasizes local economic and policy factors behind these shifts in vehicle sales.
ASEAN-6, automotive sales, TIV, Indonesia, Malaysia, Thailand, growth, decline, 2024
false
Market Analysis and Trends
Industrial & Manufacturing industrial-and-manufacturing
Mixed Chart
PwC/Strategy&
View slide
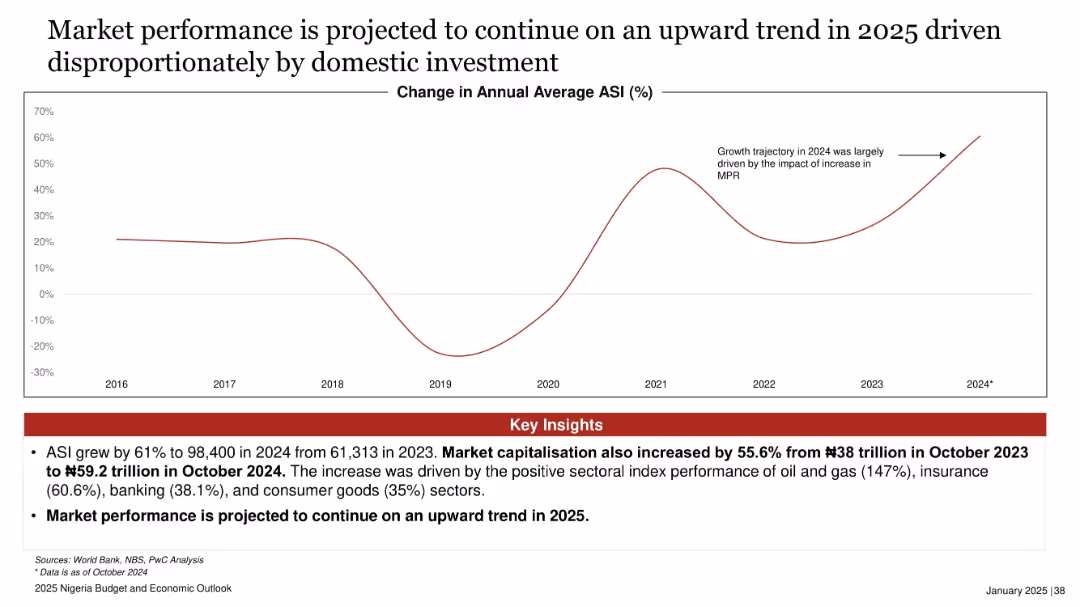
Line graph showing % change in ASI from 2016 to 2024 with a projected increase; red insights box at bottom.
Financial Performance
Financial Services
Nigeria's All Share Index (ASI) rose significantly in 2024 driven by domestic investments, with projections of continued growth in 2025. Sectors like oil & gas, insurance, and banking were major contributors to this performance.
ASI, stock market, Nigeria, 2025, domestic investment, capital market, market cap, sector performance, MPR
false
Financial Performance
Financial Services financial-services
Mixed Chart
PwC/Strategy&
View slide
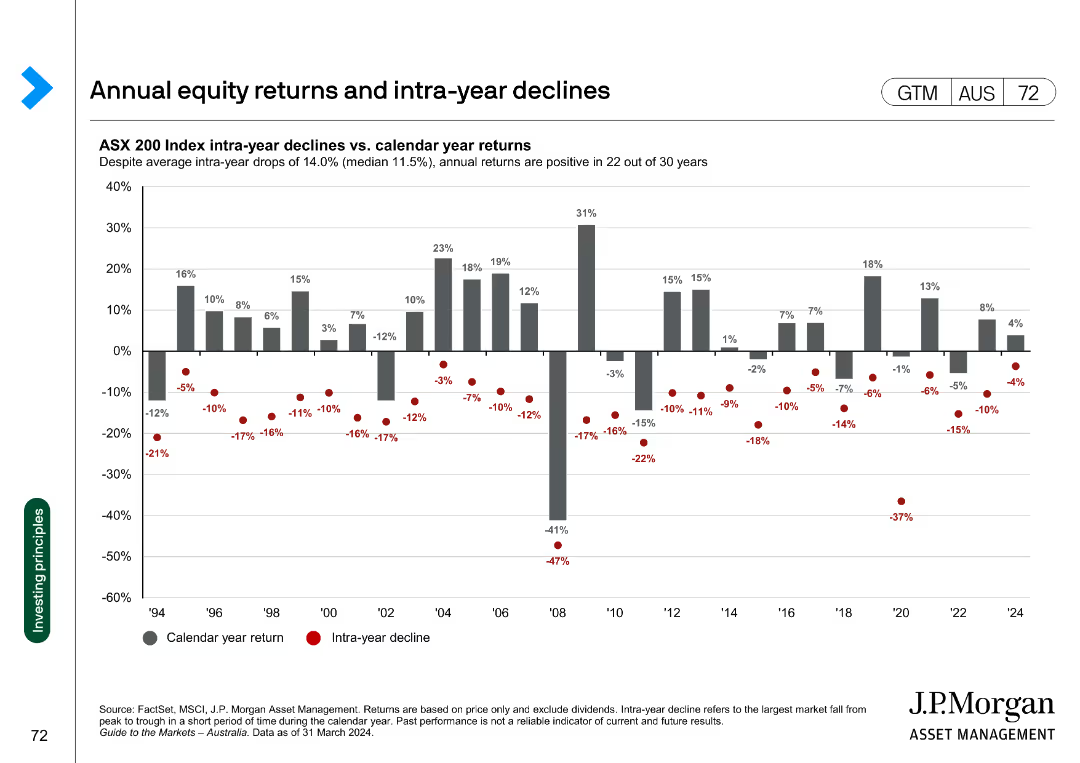
The slide presents a column chart showing ASX 200 Index intra-year declines versus calendar year returns, with calendar year returns as gray bars and intra-year declines as red dots.
Financial Performance
Financial Services
Compares the annual returns and intra-year declines of the ASX 200 Index over 30 years, highlighting that annual returns were positive in 22 out of 30 years.
ASX 200, returns, declines, financial performance, annual returns, intra-year, column chart
false
Financial Performance
Financial Services financial-services
Single Chart
JP Morgan
View slide
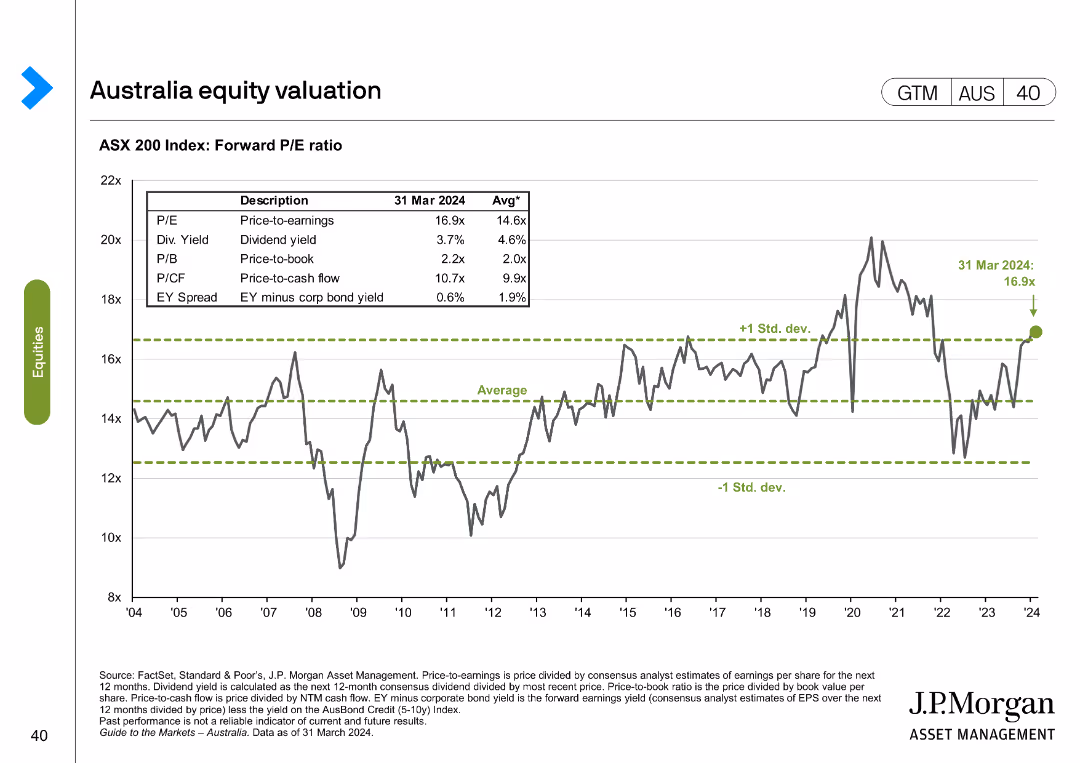
The slide presents a line chart with ASX 200 Index forward P/E ratio over time and a table with different valuation metrics as of March 2024 compared to historical averages.
Financial Performance
Financial Services
This slide evaluates the ASX 200 Index's forward P/E ratio and other valuation metrics, comparing current figures to historical averages.
ASX 200, valuation, metrics, forward P/E, historical
false
Financial Performance
Financial Services financial-services
Single Chart
JP Morgan
View slide
This slide contains four column charts and a set of small data tables. The charts are used to compare different types of capital requirements and their respective buffers at a given point in time, alongside future projections for capital in graphical and tabular formats.
Risk Assessment and Management
Financial Services
The slide discusses the management of AT1 and T2 capital needs across the total capital structure, emphasizing the strategic approach to maintaining buffer levels to manage financial risks and requirements effectively.
AT1, T2, capital management, buffer, projections
false
Risk Assessment and Management
Financial Services financial-services
Multiple Chart
Barclays
View slide
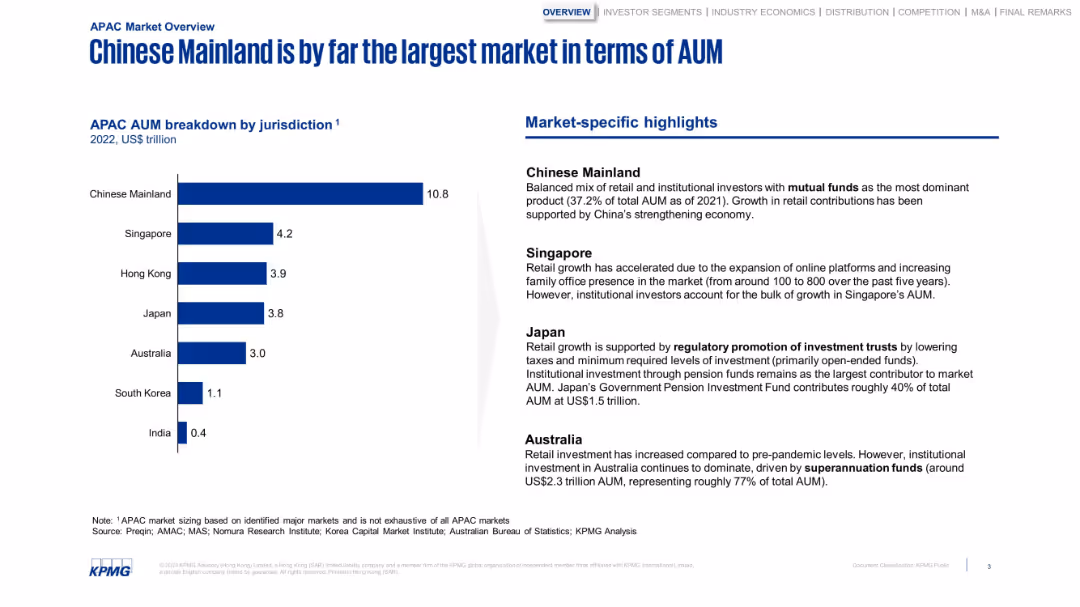
Bar chart with jurisdictional AUM and a column of highlights. Structured and minimalistic with strong blue tones.
Market Analysis and Trends
Financial Services
Breaks down APAC AUM by country, highlighting China’s dominance. The sidebar notes market-specific factors like regulatory frameworks, pension fund dominance, and online platform growth in Singapore and Japan.
AUM, China, Japan, Singapore, investment, retail growth, pensions
false
Market Analysis and Trends
Financial Services financial-services
Mixed Chart
KPMG
View slide
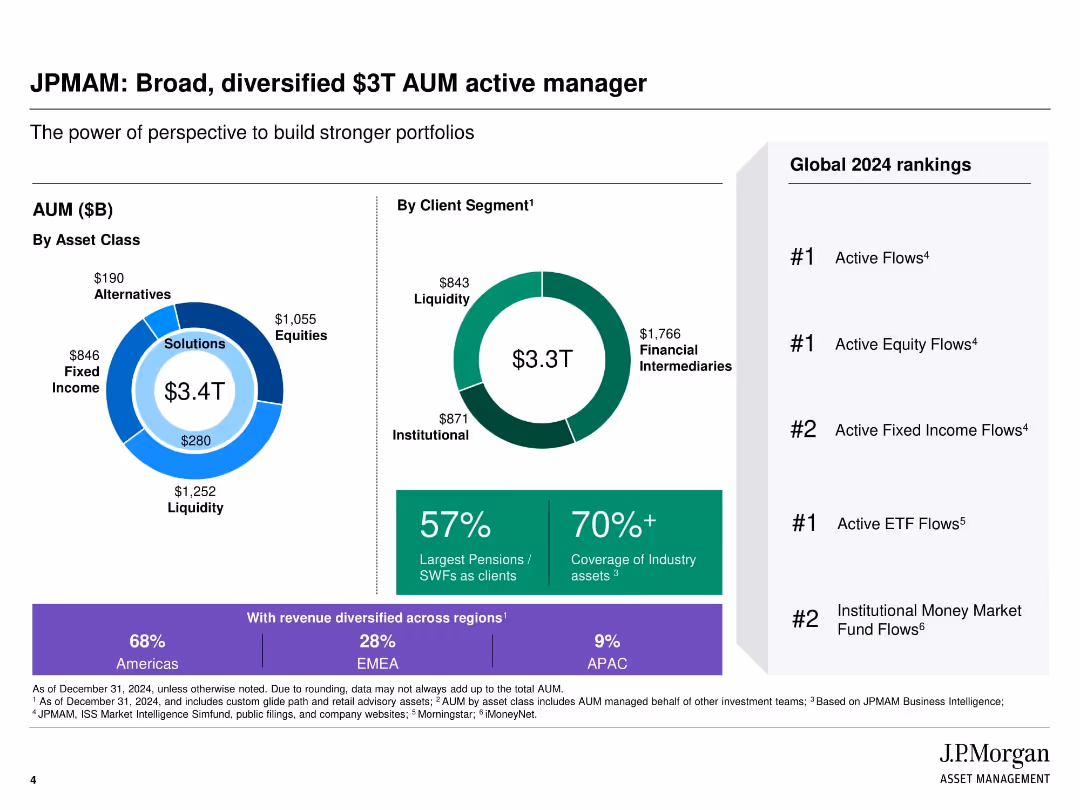
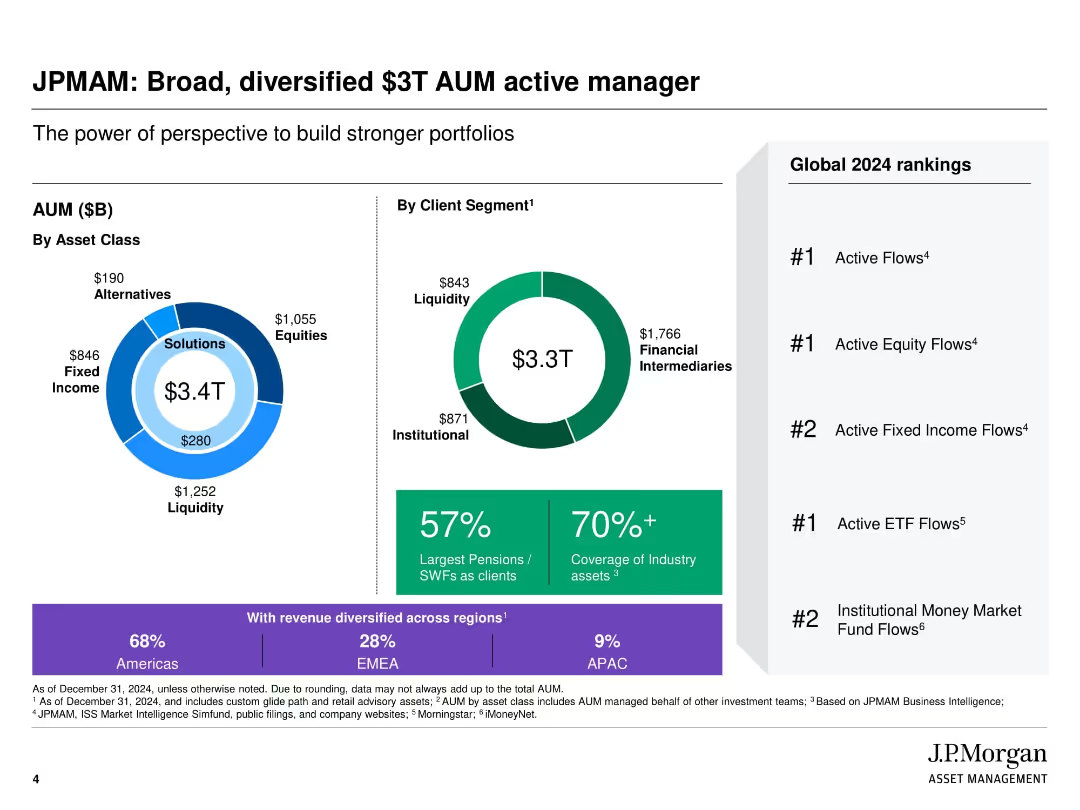
Data-driven layout with donut charts, bar segments, and ranked bullet points; split into asset class, client segment, and global rankings.
Industry Overview
Financial Services
This slide presents J.P. Morgan Asset Management’s total assets under management (AUM) by asset class and client segment, totaling $3.3T. It emphasizes global rankings, client coverage, and geographic revenue diversification.
AUM, JPMorgan, asset management, global ranking, institutional clients, financial intermediaries, liquidity, EMEA, APAC
false
Industry Overview
Financial Services financial-services
Multiple Chart
JP Morgan
View slide
Circular infographics and bar charts showing AUM distribution by asset class and client type; ranking list on the right
Industry Overview
Financial Services
Highlights the scale and diversification of JPMorgan Asset Management, emphasizing its $3.3T AUM and strong global rankings in various asset classes. Shows distribution by client segments, asset classes, and regional revenue breakdown, reinforcing JPMAM’s breadth and reach.
AUM, asset classes, global rankings, client segment, JPMorgan, diversification, industry leader
false
Industry Overview
Financial Services financial-services
Multiple Chart
JP Morgan
View slide
This slide is visually dense with column charts comparing different financial metrics from 2014 and 2019. It employs color coding to distinguish between the years.
Operational Efficiency
Financial Services
It analyzes the impact of secular trends on various financial services and how a company can navigate through them. It’s meant for discussing strategies in overcoming industry challenges.
AUM, commission rates, trading volume, net revenue
false
Operational Efficiency
Financial Services financial-services
Multiple Chart
JP Morgan
View slide
Column chart with labeled segments showing changes in Assets Under Management (AUM) over time.
Financial Performance
Financial Services
The slide shows the AUM movement within Macquarie Asset Management, detailing the effects of various business activities and market conditions. This visual aids in the analysis of asset growth and investment strategies, suitable for investor updates and strategic planning discussions.
AUM, investment, growth, assets, management
false
Financial Performance
Financial Services financial-services
Single Chart
Morgan Stanley
View slide
Features two column charts: Left chart shows firmwide AUS in trillions from 2019 to Q1 2022. Right chart illustrates firmwide management and other fees in billions from 2019 to 2024 targets. An arrow indicates a CAGR of +12%.
Financial Performance
Financial Services
This slide analyzes the growth in assets under supervision (AUS) and associated fees over time, projecting a continuous upward trend. It presents past performance and future targets, positioning the firm's growth within the financial services industry.
AUS growth, fee analysis, financial performance, CAGR, projections, column chart
false
Financial Performance
Financial Services financial-services
Multiple Chart
Goldman Sachs
View slide
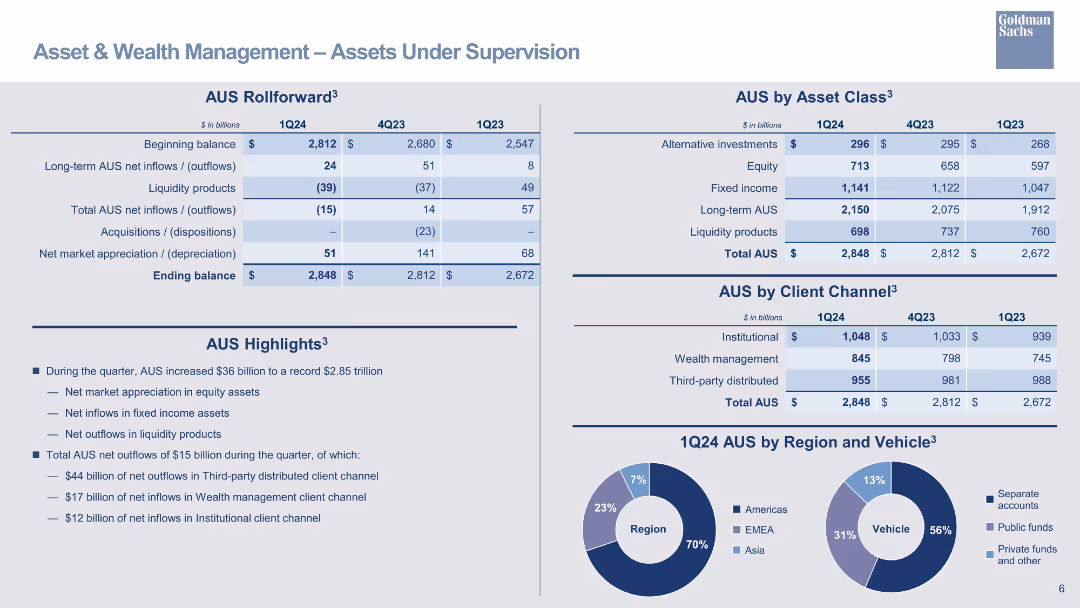
Tables showing AUS rollforward and AUS by asset class, client channel, and region, with pie charts for regional and vehicle distribution.
Operational Efficiency
Financial Services
Provides a detailed overview of assets under supervision, including net inflows/outflows and asset class breakdown.
AUS, assets under supervision, net inflows, asset class, client channel, region, pie chart
false
Operational Efficiency
Financial Services financial-services
Mixed Chart
Goldman Sachs
View slide
A bar chart showing potential reach of the TV screen by source for different age groups, with a focus on AVOD reach and its incremental gain.
Market Analysis and Trends
Media & Entertainment
The slide highlights that AVOD content has the greatest reach potential among younger viewers, showing significant incremental gains in audience reach.
AVOD, reach, potential, younger viewers, incremental gain
false
Market Analysis and Trends
Media & Entertainment media-and-entertainment
Multiple Chart
Nielsen
Previous
Loading...
Hold On!
We are searching in our database
If nothing, comes up, please try different filters!
Column Chart
Heatmap
Chevron
Org Chart
Infographic
Callouts
Timeline
List
Graphic
Picture
Process Flow
Diagram
Paragraph
Map
Table
Framework
Subtitle
Takeaway Box
Icon
Other Chart
Radar Chart
Waterfall Chart
Mekko Chart
Pie Chart
Scatter Plot
Line Chart
Bar chart
Bullet points
Create a FREE account to continue browsing
Receive Instant Access to 1,000+ slides from companies like McKinsey, Google, and Goldman Sachs
First Name
Last Name
Email
Password
I agree to all
Terms & Privacy Policy
Thank you! Your submission has been received!
Oops! Something went wrong while submitting the form.
Have an account?
Sign in
Upgrade to PRO to Save slides
Advanced Search and Filters
Access to 15,000+ slides
Access to Category Pages
Save/Bookmark Slides
PowerPoint Template Library
Pick a Plan
MONTHLY
$12/month
Billed every month, Cancel anytime.
YEARLY
$9/year
Billed $108 annually, Cancel anytime.
Checkout for $12/month
Checkout for $108/yr
Secured by Stripe | AES-256 bit encryption