My Account
My Slides
Search by Category
Templates
Leave Feedback
Login
Logout
Get Started
Browse all Slides
Browse all Slides
Create a FREE Account
Instant access to 1,000+ real slides from top companies like McKinsey, BCG, Goldman Sachs, Google and many more!
First Name
Last Name
Email
Password
I agree to all
Terms & Privacy Policy
Thank you! Your submission has been received!
Oops! Something went wrong while submitting the form.
Have an account?
Sign in
📢 Ready to start building slides? Check out our new template library
VIEW TEMPLATES
Welcome,
Welcome
PRO
Show Featured Only
Checkbox 8
Companies
Mckinsey
Bain
BCG
EY
Deloitte
Accenture
PwC/Strategy&
JP Morgan
Goldman Sachs
Morgan Stanley
Citigroup
Deutsche Bank
Barclays
LEK
KPMG
Kearney
Oliver Wyman
Booz Allen Hamilton
Gartner
IPSOS
Nielsen
Slide type
Text Only
Linear Flow
Vertical Flow
Single Chart
Header Horizontal
Mixed Chart
Header Vertical
Pillar
Multiple Chart
Graphic
Agenda
Title
Table
Framework
Industry
Technology & Software
Artificial Intelligence
Financial Services
Retail & E-commerce
Consumer Goods
Industrial & Manufacturing
Transportation & Logistics
Telecommunications
Real Estate & Construction
Hospitality & Tourism
Professional Services
Education & Training
Media & Entertainment
Agriculture & Food Production
Healthcare & Pharmaceuticals
Environmental Services & Sustainability
Government & Public Sector
Use Case
Mergers and Acquisitions
Performance Metrics and KPIs
Client Case Studies
Competitive Landscape
Corporate Finance and Valuation
Product and Service Analysis
Customer and Market Segmentation
Organizational Structure and Change
Industry Overview
Regulatory and Compliance
Risk Assessment and Management
Investment Analysis
Organizational Structure and Change
Human Resources and Talent Management
Financial Performance
Market Analysis and Trends
Sales and Business Development
Human Resources and Talent Management
Clear all
Thank you! Your submission has been received!
Oops! Something went wrong while submitting the form.
Tag
View slide
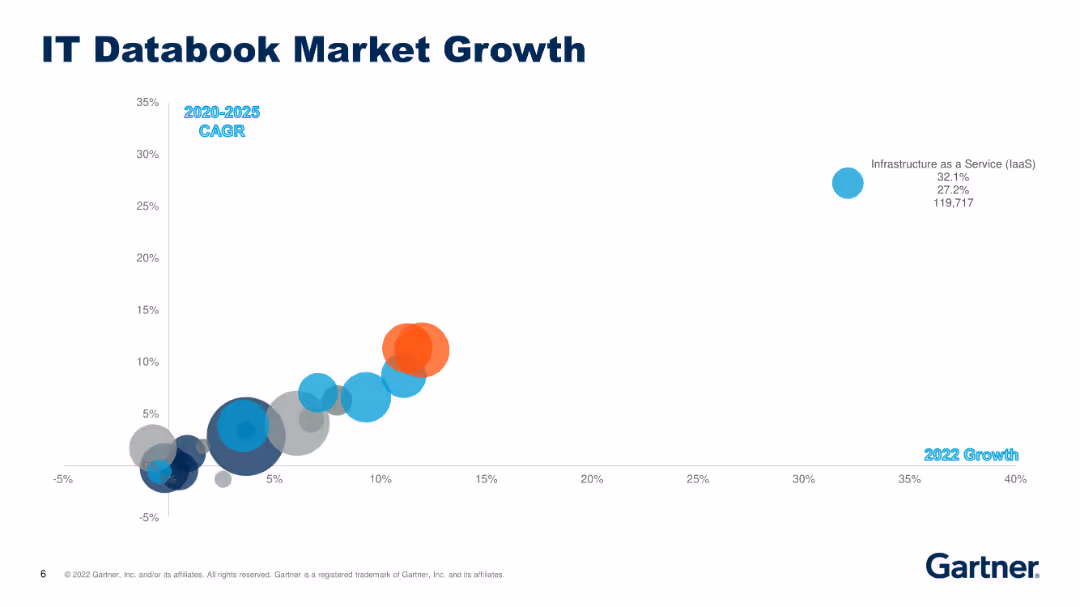
The slide includes a scatter plot showing IT market growth across various segments, highlighting growth rates and compound annual growth rates (CAGR) for different IT services and products from 2020 to 2025.
Market Analysis and Trends
Technology & Software
The slide presents a detailed analysis of market growth in the IT sector, highlighting segments like infrastructure as a service (IaaS), enterprise application software, and consulting with projected CAGR.
IT market, growth, CAGR, 2020-2025, segments, services, products, infrastructure, enterprise, consulting
false
Market Analysis and Trends
Technology & Software technology-and-software
Single Chart
Gartner
View slide
The slide features a scatter plot showing growth rates for various IT segments, including infrastructure software, business process services, and consulting, with projected CAGR from 2020 to 2025.
Market Analysis and Trends
Technology & Software
The slide provides a comprehensive view of IT market growth, highlighting key segments such as infrastructure software and business process services, along with their projected growth rates.
IT market, growth, segments, infrastructure, software, business process, consulting, CAGR, 2020-2025
false
Market Analysis and Trends
Technology & Software technology-and-software
Single Chart
Gartner
View slide
Graph depicting reduction in operational backlogs, images of textual data concerning IT improvements and customer service.
Operational Efficiency
Financial Services
Describes the outcomes of IT migration and service improvements at Postbank, focusing on operational efficiency and customer service enhancements.
IT migration, operational efficiency, customer service, Q4
false
Operational Efficiency
Financial Services financial-services
Multiple Chart
Deutsche Bank
View slide
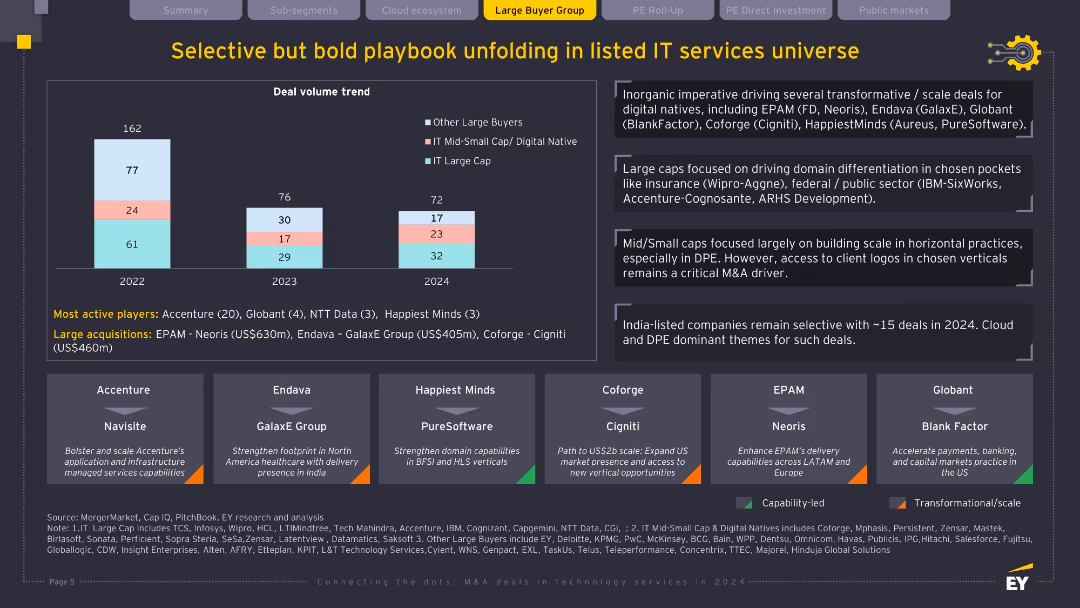
Column chart for deal volume by buyer type (2022–2024); lower third features company callouts; black and yellow theme with segmented insights; clean, bold visual language.
Mergers and Acquisitions
Technology & Software
This slide shows a nuanced M&A strategy among IT service providers, categorizing buyers into large caps, mid-small caps, and others. It highlights key players like Accenture, Globant, and Endava, and strategic themes such as domain expansion, vertical capabilities, and North American delivery enhancement. Deal volume is stable but more targeted.
IT services, M&A, listed companies, deal volume, strategic acquisition, buyer trends
false
Mergers and Acquisitions
Technology & Software technology-and-software
Mixed Chart
EY
View slide
Incorporates bullet points and icons to discuss potential acquisition targets in the IT services sector, focusing on six specific opportunities.
Investment Analysis
Technology & Software
Discusses strategic acquisition opportunities within the IT services sector, highlighting areas with potential growth and resilience in market downturns.
IT services, acquisitions, targets, opportunities, strategic growth
false
Investment Analysis
Technology & Software technology-and-software
Table
BCG
View slide
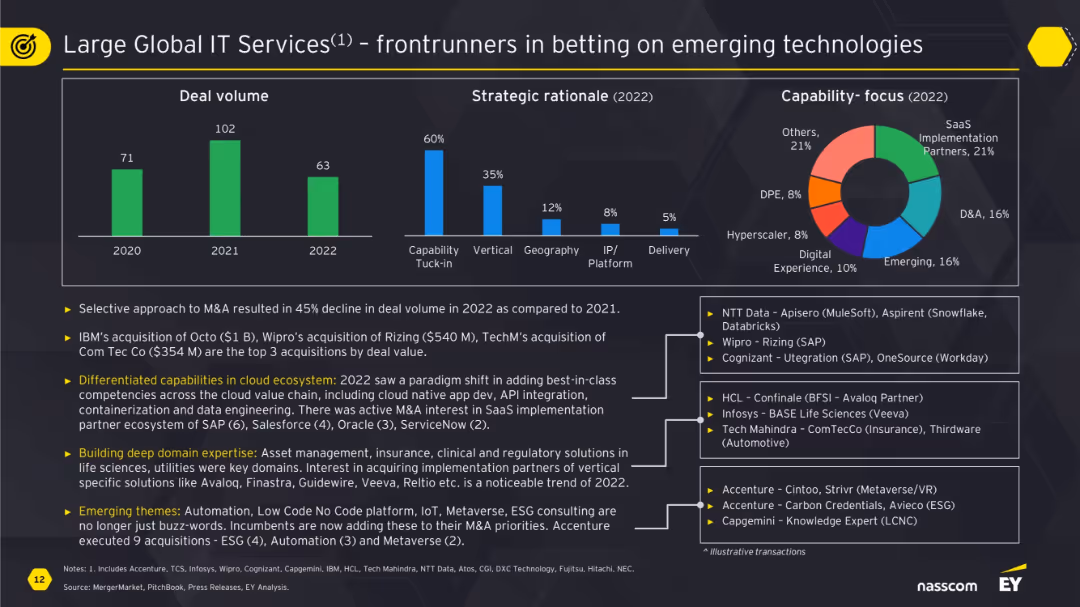
Three-part layout: bar chart on deal volume, bar chart on strategic rationale, and pie chart for capability focus; includes illustrative transactions.
Technology and Digital Transformation
Technology & Software
This slide outlines M&A trends among large global IT service providers. The focus is on capability tuck-ins and vertical integration, with significant deals in cloud and emerging tech. It mentions IBM, Wipro, and TechM among the major acquirers. Pie charts show SaaS and D&A as top priorities. Highlights show a strategic push toward building domain expertise and deepening cloud capabilities.
IT services, cloud, M&A, SaaS, vertical, emerging tech, deal volume
false
Technology and Digital Transformation
Technology & Software technology-and-software
Multiple Chart
EY
View slide
This slide features two column charts. The first chart shows IT Run-the-Bank spend, indicating a 9% reduction from 2015 to 2018. The second chart displays IT incidents, showing a 21% reduction.
Operational Efficiency
Financial Services
The slide presents data on IT spending and incident reduction, highlighting the success of strategic cost transformation in improving system stability.
IT spend, cost reduction, IT incidents, stability, transformation, system improvement, strategic cost, IT efficiency, financial metrics, P&L
false
Operational Efficiency
Financial Services financial-services
Multiple Chart
Credit Suisse
View slide
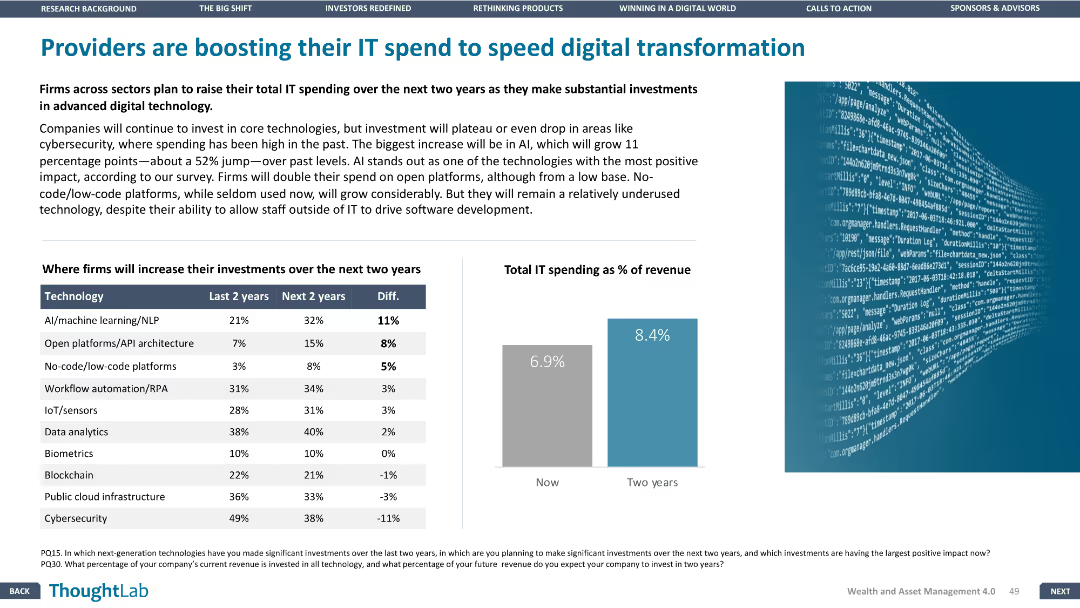
The slide has a column chart and a bar chart, with a focus on the differences in IT spending over the last two years and the next two years. The layout is moderately dense.
Technology and Digital Transformation
Financial Services
The slide discusses the planned increase in IT spending by firms over the next two years, particularly in advanced digital technologies like AI, open platforms, and workflow automation.
IT spending, digital transformation, advanced technologies, AI, workflow automation
false
Technology and Digital Transformation
Financial Services financial-services
Mixed Chart
Deloitte
View slide
The slide features a bar chart showing the percentage of global IT spending by different countries and regions, highlighting areas with no direct impact. The bars are displayed horizontally with labels.
Market Analysis and Trends
Technology & Software
The slide analyzes global IT spending by country and region, identifying areas with minimal impact and presenting the data in a clear, horizontal bar chart format.
IT spending, global, countries, regions, impact, bar chart, percentage, analysis, minimal impact, regions
false
Market Analysis and Trends
Technology & Software technology-and-software
Single Chart
Gartner
View slide
The slide features a circular chart illustrating global IT spending and growth for 2022, segmented into categories like communication services, data center systems, software, devices, and IT services.
Market Analysis and Trends
Technology & Software
The slide provides an overview of global IT spending and growth for 2022, with a focus on different segments like communication services, data center systems, software, and devices.
IT spending, growth, 2022, global, communication, data center, software, devices, services, categories
false
Market Analysis and Trends
Technology & Software technology-and-software
Single Chart
Gartner
View slide
The slide displays a bubble chart depicting IT spending by vertical industry, with bubbles representing different industries like healthcare, retail, and banking, indicating growth rates and market sizes.
Market Analysis and Trends
Technology & Software
The slide offers insights into IT spending across various vertical industries, including healthcare, retail, and banking, with a focus on growth rates and market sizes for each industry.
IT spending, vertical industry, healthcare, retail, banking, growth rates, market sizes, industries, 2022
false
Market Analysis and Trends
Technology & Software technology-and-software
Single Chart
Gartner
View slide
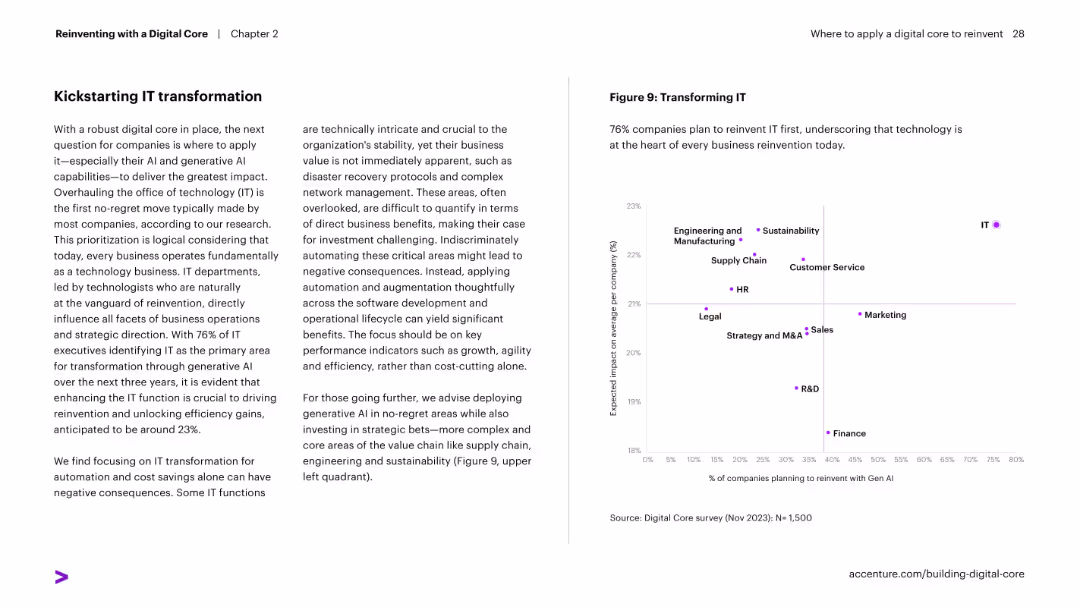
Two-column layout: text on left explains IT transformation priority; right features scatterplot of functions showing expected impact vs. GenAI reinvention planning.
Strategic Planning
Technology & Software
Argues for prioritizing IT transformation in digital reinvention strategies. Shows that companies expect the highest impact from reinventing IT with GenAI, followed by functions like supply chain and sustainability.
IT transformation, GenAI, strategy, scatterplot, business reinvention, impact
false
Strategic Planning
Technology & Software technology-and-software
Mixed Chart
Accenture
View slide
Slide includes text and a bar chart, illustrating top barriers to IT transformation such as enterprise-wide change and budget constraints.
Technology and Digital Transformation
Technology & Software
Discusses significant obstacles to IT transformation, emphasizing enterprise-wide change, budget constraints, and internal culture as primary barriers.
IT transformation, barriers, budget constraints, enterprise change
false
Technology and Digital Transformation
Technology & Software technology-and-software
Mixed Chart
Accenture
View slide
The slide features multiple bar graphs and line charts showing percentage changes in IT costs over time. It uses a clean, professional layout with color differentiation for various data points.
Market Analysis and Trends
Technology & Software
The slide analyzes IT cost changes in the technology sector, showing trends in TCO, Opex, and Capex from 2021 to 2026. It indicates how costs are projected to change over time.
IT, TCO, Opex, Capex, technology costs, financial trends
false
Market Analysis and Trends
Technology & Software technology-and-software
Multiple Chart
Accenture
View slide
Column chart showing IT spend in 2015 and 2018, with segments for "Run-the-Bank" and "Change-the-Bank" categories.
Operational Efficiency
Financial Services
This slide details IT spending optimization efforts, highlighting the balance between maintaining current operations and investing in new technologies.
IT, spend, optimization, financial, technology
false
Operational Efficiency
Financial Services financial-services
Mixed Chart
Credit Suisse
View slide
A slide featuring a bar chart showing an 80% revenue growth in ITS collaboration revenues from 9M16 to 9M18, and another chart showing the penetration of structured products among private banking clients.
Strategic Planning
Financial Services
This slide highlights the growth in ITS collaboration revenues and the penetration of structured products among private banking clients, indicating significant progress and future opportunities.
ITS collaboration, revenue growth, structured products, private banking, financial services, market penetration, strategic planning, growth opportunity
false
Strategic Planning
Financial Services financial-services
Multiple Chart
Credit Suisse
View slide
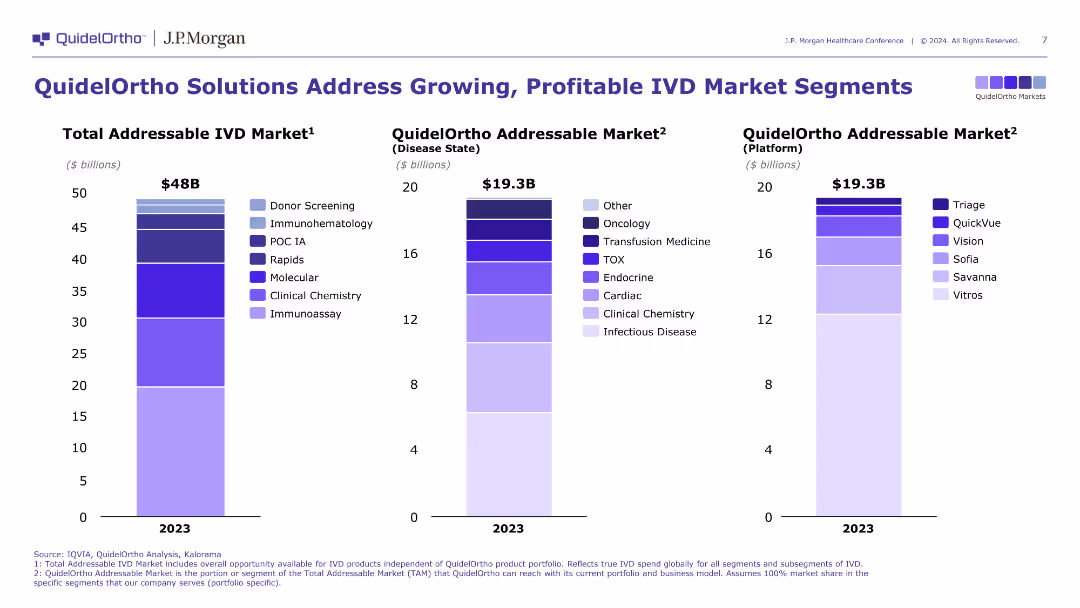
The slide shows three vertical bar charts comparing the total addressable IVD market, QuidelOrtho addressable market by disease state, and platform. The design is clear and uses distinct colors for different segments.
Market Analysis and Trends
Healthcare & Pharmaceuticals
The slide provides an analysis of the in-vitro diagnostics (IVD) market, illustrating QuidelOrtho's market opportunities and competitive positioning within various market segments.
IVD market, QuidelOrtho, market analysis
false
Market Analysis and Trends
Healthcare & Pharmaceuticals healthcare-and-pharmaceuticals
Multiple Chart
JP Morgan
View slide
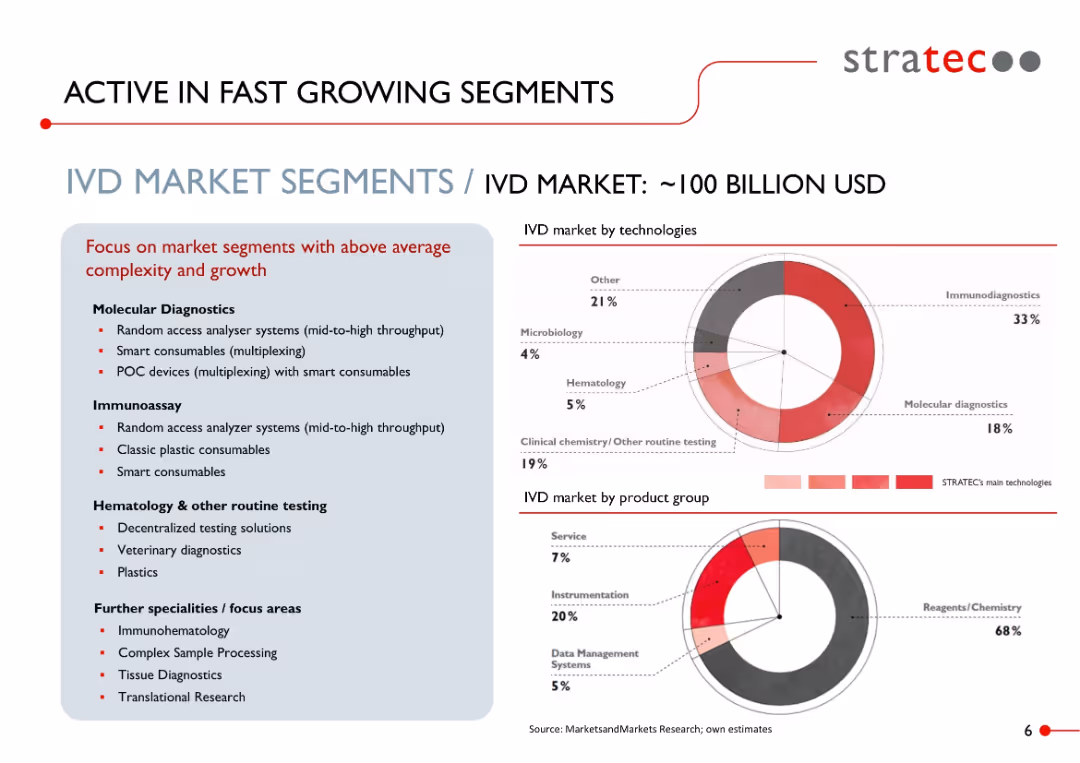
Split layout: text-heavy left box with bullet points on market segments; right side features two donut charts with red highlights and technology/product breakdowns.
Market Analysis and Trends
Healthcare & Pharmaceuticals
Highlights the high-growth and high-complexity segments within the IVD (In Vitro Diagnostics) market, valued at ~$100B. Focus areas include molecular diagnostics, immunoassays, and smart consumables. Two charts segment the market by technologies and product groups.
IVD, immunoassay, smart consumables, molecular diagnostics, healthcare, market segmentation, diagnostics, STRATEC, medical technology
false
Market Analysis and Trends
Healthcare & Pharmaceuticals healthcare-and-pharmaceuticals
Mixed Chart
Goldman Sachs
View slide
Slide contains multiple data visualizations: a line chart comparing GDP growth of Iceland with EU, UK, and US from 2009-2021; a column chart showing tourist arrivals in millions from 2009-2021; a stacked area chart illustrating the share in total exports of goods; and a line chart depicting population growth. Colors and labels are clearly used to denote different data sets.
Market Analysis and Trends
Financial Services
This slide presents a comprehensive overview of Iceland's economic recovery post-financial crisis, highlighting major growth sectors like tourism and new industries such as IP sector, pharma, and fish farming. It visually compares Iceland's GDP growth with major economies and details the changes in tourism, population, and export composition.
Iceland, economy, GDP, tourism, exports, population growth, recovery
false
Market Analysis and Trends
Financial Services financial-services
Multiple Chart
Deutsche Bank
View slide
Diagram slide with interconnected elements illustrating stakeholders in the IdREN network. Icons and labels represent entities like government, business, and academia, with arrows showing interactions. A list details the benefits and operational model.
Strategic Planning
Education & Training
Provides an overview of the IdREN project aimed at improving connectivity within Indonesia's education and research sectors. Discusses the collaborative model involving various stakeholders and the potential to expand network coverage to more educational institutions.
IdREN, connectivity, education, research, stakeholders, network coverage
false
Strategic Planning
Education & Training education-and-training
Framework
BCG
View slide
The slide features a column chart depicting participants' ability to correctly identify crypto assets, with categories for correct, incorrect, and unknown.
Market Analysis and Trends
Financial Services
This slide presents data on participants' knowledge and understanding of what constitutes a crypto asset.
Identification, crypto assets, knowledge, survey, participants
false
Market Analysis and Trends
Financial Services financial-services
Mixed Chart
IPSOS
View slide
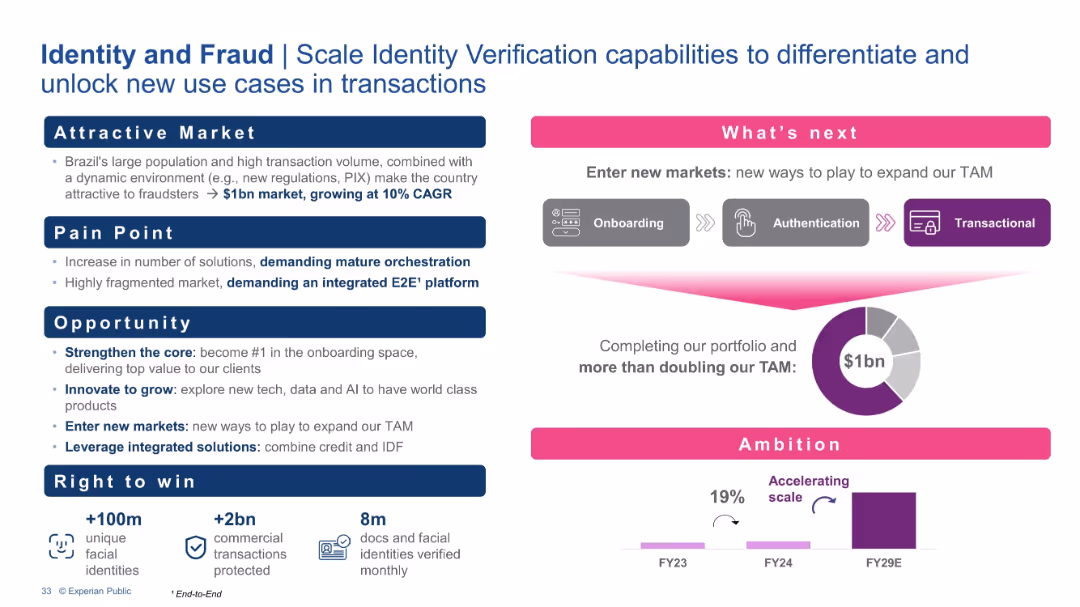
Structured into four sections (Market, Pain Point, Opportunity, Right to Win) and a visual roadmap under "What’s next." Includes metrics and a growth ambition chart.
Risk Assessment and Management
Financial Services
The slide discusses Experian’s strategy to expand its Identity and Fraud solutions. It identifies market size, pain points (fragmentation, need for orchestration), and strategic actions such as new tech integration and market entry. TAM is forecasted to double, with a goal to lead in onboarding and transaction validation.
Identity verification, Fraud prevention, Onboarding, TAM growth, Authentication, Risk management, Brazil market
false
Risk Assessment and Management
Financial Services financial-services
Multiple Chart
Barclays
View slide
Images depicting industry applications of immersive tech, with short text descriptions underneath.
Technology and Digital Transformation
Technology & Software
Insights on how immersive reality could change operations within various industries, focusing on specific applications like AR for operational safety.
Immersive reality, industry operations, AR, VR, applications
false
Technology and Digital Transformation
Technology & Software technology-and-software
Pillar
McKinsey
View slide
Illustrations of benefits and risks with corresponding bullet points, scales icon indicating balance.
Strategic Planning
Technology & Software
Explores the benefits of immersive tech in product development and risks like hardware improvement pace, covering strategic considerations for adoption.
Immersive tech, benefits, risks, strategy, product development, hardware
false
Strategic Planning
Technology & Software technology-and-software
Boxed
McKinsey
View slide
Tabular comparison of industry use cases for immersive tech, accompanied by relevant isometric illustrations.
Technology and Digital Transformation
Technology & Software
Describes horizontal and vertical use case scenarios for immersive tech across various industries, highlighting specific applications and their significance.
Immersive tech, industries, use cases, application, significance
false
Technology and Digital Transformation
Technology & Software technology-and-software
Header Horizontal
McKinsey
View slide
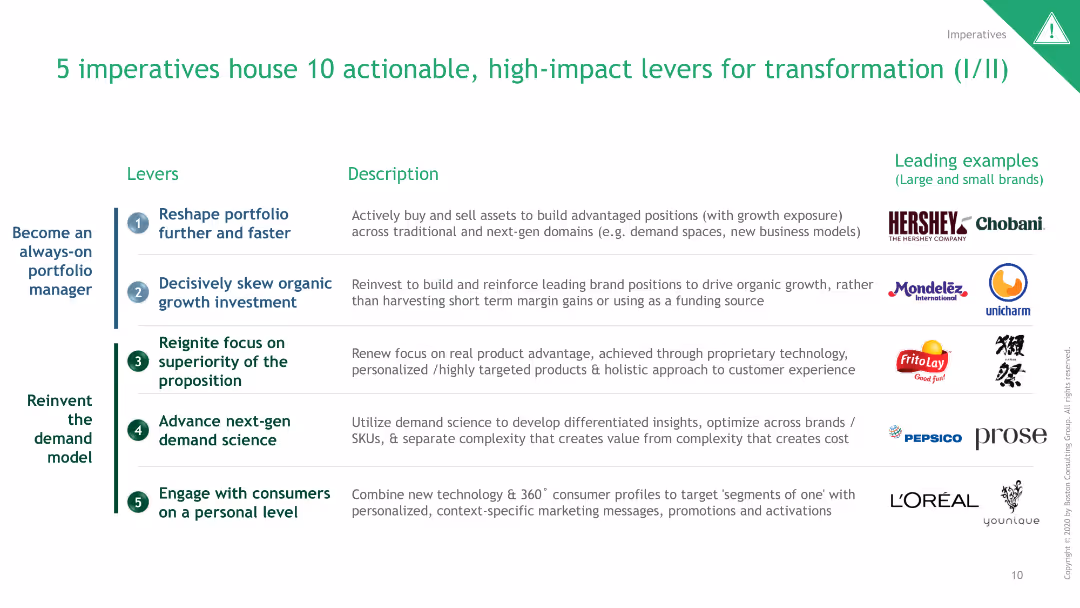
The slide uses a table format to list 5 imperatives and 10 levers for transformation, with associated examples and logos.
Strategic Planning
Professional Services
It details actionable levers for transformation across various industries, highlighting leading examples of implementation.
Imperatives, Levers, Transformation, Examples, Strategy
false
Strategic Planning
Professional Services professional-services
Table
BCG
View slide
A pie chart showing the share of total imports from Costa Rica to the US by product type. The chart uses different colors for each segment, with highlighted sections for significant variations.
Market Analysis and Trends
Transportation & Logistics
This slide provides an overview of the top ten product imports from Costa Rica to the US, highlighting their share of total imports and annual variation from 2021 to 2022.
Imports, Costa Rica, US, pie chart, market trends
false
Market Analysis and Trends
Transportation & Logistics transportation-and-logistics
Single Chart
Deloitte
View slide
Line chart detailing the share of US imports from individual Central American countries, with key events marked on the timeline.
Market Analysis and Trends
Transportation & Logistics
This slide presents a line chart showing the share of US imports from various Central American countries, noting trends and significant events like US-China tariffs and COVID-19.
Imports, US, Central America, countries, timeline
false
Market Analysis and Trends
Transportation & Logistics transportation-and-logistics
Single Chart
Deloitte
View slide
Line chart showing the share of US imports from Central America and other regions over time, with key events marked along the timeline.
Market Analysis and Trends
Transportation & Logistics
This slide shows a line chart comparing the share of US imports from Central America to other main trading partners, highlighting impacts from events like US-China tariffs, COVID-19, and the Russia-Ukraine war.
Imports, US, Central America, trade, timeline
false
Market Analysis and Trends
Transportation & Logistics transportation-and-logistics
Single Chart
Deloitte
View slide
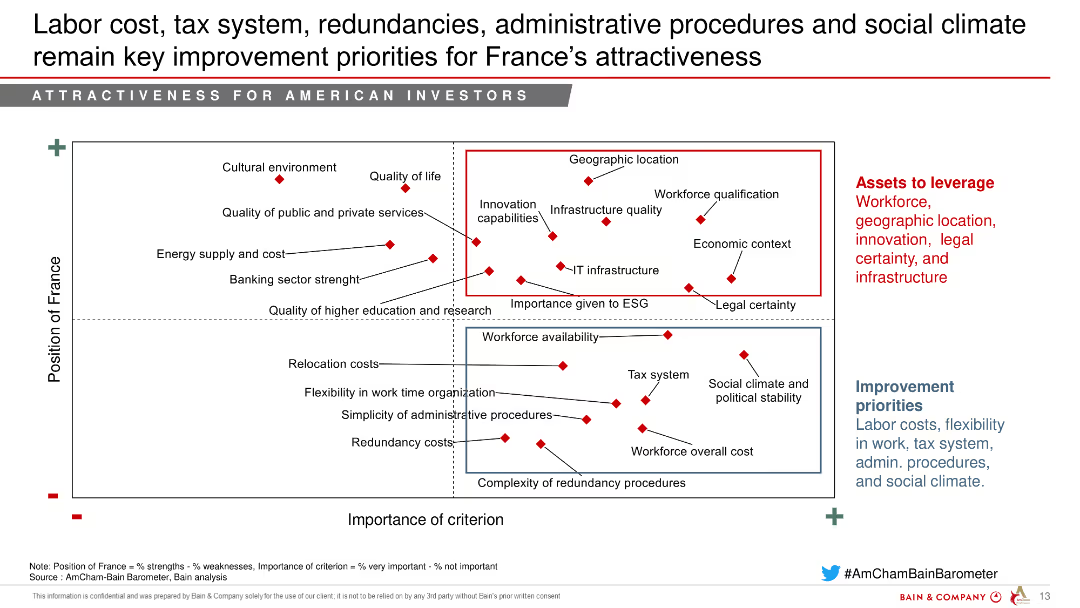
The slide features a chart mapping France's position on various criteria such as labor cost and tax system, with areas for improvement highlighted.
Regulatory and Compliance
Government & Public Sector
This slide outlines the key areas for improvement in France to enhance its attractiveness, focusing on labor cost and administrative procedures.
Improvement priorities, Labor cost, Tax system, Administrative procedures, Government
false
Regulatory and Compliance
Government & Public Sector government-and-public-sector
Mixed Chart
Bain
Previous
Loading...
Hold On!
We are searching in our database
If nothing, comes up, please try different filters!
Column Chart
Heatmap
Chevron
Org Chart
Infographic
Callouts
Timeline
List
Graphic
Picture
Process Flow
Diagram
Paragraph
Map
Table
Framework
Subtitle
Takeaway Box
Icon
Other Chart
Radar Chart
Waterfall Chart
Mekko Chart
Pie Chart
Scatter Plot
Line Chart
Bar chart
Bullet points
Create a FREE account to continue browsing
Receive Instant Access to 1,000+ slides from companies like McKinsey, Google, and Goldman Sachs
First Name
Last Name
Email
Password
I agree to all
Terms & Privacy Policy
Thank you! Your submission has been received!
Oops! Something went wrong while submitting the form.
Have an account?
Sign in
Upgrade to PRO to Save slides
Advanced Search and Filters
Access to 15,000+ slides
Access to Category Pages
Save/Bookmark Slides
PowerPoint Template Library
Pick a Plan
MONTHLY
$12/month
Billed every month, Cancel anytime.
YEARLY
$9/year
Billed $108 annually, Cancel anytime.
Checkout for $12/month
Checkout for $108/yr
Secured by Stripe | AES-256 bit encryption