My Account
My Slides
Search by Category
Templates
Leave Feedback
Login
Logout
Get Started
Browse all Slides
Browse all Slides
Create a FREE Account
Instant access to 1,000+ real slides from top companies like McKinsey, BCG, Goldman Sachs, Google and many more!
First Name
Last Name
Email
Password
I agree to all
Terms & Privacy Policy
Thank you! Your submission has been received!
Oops! Something went wrong while submitting the form.
Have an account?
Sign in
📢 Ready to start building slides? Check out our new template library
VIEW TEMPLATES
Welcome,
Welcome
PRO
Show Featured Only
Checkbox 8
Companies
Mckinsey
Bain
BCG
EY
Deloitte
Accenture
PwC/Strategy&
JP Morgan
Goldman Sachs
Morgan Stanley
Citigroup
Deutsche Bank
Barclays
LEK
KPMG
Kearney
Oliver Wyman
Booz Allen Hamilton
Gartner
IPSOS
Nielsen
Slide type
Text Only
Linear Flow
Vertical Flow
Single Chart
Header Horizontal
Mixed Chart
Header Vertical
Pillar
Multiple Chart
Graphic
Agenda
Title
Table
Framework
Industry
Technology & Software
Artificial Intelligence
Financial Services
Retail & E-commerce
Consumer Goods
Industrial & Manufacturing
Transportation & Logistics
Telecommunications
Real Estate & Construction
Hospitality & Tourism
Professional Services
Education & Training
Media & Entertainment
Agriculture & Food Production
Healthcare & Pharmaceuticals
Environmental Services & Sustainability
Government & Public Sector
Use Case
Mergers and Acquisitions
Performance Metrics and KPIs
Client Case Studies
Competitive Landscape
Corporate Finance and Valuation
Product and Service Analysis
Customer and Market Segmentation
Organizational Structure and Change
Industry Overview
Regulatory and Compliance
Risk Assessment and Management
Investment Analysis
Organizational Structure and Change
Human Resources and Talent Management
Financial Performance
Market Analysis and Trends
Sales and Business Development
Human Resources and Talent Management
Clear all
Thank you! Your submission has been received!
Oops! Something went wrong while submitting the form.
Tag
View slide
This slide uses a combination of column charts, tables, and text boxes. It includes financial data and visual representations of IPO trends.
Market Analysis and Trends
Financial Services
The slide shows the decline in IPOs and proceeds in the US and Canada, highlighting key stock exchanges, sectors, and notable IPOs.
IPOs, US NASDAQ, NYSE, stock exchanges, sectors
false
Market Analysis and Trends
Financial Services financial-services
Multiple Chart
EY
View slide
Column charts showing financial metrics of companies and a table listing recent investment rounds with details.
Investment Analysis
Financial Services
Highlights recent IPOs and financing rounds in the warehouse automation sector, showing company performance and investment details.
IPOs, financing, warehouse automation, investment, market cap
false
Investment Analysis
Financial Services financial-services
Multiple Chart
LEK
View slide
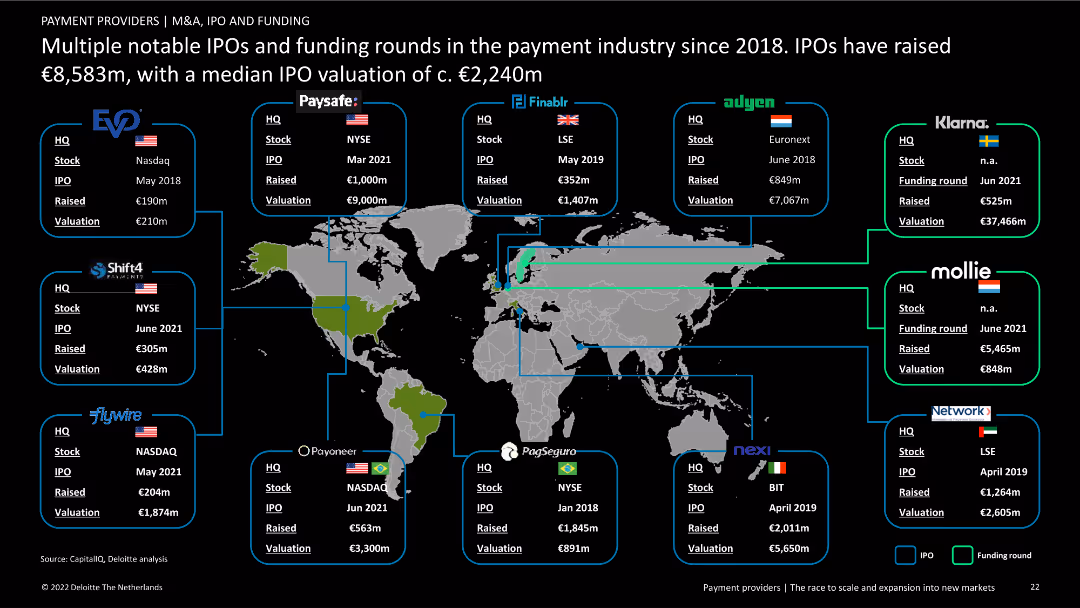
Contains a world map highlighting notable IPOs and funding rounds by company and region. Includes text boxes with details of the IPOs and funding amounts.
Investment Analysis
Financial Services
Overview of significant IPOs and funding rounds in the payment industry from 2018 onwards, providing insights into company valuations and geographical distribution of investments.
IPOs, funding rounds, payment industry, investment analysis, financial services, market analysis, company valuations, global distribution
false
Investment Analysis
Financial Services financial-services
Graphic
Deloitte
View slide
The slide features two column charts comparing the number and proceeds of IPOs across various sectors for Q1 2023 and Q1 2022. Colors differentiate the years, with specific focus on technology and energy sectors.
Market Analysis and Trends
Financial Services
The slide presents a comparison of IPO activities across different sectors in Q1 2023 versus Q1 2022, highlighting the dominance of the energy sector in proceeds despite fewer deals.
IPOs, sectors, technology, energy, Q1 2023, column charts, market trends, financial services, comparison, proceeds
false
Market Analysis and Trends
Financial Services financial-services
Multiple Chart
EY
View slide
The slide features a combination of column charts and a table. It showcases data on the number of IPOs and proceeds in the Americas for 2023, compared to 2022. Additional tables provide details on stock exchanges, sectors, and notable IPOs.
Market Analysis and Trends
Financial Services
The slide analyzes the revival of the IPO market in the Americas, highlighting an increase in both the number of IPOs and proceeds. It provides a detailed breakdown by stock exchanges, sectors, and largest IPOs, with data supporting bullish equities sentiment.
IPOs, stock exchanges, financial trends, market revival, sector analysis
false
Market Analysis and Trends
Financial Services financial-services
Multiple Chart
EY
View slide
Features column chart comparing the number of IPOs on Brazilian vs. American stock exchanges over two years
Investment Analysis
Financial Services
Examines the trend in tech IPOs, highlighting the activity in Brazil relative to the U.S. for 2018 and 2019
IPOs, tech, Brazil, US, stock exchanges
false
Investment Analysis
Financial Services financial-services
Single Chart
McKinsey
View slide
The slide features a diamond-shaped diagram with AI at the center, surrounded by four quadrants labeled Social & Search Data, Consumer Needs, Expressions & Trends, Survey Data, and Digital Behavioral Data.
Market Analysis and Trends
Technology & Software
The slide outlines how IPSOS will leverage unique, high-quality data from various sources like social and search data, consumer trends, and survey data to gain a competitive advantage.
IPSOS, data, quality, AI, social, search, consumer trends, survey, behavioral, alternative
false
Market Analysis and Trends
Technology & Software technology-and-software
Diagram
IPSOS
View slide
The slide has a title, bar charts, and a text table. It is color-coded in purple, red, and green to represent different sectors of the battery value chain.
Market Analysis and Trends
Energy & Utilities
This slide discusses the impact of the Inflation Reduction Act (IRA) on Australia's battery industry, analyzing opportunities in mining and challenges in manufacturing.
IRA, Australia, mining, manufacturing, subsidies
false
Market Analysis and Trends
Energy & Utilities energy-and-utilities
Mixed Chart
Accenture
View slide
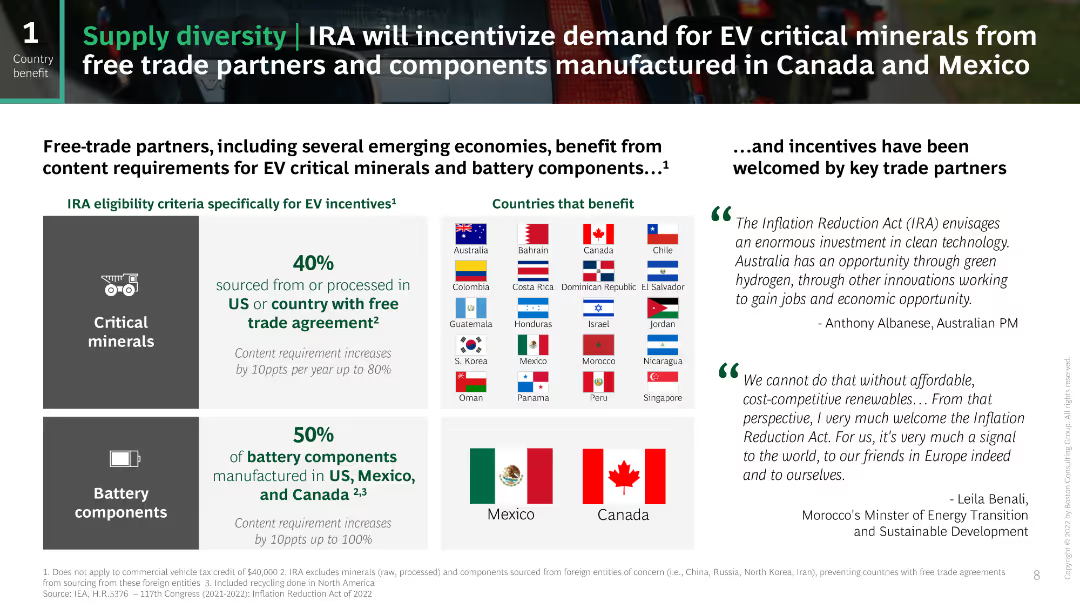
This slide features a two-column layout with text on the left and flags and quotes on the right. The left column has large icons and bullet points, while the right side shows country flags and quotes from international leaders. The design is clean and uses green highlights to emphasize key points.
Strategic Planning
Energy & Utilities
The slide discusses how the Inflation Reduction Act (IRA) incentivizes the use of EV critical minerals and battery components from countries with free trade agreements, highlighting the potential benefits for Canada and Mexico and including quotes from global leaders.
IRA, EV, critical minerals, battery components, trade
false
Strategic Planning
Energy & Utilities energy-and-utilities
Header Horizontal
BCG
View slide
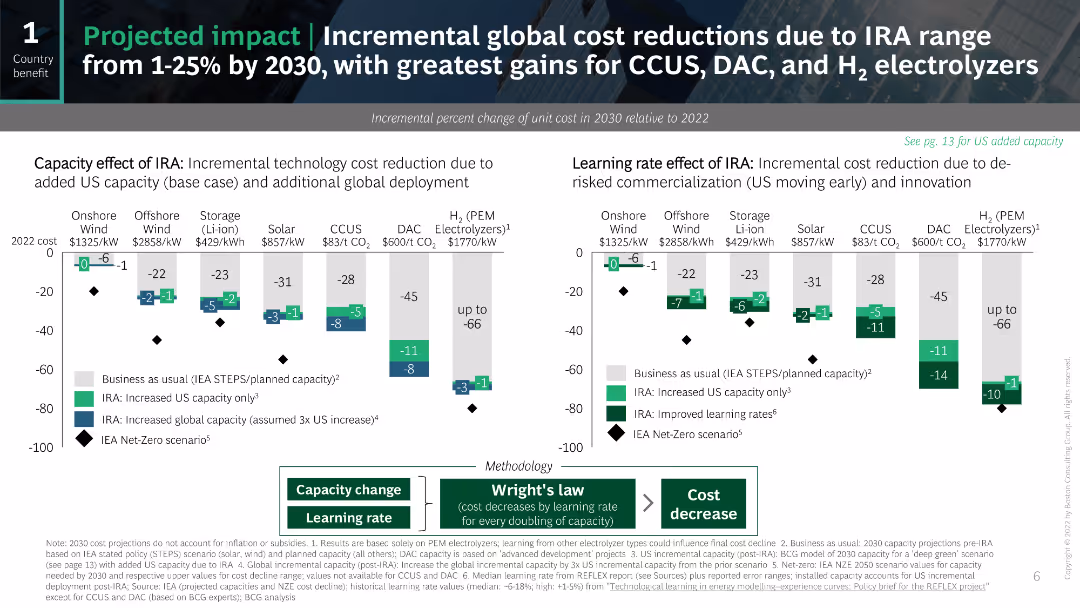
The slide features a series of column charts to show the incremental cost reductions and learning rate effects due to the IRA.
Market Analysis and Trends
Energy & Utilities
The slide projects cost reductions for various technologies due to the IRA and explains the methodology behind these projections.
IRA, cost reductions, projections, learning rate, technology
false
Market Analysis and Trends
Energy & Utilities energy-and-utilities
Multiple Chart
BCG
View slide
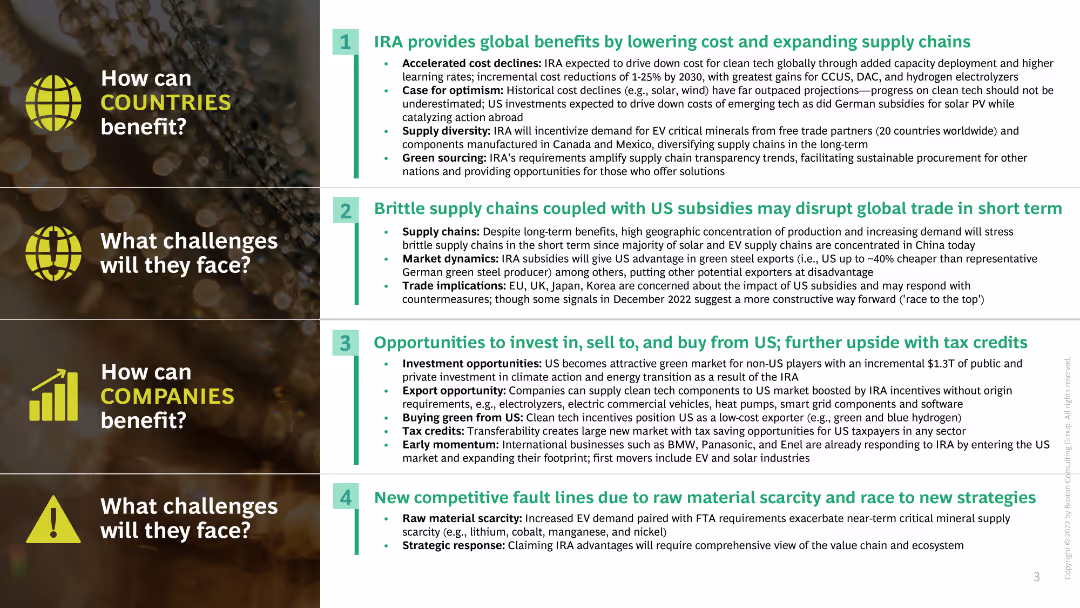
The slide uses a two-column layout with text and numbered lists detailing benefits and challenges for countries and companies.
Strategic Planning
Energy & Utilities
The slide discusses the global benefits of the Inflation Reduction Act (IRA) and potential challenges for countries and companies.
IRA, global benefits, challenges, countries, companies
false
Strategic Planning
Energy & Utilities energy-and-utilities
Header Vertical
BCG
View slide
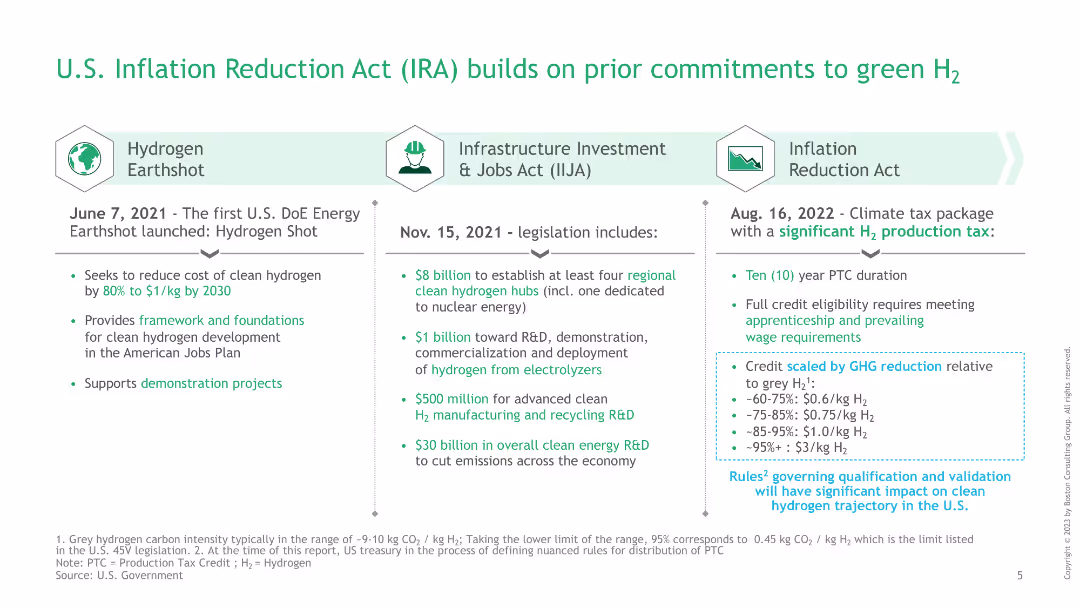
The slide is structured into three columns, each detailing different legislation acts and their contributions to green hydrogen initiatives, with bullet points.
Regulatory and Compliance
Government & Public Sector
This slide details the commitments of the U.S. government to green hydrogen through various acts, including the Hydrogen Earthshot, Infrastructure Investment and Jobs Act, and the Inflation Reduction Act, highlighting financial and policy support.
IRA, green hydrogen, legislation, infrastructure investment, Inflation Reduction Act
false
Regulatory and Compliance
Government & Public Sector government-and-public-sector
Table
BCG
View slide
Block diagram showing U.S. IRA investment allocation and examples of SEA companies investing in the U.S.; includes a cost reduction chart for hydrogen pre- and post-IRA.
Strategic Planning
Financial Services
Highlights the effectiveness of the U.S. Inflation Reduction Act in accelerating clean energy investment, including from SEA firms. Discusses public investment split and specific SEA companies establishing operations in the U.S. Demonstrates how IRA incentives reduce the cost of green hydrogen, making emerging technologies more viable.
IRA, green investment, SEA companies, hydrogen cost, incentives, manufacturing, policy, clean energy
false
Strategic Planning
Financial Services financial-services
Mixed Chart
Bain
View slide
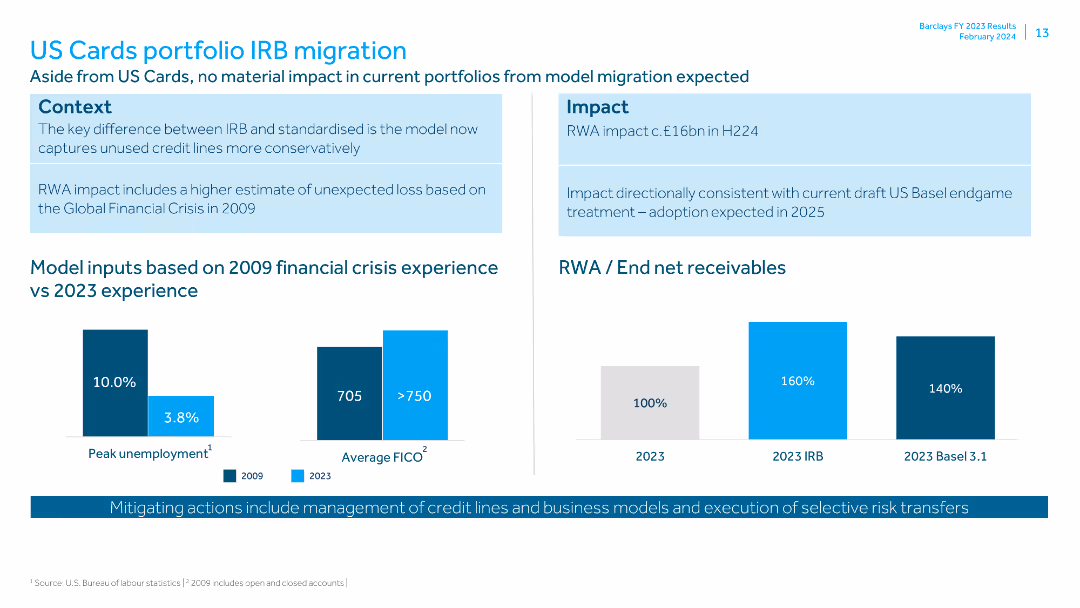
Contains bar charts comparing model inputs from 2009 financial crisis vs 2023, and data on RWA and end net receivables. Context and impact boxes are included.
Risk Assessment and Management
Financial Services
Discusses the impact of IRB migration on the US Cards portfolio, comparing past and current financial conditions. It details the RWA impact and mitigating actions.
IRB migration, US Cards, financial crisis, RWA, receivables, peak unemployment, FICO, liquidity pool, credit lines, risk transfer
false
Risk Assessment and Management
Financial Services financial-services
Multiple Chart
Barclays
View slide
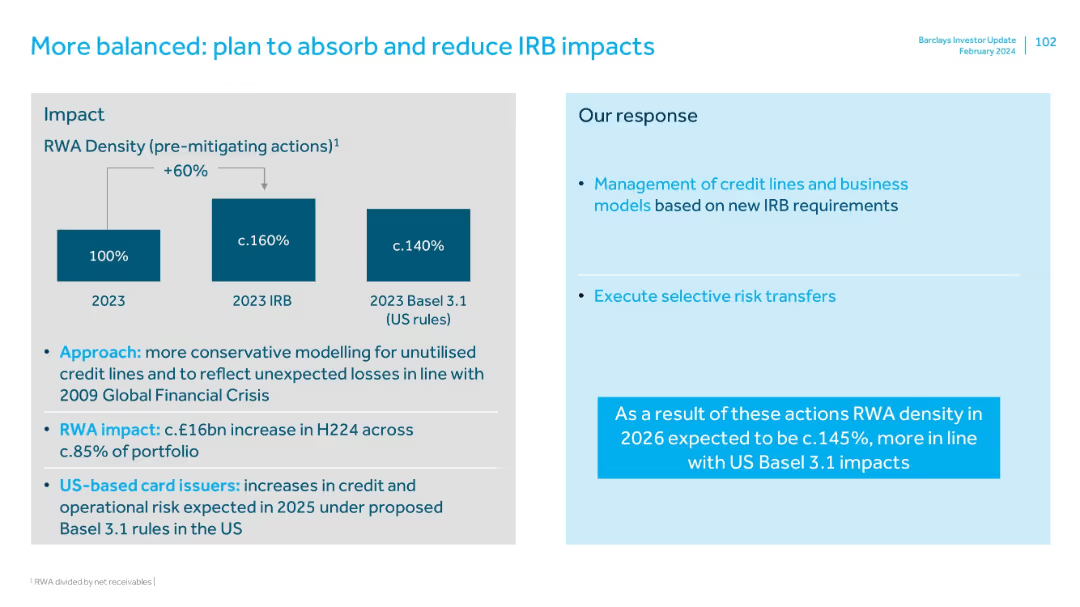
Two-panel layout: impact on left with bar graphics; response strategy on right. Blue text highlights key actions.
Regulatory and Compliance
Financial Services
Explains the impact of new IRB rules and Basel 3.1 on risk-weighted assets. Barclays plans to reduce RWA density through credit line management and selective risk transfers, aiming to align with US regulatory expectations by 2026.
IRB, Basel 3.1, regulatory impact, RWA, risk mitigation, compliance strategy
false
Regulatory and Compliance
Financial Services financial-services
Mixed Chart
Barclays
View slide
This slide presents a comparison of IRB and standardized models through column charts, focusing on RWA and net receivables.
Risk Assessment and Management
Financial Services
Analyzes the impact of migrating US Cards portfolio to IRB models on RWAs, comparing historical data and future expectations.
IRB, US Cards, RWA, risk management, migration
false
Risk Assessment and Management
Financial Services financial-services
Multiple Chart
Barclays
View slide
Slide combines text with iconography illustrating various banking sectors. The visual complexity is moderate with a clear pathway graphic showing different stages of banking services.
Investment Analysis
Financial Services
Focuses on the potential for incremental revenue through Integrated Relationship Management (IRM), likely used to outline revenue growth strategies or in financial service innovation discussions.
IRM, revenue growth, banking sectors, financial services, strategy
false
Investment Analysis
Financial Services financial-services
Linear Flow
Goldman Sachs
View slide
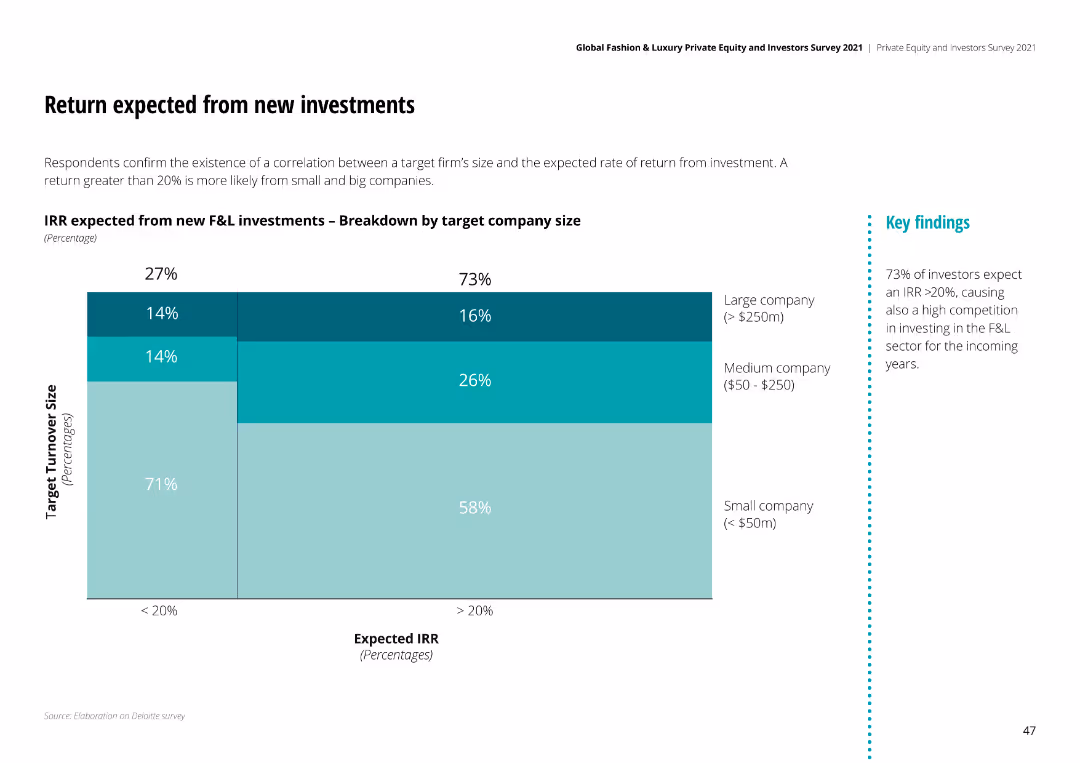
The slide includes a stacked column chart showing IRR expected from new F&L investments, categorized by target company size. Key findings are highlighted.
Investment Analysis
Financial Services
This slide discusses the expected returns from new investments in F&L, detailing the correlation between firm size and expected IRR.
IRR, investment, F&L, returns, company size
false
Investment Analysis
Financial Services financial-services
Mixed Chart
Deloitte
View slide
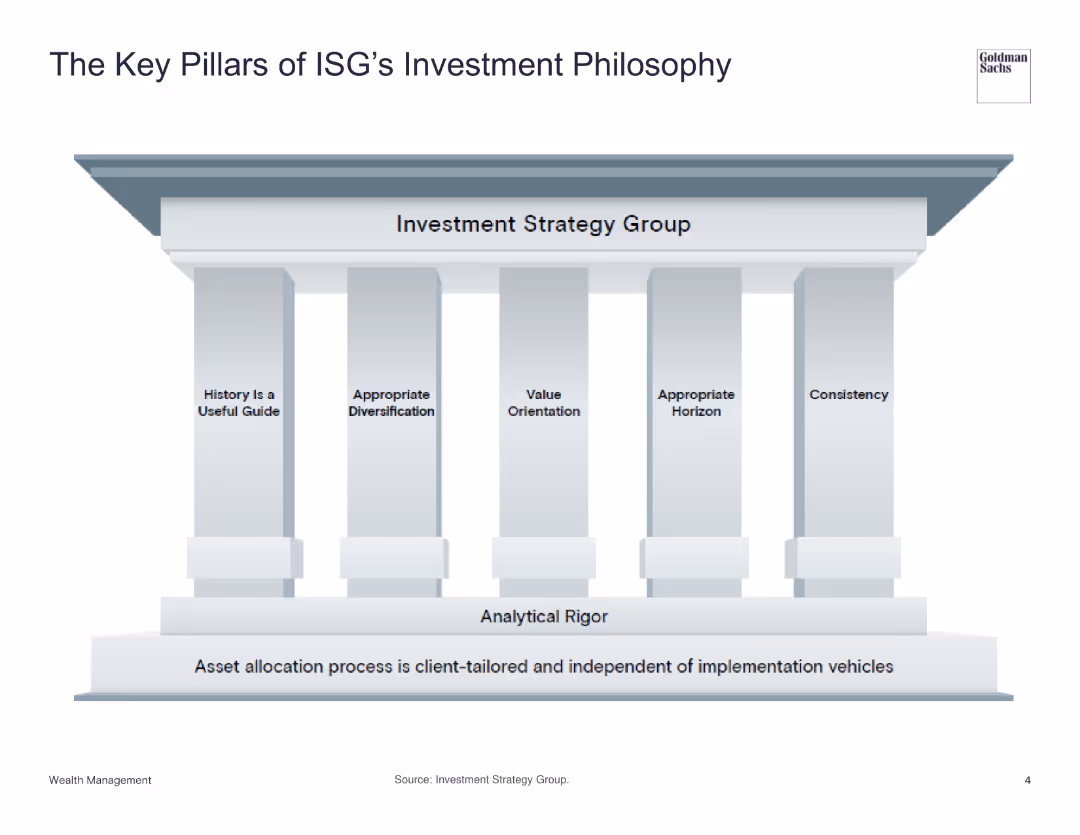
The slide features a graphic of a building with pillars representing different aspects of ISG's investment philosophy, highlighting core values.
Strategic Planning
Financial Services
The slide presents the key pillars of ISG's investment philosophy: History, Appropriate Diversification, Value Orientation, Appropriate Horizon, and Consistency, underpinning a rigorous analytical approach.
ISG, Investment Philosophy, Diversification, Value, Strategy
false
Strategic Planning
Financial Services financial-services
Pillar
Goldman Sachs
View slide
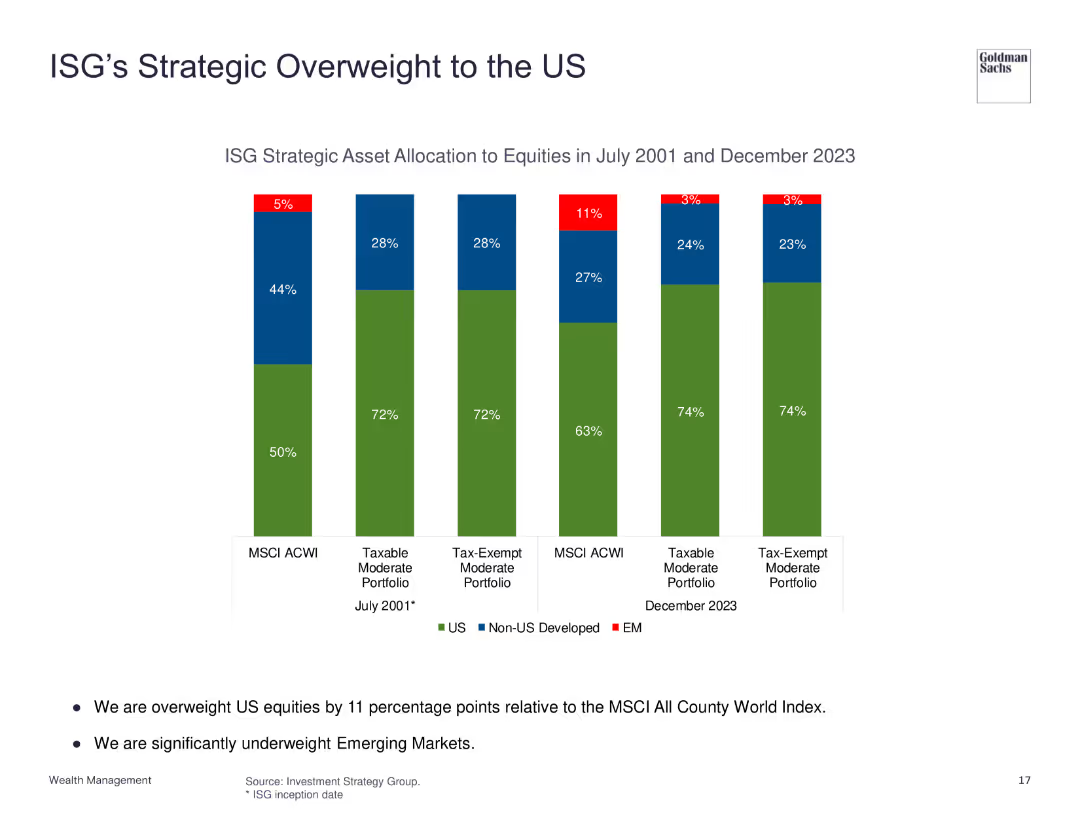
The slide shows column charts comparing ISG's asset allocation to equities in 2001 and 2023, highlighting an increased overweight to US equities.
Strategic Planning
Financial Services
The slide illustrates ISG's strategic decision to overweight US equities, showing the changes in asset allocation over time and the focus on US market investments compared to non-US developed and emerging markets.
ISG, Strategy, Asset Allocation, US Equities, Overweight
false
Strategic Planning
Financial Services financial-services
Single Chart
Goldman Sachs
View slide
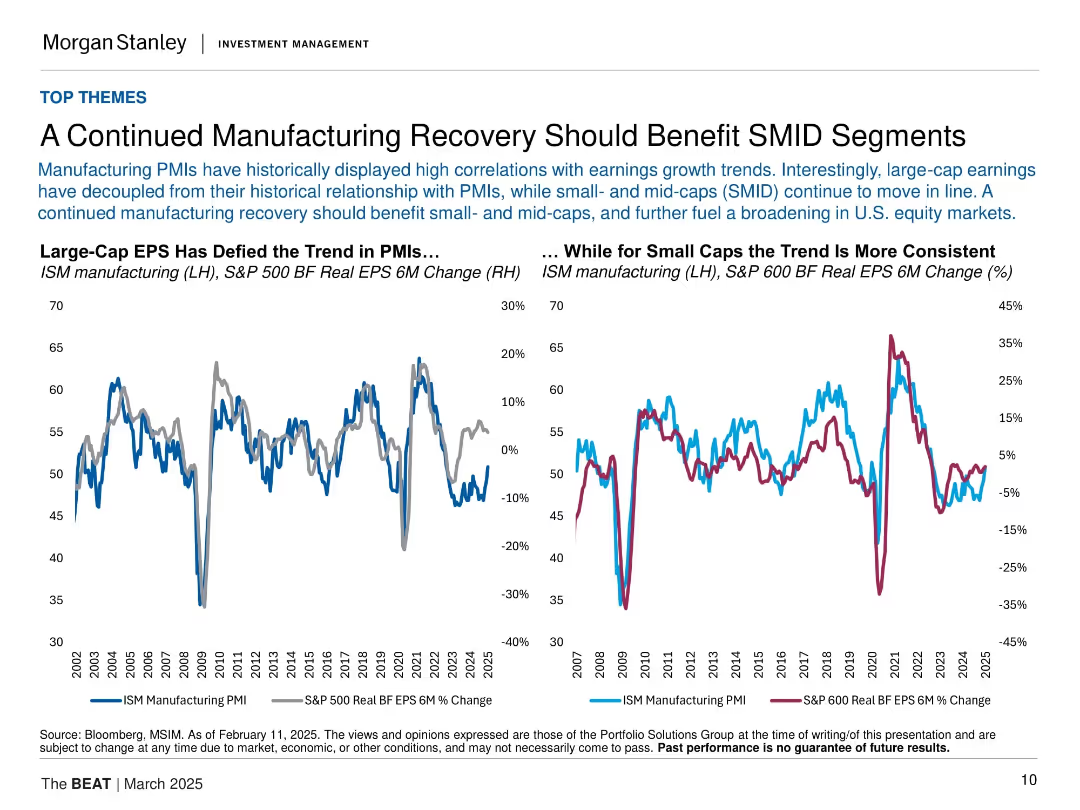
Dual line charts: left compares ISM PMI to S&P 500 EPS; right compares ISM PMI to S&P 600 EPS. Clean and parallel design structure.
Performance Metrics and KPIs
Industrial & Manufacturing
Suggests that small- and mid-cap earnings are still closely tracking manufacturing trends, unlike large-cap EPS which have decoupled. Argues for broader equity participation and growth in SMID segments as manufacturing recovers.
ISM PMI, EPS growth, S&P 500, S&P 600, small-cap, mid-cap, manufacturing, equities
false
Performance Metrics and KPIs
Industrial & Manufacturing industrial-and-manufacturing
Multiple Chart
Morgan Stanley
View slide
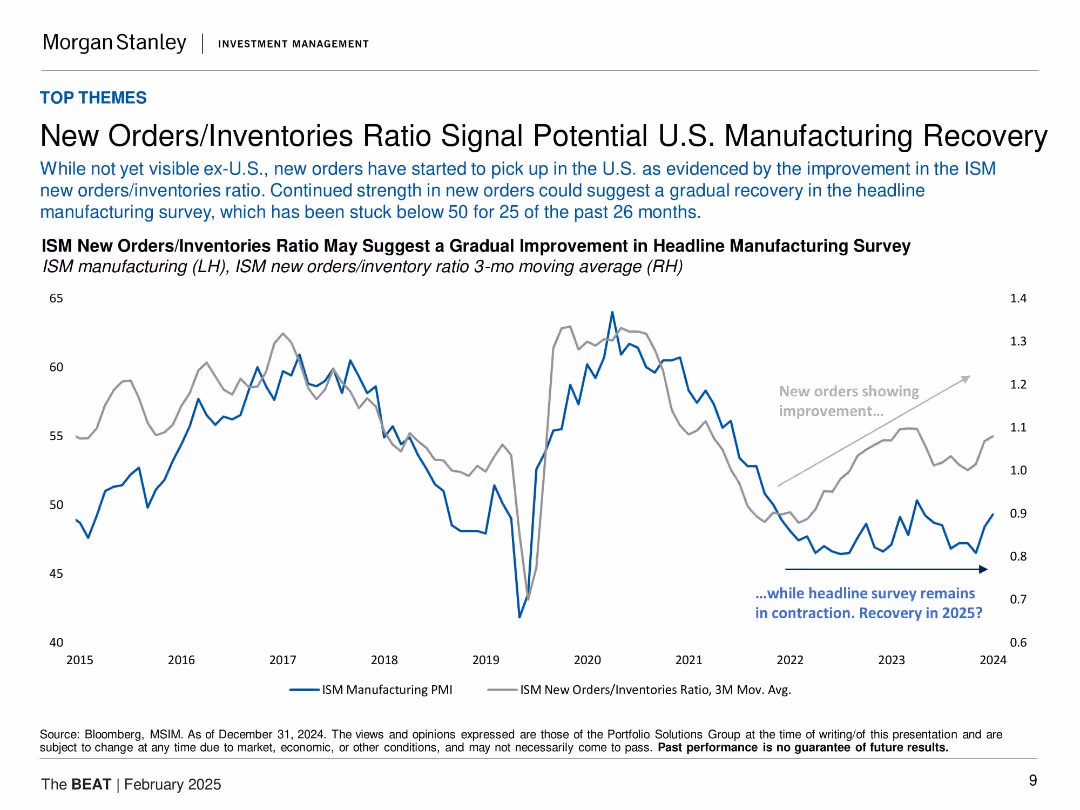
Dual-axis line chart comparing ISM Manufacturing PMI and new orders/inventories ratio from 2015–2024. Gray annotation indicating trend shift.
Performance Metrics and KPIs
Industrial & Manufacturing
The slide presents evidence of an early U.S. manufacturing recovery through rising new orders relative to inventories, despite the ISM headline manufacturing survey remaining below 50. It suggests cautious optimism for a recovery in 2025, with visual trends showing divergence between new orders and PMI metrics over time.
ISM PMI, new orders, inventories, U.S. manufacturing, recovery, economic signal, KPIs, factory output
false
Performance Metrics and KPIs
Industrial & Manufacturing industrial-and-manufacturing
Single Chart
Morgan Stanley
View slide
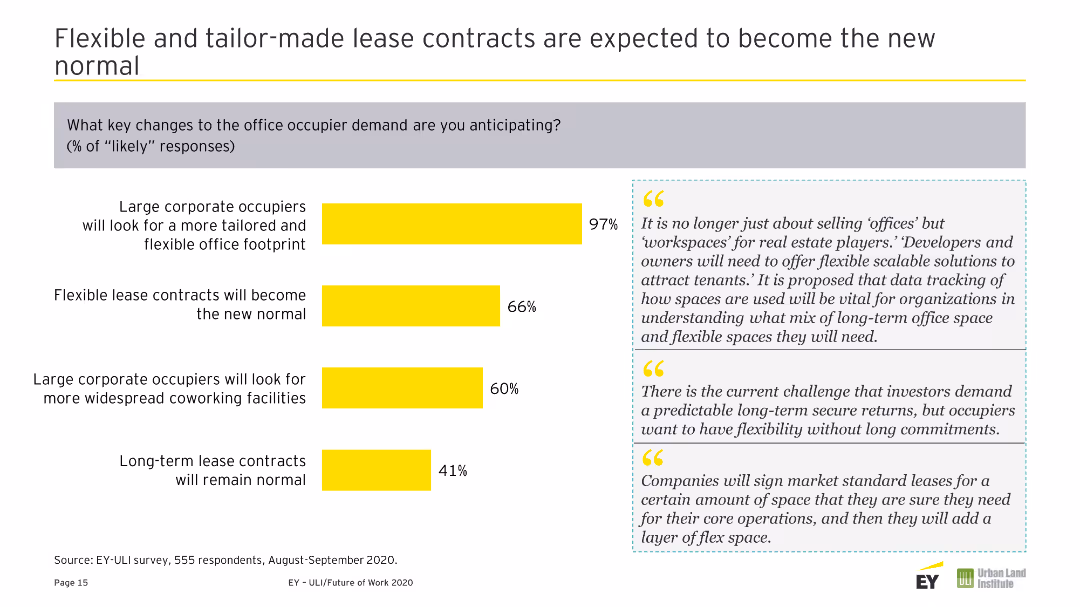
Column chart illustrating challenges from the Future of Work. Includes two text quotes on the right side in gray boxes. Uses yellow and gray colors.
Risk Assessment and Management
Real Estate & Construction
Identifies top challenges such as increased IT costs, loss of corporate culture, and less effective talent management.
IT Costs, Corporate Culture, Talent, Management, Turnover, Innovation, Creativity, Challenges, Future of Work
false
Risk Assessment and Management
Real Estate & Construction real-estate-and-construction
Mixed Chart
EY
View slide
A scatter plot showing the relationship between IT spending per employee and value-added per employee for different countries. The countries are grouped and color-coded into different regions.
Market Analysis and Trends
Technology & Software
The slide analyzes IT intensity across various countries by comparing IT spending per employee to the economic value added per employee, used for international market comparisons.
IT Intensity, Country Analysis, Economic Value, IT Spending, International Comparison
false
Market Analysis and Trends
Technology & Software technology-and-software
Single Chart
Gartner
View slide
A line chart tracking the price inflation of WLAN, Comms, Devices, and Phones from 2020 to 2026, normalized to 2020 levels. Multiple lines with different colors represent each category.
Financial Performance
Technology & Software
This slide analyzes the price inflation trends of various IT products from 2020 to 2026, indicating how prices have increased or remained stable over time.
IT Prices, Inflation, Technology Trends, Price Normalization, Market Analysis
false
Financial Performance
Technology & Software technology-and-software
Single Chart
Gartner
View slide
Two pie charts, one showing the spread of IT services spending by markets, and the other detailing the market share of the top 10 vendors in 2021. The first chart shows categories like Application Implementation and Infrastructure as a Service.
Financial Performance
Technology & Software
This slide breaks down the increase in IT services spending in 2021 by market segment and vendor, showing which areas and companies saw the most growth.
IT Services, Spending, Market Segments, Top Vendors, Financial Performance
false
Financial Performance
Technology & Software technology-and-software
Multiple Chart
Gartner
View slide
The slide contains a column chart comparing IT spending in various technologies (e.g., AI, Blockchain, Cloud) across APAC, Europe, and North America, measured in billions.
Market Analysis and Trends
Technology & Software
It provides a comparison of IT spending across regions and technologies, highlighting areas where Europe lags or leads, and stressing the need for increased investment.
IT Spending, Europe, Technology, Investment, Comparison
false
Market Analysis and Trends
Technology & Software technology-and-software
Mixed Chart
Accenture
View slide
Diagram and text outlining IT functional vacancy rates over time. Specific IT vacancies are highlighted in an organizational chart.
Human Resources and Talent Management
Technology & Software
Analysis of IT functional vacancy rates within NH DHHS, showing increased vacancies impacting strategic decision-making and planning, especially during COVID-19.
IT Vacancies, DHHS, Staffing, Organizational Chart, COVID-19
false
Human Resources and Talent Management
Technology & Software technology-and-software
Header Horizontal
Alvarez & Marsal
View slide
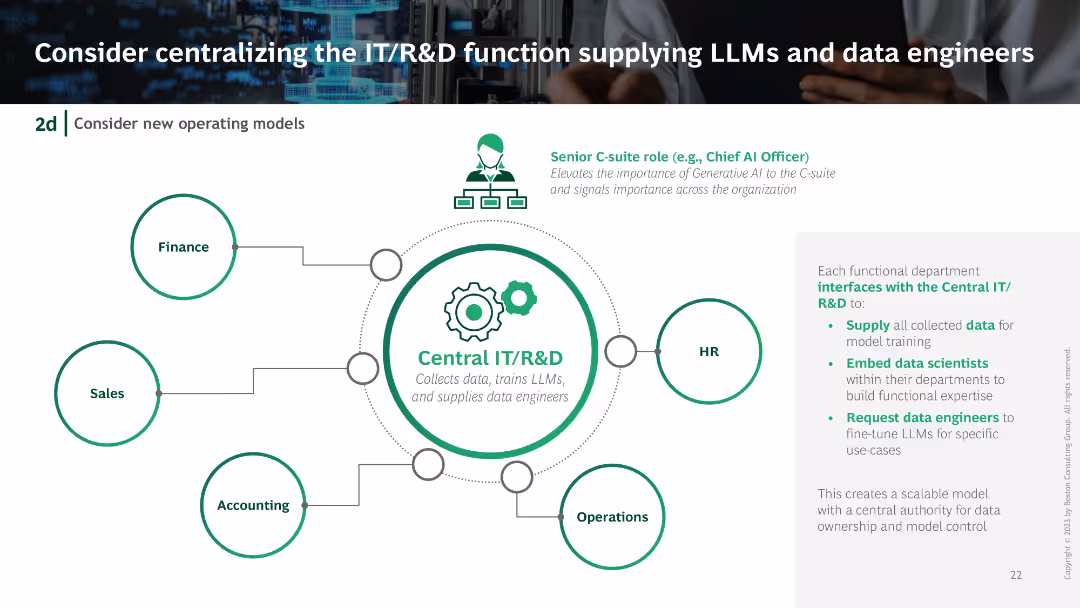
Centralized IT/R&D unit diagram with connections to different departments like Finance, HR, Sales, and Operations. Includes icons and flow lines illustrating the centralized structure.
Organizational Structure and Change
Technology & Software
Suggests centralizing the IT/R&D function to efficiently manage LLMs and data engineers, showing how this structure would interface with various departments.
IT centralization, R&D, LLMs, data engineers, organizational structure
false
Organizational Structure and Change
Technology & Software technology-and-software
Diagram
BCG
View slide
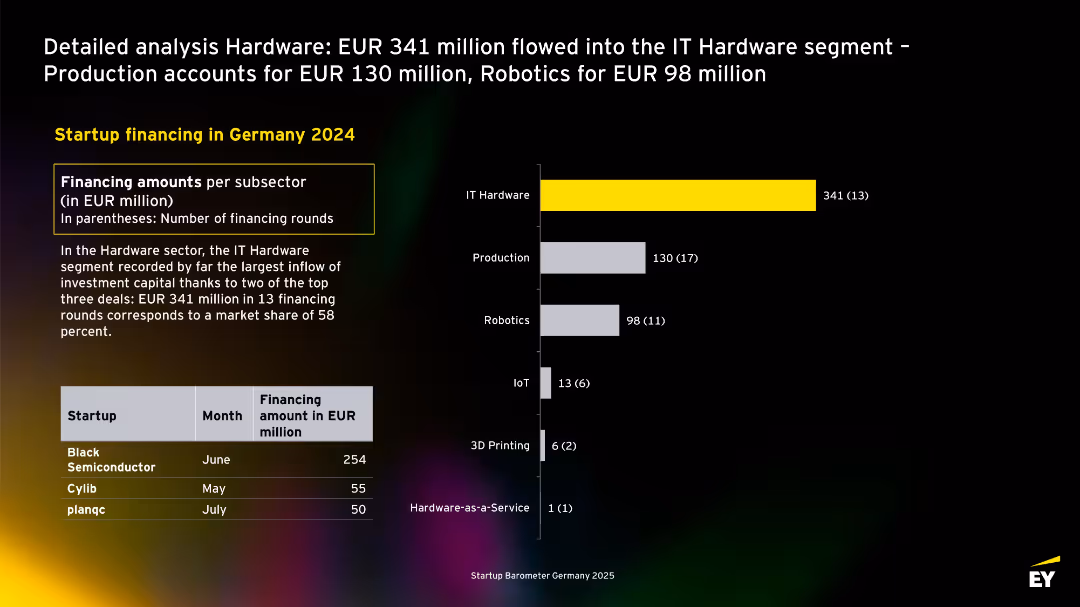
Layout with yellow-highlighted leading sector (IT Hardware), bar chart on right, and top startup table at bottom-left.
Investment Analysis
Technology & Software
The slide dissects hardware segment funding in 2024, led by IT Hardware (EUR 341M). It highlights significant investments into Black Semiconductor and others. Production and Robotics also secured notable shares.
IT hardware, robotics, production, startups, Germany, capital inflow, 2024, venture
false
Investment Analysis
Technology & Software technology-and-software
Mixed Chart
EY
Previous
Loading...
Hold On!
We are searching in our database
If nothing, comes up, please try different filters!
Column Chart
Heatmap
Chevron
Org Chart
Infographic
Callouts
Timeline
List
Graphic
Picture
Process Flow
Diagram
Paragraph
Map
Table
Framework
Subtitle
Takeaway Box
Icon
Other Chart
Radar Chart
Waterfall Chart
Mekko Chart
Pie Chart
Scatter Plot
Line Chart
Bar chart
Bullet points
Create a FREE account to continue browsing
Receive Instant Access to 1,000+ slides from companies like McKinsey, Google, and Goldman Sachs
First Name
Last Name
Email
Password
I agree to all
Terms & Privacy Policy
Thank you! Your submission has been received!
Oops! Something went wrong while submitting the form.
Have an account?
Sign in
Upgrade to PRO to Save slides
Advanced Search and Filters
Access to 15,000+ slides
Access to Category Pages
Save/Bookmark Slides
PowerPoint Template Library
Pick a Plan
MONTHLY
$12/month
Billed every month, Cancel anytime.
YEARLY
$9/year
Billed $108 annually, Cancel anytime.
Checkout for $12/month
Checkout for $108/yr
Secured by Stripe | AES-256 bit encryption