My Account
My Slides
Search by Category
Templates
Leave Feedback
Login
Logout
Get Started
Browse all Slides
Browse all Slides
Create a FREE Account
Instant access to 1,000+ real slides from top companies like McKinsey, BCG, Goldman Sachs, Google and many more!
First Name
Last Name
Email
Password
I agree to all
Terms & Privacy Policy
Thank you! Your submission has been received!
Oops! Something went wrong while submitting the form.
Have an account?
Sign in
📢 Ready to start building slides? Check out our new template library
VIEW TEMPLATES
Welcome,
Welcome
PRO
Show Featured Only
Checkbox 8
Companies
Mckinsey
Bain
BCG
EY
Deloitte
Accenture
PwC/Strategy&
JP Morgan
Goldman Sachs
Morgan Stanley
Citigroup
Deutsche Bank
Barclays
LEK
KPMG
Kearney
Oliver Wyman
Booz Allen Hamilton
Gartner
IPSOS
Nielsen
Slide type
Text Only
Linear Flow
Vertical Flow
Single Chart
Header Horizontal
Mixed Chart
Header Vertical
Pillar
Multiple Chart
Graphic
Agenda
Title
Table
Framework
Industry
Technology & Software
Artificial Intelligence
Financial Services
Retail & E-commerce
Consumer Goods
Industrial & Manufacturing
Transportation & Logistics
Telecommunications
Real Estate & Construction
Hospitality & Tourism
Professional Services
Education & Training
Media & Entertainment
Agriculture & Food Production
Healthcare & Pharmaceuticals
Environmental Services & Sustainability
Government & Public Sector
Use Case
Mergers and Acquisitions
Performance Metrics and KPIs
Client Case Studies
Competitive Landscape
Corporate Finance and Valuation
Product and Service Analysis
Customer and Market Segmentation
Organizational Structure and Change
Industry Overview
Regulatory and Compliance
Risk Assessment and Management
Investment Analysis
Organizational Structure and Change
Human Resources and Talent Management
Financial Performance
Market Analysis and Trends
Sales and Business Development
Human Resources and Talent Management
Clear all
Thank you! Your submission has been received!
Oops! Something went wrong while submitting the form.
Tag
View slide
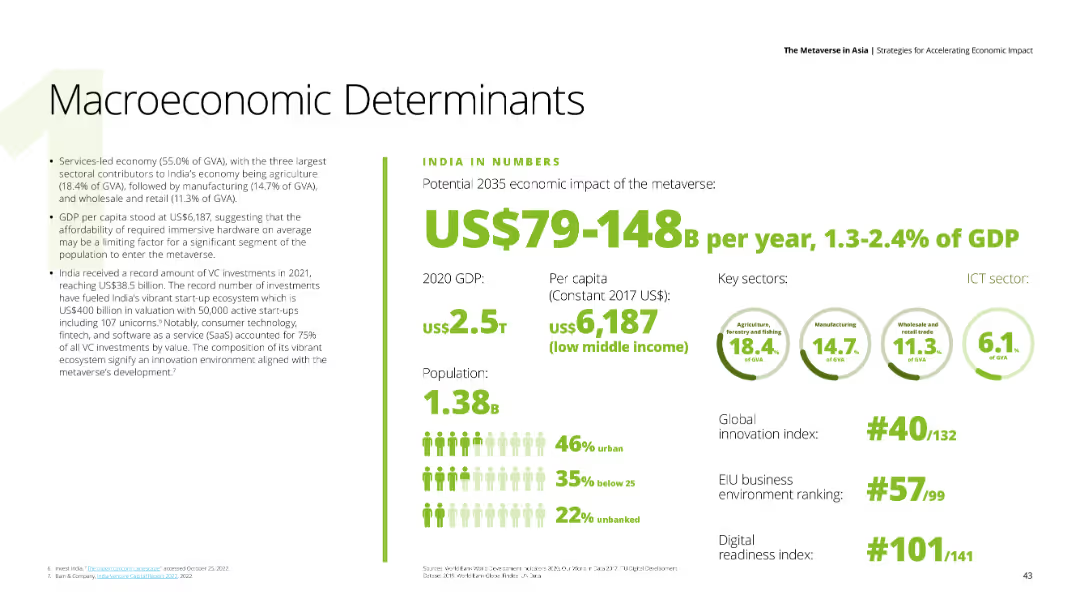
A data-driven slide with key economic indicators for India, including GDP, population, and sector contributions.
Financial Performance
Financial Services
The slide presents India’s macroeconomic determinants, highlighting the potential economic impact of the metaverse by 2035.
India, GDP, economic impact, metaverse, financial indicators
false
Financial Performance
Financial Services financial-services
Mixed Chart
Deloitte
View slide
The slide presents two focal themes: India's economic outlook with infographic circles and Saudi's economic reform with a map. Both sections include report links.
Market Analysis and Trends
Financial Services
It explores the economic growth potential of India and Saudi Arabia, emphasizing their strategic positions in global markets, which is informative for investors and policymakers.
India, Saudi Arabia, economic growth, market potential, strategic position, global markets, investment information, policymakers, Vision 2030, economic reform
false
Market Analysis and Trends
Financial Services financial-services
Mixed Chart
Morgan Stanley
View slide
Image of the Taj Mahal with accompanying text about India's UPI system, and a line chart showing the exponential growth of UPI transactions.
Market Analysis and Trends
Financial Services
Highlights the growth of UPI in India, showing its increasing use and impact on the payment landscape, with a focus on transaction volumes and values.
India, UPI, payments, growth, transactions, exponential, financial, services, system
false
Market Analysis and Trends
Financial Services financial-services
Mixed Chart
PwC/Strategy&
View slide
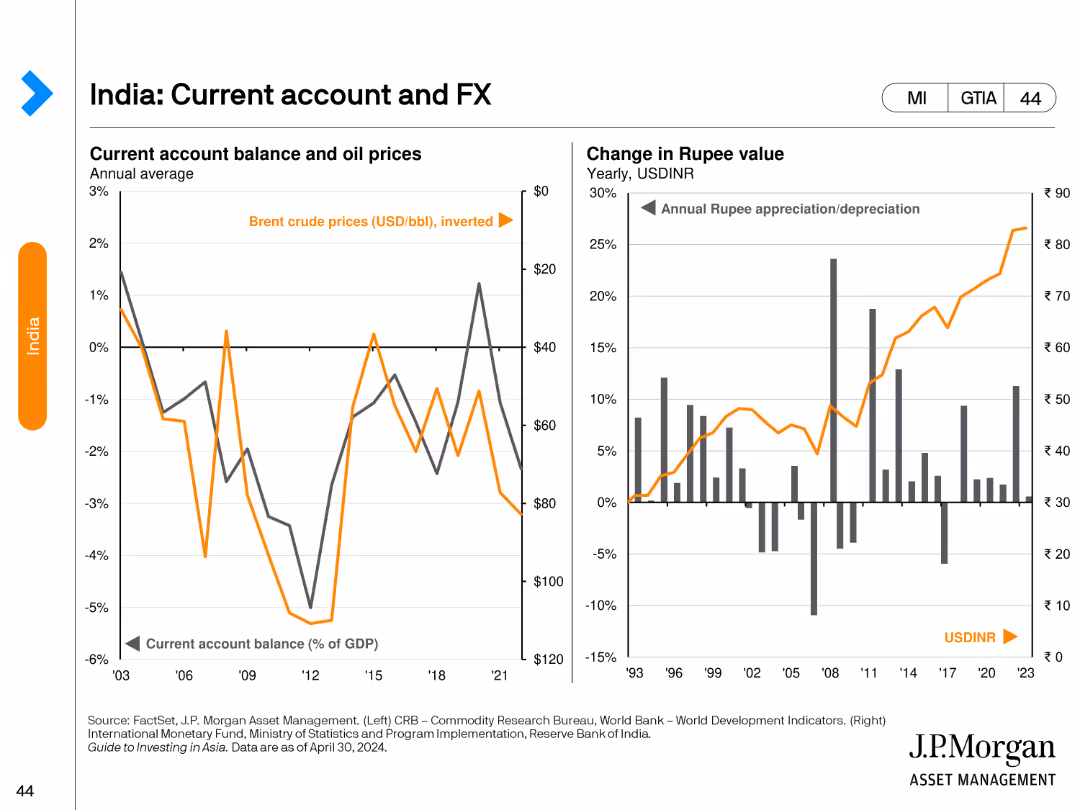
The slide features two line charts. The left chart compares India's current account balance as a percentage of GDP with Brent crude oil prices (inverted). The right chart shows the annual rupee appreciation/depreciation against USD from 1993 to 2023.
Financial Performance
Financial Services
This slide provides an analysis of India's current account balance in relation to oil prices and tracks the historical changes in the rupee's value against the US dollar.
India, current account, FX, rupee value, oil prices
false
Financial Performance
Financial Services financial-services
Multiple Chart
JP Morgan
View slide
The left graph plots internet penetration against GDP per capita for various countries. The right bar chart shows the number of real-time payments as a percentage of total transactions for India, Brazil, China, and the U.S. in 2022 and 2028F.
Technology and Digital Transformation
Technology & Software
This slide analyzes India's digital transformation, comparing internet penetration across countries and forecasting the growth of digital payments infrastructure.
India, digital transformation, internet penetration, digital payments, infrastructure
false
Technology and Digital Transformation
Technology & Software technology-and-software
Multiple Chart
JP Morgan
View slide
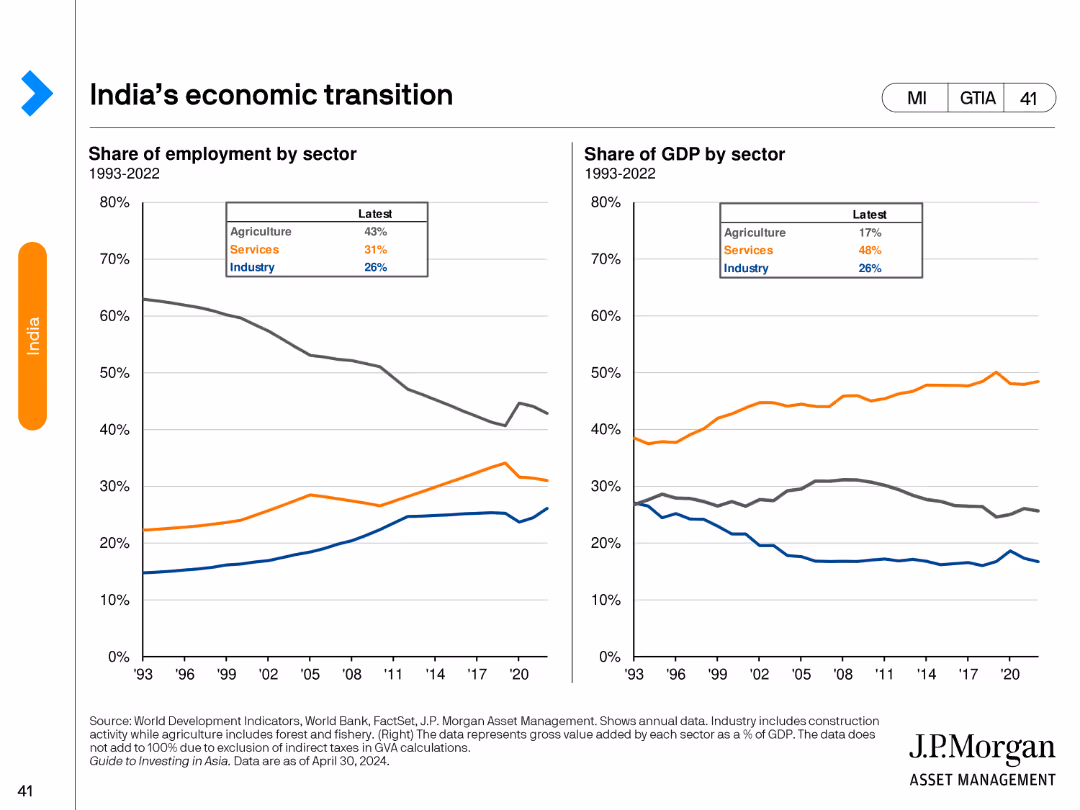
The slide has two line charts: one on the left showing the share of employment by sector from 1993 to 2022, and one on the right showing the share of GDP by sector over the same period. The layout is structured to compare changes in employment and GDP contribution.
Market Analysis and Trends
Financial Services
This slide examines the economic transition in India, focusing on shifts in employment and GDP shares across agriculture, industry, and services sectors over three decades.
India, economic transition, employment, GDP share, sector analysis
false
Market Analysis and Trends
Financial Services financial-services
Multiple Chart
JP Morgan
View slide
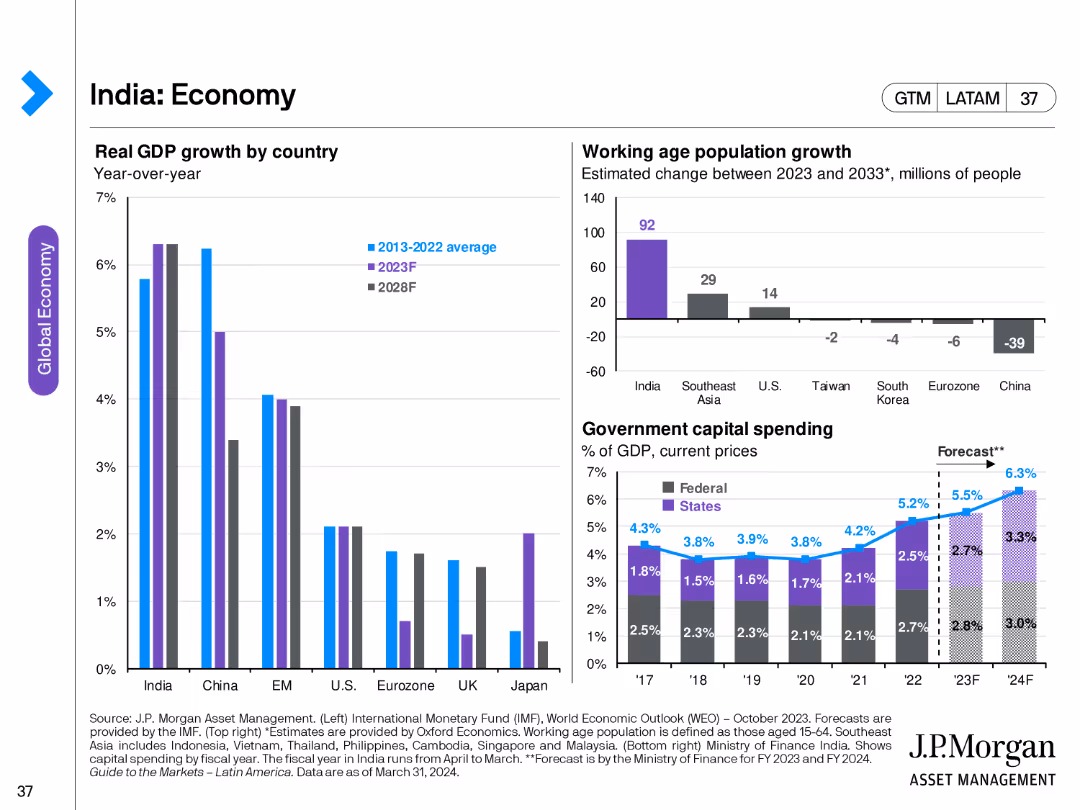
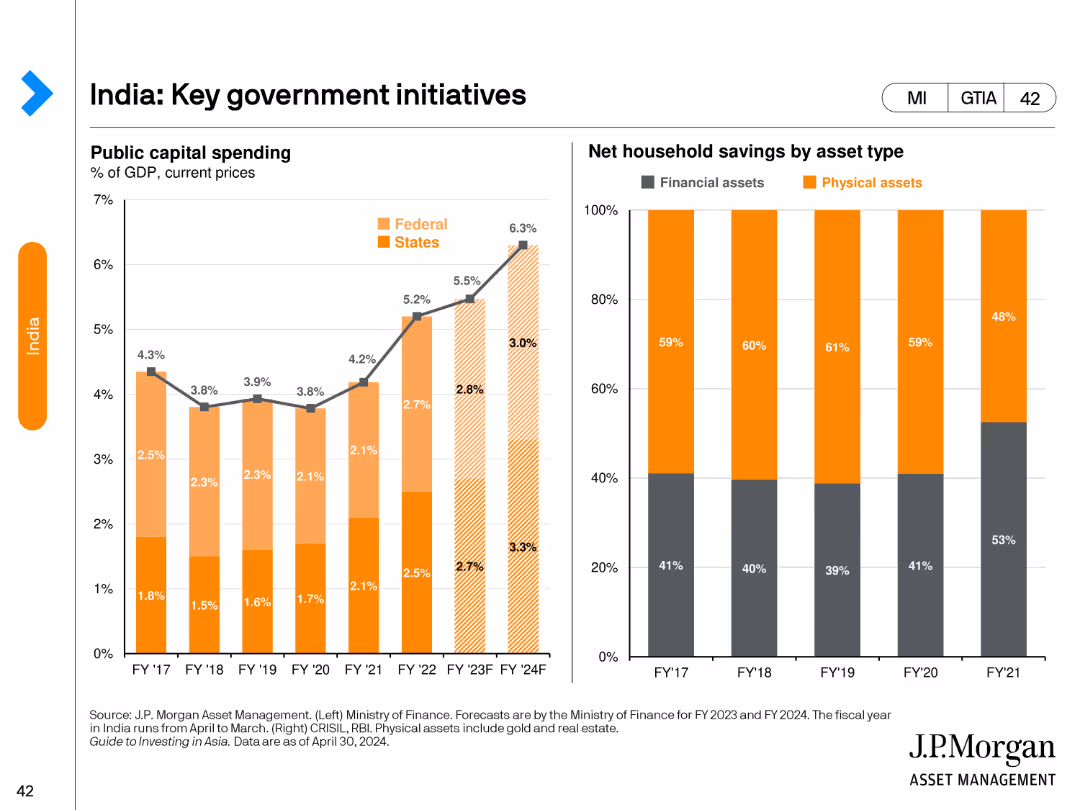
This slide includes a column chart showing India's real GDP growth by country, a bar chart showing working-age population growth, and a column chart displaying government capital spending by federal and state levels.
Market Analysis and Trends
Financial Services
The slide provides an overview of India's economic growth, demographic changes, and government spending trends, offering insights into the country's economic development and future prospects.
India, economy, GDP growth, working-age population, government spending, economic development, federal, state
false
Market Analysis and Trends
Financial Services financial-services
Multiple Chart
JP Morgan
View slide
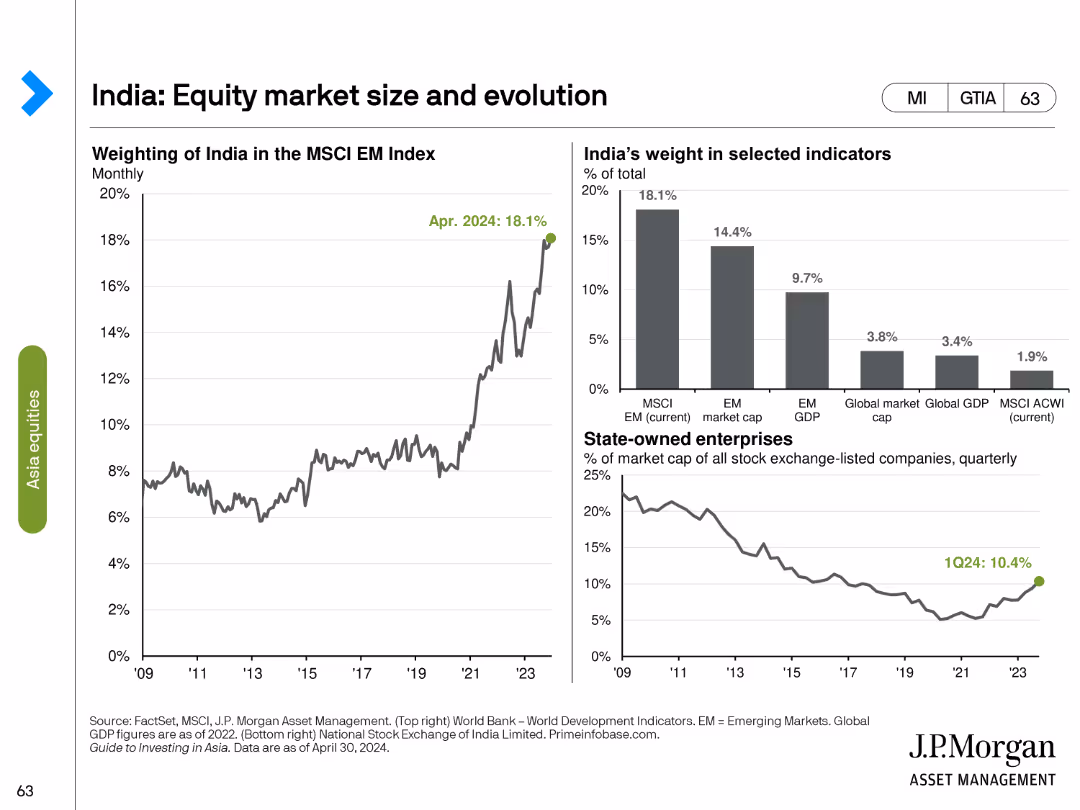
This slide features a line chart on India's weighting in the MSCI EM Index, and a bar chart showing India's weight in selected indicators, along with a line chart on state-owned enterprises' market cap share.
Market Analysis and Trends
Financial Services
The slide analyzes the growth and evolution of India's equity market, highlighting its increasing weight in global indices and the proportion of state-owned enterprises, providing insights into market dynamics and investment prospects.
India, equity market, MSCI EM, market evolution, state-owned enterprises, market cap, global indices, investment prospects, market dynamics, financial analysis
false
Market Analysis and Trends
Financial Services financial-services
Multiple Chart
JP Morgan
View slide
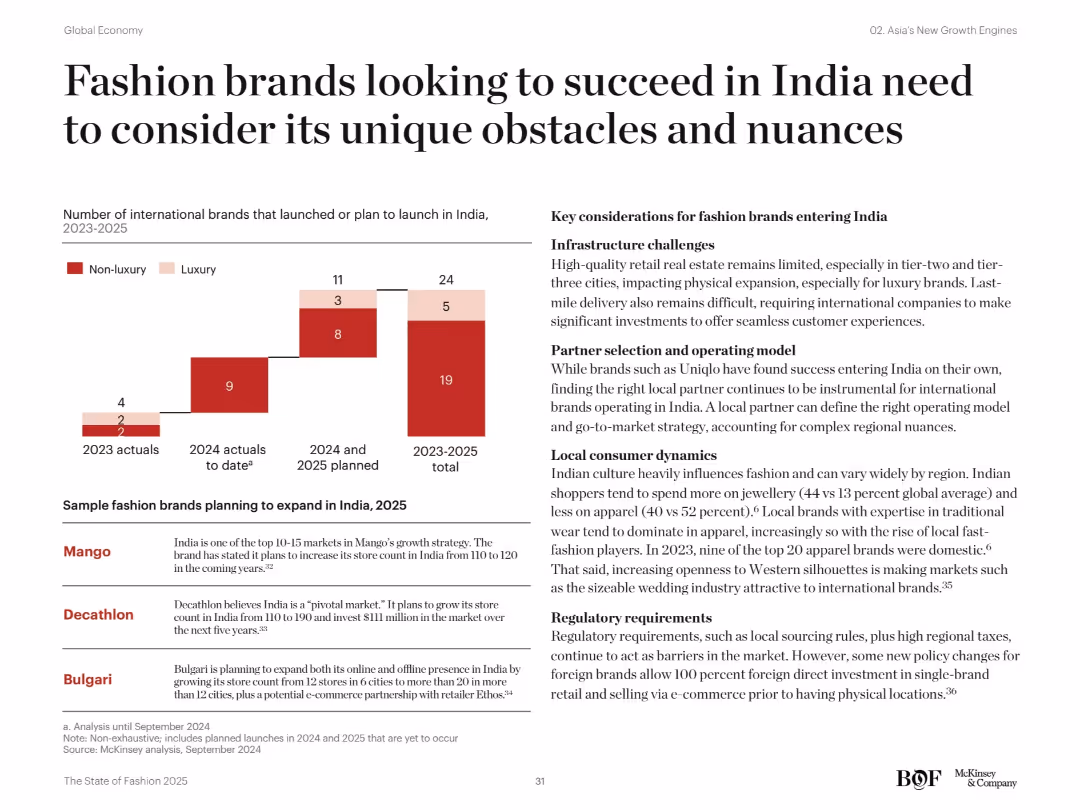
Bar chart on brand launches in India (2023–2025) split by luxury and non-luxury. Text outlines infrastructure, consumer behavior, and regulatory hurdles.
Strategic Planning
Consumer Goods
This slide outlines challenges for fashion brands entering India, such as real estate, complex regulations, and regional cultural differences. It emphasizes the need for strong local partnerships and understanding consumer behavior to navigate India’s growing but nuanced market.
India, fashion brands, infrastructure, regulation, consumer behavior, retail, expansion strategy, partnerships, non-luxury, luxury
false
Strategic Planning
Consumer Goods consumer-goods
Mixed Chart
McKinsey
View slide
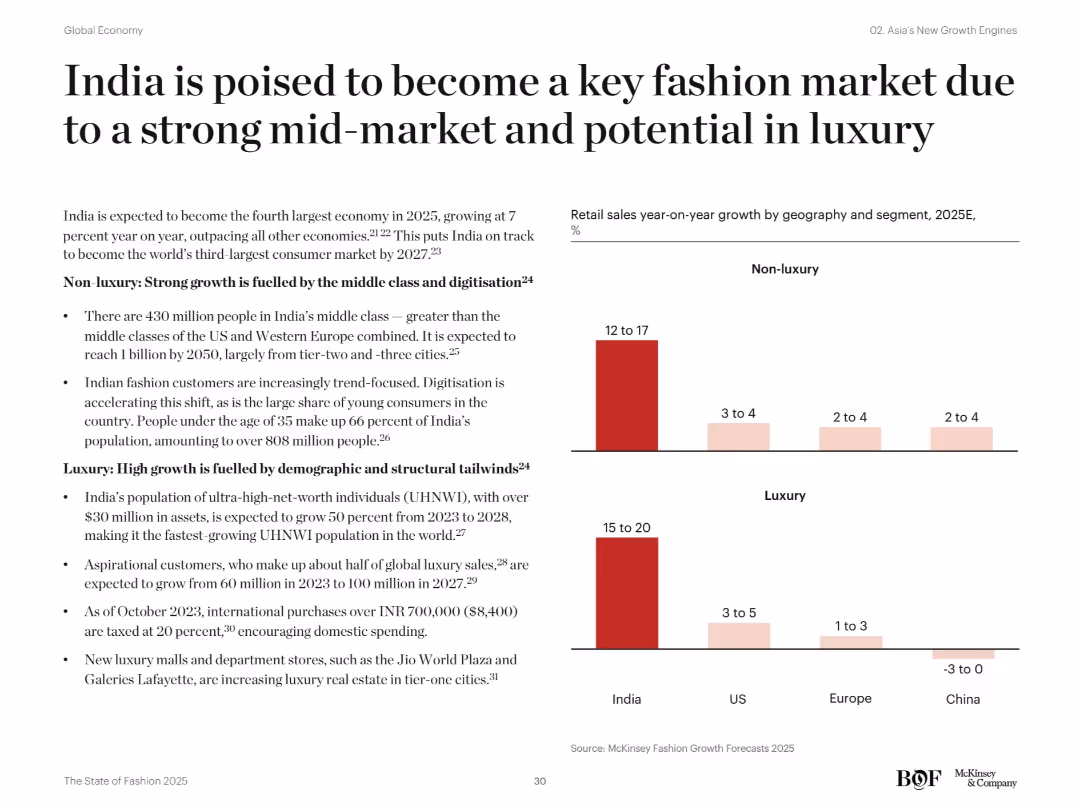
Side-by-side bar charts show projected retail growth in non-luxury and luxury segments by geography for 2025. Accompanying text provides demographic drivers.
Market Analysis and Trends
Consumer Goods
India is forecast to be a leading fashion market by 2025, fueled by a massive middle class and rapid digital adoption. Luxury growth is driven by UHNWIs and aspirational consumers. India is set to surpass Western markets in growth across both segments.
India, fashion market, middle class, UHNWIs, non-luxury, luxury, growth forecast, retail, digitization, demographics
false
Market Analysis and Trends
Consumer Goods consumer-goods
Mixed Chart
McKinsey
View slide
This slide has two charts: a bar chart showing net foreign portfolio flows into Indian equities, and a line chart showing foreign market participation in Nifty 500 companies with holdings over 5%.
Market Analysis and Trends
Financial Services
The slide examines the net foreign portfolio investment in Indian equities over the years, alongside foreign market participation rates, to provide insights into foreign investor trends and market positioning in India.
India, foreign investment, portfolio flows, Nifty 500, market participation, equities, investment trends, financial analysis, foreign investors, market positioning
false
Market Analysis and Trends
Financial Services financial-services
Multiple Chart
JP Morgan
View slide
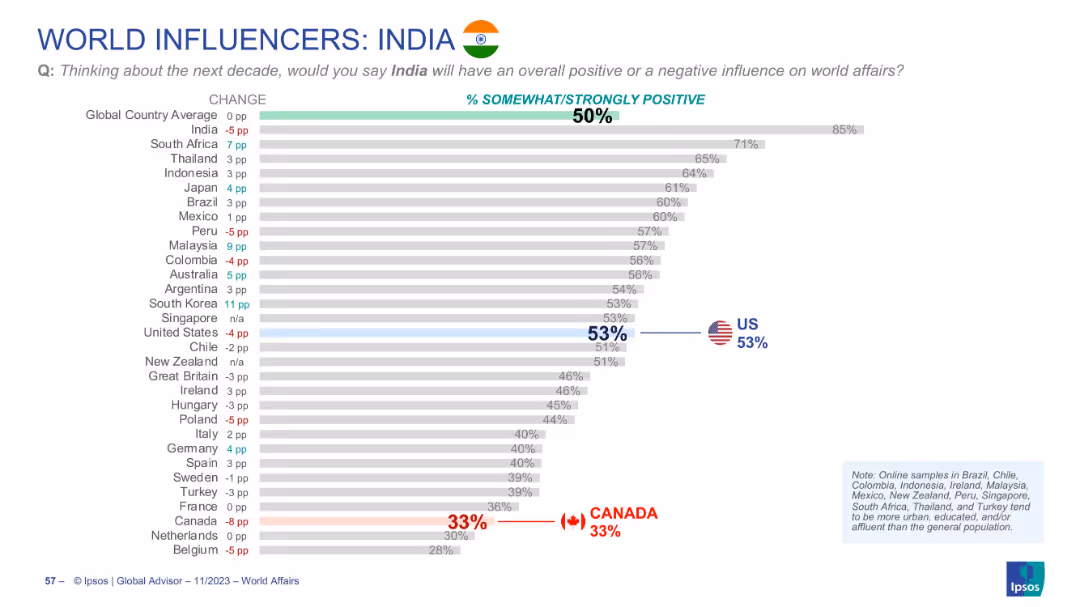
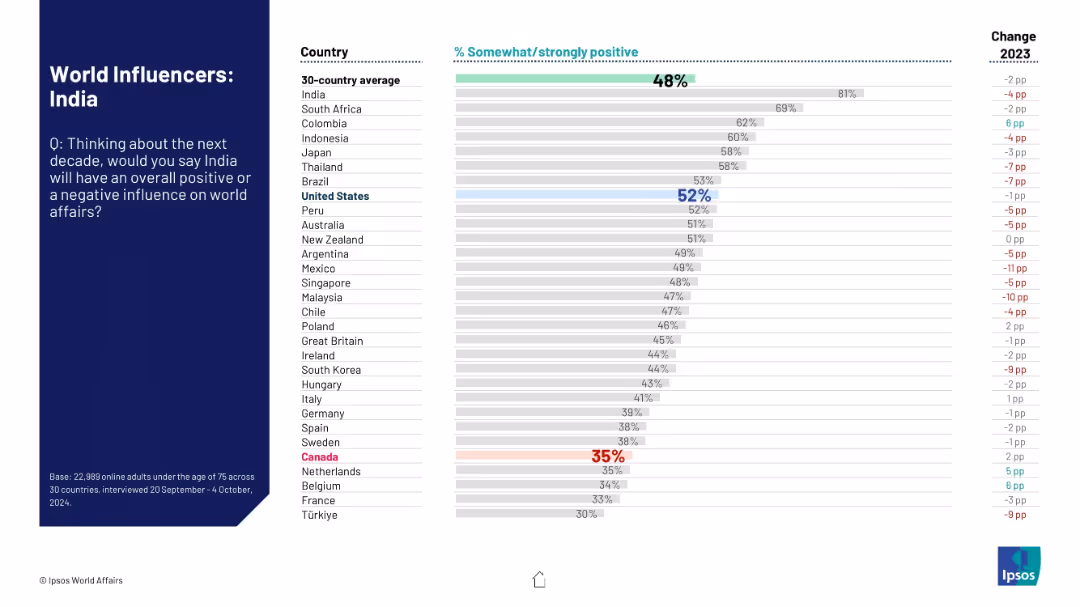
Horizontal bar chart ranking countries by % of positive influence attributed to India; includes flags and % changes.
Market Analysis and Trends
Government & Public Sector
The slide evaluates how global respondents view India's influence in the coming decade. While globally India holds a 50% positivity rating, the highest positivity comes from South Africa, and the lowest from Canada.
India, global image, public opinion, influence, Ipsos, rankings, decade outlook, soft power
false
Market Analysis and Trends
Government & Public Sector government-and-public-sector
Single Chart
IPSOS
View slide
The left side of the slide features a stacked column chart showing public capital spending by federal and state levels from FY17 to FY24F. The right side has a stacked bar chart displaying net household savings by asset type from FY17 to FY21.
Regulatory and Compliance
Government & Public Sector
This slide outlines key government initiatives in India, highlighting trends in public capital spending and household savings to understand fiscal and economic policies.
India, government initiatives, public spending, household savings, fiscal policy
false
Regulatory and Compliance
Government & Public Sector government-and-public-sector
Multiple Chart
JP Morgan
View slide
Layout identical to other slides: left-aligned prompt and title, right-hand bar chart comparing perceptions.
Market Analysis and Trends
Government & Public Sector
This chart shows how people in 30 countries perceive India’s global influence in the next decade. It reveals significant variation, with many countries reporting declining sentiment from 2023.
India, public opinion, world influence, Ipsos, perception trends, geopolitical role, survey, sentiment rating, international reputation
false
Market Analysis and Trends
Government & Public Sector government-and-public-sector
Mixed Chart
IPSOS
View slide
The slide features two column charts. The left chart shows MSCI India earnings growth estimates by sector for 2024 and 2025, while the right chart shows MSCI India price-to-earnings ratios by sector.
Financial Performance
Financial Services
This slide discusses sector earnings and valuations in India, providing earnings growth estimates and price-to-earnings ratios for various sectors. It is used for financial performance analysis and investment planning.
India, sector earnings, valuations, MSCI, price-to-earnings, financial performance, investment planning
false
Financial Performance
Financial Services financial-services
Multiple Chart
JP Morgan
View slide
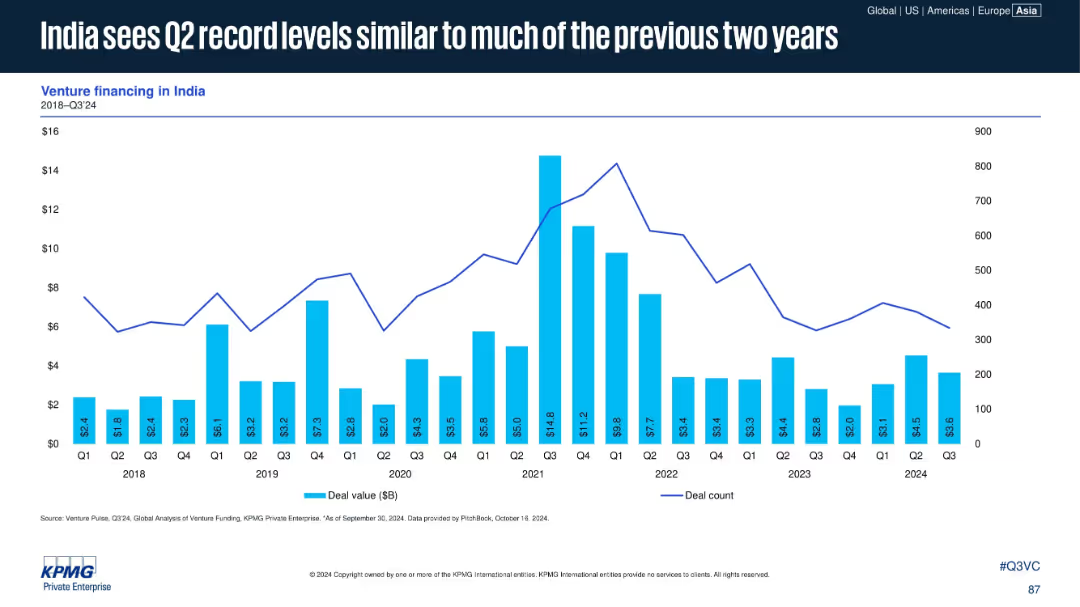
Bar and line chart tracking venture financing (deal value and count) in India from 2018 to Q3 2024.
Investment Analysis
Financial Services
Despite global VC downturns, India maintains steady investment activity with strong Q2 results in 2024. While deal counts are declining, several quarters show high deal values, reflecting fewer but larger transactions.
India, venture financing, deal value, deal count, 2024, investment trends, KPMG
false
Investment Analysis
Financial Services financial-services
Single Chart
KPMG
View slide
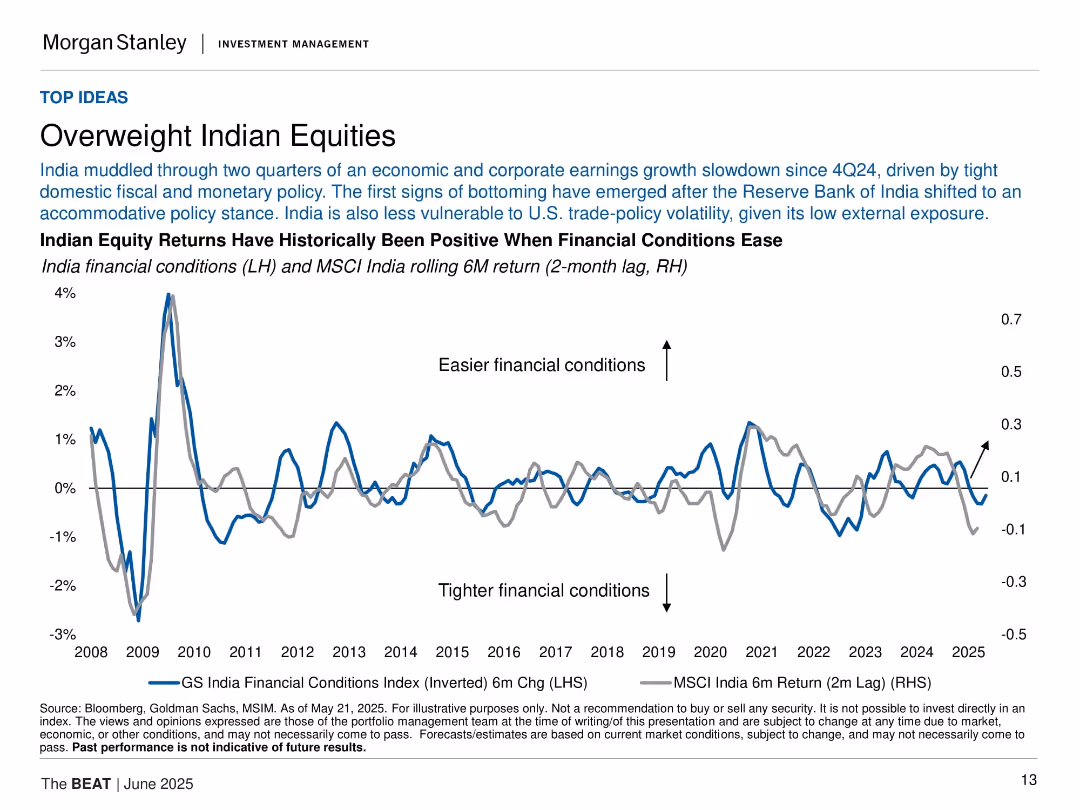
Dual-axis line chart showing India financial conditions and equity returns; minimal layout with focus on trends.
Investment Analysis
Financial Services
This slide supports overweighting Indian equities based on easing financial conditions and accommodative policy by the RBI. A dual-line chart illustrates the historical correlation between financial conditions and equity returns.
Indian equities, financial conditions, RBI, monetary policy, MSCI India, investments, easing, macroeconomic, returns
false
Investment Analysis
Financial Services financial-services
Single Chart
Morgan Stanley
View slide
A bar chart on the left shows typical indirect spend per category, with pie charts on the right indicating Commercial and Demand management focus.
Operational Efficiency
Professional Services
This slide depicts typical indirect spend by category (Professional Services, Human Resource, etc.) and their focus on Commercial and Demand management.
Indirect spend, categories, commercial, demand management, bar chart, pie chart
false
Operational Efficiency
Professional Services professional-services
Single Chart
EY
View slide
The slide features tables, regional maps, and icons. It visually separates information by countries and key international alliances.
Market Analysis and Trends
Government & Public Sector
Analyzes the strengthening of Australia's international alliances in the Indo-Pacific, influencing Australia's battery industries.
Indo-Pacific, alliances, Australia, trade agreements
false
Market Analysis and Trends
Government & Public Sector government-and-public-sector
Table
Accenture
View slide
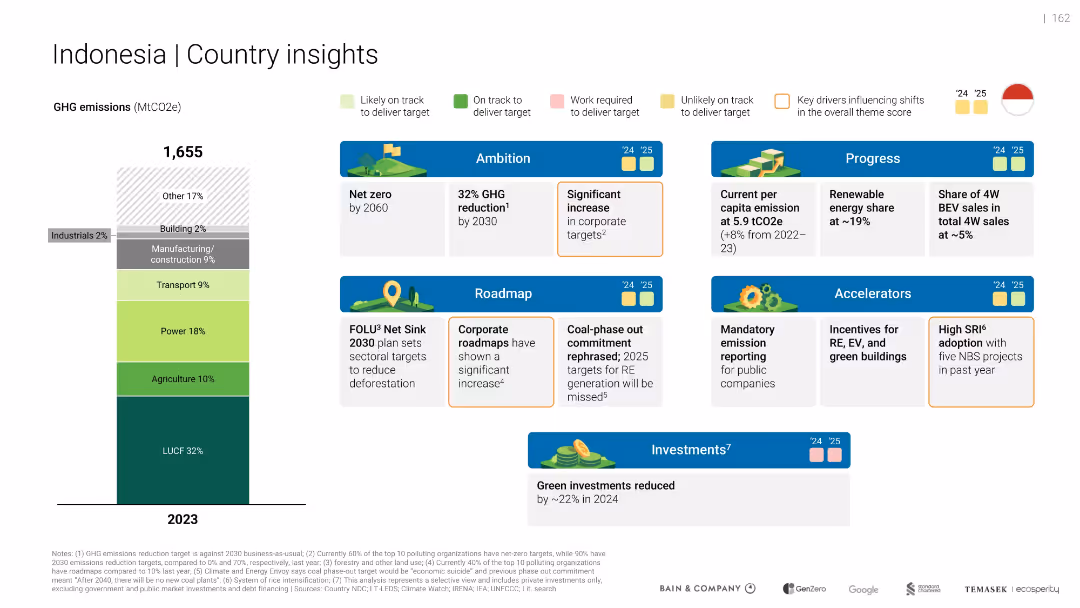
Vertical emissions bar with categories; multiple blue-highlighted cards for ambition, roadmap, progress, investment
Strategic Planning
Environmental Services & Sustainability
Provides Indonesia's green economy profile. Emphasizes emissions sources, current targets (e.g., net zero by 2060), and reduced green investment in 2024. Notes recent rollback on coal phase-out.
Indonesia
false
Strategic Planning
Environmental Services & Sustainability environmental-services-and-sustainability
Mixed Chart
Bain
View slide
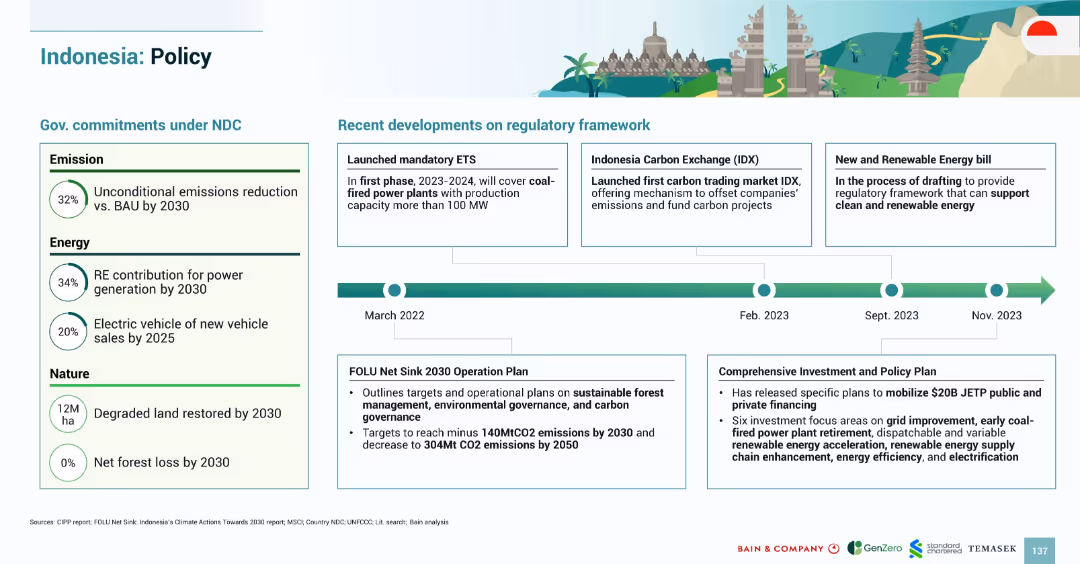
Timeline-based layout with left-side policy targets and right-side regulatory updates; illustrations and flags add clarity
Regulatory and Compliance
Government & Public Sector
Summarizes Indonesia’s regulatory progress on green policy, including NDC commitments, ETS launch, and carbon exchange developments, along with forest and investment frameworks
Indonesia policy, ETS, IDX, NDC, forest carbon, emissions targets, energy bill, regulatory updates
false
Regulatory and Compliance
Government & Public Sector government-and-public-sector
Mixed Chart
Bain
View slide
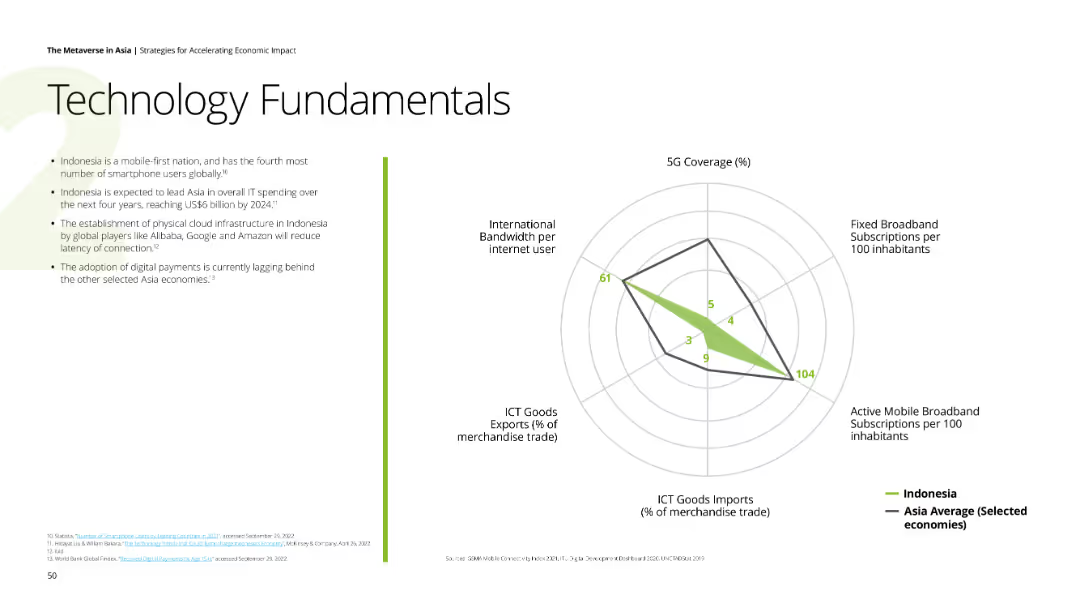
The slide contains a spider chart comparing 5G coverage, fixed broadband subscriptions, active mobile broadband subscriptions, ICT goods imports, and international bandwidth per internet user for Indonesia and Asia average. The background is white with text and charts.
Technology and Digital Transformation
Technology & Software
Discusses Indonesia's position in the ICT sector with a focus on mobile-first adoption, cloud infrastructure, digital payments, and IT spending.
Indonesia, 5G, ICT, mobile broadband, digital payments
false
Technology and Digital Transformation
Technology & Software technology-and-software
Mixed Chart
Deloitte
View slide
Detailed slide with multiple column charts, each representing a different aspect of Indonesia's digital financial services. Utilizes shades of blue for a clean look.
Financial Performance
Financial Services
This slide gives an in-depth view of the projected growth in digital lending, payments, insurance, and wealth in Indonesia's financial sector.
Indonesia, Digital Financial Services, Lending, Payments, Insurance, Wealth, Growth Projections, Financial Sector
false
Financial Performance
Financial Services financial-services
Multiple Chart
Bain
View slide
The slide features three sets of vertical column charts, color-coded in blue and yellow to distinguish between merchants’ anticipated usage increase and maintenance in digital services and tools in Indonesia.
Market Analysis and Trends
Technology & Software
Depicts Indonesian digital merchants' reliance on digital platforms, financial services, and tools, anticipating increased tech adoption.
Indonesia, Digital Merchants, Tech-Savvy, Future Trends, Digital Tools, Usage Increase, Financial Services
false
Market Analysis and Trends
Technology & Software technology-and-software
Multiple Chart
Bain
View slide
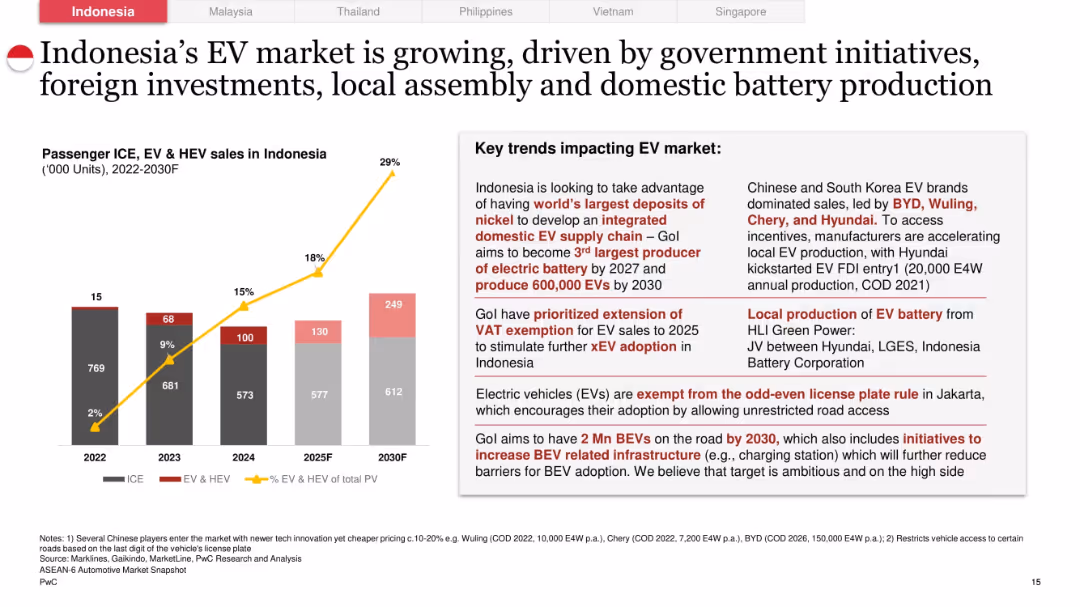
Left side has a stacked bar chart (ICE vs EV & HEV) and line chart (% EV of total PV); right side features detailed text on market drivers including incentives, infrastructure, and OEM strategies.
Technology and Digital Transformation
Industrial & Manufacturing
Explores Indonesia’s EV market growth through 2030. Highlights the rise in EV share of total passenger vehicles, supported by government incentives, battery production, VAT exemptions, and favorable road regulations. Forecasts 2 million BEVs by 2030 and positions Indonesia as a future battery and EV production hub.
Indonesia, EV market, BEVs, battery production, incentives, infrastructure, government policy
false
Technology and Digital Transformation
Industrial & Manufacturing industrial-and-manufacturing
Mixed Chart
PwC/Strategy&
View slide
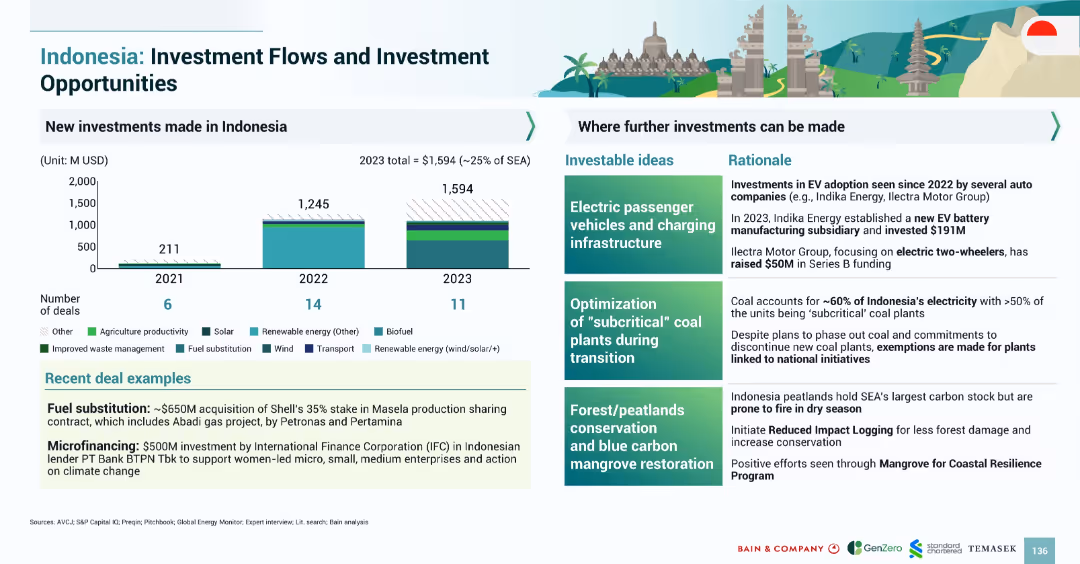
Bar chart showing investment volumes by year and type, with right-aligned boxes listing investable ideas and deal rationale
Investment Analysis
Financial Services
Highlights investment trends in Indonesia’s green sectors and identifies growth areas like EV infrastructure, coal transition, and mangrove restoration, backed by recent deal examples
Indonesia, EV, investment, fuel substitution, climate finance, mangroves, coal phaseout, renewables
false
Investment Analysis
Financial Services financial-services
Mixed Chart
Bain
View slide
Graphs and statistics about Indonesia's GDP, population demographics, and digital investment growth are presented on a dark background.
Financial Performance
Technology & Software
The slide discusses Indonesia's economic profile, internet users, and investment growth, positioning it as a future digital hub.
Indonesia, GDP, digital hub, investment, economic profile, internet users, growth
false
Financial Performance
Technology & Software technology-and-software
Pillar
Kearney
View slide
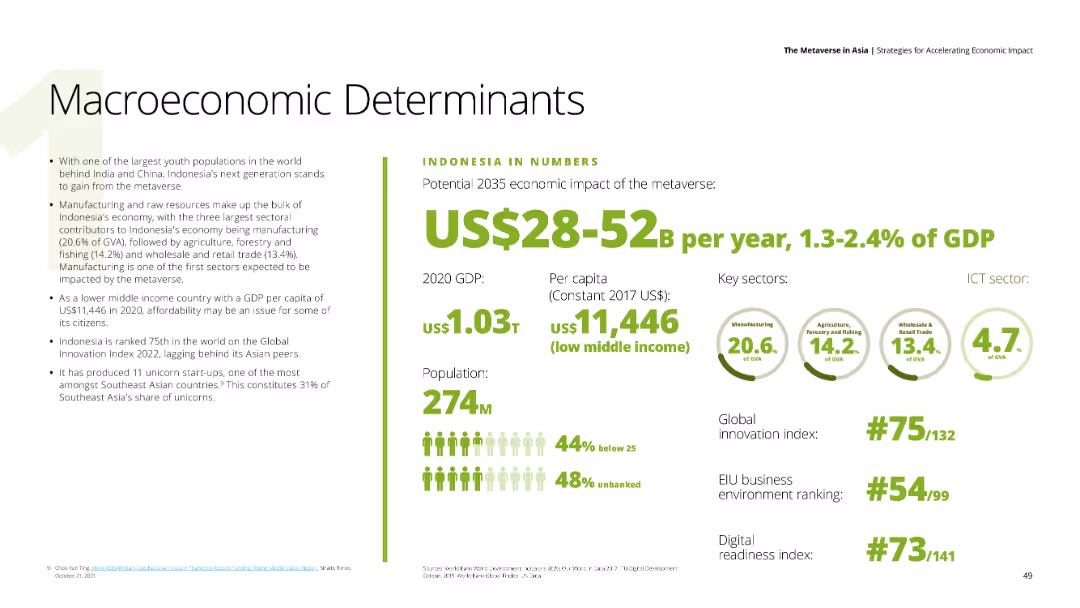
A data-driven slide with key economic indicators for Indonesia, including GDP, population, and sector contributions.
Financial Performance
Financial Services
The slide presents Indonesia’s macroeconomic determinants, highlighting the potential economic impact of the metaverse by 2035.
Indonesia, GDP, economic impact, metaverse, financial indicators
false
Financial Performance
Financial Services financial-services
Mixed Chart
Deloitte
View slide
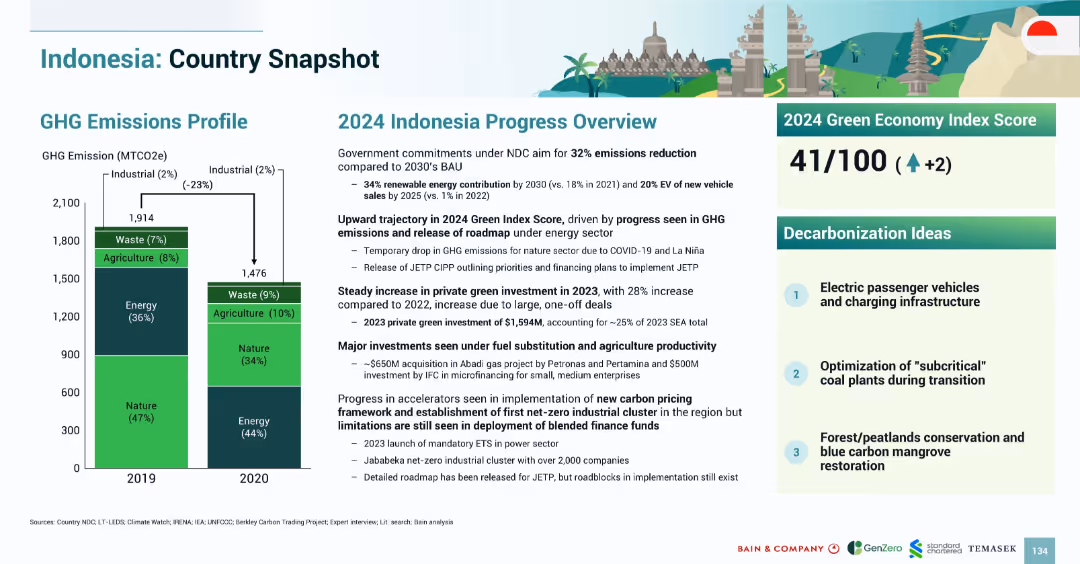
Left-side chart of GHG emissions over time; right-side lists national targets, progress summary, and decarbonization ideas
Financial Performance
Government & Public Sector
Outlines Indonesia’s progress in green investment and emissions reductions, including key metrics, policy commitments, EV goals, and forest conservation ideas, with a Green Index score improvement
Indonesia, GHG, green economy, emissions, EV, renewable energy, forest conservation, sustainability
false
Financial Performance
Government & Public Sector government-and-public-sector
Mixed Chart
Bain
View slide
Slide with bar graphs comparing HVU and non-HVU spending in Indonesia. Blue bars represent the HVU spend, with clear labels for each category.
Customer and Market Segmentation
Technology & Software
The slide compares the spending habits of HVUs to non-HVUs in Indonesia, especially highlighting the difference in travel spend.
Indonesia, HVUs, Non-HVUs, Spending Habits, Travel, Groceries, Streaming, Gaming, Food Delivery, E-commerce
false
Customer and Market Segmentation
Technology & Software technology-and-software
Multiple Chart
Bain
Previous
Loading...
Hold On!
We are searching in our database
If nothing, comes up, please try different filters!
Column Chart
Heatmap
Chevron
Org Chart
Infographic
Callouts
Timeline
List
Graphic
Picture
Process Flow
Diagram
Paragraph
Map
Table
Framework
Subtitle
Takeaway Box
Icon
Other Chart
Radar Chart
Waterfall Chart
Mekko Chart
Pie Chart
Scatter Plot
Line Chart
Bar chart
Bullet points
Create a FREE account to continue browsing
Receive Instant Access to 1,000+ slides from companies like McKinsey, Google, and Goldman Sachs
First Name
Last Name
Email
Password
I agree to all
Terms & Privacy Policy
Thank you! Your submission has been received!
Oops! Something went wrong while submitting the form.
Have an account?
Sign in
Upgrade to PRO to Save slides
Advanced Search and Filters
Access to 15,000+ slides
Access to Category Pages
Save/Bookmark Slides
PowerPoint Template Library
Pick a Plan
MONTHLY
$12/month
Billed every month, Cancel anytime.
YEARLY
$9/year
Billed $108 annually, Cancel anytime.
Checkout for $12/month
Checkout for $108/yr
Secured by Stripe | AES-256 bit encryption